
TOD’s as a financing tool:
TOD’s as a financing tool:
- why TODs, how does value capture work and can
it apply to Indian cities?
By
Peter Newman
Curtin University Sustainability Policy (CUSP)
Institute
Fremantle, Australia
India’s own
transit city
National City Lines removed transit in 44
cities....US now hitting the wall on carbased cities….
The view
through the
windscreen
In dense cities the car can
dominate very quickly….
Atlanta
Houston
Denver
San Francisco
San Diego
Phoenix
Los Angeles
Washington
Chicago
New York
Calgary
Toronto
Perth
Melbourne
Vancouver
Brisbane
Sydney
Ottawa
Montreal
Riyadh
Wellington
Geneva
Oslo
Brussels
Frankfurt
Rome
Hamburg
Nantes
Stockholm
Marseille
Zurich
Ruhr
Lyon
Newcastle
Munich
Vienna
Stuttgart
Glasgow
Paris
Dusseldorf
Copenhagen
Berne
Bologna
Graz
Tel Aviv
Madrid
Athens
London
Sapporo
Milan
Berlin
Amsterdam
Manchester
Bangkok
Kuala Lumpur
Johannesbur
Helsinki
Tokyo
Singapore
Sao Paulo
Osaka
Taipei
Seoul
Curitiba
Prague
Budapest
Barcelona
Cape Town
Harare
Tehran
Tunis
Hong Kong
Manila
Cracow
Jakarta
Beijing
Bogota
Guangzhou
Cairo
Chennai
Shanghai
Mumbai
Dakar
Ho Chi Minh
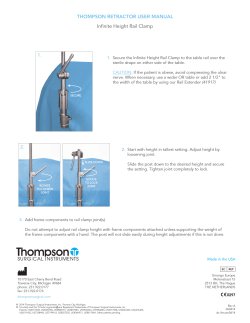
MJ per person
Private Passenger Transport Energy Use per Person,
1995
120000
100000
80000
60000
American
Australia/New Zealand
Canadian
Western European
High Income Asian
Eastern European
Middle Eastern
African
Low Income Asian
Latin American
Chinese
40000
20000
0
Cities
Ho Chi Minh City
Mumbai
Hong Kong
Cairo
Seoul
Taipei
Manila
Barcelona
Shanghai
Jakarta
Bangkok
Chennai
Beijing
Guangzhou
Bogota
Tehran
Dakar
Osaka
Singapore
Tunis
Tokyo
Madrid
Sao Paulo
Milan
Brussels
Tel Aviv
Sapporo
Cape Town
Athens
Vienna
Bologna
London
Stuttgart
Cracow
Marseille
Kuala Lumpur
Amsterdam
Berlin
Rome
Munich
Geneva
Manchester
Budapest
Dusseldorf
Prague
Frankfurt
Paris
Lyon
Zurich
Riyadh
Berne
Hamburg
Newcastle
Graz
Ruhr
Nantes
Harare
Glasgow
Helsinki
Montreal
Ottawa
Curitiba
Johannesburg
Stockholm
Copenhagen
Toronto
Los Angeles
Oslo
Wellington
Vancouver
Calgary
San Francisco
Sydney
New York
Chicago
Denver
San Diego
Washington
Melbourne
Perth
Phoenix
Brisbane
Houston
Atlanta
Urban density (persons per ha)
Urban Density, 1995 (Persons/Ha)
400
350
300
250
200
American
Australia/New Zealand
Canadian
Western European
High Income Asian
Eastern European
Middle Eastern
African
Low Income Asian
Latin American
Chinese
150
100
50
0
Cities
Fuel Use Decreases as Density Increases
New agenda: TODs around rail, eg Chatswood in
Sydney
•
Similarly Portland streetcar partnership
Why TODs….
• 50% less car use for people living there.
• Equity for car-less.
• 20% more household income (one car less)
that is spent locally.
• Transport options are running out based
around cars…
• TODs can help fund rail options….in Indian
cities too?
What is happening in global
transport?
• The peaking of car use…
• The rise and rise of rail…
Car use in cities is declining
- in all developed cities,
- starting to plateau in emerging
cities?
See
Newman P and Kenworthy J (2011) ‘Understanding Peak Car
Use: The Demise of Automobile Dependence’
World Transport Policy and Practice, 17(2): 32-42
Percentage average increase in car VKT per capita
Car use growth trends in developed
cities from 1960 to 2005 using Global
Cities Database.
45
41.8
40
35
30
25.7
25
22.9
20
15
10
5.1
5
0
1960-1970
1970-1980
1980-1990
1995-2005
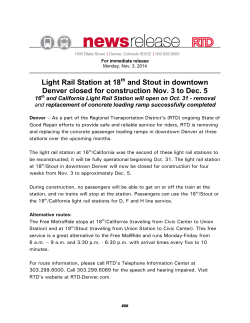
Passenger-kilometres by private
car and light trucks, 1990 – 2009,
index (1990 = 100)
160
150
Germany
140
Australia
130
France
120
United
Kingdom
United
States
110
Japan
100
90
Oil price shock
and start of
crisis
80
1990 1991 1992 1993 1994 1995 1996 1997 1998 1999 2000 2001 2002 2003 2004 2005 2006 2007 2008 2009
Peak Car Use - US cities...
• First declines for
100 years…
• Increasing
transit use –
6.5% in past
year.
• Cities coming
back in…
First Quarter patronage on selected US light rail systems
14.0
12.0
10.0
8.0
Million
Portland, Oregon
Los Angeles, California
Newark, New Jersey
6.0
4.0
2.0
0.0
1996
1998
2000
2002
2004
2006
2008
2010
2012
AUSTRALIAN CITIES - Per Capita Private Travel by City
'000 Kms per capita by car, commercial vehicle and motorcycle
15.00
14.00
13.00
12.00
11.00
10.00
9.00
8.00
7.00
6.00
Sydney
Melbourne
Brisbane
Perth
Adelaide
Canberra
Hobart
Darwin
Source: BTRE (2011): Australian Infrastructure Statistics Yearbook
2008-09
2007-08
2006-07
2005-06
2004-05
2003-04
2002-03
2001-02
2000-01
1999-00
1998-99
1997-98
1996-97
1995-96
1994-95
1993-94
1992-93
1991-92
1990-91
1989-90
1988-89
1987-88
1986-87
1985-86
1984-85
1983-84
1982-83
1981-82
1980-81
1979-80
1978-79
1977-78
1976-77
Kms per Capita
Per Capita Public Transport Travel by City
2.00
Source: BTRE (2011): Australian Infrastructure Statistics Yearbook
1.80
1.60
1.40
1.20
Sydney
Melbourne
1.00
Brisbane
Perth
0.80
Adelaide
Canberra
0.60
Hobart
0.40
Darwin
0.20
0.00
Why is this happening?
1. Density is going up after 100 years
of decline….
Small density increases can have big
impacts on car dependence
TOD’s are happening….
2. Peaking in traffic speed relative to
transit
1.0
0.94
Rela ve speed of public trasnsport to road traffic
0.9
1995
2005
0.84
0.84
0.78
0.8
0.75
0.69
0.7
0.6
0.88
0.86
0.57
0.55
0.57 0.57
0.5
0.4
0.3
0.2
0.1
0.0
US ci es
Canadian
ci es
Australian
ci es
European
ci es
Singapore
Hong Kong
Impact of Road Building on Delay –
America’s 20 Biggest Cities – ZERO!
DELAY
Freeway Miles
ONE LANE people per hr:
Freeway 2,500
Busway 5000
LRT 10-20,000
Train 50,000
Restoring ‘place’, eg River in Seoul,
buried under freeway
⑥ー1 Cheonggyecheon Area
after Restoration
(http://www.metro.seoul.kr/kor2000/chungaehome/en/seoul/2sub.htm/)
3. Public transport increases lead to
exponential declines in car use…
Exponential growth can work for us…
4. Peak oil has happened…
Climate policy: Oil's tipping point has passed
Nature 481,433–435 26 January 2012
5. Culture is changing
Annual vehicle miles per driver by age,
USA, 1995, 2001, 2009
Young people are connected without
cars…
‘Cars are so yesterday: young and
rich leave guzzlers behind’
And increased:
Public transit 100%
Biking 122%, and
Walking by 37%
From 2001 to 2009, car
use by 16 to 34 year
olds decreased from
10,300 miles to 7900
miles per capita – a
drop of 23 per cent.
In Central London, traffic fell by 19 per
cent between 2000 and 2009.
The Times Nov 6, 2012
‘Supporters of “PeakCar” theory see a future
in which the inner cities
are given over to
pedestrians, cyclists and
public transport, and
café culture replaces car
culture ….’
6. Its more economic.
Agglomeration economies….and
avoidable costs
CUSP paper: each new fringe block
1. Is subsidised by $85,000 in infrastructure.
2. Costs $250,000 extra in transport costs over 50
years.
3. Produces 4.4 tonnes/yr more in greenhouse
gases, and
4. Health is better and productivity 6% better
www.sustainability.curtin.edu.au
What about the emerging cities?
Shanghai 1990 and 2010
1990’s - Flirting with the American
model…
Rapidly filled…
So what can be done?
Shanghai Metro…12 lines, 273 stations,
420km covering 80% of metro area…
Built mostly since 2000; carries 8 million per day
Global growth now in rail…
• 82 Chinese cities building metros and high
speed rail between cities
• 14 Indian cities building metros
• Middle east cities building rail for first time
Delhi Metro
10%/year car use will hit the
wall soon…?
The global turn-around….
16.0
14.0
VKT/capita (thousands)
12.0
10.0
US
OECD
8.0
Non-OECD
World
6.0
4.0
2.0
0.0
2000
2010
2030
2050
How do we fund quality public
transport…?
Southern Railway
Carrying 65,000 per day cf 14,000 on buses.
19% growth in past year!
40,000
0
1988
1989
1990
1991
1992
1993
1994
1995
1996
1997
1998
1999
2000
2001
2002
2003
2004
2005
2006
2007
2008
2009
2010
2011
iANNUAL RAIL BOARDINGS ('000s: Train and Tram)
70,000
Southern Line
60,000
50,000
Northern Line
30,000
Adelaide
Perth
20,000
10,000
YEAR
The next phase in Perth….
Perth: 21st Century City
Focus on the 13 big development projects
in Perth and show how they can be:
• Leading demonstrations of low carbon,
renewable, green development
• Dense, mixed use centres made viable
through light rail
• Financed by a new private-public
mechanism that captures the value
inherent in green, transit oriented
development….
Committee for Perth report...
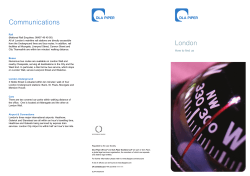
Public Transport Funding – Value of Public Transport
Transit (aggregate)
Median unit dw elling prices over 25 years
Transit suburbs versus non-transit suburbs
No n-transit (aggregate)
Trendline (transit)
Trendline (no n-transit)
900,000
800,000
700,000
600,000
M edian 500,000
price
($ )
400,000
300,000
200,000
100,000
1985
1987
1989
1991
1993
1995
1997
1999
Corview (2010)
2001
2003
2005
2007
2009
Integrated Transport
TRANSPORT
LAND USE
VALUE
CAPTURE
FINANCE
Value capture through building TOD’s
a. Through selling government land, eg
Copenhagen Metro sold a military base,
Canberra will sell a Showground site. PPP
Value capture through building TOD’s
b. Through government buying land around
stations and developing it themselves, eg Hong
Kong, Tokyo, Osaka…. Not PPP.
Value capture through building TOD’s
c. Through government capturing private land
value uptake in rail catchment, eg Australia….
Probably PPP.
Shared Value Capture Funding Model
1. Accessibility benefits analysis.
2. Land value data collection of the difference
between those areas varying in accessibility.
3. Hypothecate land value taxation increases
due to land values increasing in a special
fund.
4. Delivery through a redevelopment authority.
5. Can do in a PPP through private bids to
achieve public goals. Can be off-balance
sheet.
Example – Doncaster rail, Melbourne
SNAMUTS model showing public
transport accessibility - BEFORE
SNAMUTS model showing public
transport accessibility - AFTER
Infrastructure Australia’s first package –
55% urban rail….historic! Requires TOD’s
and alternative funding options….
Can it work in India?
What is the best model?
AusAID Project 2013/15 – ‘Stemming Car Dependency
and Improving Transport Options in Indian Cities’,
Pune & Bangalore
Partnership
• CUSP, Curtin University – 2 Indian PhD’s
• Arup
• Centre for Environment Education- CEE
• Parisar Sanrakshan
• College of Architecture for Women and Dr. BN
College of Architecture
• Institute of Urban Transport (India)
• Ministry of Urban Development
• Karnataka Directorate of Urban Land Transport
• Indian Institute for Human Settlements (IIHS)
Next Steps
Deliberative Democracy
We need your help….
[email protected]


© Copyright 2026