
Dear Family,
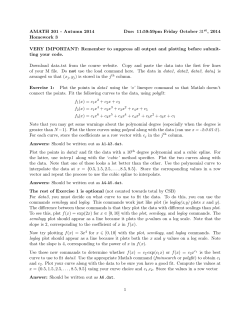
Dear Family,
Content
Overview
Important Words
Your child will be learning about numbers throughout the school
year. The math unit your child is beginning to study now involves
numerical data in the form of statistics.
Some of the important words we will be working with in this
unit are shown at the left. Some of the data displays we will be
working with are shown below.
mean or average
Population (in millions)
Histogram
median
range
interval
quartiles
U.S. Population, 2000
80
70
60
50
40
30
20
10
0
14
15–24 25–34 35–44 45–54 55–64 65–74
75
& under
& over
Age Group
clusters
Dot Plot
peaks
gaps
30
31
32
33
34
35
36 37 38 39 40
Number of Crunches
41
42
43
44
45
Box Plot
minimum
value
0
1
2
3
4
lower quartile
Q1
5
6
7
8
median
upper quartile
Q3
maximum
value
9 10 11 12 13 14 15 16 17 18 19 20
In addition to learning about ways to display data, your child will
be learning about ways to analyze and summarize it. In other
words, we will be exploring ways to make sense of data and
statistics.
If you have any questions or comments, please call or write to me.
Sincerely,
Your child’s teacher
Unit 8 addresses the following standards from the Common Core State Standards for Mathematics with
California Additions: 6.SP.1, 6.SP.2, 6.SP.3, 6.SP.4, 6.SP.5, 6.SP.5a, 6.SP.5b, 6.SP.5c, 6.SP.5d, and all Mathematical Practices.
UNIT 8 LESSON 1
Making Sense of Data
193
Estimada familia,
Un vistazo
general al
contenido
Palabras
importantes
Su hijo aprenderá diferentes conceptos relacionados con los
números durante el año escolar. La unidad de matemáticas que
estamos comenzando a estudiar trata de datos numéricos en
forma de estadísticas.
Algunas de las palabras importantes que usaremos en esta unidad
se muestran a la izquierda. Algunas de las representaciones de
datos que estaremos usando se muestran debajo.
Histograma
Población (en millones)
media o promedio
mediana
rango
intervalo
Población de EE. UU., 2000
80
70
60
50
40
30
20
10
0
14
15–24 25–34 35–44 45–54 55–64 65–74
75
y menor
y mayor
cuartiles
Edades
Diagrama de puntos
agrupamientos
valores pico
brechas
30
31
32
33
34 35 36 37 38 39 40 41
Número de flexiones abdominales
42
43
44
45
Diagrama de caja y brazos
valor
mínimo
0
1
2
3
4
primer cuartil
Q1
5
6
7
8
mediana
tercer cuartil
Q3
valor
máximo
9 10 11 12 13 14 15 16 17 18 19 20
Además de aprender acerca de diferentes maneras de representar
datos, su hijo aprenderá cómo analizarlos y resumirlos. En otras
palabras, explorará maneras de interpretar mejor los datos y las
estadísticas.
Si tiene preguntas o comentarios, por favor comuníquese conmigo.
Atentamente,
El maestro de su hijo
En la Unidad 8 se aplican los siguientes estándares auxiliares, contenidos en los Estándares estatales comunes de
matemáticas con adiciones para California: 6.SP.1, 6.SP.2, 6.SP.3, 6.SP.4, 6.SP.5, 6.SP.5a, 6.SP.5b, 6.SP.5c, 6.SP.5d, y todos los
de prácticas matemáticas.
194
UNIT 8 LESSON 1
Making Sense of Data
8–2
Content Standards 6.SP.1, 6.SP.4, 6.SP.5,
6.SP.5a Mathematical Practices MP.2, MP.3, MP.4, MP.5,
MP.6, MP.8
► Make a Dot Plot
The data below show the number of hours a group of
students spent doing homework last week.
5, 4, 1, 6, 0, 5, 3, 3, 5, 6, 1, 3, 8, 5, 4
1. Draw a dot plot to represent the data. Title your display.
2. How many students does your dot plot represent? Explain
how you know that number of students is correct.
3. Analyze Why are no dots shown at 2 and at 7?
4. Analyze Why do you think 5 hours is the most frequent
number of hours? Explain.
5. Predict The data represent 15 students. Would the scale
of the plot change if it included more students? Explain.
6. Predict Suppose the data represent sixth grade students.
Would the data change if it represented high school
students? Explain.
UNIT 8 LESSON 2
Dot Plots and Histograms
195
8–2
► Make a Histogram
The table below shows the lengths of various U.S. rivers.
Selected Rivers of the United States
Length (miles)
River
Length (miles)
Connecticut
407
Savannah
314
Hudson
306
Illinois
273
Mobile
45
Roanoke
410
Yazoo
169
Saint Johns
285
River
Potomac
Apalachicola
287
90
Monongahela
129
Kanawha
97
Sacramento
374
Delaware
367
14. On the grid below, draw and label a histogram of
the data.
196
UNIT 8 LESSON 2
Dot Plots and Histograms
8–3
Content Standards 6.SP.2, 6.SP.3
Mathematical Practices MP.3, MP.4, MP.6, MP.8
Vocabulary
mean
► Leveling Out and Fair Shares
The mean is a measure of the center for a set of numerical
data. It summarizes all of its values with a single number. Use
the three groups of cubes shown below for Exercises 1 and 2.
1. Suppose two cubes are moved from the left group
to the center group, and two cubes are moved from
the right group to the center group. Will the groups
be leveled out and represent fair shares? Explain.
2. Explain how to level out the three
groups so that each group represents
a fair share. Use the words add and
subtract in your answer. Then sketch
the fair shares in the space at the right.
Quiz Scores
► Calculate the Mean
Eight students took a 10-question quiz. The number of
correct answers each student scored is shown in the
table at the right. Use the table for Exercises 3 and 4.
Student
Score (Number
Correct)
Blaise
6
Dani
7
3. What is the quotient when the sum of the
scores is divided by the number of scores?
Olivia
8
Jamaal
9
4. What is the mean of the data? Explain.
William
5
Shanika
8
Cora
6
Enrico
7
UNIT 8 LESSON 3
Making Data Groups Equal
197
8–5
Content Standards 6.SP.2, 6.SP.3, 6.SP.4, 6.SP.5c
Mathematical Practices MP.2, MP.3, MP.4, MP.6
► Draw Models to Unlevel Data
In this lesson, the mean is shown as a balance point.
Draw a dot plot to show the new arrangement of dots.
1. Move one dot to the left and move one dot to
the right so the balance point remains the same.
1
2
3
4
5
6
7
1
2
3
4
5
6
7
5
6
7
8
9
10
11
2. Move all of the dots so the balance point
remains the same.
5
6
7
8
9
10
11
12
3. Move all of the dots so that the
balance point changes to a
different whole number. Draw
the new balance point.
13
12
13
11
12
13
14
15
16
17
18
19
20
21
22
11
12
13
14
15
16
17
18
19
20
21
22
1
2
3
4
5
6
7
8
9
10
11
12
1
2
3
4
5
6
7
8
9
10
11
12
4. Move all of the dots so that the
balance point is 6.
198
UNIT 8 LESSON 5
The Mean as a Balance Point
8–5
► Predict the Mean
Plot the given data. Draw a balance point to predict
where you think the mean will be located. Then
calculate the mean to check your prediction.
5. 10, 17, 9, 18, 11
8
9
10
11
12
6. 8, 10, 7, 5, 10, 2
13
14
15
16
17
mean:
18
1
2
3
4
5
6
7
8
9
10
mean:
► What's the Error?
Dear Math Students;
I was asked to decide if the balance point of the
dot plot at the right was correct.
The numbers to the left of the balance point are
4, 4, and 5, which add to 13. The numbers to the right
of the balance point are 8 and 9, which add to 17.
3
4
5
6
7
8
9
I decided the balance point is not correct because
the total on one side of the balance point is not the
same as the total on the other side.
Can you help correct my thinking?
Your friend,
Puzzled Penguin
7. Write a response to Puzzled Penguin.
UNIT 8 LESSON 5
The Mean as a Balance Point
199
8–8
Content Standards 6.SP.2, 6.SP.3, 6.SP.4, 6.SP.5c, 6.SP.5d
Mathematical Practices MP.1, MP.3, MP.4, MP.5, MP.6, MP.7, MP.8
Vocabulary
box plot
► Compare a Dot Plot and a Box Plot
The dot plot and box plot below represent the same set of
data. A box plot is a graphic summary that shows the median,
quartiles, and minimum and maximum values of a set of data.
minimum
value Q1
0
1
2
3
4
5
6
7
8
9
10
0
1
2
median
3
Q3
maximum
value
4
5
6
7
8
25
26
27
28
29
9
10
1. In which display, the dot plot or the box plot, is it easier
to identify the median and quartiles of the data? Give a
reason to support your answer.
2. Use the box plot to name the median, the quartiles, and
the minimum and maximum values of the data. Explain
how you know.
3. In which display, the dot plot or the box plot, is it easier
to identify the range into which one half the data can
be found? Explain your answer.
► Make a Box Plot
4. Make a box plot to represent the dot plot data.
23 24 25 26 27 28 29
200
UNIT 8 LESSON 8
23
24
Box Plots
8–9
Content Standards 6.SP.5, 6.SP.5c
Mathematical Practices MP.1, MP.2, MP.3, MP.6
► Determine Distance from the Mean
This dot plot shows six values. The mean of the values is 5.
1
2
3
4
5
6
7
8
9
10
mean
The numbers below represent each dot’s distance from
the mean.
0
0
0
2
2
1
2
3
4
5
4
6
7
8
9
10
mean
1. Why is 5 the mean?
2. What subtraction is used to calculate distance from the
mean to each blue dot?
3. What subtraction is used to calculate distance from the
mean to the green dot?
4. Calculate the mean of the dot plot below and label it. Then
in the space at the right, write a number for each dot that
represents the dot’s distance from the mean.
1
2
3
UNIT 8 LESSON 9
4
5
6
7
8
9
10
1
2
3
4
5
6
7
8
9
10
Mean Absolute Deviation
201
8–9
► Compare Mean Absolute Deviations
A basketball team consists
of two groups of players
with five players in each
group. The tables at the
right show the number
of points the players have
scored so far this season.
Group A Points Scored
Group B Points Scored
Nick
10
Casey
29
Kurtis
31
Pedro
43
Raul
68
Zack
32
Cory
26
Andre
45
Hector
45
Tommy
31
Distance
from Mean
Group
B
Distance
from Mean
13. Calculate the mean number of points
scored by the players in each group.
Group A mean:
Group B mean:
14. Calculate each player’s
distance from the
mean number of
points scored and
write the distances
in the table at the
right.
Group
A
Nick
Casey
Kurtis
Pedro
Raul
Zack
Cory
Andre
Hector
Tommy
15. Calculate the mean absolute deviation of each group.
What does your calculation suggest?
Group A mean absolute deviation:
Group B mean absolute deviation:
16. Which player in each group has the greatest deviation
from the mean?
Group A player:
Group B player:
17. What does the greatest deviation from the mean suggest
about the two players you named in Exercise 16?
202
UNIT 8 LESSON 9
Mean Absolute Deviation
8–9
► What’s the Error?
Dear Math Students,
On the last day of school, the students
in a sixth grade class were asked how
many days they were absent that year.
The table shows the data that were
collected.
I calculated the mean absolute
deviation for each set of data.
I concluded that the data for the girls
showed more variability than the data
for the boys.
I was told my conclusion was wrong.
Can you tell me why?
Your friend,
Number of Days
Absent
Boys
Girls
2
0
8
5
0
3
0
9
0
1
0
3.5
1
3
4
0
4.5
3
5
2
Puzzled Penguin
18. Write a response to Puzzled Penguin.
UNIT 8 LESSON 9
Number of Days
Absent
Distance
from
the mean
Distance
from
the mean
Boys
Girls
Mean Absolute Deviation
203
8–10
► Display and Summarize Data
Twenty-five sixth graders were surveyed and asked “In the
morning, how long does it take you to get ready for
school?” Their answers are shown in the table at the right.
Use the table for Exercises 5–7.
5. In the space below make a display of the data that
enables you to see its overall shape.
6. Describe the shape of the data. Use the words clusters,
peaks, gaps, and outliers in your answer.
Number
of
Minutes
30
60
45
60
25
90
55
60
50
60
30
60
10
45
25
45
30
60
50
60
45
90
60
30
50
7. Which measure—mean, median, range, interquartile
range, or mean absolute deviation—best describes the
data? Include a reason to support your answer.
204
UNIT 8 LESSON 10
Clusters, Peaks, Gaps, and Outliers
Unit 8
1. Is the question a statistical question? Select Yes or No for each question.
a. How many pets do you have in
your home?
Yes
No
b. How tall are basketball players?
Yes
No
c. Who is the tallest 6th grade student?
Yes
No
d. How many minutes long is a lunch
period in a school?
Yes
No
e. How much time do 6th grade students
spend doing homework every night?
Yes
No
2. Choose one number from each column to show the mean and the
median of the data set
8, 16, 4, 8, 5, 10, 12, 12, 10, 12, 13
Mean
5
8
10
11.5
12
12.5
Median
5
8
10
11.5
12
12.5
3. Suppose the data in one dot plot are symmetric and the data
in a related dot plot are not symmetric. Explain how the dot plots
would look different.
4. Why do the quartiles of a set of data divide the data into four equal parts?
UNIT 8 TEST
205
Unit 8
Name
Date
5. Explain why you can think of finding a mean as
unleveling and leveling data.
6. Norberto collected the data shown.
21
16
10
6
12
4
a. Calculate the mean.
b. Calculate the median.
7. Trina’s final math grade is the average of five scores—four quarterly
tests and a final exam. Her quarterly test scores were 72, 80, 84, and 76.
What is the lowest score she can earn on her final exam if her goal is to
have an average score of 80?
Choose the correct answer.
80
c.
88
b.
84
d.
92
© Houghton Mifflin Harcourt Publishing Company
a.
8. Choose a number from the number tiles to show the median,
first quartile (Q1) and third quartile (Q3) of the data on the dot plot.
2
6
3
9
Median:
206
UNIT 8 TEST
4
10
Q1:
5
11
1
Q2:
2
3
4
5
6
7
8
9
10
11
Unit 8
9. The dot plot below shows the number of correct
answers a group of students scored on a quiz.
1
2
3
4
5
6
7
8
Number of Correct Answers
9
10
a. Calculate the mean absolute deviation of the data.
b. Consider the shape of the data in the dot plot above. Does the
dot plot display a cluster or clusters of data? Explain.
10. Using the dot plot from Problem 9, categorize each data value
as a peak or a gap. Not every data value will be used.
1
2
3
4
5
GAP
6
7
8
9
10
PEAK
11. Are any of the data values outliers? Explain why or why not.
UNIT 8 TEST
207
Unit 8
12. Look back at Problem 9. In the space below, make a box plot display of the data.
0
1
2
3
4
5
6
7
8
9 10 11 12
13. Calculate the range and interquartile range of the dot plot data.
1
2
3
4
5
6
7
8
Range:
9
10
11
12
13
14
15
Interquartile range:
14. The table below shows the length of the shorelines of various states.
a. On the grid, draw a histogram of the data.
Shorelines of
Selected States
Texas
Rhode Island
California
3,427
Hawaii
1,052
607
New Jersey
1,792
Maine
3,478
Oregon
1,410
South Carolina
2,876
4
3
2
1
618
Massachusetts
1,519
Washington
3,026
New York
1,850
UNIT 8 TEST
5
384
2,344
Connecticut
Shorelines of Selected States
3,359
Georgia
Alabama
208
Length
(miles)
Number of States
State
0
1–999
1,000–1,999 2,000–2,999 3,000–3,999
Length (miles)
Unit 8
14b. In your histogram for Problem 14a, which length interval has the
greatest number of states?
1 - 999
1,000 - 1,999
2,000 - 2,999
3,000 - 3,999
cluster
gap
15. In the box plot below, the data value at 15 represents a(n)
.
outlier
peak
1
2
3
4
5
6
7
8
9
10
11
12
13
14
15
16. Suppose you wanted to investigate the size of a typical
sixth grader’s foot.
a. What unit of measure would you use?
b. How would you do the measuring?
17. Calculate the range and interquartile range for the
data displayed in the box plot.
minimum
value
Q1 median
Q3
maximum
value
20 21 22 23 24 25 26 27 28 29 30 31 32 33 34 35 36 37 38 39 40
Range:
UNIT 8 TEST
Interquartile range:
209
Unit 8
18. The set of data below shows the number of brothers
and sisters each student in a sixth grade class has.
2
0
3
1
5
2
0
4
0
3
2
3
2
1
2
Part A
Make a dot plot to to display the data.
0
1
2
3
4
5
Number of Brothers and Sisters
Part B
Interpret the dot plot data.
• How many students does the dot plot represent?
• What does the data value 0 represent?
Part C
Dena calculated these measures for the data:
Mean: 6
Median: 2
Range: 4
Are her calculations correct? If not, calculate the correct
measures and explain her error.
210
UNIT 8 TEST


© Copyright 2026