
Environmental Lead Exposure, Catalase Gene and Markers of Antioxidant and
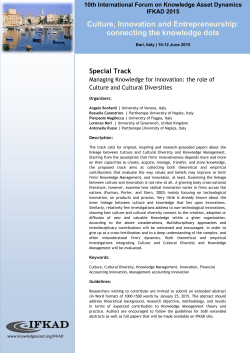
Environmental Lead Exposure, Catalase Gene and Markers of Antioxidant and
Oxidative Stress Relation to Hypertension: An Analysis Based on The EGAT STUDY
Jintana Sirivarasai1*, Sukhumpun Kaojarern2, Suwannee Chanprasertyothin3, Pachara
Panpunuan4, Krittaya Petchpoung5, Aninthita Tatsaneeyapant6, Krongtong Yoovathaworn7,
Thunyachai Sura4, Sming Kaojarern8, Piyamit Sritara4
1
Graduate Program in Nutrition, 2Cardiovascular&Metabolic Center, 3Office of Research
Academic and Innovation, 4Department of Medicine, 5Research and Development Institute,
Kasetsart University, 6Health Office, Electricity Generating Authority of Thailand,
Nonthaburi, 7Department of Pharmacology, Faculty of Science,8Occupational and
Environmental Toxicology Center, Faculty of Medicine Ramathibodi Hospital, Mahidol
University, Bangkok, 10400 Thailand
*Correspondence should be addressed to Jintana Sirivarasai ; [email protected]
Lead has been linked to the development of hypertension via oxidative stress. Catalase play
an important role in the disposal of hydrogen peroxide in erythrocyte and its activity was
determined by CAT gene. The aim of this study were to investigate 1) the association
between blood levels of antioxidant markers such as catalase, superoxide dismutase,
glutathione, glutathione peroxidase, oxidative stress-marker (malondialdehyde), and blood
lead level; 2) the influence of genetic polymorphism of CAT gene (rs769217) on change in
blood pressure in general population of EGAT STUDY project. This is a cross-sectional
study of 332 normotensive, 432 prehypertensive and 222 hypertensive male subjects.
Hypertensive subjects had significantly higher blood lead level (5.28 μg/dL) compared to
normotensive (4.41μg/dL) and pre-hypertensive (4.55 μg/dL) subjects (p<0.05). These
significant findings also found in MDA levels. Moreover, individual with TT genotype in
hypertensive group had significantly higher blood lead and MDA levels (6.06 μg/dL and 9.67
μmol/L) than those with CC genotype (5.32 μg/dL and 8.31 μmol/L, p<0.05). Our findings
suggested that decreased blood catalase activity in this polymorphism together with low level
lead exposure induced lipid peroxidation may be responsible for hypertension.
1. Introduction
General population may be exposed to lead through various sources such as dietary
contamination (via food chain, and lead releasing from food containers or ceramic glaze),
public water supplies contamination, herbal remedies and manufacturing byproducts such as
E-waste recycling, manufacture of batteries, sheet lead, solder, brass and bronze plumbing,
radiation shields, circuit boards, and military equipments [1]. Lead exposure occurs mainly
through the respiratory and gastrointestinal tracts. Approximately 30-40 percent of inhaled
lead is absorbed into the bloodstream. Gastrointestinal absorption varies depending on
nutritional status (i.e. iron or calcium deficiency) and age. Once absorbed, 99 percent of
circulating lead is bound to erythrocytes for approximately 30-35 days (estimated about 1%
absorbed lead is found in plasma and serum) and is dispersed into the soft tissues, including
renal cortex, liver, lung, brain, teeth, and bones [1].
Since bone accounts for more than 94% of the adult body burden of lead and bone
lead level by K-X-ray fluorescence represent lead content in the cortex of tibia and the patella
trabecular [2]. This measurement is an indicator of cumulative lead exposure and particularly
relevant to the elderly in whom elevated bone lead concentrations may represent chronic
toxicity [3]. Measuring blood lead is the most commonly accepted and verifiable biomarker
for lead exposure. This assessment, by industrial hygienist, was used both in current and past
environmental lead exposures to quantify the intensity of the exposure [4]. In the blood
stream, lead circulating is mobile whereas lead in bone is stored. Mobile lead exerts adverse
effects on human body. Under conditions of more or less constant and prolonged exposure,
an individual’s blood lead level reflects the quantity of biological active form of lead in their
body [5]. A large number of reports revealed positive correlations between blood lead and
detrimental effects on the central nervous, hematopoietic, renal, immune and cardiovascular
systems [6].
Hypertension is a multi-factorial condition associated with both environmental and
genetic factors. For environmental risk factors include dietary, lifestyle, obesity, and some
toxicants. Lead is one of the candidate metals which can be linked to the development of
hypertension [7, 8]. Numerous human and animal studies found a causal relationship between
low-level lead exposure and hypertension. Some evidences indicated that oxidative stress
played a significant role in the etiology of lead-induced hypertension [8]. Oxidative stress is
described as a physiological stage in which antioxidant defense is inadequate to detoxify the
reactive oxygen species (ROS). This oxidative process results in the damaging of essential
biomolecules such as protein, lipid and DNA. Over production of ROS is demonstrated in
lead-induced oxidative stress. Previous experimental studies revealed that lead could promote
ROS production in kidney and cardiovascular tissues [9, 10]. In addition, lead influenced on
cell membrane alterations, such as lipid component, membrane integrity, permeability and
function and finally leading to lipid peroxidation [11, 12].
The most common group of indices used to assess oxidative stress is that of
peroxidation products of lipids, usually polyunsaturated fatty acids, which are susceptible to
attack by free radicals. All these products of degradation and decomposition are used in
assessing oxidative stress, including hydroperoxides, F2-isoprostanes and malondialdehyde
(MDA) [13]. MDA is a principal and most studied product of polyunsaturated fatty acid
peroxidation. This aldehyde is a highly toxic molecule and should be considered as more than
a marker of lipid peroxidation. [14]. Derivertization of MDA with thiobarbituric acid (TBA),
as MDA-TBA adduct is wildly used method to monitor the level of lipid peroxidation in
biological sample. The HPLC with fluorescence detection significantly improved the
specificity and overcome overestimation of the MDA-TBA adduct, as indicated by much
more homogenous results obtained in various publications [15]. By measurement of F2isoprostanes, TBA-MDA adduct, or lipid hydroperoxides, there was some reports that
showed correlations between TBA-MDA adduct and F2-isoprostanes or lipid hydroperoxides
[12].
Another mechanism of lead induced oxidative stress is the effect on antioxidant
defense systems of cells. Lead exhibit a high affinity for sulfhydryl (SH) groups and can
interfere antioxidant activities by inhibiting functional SH groups in several enzymes such as
superoxide dismutase (SOD), catalase (CAT), glutathione peroxidase (GPx), glucose-6phosphate dehydrogenase (G6PD) and ALAD [16]. A large number of researches were
conducted to further understand imbalance between antioxidant and oxidant stages with risks
of chronic diseases, especially in field of genetic variations of antioxidant enzymes [17-19].
Catalase is a well-known antioxidant enzyme that plays role in the conversion of H2O2 to
H2O and O2 [20]. The CAT gene is located in chromosome 11p13 and consists of 13 exons.
The C111T polymorphism of this gene, in exon 9 (rs769217) is responsible for alteration in
its activity [21]. To our knowledge, data related to influence of CAT C111T polymorphism
on antioxidant system/oxidative stress and hypertension in environmental lead exposure are
very limited. Moreover, this is the first study in Thai population that emphasizes on
biomarkers of lead exposure and of susceptibility with CAT gene. The aims of the present
study were to investigate 1) association between blood levels of antioxidant markers such as
CAT, SOD, GPx, glutathione (GSH), MDA and blood lead level; 2) possible influence of
CAT polymorphism on change in blood pressure among general population.
2. Materials and Methods
2.1 Study population
The Electric Generating Authority of Thailand (EGAT) study was the first cohort
study of chronic disease in Thailand, originally designed in 1985 (known as EGAT 1), and
mainly covered multidisciplinary researches related to cardiovascular disease (CVD) risks
such as nutrition and toxicology. The 986 male subjects were participants in the third survey
of EGAT 2 in 2009 (the first survey started in 1998 and second survey in 2003). This study
was approved by the Committee on Human Rights related to Researches involving human
subjects, Faculty of Medicine Ramathibodi Hospital, Mahidol University, Thailand. All
participants completed a self-administered questionnaire, and underwent a physical
examination, and performed laboratory analysis, including tests for diabetes, liver and kidney
diseases, etc. [22]. Toxicological profile of heavy metals and genetic analysis were
determined. Ten milliliters of blood were collected by venipuncture into EDTA and
heparinized tubes from each subject and immediately centrifuged at 2000g. Buffy coat,
erythrocytes and plasma were separated and stored at -20°C until genotyping analysis and
biochemical measurements were performed.
According to the Joint National Committee 7 (JNC 7), hypertension was defined as
systolic blood pressure (SBP) ≥140 mmHg or diastolic blood pressure (DBP) ≥90 mmHg,
pre-hypertension was defined as SBP 120-139 mmHg or DBP 80-89 mmHg and normal
blood pressure was defined as SBP <120 mmHg and DBP < 80 mmHg [23]. Based on this
criterion, participants were classified into 3 groups; 332 normotensive, 432 prehypertensive
and 222 hypertensive subjects.
2.2 Determination of blood lead
Blood lead concentration was measured by graphite furnace atomic absorption
spectrometry (GFAAS) with Zeeman background correction. The analytical procedure based
on the method described by Subramanian [24]. The measurement was calculated as
micrograms per deciliter (μg/dL) and expressed by means of total blood lead. The intra-assay
coefficients of variation (CV) ranged from 2.8-5.9% and inter-assay CV ranged from 3.26.4%.
2.3 Determination of glutathione by the DTNB method
Whole blood (0.1 ml) was added to distilled water (1.9 ml) together with 3 ml of
precipitating solution (1.67 g glacial meta-phosphoric acid, 0.2 g disodium
ethylenediaminetetraacetic acid; EDTA and 30 g sodium chloride). Then, the filtrate (0.5 mL)
was added to 0.3 M phosphate buffer, pH 6.4 (2 ml). Finally, 1 mM DTNB (0.25 ml) was
added, mixed well, and the absorbance was read at 412 nm within 4 min [25]. The intra-assay
and inter-assay CV were 4.3% and 6.0%, respectively.
2.4 Determination of catalase activity
Catalase activity was measured by the decrease in absorbance at 240 nm due to
H2O2 consumption, according to Aebi method [26]. Hemolysate (0.1 ml) was added to
cuvette containing 1.9 ml of 50 mM phosphate buffer (pH 7.0). Enzymatic reaction was
started by the addition of 1.0 ml of freshly prepared 30 mM H2O2. The rate of decomposition
of H2O2 was measured by spectrophotometer from changes in absorbance at 240 nm.
Activity of catalase was expressed as U/gHb. The intra-assay and inter-assay CV were 3.2%
and 4.7%, respectively.
2.5 Determination of SOD activity
Superoxide dismutase (SOD) activity was measured by the method of Winterbourn et
al. [27]. This method used nitroblue tetrazolium (NBT) as indicator, and riboflavin as
superoxide-generating system. Result was expressed as unit of SOD per gram of Hb. One unit
is defined as the amount of enzyme causing half the maximum inhibition of NBT reduction.
The intra-assay and inter-assay CV were 3.6% and 5.5%, respectively.
2.6 Determination of GPx activity
GPx activity was assayed by method of Beutler, et al. [28], using t-butyl
hydroperoxide (t-BuOOH) and glutathione (GSH) as substrates, and followed by measuring
the oxidation of NADPH at 340 nm at 37°C with a spectrophotometer in the presence of
glutathione reductase. The reaction mixture consisted of 0.5 mM EDTA, 0.1 M Tris-HCl (pH
8.0), 2.0 mM NADPH, 2 mM GSH, 1 U glutathione reductase, and hemolysate in a total
volume of 0.99 mL. The enzymatic reaction was initiated by the addition of 10 μL t-BuOOH.
One unit of GPx activity is defined as the amount of enzyme that oxidizes 1 μmol
NADPH/min. GPx activity was expressed as U/gHb. The intra-assay and inter-assay CV were
4.6% and 6.8%, respectively.
2.7 Determination of MDA
MDA was determined using an HPLC method with fluorescence detector, as
described by Khoschsorur et al. [29]. Detection limit was 0.25 μmol/L and this method
exhibited a linear response of MDA in a range of concentration from 1.50 to 15.0 μmol/L and
calibration curve presented high correlation coefficient (r2 > 0.90, p = 0.001; n=10). The
intra-assay and inter-assay CV were 3.9% and 4.7%, respectively.
2.8 Genotyping assay.
The genomic DNA was extracted from lymphocytes by a modified salting out
procedure [30] and frozen at -20 ºC until analysis. The genetic polymorphism of CAT
(rs769217) was performed by Real-time polymerase chain reaction (real-time PCR)
according to the method of TaqMan SNP Genotyping Assays on an ABI 7500 instrument
(Applied Biosystems, Foster City, CA, USA), in 96-well format. The TaqMan Assay
included the forward target-specific polymerase chain reaction (PCR) primer, the reverse
primer, and the TaqMan MGB probes labeled with 2 special dyes: FAM and VIC. The
concentrations of probes were 0.04 μM. Amplification of 20 ng of DNA was performed
during 40 cycles in a reaction volume of 10 μl. TaqMan Universal PCR Master Mix was
used for analysis. Thermocycling conditions were: 95 ºC for 15 seconds, follow by 60 ºC for
1 minute. Information of specific probe and primers are available on the National Cancer
Institute's SNP500 database web page at http://snp500cancer.nci.nih.gov/ [31]. Quality
control procedure included repeat genotyping of at least 10% of DNA samples. On every
single 96-well microtiter plate, we include negative control in the form of water. The
percentage of successful rate for 95 cases and negative control was 100 and this assay was
good discriminates among individuals. For overall SNP genotyping assay, reported error rate
for 983 cases was 0.33% which it involved DNA extracts of poor quantity and quality.
2.9 Statistical analysis
Statistical analyses were carried out using the SPSS 16.0 for window software (SPSS,
Inc., Chicaco, IL). Most of the study parameters were presented as mean ± SE. Because of
skewed distribution, lead level was transformed to normal distribution and expressed as
geometric mean ± SE. The comparisons between variables were examined by the Student’s ttest and analysis of variance (ANOVA). Genotype distribution was analyzed with χ2.
Pearson’s correlation was performed to determine the strength of the association between
blood lead and other significantly correlated parameters. A p-value of 0.05 was used as the
criterion for statistical significance.
3. Results
The clinical characteristics and biochemical profile in normotensive, pre-hypertensive
and hypertensive groups are presented in Table 1. Mean age for subjects with hypertension
was comparable to those of pre-hypertension and normaotension. More than 50% of three
groups were in range of 40-55 year old. The control group (23.58 kg/m2) has significantly
lower BMI than pre-hypertensive (25.09 kg/m2) and hypertensive subjects (26.26 kg/m2,
p<0.05). SBP and DBP in hypertensive group (144.9 and 93.7 mmHg) also showed
statistically higher than those in the pre-hypertensive (126.1 and 80.94 mmHg) and control
groups (110.2 and 70.3 mmHg, p<0.05). No significant differences were found with respect
to distributions of alcohol consumption and smoking status among three groups. Furthermore,
subjects with pre-hypertension and hypertension had statistically higher blood levels of
triglyceride, fasting glucose, creatinine and uric acid than the normotensive subjects
As shown in Table 2, there were significantly increasing in blood lead and MDA
levels among three groups, but did not find statistical changes in antioxidant parameters.
Hypertensive subjects had significantly higher blood lead level (5.28 μg/dL) compared to
normotensive (4.41μg/dL) and pre-hypertensive (4.55 μg/dL) subjects (p<0.05). In addition,
blood MDA level in hypertensive group (9.64 μmol/L) was statistically higher than those in
pre-hypertensive (8.02 μmol/L) and normotensive groups (8.23 μmol/L, p<0.01). There were
no significant differences in the means of CAT, SOD, GPx and GSH among three groups.
Our results illustrated that SBP (r=0.218, p<0.01), DBP (r=0.195, p<0.05) and MDA
concentration (r=0.147, p<0.01) were positively correlated with blood lead level (Figure 1).
There was no significant association between blood MDA and SBP or DBP (r=0.131, p=0.08
and r=0.111, p=0.10 respectively) (Figure 2).
Genotype frequencies of CAT C111T polymorphism in this study population were
32.0 % for CC, 46.2% for CT and 21.7% for TT. The genotype distribution among controls
was according to the Hardy-Weinberg equilibrium (p=0.28). Catalase activity was
significantly lower in individual with TT genotype (27044 U/gHb) compared to those with
CT genotype (29103 U/gHb) or CC genotype (30625 U/gHb) (p<0.01). However, the means
of blood lead, MDA, SBP and DBP of individual with CC, CT or TT genotypes did not
reveal differences (Figure 3).
Table 3 illustrates the effect of CAT genotypes on biochemical profile, blood lead,
antioxidant and oxidative stress determinants in three groups classified by CAT genotypes.
All groups with CC, CT and TT genotypes had no significant (p>0.05) differences for lipid
profiles and other biochemical parameters (FBS, Cr and UA). Further analysis in the same
fashion with oxidative stress and antioxidant defense found that there was significant change
of catalase activity with higher activity in wild type allele (32341 U/gHb) and lower activity
in those with mutant allele (27423 U/gHb, p<0.05) in controls. Similar (p<0.05) blood
catalase activities were found for CC, CT and TT genotypes in pre-hypertensive and
hypertensive subjects. In contrast, SOD activity in the hypertensive group showed different
trend (2055 U/gHb for CC vs 2616 U/gHb for TT, p<0.05). The CAT C111T significantly
modified the effect of lead on MDA, as seen only in hypertensive group, in which individual
with TT genotype had significantly higher blood lead and MDA levels (6.06 μg/dL and 9.67
μmol/L) than those with CC genotype (5.32 μg/dL and 8.31 μmol/L, p<0.05).
4. Discussion
Exposed to low level of lead in environmental manner has been reported to cause
dysfunction in many target organs. The overt toxicity of this metal may result from its
potentially induced oxidative stress as seen by an increased prevalence of chronic kidney
disease, cardiovascular disease, peripheral arterial disease, diabetes, hyperuricemia, or
hypertension [7-9]. The positive correlation between blood lead level and SBP or DBP has
been well documented. These associations have been reported in both occupational workers
and population with low exposure to environmental lead. In this study, hypertensive group
has higher blood lead level (5.28 μg/dL) than controls (4.41 μg/dL) (Table 2). In addition, the
positive correlations between blood lead level, SBP and DBP are shown in Figure 2.
Skoczynska [32] suggested various cardiovascular mechanisms of the hypertensive effect by
low doses of lead, including changes in metabolisms of catecholamines, increased activity of
the central adrenergic system, decreased activity of ATP-ase, changes in transmembraneal
transport of ions, inhibition of Na+ secretion and increase in blood volume, increased plasma
rennin activity and enhanced free radicals generation. Moreover, our previous study revealed
relationship between effect of lead exposure on inflammatory marker (high-sensitivity Creactive protein, hs-CRP) and adverse change in SBP [33].
Lipid peroxidation is a well-established mechanism of cellular injury and used as an
indicator of oxidative stress in cells and tissues. In addition, measurement of MDA is widely
used as an indicator of lipid peroxidation. The findings of the present study also supported the
evidence of lead induced ROS generation which represented oxidative stress (Table 2 and
Figure 1). There was an increase in the MDA levels in the hypertensive group (9.46 μmol/L)
in comparison to those in the control group (8.23 μmol/L) (Table 2). In addition, MDA level
showed a significant increase with blood lead level (Figure 2). However, there were no
significant differences in GPx activity and GSH level between controls and pre-hypertensive
or hypertensive group. Catalase and SOD activities showed significant changes in
hypertensive subjects. The results indicated adaptive mechanism in case of oxidative stress
occurred in cell. Impaired these enzyme activities may lead to the excess condition of free
radicals which they can escape antioxidant defense system, contribute to alteration of nitric
oxide bioavailability and affect structure/function of endothelium, resulting in high blood
pressure [34].
Catalase has a predominant role in the disposal of hydrogen peroxide in human
erythrocytes. Deficiency of erythrocyte catalase causes increased hydrogen peroxide
concentration. A few polymorphisms have been revealed for the catalase-encoding gene.
Genetic variations of this gene can be responsible for change of its activity and expression.
The analyzed polymorphism in this population is the C111T polymorphism in exon 9
(rs769217). Gavalas et al. [20] revealed difference in catalase activity between wild-type and
mutant alleles. Allele frequencies for the C and T reported in our study (55% and 45%,
respectively) were similar to those reported previously in Japanese (C allele : 48%; T allele :
52%) [35] and Korean (C allele : 60%.; T allele : 40%) [36]. In contrast to some countries,
the T alleles were less frequent in Hungry (28%) [37], USA (12%) [38] and UK (17%) [20].
Based on genetic determinant of enzyme activity, this study revealed that individuals with TT
genotype of C111T polymorphism associated with low catalase activity compared to those
with wild-type (Figure 3). These findings can be explained by the data which this nucleotide
change may cause slower transcription from the mutant allele than from the wild-type allele
[37].
To our knowledge, the present study is the first research that investigates effect of
CAT polymorphism on blood lead and blood pressure among non-occupational population.
Statistical differences in mean enzyme activities by genotypes were detected. The C111T
polymorphism has effect on blood catalase activity in all study groups (Table 3) but for the
hypertensive group, SOD activity in mutant allele (2616 U/gHb) was significantly higher
than the wild-type allele (2055 U/gHb, p<0.05). As above mention, these enzyme activities
were partially determined by genetic factors and further modified by other various factors,
such as exercise, stress condition, dietary intake of antioxidant and co-exposures to some
toxicants. Moreover, individual with TT genotype in hypertensive group showed significantly
higher blood lead and MDA level than those with CC genotype. Decrease blood catalase
activity in this polymorphism together with low level lead exposure induced lipid
peroxidation may be responsible for hypertension.
This study has an important strength. Because EGAT study is the first cohort study in
Thailand (EGAT 2 started in 1998), focusing on chronic disease with a five-year time series
of survey. Thus it also provides the opportunity to reevaluate the relationship between lead
exposure and blood pressure with the large sample size. A limitation of our study is that
blood lead concentration, as a biomarker of exposure, is not an appropriate marker for
cumulative exposure when compare to bone lead. However, in vivo K-x-ray fluorescence for
bone lead measurement is expensive and impractical for large-scale population studies. In
addition, previous studies have been shown strongly association between blood lead and bone
lead [39, 40] and the most epidemiological studies to date are wildly used blood lead level for
biomonitoring of environmental lead exposure.
In conclusion, the evidence in this study was sufficient to infer a causal association
between lead exposure and elevated blood pressure. Our finding suggested that exposure to
low lead level associated with oxidative stress and deficiency of the enzyme catalase may
contribute to hypertension. Further studies related to other genes involving antioxidant
enzymes or elements will elucidate the relationship between environmental lead exposure,
oxidative stress and adverse health outcomes. For public health implication, regulatory plan
and health intervention program should be developed and implemented for reduction of lead
exposure and health risks such as cardiovascular, kidney and other diseases.
Conflict of Interest
The authors declare no conflict of interest
Acknowledgments
The authors wish to thank the EGAT and their people for participating and establishing this
study. We would like to express our gratitude to all research staffs, especially Miss Nisakron
Thongmung and Ms. Yupin Wisetpanit, Office of Research Academic and Innovation,
Faculty of Medicine Ramathibodi Hospital, for providing subjective data and technical
assistance in specimen collection and preparation. This work was supported by the
Cooperative Research Network (CRN) scholarship; the project for Higher Education
Research Promotion and National Research University Development, Office of the Higher
Education Commission, Ministry of Education, Thailand, and The Thailand Research Fund.
References
[1] F. Barbosa, J.E. Tanus-Santos, R.F. Gerlach, et al., “A critical review of biomarkers used
for monitoring human exposure to lead: advantages, limitations, and future needs,”
Environmental Health Perspectives, vol. 113, no. 2, pp.1669-1674, 2005.
[2] E.J. O’Flaherty, “Physiologically based models for bone-seeking elements. V: Lead
absorption and disposition in childhood,” Toxicological Apply Pharmacology, vol. 131, no.7,
pp.297-308,1993.
[3] A. Rosin, “The long-term consequences of exposure to lead,” The Israel Medical
association Journal, vol.11, no. 11, pp.689-694, 2009.
[4] R.W. Leggett, “An age specific kinetic model of lead metabolism in humans,”
Environmental Health Perspective, vol.101, no. 7, pp 598-616, 1995.
[5] K.P.Mishra, V.K. Singh, R.Rani., et al., “Effect of lead exposure on the immune response
of some occupationally exposed individuals,” Toxicology, vol.188, No. 23,pp.251-259,2003.
[6] L.Patrick, “Lead toxicity, a review of the literature. Part I: Exposure, evaluation, and
treatment,” alternative medicine Review, vol.11, no.1, pp2-22,2006.
[7] H. Hu, A. Aro, M. Payton et al., “The relationship of bone and blood lead to
hypertension, The Normative Aging Study,” The Journal of The American Medical
Association, vol.275, no.15, pp. 1171-1176, 1996.
[8] A.A. Alghasham, M.A. Meki, and H.A. Ismail, “Association of blood lead level with
elevated blood pressure in hypertensive patients,” International Journal Health Science,
vol.5, no.1, pp.17-27, 2011.
[9] N.D. Vaziri, “Mechanisms of lead-induced hypertension and cardiovascular disease,”
American Journal of Physiology - Heart and Circulatory Physiology, vol.295, no.2, pp.
H454-H465, 2008.
[10] H.C. Gonick, Y. Ding Y, A.C. Bondy et al., “Lead-induced HTN: interplay of nitric
oxide and reactive oxygen species,” Hypertension, vol. 30, no.6, pp.1487-1492, 1997.
[11] N.M. Bolin, R. Basha, D. Cox, et al., “Exposure to lead and the development origin of
oxidative DNA damage in the aging brain,” Official Publication of The Federation of
American Societies for Experimental Biology, vol.20, no.6, pp.788-790, 2006.
[12] S. Kasperczyk, J. Kasperczyk, A. Ostałowska et al., “The role of the antioxidant
enzymes in erythrocytes in the development of arterial hypertension among humans exposed
to lead,” Biological Trace Element Research, vol. 130, no.2, pp. 95-106, 2009.
[13] Y.Dotan, D. Lichtenberg, I.Pinchuk, “Lipid peroxidation cannot be used as a universal
criterion of oxidative stress,”, Progress in Lipid Research, vol. 43, no. 3, pp.200-227, 2004.
[14] D.D. Rio, A.J. Stewart, N.Pellegrini, “A review of recent studies on malondialdehyde as
toxic molecule and biological marker of oxidative stress,” Nutrition, Metabolism
&Cardiovascular Diseases, vol.15, no.4,pp.316-328, 2005.
[15] J. Lykkesfeldt, “Malondialdehyde as biomarker of oxidative damage to lipids caused by
smoking,” Clinica Chimica Acta , vol. 380, no.1-2 , pp.50-58, 2007.
[16] R.C. Patra, A.K. Rautray, and D. Swaryp, “Oxidative stress in lead and cadmium
toxicity and its amelioration,” Veterinary Medicine International, doi: 10.4061/2011/457327.
[17] A. Crawford, R.G. Fassett, D.P. Geraghty et al., “Relationships between single
nucleotide polymorphisms of antioxidant enzymes and disease,” Gene, vol.501, no.2, pp.89103, 2012.
[18] L. Fosberg, U. De Faire, and R. Morgenstern, “Oxidative stress, human genetic
variation, and disease,” Archive of Biochemistry Biophysics, vol. 389, no.1, pp.84-93, 2001.
[19] M.L. Mansego, M. Solara Gge, M.P. Alonsoet al., “Polymorphisms of antioxidant
enzymes, blood pressure and risk of hypertension,” Journal of Hypertension, vol. 29, no. 3,
pp. 492-500, 2011.
[20] L.M.Yung, F.P. Leung, X. Yao X, Z.Y. Chen, and Y. Huang, “ Reactive oxygen species
in vascular wall,” Cardiovascular & Hematological Disorder Drug Targets, vol. 6, no. 1,
pp. 1-19, 2006.
[21] N.G. Gavalas, S. Akhtar S, D.J. Gawkrodger, P.F. Watson, and A.P. Weetman,
“Analysis of allelic variants in the catalase gene in patients with the skin depigmentation
disorder vitiligo,” Biochemical and Biophysical Research Communications, vol.345, no. 4,
pp.1586-1591, 2006.
[22] P. Sritara, S. Cheepudomwit, N. Chapman, et al., “ Twelve-year changes in vascular risk
factors and their associations with mortality in a cohort of 3499 Thais: the Electricity
Generating Authority of Thailand Study”, International Journal of Epidemiology, vol. 32,
no. 3, pp. 461-468, 2003.
[23] A.V. Chobanian, “The Seventh Report of the Joint National Committee on Prevention,
Detection, Evaluation, and Treatment of High Blood Pressure,” National High Blood
Pressure Education Program. Report No. 04-5230, 2004
[24] K.S. Subramanian, and J.C. Meranger, “A rapid electrothermal atomic absorption
spectrophotometric method for cadmium and lead in human whole blood”, Clinical
Chemistry, vol.27, no. 11, pp. 1866-1871, 1981.
[25] E. Beutler, O. Duron, and B.M. Kelly, “Improved method for the determination of
blood glutathione,” The Journal of Laboratory and Clinical Medicine, vol.61, pp.882-888,
1963.
[26] H. Aebi, “Catalase”. In: H.U. Bergmeyer, Editor, Methods of enzymatic analysis,
Academic Press, London. pp. 671–684, 1974.
[27] C.C. Winterbourn, R.E. Hawkings, M. Brain, and R.W. Carrell, “The estimation of red
cell superoxide dismutase activity,” The Journal of Laboratory and Clinical Medicine ,
vol.85, no.2, pp. 337-341, 1974.
[28] E. Beutler, “Gluthaione peroxidase”. In: E. Beutler, editor. Red Cell Metabolism : A
manual of biochemical methods. Grune and Stratton. New York, NY, USA: 1975
[29] G.A. Khoschsorur, B.M. Winklhofer-Roob, H. Rabl et al., “Evaluation of a sensitive
HPLC method for the determination of malondialdehyde, and application of the method to
different biological materials,” Chromatographia, vol. 52, no.3-4, pp. 181-184, 2000.
[30] S.A.Miller, D.D. Dykes, and H.F. Polesky, “A simple salting out procedure for
extracting DNA from nucleated cells,” Nucleic Acids Research, vol. 16, no.3. pp. 1215, 1988.
[31] B.R. Packer, M. Yeager, B. Stats, et al., “SNP 500 Cancer: a public resource for
sequence validation and assay development for genetic variation in candidate genes”, Nucleic
Acids Research, vol. 32 (Database issue), pp, D528-534, 2004.
[32] A. Skoczynska A. In : Lead as cardiovascular risk factor. Ed: W Gornicki Wyd. Med.
2006
[33] J. Sirivarasai, W. Wananukul, S. Kaojarern, et al., “Association between Infammatory
marker, Environmental lead Exposure, and Glutathione S-Transferase Gene,” BioMed
Research International, doi: 10.1155/2013/474963.
[34] S. Taddei, A. Virdis, L. Ghiadoni, et al., “Age-related reduction of NO availability and
oxidative stress in humans,” Hypertension, vol. 38, no.2, pp.274-279, 2001.
[35] Y. Kishimoto, Y. Murakami, K. Hayashi et al., “Detection of a common mutation of the
catalase gene in Japanese acatalasemic patients,” Human Genetic, vol.88, no.5, pp. 487-490,
1992.
[36] T.H.Kim, J.M. Hong, B. Oh et al., “Genetic association study of polymorphisms in the
catalase gene with the risk of osteonecrosis of the femoral head in the Korean population,”
Osteoarthritis Cartilage, vol.16, no.9, pp.1060-1066, 2008.
[37] L. Góth, T. Nagy, Z. Kósa et al., “ Effects of rs769217 and rs1001179 polymorphisms of
catalase gene on blood catalase, carbohydrate and lipid biomarkers in diabetes mellitus,”
Free Radical Research, vol.46, no.10, pp.1249-1257, 2012 .
[38] C.B. Casp, J She, and W.T. McCormack, “Genetic association of catalase gene (CAT)
with vitiligo susceptibility,” Pigment Cell Research, vol. 15, no. 1, pp.62-66, 2002.
[39] A.C. Todd, B.K Lee, G-S Lee, et al., “Predictors of DMSA chelatable lead, tibial
lead,and blood lead in 802 Korean lead workers,” Occupational and Environmental
Medicine, vol.58, no.2, pp.73-80, 2001.
[40] F.Kamel F, D.M. Umbach, T.L. Munsat et al., “Lead exposure and amyotrophic lateral
sclerosis,” Epidemiology, vol.13, no.3, pp.11-19, 2002.
Table 1. General characteristics and biochemical parameters of study population according to
hypertension
Variables
Normatension
Pre-hypertension
Hypertension
(N=332)
(N=432)
(N=222)
Age, yrs (AM ± SE)
51.58±0.23
52.01±0.20
52.96±0.33
Age group, N (%)
40-55 yrs
>55 yrs
267 (80.4)
65 (19.6)
328 (75.9)
104 (24.1)
152 (68.5)
70 (31.5)
BMI, kg/m2 (AM ± SE)
23.58 ±0.16
25.09 ±0.15a
26.26 ±0.25a
Drinking status, N (%)
Non-drinkers
Drinkers
125 (37.7)
207 (62.3)
165 (38.2)
267 (61.8)
67 (30.2)
155 (69.8)
Smoking status, N (%)
Non-smokers
Smokers
247 (74.4)
85 (25.6)
342 (79.2)
90 (20.8)
156 (70.3)
66 (20.8)
Biochemical tests (AM ± SE)
Triglyceride, mg/dL
HDL cholesterol, mg/dL
LDL cholesterol, mg/dL
Total cholesterol, mg/dL
Fasting glucose, mg/dL
Creatinine, mg/dL
Uric acid, mg/dL
132.81 ± 4.04
165.78 ± 5.35 a
191.47 ± 8.81 a,b
49.57 ± 0.57
48.74 ± 0.49
49.32 ± 0.071
152.31 ± 2.14
148.49 ± 1.91
146.61 ± 2.72
228.55 ± 2.31
230.33 ± 2.09
233.02 ± 2.79
100.58 ± 1.35
105.91 ± 1.24 a
112.65 ± 3.09 a,b
1.10 ± 0.07
1.14± 0.01 a
1.14 ± 0.01 a
a
5.97 ± 0.06
6.40 ± 0.06
6.61 ± 0.08 a,b
a,b
Significant different from normotension and pre-hypertension, respectively, p<0.05
Table 2. Blood lead level, antioxidants and oxidative stress determinants of study population,
according to hypertension
Variables
Blood lead , µg/dL
Antioxidant biomarkers
CAT, U/gHb
SOD, U/gHb
GPx, U/gHb
GSH, mg/dL
Normatension
(N=332)
4.41 ± 0.10
Pre-hypertension
(N=432)
4.55 ± 0.09
Hypertension
(N=222)
5.28 ± 0.21 a,b
29966 ± 549
2417 ± 80
34.56 ± 0.85
31.42 ± 0.34
28543 ± 422
2365 ± 71
34.92 ± 0.78
31.41 ± 0.32
28084 ± 600
2363 ± 96
36.11 ± 1.14
31.34 ± 0.46
Oxidative stress biomarker
MDA, µmol/L
8.23 ± 0.34
8.02 ± 0.26
9.64 ± 0.45 a,b
a,b
Significant different from normotension and pre-hypertension, respectively, p<0.05
Figure 1. Association between blood lead and serum MDA levels in the study population
Table 3. Biochemical, blood lead, determinants of antioxidant and oxidative stress, classified by CAT genotypes among three groups.
CC
Normotension
CT
TT
CC
(N=104)
(N=145)
(N=83)
(N=139)
Triglyceride, mg/dL
135.0 ± 7.7
129.6 ± 6.2
135.5 ± 7.1
HDL cholesterol, mg/dL
49.36 ± 1.04
49.91 ± 0.87
LDL cholesterol, mg/dL
149.4 ± 4.2
Total cholesterol, mg/dL
Pre-hypertension
CT
TT
CC
Hypertension
CT
TT
(N=207)
(N=86)
(N=73)
(N=104)
(N=45)
161.0 ± 8.9
166.7 ± 8.1
171.0 ± 11.7
166.8± 9.8
206.9 ±14.9
195.9 ±20.7
49.25 ± 1.14
50.37 ± 0.93
49.56 ± 0.66
48.91 ± 1.16
50.83 ±1.32
48.70 ±1.01
48.32 ±1.48
156.1 ± 3.2
149.21 ± 3.6
149.3 ± 2.9
148.1 ± 2.9
147.1 ± 4.4
151.1 ±4.9
145.5 ±4.1
141.9 ±5.3
225.8 ± 4.6
232.0 ± 3.4
225.7 ± 4.0
232.4± 3.3
229.2 ± 3.2
229.8 ± 4.7
235.1 ±5.1
234.2 ±4.3
226.9 ±4.6
Fasting glucose, mg/dL
102.2 ± 2.9
99.94 ± 2.06
99.91 ± 1.76
105.4 ± 2.1
106.1 ± 1.9
106.4 ± 2.6
104.6 ±2.1
119. ±5.9
109.1 ±5.5
Creatinine, mg/dL
1.10 ± 0.01
1.11 ± 0.01
1.08 ± 0.01
1.11 ± 0.01
1.15 ± 0.01
1.15 ± 0.02
1.15 ±0.02
1.13 ±0.02
1.14 ±0.02
5.95 ± 0.12
4.32± 0.17
5.94 ± 0.09
4.51 ±0.16
6.03 ± 0.13
4.36 ±0.21
6.51 ± 0.09
4.71 ± 0.16
6.31 ± 0.09
4.42± 0.14
6.46 ± 0.14
4.59 ± 0.21
6.57± 0.13
5.32 ±0.31
6.60 ±0.13
5.38 ±0.22
6.72 ±0.19
6.06 ±0.41 a
CAT, U/gHb
32341 ±1017
29717 ±766a
27423 ±1129a,b
29621 ±563
28014±425
26741 ±498 a
28745 ±765
28012 ±568
26104 ±925 a
SOD, U/gHb
2301 ±133
2571± 136
2295 ±135
2286 ±114
2436 ±107
2321 ±161
2055 ±151
2469 ±131
2616 ±265a
GPx, U/gHb
34.31 ±1.63
36.19± 1.33
32.03 ±1.42
36.05 ±1.41
34.58 ±1.14
33.91 ±1.74
37.65 ±1.87
34.51 ±1.59
37.32±2.97
GSH, mg/dL
31.16 ±0.62
32.05± 0.49
30.64 ±0.73
31.46 ±0.55
31.76 ±0.48
30.50 ±0.64
30.75 ±0.69
30.97 ±0.70
33.17 ±1.12
7.95 ±0.54
8.71 ±0.59
7.76 ±0.64
MDA, µmol/L
*AM ± SE, **GM± SE
a,b
Significant different from individuals with CC and CT, respectively, p<0.05
8.32 ±0.49
7.88 ±0.35
7.86 ±0.60
8.31 ±0.65
9.75 ±0.73 a
9.67 ±0.88 a
Biochemical tests*
Uric acid, mg/dL
Blood lead , µg/dL **
Antioxidant determinants**
Oxidative stress
determinant**
Figure 2. Association between blood lead, serum MDA and SBP, DBP in the study population
Figure 3. Genetic polymorphism of CAT gene (rs769217) and its activity (the upper) and the comparison of blood lead, MDA and BP of all study
population classified by genotype (the lower).


© Copyright 2026