
Latin America’s Decade of Development-less Growth Ernesto Talvi
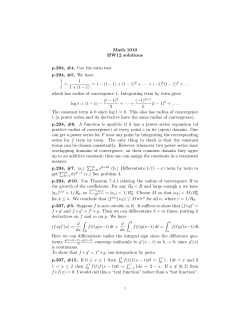
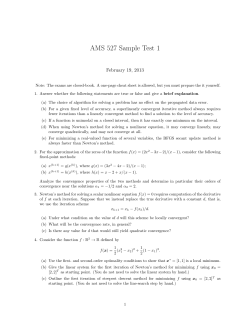
Latin America’s Decade of Development-less
Growth1
Ernesto Talvi
Nonresident Senior Fellow and Director, Brookings Global-CERES Economic & Social Policy in
Latin America Initiative, The Brookings Institution
A
figure speaks a thousand words. And looking at Figure 1, which shows the population-weighted average income per capita in
emerging economies relative to the U.S., there could
be no doubt in anybody’s mind that since the late
1990s something rather extraordinary happened—a
new phenomenon with no antecedents in the postWWII period—that propelled emerging economies
into an exponential process of convergence.2,3
This takeoff took relative income in emerging
economies to levels, albeit still low relative to the
U.S., twice those of the late 1990s and the highest
since the 1950s. If such a breathtaking path of convergence were to continue, it would mean that the
relative income of the typical emerging economy
citizen would converge to that of the typical U.S.
citizen in three generations.4
Needless to say, this extraordinary phenomenon
had enormous consequences for the welfare of
millions of citizens in emerging economies. It lifted more than 500 million people out from poverty
and extreme poverty, and gave rise to the so-called
emerging middle classes that increased at a rate of
150 million per year.5
figure 1. convergence in emerging economies 1950-2013
(Emerging markets PPP-adjusted per capita real GDP relative to the U.S.)
16%
15%
15%
14%
13%
12%
11%
11%
10%
9%
9%
8%
2010
2006
2002
1998
1994
1990
1986
1982
1978
1974
1970
1966
1962
1958
1954
6%
1950
7%
Note: Emerging markets refers to the population-weighted average of a subset of emergin market economies as defined by the IMF’s
World Economic Outlook. This set of countries comprises more than 80 percent of the GDP of all emergin market economies.
Source: The Conference Board Total Economy Database.TM
THINK TANK 20:
Growth, Convergence and Income Distribution: The Road from the Brisbane G-20 Summit
35
It seems that something rather extraordinary happened in emerging economies. Or did it? Let’s look
again. When China and India are removed from
the emerging markets sample, Figure 1 becomes
Figure 2a. In Figure 2a, one can still discern a period of convergence starting in the late 1990s. But
convergence was not nearly as strong—relative income is still far below its previous heights—and it
occurred after a period of divergence that started
in the mid-1970s after the first oil shock, in the
early 1980s with the debt crisis, and in the late
1980s with post-Berlin Wall meltdown in Eastern
European economies.
This pattern in population-weighted relative income is actually characteristic of every emerging
region with the exception of emerging Asia (see Figure 2 panels b-f). Latin America, emerging Europe,
Middle East and North Africa, and sub-Saharan
Africa all display a similar pattern to Figure 2a.6
Only Asia differs markedly from this pattern. On
the one hand, China and India have seen exponential convergence since the late 1990s (see Figure
2 panels g-h), while the rest of emerging Asia has
experienced a sustained but much slower convergence since the mid-1960s (see Figure 2, panel f).
This extraordinary phenomenon of exponential
convergence is more a story about China and, to a
lesser extent, India. Since China and India represent
37 percent of the world population and 43 percent
of the population in emerging economies, needless
to say this is an event of immense proportions. If
it were to continue, the consequences for humanity
would be huge. But be that as it may, it does not tell
the whole story of emerging economies as a group.
figure 2. convergence per emerging region 1950-2013
(PPP-adjusted per capita real GDP relative to the U.S.)
a. Emerging Economies
(excl. China and India)
b. Latin America
22%
31%
20%
29%
27%
18%
25%
16%
23%
14%
21%
17%
8%
15%
1950
1954
1958
1962
1966
1970
1974
1978
1982
1986
1990
1994
1998
2002
2006
2010
19%
10%
1950
1954
1958
1962
1966
1970
1974
1978
1982
1986
1990
1994
1998
2002
2006
2010
12%
c. Emerging Europe
45%
40%
35%
30%
25%
23%
21%
19%
17%
15%
13%
11%
20%
9%
15%
5%
THINK TANK 20:
7%
1950
1954
1958
1962
1966
1970
1974
1978
1982
1986
1990
1994
1998
2002
2006
2010
1950
1954
1958
1962
1966
1970
1974
1978
1982
1986
1990
1994
1998
2002
2006
2010
36
d. Middle East and North Africa
25%
Growth, Convergence and Income Distribution: The Road from the Brisbane G-20 Summt
f. Emerging Asia
(excl. China and India)
e. Sub-Saharan Africa
9%
14%
8%
12%
7%
10%
6%
8%
5%
6%
4%
2%
2%
25%
g. China
1950
1954
1958
1962
1966
1970
1974
1978
1982
1986
1990
1994
1998
2002
2006
2010
4%
1950
1954
1958
1962
1966
1970
1974
1978
1982
1986
1990
1994
1998
2002
2006
2010
3%
9%
h. India
8%
20%
7%
15%
6%
5%
10%
4%
5%
3%
0%
1950
1954
1958
1962
1966
1970
1974
1978
1982
1986
1990
1994
1998
2002
2006
2010
1950
1954
1958
1962
1966
1970
1974
1978
1982
1986
1990
1994
1998
2002
2006
2010
2%
Note: Regional aggregates are defined as in the IMF’s World Economic Outlook but only including major economies in each region
that represent a minimum of 80 percent of regional GDP. Regions are calculated as population-weighted averages. Countries
included in Latin America, Emerging Europe, Emerging Asia (excluding China and India), Middle East and North Africa and subSaharan Africa, represent 91, 88, 84, 81 and 81 percent of the corresponding region’s GDP, respectively.
Source: The Conference Board Total Economy Database.TM
More specifically, it does not tell the story of Latin
America.
From the Latin American perspective, the relevant
question we need to ask is whether the recent bout
of convergence that started in 2004, after a quarter
of a century of relative income decline, is a break
with the past or just a short-lived phenomenon.
To address this question, we will first explore the
arithmetic of convergence, i.e., whether mechanical projections are consistent with the convergence
hypothesis. We will then explore the economics of
convergence, i.e., whether Latin America’s income
convergence was associated with a comparable
convergence in growth determinants. Finally, we
offer some concluding thoughts.
The Arithmetic of Convergence
Let us begin by defining precisely what we mean
by convergence. To that end, we need to establish
a departure and arrival point. For the purposes
of this essay, convergence is defined as a process
whereby a country’s income per capita starts at or
below one third of U.S. income per capita at any
point in time since 1950, and rises to or above twothirds of U.S. income per capita.7
According to this definition, since 1950
growth-convergence-development miracles represent only 3 percent of emerging countries as
currently classified by the IMF’s World Economic
Outlook. Only five countries managed to achieve
THINK TANK 20:
Growth, Convergence and Income Distribution: The Road from the Brisbane G-20 Summit
37
this: Japan, South Korea, Taiwan, Hong Kong and
Singapore. They started the convergence process at
levels between 10 and 29 percent of U.S. income
per capita (Korea and Hong Kong, respectively)
and took them between 16 and 44 years to converge
(Singapore and South Korea, respectively). Income
per capita growth rates ranged from a minimum of
6.1 percent per year to a maximum 8.5 percent per
year (Hong Kong and Japan, respectively) during
the convergence period (see Table 1).
country would converge to two-thirds of U.S. income per capita in two generations.10
Put differently, the region should grow at an average rate of 4.5 percent per year to converge to
two-thirds of U.S income in 40 years, the number
of years it took Korea to converge to high income
country levels. To put the odds into context, in the
63 years since 1950, per capita GDP in LAC-7 grew
at a rate of 4.5 percent only 8 percent of the time.
In other words, the arithmetic does not seem to be
on the side of the region.
In other words, convergence towards income per
capita levels of rich countries is an extremely rare
event. In fact, even if we only consider the sample
of 24 countries that had any chance of converging
in the 1950-2013 period—the updated sample of
success stories of sustained high growth defined
by the Commission on Growth and Development
chaired by Nobel Prize winner Michael Spence—
only 21 percent made it to the finish line.8
The Economics of Convergence
What about the economics? To answer this question we must analyze whether Latin America’s
process of income convergence in the last decade
was also associated with a similar convergence
in the key drivers of growth.11 If income convergence towards income levels of advanced economies, as defined by the IMF’s World Economic
Outlook, was not accompanied by a comparable
process of convergence in the drivers of growth, it
is difficult to see how the process of convergence
in income will be sustainable, and was thus more
likely triggered by other, more temporary factors.
For example, it has been extensively argued that an
extremely favorable external environment—with
high commodity prices that LAC-7 both produces
What about Latin America? If we consider the consensus forecast growth rates for the period 20142018 for the seven major countries in the region,
henceforth LAC-7, the population-weighted per
capita expected growth rate is 1.9 percent per year,
similar to that of the U.S., indicating that the process of convergence that the region experienced
in the previous decade is expected to stall.9 Based
on these projections, not a single Latin American
table 1. growth miracles and convergence
Relative
Income at
Beginning of
Years of
Convergence
Convergence
Year
20
29%
Relative
Income in
2013
93%
Per Capita
GDP Growth
During
Convergence
6.1%
21%
72%
8.5%
16
25%
116%
8.1%
2010
44
10%
64%
6.3%
2006
39
14%
76%
6.1%
Beginning of
Convergence
Year
1967
End of
Covergence
Year
1987
Japan
1950
1970
20
Singapore
1965
1981
South Korea
1966
Taiwan
1967
Hong Kong
Note: Convergence is defined as a process whereby a country’s income per capita starts at or below one third of U.S. income per capita
and rises to or above two-thirds of U.S. Income per capita. Income per capita is measured as PPP-adjusted per capita real GDP.
Source: Own calculations based on The Conference Board Total Economy Database.TM
38
THINK TANK 20:
Growth, Convergence and Income Distribution: The Road from the Brisbane G-20 Summt
and exports, abundant international liquidity and
low costs of capital and financial resources—gave
growth in the region an unusual boost in the last
decade.12
economies, and was the only country that actually
improved in every single growth driver in the last
decade. Although Chile’s improvement in growth
drivers relative to advanced economies was much
slower than in Colombia, it is the country in the
region where the level of growth drivers is closer to
those of advanced economies.
To analyze this issue further, we consider a subset
of the most widely used growth determinants in
cross-country regressions popularized by Barro
(1991) that have been shown to have a positive and
significant impact on growth: trade integration,
physical and technological infrastructure, human
capital, innovation, and the quality of public services.13,14
This lack of convergence in the key drivers of
growth contrasts markedly with what happened
in the small group of countries that did converge to advanced country income levels. Figure
4 illustrates the case of Korea. Every key driver
of growth—trade integration, human capital, and
physical and technological infrastructure—were
converging to advanced country levels hand-inhand with income convergence.15
Figure 3 illustrates the results. In contrast to relative income, during the last decade LAC-7 countries failed to converge towards advanced country
levels in every growth driver. The overall index
of growth drivers—the simple average of the five
sub-indexes—remained unchanged in the last
decade relative to the equivalent index for advanced economies. By and large the latter holds
true for every LAC-7 country. It is worth noting,
however, that Colombia experienced the largest
improvement in growth drivers relative to advanced
Moreover, just as the drivers of growth failed to
converge in Latin America in the last decade, nor
was income convergence accompanied by any
comparable convergence in key indicators of development, such as equality of opportunity by income level and gender, the quality of the environment and personal security (see Figure 5).16
figure 3. convergence of income and growth drivers in latin america 1950-2013
(LAC-7, 2004=100)
125
122
120
2004
115
2013
110
105
100
104
100
100
100
100
102
100
102
100
100
95
95
93
90
85
Innovation
Trade
Integration
Quality of
Public
Services
Physical &
Technological
Infrastructure
Human Capital
Global Index
Relative
Income
80
Note: LAC-7 is the simple average of Argentina, Brazil, Chile, Colombia, Mexico, Peru and Venezuela, which account for 93 percent
of Latin America’s GDP. For details on the calculation of the indexes see Appendix.
Source: The Conference Board Total Economy DatabaseTM, World Economic Forum, Barro-Lee Dataset, The World Bank
Development Indicators, NetIndex | Speedtest, OECD-WTO and World Intellectual Property Organization.
THINK TANK 20:
Growth, Convergence and Income Distribution: The Road from the Brisbane G-20 Summit
39
figure 4. the korean miracle
a. Relative Income
b. Trade Integration
(PPP-adjusted real GDPP, relative to Advanced Economies)
(Ratio of exports to GDP, relative to Advanced Economies)
120%
100%
110%
100%
80%
80%
80%
60%
60%
40%
40%
20% 13%
20%
0%
1960
0%
1970
1980
1990
2000
2010
19%
1960
107%
2010
100%
80%
60%
70%
40%
60%
40%
1960
2000
80%
90%
50%
1990
(Technological and Physical Infrastructure Index,
relative to Advanced Economies)
(Average years of education, relative to Advanced Economies)
100%
1980
d. Technological and Physical Infrastructure
c. Human Capital
110%
1970
67%
20%
46%
1970
1980
1990
2000
2010
2%
0%
1960
1970
1980
1990
2000
2010
Advanced Economies refers to Australia, Austria, Belgium, Canada, Denmark, Finland, France, Germany, Iceland, Ireland, Italy,
Netherlands, New Zealand, Norway, Sweden, Switzerland, United Kingdom and United States. The Technological and Physical
Infrastructure Index includes road density and number of telephone lines and mobile phones per 1,000 workers.
Source: IMF World Economic Outlook, World Bank, The World Bank Development Indicators, Barro-Lee Dataset and Calderón and
Servén (2004) dataset.
Looking Ahead
Latin America had a decade of uninterrupted high
growth rates—with the sole exception of 2009 in
the aftermath of the Lehman crisis—that put an
end to a quarter of a century of relative decline in
income per capita levels vis-à-vis advanced economies. However, high growth and income convergence were largely the result of an unusually favorable external environment, rather than the result
of convergence to advanced country levels in the
key drivers of growth. Moreover, income convergence was not associated either with a comparable convergence in key indicators of development.
Fundamentally, the last was a decade of “development-less growth” in Latin America.
40
THINK TANK 20:
With the extremely favorable external conditions
already behind us—China’s growth rates are expected to cool-off significantly, commodity prices will likely soften and world interest rates look
set to edge up—the region is expected to grow at
mediocre rates of around 2 percent in per capita
terms for the foreseeable future. With this level of
growth, the dream of convergence and development is unlikely to be realized any time soon.
To avoid such a fate the region must make a renewed effort to deepen integration into the world
economy, into global supply chains, and within the
region itself; to improve human capital, the rate
of innovation and the quality of public services;
to upgrade physical and technological infrastructure; and to reduce social exclusion, inequality,
Growth, Convergence and Income Distribution: The Road from the Brisbane G-20 Summt
figure 5. convergence of income and development indicators
(LAC-7, 2004=100)
130
122
120
2004
2013
110
100
107
100
90
100
100
100
100
100
87
86
79
80
72
70
Personal
Security
Equality of
Opportunity
by Gender
Quality of the
Environment
Equality of
Opportunity
by Income
Development
Indicator
Relative
Income
60
Note: LAC-7 is the simple average of Argentina, Brazil, Chile, Colombia, Mexico, Peru and Venezuela, which account for 93 percent
of Latin America’s GDP. For details on the calculation of the indexes see Appendix.
Source: The Conference Board Total Economy DatabaseTM, World Economic Forum, Barro-Lee Dataset, The World Bank
Development Indicators, NetIndex | Speedtest, OECD-WTO and World Intellectual Property Organization.
personal insecurity and the pollution of our cities.
All of these improvements will be needed to revitalize growth—through domestic rather than external tailwinds—and to put the region on a path
of convergence and development.
Although the challenges ahead appear to be huge,
there is plenty of room for optimism. First, Latin America has built a sound platform to launch a
process of development. Democracy has by-andlarge consolidated across the region and an entire
generation has now grown up to see elections as
the only legitimate way to select national leaders.17
In terms of democratic development, Latin America ranks first among emerging regions. Moreover,
it is for the most part a relatively stable region with
no armed conflicts and few insurgency movements
threatening the authority of the state.
Second, a sizeable group of major countries in
Latin America have by now built a long track record of sound macroeconomic performance.18 An
entire generation has now grown up with low and
relatively stable inflation and reasonably healthy
public finances. Moreover, regulation and supervision of the banking system has improved significantly in recent years.
Third, the region could be just steps away from
major economic integration. Most Latin American countries in the Pacific Coast have bilateral
free trade agreements (FTAs) with their North
American neighbors (11 countries with the U.S.
and seven countries with Canada). Were these
countries to harmonize current bilateral trade
agreements among themselves—in the way Pacific Alliance members have been doing—a huge
economic space would be born: a Trans-American
Partnership that would comprise 620 million consumers, and have a combined GDP of more than
$22 trillion (larger than the EU’s, and more than
double that of China). Were such a partnership on
the Pacific side of the Americas to gain traction, it
could eventually be extended to Atlantic partners,
in particular Brazil and other of Mercosur countries. The spirit of the 1994 Summit of the Americas, where U.S. President Bill Clinton and his Latin
American counterparts set out a grand vision for
THINK TANK 20:
Growth, Convergence and Income Distribution: The Road from the Brisbane G-20 Summit
41
the hemisphere by launching the Free Trade Area
of the Americas, could then be rekindled.
Latin America’s development path will be more
akin to that of Spain and Portugal than to the
Asian miracles. In Spain and Portugal democratization came first, economic integration (with the
European Union) second, and development last.
Chile, the only Latin American country on its way
to the third stage, is a vibrant example on how the
region can accomplish exactly that.
References
Talvi E. 2014. “A New Trans-American Partnership.”
Project Syndicate. http://www.project-syndicate.
org/commentary/ernesto-talvi-calls-for-renewedcooperation--beginning-with-trade--between-northand-south-america.
Talvi, E. and H. Trinkunas. 2013. “The Upcoming Electoral
Cycle in Latin America in the Midst of Social Unrest:
What Lies Ahead?” The Brookings Global-CERES
Economic & Social Policy in Latin America Initiative
(ESPLA). Washington: Brookings Institution. http://
www.brookings.edu/blogs/up-front/posts/2013/10/28electoral-cycle-latin-america-talvi-trinkunas.
Endnotes
1.
This report was written with the invaluable collaboration
of the team of CERES research associates—Santiago
García da Rosa, Rafael Guntin and Rafael Xavier—and
research assistants—Federico Ganz and Mercedes Cejas.
I would also like to thank very specially my colleague at
Brookings, Guillermo Vuletin, for a thorough review of
the first version of this essay and for suggesting the term
“development-less growth”. Julia Ruiz, research assistant
at Brookings, also provided valuable comments.
2.
We consider a subset of emerging market economies
defined by the IMF’s World Economic Outlook for
which complete data are available. This set of countries comprises more than 80 percent of the GDP of
all emerging market economies. Relative income is
measured by PPP-adjusted per capita real GDP from
The Conference Board. Our results would remain unchanged if PPP-adjusted per capita GDP from the Penn
World Tables or per capita GDP in real U.S. dollars from
the World Bank are used. Population-weighted averages
measure the convergence of the income of the average
citizen of emerging economies relative to the income of
the average citizen in the U.S.
3.
The phenomenon depicted in Figure 1 is the other side
of the coin of the takeoff in population-weighted average real GDP growth rate which increases dramatically
relative to the U.S. and to advanced economies.
4.
Considering advanced economies—as defined by the
IMF’s World Economic Outlook— instead of the U.S.,
yields similar results.
5.
Poverty is measured as the share of persons living
below US$1.25 at Purchasing Power Parity (PPP), see
Ravallion, Chen and Sangraula (2009). The middle class
is measured as the number of persons that have a level
of consumption between US$10 and US$100 per person
per day as defined in Kharas and Gertz (2010) and
Dervis and Kharas (2014) in this volume.
6.
Regional aggregates are defined as in the IMF’s World
Economic Outlook but only including major economies
in each region that represent a minimum of 80 percent
of regional GDP. Countries included in Latin America,
Calderón, C. and L. Servén. 2004. “The Effects of
Infrastructure Development on Growth and Income
Distribution” The World Bank Policy Research Working
Paper 3400. Washington: The World Bank.
Commission on Growth and Development. 2008. “The
Growth Report: Strategies for Sustained Growth and
Inclusive Development” PREM Network. Washington: The
World Bank.
Derviş, K. and H. Kharas. 2014. “Growth, Convergence and
Income Distribution: An Introduction” in Derviş, K.
and H. Kharas (editors) “The Growth, Convergence and
Divergence Debate”, forthcoming.
Durlauf, S. and D. Quah. 1999. “The New Empirics of
Economic Growth.” in: J. B. Taylor & M. Woodford (ed.),
“Handbook of Macroeconomics”, ed. 1, vol. 1, chapter 4,
pp. 235-308.
Durlauf, S., P. Johnson and J. Temple. 2005. “ Growth
Econometrics.”in Aghion, P. and S. Durlauf (editors)
“Handbook of Economic Growth”, ed. 1, vol. 1, pp 555677.
The Economist Intelligence Unit. 2014. “Democracy Index
2013: Democracy in Limbo”. London: The Economist.
Kharas, H. and G. Gertz. 2010. “The New GLobal Middle
Class: A Cross-Over from West to Eas.”, Wolfensohn
Center for Development at Brookings. Washington:
Brookings Institution.
Ravallion, M., S. Chen and P. Sangraula. 2009. “Dollar a Day
Revisited.” The World Bank Economic Review, vol. 23,
issue 2, pp. 163-184. Washington: The World Bank.
Talvi, E. 2014. “Latin America Macroeconomic Outlook: A
Global Perspective. Macroeconomic Vulnerabilities in an
Uncertain World: One Region, Three Latin Americas.”
The Brookings Global-CERES Economic & Social Policy
in Latin America Initiative (ESPLA). Washington:
Brookings Institution.
42
THINK TANK 20:
Growth, Convergence and Income Distribution: The Road from the Brisbane G-20 Summt
emerging Europe, emerging Asia (excluding China and
India), Middle East and North Africa and sub-Saharan
Africa, represent 91, 88, 84, 81 and 81 percent of the
corresponding region’s GDP, respectively.
Appendix. Growth Drivers and
Development Indicators
7.
One third and two thirds of U.S. income per capita represent the mean minus one standard deviation and the mean
plus one standard deviation, respectively, of the distribution of income per capita of all countries in our sample
relative to that of the U.S. in 2013. The World Bank in its
income classifications uses a different and much less stringent definition of high income countries. The World Bank’s
threshold to define a high income country is $12,745 per
capita gross national income which represents 24 percent
of U.S. per capita gross national income.
8.
See Commission on Growth and Development (2008).
Success stories of sustained high growth are defined as
those countries that had an average growth rate per year
of at least 7 percent for 25 consecutive years since 1950.
The countries that meet the Commission’s criterion
through 2013 are Belize, Bhutan, Botswana, Brazil,
Cambodia, China, Equatorial Guinea, Hong Kong,
India, Indonesia, Japan, Malaysia, Maldives, Malta,
Morocco, Mozambique, Oman, Singapore, South Korea,
Sudan, Taiwan, Thailand, Uganda and Vietnam.
This appendix presents the definitions and data
sources of the growth drivers and development indicators presented in the text. Growth drivers are
measured by 5 indicators: trade integration, human
capital, innovation, physical and technological infrastructure, and the quality of public services. Each
of these indicators contains one or more variables.
Development indicators are measured by 4 indicators: equality of opportunity by income, equality of
opportunity by gender, quality of the environment
and personal security. Likewise, each development
indicator contains one or more variables.
9.
LAC-7 refers to the seven largest Latin American
countries namely, Argentina, Brazil, Chile, Colombia,
Mexico, Peru and Venezuela, which together account
for 93 percent of the region’s GDP
10. The closest would be Chile converging in 55 years. Considering advanced economies—as defined by the IMF’s
World Economic Outlook— instead of the U.S., yields
similar results.
11. Throughout this section we use a simple average of
LAC-7 economies since we are interested in analyzing
the convergence of the average country. Using population-weighted averages yields similar results.
Each growth driver/development indicator is constructed as follows. First, for each variable, LAC-7
relative value with respect to Advanced Economies
is calculated as:
Ytj =
j
where Xt is the simple average of variable j for
j
all countries in LAC-7 (Xt LAC) and Advanced
j
Economies (Xt Advanced) in the year t.
Then, the simple average of each variable contained in indicator i is calculated in order to construct the indicator:
I ti =
12. See Talvi (2014) for a recent analysis on the role of external
factors as the key drivers of LAC-7 growth performance.
13. For a complete survey on cross-country growth regressions see Durlauf and Quah (1999) and Durlauf,
Johnson and Temple (2005).
14. See Appendix for the definition of the variables used as
drivers of growth.
15. Due to lack of time series data, we only show a subset of
growth drivers for Korea. Korea’s convergence started in
1970 and reached two thirds of U.S. income per capita
levels in 2010.
16. See Appendix for the definition of the variables used as
development indicators.
17. See The Economist (2014) and Talvi and Trinkunas (2013).
18. For a recent analysis see Talvi (2014).
Xtj LAC
Xtj Advanced
Σ nj =1Ytj i
n
i
ji
where I t is indicator i in period t and Yt is the relative value of variable j in indicator i for year t. Each
indicator is normalized to 100 in 2004. When data
is not available for 2004 the first year available is
used. When data is not available for 2013 the latest
data available is used.
The overall indicator for growth drivers is given by:
It=
Σ mi =1I ti
m
where is the overall index of growth drivers/development indicators at time t.
THINK TANK 20:
Growth, Convergence and Income Distribution: The Road from the Brisbane G-20 Summit
43
Data: Definitions and Sources
Growth Driver Indicators
Trade Integration Indicator
Trade Openness: measured as the ratio of total
exports of goods and services to GDP. Data
source: World Bank World Development Indicators.
Integration to Global Supply Chains: measured
as the share of foreign inputs (backward participation) and domestically produced inputs
used in third countries’ exports (forward participation) in percentage of gross exports. For
further details on the indicator’s methodology see Koopman et al. (2010). Data is available for years 2005 and 2009. Due to lack of
data, LAC-7 includes Argentina, Brazil, Chile
and Mexico. Data Source: OECD-WTO.
Human Capital Indicator
Years of Education: measured as the average years
of total education for individuals between 20 and
24 years. Data source: Barro-Lee Dataset.
Quality of Education: defined as educational achievement in standardized tests. Data
source: Program for International Student Assessment—OECD, World Economic Forum.
Innovation Indicator
Research and Development: defined as company spending on R&D. Data source: World
Economic Forum.
Tertiary Education: defined as the population
between 25 and 34 years that have completed
tertiary education. Source: Barro-Lee Dataset.
Patents: defined as patent applications per million people. Data source: World International
Property Rights.
Royalties: defined as receipts from Royalties and License Fees in current dollars. Due
44
THINK TANK 20:
to lack of data the LAC-7 aggregate excludes
Venezuela. Data source: WTO.
Physical and Technological Infrastructure
Indicator
Physical and Technological Infrastructure variables: quality of railroads, quality of roads,
quality of air transport, quality of ports and
quality of electricity supply. Data source:
World Economic Forum.
Broadband Speed: average of download and
upload speed expressed in kbps. Data source:
NetIndex | Speedtest.
Quality of Public Services Indicator
Quality of Public Services variables: Government Effectiveness, Regulatory Quality, and
Control of Corruption. Data source: World
Bank Worldwide Governance Indicators.
Development Indicators
Equality of Opportunity by Income: measured as
the difference between the proportion of insufficient scores in the lowest socioeconomic quintile
and the proportion of insufficient scores in the
highest socioeconomic quintile in the Program
for International Student Assessment (PISA) tests.
Data source: PISA-OECD.
Equality of Opportunity by Gender: measured as
the Gender Inequality Index. Given that the Index
is available since 2010, it was reconstructed for
2004 following the United Nations methodology.
Source: United Nations Development Program
and World Bank World Development Indicators.
Quality of the Environment Indicator: measured
as the annual average concentration (micrograms
per cubic meter) of particulate matter with less
than ten microns in diameter (PM10) for urban
areas. Data source: World Bank World Development Indicators.
Growth, Convergence and Income Distribution: The Road from the Brisbane G-20 Summt
Personal Security Indicator: measured as the number of intentional homicides (excluding deaths in
armed conflicts) per 100,000 people. Data sources:
World Health Organization and United Nations
Office on Drugs and Crime.
THINK TANK 20:
Growth, Convergence and Income Distribution: The Road from the Brisbane G-20 Summit
45


© Copyright 2026