
40 Global Petroleum Survey
40
Y E A R S
1974 - 2014
Fraser Institute
Global
Petroleum
Survey
2014
by Taylor Jackson,
Gerry Angevine,
and Frazier Fathers
Survey Director:
Kenneth P. Green
Acknowledgements
First and foremost, we wish to thank the many managers and senior officers of petroleum exploration
companies and associated firms who submitted survey responses, thereby providing the data for the
analyses in this report. In addition, we are grateful to various industry associations and non-profit
think tanks for providing helpful contact information and generously informing their members of
the opportunity to participate in the survey. In particular we would like to thank the Canadian Association of Petroleum Land Administration; Irish Offshore Operators’ Association (IOOA); South
Africa Oil and Gas Association; and the Instituto Argentino del Petroleo y del Gas for their assistance.
Any errors or omissions are the sole responsibility of the authors. As they worked independently,
opinions expressed by the authors are their own and do not necessarily reflect the opinions of supporters, trustees, or other staff of the Fraser Institute.
Copyright
Copyright© 2014 by the Fraser Institute. All rights reserved. No part of this publication may be reproduced in
any manner whatsoever without written permission except in the case of brief passages quoted in crit ical
articles and reviews.
For more information on the Fraser Institute and this publication, please see the end of this document.
Date of issue
November 2014
Table of Contents
Executive Summary . . . . . . . . . . . . . . . . . . . . . . . . . . . . . . . .
5
Survey Methodology . . . . . . . . . . . . . . . . . . . . . . . . . . . . . . . .
8
Global Results . . . . . . . . . . . . . . . . . . . . . . . . . . . . . . . . . . . 15
Results by Continental Region . . . . . . . . . . . . . . . . . . . . . . . . . .
43
Optional Survey Questions . . . . . . . . . . . . . . . . . . . . . . . . . . . . 75
Additional Comments from the Petroleum Survey . . . . . . . . . . . . . . . 80
Single-factor Results . . . . . . . . . . . . . . . . . . . . . . . . . . . . . . . .
86
Appendix 1: Proved Oil and Natural Gas Reserves . . . . . . . . . . . . . . 107
References . . . . . . . . . . . . . . . . . . . . . . . . . . . . . . . . . . . . . 109
About the authors . . . . . . . . . . . . . . . . . . . . . . . . . . . . . . . . 110
Publishing information . . . . . . . . . . . . . . . . . . . . . . . . . . .
111
Supporting the Fraser Institute . . . . . . . . . . . . . . . . . . . . . . . 112
Purpose, funding, and independence
. . . . . . . . . . . . . . . . . . .
112
About the Fraser Institute . . . . . . . . . . . . . . . . . . . . . . . . . . 113
Editorial Advisory Board . . . . . . . . . . . . . . . . . . . . . . . . . . . 114
Executive Summary
This report presents the results of the Fraser Institute’s 8th annual survey of petroleum industry
executives and managers regarding barriers to investment in oil and gas exploration and production facilities in various jurisdictions around the globe. The survey responses have been tallied to
rank provinces, states, other geographical regions (e.g. offshore areas) and countries according to
the extent of such barriers. Those barriers, as identified by the survey respondents, include high tax
rates, costly regulatory obligations, uncertainty over environmental regulations and the interpretation and administration of regulations governing the “upstream” petroleum industry, and concerns with regard to political stability and security of personnel and equipment.
A total of 710 respondents participated in the survey this year, providing sufficient data to evaluate
156 jurisdictions. By way of comparison, 157 jurisdictions were evaluated in the 2013 survey, 147
in 2012, 135 in 2011, and 133 in 2010.
The jurisdictions were assigned scores for each of 16 questions pertaining to factors known to
affect investment decisions. The scores are based on the proportion of negative responses a jurisdiction received with regard to each question. The greater the proportion of negative responses for
a jurisdiction, the greater were its perceived investment barriers, and, therefore, the lower its ranking. This ranking is used to generate a Policy Perception Index. Jurisdictions are then sorted into
clusters based on the size of their proved reserves allowing for an apples-to-apples comparison of
policy perception in the context of available reserves.
Of the 27 jurisdictions with large petroleum reserves, the five that rank as most attractive and with
the least deterrent to investment are Texas, Alberta, Norway—North Sea, United Arab Emirates,
and Qatar. The least attractive of the large-reserve jurisdictions for investment on the basis of their
Policy Perception Index scores (all of which received fifth quintile scores: Venezuela, Iran, the four
Russian regions, Iraq, Egypt, Libya, Indonesia, and Turkmenistan) account for almost half of the
world’s proved oil and reserves. Alberta is the only Canadian jurisdiction with large reserve
holdings.
In the group of 44 jurisdictions with medium-sized reserves, the 10 most attractive jurisdictions
are Oklahoma, Arkansas, North Dakota, Wyoming, Utah, Louisiana, Netherlands—Onshore,
Norway—Other Offshore (i.e., except for the North Sea), New Mexico, and United Kingdom—North Sea. Bolivia, Ecuador, Uzbekistan, South Sudan, Uganda, Syria, and Argentina—Chubut, appear to pose the greatest barriers to upstream investment among medium
reserve-size holders.
The only two Canadian jurisdictions in this group, Newfoundland & Labrador and British Columbia, rank 15th and 19th (of 44), respectively.
Of 69 jurisdictions with relatively small proved oil and gas reserves, the top performers are Mississippi, Saskatchewan, Manitoba, Alabama, Kansas, and the Netherlands—Offshore. Those in this
Fraser Institute Global Petroleum Survey, 2014
www.fraserinstitute.org
5
group deemed the least attractive for investment on the basis of poor Policy Perception Index
scores are: Democratic Republic of the Congo (Kinshasa), Kyrgyzstan, Tanzania, Argentina—Santa Cruz and Guatemala. Nova Scotia, New Brunswick, Yukon, and the Northwest Territories each rank near the middle of the small reserve holder group.
When considering policy independently from the size of jurisdictions’ reserves, historically the
primary focus of this survey, we find that the jurisdictions with Policy Perception Index scores in
the first quintile (suggesting that obstacles to investment are lower than in all other jurisdictions
assessed by the survey), are all located in Canada, the United States, and Europe. According to this
year’s survey, the 10 most attractive jurisdictions for investment worldwide are Oklahoma, Mississippi, Saskatchewan, Arkansas, Manitoba, Alabama, Kansas, Texas, North Dakota, and Wyoming.
All of these jurisdictions were among last year’s top 10 most attractive jurisdictions with the exception of Wyoming. The only jurisdiction displaced from the top 10 was Netherlands—North Sea.
The 10 least attractive jurisdictions for investment (starting with the worst) are Venezuela, Bolivia,
Ecuador, Iran, Russia—Eastern Siberia, Russia—Offshore Arctic, Iraq, Uzbekistan, Democratic
Republic of the Congo (Kinshasa), and Turkmenistan. Each of these jurisdictions except
Turkmenistan and Democratic Republic of the Congo (Kinshasa) were also among the 10 least
desirable jurisdictions for investment in oil and gas exploration and development identified in the
2013 survey.
Jurisdictions that saw the most change
This year only five jurisdictions improved their relative attractiveness for investment by at least 10
points on the Policy Perception Index measure: French Guiana, Uruguay, Suriname, Guyana, and
Romania. Of those, only French Guiana improved by at least 20 points, although all five achieved
significant gains in their global and regional rankings.
While just five jurisdictions saw considerable improvements, a substantial number saw their barriers to investment increase significantly over the past year, according to the 2014 Policy Perception
Index scores. Forty-one jurisdictions (of 156) had their scores deteriorate by 10 points or more.
This represents more than 25 percent of the sample. In particular, 20-point drops from 2013 Policy
Perception Index scores were recorded for Nova Scotia, Yukon, Georgia (the country),
Spain—Offshore, Kuwait, South Africa, Turkey, Spain—Onshore, Lebanon, Egypt, Tanzania, and
Mali.
Analysis of the 2014 results indicates that the extent of negative sentiment regarding factors driving petroleum investment decisions (ignoring the extent of proved oil and gas reserve holdings)
increased in most world regions. In fact, the median Policy Perception Index score deteriorated
this year in all regions. Increased percentages of negative responses to survey questions were especially severe in sub-Saharan Africa, the Middle East and North Africa, and Europe.
6
Fraser Institute Global Petroleum Survey, 2014
www.fraserinstitute.org
Comparing the survey results for the years since 2010, negative sentiment over upstream investment appears to be rising around the world. By way of example, with few exceptions Policy Perception Index scores have been deteriorating consistently in the Australian jurisdictions.
Respondents’ comments highlight reasons for the investment attractiveness (or non-attractiveness) of some jurisdictions. As in previous surveys, investors indicate that they continue to turn
away from jurisdictions with onerous fiscal regimes, political instability, and land claim disputes.
Similarly, investors prefer to avoid jurisdictions with costly, time-consuming uncertain regulations. Other factors being equal, competitive tax and regulatory regimes can attract investment
and thus generate substantial economic benefits.
Additional sub-indices focus specifically on a jurisdiction’s regulatory climate and perceptions of
geopolitical risk.
Fraser Institute Global Petroleum Survey, 2014
www.fraserinstitute.org
7
Survey Methodology
Sample design
This survey is designed to identify provinces, states, offshore regions, other geographic areas, and
countries with the greatest barriers to investment in oil and gas exploration and production. Jurisdictions that investors assess as relatively unattractive may thus be prompted to consider policy
reforms that could improve their rankings. Petroleum companies can also use the information to
corroborate their own assessments and to identify jurisdictions where business conditions and the
regulatory environment are most attractive for investment. The survey results are also a useful
source of information for the media, providing independent evidence as to how particular
jurisdictions compare.
The survey was distributed to managers and executives in the “upstream” petroleum industry.
This industry includes those exploring for oil and gas, those producing crude oil from conventional and non-conventional sources (such as bitumen from oil sands and shale formations), and
those producing both conventional sources of natural gas and non-conventional sources, such as
coalbed methane and gas embedded in shale formations. It does not include companies that are
refining, upgrading, or processing crude oil, bitumen, and raw natural gas, or the transportation
and marketing of petroleum products.
The names of potential respondents were taken from publicly available membership lists of trade
associations and other sources. In addition, some industry associations and non-profit think tanks
provided contact information (e.g., the Canadian Association of Petroleum Land Administration;
Figure 1: The position survey respondents hold in their company, 2014
Professional Consultant, Advisor, or
Negotiator providing services to
companies in the petroleum industry
23%
Other
8%
Company Vice President
11%
8
Company Chairman, CEO, President,
or Director
22%
Company Group, Division or Unit
Manager
15%
Company Specialist/Advisor (e.g.
Landman, Geologist, Economist,
Planner, or Lawyer )
20%
Fraser Institute Global Petroleum Survey, 2014
www.fraserinstitute.org
Figure 2: Activities performed by firms of survey respondents, 2014
80%
61%
60%
41%
40%
40%
25%
20%
13%
7%
0%
Drilling services for
petroleum
exploration and
development
companies
Other
Provision of expert
advice to petroleum
exploration and
development
companies
Natural gas
exploration and
development
Production of oil Oil exploration and
and/or natural gas
development
the Irish Offshore Operators’ Association (IOOA); the South Africa Oil and Gas Association; and
the Instituto Argentino del Petroleo y del Gas).
The survey was conducted from June 3, 2014, until August 23, 2014. A total of 710 individuals
working with 563 companies responded. As figure 1 illustrates, just under half of the respondents
(48 percent) identified themselves as either a manager or holding a higher-level position. Figure 2
shows that 61 percent of the firms participating in the survey are engaged in the exploration and
development of oil, 41 percent are engaged in the exploration and development of natural gas, 40
percent are engaged in production of oil and/or natural gas, and 32 percent provide expert advice
and/or drilling services.1
Figure 3 shows the principal focus of the petroleum exploration and development activities of
companies whose managers or other representatives participated in the survey. The focus of most
of these companies (74 percent) is on finding and developing conventional oil and gas reserves.
The percentage of companies focusing on finding and developing conventional oil and gas reserves
has declined overall in recent years from 82 percent in 2011 and 80 percent in 2012. Relative to
2013, however, the percentage of companies focusing on conventional oil and gas is up from 71
percent. Unconventional oil and natural gas exploration and development represented 26 percent
of the focus of companies in 2014 compared with 29 percent in 2013.
1
Respondents were asked to select all activities performed by their respective companies. Because
respondents come from companies with different focuses (e.g. exploration, production, drilling, and
advisory services), the shares of the reported activities exceed 100 percent. Thirteen percent of
respondents also selected “Other.” Examples of such practices were scientific development, seismic
surveys, studies of oil markets, storage of products, etc.
Fraser Institute Global Petroleum Survey, 2014
www.fraserinstitute.org
9
Figure 3: Company focus in petroleum exploration and development
business, as indicated by respondents
Conventional natural gas
24.6%
Other oil activities (e.g. exploration and
development of kerogen)
2.2%
Oil sands bitumen
3.3%
Natural gas from tight sand and shale
formations using hydraulic fracking
8.5%
Coal-bed methane
1.8%
Other natural gas activities (e.g. in
relation to gas hydrates)
1.2%
Oil from shale formations requiring
hydraulic fracking
9.6%
Conventional oil
49.7%
Participants employed by petroleum firms reported that 15 percent of their upstream activity
involves unconventional oil resources. The majority of this activity (64 percent) includes the
recovery of oil from shale formations using hydraulic fracturing, 22 percent is focused on oil sands
bitumen, and 14 percent on other oil activities, such as the exploration or development of oil from
kerogen found in shale rock.
Participants in the survey also reported that 11 percent of their upstream activity involves unconventional natural gas resources. The majority of this activity (74 percent) involves the recovery of
natural gas from tight sand and shale formations using hydraulic fracturing. Sixteen percent is
focused on coal-bed methane. Eleven percent of the petroleum firms responding to the survey
reported other unconventional natural gas activities (related to gas hydrates).
10
Fraser Institute Global Petroleum Survey, 2014
www.fraserinstitute.org
Survey questionnaire
The survey was designed to capture the opinions of managers and executives about the level of
investment barriers in jurisdictions with which they are familiar. Respondents were asked to indicate how each of the 16 factors listed below influence company decisions to invest in various
jurisdictions.
1. Fiscal terms—including licenses, lease payments, royalties, other production taxes, and
gross revenue charges, but not corporate and personal income taxes, capital gains taxes, or
sales taxes.
2. Taxation in general—the tax burden including personal, corporate, payroll, and capital
taxes, and the complexity of tax compliance, but excluding petroleum exploration and production licenses and fees, land lease fees, and royalties and other charges directly targeting
petroleum production.
3. Environmental regulations—stability of regulations, consistency and timeliness of regulatory process, etc.
4. Regulatory enforcement—uncertainty regarding the administration, interpretation, stability, or enforcement of existing regulations.
5. Cost of regulatory compliance—related to filing permit applications, participating in hearings, etc.
6. Protected areas—uncertainty concerning what areas can be protected as wilderness or
parks, marine life preserves, or archaeological sites.
7. Trade barriers—tariff and non-tariff barriers to trade and restrictions on profit repatriation, currency restrictions, etc.
8. Labor regulations and employment agreements—the impact of labor regulations, employment agreements, labor militancy or work disruptions, and local hiring requirements.
9. Quality of infrastructure—includes access to roads, power availability, etc.
10. Quality of geological database—includes quality, detail, and ease of access to geological
information.
11. Labor availability and skills—the supply and quality of labor, and the mobility that workers
have to relocate.
12. Disputed land claims—the uncertainty of unresolved claims made by aboriginals, other
groups, or individuals.
13. Political stability.
14. Security—the physical safety of personnel and assets.
15. Regulatory duplication and inconsistencies (includes federal/provincial, federal/state,
inter-departmental overlap, etc.)
16. Legal system—legal processes that are fair, transparent, non-corrupt, efficiently administered, etc.
Fraser Institute Global Petroleum Survey, 2014
www.fraserinstitute.org
11
The above 16 factors were unchanged from the 2013 survey. However, two questions that had been
included earlier—on socioeconomic agreements/community development conditions and on the
corruption of government officials—were dropped in 2013 because respondents from previous
years had complained that the survey had become onerously lengthy. In addition, those questions
were seen to be redundant, or to overlap heavily with other questions.
For each of the 16 factors, respondents were asked to select one of the following five responses that
best described each jurisdiction with which they were familiar:
1. Encourages investment
2. Is not a deterrent to investment
3. Is a mild deterrent to investment
4. Is a strong deterrent to investment
5. Would not invest due to this criterion
The 2014 survey included a list of 158 jurisdictions that respondents could evaluate, including all
of the Canadian provinces and territories except Ontario, Prince Edward Island, and Nunavut;
many US oil and gas producing states (as well as the US Alaska, Pacific, and Gulf Coast offshore
regions); all six Australian states, the Australian offshore and the Timor Gap Joint Petroleum
Development Area (JPDA); and countries with current or potential petroleum production capacity. Russia was split into four categories: Offshore Arctic, Offshore Sakhalin, Eastern Siberia, and
the rest of the country. Six provinces in Argentina were also included in the survey: Chubut,
Mendoza, Neuquen, Salta, Santa Cruz, and Tierra del Fuego. Brazil was again represented by three
separate categories: onshore concessions, offshore concessions, and offshore “pre-salt” regions.
Saudi Arabia, where investment in upstream petroleum exploration and development is mostly
confined to government-owned facilities, was again excluded from the list of jurisdictions that
respondents could rank.
With the opening up of oil and gas exploration and development for foreign investment under the
leadership of the new President, Mr. Peña Nieto, Mexico was included for the first time.
Scoring the survey responses
For each jurisdiction, we calculated the percentage of negative scores for each of the 16 factors.2 We
then developed an index for each factor by assigning the jurisdiction with the highest percentage of
negative responses a value of 100, and correspondingly lower values to the other jurisdictions
according to their scores. Upstream investors consider jurisdictions with the lowest index values
2
12
The negative scores were determined by the number of times respondents graded a factor as “a mild
deterrent to investment,” “a strong deterrent to investment,” or indicated that they “would not
invest” in the jurisdiction because of issues related to that factor.
Fraser Institute Global Petroleum Survey, 2014
www.fraserinstitute.org
the most attractive, and thus rank them above jurisdictions that scored higher as a consequence of
having greater proportions of negative scores.
In past years, only jurisdictions that at least 5 respondents evaluated on all 16 factors were included
in the rankings. This year, as with 2013, we were able to increase this minimum threshold to 10 for
almost all jurisdictions, allowing us to present more robust results. Jurisdictions that received
between 5 and 9 responses (French Guiana, Georgia, Greece, Greenland, Kyrgyzstan, Uzbekistan,
and the Yukon) were still included, but have been denoted throughout. We excluded East Timor
and Botswana from our analysis because they received an insufficient number of responses. We
were able to rank all but two of the 158 jurisdictions listed in the questionnaire. The median number of responses to all questions across all jurisdictions was 18, which compares favorably with 15
in the 2012 survey, although less than the median of 24.5 in 2013.
In addition to being ranked on the 16 factors, jurisdictions were also ranked on the basis of five
composite indices, as follows.
Policy Perception Index
The Policy Perception Index value (referred to in surveys prior to 2013 as the All-Inclusive Composite Index) for each jurisdiction is derived from the equally-weighted3 scores achieved on all 16
factors. This index is the most comprehensive measure of the extent of investment barriers within
each jurisdiction. Most of the discussion that follows is based on the jurisdictional scores and rankings obtained using it. A high score on this measure reflects considerable negative sentiment on the
part of respondents and indicates that they regard the jurisdiction in question as relatively unattractive for investment
Commercial Environment Index
The Commercial Environment Index ranks jurisdictions on five factors that affect after-tax cash
flow and the cost of undertaking petroleum exploration and development activities:
·
·
·
·
·
fiscal terms
taxation in general
trade barriers
quality of infrastructure
labor availability and skills
The scores for the Commercial Environment Index for each jurisdiction were calculated by averaging the negative scores for each of these five factors. A high index value indicates that industry
3
The scores for each of the 16 factors are published online to permit interested parties to tailor weighting and composite indices to suit their needs.
Fraser Institute Global Petroleum Survey, 2014
www.fraserinstitute.org
13
managers and executives consider that the business conditions reflected in this measure constitute
significant barriers to investment.
Regulatory Climate Index
The Regulatory Climate Index reflects the scores assigned to jurisdictions for the following six
factors:
·
·
·
·
·
·
the cost of regulatory compliance
regulatory enforcement
environmental regulations
labor regulations and employment agreements
regulatory duplication and inconsistencies
legal system
A relatively high value on the Regulatory Climate Index indicates that regulations, requirements,
and agreements in a jurisdiction constitute a substantial barrier to investment, resulting in a relatively poor ranking.
Geopolitical Risk Index
The Geopolitical Risk Index represents scores for political stability and security. These factors are
considered to be more difficult to overcome than either regulatory or commercial barriers because
for significant progress to be made on them, a change in the political landscape is usually required.
A high score on the Geopolitical Risk Index indicates that investment in that jurisdiction is relatively unattractive because of political instability and/or security issues that threaten the physical
safety of personnel or present risks to an investor’s facilities.
Best practices
The survey includes a question on the extent to which exploration and development might
increase if a full and complete transition to “best practices” (in relation to the main drivers of
investment decisions) were to occur. This question enables us to measure the potential impact of
the adoption of best practices on the attractiveness for investment in each jurisdiction.
14
Fraser Institute Global Petroleum Survey, 2014
www.fraserinstitute.org
Global Results
Policy Perception Index rankings segmented
according to jurisdictions’ proved reserves
As we noted in the 2013 Global Petroleum Survey, it is useful to measure the attractiveness of jurisdictions for investment according to regulatory climate, political risk, production taxes, quality of
infrastructure, and the other factors which respondents are asked to address. However, ranking
jurisdictions according to their Policy Perception Index scores alone does not recognize the fact
that decisions to invest in petroleum exploration and development are always conditioned by the
size of the oil and gas resources that are considered to be available.
Jurisdictions with relatively small proven petroleum reserves and relatively small production may
be recognized as very attractive for investment as reflected by favorable Policy Perception Index
scores and high rankings—as Manitoba is. However, jurisdictions with small resource endowments cannot be expected to attract nearly as much investment as those with relatively large undeveloped oil and gas reserves, such as Alberta, the United Arab Emirates, and Kuwait. In this section
we compare jurisdictions with similar proved reserve sizes (relatively large, modest, or small) on
their Policy Perception Index rankings.
Proved petroleum reserves are discovered oil and gas resources that are deemed feasible for commercialization, assuming current prices and infrastructure. By excluding already discovered but as
yet “unproven” resources, and resources thought to exist but not yet discovered, this approach
most likely does not accurately reflect how jurisdictions which have large unproven oil and gas
resources (such as Alaska—US Offshore, Russia—Offshore Arctic, and Brazil’s offshore pre-salt
region) are regarded by potential investors and, therefore, how much investment they are likely to
attract in the foreseeable future. However, our group comparisons were limited by the fact that
comparable data for so-called “P2” reserves (i.e., proved reserves plus probable reserves from
already discovered yet unproven resources) are not available for most jurisdictions.4 Comparable
information for “P3” reserves (i.e., proved, probable, and possible resources—the latter based on
estimates of potential production from as yet undiscovered resources) is very limited.
Table 1 provides Policy Perception Index values for 27 jurisdictions that each hold at least 1 percent (when rounded to the nearest decimal) of the sum of the proved petroleum reserves of the 140
(of 156) jurisdictions ranked by the survey that have at least some proved oil and/or gas reserves.5
4
Appendix 1 lists the sources from which the reserves data were gleaned.
5
The 16 jurisdictions excluded because they have no proven oil and/or gas reserves are: Brazil—
Offshore Profit Sharing Contracts, Cambodia, Cyprus, Faroe Islands, French Guiana, Greenland,
Guyana, Kenya, Lebanon, Mali, Malta, New South Wales, Quebec, Seychelles, Tasmania, and
Uruguay.
Fraser Institute Global Petroleum Survey, 2014
www.fraserinstitute.org
15
Table 1: Large Reserve Holder Comparisons
Tier One
16
Policy Perception Proved Reserves
Index Score
(bboe)
1
Texas
13.19
28.571
2
Alberta
26.57
174.835
3
Norway—North Sea
29.70
13.576
4
United Arab Emirates
31.83
137.990
5
Qatar
34.90
190.700
6
Malaysia
53.10
19.513
7
Brazil—Offshore CC
55.18
14.589
8
Mozambique
66.13
18.690
9
Kuwait
66.58
115.868
10
Azerbaijan
68.29
13.542
11
India
70.63
14.432
12
Nigeria
72.04
70.920
13
China
72.37
53.413
14
Algeria
75.74
41.936
15
Mexico
75.79
13.264
16
Kazakhstan
75.93
45.887
17
Russia—Other
82.11
189.848
18
Egypt
83.08
18.829
19
Russia—Offshore Sakhalin
84.33
22.442
20
Libya
85.43
58.694
21
Indonesia
85.89
23.098
22
Turkmenistan
87.01
50.129
23
Iraq
88.59
161.143
24
Russia—Offshore Arctic
90.90
160.238
25
Russia—Eastern Siberia
92.66
22.959
26
Iran
93.78
380.272
27
Venezuela
100.00
334.449
Fraser Institute Global Petroleum Survey, 2014
www.fraserinstitute.org
Proved reserves holdings in this group range from Mexico’s 13.27 billion barrels of oil equivalent
(Bboe) to Iran’s 380.27 Bboe. As a whole, the proved reserves of these 27 large reserve holders constitute 91.0 percent of the reserves held by the 140 jurisdictions.6
In this year’s report there are again 27 large reserve holders, as there were in 2013, but the composition of the group has changed slightly. Due to a large increase in that country’s proved gas reserves,
Mozambique, which ranks 8th (of 27) this year, is now part of this group. However, Australia—Offshore is now classified among the group of modest reserve holders instead of a jurisdiction
with relatively large reserves (see table 2).7
Of the large reserve holders, the five with the highest level of attractiveness on the Policy Perception Index (in that they received the lowest score) are Texas, Alberta, Norway—North Sea, United
Arab Emirates, and Qatar. Of these, only Texas ranks in the highly attractive first quintile. The four
other jurisdictions in this group, led by Alberta and Norway—North Sea, have somewhat less
attractive second quintile investment attractiveness ratings.
Top Five Large Reserve Holder Jurisdictions
1. Texas
2. Alberta
3. Norway—North Sea
4. United Arab Emirates
5. Qatar
Eleven of the 27 large reserve holders have highly undesirable (i.e., fifth quintile) scores on the Policy Perception Index. These consist of the four Russian regions, Egypt, Libya, Indonesia,
Turkmenistan, Iraq, Iran, and Venezuela. Together, these countries’ proved reserves comprise
almost 60 percent of the holdings of the group of 27 and 54 percent of the reserves of the 140 jurisdictions with proved reserves.
6
In the 2013 survey, 27 large reserve holders were indicated to have 92.1 percent of total reserves.
7
The allocation this year of Australia—Offshore to the group of modest reserve holders resulted from
our decision to rely almost exclusively on the US Energy Information Administration’s International
Energy Statistics for proved reserves data, as explained in Appendix 1. The EIA places proved natural
gas reserves in Australia as a whole at 43.0 Tcf. By way of comparison, British Petroleum’s Statistical
Review of World Energy places them much higher, at 129.9 Tcf. Because more than 98 percent of
Australia’s gas reserves are located in the federal offshore jurisdiction, if the BP estimate were used,
Australia—Offshore would fall in the large reserve holder group, positioned in 6th place as in the
2013 survey.
Fraser Institute Global Petroleum Survey, 2014
www.fraserinstitute.org
17
Table 2: Medium Reserve Holder Comparisons
Tier Two
1
2
3
4
5
6
7
8
9
10
11
12
13
14
15
16
17
18
19
20
21
22
23
24
25
26
27
28
29
30
31
32
33
34
35
36
37
38
39
40
41
42
43
44
Oklahoma
Arkansas
North Dakota
Wyoming
Utah
Louisiana
Netherlands—Onshore
Norway—Other Offshore
New Mexico
United Kingdom—North Sea
Oman
West Virginia
Australia—Offshore
Trinidad & Tobago
Newfoundland & Labrador
US—Gulf of Mexico
Pennsylvania
Brunei
British Columbia
Colombia
Colorado
Alaska
Thailand
Vietnam
Peru
Pakistan
Israel
Rep. of Congo (Brazzaville)
Gabon
California
Chad
Equatorial Guinea
Angola
Yemen
Myanmar
Bangladesh
Ukraine
Argentina—Chubut
Syria
Uganda
South Sudan
Uzbekistan
Ecuador
Bolivia
Policy Perception Proved Reserves
Index Score
(bboe)
7.02
11.06
13.55
19.11
21.40
23.12
28.60
30.07
30.70
33.18
36.03
37.60
38.41
38.44
39.06
40.61
46.14
46.42
49.60
51.82
51.92
52.52
53.69
54.59
56.78
61.65
63.16
65.18
66.84
67.35
67.63
69.51
69.92
70.82
76.26
76.89
76.96
83.39
83.53
83.90
84.33
87.72
96.79
97.75
6.647
2.118
4.516
6.845
2.153
4.721
6.935
6.043
3.789
3.462
11.107
2.838
9.252
3.179
2.146
6.676
6.897
3.679
6.215
3.687
4.811
5.142
2.138
9.016
3.507
5.323
1.893
2.198
2.187
3.372
1.500
1.343
10.875
6.159
1.919
1.774
7.684
1.532
4.089
2.593
4.171
12.742
8.280
2.068
Bottom Five Large Reserve Holder Jurisdictions
1. Iraq
2. Russia—Offshore Arctic
3. Russia—Eastern Siberia
4. Iran
5. Venezuela
Table 2 gives the Policy Perception Index scores for 44 jurisdictions with at least 0.1 percent (when
rounded to the nearest decimal) but less than 1 percent of the proved reserves of the group of 140
reserve holders. As a whole, the jurisdictions with modest reserves have 8.0 percent of total proved
reserves. Their reserve holdings range in size from Equatorial Guinea’s 1.34 Bboe to Uzbekistan’s
12.74 Bboe.
Four jurisdictions in this group, all US states, achieved first quintile (most attractive) Policy Perception Index scores: Oklahoma, Arkansas, North Dakota, and Wyoming. Twelve jurisdictions
have reasonably attractive second quintile scores: Utah, Louisiana, Netherlands—Offshore, Norway—Other Offshore, New Mexico, United Kingdom—North Sea, Oman, West Virginia, Australia—Offshore, Trinidad & Tobago, and Newfoundland & Labrador. Collectively the jurisdictions
with modest reserves that achieved first or second quintile scores have proved petroleum reserves
of 75.75 Bboe, or approximately 36 percent of the combined reserves of the 44 jurisdictions in this
group.
Top Five Medium Reserve Holder Jurisdictions
1. Oklahoma
2. Arkansas
3. North Dakota
4. Wyoming
5. Utah
Seven jurisdictions in the group of 44 have index values in the least attractive fifth quintile. From
best to worst in terms of their performance according to the survey results are Argentina—Chubut, Syria, Uganda, South Sudan, Uzbekistan, Ecuador, and Bolivia. Combined, these
jurisdictions and the 12 jurisdictions with Policy Perception Index scores in the fourth quintile
range have proved reserves of 81.70 Bboe, or 39 percent of holdings of all 44 jurisdictions. By way
of comparison, the combined reserves of the 10 jurisdictions in the group of modest reserve holders that achieved 3rd quintile Index scores, including the US—Gulf of Mexico, British Columbia,
Vietnam, and Peru constitute only 25 percent of the group’s reserves.
Fraser Institute Global Petroleum Survey, 2014
www.fraserinstitute.org
19
Bottom Five Medium Reserve Holder Jurisdictions
1. Uganda
2. South Sudan
3. Uzbekistan
4. Ecuador
5. Bolivia
Table 3 provides the Policy Perception Index scores and rankings for the 69 jurisdictions with the
smallest proved petroleum reserves. Each of these jurisdictions has less than 0.1 percent of the
proved reserves of the 140 jurisdictions addressed in this section, ranging from 9 million Bboe in
Spain—Offshore to Romania’s 1.30 Bboe. As in the 2013 survey, the six small reserve holder jurisdictions with first quintile scores are Mississippi, Saskatchewan, Manitoba, Alabama, Kansas and
Netherlands—Offshore, although third place Manitoba and fifth place Kansas have exchanged
positions between last year and this. The six top-ranked jurisdictions are followed by 15 with second quintile scores, headed by Ohio, Denmark, New Zealand, and South Australia.
Top Five Small Reserve Holder Jurisdictions
1. Mississippi
2. Saskatchewan
3. Manitoba
4. Alabama
5. Kansas
The four jurisdictions in this group with the least attractive scores on the Policy Perception Index,
all falling in the fifth quintile, are Argentina—Santa Cruz, Tanzania, Kyrgyzstan, and the Democratic Republic of the Congo (Kinshasa). Another twenty-seven jurisdictions in the group of small
reserve holders also received poor marks from survey respondents as evidenced by their fourth
quintile scores.
Bottom Five Small Reserve Holder Jurisdictions
1. Guatemala
2. Argentina—Santa Cruz
3. Tanzania
4. Kyrgyzstan
5. Democratic Republic of the Congo (Kinshasa)
20
Fraser Institute Global Petroleum Survey, 2014
www.fraserinstitute.org
Table 3: Small Reserve Holder Comparisons
Tier Three
Policy
Perception
Index
Score
Proved
Reserves
(bboe)
Tier Three
Policy
Perception
Index
Score
Proved
Reserves
(bboe)
1
Mississippi
7.25
0.390
36
Philippines
53.44
0.789
2
Saskatchewan
10.29
1.212
37
US Offshore—Alaska
55.24
0.017
3
Manitoba
11.51
0.031
38
Georgia
56.85
0.091
4
Alabama
11.90
0.500
39
Brazil—Onshore CC
59.53
1.196
5
Kansas
12.82
1.047
40
Tunisia
60.09
0.855
6
Netherlands—Offshore
19.38
0.827
41
Hungary
60.47
0.079
7
Ohio
0.295
42
Timor Gap JPDA
61.32
0.271
8
Denmark
1.090
43
Mauritania
62.19
0.207
9
New Zealand
26.83
0.275
44
Albania
62.50
0.174
10
South Australia
27.17
0.075
45
Spain—Offshore
63.84
0.009
11
Montana
28.62
0.503
46
France
64.32
0.154
12
Chile
30.57
0.797
47
New York
64.68
0.044
13
Ireland
32.82
0.065
48
South Africa
67.35
0.249
14
Michigan
33.14
0.404
49
Turkey
68.79
0.340
15
UK—Other Offshore
34.75
1.127
50
Ethiopia
69.05
0.164
16
Namibia
35.90
0.411
51
Cameroon
69.51
1.092
17
Illinois
36.51
0.060
52
Madagascar
69.58
0.013
18
36.85
0.023
53
Argentina—Neuquen
69.87
1.235
54
Bulgaria
70.03
0.052
19
Australia—Northern
Territory
Suriname
36.96
0.077
55
Papua New Guinea
70.90
1.211
20
Japan
38.03
0.182
56
Argentina—Salta
71.68
0.279
21
Jordan
38.70
0.041
57
Niger
72.19
0.150
22
Victoria
40.96
0.012
58
Italy
72.34
0.953
23
Western Australia
41.40
0.039
59
0.281
Germany
42.43
0.999
25
Morocco
44.34
0.011
60
Argentina—Tierra del
Fuego
Spain—Onshore
73.09
24
73.30
0.017
26
Romania
45.12
1.296
61
Argentina—Mendoza
73.48
0.350
27
Queensland
45.15
0.075
62
Somaliland
73.76
0.037
28
Ivory Coast
46.75
0.287
63
US—Offshore Pacific
73.90
0.448
29
Poland
0.764
64
Greece
78.79
0.017
30
Ghana
0.810
65
Guatemala
79.16
0.083
31
Nova Scotia
48.96
0.037
66
Argentina—Santa Cruz
82.05
0.924
32
New Brunswick
51.04
0.019
67
Tanzania
83.76
0.043
33
Bahrain
51.37
0.732
68
Kyrgyzstan
84.39
0.077
34
Yukon
52.59
0.021
69
87.43
0.187
35
Northwest Territories
53.11
0.119
Democratic Republic of
the Congo (Kinshasa)
23.29
25.25
46.84
48.75
Fraser Institute Global Petroleum Survey, 2014
www.fraserinstitute.org
21
Policy Perception Index
Table 4 compares the scores and rankings on the Policy Perception Index (PPI) from 2014 back
through 2010. The first set of columns show the rankings.8 The second set of columns shows the
absolute scores for the jurisdictions in each of the 5 years, based on the percentage of negative
responses to each survey question. Those at the top of the list are regarded as having relatively low
investment barriers and, therefore, as being more attractive for investment. Readers are reminded
again that these rankings are driven purely by responses to the survey questions and do not
account for the extent of any jurisdiction’s proved oil and gas reserves. Hence, some jurisdictions
with relatively small or even no reserves rank more highly on the basis of the respondents’ perceptions of business conditions, regulatory regimes, and other factors than some jurisdictions with
much larger reserves.
The 10 jurisdictions with the highest percentage of negative responses, indicating the greatest barriers to investment, with the least attractive last, are:
1. Turkmenistan
2. Democratic Republic of the Congo (Kinshasa)
3. Uzbekistan
4. Iraq
5. Russia—Offshore Arctic
6. Russia—Eastern Siberia
7. Iran
8. Ecuador
9. Bolivia
10. Venezuela
With the exception of Turkmenistan and Democratic Republic of the Congo (Kinshasa), these
jurisdictions were also among the 10 least attractive jurisdictions for investment in the 2013 survey. Of the four Russian jurisdictions in the survey, two scored in the bottom 10 and the other two
scored close to the bottom 10.
The two jurisdictions that were in the bottom 10 in 2013 but not this year were Russia—Other and
South Sudan. Russia—Other, although realizing a slightly worse overall PPI score than in 2013,
moved from a rank of 148th (of 157) last year to 135th (of 156) in 2014. Similarly, South Sudan also
improved in the standings, moving from 150th (of 157) in 2013 to 141st (of 156), but with a less
favorable overall score.
8
22
Note that the comparison of 2014 and 2013 values with values from 2012 or earlier on this index is
affected by the fact that scores on the question regarding socioeconomic agreements/community
development conditions were included in the calculation prior to 2013 and scores on the corruption
question were included in the calculation for 2012 (only).
Fraser Institute Global Petroleum Survey, 2014
www.fraserinstitute.org
Table 4: Jurisdictional rankings according to the extent of investment barriers (based
on Policy Perception Index values)
2014
2013
2012
2011
2010
2014
Rank in Rank in Rank in Rank in Rank in Score
Group Group Group Group Group
of 156 of 157 of 147 of 135 of 133
2013
Score
2012
Score
2011
Score
2010
Score
Oklahoma
1
1
1
4
9
7.02
9.84
4.71
11.81
13
Mississippi
2
2
2
1
6
7.25
11.19
6.3
4.89
11.65
Saskatchewan
3
3
13
11
17
10.29
11.43
14.6
17.48
17.63
Arkansas
4
5
N/A
15
13
11.06
12.34
N/A
19.16
15.62
Manitoba
5
9
5
12
8
11.51
16.87
11.05
17.52
12.48
Alabama
6
7
N/A
8
10
11.90
15.34
N/A
17.00
13.41
Kansas
7
6
8
3
19
12.82
12.64
12.32
11.70
18.80
Texas
8
4
3
5
2
13.19
11.71
8.03
12.17
9.53
North Dakota
9
8
4
10
24
13.55
15.92
9.88
17.44
19.65
Wyoming
10
15
11
27
4
19.11
22.63
13.87
23.38
10.25
Netherlands—
Offshore
Utah
11
10
12
7
26
19.38
18.66
14.30
15.88
20.26
12
32
24
18
7
21.40
28.09
22.65
21.28
12.04
Louisiana
13
14
15
14
15
23.12
22.57
15.26
18.87
16.62
Ohio
14
29
14
2
12
23.29
27.35
14.97
10.16
13.76
Denmark
15
13
9
17
33
25.25
22.46
13.09
20.47
23.99
Alberta
16
19
21
51
60
26.57
24.47
21.08
32.73
36.70
New Zealand
17
34
20
16
18
26.83
29.60
20.59
20.33
18.32
South
Australia
Netherlands—
Onshore
Montana
18
27
29
21
14
27.17
26.91
24.83
21.50
15.74
19
11
6
24
25
28.60
21.68
11.42
22.11
20.02
20
21
23
43
35
28.62
25.89
22.17
29.74
24.26
Uruguay
21
63
81
52
27
28.80
41.38
51.31
32.76
21.10
Faroe Islands
22
12
18
26
N/A
29.30
22.11
19.59
23.33
N/A
Norway—
North Sea
Norway—Other
Offshore (except
North Sea)
Chile
23
28
19
31
47
29.70
27.06
19.95
24.89
31.47
24
20
31
54
51
30.07
25.18
25.31
33.52
32.69
25
26
76
20
22
30.57
26.63
49.51
21.45
19.55
New Mexico
26
36
7
41
54
30.70
30.36
11.92
28.79
34.27
French Guiana***
27
109
N/A
N/A
N/A
31.54
60.18
N/A
N/A
N/A
United Arab
Emirates
Ireland
28
25
42
39
41
31.83
26.49
30.65
28.59
28.89
29
35
17
N/A
N/A
32.82
29.60
18.26
N/A
N/A
Michigan
30
62
30
29
38
33.14
41.03
24.87
23.87
27.27
United Kingdom—
North Sea
31
16
22
22
29
33.18
23.47
21.44
21.77
21.23
Fraser Institute Global Petroleum Survey, 2014
www.fraserinstitute.org
23
Table 4: Jurisdictional rankings continued ...
2014
2013
2012
2011
2010
2014
Rank in Rank in Rank in Rank in Rank in Score
Group Group Group Group Group
of 156 of 157 of 147 of 135 of 133
2013
Score
2012
Score
2011
Score
2010
Score
Malta
32
43
25
N/A
N/A
34.59
33.76
22.86
N/A
N/A
United Kingdom—
Other Offshore
(except North Sea)
Qatar
33
23
38
32
32
34.75
26.40
27.63
25.35
23.55
34
18
32
33
30
34.90
24.16
25.42
25.73
21.47
Namibia
35
38
67
49
48
35.90
31.31
43.72
32.09
31.88
Oman
36
31
46
57
44
36.03
27.84
32.77
34.18
30.03
Illinois
37
40
N/A
13
3
36.51
32.51
N/A
17.75
9.65
Seychelles
38
37
N/A
N/A
N/A
36.78
30.98
N/A
N/A
N/A
Northern Territory
39
33
44
30
16
36.85
29.25
32.12
24.87
17.14
Suriname
40
87
N/A
87
70
36.96
51.94
N/A
54.19
42.26
West Virginia
41
22
10
6
49
37.60
25.91
13.64
13.35
31.93
Japan
42
57
37
56
69
38.03
39.05
27.37
33.96
42.06
Australia—
Offshore
Trinidad & Tobago
43
54
33
40
31
38.41
37.65
25.86
28.61
21.93
44
53
69
58
59
38.44
37.45
44.79
34.18
36.54
Jordan
45
45
99
N/A
75
38.70
34.60
58.86
N/A
44.40
Newfoundland &
Labrador
Tasmania
46
24
47
50
50
39.06
26.43
33.78
32.34
32.39
47
52
51
28
23
39.88
36.69
35.74
23.66
19.61
48
41
26
60
11
40.61
33.07
22.89
36.38
13.44
US Offshore—
Gulf of Mexico
Victoria
49
56
43
19
20
40.96
38.74
31.78
21.40
18.96
Western
Australia
Guyana
50
49
40
37
21
41.40
35.70
28.78
28.18
19.13
51
90
48
97
N/A
41.48
52.39
34.12
58.48
N/A
Germany
52
55
36
35
39
42.43
38.07
26.27
27.04
27.48
Morocco
53
51
57
61
67
44.34
36.18
37.72
36.58
40.97
Romania
54
97
53
63
95
45.12
55.34
36.57
38.56
53.96
Queensland
55
69
50
42
34
45.15
45.07
35.40
29.12
24.06
Pennsylvania
56
58
34
65
66
46.14
39.13
26.04
40.37
40.44
Brunei
57
50
85
71
45
46.42
35.81
52.56
41.51
30.46
Ivory Coast
58
85
108
80
99
46.75
50.99
64.04
47.74
55.79
Poland
59
46
41
36
37
46.84
35.03
29.12
27.24
26.84
Ghana
60
74
80
72
89
48.75
47.88
51.27
41.89
50.33
Nova Scotia
61
30
35
34
53
48.96
27.52
26.17
26.64
33.28
British
Columbia
62
47
39
69
52
49.60
35.55
27.73
41.44
33.16
24
Fraser Institute Global Petroleum Survey, 2014
www.fraserinstitute.org
Table 4: Jurisdictional rankings continued ...
2014
2013
2012
2011
2010
2014
Rank in Rank in Rank in Rank in Rank in Score
Group Group Group Group Group
of 156 of 157 of 147 of 135 of 133
2013
Score
2012
Score
2011
Score
2010
Score
New
Brunswick
Bahrain
63
81
102
59
N/A
51.04
49.94
62.08
35.80
N/A
64
44
78
38
46
51.37
34.51
49.71
28.37
30.81
Colombia
65
73
65
48
42
51.82
47.65
43.36
31.81
29.60
Colorado
66
66
16
53
61
51.92
42.02
16.85
33.47
37.35
Alaska
67
79
61
83
68
52.52
49.70
40.16
50.84
41.80
Yukon***
68
39
58
N/A
36
52.59
31.99
38.04
N/A
25.50
Cyprus
69
76
27
N/A
N/A
52.91
48.22
24.43
N/A
N/A
Malaysia
70
68
83
79
63
53.10
43.55
51.77
47.47
39.71
Greenland***
71
82
59
44
56
53.10
50.65
38.60
30.08
36.04
Northwest
Territories
Philippines
72
61
60
103
74
53.12
40.84
39.62
64.84
44.08
73
72
91
86
55
53.44
47.15
55.56
53.31
35.68
Thailand
74
59
84
64
73
53.70
39.14
51.82
39.90
43.42
Vietnam
75
99
92
84
64
54.59
56.13
55.73
51.23
40.29
Brazil—Offshore CC
76
107
74
68
*
55.19
59.71
48.08
41.22
*
US Offshore—
Alaska
Peru
77
79
61
83
68
55.24
49.70
40.16
50.84
41.80
78
106
94
76
85
56.78
59.22
57.01
46.37
48.36
Georgia***
79
42
49
N/A
N/A
56.85
33.40
35.04
N/A
N/A
Brazil—
Onshore CC
Kenya
80
105
88
67
*
59.53
59.02
52.72
40.83
*
81
95
86
N/A
N/A
59.86
54.56
52.58
N/A
N/A
Tunisia
82
78
56
62
62
60.09
49.35
37.66
36.93
38.95
New South Wales
83
84
63
45
40
60.38
50.92
41.50
30.14
28.05
Hungary
84
80
28
9
43
60.48
49.83
24.79
17.06
29.82
Timor Gap (JPDA)
85
111
73
47
72
61.32
61.09
47.34
30.75
42.52
Pakistan
86
92
129
107
105
61.65
53.26
74.43
67.70
62.17
Mauritania
87
77
97
111
N/A
62.19
48.55
57.69
70.56
N/A
Albania
88
67
95
73
81
62.50
43.41
57.19
42.34
45.64
Israel
89
70
54
81
N/A
63.16
45.33
37.06
48.73
N/A
Spain—Offshore
90
64
N/A
N/A
N/A
63.84
41.52
N/A
N/A
N/A
France
91
96
55
46
58
64.32
55.26
37.23
30.65
36.43
New York
92
119
68
N/A
102
64.68
64.20
44.08
N/A
59.34
Republic of the
Congo (Brazzaville)
Mozambique
93
121
113
113
104
65.18
66.41
67.29
70.71
60.90
94
91
90
75
97
66.13
52.71
55.54
45.22
55.19
Kuwait
95
60
64
74
83
66.58
39.56
42.23
43.76
46.10
Fraser Institute Global Petroleum Survey, 2014
www.fraserinstitute.org
25
Table 4: Jurisdictional rankings continued ...
2014
2013
2012
2011
2010
2014
Rank in Rank in Rank in Rank in Rank in Score
Group Group Group Group Group
of 156 of 157 of 147 of 135 of 133
2013
Score
2012
Score
2011
Score
2010
Score
Gabon
96
102
100
99
91
66.84
57.85
59.15
60.23
52.10
California
97
98
45
91
87
67.35
55.70
32.47
55.99
49.35
South Africa
98
71
106
85
88
67.35
45.62
63.75
51.55
49.95
Chad
99
133
132
115
114
67.64
74.96
74.92
71.94
66.98
Azerbaijan
100
93
70
104
108
68.29
53.93
45.58
65.45
64.33
Brazil—Offshore
presalt area PSC
Turkey
101
115
75
66
*
68.39
61.73
48.36
40.79
*
102
48
66
70
84
68.79
35.63
43.56
41.51
48.15
Ethiopia
103
103
72
N/A
119
69.05
58.74
47.07
N/A
76.15
Cameroon
104
86
82
98
76
69.51
51.66
51.49
59.82
44.70
Equatorial Guinea
105
104
107
121
101
69.51
58.74
63.85
76.85
59.16
Madagascar
106
112
105
100
98
69.58
61.14
63.54
62.66
55.54
Argentina—
Neuquen
Angola
107
129
111
102
*
69.87
73.76
65.49
63.88
*
108
108
118
117
93
69.92
60.14
69.84
72.70
52.65
Bulgaria
109
114
62
55
86
70.03
61.68
40.93
33.94
49.21
India
110
124
124
109
107
70.63
70.41
72.98
69.56
63.34
Yemen
111
120
130
120
116
70.82
64.42
74.50
75.25
69.66
Papua New Guinea
112
125
123
96
110
70.90
70.62
72.96
57.68
65.11
Argentina—Salta
113
147
126
82
*
71.68
81.08
73.50
49.56
*
Nigeria
114
135
137
123
126
72.05
75.75
81.31
79.36
83.38
Niger
115
110
79
N/A
112
72.19
60.75
50.88
N/A
65.46
Italy
116
94
96
77
78
72.35
54.17
57.42
46.91
45.01
China
117
101
103
90
90
72.37
57.23
62.53
55.43
51.66
Argentina—
Tierra del Fuego
Spain—Onshore
118
137
122
*
*
73.09
76.29
72.58
*
*
119
65
N/A
N/A
N/A
73.30
41.85
N/A
N/A
N/A
Argentina—
Mendoza
Lebanon
120
136
119
88
N/A
73.48
75.88
69.99
54.66
N/A
121
88
71
N/A
N/A
73.66
52.22
45.61
N/A
N/A
Somaliland
122
138
110
N/A
N/A
73.76
76.56
65.22
N/A
N/A
US Offshore—
Pacific
Algeria
123
100
N/A
101
103
73.90
56.20
N/A
63.17
60.66
124
126
125
125
109
75.74
71.04
73.23
80.93
64.37
Mexico
125
N/A
N/A
N/A
N/A
75.79
N/A
N/A
N/A
N/A
Kazakhstan
126
139
134
131
124
75.93
76.73
78.64
89.27
80.45
Myanmar
127
127
115
108
113
76.26
71.18
68.82
68.42
66.59
Bangladesh
128
142
114
118
115
76.89
78.23
67.75
72.99
68.75
26
Fraser Institute Global Petroleum Survey, 2014
www.fraserinstitute.org
Table 4: Jurisdictional rankings continued ...
2014
2013
2012
2011
2010
2014
Rank in Rank in Rank in Rank in Rank in Score
Group Group Group Group Group
of 156 of 157 of 147 of 135 of 133
2013
Score
2012
Score
2011
Score
2010
Score
Ukraine
129
144
116
119
130
76.96
79.27
69.12
74.16
88.73
Cambodia
130
130
135
110
92
77.04
73.89
79.97
70.38
52.35
Greece***
131
116
93
N/A
N/A
78.79
61.99
55.80
N/A
N/A
Guatemala
132
128
77
N/A
N/A
79.16
73.48
49.57
N/A
N/A
Quebec
133
141
101
92
77
79.47
77.11
60.53
56.24
44.89
Argentina—
Santa Cruz
Russia—Other
134
131
140
94
*
82.05
74.02
84.00
57.13
*
135
148
138
*
*
82.11
81.62
82.33
*
*
Egypt
136
117
104
93
79
83.08
62.62
62.70
56.47
45.32
Argentina—
Chubut
Syria
137
134
112
95
*
83.39
75.62
65.55
57.48
*
138
143
131
106
96
83.53
78.53
74.66
67.69
55.17
Tanzania
139
89
89
89
82
83.76
52.32
54.67
54.95
45.66
Uganda
140
118
87
122
94
83.90
64.06
52.66
77.72
53.41
South Sudan
141
150
117
**
**
84.33
83.80
69.15
**
**
Russia—Offshore
Sakhalin
Kyrgyzstan***
142
140
133
*
*
84.33
76.75
77.31
*
*
143
146
109
105
123
84.39
80.60
64.21
66.34
79.74
Libya
144
145
143
127
121
85.43
79.98
85.55
83.69
76.60
Indonesia
145
132
127
114
111
85.89
74.36
74.14
71.57
65.12
Mali
146
83
128
N/A
N/A
86.01
50.90
74.23
N/A
N/A
Turkmenistan
147
123
98
124
128
87.01
70.23
58.79
80.31
87.41
Democratic
Republic of the
Congo (Kinshasa)
Uzbekistan***
148
122
120
129
106
87.43
69.32
71.03
85.14
62.81
149
152
141
130
122
87.72
89.22
84.97
88.37
78.37
Iraq
150
149
139
128
125
88.59
82.88
82.60
83.95
81.41
Russia—Offshore
Arctic
Russia—Eastern
Siberia
Iran
151
153
136
*
*
90.90
90.74
80.94
*
*
152
151
144
*
*
92.66
85.80
85.91
*
*
153
155
145
132
129
93.78
97.17
88.44
92.50
87.93
Ecuador
154
156
142
134
127
96.79
97.97
85.34
96.27
85.59
Bolivia
155
154
147
133
133
97.75
95.80
100.00
96.18
100.00
Venezuela
156
157
146
135
132
100.00
100.00
97.09
100.00
97.18
Notes:
Botswana was dropped this year after only receiving three responses. East Timor was dropped after receiving zero responses.
*Broken down into regions.
**Sudan became two countries. South Sudan was ranked but not Sudan.
***Between 5 and 9 responses.
Fraser Institute Global Petroleum Survey, 2014
www.fraserinstitute.org
27
Figure 4 presents the Policy Perception Index rankings for the 157 jurisdictions ranked this year.
Among the three Brazilian jurisdictions, “CC” and “PSC” refer to “concession contracts” and
“production sharing contracts.”
Respondents ranked the following 10 jurisdictions as the most attractive for investment in petroleum exploration and development:
1. Oklahoma
2. Mississippi
3. Saskatchewan
4. Arkansas
5. Manitoba
6. Alabama
7. Kansas
8. Texas
9. North Dakota
10. Wyoming
All but one of these jurisdictions—Wyoming—ranked in the top 10 jurisdictions worldwide in the
2013 survey. Three of the jurisdictions—Oklahoma, Mississippi, and Texas—consistently rank in
the top 10, having been there in the last five iterations of the survey.
Oklahoma and Mississippi ranked first and second this year, respectively, unchanged from their
2012 and 2013 positions. Saskatchewan held onto third after moving into that position last year
from 13th (of 147) in 2012. Arkansas moved up one spot from 5th (of 157) place in 2013. Manitoba
rose to 5th (of 156) this year, after placing 9th (of 157) in 2013, and has only missed being in the top
ten once (2011) in the last five years. Alabama moved up to 6th (of 156) from 7th (of 157) in the previous year. That state has ranked in the top ten for four of the last five years.9 Kansas and Texas both
dropped this year, moving to 7th (of 156) from 6th (of 157) and 8th (of 156) from 4th (of 157),
respectively. North Dakota also dropped one spot this year. While, Wyoming moved up to 10th (of
156) from 15th (of 157) in 2013. The only jurisdiction displaced from the top 10 was the Netherlands—Offshore which ranked 11th (of 156) this year.
Only five jurisdictions, Uruguay (-12.56), French Guiana (-28.64), Suriname (-14.98), Guyana
(-10.90) and Romania (-10.22), scored much lower Policy Perception Index scores this year (by at
least 10 points) than in 2013. Such improvements are remarkable given a significantly more uncertain world. The improved scores enabled those jurisdictions to move up considerably in the rankings, indicating that survey respondents now regard them as more favorable for upstream
petroleum investment than in 2013. For example, Uruguay now ranks as the 21st (of 156) most
9
28
Alabama was not ranked in 2012 due to insufficient data.
Fraser Institute Global Petroleum Survey, 2014
www.fraserinstitute.org
Figure 4: Policy Perception Index
Oklahoma
Oklahoma
Mississippi
Saskatchewan
Arkansas
Manitoba
Alabama
Kansas
Texas
North Dakota
Wyoming
Netherlands—Offshore
Utah
Louisiana
Ohio
Denmark
Alberta
New Zealand
South Australia
Netherlands—Onshore
Montana
Uruguay
Faroe Islands
Norway—North Sea
Norway—Other Offshore (except North Sea)
Chile
New Mexico
French Guiana
United Arab Emirates
Ireland
Michigan
United Kingdom—North Sea
Malta
UK—Other Offshore (except North Sea)
Qatar
Namibia
Oman
Illinois
Seychelles
Northern Territory
Suriname
West Virginia
Japan
Australia—Offshore
Trinidad and Tobago
Jordan
Newfoundland & Labrador
Tasmania
US Offshore—Gulf of Mexico
Victoria
Western Australia
Guyana
Germany
Morocco
Romania
Queensland
Pennsylvania
Brunei
Ivory Coast
Poland
Ghana
Nova Scotia
British Columbia
New Brunswick
Bahrain
Colombia
Colorado
Alaska
Yukon
Cyprus
Malaysia
Greenland
Northwest Territories
Philippines
Thailand
Vietnam
Brazil—Offshore CC
US Offshore—Alaska
Peru
Mild deterrent to investment
Strong deterrent to
investment
Would not pursue investment
due to this factor
0
20
40
60
Fraser Institute Global Petroleum Survey, 2014
www.fraserinstitute.org
80
100
Georgia
Brazil—Onshore CC
Kenya
Tunisia
New South Wales
Hungary
Timor Gap (JPDA)
Pakistan
Mauritania
Albania
Israel
Spain—Offshore
France
New York
Republic of the Congo (Brazzaville)
Mozambique
Kuwait
Gabon
California
South Africa
Chad
Azerbaijan
Brazil—Offshore presalt area PSC
Turkey
Ethiopia
Cameroon
Equatorial Guinea
Madagascar
Argentina—Neuquen
Angola
Bulgaria
India
Yemen
Papua New Guinea
Argentina—Salta
Nigeria
Niger
Italy
China
Argentina—Tierra del Fuego
Spain—Onshore
Argentina—Mendoza
Lebanon
Somaliland
US Offshore—Pacific
Algeria
Mexico
Kazakhstan
Myanmar
Bangladesh
Ukraine
Cambodia
Greece
Guatemala
Quebec
Argentina—Santa Cruz
Russia—Other
Egypt
Argentina—Chubut
Syria
Tanzania
Uganda
South Sudan
Russia—Offshore Sakhalin
Kyrgyzstan
Libya
Indonesia
Mali
Turkmenistan
DRC (Kinshasa)
Uzbekistan
Iraq
Russia—Offshore Arctic
Russia—Eastern Siberia
Iran
Ecuador
Bolivia
Venezuela
0
20
40
60
80
100
29
attractive jurisdiction worldwide compared with 63rd of (of 157) in 2013, and Romania is now
ranked 54th (of 156) in the world compared with 97th (of 157) a year ago. The reasons underlying
these and other significant improvements are examined in the regional analysis that is presented
later in this report.
But respondents also awarded higher (i.e., less favorable) overall scores to a large number of jurisdictions this year, indicating that barriers to investment there appear to have considerably
increased since the 2013 survey was undertaken. Forty-one jurisdictions (of 156) had their scores
deteriorate by 10 points or more. This represents more than 25 percent of the sample. Deterioration (i.e., higher values) of 15 points or more in the scores this year compared with 2013 occurred
in Nova Scotia, Bahrain, Yukon, Georgia, Albania, Israel, Spain—Offshore, Kuwait, South Africa,
Turkey, Cameroon, Italy, China, Spain—Onshore, Lebanon, US—Offshore Pacific, Greece,
Egypt, Tanzania, Uganda, Mali, Turkmenistan, and the Democratic Republic of the Congo
(Kinshasa). Obstacles to investment are indicated to have increased the most (more than 20
points) in Nova Scotia (+21.44), Yukon (+20.60), Georgia (+23.45), Spain—Offshore (+22.32),
Kuwait (+27.02), South Africa (+21.73), Turkey (+33.16), Spain—Onshore (+31.45), Lebanon
(+21.44), Egypt (+20.46), Tanzania (+31.44), and Mali (+35.11). Uganda realized a deterioration
of almost 20 points (+19.84).
Readers are reminded again that these rankings are driven purely by responses to the survey questions and do not account for the extent of the jurisdictions’ proved oil and gas reserves, which are
discussed above. The scores, from 0 to 100, have been divided into five equal ranges (quintiles).
Those in the 0 to 19.99 range (first quintile) are rated as most attractive for investment because
they reflect the lowest percentages of negative responses while jurisdictions with scores ranging
from 80.0 to 100 (fifth quintile) are the least attractive. Arrows next to jurisdictions indicate
whether they moved up or down in quintiles from their 2013 position.
First Quintile
Only 11 jurisdictions have scores in the top range (first quintile) in 2014. They are:
·
·
·
·
·
·
·
·
·
·
·
30
Oklahoma
Mississippi
Saskatchewan
Arkansas
Manitoba
Alabama
Kansas
Texas
North Dakota
Wyoming (Ú)
Netherlands—Offshore
Fraser Institute Global Petroleum Survey, 2014
www.fraserinstitute.org
This compares with 10 jurisdictions with first quintile scores in 2013, 19 in 2012, and 15 in 2011.
Except for Wyoming, all jurisdictions in the first quintile this year were in the first quintile in 2013.
The Netherlands—Onshore, Faroe Islands, Denmark, Louisiana, Wyoming, West Virginia, Norway—North Sea, Ohio, Ireland, and New Mexico slipped from the first quintile in 2012 to the second quintile in 2013, but only Wyoming has realized a low enough (first quintile) score to recover
its first quintile ranking.
US jurisdictions account for 8 of the 11 jurisdictions with first quintile scores this year. Two jurisdictions (Saskatchewan and Manitoba) are in Canada. The only other jurisdiction in the first
quintile grouping is the Netherlands—Offshore.
Second Quintile
There are 36 jurisdictions with scores from 20 to 39.99 (second quintile) according to the Policy
Perception Index. This compares with 50 second-quintile jurisdictions in 2013 and 48 in 2012.
Geographically, this year this group is concentrated in North America (with 8 US states and 2
provinces: Alberta and Newfoundland & Labrador), Europe (9 jurisdictions), Oceania (New Zealand and 4 Australian jurisdictions), and the Latin America and the Caribbean region (5 jurisdictions). In addition, four jurisdictions in this second quintile are in the Middle East and North
Africa region, and two are in the rest of Africa. Asia is represented by one jurisdiction.
All of the jurisdictions with scores in the second quintile are listed below in the order of their rank
(i.e., best to worst score). No jurisdictions fell from the first quintile in 2013 to the second quintile
in 2014 (see previous section) and 32 jurisdictions in the second quintile group were also in this
group in 2013. Four jurisdictions moved up into the group this year as the result of improved survey results.
·
·
·
·
·
·
·
·
·
·
·
·
·
·
·
Utah
Louisiana
Ohio
Denmark
Alberta
New Zealand
South Australia
Netherlands—Onshore
Montana
Uruguay (Ú)
Faroe Islands
Norway—North Sea
Norway—Other Offshore (except North Sea)
Chile
New Mexico
Fraser Institute Global Petroleum Survey, 2014
www.fraserinstitute.org
31
·
·
·
·
·
·
·
·
·
·
·
·
·
·
·
·
·
·
·
·
·
French Guiana (Ú)
United Arab Emirates
Ireland
Michigan (Ú)
United Kingdom—North Sea
Malta
United Kingdom—Other Offshore (except North Sea)
Qatar
Namibia
Oman
Illinois
Seychelles
Northern Territory
Suriname (Ú)
West Virginia
Japan
Australia—Offshore
Trinidad and Tobago
Jordan
Newfoundland & Labrador
Tasmania
Third Quintile
Investors generally perceive jurisdictions with Policy Perception Index scores from 40 to 59.99
(i.e., in the third quintile) as somewhat less attractive than those with scores in the first and second
quintiles. The 34 jurisdictions that achieved third quintile scores this year are listed below in order
of their rank (best to worst).
This year there are many fewer jurisdictions in the third quintile than in 2013 when there were 47.
Of the 34 jurisdictions with scores in the third quintile this year, 14 dropped from the second
quintile in 2013. The remaining 20 jurisdictions were all present in the third quintile in 2013. No
jurisdiction moved up to the third quintile from the fourth quintile this year. It is noteworthy,
though, that more than half of the jurisdictions that had third quintile scores in 2013 dropped to
less attractive fourth and fifth quintile placements in 2014.
·
·
·
·
·
32
US Offshore—Gulf of Mexico (Ø)
Victoria (Ø)
Western Australia (Ø)
Guyana
Germany (Ø)
Fraser Institute Global Petroleum Survey, 2014
www.fraserinstitute.org
·
·
·
·
·
·
·
·
·
·
·
·
·
·
·
·
·
·
·
·
·
·
·
·
·
·
·
·
·
Morocco (Ø)
Romania
Queensland
Pennsylvania (Ø)
Brunei (Ø)
Ivory Coast
Poland (Ø)
Ghana
Nova Scotia (Ø)
British Columbia (Ø)
New Brunswick
Bahrain (Ø)
Colombia
Colorado
Alaska
Yukon (Ø)
Cyprus
Malaysia
Greenland
Northwest Territories
Philippines
Thailand (Ø)
Vietnam
Brazil—Offshore CC
US Offshore—Alaska
Peru
Georgia (Ø)
Brazil—Onshore CC
Kenya
Fourth Quintile
Jurisdictions with Policy Perception Index scores from 60 to 79.99 (i.e., in the fourth quintile) all
have relatively high percentages of negative responses to the survey questions. This indicates that
investors regard them as less attractive than jurisdictions with lower scores, i.e., those in the first,
second, or third quintiles. The fourth quintile is the largest group among the five quintiles this
year; 52 jurisdictions scored in this range compared with only 38 in 2013 and 35 in 2012.
This year’s fourth quintile jurisdictions are listed below in order of rank. Mexico was not evaluated
in 2013. Twenty-two jurisdictions slipped from the third quintile last year to the fourth quintile
Fraser Institute Global Petroleum Survey, 2014
www.fraserinstitute.org
33
this year. Kuwait (27.02 points) and Turkey (33.16 points) deteriorated from second quintile to
fourth quintile values. Spain—Onshore also received a much worse score this year than last (31.45
points). One jurisdiction, Argentina—Salta, improved to the fourth quintile this year from the
fifth in 2013. Twenty-six of the 52 jurisdictions in the fourth quintile this year also had scores in
this range in 2013.
·
·
·
·
·
·
·
·
·
·
·
·
·
·
·
·
·
·
·
·
·
·
·
·
·
·
·
·
·
·
·
·
·
·
34
Tunisia (Ø)
New South Wales (Ø)
Hungary (Ø)
Timor Gap (JPDA)
Pakistan (Ø)
Mauritania (Ø)
Albania (Ø)
Israel (Ø)
Spain—Offshore (Ø)
France (Ø)
New York
Republic of the Congo (Brazzaville)
Mozambique (Ø)
Kuwait (Ø)
Gabon (Ø)
California (Ø)
South Africa (Ø)
Chad
Azerbaijan (Ø)
Brazil—Offshore presalt area PSC
Turkey (Ø)
Ethiopia (Ø)
Cameroon (Ø)
Equatorial Guinea (Ø)
Madagascar
Argentina—Neuquen
Angola
Bulgaria
India
Yemen
Papua New Guinea
Argentina—Salta (Ú)
Nigeria
Niger
Fraser Institute Global Petroleum Survey, 2014
www.fraserinstitute.org
·
·
·
·
·
·
·
·
·
·
·
·
·
·
·
·
·
·
Italy (Ø)
China (Ø)
Argentina—Tierra del Fuego
Spain—Onshore (Ø)
Argentina—Mendoza
Lebanon (Ø)
Somaliland
US Offshore—Pacific (Ø)
Algeria
Mexico
Kazakhstan
Myanmar
Bangladesh
Ukraine
Cambodia
Greece
Guatemala
Quebec
Fifth Quintile
The survey participants rated the group of jurisdictions in the fifth quintile as least attractive for
upstream investment. This year there are 23 countries with fifth quintile scores, a considerable
increase from 12 in both 2012 and 2013. In order of their ranking, with the worst last, they are:
·
·
·
·
·
·
·
·
·
·
·
·
·
·
·
Argentina—Santa Cruz (Ø)
Russia—Other
Egypt (Ø)
Argentina—Chubut (Ø)
Syria (Ø)
Tanzania (Ø)
Uganda (Ø)
South Sudan
Russia—Offshore Sakhalin (Ø)
Kyrgyzstan
Libya (Ø)
Indonesia (Ø)
Mali (Ø)
Turkmenistan (Ø)
Democratic Republic of the Congo (Kinshasa) (Ø)
Fraser Institute Global Petroleum Survey, 2014
www.fraserinstitute.org
35
·
·
·
·
·
·
·
·
Uzbekistan
Iraq
Russia—Offshore Arctic
Russia—Eastern Siberia
Iran
Ecuador
Bolivia
Venezuela
All of the countries in 2013 that were in the fifth quintile, accept for Argentina—Salta, are also in
the fifth quintile in 2014. Twelve more countries dropped into fifth quintile this year, with
two—Tanzania and Mali—dropping from the third quintile. Tanzania and Mali’s scores
increased (i.e. worsened) the worst—by 31.44 and 35.11 points, respectively. All four Russian
jurisdictions scored in the fifth quintile this year.
Overall, the fact that almost half of the jurisdictions included in the survey this year have unattractive fourth and fifth quintile ratings, compared with less than one third ranked thus in 2013, indicates that investors are seeing fewer safe, low-risk havens for petroleum exploration and
development than previously. Certainly, the fact that the lions’ share of proved oil and gas reserves
are located in jurisdictions with fourth and fifth quintile ratings must be cause for some concern.
Commercial Environment Index Findings
Figure 5 ranks jurisdictions based on the five commercial environment index factors: fiscal terms,
taxation in general, trade barriers, quality of infrastructure, and labor availability and skills.
Based solely on the responses to these 5 factors, the 10 least attractive jurisdictions are Venezuela,
Bolivia, Russia—Eastern Siberia, Russia—Offshore Arctic, Democratic Republic of the Congo
(Kinshasa), Iran, Iraq, Russia—Offshore Sakhalin, Uzbekistan, and Quebec. But five other jurisdictions (Indonesia, Libya, Argentina—Chubut, Turkmenistan and Syria) also earned unattractive fifth quintile ratings according to this measure.
This year, Democratic Republic of the Congo (Kinshasa), Iraq, Russia—Offshore Sakhalin, and
Quebec displaced Ecuador, Kazakhstan, Russia—Other, and Argentina—Salta in this group. The
four jurisdictions that were displaced from the group of 10 worst jurisdictions on the Commercial
Environment Index rose to fourth quintile ratings.
Oklahoma ranks as the most commercially attractive jurisdiction again this year, followed closely
by Mississippi and Texas. The 10 other jurisdictions in the first quintile according to the Commercial Environment Index are Manitoba, Kansas, Arkansas, Saskatchewan, Wyoming, Alabama,
Louisiana, South Australia, North Dakota, and New Zealand. Canadian and US jurisdictions
dominate the first quintile with 9 US states and 2 Canadian provinces in this quintile. South Australia and New Zealand are the only jurisdictions in this group from outside of North America.
36
Fraser Institute Global Petroleum Survey, 2014
www.fraserinstitute.org
Figure 5: Commercial Environment Index
Oklahoma
Mississippi
Texas
Manitoba
Kansas
Arkansas
Saskatchewan
Wyoming
Alabama
Louisiana
South Australia
North Dakota
New Zealand
Ohio
Utah
Alberta
Netherlands—Offshore
New Mexico
Montana
Uruguay
Tasmania
Norway—North Sea
US Offshore—Gulf of Mexico
Denmark
Norway—Other Offshore (except North Sea)
UK—Other Offshore (except North Sea)
Netherlands—Onshore
Victoria
Michigan
Northern Territory
Colombia
Queensland
Ireland
Australia—Offshore
Seychelles
Peru
Romania
United Kingdom—North Sea
Chile
French Guiana
Qatar
Malta
Western Australia
Trinidad and Tobago
Germany
Japan
West Virginia
United Arab Emirates
Illinois
Jordan
Colorado
Thailand
Italy
Newfoundland & Labrador
Spain—Offshore
Morocco
New South Wales
Philippines
Ivory Coast
British Columbia
Pennsylvania
Poland
Faroe Islands
US Offshore—Alaska
Namibia
Cyprus
Suriname
Northwest Territories
Oman
Bahrain
Pakistan
Georgia
Yukon
Nova Scotia
Albania
Hungary
Mild deterrent to investment
Strong deterrent to
investment
Would not pursue
investment due to this factor
0
20
40
60
Fraser Institute Global Petroleum Survey, 2014
www.fraserinstitute.org
80
100
Alaska
Spain—Onshore
Ghana
Tunisia
Brunei
Ethiopia
Malaysia
New Brunswick
Vietnam
South Africa
Kenya
New York
California
France
Guyana
Bulgaria
Brazil—Onshore CC
Ukraine
US Offshore—Pacific
Israel
Somaliland
Republic of the Congo (Brazzaville)
Brazil—Offshore CC
Lebanon
Chad
Timor Gap (JPDA)
Yemen
Greenland
Niger
Turkey
Papua New Guinea
Equatorial Guinea
Azerbaijan
Gabon
Nigeria
Madagascar
Kuwait
Cameroon
Argentina—Salta
Mauritania
Argentina—Neuquen
India
Kazakhstan
China
Mozambique
Mexico
Greece
Cambodia
Myanmar
Kyrgyzstan
Guatemala
Argentina—Mendoza
Egypt
Brazil—Offshore presalt area PSC
Mali
Ecuador
Uganda
Tanzania
Bangladesh
South Sudan
Algeria
Argentina—Santa Cruz
Russia—Other
Angola
Argentina—Tierra del Fuego
Syria
Turkmenistan
Argentina—Chubut
Libya
Indonesia
Quebec
Uzbekistan
Russia—Offshore Sakhalin
Iraq
Iran
DRC (Kinshasa)
Russia—Offshore Arctic
Russia—Eastern Siberia
Bolivia
Venezuela
0
20
40
60
80
100
37
Regulatory Climate Index Results
The Regulatory Climate Index (figure 6) ranks jurisdictions according to investors’ perceptions of
the regulatory hurdles that are in place, including regulatory enforcement, regulatory inconsistency and duplication, environmental regulations, labor regulations, fairness and transparency of
the legal system, and the cost of regulatory compliance. Poor performance on regulatory issues is a
major reason why many jurisdictions are regarded as relatively unattractive for investment.
Based on the responses to these factors, the 10 least attractive jurisdictions on the Regulatory Climate Index are Italy, Spain—Onshore, Ecuador, Greece, US Offshore—Pacific, Russia—Eastern
Siberia, Spain—Offshore, Russia—Offshore Sakhalin, Argentina—Santa Cruz, and Argentina—Chubut. This is quite a different group from 2013. Only Russia—Eastern Siberia, Russia—Offshore Sakhalin, and Ecuador were in the bottom 10 in 2013. While Venezuela, Iran,
Russia—Offshore Arctic, Uzbekistan, Bolivia, Quebec, and Argentina—Salta are no longer among
the bottom 10, they remain in the fifth quintile, except for Uzbekistan and Quebec which now have
fourth quintile scores. Italy, Greece, US Offshore—Pacific, and Spain—Offshore all dropped from
the fourth quintile in 2013 to the bottom 10 this year. Spain—Onshore suffered the largest
drop—from the third quintile in 2013 to the second worst performing jurisdiction in 2014.
Argentina—Santa Cruz dropped into the fifth quintile and among the group of 10 worst performers according to the Regulatory Climate Index from a fourth quintile placement in 2013. Argentina—Chubut was in the fifth quintile last year but lost further ground and is now among the 10
least attractive jurisdictions on this measure.
In addition to the Regulatory Climate Index’s 10 worst jurisdictions and those mentioned above,
undesirable fifth quintile ratings for their regulatory climates were also awarded to Russia—Other,
Indonesia, California, Kazakhstan, Uganda, and France.
At the other end of the scale, the 10 most attractive jurisdictions on the Regulatory Climate Index
this year are Oklahoma, Mississippi, Arkansas, North Dakota, Saskatchewan, Kansas, Alabama,
Manitoba, Texas, and Utah. The list is similar to last year’s with the exception of Botswana, which
was not included based on its response rate, and the Faroe Islands, which dropped just into the second quintile this year. The two newcomers to the top 10 grouping this year are Alabama and Utah.
All 10 most attractive jurisdictions achieved first quintile ratings on the Regulatory Climate Index.
No other jurisdictions have first quintile regulatory climate scores.
Geopolitical Risk Index
The Geopolitical Risk Index focuses on political risk and on the security of personnel and physical
assets. As figure 7 indicates, 16 jurisdictions (Syria, Venezuela, Iraq, South Sudan, Egypt, Libya,
Democratic Republic of the Congo (Kinshasa), Lebanon, Kyrgyzstan, Mali, Somaliland, Iran,
Papua New Guinea, Pakistan, Ukraine, and Turkmenistan) scored in the fifth quintile this year on
38
Fraser Institute Global Petroleum Survey, 2014
www.fraserinstitute.org
Figure 6: Regulatory Climate Index
Oklahoma
Mississippi
Arkansas
North Dakota
Saskatchewan
Kansas
Alabama
Manitoba
Texas
Utah
Faroe Islands
Wyoming
Netherlands—Offshore
Chile
Ohio
Guyana
Suriname
Louisiana
United Arab Emirates
French Guiana
Montana
Namibia
Uruguay
Jordan
New Zealand
Malta
Oman
Denmark
Alberta
Seychelles
Netherlands—Onshore
New Mexico
Qatar
Morocco
Ireland
South Australia
West Virginia
Michigan
Norway—Other Offshore (except North…
Newfoundland & Labrador
United Kingdom—North Sea
Trinidad and Tobago
United Kingdom—Other Offshore…
Greenland
Illinois
Norway—North Sea
Bahrain
Northern Territory
Ivory Coast
Kenya
Mauritania
Philippines
Brunei
Ghana
Georgia
Cyprus
Australia—Offshore
Japan
Western Australia
Madagascar
Victoria
Northwest Territories
New Brunswick
Yukon
Malaysia
Germany
Poland
Mozambique
Romania
Thailand
Chad
Tasmania
Nova Scotia
Pennsylvania
Vietnam
British Columbia
0
Mild deterrent to investment
Strong deterrent to
investment
Would not pursue
investment due to this factor
20
40
60
80
Fraser Institute Global Petroleum Survey, 2014
www.fraserinstitute.org
100
Queensland
US Offshore—Gulf of Mexico
Colombia
Somaliland
Turkey
Alaska
Gabon
Republic of the Congo (Brazzaville)
Brazil—Offshore CC
Pakistan
Israel
Cameroon
Yemen
Brazil—Onshore CC
Angola
Colorado
Papua New Guinea
Tunisia
US Offshore—Alaska
Azerbaijan
Democratic Republic of the Congo (Kinshasa)
Equatorial Guinea
Guatemala
Timor Gap (JPDA)
South Sudan
Peru
Kyrgyzstan
Myanmar
Syria
Cambodia
Bangladesh
Niger
Lebanon
Ethiopia
Nigeria
Uzbekistan
Turkmenistan
South Africa
Hungary
Brazil—Offshore presalt area PSC
Kuwait
Albania
Libya
Mexico
New South Wales
Iraq
China
Algeria
Mali
India
Argentina—Neuquen
New York
Ukraine
Quebec
Tanzania
Argentina—Mendoza
Bulgaria
Egypt
Argentina—Tierra del Fuego
France
Argentina—Salta
Uganda
Kazakhstan
California
Iran
Indonesia
Bolivia
Venezuela
Russia—Offshore Arctic
Russia—Other
Argentina—Chubut
Argentina—Santa Cruz
Russia—Offshore Sakhalin
Spain—Offshore
Russia—Eastern Siberia
US Offshore—Pacific
Greece
Ecuador
Spain—Onshore
Italy
0
20
40
60
80
100
39
this measure. This compares with 18 jurisdictions with fifth quintile Geopolitical Risk Index scores
in 2013.
Four jurisdictions saw their scores on this index drop into the fifth quintile this year. The greatest
drop by far was Turkmenistan whose score deteriorated drastically from a very low (and therefore
commendable) third quintile value in 2013. The Democratic Republic of the Congo (Kinshasa),
Ukraine, and Lebanon all dropped into the fifth quintile range this year from the fourth last year.
On the other hand, Ecuador, Nigeria, Bolivia, Yemen, Algeria, and Chad improved their
geopolitical risk ratings sufficiently to lift their scores from the fifth quintile to the fourth.
A relatively high percentage of the negative responses for some jurisdictions on the political stability and security issue questions indicate that respondents simply “would not pursue investment”
in those jurisdictions due to this factor. Those jurisdictions for which the survey responses used in
the evaluations contained large percentages (greater than 25 percent of the total) of this most negative type of response this year are Syria (47 percent), Libya (41 percent), Venezuela (38 percent),
South Sudan (29 percent), and Yemen (26 percent). Iran and Iraq also attracted relatively high percentages of this type.
Potential for Improvement
In this year’s survey, respondents were again asked, “How much do you think oil and gas exploration and development in each of the jurisdictions with which you are familiar might increase if a
full and complete transition to ‘Best Practices’ in relation to the main drivers of investment decisions—such as royalties, environmental regulations, cost of regulatory compliance, profit repatriation, a fair and transparent legal system, and security of personnel and assets—were to occur?”
Respondents were asked to answer the question for each jurisdiction with which they are familiar
by selecting from one of five possible responses: 1) Not at all; 2) Only slightly; 3) 20 to 50 percent; 4)
50 to 100 percent; and 5) More than 100 percent.
The results (figure 8) indicate that a relatively large percentage (30 percent or more) of respondents believe that exploration and development could increase by more than 100 percent in Lebanon, Rus sia—Off shore Arc tic, Iran, Argen tina—Mendoza, Ven e zuela, Uzbekistan,
Argentina—Neuquén, Turkmenistan, Niger, and Kyrgyzstan if best practices were adopted. Combining all the responses that indicate that best practices could increase exploration and development by at least 20 percent (i.e., the type 3, 4, and 5 responses) shows that survey respondents
believe that activity could potentially be boosted by the greatest percentage in Russia—Offshore
Sakhalin, Ukraine, Mexico, Argentina—Chubut, Madagascar, Kazakhstan, Russia—Eastern Siberia, Lebanon, Russia—Offshore Arctic, and Iran. Moreover, as figure 8 indicates, the adoption of
best practices would likely lead to greater upstream investment in many other jurisdictions as well.
40
Fraser Institute Global Petroleum Survey, 2014
www.fraserinstitute.org
Figure 7: Geopolitical Risk Index
Norway—Other Offshore (except North Sea)
Netherlands—Offshore
Netherlands—Onshore
Faroe Islands
Tasmania
South Australia
Northern Territory
Mississippi
Alabama
Saskatchewan
Manitoba
Norway—North Sea
Arkansas
Western Australia
Chile
Oklahoma
Alberta
Australia—Offshore
North Dakota
Denmark
Utah
Kansas
New Zealand
Texas
Wyoming
Seychelles
Victoria
Louisiana
Alaska
Queensland
Germany
Oman
West Virginia
Montana
UK—Other Offshore (except North Sea)
Ohio
United Kingdom—North Sea
New Mexico
Ireland
Michigan
Brunei
British Columbia
Uruguay
Pennsylvania
Newfoundland & Labrador
United Arab Emirates
Japan
Greenland
Yukon
Namibia
French Guiana
US Offshore—Alaska
New Brunswick
Illinois
Nova Scotia
Qatar
Spain—Onshore
Northwest Territories
Trinidad and Tobago
New South Wales
US Offshore—Gulf of Mexico
Vietnam
Suriname
Malta
Ghana
Spain—Offshore
Guyana
Malaysia
US Offshore—Pacific
New York
Brazil—Offshore CC
Timor Gap (JPDA)
Poland
Colorado
France
California
Quebec
Brazil—Offshore presalt area PSC
Hungary
Peru
Israel
Romania
Greece
Brazil—Onshore CC
India
Kuwait
Morocco
China
Kazakhstan
Bulgaria
Cyprus
Colombia
Mozambique
Argentina—Tierra del Fuego
Jordan
Bahrain
Ivory Coast
Russia—Offshore Sakhalin
Italy
Tunisia
Cameroon
Angola
Russia—Other
Albania
Argentina—Mendoza
Gabon
Azerbaijan
Philippines
Argentina—Salta
Uzbekistan
Georgia
Argentina—Neuquen
Bangladesh
Ethiopia
Republic of the Congo (Brazzaville)
Niger
Turkey
Russia—Eastern Siberia
Mexico
South Africa
Cambodia
Indonesia
Kenya
Uganda
Myanmar
Argentina—Santa Cruz
Equatorial Guinea
Thailand
Argentina—Chubut
Chad
Tanzania
Guatemala
Mauritania
Russia—Offshore Arctic
Madagascar
Algeria
Yemen
Bolivia
Nigeria
Ecuador
Turkmenistan
Ukraine
Pakistan
Papua New Guinea
Iran
Somaliland
Mali
Kyrgyzstan
Lebanon
Democratic Republic of the Congo (Kinshasa)
Libya
Egypt
South Sudan
Iraq
Venezuela
Syria
Mild deterrent to investment
Strong deterrent to investment
Would not pursue investment due
to this factor
0
20
40
60
Fraser Institute Global Petroleum Survey, 2014
www.fraserinstitute.org
80
100
0
20
40
60
80
100
41
Figure 8: Transition to Best Practices
Faroe Islands
Yukon
Netherlands—Offshore
Norway—Other Offshore (except…
Saskatchewan
Arkansas
Norway—North Sea
United Kingdom—North Sea
Denmark
Seychelles
Northwest Territories
Utah
Oklahoma
Netherlands—Onshore
New Zealand
Victoria
Manitoba
North Dakota
Texas
Japan
New Brunswick
South Australia
UK—Other Offshore (except North Sea)
Wyoming
Western Australia
Australia—Offshore
New Mexico
Alberta
Oman
Tasmania
Ohio
Qatar
Alaska
Montana
Louisiana
Illinois
Nova Scotia
Mississippi
Morocco
Queensland
Ireland
Pennsylvania
Kansas
British Columbia
Colorado
Newfoundland & Labrador
Suriname
French Guiana
Jordan
Bahrain
Greenland
Alabama
Namibia
Timor Gap (JPDA)
Germany
Ivory Coast
Hungary
United Arab Emirates
Guyana
US Offshore—Alaska
Israel
US Offshore—Gulf of Mexico
New South Wales
Northern Territory
Brunei
Michigan
Poland
West Virginia
Thailand
Trinidad and Tobago
Ghana
Malaysia
Chile
Azerbaijan
US Offshore—Pacific
Tunisia
0%
42
Bulgaria
Guatemala
Mauritania
Kenya
Gabon
Kyrgyzstan
California
Vietnam
Philippines
Equatorial Guinea
Quebec
Chad
Spain—Offshore
Brazil—Onshore CC
Uruguay
New York
Cameroon
Malta
Romania
Argentina—Salta
Albania
Brazil—Offshore CC
China
Italy
Republic of the Congo (Brazzaville)
DRC (Kinshasa)
Mali
Turkey
Greece
Brazil—Offshore presalt area PSC
Colombia
Mozambique
Ethiopia
Cyprus
Bangladesh
Peru
France
Angola
Russia—Other
Argentina—Tierra del Fuego
Kuwait
South Africa
Algeria
Papua New Guinea
Myanmar
South Sudan
Niger
Turkmenistan
Uganda
Cambodia
Argentina—Neuquen
Uzbekistan
Georgia
Venezuela
Iraq
Ecuador
Bolivia
Indonesia
Somaliland
Spain—Onshore
Syria
Nigeria
Pakistan
India
Argentina—Mendoza
Argentina—Santa Cruz
Yemen
Tanzania
Libya
Egypt
Iran
Russia—Offshore Arctic
Lebanon
Russia—Eastern Siberia
Kazakhstan
Madagascar
Argentina—Chubut
Mexico
Ukraine
Russia—Offshore Sakhalin
20-50 percent
50-100 percent
More than 100 percent
20%
40%
60%
80%
100%
0%
20%
40%
60%
80%
100%
Fraser Institute Global Petroleum Survey, 2014
www.fraserinstitute.org
Results by Continental Region
North America
Compared to other regions of the world, many jurisdictions in Canada and the United States are
rated as relatively attractive for upstream investment.
Canada
Table 5 summarizes this year’s shifts in the relative attractiveness of Canadian jurisdictions compared with 2013. Readers are reminded that these rankings are based on the factors in the Policy
Perception Index only, and do not factor in the respective jurisdictions’ proved oil and gas reserves
or their petroleum resource potential. As in 2010, 2011, 2012, and 2013, Manitoba and Saskatchewan are again the top 2 Canadian jurisdictions. Saskatchewan maintained its position atop the
Canadian Policy Perception Index rankings, and achieved a slightly lower score this year than last.
However, Manitoba also received lower percentages of negative scores overall and a greater
improvement in its score than Saskatchewan. This resulted in Manitoba moving up a bit on the
Policy Perception Index scale to rank 5th overall (of 156) compared with 9th (of 157) in 2013. Saskatchewan is again 3rd overall (of 156). Saskatchewan and Manitoba were the only jurisdictions in
Canada to achieve improved PPI scores in 2014 compared with 2013.
Figure 9 illustrates the relative performance of the Canadian jurisdictions in the 2014 survey.
According to the Policy Perception Index measure, Saskatchewan is the most attractive Canadian
Table 5: Rankings of Canadian Jurisdictions for 2014 and their Policy Perception
Index Scores
Jurisdiction
2014
Rank
2013
Score
Rank
Score
Saskatchewan
1
10.29
1
11.43
Manitoba
2
11.51
2
16.87
Alberta
3
26.57
3
24.47
Newfoundland & Labrador
4
39.06
4
26.43
Nova Scotia
5
48.96
5
27.52
British Columbia
6
49.60
7
35.55
New Brunswick
7
51.04
9
49.94
Yukon
8
52.59
6
31.99
Northwest Territories
9
53.12
8
40.84
10
79.47
10
77.11
Quebec
Fraser Institute Global Petroleum Survey, 2014
www.fraserinstitute.org
43
Figure 9: Policy Perception Index—Canada
Mild deterrent to investment
Saskatchewan
Strong deterrent to investment
Manitoba
Would not pursue investment due to this factor
Alberta
Newfoundland & Labrador
Nova Scotia
British Columbia
New Brunswick
Yukon
Northwest Territories
Quebec
0
10
20
30
40
50
60
70
80
90
100
jurisdiction for upstream petroleum investment. At the other end of the scale, Quebec stands out
as the Canadian jurisdiction posing the greatest barriers to investment.
Canada had 10 jurisdictions in the 2014 survey but only two, Saskatchewan and Manitoba,
achieved commendable first quintile rankings. As in 2013, Alberta and Newfoundland & Labrador
have second quintile ratings. However, Nova Scotia, British Columbia, and Yukon slipped into the
third quintile this year, joining New Brunswick and the Northwest Territories among the jurisdictions with PPI scores in the 40.0 to 59.9 range. Once again, the outlier is Quebec with a fourth
quintile rating.
Quebec fell from 101st (of 147) in 2012 to 141st (of 157) in 2013. Although that province’s overall
rank improved slightly in 2014 to 133rd (of 156), it is still clearly regarded as unattractive for
upstream petroleum exploration investment compared to other Canadian jurisdictions. Quebec’s
Policy Perception Index score deteriorated from 77.1 to 79.5, putting Quebec just marginally
above the fifth quintile. Its decline is due to poorer results with regard to trade barriers (38 percent)10; regulatory duplication and inconsistencies (15 percent); and taxation in general (14
percent).
10
44
The numbers in brackets show the difference between the total percentage of responses which
indicate that a particular factor is a deterrent to investment (i.e., the combined responses of types
“3. Is a mild deterrent to investment,” “4. Is a strong deterrent to investment,” and “5. Would not
pursue exploration investment in this region due to this factor”) from 2013 to 2014.
Fraser Institute Global Petroleum Survey, 2014
www.fraserinstitute.org
British Columbia dropped in the Policy Perception Index ranking from 47th (of 157) in 2013 to
62nd (of 156) this year as a consequence of poorer (i.e. higher) scores on the survey questions pertaining to regulatory enforcement uncertainty (22 percent), taxation in general (20 percent), and
environmental regulations (20 percent).
The Northwest Territories slipped from a high third quintile placement in 2013 (score 40.8) to the
mid to low third quintile (score 53.1) and dropped 11 spots in the overall ranking to 72nd (of 156)
in 2014. Driving this shift were significant increases in factors related to regulatory enforcement
uncertainty (30 percent), trade barriers (22 percent), and environmental regulations (17 percent).
Alberta’s ranking rose slightly this year, moving from 19th (of 157) to 16th (of 156), in spite of realizing a slightly poorer Policy Perception Index score. Nova Scotia saw the largest decline in Canada
this year; it moved down 31 spots from 30th place (of 157) in 2013 to 61st (of 156) in 2014. This
reflects a 21-point increase in Nova Scotia’s PPI score, from 27.5 in 2013 to 49. The factors driving
this shift appear to be increases in regulatory enforcement uncertainty (32 percent), disputed land
claims (28 percent), and regulatory duplication and inconsistencies (23 percent). Newfoundland
& Labrador remained in the second quintile despite seeing its PPI score decrease by roughly 13
points, from 26.4 to 39.1 in 2014. The greatest driver of this shift was uncertainty regarding labor
regulations and employment agreements (35 percent).
New Brunswick has the greatest increase in ranking amongst the Canadian jurisdictions, moving
from 81st (of 157) in 2013 to 63rd (of 156) in 2014. This improvement occurred despite a reduction of 1.1 points in the PPI score. However, with the deterioration that occurred in other provinces, New Brunswick now ranks 7th (of 10) in Canada for attractiveness for exploration and
development investment compared with 9th in 2013. In the past, New Brunswick’s and Quebec’s
rankings both likely suffered as a result of policies and proposed regulations regarding the potential implementation of hydraulic fracking to recover natural gas from shale formations.
Respondents’ comments about various provinces ranged from complimentary to critical. The
comments in the following section have been edited for length, grammar and spelling, to retain
confidentiality, and to clarify meanings.
Alberta
“Took over 1 year to get regulatory approval for a minor tie-in for natural gas gathering system.”
“Introduction of the ‘moratorium’ on shallow Steam-Assisted Gravity Drainage
(SAGD) projects in Dec 2013 completely derailed our equity offering and has put our
company on a shaky footing.”
Fraser Institute Global Petroleum Survey, 2014
www.fraserinstitute.org
45
British Columbia
“Wanting to charge royalties for oil and gas being transported by pipeline from another
province—unprecedented, can never be done. This is making investment in Western
Canada difficult since there is no way to move hydrocarbons offshore. This is slowing
down industry by many billions of dollars per year.”
Saskatchewan
“Tax and royalty holiday on incentive volumes for horizontal development wells.”
“Simplicity, transparency, and support for prudent industrial development.”
“Horizontal well royalty holiday—spurred additional investment.”
Quebec
“Arbitrary decisions and unreasonable delays pertaining to the provision of required
authorizations, permits, etc., by the Ministry of Natural Resources which regulates oil
& gas activities—has been the situation since 2011.”
The United States
Twenty-four US jurisdictions were included in the 2014 survey and sufficient responses were
received to allow us to rank all of them.
Oklahoma is again the most attractive US and global jurisdiction, followed by Mississippi. Five
other US jurisdictions also remain in the first quintile this year: Arkansas, Alabama, Kansas, Texas,
and North Dakota. In addition, Wyoming achieved a first quintile score, bringing the total number in this group to eight compared with seven in 2013 (figure 10).
Only eight US jurisdictions are in the second quintile group this year compared with 10 in 2013.
The seven states which were also in this group in 2013—Utah, Louisiana, Ohio, Montana, New
Mexico, Illinois, and West Virginia—have been joined by Michigan, which moved up from the 3rd
quintile. Michigan’s much improved overall ranking, from 62nd position (of 157) last year to 30th
(of 156) in 2014 is the result of improvements in several factors addressed in the survey: labor regulations and employment agreements (-21 percent), uncertainty regarding protected areas (-19
percent), and quality of the geological database (-18 percent). Utah also significantly improved its
Policy Perception Index rank this year, moving from 32nd (of 157) in 2013 to 12th (of 156) in 2014
to lead the group of US jurisdictions with second quintile status. This is due to significantly
improved scores with regard to uncertainty regarding environmental regulations (-24 percent),
labor availability and skills (-17 percent), and the cost of regulatory compliance (-16 percent).
46
Fraser Institute Global Petroleum Survey, 2014
www.fraserinstitute.org
Pennsylvania and the US Gulf of Mexico both slipped into the 3rd quintile grouping from the second while, as noted above, Wyoming moved up to the first quintile. West Virginia’s Policy Perception Index score deteriorated from 25.9 in 2013 to 37.6 this year. Increases in taxation in general
(27 percent) and quality of infrastructure (22 percent) greatly contributed to the state’s weaker
performance, which caused it to drop from 4th place (of 10) in the 2nd quintile group to last (of 8).
There are five US jurisdictions in the third quintile this year compared with six in 2013. Colorado,
Alaska, and US Offshore—Alaska repeated the 3rd quintile performances that they attained in 2013
and were joined by the US Offshore—Gulf of Mexico and Pennsylvania. The latter two both
dropped from the second quintile. Michigan moved up to the second quintile, while both California and New York slipped into the fourth quintile.
The deterioration in the US Offshore—Gulf of Mexico’s score and overall rank (from 41st of 157)
to 48th (of 156) resulted, in part, from poorer marks in relation to the uncertainty regarding political stability and legal system fairness.
Colorado’s PPI score deteriorated for the second consecutive year, by almost 10 points in 2014
alone, largely as a result of increased negative sentiment with regard to uncertainty concerning
environmental regulation (15 percent), trade barriers (15 percent), and taxation in general (15
Figure 10: Policy Perception Index—United States
Oklahoma
Mild deterrent to investment
Mississippi
Arkansas
Strong deterrent to investment
Alabama
Would not pursue investment due to this factor
Kansas
Texas
North Dakota
Wyoming
Utah
Louisiana
Ohio
Montana
New Mexico
Michigan
Illinois
West Virginia
US Offshore—Gulf of Mexico
Pennsylvania
Colorado
Alaska
US Offshore—Alaska
New York
California
US Offshore—Pacific
0
10
20
Fraser Institute Global Petroleum Survey, 2014
www.fraserinstitute.org
30
40
50
60
70
80
90
100
47
percent). The state now sits in the middle of the third quintile instead of near the top. However, its
overall rank (in 66th spot) is unchanged from a year ago.
Last year’s only US jurisdiction with a relatively poor fourth quintile score, New York State, has
been joined this year by California and the US Offshore—Pacific. Although New York’s score deteriorated slightly, it move up in the global standings to 92nd place (of 156) from 119th position (of
157) in 2013 because many jurisdictions, especially in the Middle East and Africa, were the object
of much greater downgrading.
California’s score worsened by 11.7 points this year, pulling the state down to the fourth quintile
from the third. The deterioration in the state’s attractiveness for investment is largely the consequence of poorer scores for several factors: the quality of infrastructure (25 percent), legal system
fairness (15 percent), and disputed land claims (14 percent). The US Offshore—Pacific was also
subject to a significant drop in the PPI score. This pulled the jurisdiction down to an overall rank of
123rd (of 156) compared with 100th place in 2013. Contributing to this lower score were diminished performances for taxation in general (42 percent), regulatory enforcement uncertainty (36
percent), and disputed land claims (21 percent).
Three US jurisdictions (West Virginia, California, and US—Offshore Pacific) saw their Policy Perception Index scores deteriorate (i.e., increase) by more than 10 points this year from 2013. Colorado also fared relatively poorly, registering an increase in its score of 9.9. The jurisdiction with the
greatest improvement was Michigan, which benefitted from a favourable 7.9 point change in its
score.
Survey participants’ comments on a number of American jurisdictions are presented below. Comments in have been edited for length, grammar and spelling, to retain confidentiality, and to clarify
meanings.
Alaska
“Alaska provides financial support for exploration and production expenditures to encourage exploration for new reserves.”
California
“Local government cherry-picking regulations between local and state levels to fit their
need.”
“The Bay Area Air Quality Management Agency had the authority to shut in production from fields because of compressor exhaust emissions.”
“California protected lizards holding up establishing well sites.”
48
Fraser Institute Global Petroleum Survey, 2014
www.fraserinstitute.org
Colorado
“Continued layering of new regulations and negative uncertainty in the ability to reliably conduct oil and gas operations.”
“Ballot initiatives against fracking and increased setbacks. Increased regulatory requirements on air monitoring. Initiatives to take additional lands prospective for oil and gas
[and turn them] into roadless, non-surface occupancy, and wildlife preserves.”
“Short, transparent, and established procedure to get drilling permits.”
Kansas
“Fish and Wildlife Service (FWS) listed the lesser prairie chicken as a threatened species
causing great uncertainty in future operations.”
“Encourages mineral development without onerous regulations.”
Louisiana
“Numerous unfounded lawsuits by a number of agencies that have oversight of oil and
gas permits that are contradictory to policies of the past. These reinterpretations have
caused a number of operators to leave this market.”
Montana
“New tax burden greater than profit.”
New Mexico
“EPA—the state is unable to convey what is required to comply with the clean air regulations.”
“Onerous revision of open pit rules.”
New York
“Will not allow unconventional well completions.”
“Bans on fracking and misinformation affecting economic development and state energy self-sufficiency.”
Fraser Institute Global Petroleum Survey, 2014
www.fraserinstitute.org
49
Pennsylvania
“Indecision on severance taxes and impact fees and the amount of each causes
uncertainties in economic evaluations.”
Texas
“Put a 10 year hiatus on production taxes on unconventional production.”
“Right to Work State.”
“For a regulatory body, the Texas Railroad Commission is fairly efficient in getting permits and does not have an anti-development bias.”
Utah
“Uintah County: Providing upgraded infrastructure to assist in new oil sand and shale
development.”
Wyoming
“Large areas cannot be developed due to ‘cultural’ considerations.”
Oceania
In the survey Oceania is composed of 15 jurisdictions.11 These are the six Australian states, the
Northern Territory, and the Australian Offshore (both of which fall under Australian federal jurisdiction), the Timor Gap Joint Petroleum Development Area (JPDA), New Zealand, Brunei,
Malaysia, the Philippines, Papua New Guinea, and Indonesia.
As figure 11 illustrates, the results for this region fall into four distinct categories. Again this year,
none of the Oceania jurisdictions achieved first quintile scores. There now are only five jurisdictions in the region with second quintile scores compared with eight a year ago. These are New Zealand and the Aus tra lian juris dic tions of South Aus tra lia, the North ern Ter ri tory,
Australia—Offshore, and Tasmania, all of which were also in the second quintile group in 2013.
New Zealand, now the most attractive jurisdiction for investment in this region, is the only one of
the five with an improved score. New Zealand’s performance was boosted by diminished concern
with regard to disputed land claims (-14 percent), regulatory duplication and inconsistencies (-12
percent), and regulatory enforcement (-12 percent).
11
50
East Timor was dropped this year because of an insufficient number of responses.
Fraser Institute Global Petroleum Survey, 2014
www.fraserinstitute.org
Figure 11: Policy Perception Index—Oceania
New Zealand
Mild deterrent to investment
South Australia
Strong deterrent to investment
Northern Territory
Would not pursue investment due to this factor
Australia—Offshore
Tasmania
Victoria
Western Australia
Queensland
Brunei
Malaysia
Philippines
New South Wales
Timor Gap (JPDA)
Papua New Guinea
Indonesia
0
10
20
30
40
50
60
70
80
90
100
This year there are six Oceania jurisdictions with third quintile scores compared with four in 2013:
Victoria, Western Australia, Brunei, Queensland, Malaysia, and Philippines. The first three of
these dropped into the third quintile range after achieving second quintile scores in 2013. Brunei
experienced the largest deterioration among the Oceania jurisdictions this year as the country’s
Policy Perception Index score rose from 35.8 in 2013 to 46.4. Contributing to this drop was the
poor performance in the cost of regulatory compliance (19.3 percent), uncertainty regarding disputed land claims (16 percent), and political stability (15 percent), relative to last year.
This year’s three-jurisdiction, fourth-quintile contingent (New South Wales, Papua New Guinea,
and Timor Gap (JPDA)) numbers one fewer jurisdiction than a year ago. New South Wales
dropped into the fourth quintile from the third because of poorer marks for trade barriers (24 percent), the cost of regulatory compliance (17 percent), and labor regulations (17 percent). Indonesia, which ranked in the fourth quintile in 2013, is now in fifth quintile as the result of increased
negative sentiment with respect to political stability (23 percent), uncertainty about regulatory
enforcement (15 percent), and fiscal terms pertaining to the petroleum industry (14 percent). East
Timor, also in the fourth quintile in 2013, could not be included in this year’s assessment because
the number of responses for that jurisdiction was too low.
Fraser Institute Global Petroleum Survey, 2014
www.fraserinstitute.org
51
Figure 12: Policy Perception Index Scores for Australian Jurisdictions
2010-2014
70
New South Wales
Northern Territory
Queensland
60
South Australia
Policy Percetion Index Score
Tasmania
Victoria
50
Western Australia
Australia—Offshore
40
30
20
10
2010
2011
2012
2013
2014
The fact that an Australian jurisdiction (New South Wales) is now positioned with an undesirable
fourth quintile grade comes as somewhat of a surprise, even though New South Wales’ marks have
been worsening since 2010. As figure 12 illustrates, PPI scores have been rising not only in that
state, but in all eight of the Australian jurisdictions in recent years. Whereas four Australian states
and the Northern Territory all ranked in the prestigious first quintile in 2010, no Australian jurisdiction has scored that well since. Now, in 2014, four of the eight Australian jurisdictions have
scores in the third or fourth quintile ranges. This suggests that Australia is being regarded as a
much less attractive region for investment than it was as recently as three or four years ago.
Respondents offered both positive and negative comments about conditions in the jurisdictions
that we surveyed in the Oceanic region. The comments in the following section have been edited
for length, grammar and spelling, to retain confidentiality, and to clarify meanings.
New South Wales
“The Coal Seam Gas explorer Metgasco recently had a license suspended for ‘failure to
undertake appropriate community consultation.’ The well was a conventional gas well
52
Fraser Institute Global Petroleum Survey, 2014
www.fraserinstitute.org
which was not going to undertake fracking operations. Despite this fact, the Office of
Coal Seam Gas Regulation, recently established as a sub-group of the E&P administration offices of government, suspended the license one day before [drilling began at] the
well in response to 1000+ people protesting outside the drill site preventing equipment
from reaching the site. This despite the fact that the landowner was very supportive of
the drilling and [the project had undergone] an 18-month community consultation
process. The matter is now before the courts and the press is publishing both sides of
an increasingly polarized argument. This in a state that imports (domestically) 95 percent
of its gas from other states. This single action wiped 50 percent of the value from the
company on the share market. NSW and Victoria are currently rife with examples of reactive, inconsistent political policy setting in relation to E&P activity in their states.”
Northern Territory
“The Northern Territory Prime Minister and ‘Minerals Minister’ have both gone on record in the press (domestically and overseas) saying that the Territory is ‘Open for Business’ and is actively fast-tracking E&P permit applications, license conversion,
prioritizing water usage clarity, and engaging native peoples regarding the potential benefits of E&P on the Territory. This is probably a matter of mindset rather than specific policy, but that can often make even a mediocre policy an attractive quality when clearly
enforced and committed to. When both are in question, that is when alarms go off.”
South Australia
“One stop shop; granting of grouping of licences and obligations.”
“Government established a ‘full service’ support office to assist with hydrocarbon exploration.”
Western Australia
“Unfortunately a State agreement in the Canning Basin overrode the relinquishment
provisions of the Petroleum and Geothermal Energy Resources Act 1967 (WA)
(PGERA67) and allowed warehousing of huge areas of acreage—permit terms were extended significantly. Thus relinquishment acreage was delayed in being made available
for industry to subsequently bid on.”
Indonesia
“New tax regulations applied to land and buildings (both onshore and offshore).”
“Restricting the age of foreign specialist technical workers to 30-55 years of age, with a
maximum of 4 years in the country.”
Fraser Institute Global Petroleum Survey, 2014
www.fraserinstitute.org
53
“Newly tightened restrictive work permit regulations by SKK Migas mean that investors cannot control their investments internally.”
“Application of a Land & Building Tax on offshore contract areas signed post-2011.
This tax is levied on both surface area of contract area and subsurface area.”
“Allows the oil companies the priority to recover value-added tax at production.”
Malaysia
“Unilateral implementation of tax incentives and improved profit splits by government.”
New Zealand
“A re-write of the petroleum regulations introduced a much more rigid and prescriptive regime which is preventing companies from being able to negotiate changes to permit work programs, particularly around being able to defer drilling decisions for
pragmatic reasons. In several instances, this has led to companies surrendering permits
after having spent large sums of money in the exploration phase.”
“The modern New Zealand block offer is now about giving potential investors choice.
Where once the government tried to define what blocks were put up for competitive
bidding, the government is now defining large areas and asking potential permit holders to draw their block boundaries using a graticular [i.e., a predetermined line of latitude and longitude that is used to divide tracts of land into graticular sections]
approach similar to the UK North Sea.”
“Moving from 5-year to 15-year multi-client data confidentiality duration in 2013 has
dramatically increased seismic data acquisition in New Zealand’s waters.”
Philippines
“A foreign company, as operator for a joint venture, was unable to proceed to drill an
exploration well due to the non-issuance of a local (provincial level) permit. Eventually
the company withdrew from the joint venture.”
54
Fraser Institute Global Petroleum Survey, 2014
www.fraserinstitute.org
Europe
Figure 13 shows the rankings for European jurisdictions based on this year’s Policy Perception
Index scores. We were able to evaluate 30 jurisdictions in this region, the same number as in 2013.
This year only 10 European jurisdictions rated in the attractive first and second quintiles compared with 14 in 2013 and 18 (of 28) in 2012. As in 2013, the Netherlands—Offshore is the only
European jurisdiction with a first quintile score.
The nine jurisdictions with second quintile scores were also in that range in 2013. Led by Denmark,
the group also includes Netherlands—Onshore, the Faroe Islands, Ireland, Malta, the two jurisdictions from the United Kingdom (UK), and the two Norwegian jurisdictions. Although still in the
second quintile, both UK jurisdictions realized poorer scores this year. UK—North Sea dropped
from 16th place (of 157) in 2013 to 31st (of 156) in 2014, largely as a result of increased concern
regarding the cost of regulatory compliance (26 percent), quality of infrastructure (14 percent),
Figure 13: Policy Perception Index—Europe
Netherlands—Offshore
Mild deterrent to investment
Denmark
Netherlands—Onshore
Strong deterrent to investment
Faroe Islands
Would not pursue investment due to this factor
Norway—North Sea
Norway—Other Offshore (except North Sea)
Ireland
United Kingdom—North Sea
Malta
United Kingdom—Other Offshore (except North Sea)
Germany
Romania
Poland
Cyprus
Greenland
Georgia
Hungary
Albania
Spain—Offshore
France
Turkey
Bulgaria
Italy
Spain—Onshore
Ukraine
Greece
Russia—Other
Russia—Offshore Sakhalin
Russia—Offshore Arctic
Russia—Eastern Siberia
0
Fraser Institute Global Petroleum Survey, 2014
www.fraserinstitute.org
20
40
60
80
100
55
and uncertainty of regulatory enforcement (14 percent). UK—Offshore Other dropped 10 spots
in the rankings to 33 (of 156) this year for some of the same reasons. However, concern with
respect to labor regulations and employment agreements (14 percent) also had a large impact on
that jurisdiction’s poorer showing.
Six European jurisdictions (Germany, Romania, Poland, Cyprus, Greenland, and Georgia) are in
the third quintile this year, down from nine in 2013. Romania is the success story of the group, lowering its PPI score ten points to 45.1, and consequently improving its rank from 97th (of 157) in
2013 to 54th (of 156) in 2014. Romania benefited from diminished negative sentiment with regards
to trade barriers (-21 percent) and protected areas (-20 percent). Romania, Cyprus, and Greenland were also in the third quintile in 2013. However, Germany, Poland, and Georgia are new to
this range this year, having slipped from their second quintile standing last year.
Ten European jurisdictions are in the fourth quintile this year, up substantially from only four last
year. This marked change resulted from six jurisdictions (Hungary, Albania, Spain—Offshore,
France, Italy and Spain—Onshore) slipping from third to fourth quintile standing, while Turkey
dropped from the second to the fourth quintile. Bulgaria, Ukraine, and Greece, along with Russia—Offshore Sakhalin, which slipped from the fourth quintile to the fifth this year, also had lacklustre fourth quintile results in 2013.
Italy dropped from a 2013 PPI score of 54.2 to a 2014 score of 72.4, and was rated the worst jurisdiction in the world on the Regulatory Climate Index. This shift was driven by its poor performance
on the cost of regulatory compliance (52 percent), regulatory duplication and inconsistencies (30
percent), and uncertainty regarding protected areas (27 percent). The percentage of the most negative “would not pursue investment due to this factor” type of response increased sharply in Italy
this year and was greater than in any of the other European jurisdictions. This could be related to
concerns over the reduction of the area where offshore production and exploration can take place,
which came into effect in late 2013.
Both Spain—Onshore and Spain—Offshore dropped in rank by 54 and 26 positions, respectively.
Both jurisdictions performed much worse on disputed land claims (Onshore by 51 percent and
Offshore by 41 percent) and on the cost of regulatory compliance (Onshore by 46 percent and Offshore by 48 percent) than in 2013. Turkey is another jurisdiction that performed much more
poorly this year. Labor regulations (43 percent), quality of infrastructure (37 percent) and security
uncertainty (36 percent) contributed to Turkey’s drop in the overall PPI ranking from 48th place (of
157) to 102nd spot (of 156). Turkey also suffered because numerous other investment drivers also
increased by 20 or more percentage points.
All four Russian jurisdictions—Offshore Arctic, Eastern Siberia, Offshore Sakhalin, and
Other—are in the fifth quintile this year and two of them, Offshore Arctic and Eastern Siberia, are
amongst the 10 least attractive jurisdictions worldwide for upstream petroleum exploration
investment.
56
Fraser Institute Global Petroleum Survey, 2014
www.fraserinstitute.org
The comments received for European jurisdictions range from positive to critical. Some are provided below; comments have been edited for length, grammar and spelling, to retain confidentiality, and to clarify meanings.
France
“Applying officially for an onshore exploration permit in France, the application being
accepted, and a few days later the application annulled.”
Germany
“In Germany, renewal of an onshore exploration license became entangled with local
politics and was, practically, rejected.”
“‘Moratorium on fracking’ declared by federal state politicians not in line with current
(federal) mining law and not based on any scientific proof, just populism.”
“Regulatory process not streamlined and industry data kept confidential.”
“[There was a] complete lack of due process in Germany’s decision to place an unofficial moratorium on fracking. The eagerness of the politicians to resist new unconventional exploration activity resulted in shutting-in Germany’s well-established
production from tight gas development that has been stimulating wells for over 40
years.”
Greece
“Lack of clarity on commercial terms.”
Ireland
“Very inefficient process around planning permission for project construction. Multiple agency overlap adds an additional level of complexity to this process.”
“Inefficient/convoluted planning processes.”
“Open door access and knowledgeable regulatory authorities.”
Italy
“Banning offshore drilling in the wake of [the Deepwater Horizon blowout].”
“Moribund licensing systems.”
Fraser Institute Global Petroleum Survey, 2014
www.fraserinstitute.org
57
“Regional Emilio-Romagna authority banned drilling with no legal or scientific basis.
Central government did nothing.”
Norway (general comment)
“Reduction of important tax allowance (uplift) was a surprise decision by government,
unilaterally without any form of normal hearing process and consultation with industry.”
“This has been in place for some years: the Norwegian approach to incentivizing exploration through its fiscal system is exemplary.”
“78 percent tax relief on exploration activities—even without production.
Romania
“Starting January 1, 2014, a tax on construction would be due by Romanian taxpayers.
The tax is computed by applying a 1.5 percent rate to the value of construction owned
by taxpayers on December 31 of the previous year.”
“Uncertainty about taxation with proposed increases. Have license from the country
but unable to obtain local permits to conduct exploratory work on the license.
Spain—Onshore
“All permits to drill are in place. All environmental requirements have been met. Government has sat on final approval for over two years without explanation.”
Spain—Offshore
“The drilling of two offshore exploration wells, some 60 kilometers east of the Canary
Islands, is suffering from a strong local resistance campaign. The state environmental
authorities recently approved the project. However, the regional authorities and the local community remains strongly opposed, claiming that tourism would be dramatically
affected by exploration activities and by any hydrocarbon production in the area. These
Canary exploration permits have a long history. The permits were awarded in January
2002. In 2003 a legal process was initiated by local authorities of the Canary Islands
against the national government. The permits were revoked by a judgment of the Spanish Supreme Court for not having expressly determined the environmental protection
measures. The permits were suspended on February 2004. One month later, a change
of the national government took place in Spain. Then, the process was kept on hold for
8 years. On November 2011, a reverse political change took place in the national government and on March 2012, a new Royal Decree was published amending the former
text and reactivating the exploration permits, i.e., 10 years after the first awarding.”
58
Fraser Institute Global Petroleum Survey, 2014
www.fraserinstitute.org
“Long (18+ months), bureaucratic, politically motivated environmental approval process with zero flexibility.”
Turkey
“From a business perspective, lack of required approvals for operations; regulatory
body allows E&P companies the ability to operate efficiently. Examples: no approvals
necessary for drilling (companies provide a spudding statement), well completions,
fracking, or seismic acquisition.”
Ukraine
“Decision to increase taxes and royalties to 45-55 percent on production for balance of
2014 during the political and security crisis.”
United Kingdom
“Supplementary tax on oil companies.”
“UK was slow to address concerns on shale gas. Scotland has been slower than England
and needs to openly and strongly address the concerns and promote the benefits.”
“The regulator is slow and reluctant to exercise its powers to determine the terms and
conditions for use of third party infrastructure.”
Asia
Figure 14 ranks the 14 Asian jurisdictions that were evaluated this year according to their Policy
Perception Index values. This is the same group of countries as in 2013.
As has been the case since the survey began in 2007, none of the Asian jurisdictions achieved first
quintile status in 2014. Japan, again with a second quintile rating, now sits alone in the 20.0 to 39.9
PPI score range because Thailand, which had a second quintile score in 2013, has slipped into the
third quintile.
Japan is still rated by petroleum explorers and developers as the most attractive jurisdiction for
investment in Asia, although its attractiveness for investment improved slightly in this year’s survey as evidenced by a Policy Perception Index score near the upper bounds of the second quintile
(38.0 this year from 39.1 in 2013). This small improvement is due in part to declines in negative
sentiment with regard to taxation (-31 percent), regulatory enforcement (-29 percent), and protected areas (-23 percent). These changes were sufficient to boost Japan to 42nd place (of 156) in the
Fraser Institute Global Petroleum Survey, 2014
www.fraserinstitute.org
59
overall ranking from 57th place (of 157) a year ago. Moreover, the gap between Japan and second
place Thailand (among the Asian jurisdictions) has widened considerably; Thailand’s score
increased by more than 14 points mainly due to greater negative sentiment expressed by survey
respondents over political stability (37 percent), security (27 percent), and disputed land claims
(24 percent).
Thailand shares its third quintile status with Vietnam. Three Asian jurisdictions that enjoyed
third-quintile status in 2013—Pakistan, Azerbaijan, and China—have all drifted downwards into
the less desirable fourth quintile range this year. Five jurisdictions that only achieved fourth
quintile status in 2013 received more or less similar fourth quintile ratings this year: India,
Kazakhstan, Myanmar, Bangladesh, and Cambodia.
The percentage of the most negative “would not pursue investment due to this factor” type of
response increased sharply in Azerbaijan this year and is greater than in any of the other Asian
jurisdictions. This change is related to concerns over labor regulations and employment agreements (24 percent), uncertainty in regulatory enforcement (22 percent), and uncertainty concerning environmental regulations (22 percent). China’s less attractive score compared with a year ago
resulted largely from increased uneasiness over both regulatory and geopolitical factors, particu-
Figure 14: Policy Perception Index—Asia
Mild deterrent to investment
Japan
Strong deterrent to investment
Thailand
Would not pursue investment due to this factor
Vietnam
Pakistan
Azerbaijan
India
China
Kazakhstan
Myanmar
Bangladesh
Cambodia
Kyrgyzstan
Turkmenistan
Uzbekistan
0
60
10
20
30
40
50
60
70
80
90
100
Fraser Institute Global Petroleum Survey, 2014
www.fraserinstitute.org
larly disputed land claims (32 percent), the cost of regulatory compliance (29 percent), and political stability (26 percent).
Vietnam scored more favorably overall this year, which moved the country up to 75th place (of
156) in the overall ranking from 99th spot (of 157) last year. The improvement was a result of less
negative sentiment with regard to infrastructure quality (-19 percent), labor availability and skills
(-17 percent), and the cost of regulatory compliance (-13 percent).
Turkmenistan bore the brunt of the most significant deterioration in Policy Perception Index
scores among the Asian jurisdictions and dropped into the fifth quintile from the fourth, and into
the group of 10 least attractive jurisdictions in the world as a consequence. This unflattering result
is mostly due to increased concern over the country’s geopolitical risk. Uzbekistan remains the
least attractive jurisdiction in the region, and one of the 10 least attractive jurisdictions overall,
along with Kyrgyzstan. The scores for both of those jurisdictions were also in the unattractive fifth
quintile range in 2013.
Below are some of the comments received about the petroleum industry investment environment
in various Asian countries. The comments in the following section have been edited for length,
grammar and spelling, to retain confidentiality, and to clarify meanings.
China
“The foreign company has to cooperate with the state-owned company to enter the
market. The whole bureaucratic procedure will take a long time and numerous negotiations with the central and local governments.”
“The Chinese government provides great tax benefits for foreign investors if they enter
the market with the state-owned companies.”
India
“Gas pricing regime as per the PSCs signed by the government; gas should be sold by
the operator to the highest bidder after an arms-length discovery process. Unfortunately, in practice, it has become a case of the government of India ‘allocating’ gas to
buyers and determining the price.”
“Imposition of ‘missile testing ranges’ over many petroleum exploration licenses.”
India makes life tough for E&P companies—at least some. The gas pricing situation in
India is a mess. And the plan to move to the new Open Acreage Licensing Policy
(OALP) is also a bit of a mess—and some are pushing for an altogether new fiscal system where there is a gross production split.”
Fraser Institute Global Petroleum Survey, 2014
www.fraserinstitute.org
61
Myanmar
“2013 offshore bidding round—lack of clarity on rules of engagement and application
of fiscal system, in particular, the relationship between the fiscal system and
concessions available within the Corporate Income Tax (CIT) system. No geoscience data
worth talking about available to bidders. Final decision on winning bids not transparent.”
“Myanmar modified the terms of their recent offshore bid round to include an initial
‘study period.’ This period, which was up to two years, resulted in a large number of
applicants for the blocks, including most of the major oil companies, and set off a
round of intense exploration activity that will undoubtedly result in significant oil and
gas discoveries.”
“Government delayed the bid round to make it more transparent.”
“Fair terms for new PSCs.”
Pakistan
“Policies should be market-based, competitive, and consistent.”
Thailand
“The political situation and conditions are not stable.”
Vietnam
“Oil and gas policy is generally favorable to the investor.”
62
Fraser Institute Global Petroleum Survey, 2014
www.fraserinstitute.org
Figure 15: Policy Perception Index—Africa
Mild deterrent to investment
Namibia
Strong deterrent to investment
Seychelles
Would not pursue investment due to this factor
Ivory Coast
Ghana
Kenya
Republic of the Congo (Brazzaville)
Mozambique
Gabon
South Africa
Chad
Ethiopia
Cameroon
Equatorial Guinea
Madagascar
Angola
Nigeria
Niger
Somaliland
Tanzania
Uganda
South Sudan
Mali
Democratic Republic of the Congo (Kinshasa)
0
10
20
30
40
50
60
70
80
90
100
Africa
This year, as in 2013, we grouped the Middle East and African jurisdictions this way: 1) the Middle
East and North Africa (MENA), and 2) the remainder of Africa (Africa). This change (from a simply Middle East /All of Africa split) was made to be more consistent with the regional reporting and
statistics produced by international organizations. This section examines the survey results with
respect to Africa (as redefined). The MENA region follows the Africa region.
Figure 15 compares the attractiveness of the 23 African jurisdictions that were assessed. Namibia
and Seychelles, the two top ranked African jurisdictions this year, are in the second quintile. 12
Namibia has surpassed Seychelles to become the most attractive jurisdiction in Africa, largely as
the result of investors’ reduced concern with regard to regulatory uncertainty in Namibia and the
perceived strengthening of the commercial environment there.
12
Botswana, which headed the second quintile group in 2013, could not be assessed this year due to a
lack of responses.
Fraser Institute Global Petroleum Survey, 2014
www.fraserinstitute.org
63
Only three African jurisdictions are in the third quintile this year compared with 11 in 2013: Ivory
Coast, Ghana, and Kenya. An improved PPI score moved the Ivory Coast to the top of the group,
up from a less attractive rating in the third quintile in 2013. The improvement is related to fewer
negative responses with regard to security (-28 percent), the availability of labor (-27 percent), and
labor regulations (-15 percent).
Thirteen African jurisdictions now rank in the fourth quintile compared with only nine in 2013.
Mozambique, Gabon, South Africa, Ethiopia, Cameroon, and Equatorial Guinea all dropped into
the fourth quintile from the third in 2013. South Africa, in particular, has a much worse PPI score
this year. At 67.4, it is approximately 22 points greater than last year, largely driven by considerably
poorer grades on regulatory duplication and inconsistencies (30 percent), protected areas (22 percent), and infrastructure quality (21 percent). Cameroon also saw a marked deterioration in a
number of its scores this year, especially in relation to regulatory enforcement (27 percent), disputed land claims (24 percent), and the quality of its geological database (20 percent).
Africa’s presence in the undesirable fifth quintile group of jurisdictions grew to five countries this
year from only one a year ago. Tanzania, Uganda, Mali, and the Democratic Republic of the Congo
(Kinshasa), have joined South Sudan in this group. Tanzania and Mali both absorbed staggering
increases of more than 30 points in their scores and, as a consequence, tumbled all the way from the
much more favourable third quintile group. Tanzania fell from 89th overall (of 157) in 2013 to
139th (of 156) in 2014 because of increased concern regarding protected areas (46 percent), regulatory enforcement (41 percent), trade barriers (29 percent), and political stability (28 percent).
Mali’s drastic 35-point score deterioration, resulting in a drop in its ranking to 146th (of 156) from
83rd (of 157) in 2013, was largely caused by much greater negative sentiment over the cost of regulatory compliance (61 percent), trade barriers (50 percent), and taxation in general (40 percent).
However, Mali also lost considerable ground because of more than 20-point increases in the percentage of negative responses for other factors.
Uganda and the Democratic Republic of the Congo (Kinshasa), which now has the distinction of
being the least desirable country for investment in the African grouping (supplanting South
Sudan), both dropped into the fifth quintile from the fourth. Of the two, Uganda’s PPI score deteriorated the most, rising from 64.1 to 83.9, mainly because of uncertainty over regulatory enforcement
(36 percent), disputed land claims (33 percent), and the cost of regulatory compliance (31 percent).
Some of the respondents’ comments concerning various African jurisdictions are presented
below. These comments have been edited for length, grammar and spelling, to retain confidentiality, and to clarify meanings.
Angola
“Lack of flexibility of fiscal regime to attract investment in marginal fields.”
“Increased competitiveness and diversity of investors.”
64
Fraser Institute Global Petroleum Survey, 2014
www.fraserinstitute.org
Equatorial Guinea
“Dispute regarding interpretation and application of economic stability clauses in the
profit sharing contract.”
Gabon
“Denial that the law had been followed (which it was) and therefore demanded negotiation for the renewal of a license on new (unfavorable) terms.”
“New petroleum law obliges participation by state oil company and obliges state participation.”
Ivory Coast
“Pragmatic negotiation of profit sharing contract to bring more gas on stream.
Madagascar
“Madagascar changed the VAT regime applicable to oil and gas, leading to a 20 percent
increase in costs.”
Namibia
“Applying a 25 percent withholding tax (WHT) on specified services has the potential
to inflate supplier costs substantially. The list of specified services could be expanded to
include services to which the tax does not currently apply.”
Nigeria
“Nigerians have the right to organize associations without any limitations and without
any state regulation or intervention. This led to the formation of the Niger Delta
Group, which became involved in serious kidnapping activities.”
“The proposed Petroleum Industry Bill, which still has not been passed by the National
Assembly in spite of many years of discussion, poses some serious concerns for investment. The bill has gone through several iterations and revisions because of political and
interest group pressures. A number of versions have been introduced over the years in
the search for the right balance, particularly in terms of the fiscal terms, certainty of
tenure of licences and interests, etc.”
“Nigeria is known for low investment taxation policy and this encourages investment.”
Fraser Institute Global Petroleum Survey, 2014
www.fraserinstitute.org
65
South Africa
“Changes in legislation related to the Mineral and Petroleum Resources Development
Act (MPRDA) ‘one size fits all’ approach by the government, so that oil and gas are included with mining, require review to determine whether to invest (drill) after signature of a permit.”
Tanzania
“The new fiscal terms will prohibit future investment.”
The Middle East and North Africa (MENA)
The 18 Middle East and North African countries evaluated in this year’s survey are presented in figure 16, ranked according to their relative attractiveness for investment as measured by the Policy
Perception Index. Again this year, none of the region’s jurisdictions achieved first quintile Policy
Figure 16: Policy Perception Index—Middle East and North Africa
United Arab Emirates
Mild deterrent to investment
Qatar
Strong deterrent to investment
Oman
Would not pursue investment due to this factor
Jordan
Morocco
Bahrain
Tunisia
Mauritania
Israel
Kuwait
Yemen
Lebanon
Algeria
Egypt
Syria
Libya
Iraq
Iran
0
66
10
20
30
40
50
60
70
80
90
100
Fraser Institute Global Petroleum Survey, 2014
www.fraserinstitute.org
Perception Index scores. Only four MENA countries (United Arab Emirates, Qatar, Oman, and
Jordan) achieved second quintile rankings in the 2014 survey compared with seven in 2013. Qatar
has been displaced from first place in the region by the United Arab Emirates, mainly because
Qatar was hit by a 10 point increase its the PPI score, raising it to 34.9. Qatar’s grade for the legal
system factor (up 34 percent) is largely to blame for this, but worse scores compared to a year ago
on labor availability (19 percent) and trade barriers (18 percent) also took their toll. The United
Arab Emirates benefitted from an improved score on environmental regulation (-9 percent). Jordan was able to retain its position in this quintile after moving up to the second quintile in 2013.
Compared with four jurisdictions a year ago, only two—Morocco and Bahrain—have third
quintile scores this year. Both countries slipped into this range from the mid-second-quintile
range as the result of less favorable PPI scores than in 2013.
Seven MENA jurisdictions scored in the fourth quintile this year compared with five in 2013.
These include Kuwait (which fell all the way from the second quintile), Tunisia, Mauritania, Israel,
and Lebanon (which slipped down from the third quintile), along with repeat fourth quintile performers Yemen and Algeria.
Kuwait’s remarkable 27.0 point deterioration in its PPI score and drop in the standings to 95th
position (of 156) from 60th (of 157) is mainly the result of labor regulations and employment
agreements (63 percent), trade barriers (55 percent), and concerns regarding the legal system (52
percent). Lebanon’s worse PPI score (up 21.4 points from a year ago) was due in part to greater
percentages of negative responses for its legal system performance (38 percent), political stability
(35 percent), and regulatory duplication (33 percent). Survey respondents also downgraded Tunisia and Israel considerably.
Iran and Iraq still rank amongst the 10 most unattractive jurisdictions in the survey with overall
scores in the least attractive fifth quintile. This year they have been joined by Egypt, Syria, and
Libya, all of which have slipped from fourth quartile ratings. The deterioration was greatest for
Egypt, whose PPI score rose by 20.5 points, due to poorer marks for taxation in general (24 percent) and its legal system (22 percent). Egypt, Syria, and Libya all now rank among the worst six
jurisdictions in the world according to the Geopolitical Risk Index measure. In fact, Syria is now
the least attractive jurisdiction in the world on that measure.
Respondents provided the following comments regarding conditions in various countries in the
Middle East and North Africa. The comments have been edited for length, grammar and spelling,
to retain confidentiality, and to clarify meanings.
Egypt
“After the oil price collapse in the late 90s, Egypt introduced a low price cap for domestic gas for upstream producers of $2.65/mmbtu. This cap has not changed for most of
the contracts (even though it might not increase enough to generate new develop-
Fraser Institute Global Petroleum Survey, 2014
www.fraserinstitute.org
67
ments), and as a result, even the discovered new gas resources are being left undeveloped since it is not economically feasible to investors to develop most of the fields
(offshore, most of the resources in deep water) and Egypt, which once was a substantial
LNG exporter, now needs to IMPORT gas at a substantial cost since it was not ready to
offer and pay the appropriate gas price for its own energy, resulting in power blackouts
and other macroeconomic consequences.
Iraq
“Failure by Kurdistan and the central government to reach agreement on oil and gas
laws and regulations is creating uncertainty for investors.”
Kuwait
“Having all decisions related to the petroleum industry approved by the Parliament,
which has no understanding of the petroleum, political, economic intricacies.”
Libya
“Forced renegotiation of valid contracts to much worse financial terms; arbitrarily invoked new taxes and regulations.”
Tunisia
“Negotiation with local authorities/ labor/operating companies and strong support
from the central authority to support such negotiation and to implement the result of
such negotiation is needed.”
Latin America and the Caribbean
Figure 17 presents the Latin American and Caribbean jurisdictions that were evaluated this year on
the Policy Perception Index. Again this year, Brazil was broken into three distinct regions: Onshore
Concession Contracts (CCs), Offshore Concession Contracts (CCs), and Offshore Pre-salt13 Area
Profit Sharing Contracts (PSCs). Argentina was broken down into six petroleum-producing provinces: Chubut, Mendoza, Neuquen, Salta, Santa Cruz, and Tierra del Fuego. Twenty-two jurisdictions were ranked compared with 21 in 2013; Mexico was included for the first time this year.
13
68
The “pre-salt” concession refers to the abundant petroleum reserves recently discovered in deep water
locations beneath layers of salt in the Santos Basin approximately 200 kilometres off the coast of
Brazil, south of Rio de Janeiro, and east of Sao Paulo.
Fraser Institute Global Petroleum Survey, 2014
www.fraserinstitute.org
Figure 17: Policy Perception Index—Latin America and the Caribbean
Uruguay
Mild deterrent to investment
Chile
Strong deterrent to investment
French Guiana
Would not pursue investment due to this factor
Suriname
Trinidad and Tobago
Guyana
Colombia
Brazil—Offshore CC
Peru
Brazil—Onshore CC
Brazil—Offshore presalt area PSC
Argentina—Neuquen
Argentina—Salta
Argentina—Tierra del Fuego
Argentina—Mendoza
Mexico
Guatemala
Argentina—Santa Cruz
Argentina—Chubut
Ecuador
Bolivia
Venezuela
0
10
20
30
40
50
60
70
80
90
100
Five countries in Latin America and the Caribbean Basin rank in the second quintile this year compared with only two (Chile and Trinidad & Tobago) a year ago. The newcomers are Uruguay,
French Guiana, and Suriname. Uruguay and Suriname both moved up from the third quintile
while French Guiana rose all the way from a low fourth quintile rating.
Uruguay is now the most attractive jurisdiction in the region: a 12.6 point improvement in its PPI
score lifted the country from 63rd place (of 157) to 21st place (of 156). Improved marks on the labor
regulations (-33 percent), quality of infrastructure (-31 percent), and regulatory duplication (-29
percent) had the greatest effect on these results were largely responsible for the improvement. Suriname experienced a similar improvement but its gains were mainly driven by respondents’ more
positive perspectives regarding political stability (-30 percent) and regulatory consistency (-26
percent). French Guiana14 exhibited the greatest improvement of all the jurisdictions in the survey
this year. The country’s PPI score fell by roughly 29 points. Improvements were observed with
respect to 13 of 15 investment-driver categories, with the greatest improvements being in the case
14
These results may not be as robust as others because French Guiana only received between 5 and 9
responses.
Fraser Institute Global Petroleum Survey, 2014
www.fraserinstitute.org
69
of taxation in general (-40 percent), trade barriers (-39 percent), and quality of the geological database (-38 percent). This resulted in French Guiana rising from 109th place (of 157) in 2013 to 27th
place (of 156) in 2014.
There are only five third quintile jurisdictions in this region this year instead of seven since, as
noted, two jurisdictions that were in this grouping in 2013 moved up to the second quintile. The
group leader, Guyana, rose from 90th place in the overall ranking to 51st as the result of an 11-point
improvement in its PPI score. This is attributable to improvements in uncertainty concerning
environmental regulations (-39 percent), improvements in labor regulations and employment
agreements (-28 percent), and a reduction of regulatory duplications and inconsistencies (-24 percent). Colombia received slightly poorer grades yet moved up a bit in the standings. Both
Brazil—Onshore Concession Contracts and Brazil—Offshore Concession Contracts have scores
in the third quintile again this year and in both cases the scores are quite similar to where they were
in 2013. However, with negative sentiment rising over many jurisdictions, these two Brazilian
jurisdictions substantially improved their rankings. Brazil—Offshore Concession Contracts
moved up 31 positions to 77th place and Brazil—Onshore Concession Contracts moved up 25
positions to a ranking of 80th. Peru made similar gains in spite of only a modest improvement in its
PPI score.
This year, seven jurisdictions in Latin America and the Caribbean fall into the fourth quintile,
compared with eight in 2013. Although three jurisdictions left the group, Mexico (new to the survey) and Argentina—Salta are in this category. The latter jurisdiction received a sufficiently
improved score to move up from the 5th quintile last year. In part this is due to reduced negative
sentiment over taxation in general (-30 percent), the legal system (-25 percent), and political stability (-19 percent). Three other Argentine provinces, Tierra del Fuego, Mendoza, and Neuquen,
along with the Brazil—Offshore Pre-salt PSC region, which resides at the top of the fourth quintile,
and Guatemala, at the bottom, are also in this group. Guatemala fell slightly, to 132th place overall
from 128th position because of increased concerns affecting both the regulatory climate and commercial environment. Mexico, which has not previously been ranked, came in at 125th (of 156).
Again this year, Venezuela, Bolivia, and Ecuador rank as the least attractive jurisdictions for investment in the region and world, Venezuela remaining the lowest ranked. All three countries,
together with Argentina—Santa Cruz and Chubut, which slipped from the fourth quintile, have
fifth quintile scores.
Respondents’ comments on jurisdictions in Latin American and the Caribbean Basin are provided
below and have been edited for length, clarity of meaning, grammar and spelling, and to remove
identifying information.
70
Fraser Institute Global Petroleum Survey, 2014
www.fraserinstitute.org
Argentina
“Control of gas prices, control and arbitrary decisions on who the buyers of gas production are, export taxes, all of that in Argentina since 2004.”
“Law on export of oil is an issue.”
“In my opinion, Argentina’s decree 1277 (federal level) was worse than the expropriation of shares from Repsol or the debt default in 2001. This decree ordered the creation
of a national hydrocarbon planning commission to oversee companies’ investment
plans, sanction them if they fall short and, in the most controversial aspect of the decree, periodically publish “reference prices for the sale of hydrocarbons and fuels,
which will allow [oil companies] to cover the production costs attributable to the activity as well as obtain a reasonable profit margin.”
“The Argentine government has changed several laws to expand the state’s intervention
in the upstream oil sector.”
Argentina & Venezuela
“Changes in royalties and expropriation of international oil company assets (e.g.
Repsol in Argentina and ExxonMobil in Venezuela).”
“Changes in foreign exchange policy in both countries have led to limitations or prohibitions of repatriation of profits. The import controls are a detriment to exploration
and project development using more efficient, advanced technologies and adding to
project costs.”
Brazil
“During Lula’s presidency, the terms of offshore contracts, especially those for the
promising pre-salt areas, were radically changed. The increased interference of government as with national policy and fiscal terms has inhibited foreign investment. One example of this is what happened in bidding for acreage in the Libra field; many
companies expressed interest but there was only one bid (by a consortium). Bad for all
parties.”
“The pre-salt regulations allow Petrobras to be sole operator of oil fields where licenses
haven’t been issued. This will increase government control over the energy industry
and reduce competition against Petroleo Brasileiro SA, the state-controlled producer.”
“Some equipment that is needed to develop ultra-deepwater fields is not available in
Brazil without imports. Brazil doesn’t have enough rigs to support local content requirement yet oil companies that fail to meet the requirements are subject to penalty.”
Fraser Institute Global Petroleum Survey, 2014
www.fraserinstitute.org
71
“The Brazilian Development Bank (BNDES) provides some financial assistance to the
oil and natural gas industry in order to promote the development of the entire industry
productive chain—development, production, refining, transportation and distribution.
Chile
“Petroleum contracts are awarded by a competitive public bidding process which is
very transparent.”
Colombia
“Long delays in environmental permitting for exploration and development wells.”
“The manner in which environmental policy has been administered for more than
three years now has been delaying the issuing of environmental licences for non-conventional oil and gas. While the Agencia Nacional de Hidrocarburos invited the companies to bid for non-conventional resources, and awarded some concessions, the
Ministry of Environment and the Environmental Agency has decided not to issue the
required environmental licenses on the basis of environmental uncertainties.”
“Positive changes to the high-price kick-in of additional compensation to the government for gas in deep and ultra-deepwater exploration and production, and the conversion rate of gas for the payment of royalties.”
French Guiana
“Moribund licensing system.”
Guatemala
“We were awarded a license in a public /competitive bid round but, one year later, are
still waiting for the government to issue the PSA.”
Mexico
“After 76 years, Mexico finally changed its Constitution to allow private investment in
its O&G sector. This was not a single area of opening, such has happened before. This
time, Mexico has opened up opportunities for foreign direct investment throughout
the value chain, which will enable a constant flow of investment for future years to
come.”
72
Fraser Institute Global Petroleum Survey, 2014
www.fraserinstitute.org
Peru
“Permits take over a year to acquire sometimes. Social problems also, but depends on
region. Peru has offshore, coast, and jungle regions, each with different problems.”
“Extension of Environmental Impact Assessment approval (2-4 years) and the creation
of Natural Protected Areas over oil and gas blocks granted to private investors present
challenges.”
Uruguay
“With little prospectivity, at least at the time of the initiation of the effort, clear rules,
government support, and positive economic parameters have allowed offshore and onshore exploration to take place.”
Venezuela
“Important barriers include:
(a) The foreign currency exchange controls which restrict repatriation and therefore
limit the influx of capital;
(b) Limitations on commercialization options and freedom in the case of oil and gas
extracted (monopoly in the purchase of production by Venezuela’s instrumentalities)
and material delinquency in payment for crude delivered;
(c) Abuse of control in the decision-making processes with regard to the Empresas
mixtas.”
“Apertura Petrolera was a policy executed by the Venezuelan government in 1990
which reduced the amount of income tax, reduced royalties for 7 years from production start, and simplified foreign oil investment in the Orinoco Oil Belt (Extra Heavy
Oil). The contracts that sustained the activities of the foreign investor were clear and
fair (accounting policies, repatriation, foreign investor could choose the employees, fair
participation in the shareholders decisions and Board decisions, no political pressure of
expropriation). Departures from this policy have limited investment.”
Overview
Our analysis of the 2014 petroleum survey results indicates that the extent of negative sentiment
over the factors driving petroleum investment decisions (disregarding the extent of proved oil and
gas reserve holdings) has increased in most world regions. In fact, as figure 18 illustrates, this year
the median PPI score increased in all of the world’s regions from what it was in 2013. The increases
were especially severe in the case of Africa (19 percent), Europe (32 percent) and MENA (33 per-
Fraser Institute Global Petroleum Survey, 2014
www.fraserinstitute.org
73
cent). In both Africa and MENA the median score has slipped into the fourth quintile from the
third. Canada’s median score in particular fared unfavorably (an increase of 66 percent) and is
now in the third quintile instead of the second.
The drop in the attractiveness of the Middle East and North Africa reflects less attractive scores on
the geopolitical risk factors in many jurisdictions. Negative sentiment in general appears to be rising in both Europe and Oceania. In the other regions where PPI scores deteriorated this year it is
too soon to determine whether or not the increases recorded this year constitute a trend.
Figure 18: Regional Median PPI Scores 2010-2014
80
Asia
70
Median Policy Perception Index Score
60
Africa
Latin America & Caribbean
50
Middle East & North Africa
40
Oceania
Canada
30
Europe
United States
20
10
0
2010
74
2011
2012
2013
2014
Fraser Institute Global Petroleum Survey, 2014
www.fraserinstitute.org
Optional Survey Questions
Optional Question One
Participants were asked, “For Canadian and US jurisdictions only, please indicate what percentage
of your crude oil (conventional and unconventional) is transported via the following single or
combined modes of transportation.” Their responses follow (see figure 19).
The figure shows the proportions of crude oil that are shipped using various transportation methods and combinations thereof. Survey respondents indicated that the companies they work for or
are directly involved with ship slightly less than half (46.0 percent) of the crude oil that they produce by pipeline alone, and 34.7 percent of crude oil by road alone. Transportation by rail alone
was used in only 6.6 percent of the cases. The combined mode of transportation most often used
was pipeline and barge, which was used to transport crude oil in 8.9 percent of the cases reported.
Given the attention surrounding the increasing use of rail to transport crude oil—with rail filling
in the gap arising from inadequate pipeline capacity—a relatively low percentage of crude oil is
being transported by rail alone, at least in the case of the companies with which the respondents are
familiar. Even when factoring in combined methods of transport that use rail, only 12.1 percent of
companies’ crude oil shipments use railway transport in some capacity. The transportation
method used most often, according to survey respondents, is pipeline. When factoring in combined methods, 59.0 percent of crude oil is transported through pipelines at some point. It is also
Figure 19: Transportation of Crude Oil in Canada and the US by Method
Pipeline, Rail and Barge:
4.11
Rail and Barge:
1.48
Pipeline and Barge:
8.89
Road (alone):
34.72
Rail (alone):
6.55
Pipeline (alone):
45.96
0
5
10
15
20
25
30
35
40
45
50
Percentage of Respondents
Fraser Institute Global Petroleum Survey, 2014
www.fraserinstitute.org
75
perhaps of interest that 87.2 percent of oil is shipped using just one transportation method (rail,
pipeline, or road).
Collection of this data in future years will help to assess the extent to which railway transport and
intermodal forms of crude oil transportation (with and without rail) are changing within the
group of companies represented in the survey.
Optional Question Two
Participants were also asked “How do regulations and/or joint development/production requirements pertaining to state-owned petroleum companies (such as Ecopetrol, Gazprom, Petrobras)
influence your company’s investment decisions?” Possible responses were:
·
Facilitates and/or encourages investment,
·
Does not affect business operations nor deter investment,
·
Presents some challenges and/or mild deterrents to investment,
·
Cumbersome requirements present a strong deterrent to investment, and
·
Requirements make it almost impossible to work in this jurisdiction.
Figure 20 illustrates the percentages for the three types of negative responses.
Responses to this question were received for 70 jurisdictions.15 For 42 of them, the percentage of
negative responses of one or more of the three kinds was greater than 50 percent.
Ecuador, Bolivia, Iran, Russia—Offshore Sakhalin, and Venezuela rank as the five worst jurisdictions in which to invest based on the negative effects that state-owned petroleum companies are
indicated to have on investment decisions. In particular, in the case of Ecuador, Bolivia, and Venezuela, more than 35 percent of the respondents reported that requirements with respect to
state-owned companies in these jurisdictions make it almost impossible to work. In the two other
Russian frontier regions and Mexico, the shares of that strongest negative response were also particularly high (20 percent or more).
In 12 jurisdictions, at least 35 percent of respondents indicated that working with state-owned
companies poses a strong deterrent to investment because of cumbersome regulations and/or
joint development/production requirements. These are Iran, Venezuela, the four Russian regions,
Libya, Indonesia, Iraq, India, Angola, and Kazakhstan.
The following comments were received regarding state-owned oil companies. Comments have
been edited for length, grammar and spelling, to retain confidentiality, and to clarify meanings.
15
76
Only jurisdictions with more than 10 responses were included in the analysis.
Fraser Institute Global Petroleum Survey, 2014
www.fraserinstitute.org
Figure 20: How Regulations and Other Requirements Pertaining to State-owned
Petroleum Companies Affect Investment Decisions
United Kingdom—North Sea
Presents some challenges and/or mild deterrents to investment
United Kingdom—Other Offshore (except North Sea)
Netherlands—Offshore
Cumbersome requirements present a strong deterrent to investment
Germany
Denmark
Requirements make it almost impossible to work in this jurisdiction
Peru
Norway—North Sea
Philippines
Norway—Other Offshore (except North Sea)
Qatar
Pakistan
Chile
Namibia
United Arab Emirates
Oman
Colombia
Trinidad and Tobago
Thailand
Kenya
Romania
Mozambique
Ghana
Madagascar
Argentina—Santa Cruz
Brunei
Papua New Guinea
Morocco
Chad
Argentina—Neuquen
Myanmar
Yemen
Cambodia
Azerbaijan
Argentina—Mendoza
Ivory Coast
Uganda
Equatorial Guinea
Tunisia
India
Cameroon
Vietnam
South Sudan
Argentina—Chubut
Gabon
Nigeria
China
Malaysia
Brazil—Offshore CC
Algeria
Brazil—Offshore presalt area PSC
Kazakhstan
Iraq
Brazil—Onshore CC
Angola
Ukraine
Egypt
Russia—Offshore Arctic
Russia—Eastern Siberia
Bangladesh
Tanzania
Republic of the Congo (Brazzaville)
Indonesia
Libya
Russia—Other
Mexico
Venezuela
Russia—Offshore Sakhalin
Iran
Bolivia
Ecuador
0
10
20
30
40
50
Percent of Respondents
60
70
80
90
100
Petronas (Malaysia)
“Very supportive of investment and working through administrative issues—positive.
On the negative side, there are many levels of control exerted over operators, from operations to procurement. The latest initiative, the Contractor Compliance Index, appears to have good motives for encouraging best performance by monitoring activities;
however, it is cumbersome and ill-thought out by quite inexperienced people.”
PPL, OGDCL & GHPL (Pakistan)
“Unlike other state-owned companies, in Pakistan, all of the state-owned companies
are managed by their boards and run by highly professional management and staff.
They have a very good knowledge base and always provide constructive input in matters affecting the performance of multinational corporations (MNCs).”
Gabon Oil Company
“Took over a producing oil field that was producing 10,000 barrels per day (bpd) and
in one year damaged the field, infrastructure, and facilities to reduce output to less than
2,000 bpd production.”
Saudi Aramco
“Very tough contractual terms discourage world class companies to work there by excessive contractual unbalance in favour of the NOC [National Oil Company]. Once
under contract, an Offshore Support Vessel Owner is penalized more than it should be
as per the contract with very little ability to respond.”
Petro Peru
“Cumbersome processes and oversight of all your business without any transparency
on their part.”
Petrovietnam Investment and Development
Company (PIDC)
“Very difficult to work with. Highly politicized environment and little focus on the
business. Management and business development decisions with regard to joint ventures (empresas mixtas) most times have little to do with an international operator’s
aims and objectives.”
78
Fraser Institute Global Petroleum Survey, 2014
www.fraserinstitute.org
PGNiG (Poland)
“PGNiG is very bureaucratic and reasons for decisions are not transparent. They essentially force partners to use their affiliate service companies for most service work for
which they offer services at international rates but provide mediocre service in an isolated tender process.
Petrobras
“Largely dysfunctional in parts, in particular, downstream.”
TPAO (Turkey)
“A comment about TPAO in Turkey—although [I have] limited experience with
TPAO, in general, I would avoid trying to do business with them because of the business logic (or lack thereof) deployed by TPAO personnel. Typical mentality of NOCs
seems to be ‘this is my country: my way or the highway,’ lack of transparency, and unrealistic deal terms (pay 100 percent to earn 30 percent with some adjustment for cost
recovery.”
Fraser Institute Global Petroleum Survey, 2014
www.fraserinstitute.org
79
Additional Comments from the Petroleum Survey
Comments have been edited for length, grammar and spelling, to retain confidentiality, and to
clarify meanings.
Regulatory “horror stories” …
Canada
“Ban on leasing in caribou habitat in Alberta.”
“A combination of Canadian federal legislation (Investment Canada) and Alberta regulatory uncertainty has caused investment in the junior oil sands sector to dry up completely.”
“Excessively long approval times by the newly redesigned Alberta Energy Regulator.
What used to take 6 weeks takes 6 months or more—a definite deterrent to investment.”
USA
“The hostility of the Obama administration is without a doubt the greatest obstacle to
the upstream industry in the USA.”
“In Colorado there is a big push for local control of oil and gas activity. So instead of a
consistent set of regulations governed by the state Oil and Gas Commission, which is
staffed by experienced professionals, potentially every jurisdiction/city/county/etc. will
try to regulate activity without adequately trained regulators. Also, there is a major
push to ban or put a moratorium on all fracking operations at the city/county level and
statewide. As a principal partner in my company, I live and work in Colorado, but
chose not do business here. Colorado is slowly moving from oil friendly to oil hostile.”
“The Environmental Protection Agency (EPA) is requiring the oil and gas industry to
protect the Lesser Prairie Chicken habitat in Kansas, attempting to restrict the months
and hours of the day we can operate. At the same time, it is giving the landowner and
farmer exemption from this when these farmers of grain and corn have a major impact
on the habitat. [It is apparently] okay to levy a $75,000 fine for having a dead Prairie
Chicken on your lease, but not okay to fine or restrict the farmers who have a major
impact via plowing up the birds’ habitat 2-4 times per year.”
“New York’s delaying decisions to allow completions of unconventional gas wells for
over 10 years has cost the state billions in investments and jobs.”
80
Fraser Institute Global Petroleum Survey, 2014
www.fraserinstitute.org
Oceania
“In Indonesia, two years required to obtain approval of a field development plan by interfering regulator. Should have been in production by 2012; still has not started development funding yet.”
“We were awarded an exploration block by the Ministry of Petroleum and Natural Gas
in the Philippines, then informed by the Ministry of a local court injunction counterclaim by a domestic third party. Matter has been dragging for two years. Unable to
commence exploration activities.”
Europe
“In Ireland’s Corrib gas field development, the local planning process caused immense
delays and included the operator having to build an underground ‘channel tunnel,’ but
then, later, to back-fill it at enormous cost.”
“Spanish protected areas have random buffer zones that seem to be invented at will, including one set of islands where seismic can no longer be undertaken within 20 km; islands that used to be one of the Spanish Air Force’s major bombing ranges.”
Asia
“Chinese authorities have falsified map coordinates and failed to divulge the complete
listing of all exploratory wells in an area.”
“In Vietnam, the inability to negotiate a fair gas sales price has held up the development of a large offshore gas field for 10 years. Currently the field is being sold due to
price uncertainty and this will push development out even further. A slight increase in
the gas price by central authorities would set off a drilling campaign and boost the
Vietnamese economy.”
“In India our company was denied cost recovery for production that came in less than
forecast in its development plan.”
Middle East North Africa (MENA)
“The Israeli government changed its take on leases after the discovery of a significant
gas field. This was done by imposing a new tax on profits from gas fields.”
“In Yemen, the government is failing to honor a contractual cost recovery mechanism.”
Africa
“An oil field in Gabon was expropriated illegally for 12 months with use of force.”
Fraser Institute Global Petroleum Survey, 2014
www.fraserinstitute.org
81
“In Uganda the state is applying the capital gains tax to a licence in which the PSC provided exemption.”
Latin America and the Caribbean
“In Colombia we had a [well shut down] for extremely minor infractions, which
caused zero environmental impact and had valuable acreage removed from a block by
landowners setting up environmental reserves without a public hearing.”
“The expropriation of Repsol-YPF in Argentina has negatively impacted the flow of investment to the country.”
“In the case of Blocks III and IV in the Talara area of northwest Peru, Interoil had been
asking for a 10-year extension and was continuously being put off. Peru Petro couldn’t
(wouldn’t?) make a final decision as to what to do with the licenses once Interoil’s licenses expired in March 2014. Finally, it became so late, because Peru Petro did not do
its job, that an emergency one-year license had to be negotiated.”
Exemplary policies…
“New Zealand, Norway, Australia, UK, and the US: all these countries have established
an ‘open’ database where data past a certain point becomes available for virtually the
cost of copying. This goes a long way towards encouraging new exploration.”
“In Manitoba it takes less than 1 week to get approval for most drilling licenses.”
“North Dakota: Quality of publicly available geologic, engineering, and production data.”
“Texas has clearly defined rules regarding permitting, drilling, and completion. Excellent time in approving permits. The best of any area.”
“Malaysia introduced fiscal terms for the development of marginal fields. These previously sub-commercial fields attracted several new operating companies for appraisal
and development after more attractive terms were implemented. A government priority was to involve more local companies in these upstream ventures, whereby several
new players emerged.”
“Albania: straightforward PSC terms and strong support by all the authorities.”
“Malta: a pragmatic, clear, and simple approach to evaluating the environmental impact of a seismic survey and how to actually assist the licensee in smoothly conducting
the survey to minimize impact on the environment and other key stakeholders such as
fishing, fish farming, and tourism.”
82
Fraser Institute Global Petroleum Survey, 2014
www.fraserinstitute.org
“An exemplary policy initiative in Peru has been to grant oil companies tax stabilization contracts in order to provide certainty with regard to what oil companies have to
pay to the Peruvian Internal Revenue Service during an oil concession period.”
“Uruguay developed an energy policy with input from all political parties and the process for permit applications/awards is transparent. Oil companies are encouraged to assist in defining the scope of prospecting permits and contractual terms are reasonable.”
“Kuwait: opening their upstream opportunities through creative mechanisms, as in the
case of their offset program tool, Mubadala.”
Opportunities & challenges …
“The biggest challenge that faces the upstream petroleum industry is lack of infrastructure in pipelines, refineries, storage facilities, and LNG plants for importing countries.
How can these issues be resolved? Private sector investment either through mergers
and acquisitions or through equity funding can play an important role. But resource
nationalism in emerging resource endowed countries is hindering the inward flow of
investment needed to develop those resources.”
“The primary concern in many jurisdictions outside the US and Canada is political stability.”
“Regulatory and taxation environments have not been stable in many jurisdictions in
central and eastern Europe. Petroleum industry often demonized and blamed for all
the evils of mankind.”
“Costs are getting higher in Europe, service providers are of lower quality, permit time
longer, and politics is deterring investment nearly everywhere.”
“Peru is underexplored, with a lot of opportunities, but the government does not realize it. The Ministry of Energy and Mines generally does not understand the industry.
Too many permits are being issued in jungle areas where social issues and difficult logistics pose challenges.”
“With the energy revolution in North America—a consequence of the development of
the unconventional resources (oil sands, CBM, shale)—the whole game has changed.
This will bring a flow of opportunities, both in mature markets like Canada and the
US, but also in nearby countries such as Mexico and Colombia. This, however, is not a
done deal. Both countries need to do more to facilitate the investment in infrastructure
that will be needed to take advantage of the opportunities to come. In the case of Mexico, to realize its full potential, substantial issues like security—especially in oil-rich areas—have to be addressed.”
Fraser Institute Global Petroleum Survey, 2014
www.fraserinstitute.org
83
“The use of social media to exert influence far beyond the area of any potential impact
of a single company makes business planning almost impossible in many jurisdictions.
The cost of offshore E&P makes onshore areas with good infrastructure very attractive
to small companies, but the lack of recognition of the role of innovative small companies in exploration impacts negatively on overall exploration activity and results.”
“Affecting the investment climate in South America is the increasing promulgation of
the expansion of several unreasonable environmental regulations. Some governments
have been enacting laws that impose irrational environmental requirements onto oil
companies. In my opinion, it is necessary to work on establishing proper environmental standards that balance the required degree of environmental protection while fostering investment.”
“In terms of respecting foreign investors and obtaining the benefits of foreign expertise,
Malaysia is doing everything right while Indonesia is doing everything wrong. By one
estimate, over $5 billion per year in exploration investment has moved away from Indonesia to Malaysia. Indonesia could be producing over 1.5 MMbpd; instead production is 750,000 bpd and declining 10 percent per year.”
“In Africa there are massive differences in the investment climates of countries like
Cameroon, Nigeria, and Gabon that are adjacent to each other. The countries need to
understand that mid-size oil companies (100,000 to 200,000 bpd) will not invest in jurisdictions that have unreasonable regulations, unstable regimes, and are not supportive of investment and honoring contracts.”
“[There is a problem with] lack of global coordination over issues such as common acceptable environmental standards for hydrocarbons, managing the implications of nuclear blackout, and the petroleum industry’s role in economic development.”
“Many non-North American countries have state pipeline companies which by government rule, ruling, or law, are monopolies that lack expertise in infrastructure development, yet the countries have no other method for such development and politicians
fear third party developers as enemies of the state. This becomes an overwhelming barrier to midstream service development, since companies cannot sell products in the local market because of the monopoly position of government owned entities.”
Future expectations …
“Exploration is in decline. Rising costs result in larger companies with access to sustainable cash flow being considerably more advantaged in the exploration space than
start-ups, juniors, and smaller producers.”
“The current debate regarding the place of oil and gas in the world seems largely to be
one of have/have not. The proper placement of the argument is degree. As an industry
84
Fraser Institute Global Petroleum Survey, 2014
www.fraserinstitute.org
we are probably very near the collective diminishing returns point of below-ground energy sources (E&P, I mean). So long as there is sustained demand, we will continue to
have to tackle increasingly marginal projects and the current stock of investment opportunities (especially in my current jurisdiction in Australia) reflects this. There are
opportunities, but they are harder than ever to realize. Inconsistent views from voters
and politicians do not help this and are in aggregate generally making the difficult job
even harder. More tough times ahead.”
“Mexico’s upstream industry is about to be revolutionized due to a constitutional reform that was passed in December 2013, and implementing legislation that will be put
in effect very soon. Big opportunities for foreign investors.”
“Large-volume offshore developments will prosper: UK North Sea, Norway, Gulf of
Mexico, offshore Brazil, and offshore West Africa. Existing large-volume onshore developments will prosper: Saudi Arabia, Qatar, UAE, Kuwait, and Russia (latter to the
extent run by Russians themselves). The Straits of Hormuz will become more high risk
as the Iranians become more fractious and hostile (more so if they do in fact become a
nuclear armed state in 2013 or 2014 or 2015, and become even more fractious and hostile and unpredictable).”
“I think the upstream petroleum industry will continue to flourish as long as oil prices
don’t continue to drop, but the costs will grow as environmental policies get stricter
and the aboriginal communities living in or around the license areas become aware of
their negotiating power and keep increasing their demands to a breaking point.”
Fraser Institute Global Petroleum Survey, 2014
www.fraserinstitute.org
85
Single-factor Results
The rankings for the specific factors addressed by the 16 survey questions provide detailed information about each jurisdiction’s relative attractiveness for investment (see figures 21 through 36).
The results for each factor are illustrated by the rankings, and the complete dataset is available for
downloading. The jurisdictions with a relatively low proportion of negative scores appear near the
top of the rankings and are generally regarded as more attractive for upstream petroleum
investment.
The single-factor rankings are self-explanatory. However, we highlight some findings of particular
interest below.
Fiscal terms
According to the survey respondents (figure 21), fiscal terms pose the greatest obstacle to investment in Venezuela, Bolivia, the three Russian frontier regions, and Iran, all of which scored in the
fifth quintile on this question. These jurisdictions were closely followed by four jurisdictions with
particularly poor (i.e. high) fourth quintile scores: Syria, Russia—Other, Iraq, and Indonesia.
Amongst the Canadian and US jurisdictions, fiscal terms appear to be of most concern in Quebec,
New York, and California, as in 2013. In each of those three jurisdictions the scores for this factor
fall in the undesirable fourth quintile again this year.
Jurisdictions with the lowest percentages of negative responses on the fiscal terms question (all
with low (under 10) first quintile scores, which suggest that this issue is certainly not a cause for
concern) include Ethiopia, Mississippi, Oklahoma, Texas, Kansas, North Dakota, Saskatchewan,
Wyoming, Manitoba, Arkansas, Australia’s Northern Territory, New Zealand, Somaliland, and
Louisiana. Seventeen other jurisdictions also scored in the first quintile on this factor.
Uncertainty concerning environmental regulations
The 11 jurisdictions that have the worst scores this year with regard to uncertainty concerning
environmental regulations are Spain—Offshore, California, Spain—Onshore, New York, Quebec, US Offshore—Pacific, New South Wales, Italy, Peru, and Colorado and France (tied) (figure
23). Quebec, California, France, New York, the US Offshore—Pacific, and Spain—Offshore were
also in this group last year. Several of these jurisdictions including Quebec, France, and a number
of municipalities and counties in New York and Colorado, have moratoria on hydraulic
fracturing.
86
Fraser Institute Global Petroleum Survey, 2014
www.fraserinstitute.org
Concern about uncertainties surrounding environmental regulations is of least concern to survey
respondents in Mississippi, Kansas, Oklahoma, North Dakota, Guyana, Mauritania, and Suriname, all with first quintile grades.
Interpretation and administration of regulations
The 10 jurisdictions with the worst scores on the question regarding the interpretation and consistency in the administration and enforcement of regulations this year are US Offshore—Pacific,
Ethiopia, Russia—Other, Russia—Eastern Siberia, Venezuela, Iran, Turkmenistan, Uzbekistan,
Uganda, and Russia—Offshore Arctic. Venezuela and the same three Russian jurisdictions were
also in this group in 2013. Ecuador, Indonesia, and Russia—Offshore Sakhalin also scored in the
fifth quintile on this factor.
US—Offshore Pacific moved from the third quintile in 2013 to become the least attractive jurisdiction in the world based on this measure. Surprisingly, Uganda and Ethiopia also dropped all the
way from third quintile results a year ago. A staggering 55 jurisdictions (of 156) have unflattering
fourth and fifth quintile scores on this question this year compared with only 39 (of 157) a year ago
(figure 24).
The 10 most attractive jurisdictions on this issue this year are Faroe Islands, Oklahoma, Mississippi, Arkansas, Alabama, Texas, North Dakota, Suriname, Saskatchewan, and Japan, all of which
achieved first quintile scores. Both Suriname and Japan exhibited considerable improvement on
this question from their 2013 scores. Six of the top ten jurisdictions, as well as the least attractive
jurisdiction in the world on this measure, are in the US, illustrating just how vast policy differences
can be within a country or region.
Cost of regulatory compliance
Thirty-four jurisdictions have unflattering fourth and fifth quintile scores on the cost of regulatory
compliance, up from 28 last year (figure 25). Spain—Onshore ranks as the worst (of 156) jurisdictions on this issue. Other jurisdictions in the worst fifth quintile are Italy, US Offshore—Pacific,
Spain—Offshore, Russia—Eastern Siberia, Russia—Offshore Sakhalin, Quebec, and Hungary.
US—Offshore Pacific dropped into the fifth quintile this year from the fourth, while US—Offshore Alaska improved somewhat, rising to the fourth quintile from the fifth. Italy’s score deteriorated considerably compared with 2013—enough to move that country from a reasonably
attractive third quintile position in 2013 to become the second least attractive jurisdiction in the
world according to this measure in 2014. Hungary also tumbled from the third quintile to the fifth
this year on the cost of regulatory compliance question.
The cost of regulatory compliance is indicated to be of least concern in Oklahoma, Arkansas, Alabama, Mississippi, and North Dakota. Uruguay, Kansas, Saskatchewan, Guyana, United Arab
Fraser Institute Global Petroleum Survey, 2014
www.fraserinstitute.org
87
Republic, Georgia (the country), Utah, Suriname, and Texas also have attractive first quintile
scores on this factor this year.
High regulatory compliance costs often also mean that the time required for project applications
to be approved is unduly long. As a result, potentially viable projects are often subject to extensive
delays or not undertaken at all. In such cases, the foregone economic and social benefits may be
large.
Protected areas
Three of the eight jurisdictions with fifth quintile scores on the protected areas issue are American
(US—Offshore Pacific, US—Offshore Alaska, and Alaska) (see figure 26). The scores for Ecuador,
Seychelles, New South Wales, Italy, and Greece (although just barely so) fall within the least attractive fifth quintile. Another 22 jurisdictions, including 2 in Canada and 3 in the US, have slightly
better, yet still very unattractive fourth quintile scores on this question. By contrast, the top two
jurisdictions in the world are Mississippi and Alabama, again indicating that stark differences in
perspectives about upstream petroleum industry investment can exist within countries. Guyana,
Suriname, United Arab Republic, Oklahoma, and Manitoba also scored particularly well on this
issue.
Trade barriers
All six Argentinean provinces included in the survey along with Venezuela, Russia—Eastern Siberia, Turkmenistan, and Iran are the ten jurisdictions for which trade regulations and currency controls are indicated as posing the greatest barrier to upstream investment. Russia—Offshore Arctic
and Uzbekistan also received fifth quintile grades on this issue. The poor performance of the
Argentine provinces with respect to this factor was also highlighted in the 2013 survey. Trade barriers were indicated to be of no or minimal concern (less than 5 percent) in Arkansas, Mississippi,
Oklahoma, Georgia, and French Guiana (see figure 27).
Labor availability and skills
The 10 jurisdictions with least attractive scores for labor availability and skills this year are Greenland, Madagascar, Cyprus, Democratic Republic of the Congo (Kinshasa), Somaliland, Papua
New Guinea, Georgia, Russia—Offshore Arctic, Guyana, and Mauritania (see figure 31). In addition to those jurisdictions, Kyrgyzstan, Turkmenistan, and Guatemala have fifth quintile scores.
Further, the survey results indicate that labor availability and skills are also an important issue in 37
jurisdictions with fourth quintile scores. The latter group includes Quebec and Newfoundland &
Labrador, but no US jurisdictions. Labor availability and skills is of no or very minimal concern
(less than 10 percent) in Netherlands—Offshore, United Kingdom—Other Offshore (except
88
Fraser Institute Global Petroleum Survey, 2014
www.fraserinstitute.org
North Sea), Netherlands—Onshore, Oklahoma, and Mississippi. Twenty other jurisdictions
including Saskatchewan, Manitoba, and seven US states also have attractive first quintile ratings
on this measure.
Jurisdictions with high unemployment rates per se are not necessarily attractive to oil and gas
explorers and developers; they require skilled workers and specialists for many positions and while
the unemployment rate may be high, there may nonetheless be a deficiency in the availability of
skilled labor. Furthermore, international mobility of skilled workers is important to the upstream
oil and gas industry so it can meet its requirement for skilled workers without being constrained by
the size and quality of the local work force.
Disputed land claims
Ecuador has the worst score on the disputed land claims question this year (figure 32). The other
jurisdictions with unattractive fifth quintile scores on this factor are South Sudan, Syria, Bolivia,
Yukon, and Uzbekistan. The Northwest Territories—which had the second worst score last
year—has improved a bit, but is nevertheless positioned in the middle of the fourth quintile group,
which is composed of 20 jurisdictions this year. Clearly, the land claims issue continues to be of
major concern for Canada’s northern regions. British Columbia’s score is similar to that for the
Northwest Territories.
Duplication and inconsistency of regulations
Dupli ca tion and incon sis tency of reg u la tions can pose an obsta cle to invest ment.
Spain—Onshore, Italy, Syria, Yukon, Ethiopia, Tanzania, and Quebec all have poor fifth quintile
scores this year on the question pertaining to regulatory duplication and inconsistency (figure 35).
Forty-four jurisdictions, up from 17 last year, including California, US—Offshore Pacific, two
Russian jurisdictions (Other and Offshore Arctic), and all six Argentine provinces have undesirable fourth quintile scores. The only other North American jurisdiction in this group is Mexico.
Jurisdictions with no or minimal (less than 10 percent) negative responses on this issue this year
are Jordan, Uruguay, Saskatchewan, Netherlands—Offshore, Denmark, Oman, Norway—Other
Offshore (i.e., other than North Sea), and Chile. Twenty-one jurisdictions have first quintile scores
on the regulatory duplication question.
Only nine of the 42 jurisdictions included in the survey that belong to the Canadian, US, and Australian federations achieved first quintile ratings on this question. This is not surprising because it
is highly likely that some duplication and inconsistency exists between federal and state or provincial laws and regulations in these countries.
Fraser Institute Global Petroleum Survey, 2014
www.fraserinstitute.org
89
Legal system fairness and transparency
A total of 33 jurisdictions have unattractive fifth quintile scores on this issue (see figure 36). Survey
respondents indicated that legal system fairness and transparency is of very great concern (scores
of 100 when rounded) in the Democratic Republic of the Congo (Kinshasa), Kyrgyzstan, Lebanon,
Syria, Ecuador, Russia—Offshore Arctic, and Venezuela. Other jurisdictions in the group of 33
with fifth quintile scores on the legal system question are the four Argentine provinces (Mendoza,
Santa Cruz, Neuquen, and Chubut), Libya, Egypt, Ukraine, Iraq, Iran, Indonesia, Bangladesh,
Myanmar, Greece, Cambodia, Cameroon, Equatorial Guinea, Yemen, Mali, Papua New Guinea,
Georgia, Uzbekistan, Albania, Turkmenistan, and the three other Russian jurisdictions (Eastern
Siberia, Offshore Sakhalin, and Other).
In 34 jurisdictions legal system fairness is either of no or minimal concern (score of less than 10
percent). All of these jurisdictions are in Canada, the US, Australia, New Zealand, or Western
Europe. Further, the group includes 8 (of 10) Canadian jurisdictions and 7 (of 8) of the Australian
jurisdictions.
A fair and stable legal system is essential for the development of the upstream oil and gas industry.
Oil and gas explorers and developers often spend years investing in exploration before realizing
any return on their investment. They need to be certain that if they discover and develop resources
in accordance with the existing laws and regulations, they will benefit more or less as planned, subject, of course, to market conditions.
90
Fraser Institute Global Petroleum Survey, 2014
www.fraserinstitute.org
Figure 21: Fiscal Terms
Mild deterrent to investment
Ethiopia
Mississippi
Oklahoma
Texas
Kansas
North Dakota
Saskatchewan
Wyoming
Manitoba
Arkansas
Northern Territory
New Zealand
Somaliland
Louisiana
South Australia
Australia—Offshore
Alabama
Montana
Alberta
Utah
Colombia
Seychelles
Pakistan
Ireland
Philippines
Ohio
Namibia
Uruguay
Faroe Islands
Western Australia
Morocco
Albania
Peru
Denmark
West Virginia
Japan
Norway—North Sea
New Mexico
Tasmania
Chile
Jordan
Malta
Georgia
Netherlands—Offshore
Ivory Coast
Newfoundland & Labrador
Trinidad and Tobago
Norway—Other Offshore (except North Sea)
Niger
Northwest Territories
Kenya
Cyprus
Queensland
Qatar
Romania
Michigan
Madagascar
Netherlands—Onshore
Suriname
Brazil—Onshore CC
Thailand
Illinois
Guyana
Turkey
US Offshore—Gulf of Mexico
British Columbia
United Kingdom—North Sea
Ghana
Papua New Guinea
Cameroon
Alaska
Mali
Poland
Greenland
Yukon
Bulgaria
Vietnam
UK—Other Offshore (except North Sea)
Strong deterrent to investment
Would not pursue investment
due to this factor
0%
20%
40%
60%
Fraser Institute Global Petroleum Survey, 2014
www.fraserinstitute.org
80%
100%
Nova Scotia
South Africa
Chad
Tunisia
Mozambique
Republic of the Congo (Brazzaville)
Pennsylvania
Hungary
Yemen
United Arab Emirates
Ukraine
Equatorial Guinea
Myanmar
Germany
New South Wales
Mauritania
Brunei
Spain—Offshore
Colorado
Victoria
Italy
Cambodia
Malaysia
New Brunswick
Guatemala
French Guiana
Gabon
US Offshore—Alaska
Tanzania
Brazil—Offshore CC
Oman
Timor Gap (JPDA)
Lebanon
China
Kuwait
Bahrain
Bangladesh
France
Argentina—Mendoza
Argentina—Salta
Nigeria
Turkmenistan
Uzbekistan
Azerbaijan
Spain—Onshore
India
Democratic Republic of the Congo (Kinshasa)
Israel
Kyrgyzstan
Argentina—Neuquen
Angola
Kazakhstan
Brazil—Offshore presalt area PSC
California
Egypt
Libya
Ecuador
US Offshore—Pacific
Argentina—Santa Cruz
Uganda
New York
Mexico
Argentina—Chubut
South Sudan
Argentina—Tierra del Fuego
Algeria
Greece
Quebec
Indonesia
Iraq
Russia—Other
Syria
Russia—Eastern Siberia
Iran
Russia—Offshore Sakhalin
Russia—Offshore Arctic
Bolivia
Venezuela
0%
20%
40%
60%
80%
100%
91
Figure 22: Taxation in General
Mild deterrent to investment
Tasmania
Mississippi
Manitoba
New Zealand
Saskatchewan
Texas
North Dakota
Uruguay
Oklahoma
Arkansas
Wyoming
Alabama
Kansas
Colombia
French Guiana
Seychelles
Louisiana
Alberta
South Australia
Montana
Cyprus
Peru
Ohio
Somaliland
Ethiopia
Yukon
Utah
Newfoundland & Labrador
Suriname
Chile
Morocco
Japan
Greenland
Victoria
Northwest Territories
Queensland
Namibia
New Mexico
Philippines
Georgia
Jordan
US Offshore—Gulf of Mexico
Northern Territory
United Arab Emirates
Trinidad and Tobago
Albania
New Brunswick
Romania
Ireland
Mauritania
Michigan
New South Wales
Netherlands—Offshore
Malta
Qatar
Ivory Coast
Brazil—Onshore CC
Thailand
Western Australia
UK—Other Offshore (except North Sea)
Papua New Guinea
Niger
Kyrgyzstan
Spain—Onshore
Ghana
Guyana
Illinois
Nova Scotia
Norway—North Sea
South Africa
West Virginia
Colorado
Gabon
Bahrain
Poland
Brunei
Norway—Other Offshore (except North Sea)
Azerbaijan
Strong deterrent to investment
Would not pursue investment
due to this factor
0%
92
20%
40%
60%
80%
100%
Tunisia
Republic of the Congo (Brazzaville)
Chad
Australia—Offshore
British Columbia
Germany
Alaska
Yemen
Hungary
Oman
Ukraine
Bulgaria
Lebanon
Spain—Offshore
US Offshore—Alaska
Pennsylvania
Netherlands—Onshore
Denmark
Equatorial Guinea
Madagascar
South Sudan
Vietnam
Pakistan
United Kingdom—North Sea
Malaysia
Myanmar
Argentina—Salta
Nigeria
Italy
Guatemala
Mali
Turkey
Kenya
Mozambique
Turkmenistan
Russia—Offshore Arctic
Brazil—Offshore CC
Timor Gap (JPDA)
New York
Cameroon
Faroe Islands
Cambodia
Bangladesh
Kazakhstan
Greece
California
Argentina—Neuquen
China
Egypt
Democratic Republic of the Congo (Kinshasa)
Mexico
Russia—Other
Russia—Offshore Sakhalin
Israel
Brazil—Offshore presalt area PSC
Uganda
Tanzania
India
Libya
Iraq
Algeria
Angola
Kuwait
Uzbekistan
Argentina—Mendoza
Argentina—Santa Cruz
Russia—Eastern Siberia
Ecuador
Argentina—Tierra del Fuego
Argentina—Chubut
Bolivia
France
Indonesia
US Offshore—Pacific
Syria
Quebec
Venezuela
Iran
0%
20%
40%
60%
80%
Fraser Institute Global Petroleum Survey, 2014
www.fraserinstitute.org
100%
Figure 23: Environmental Regulations
Mild deterrent to investment
Mississippi
Kansas
Oklahoma
North Dakota
Guyana
Mauritania
Suriname
Jordan
Saskatchewan
Alabama
Manitoba
Morocco
United Arab Emirates
Angola
Qatar
Bahrain
Brunei
Ivory Coast
Texas
Utah
Iraq
French Guiana
Libya
Ohio
Yemen
Malta
Equatorial Guinea
Chile
Madagascar
Ghana
Malaysia
Oman
Gabon
Namibia
Faroe Islands
Kuwait
Kenya
Vietnam
Lebanon
Arkansas
Chad
Cameroon
Yukon
Mozambique
Syria
Niger
Wyoming
Romania
Poland
Ireland
Greenland
Philippines
Egypt
Papua New Guinea
Louisiana
Argentina—Neuquen
Cyprus
Argentina—Mendoza
Trinidad and Tobago
Tunisia
Montana
Democratic Republic of the Congo (Kinshasa)
Pakistan
Thailand
Japan
Turkey
West Virginia
New Mexico
Republic of the Congo (Brazzaville)
Georgia
Myanmar
Bangladesh
Netherlands—Offshore
Algeria
United Kingdom—North Sea
Alberta
Mexico
Argentina—Tierra del Fuego
Strong deterrent to investment
Would not pursue investment
due to this factor
0%
20%
40%
60%
Fraser Institute Global Petroleum Survey, 2014
www.fraserinstitute.org
80%
100%
Iran
Russia—Offshore Arctic
Bulgaria
Venezuela
Uruguay
Somaliland
Russia—Eastern Siberia
Indonesia
China
UK—Other Offshore (except North Sea)
South Australia
Ukraine
Norway—North Sea
Norway—Other Offshore (except North Sea)
Seychelles
Ethiopia
Michigan
Brazil—Onshore CC
Albania
Cambodia
Israel
Azerbaijan
Nigeria
South Sudan
Newfoundland & Labrador
Illinois
Northern Territory
Timor Gap (JPDA)
New Zealand
Argentina—Salta
Uganda
Mali
Kyrgyzstan
India
Russia—Other
Russia—Offshore Sakhalin
Denmark
Nova Scotia
Tanzania
Turkmenistan
Hungary
Northwest Territories
New Brunswick
Argentina—Chubut
Tasmania
Brazil—Offshore presalt area PSC
Netherlands—Onshore
Guatemala
South Africa
Queensland
Brazil—Offshore CC
Colombia
Bolivia
Western Australia
Pennsylvania
Australia—Offshore
US Offshore—Gulf of Mexico
Ecuador
Argentina—Santa Cruz
Germany
Victoria
Kazakhstan
US Offshore—Alaska
Uzbekistan
British Columbia
Alaska
Greece
France
Colorado
Peru
Italy
New South Wales
US Offshore—Pacific
Quebec
New York
Spain—Onshore
California
Spain—Offshore
0%
20%
40%
60%
80%
100%
93
Figure 24: Uncertainty Concerning the Administration, Interpretation
and Enforcement of Regulations
Faroe Islands
Oklahoma
Mississippi
Arkansas
Alabama
Texas
North Dakota
Suriname
Saskatchewan
Japan
Norway—Other Offshore (except North Sea)
Netherlands—Offshore
New Zealand
Manitoba
Kansas
Guyana
Wyoming
Norway—North Sea
Utah
French Guiana
Netherlands—Onshore
Louisiana
South Australia
Denmark
Northern Territory
Western Australia
New Mexico
Poland
Australia—Offshore
United Arab Emirates
Newfoundland & Labrador
Montana
Seychelles
Ohio
Germany
Chile
Qatar
Alberta
Ireland
Morocco
Trinidad and Tobago
Oman
Jordan
Turkey
Greece
Michigan
Namibia
Victoria
UK—Other Offshore (except North Sea)
Uruguay
Malta
New Brunswick
United Kingdom—North Sea
Queensland
West Virginia
Philippines
Pennsylvania
Kenya
Ghana
Brunei
Peru
Illinois
British Columbia
Cyprus
Malaysia
Tasmania
Romania
Syria
Brazil—Offshore CC
Mauritania
US Offshore—Gulf of Mexico
Colombia
Brazil—Onshore CC
Thailand
Ivory Coast
Bahrain
Georgia
Yukon
Mild deterrent to investment
Strong deterrent to investment
Would not pursue investment
due to this factor
0%
94
20%
40%
60%
80%
100%
Northwest Territories
Alaska
Vietnam
Colorado
South Africa
Yemen
Hungary
New South Wales
Chad
Tunisia
Nova Scotia
Papua New Guinea
US Offshore—Alaska
Mozambique
Greenland
Brazil—Offshore presalt area PSC
Angola
Mexico
Gabon
Israel
France
Lebanon
New York
Guatemala
Somaliland
Timor Gap (JPDA)
Mali
Kyrgyzstan
Nigeria
Republic of the Congo (Brazzaville)
Kuwait
India
Argentina—Neuquen
Argentina—Mendoza
Niger
Cameroon
Myanmar
Equatorial Guinea
Democratic Republic of the Congo (Kinshasa)
Azerbaijan
China
Spain—Offshore
California
Bulgaria
Bolivia
South Sudan
Algeria
Argentina—Salta
Ukraine
Argentina—Chubut
Albania
Quebec
Egypt
Libya
Madagascar
Pakistan
Cambodia
Argentina—Tierra del Fuego
Spain—Onshore
Iraq
Italy
Tanzania
Kazakhstan
Bangladesh
Argentina—Santa Cruz
Russia—Offshore Sakhalin
Indonesia
Ecuador
Russia—Offshore Arctic
Uganda
Uzbekistan
Turkmenistan
Iran
Venezuela
Russia—Eastern Siberia
Russia—Other
Ethiopia
US Offshore—Pacific
0%
20%
40%
60%
80%
100%
Fraser Institute Global Petroleum Survey, 2014
www.fraserinstitute.org
Figure 25: Cost of Regulatory Compliance
Oklahoma
Arkansas
Alabama
Mississippi
North Dakota
Uruguay
Kansas
Saskatchewan
Guyana
United Arab Emirates
Georgia
Utah
Suriname
Texas
French Guiana
Morocco
Newfoundland & Labrador
Jordan
Faroe Islands
Ohio
Qatar
Wyoming
Chile
Ethiopia
Manitoba
Louisiana
Trinidad and Tobago
Philippines
Mauritania
Malta
Illinois
Papua New Guinea
Oman
Guatemala
Montana
Bahrain
Namibia
Netherlands—Offshore
Syria
Ghana
Denmark
Ivory Coast
New Mexico
Michigan
Yemen
South Sudan
Chad
Vietnam
Argentina—Neuquen
Seychelles
Nova Scotia
New Zealand
Democratic Republic of the Congo (Kinshasa)
Pakistan
Malaysia
Cameroon
Brunei
Republic of the Congo (Brazzaville)
Uzbekistan
Kyrgyzstan
Cyprus
Northwest Territories
Argentina—Mendoza
Colombia
West Virginia
Azerbaijan
South Australia
Greenland
Gabon
Equatorial Guinea
Argentina—Tierra del Fuego
Turkey
Tasmania
Netherlands—Onshore
Brazil—Offshore CC
Alberta
Victoria
Myanmar
Mild deterrent to investment
Strong deterrent to investment
Would not pursue investment
due to this factor
0%
20%
40%
60%
Fraser Institute Global Petroleum Survey, 2014
www.fraserinstitute.org
80%
100%
Bulgaria
Argentina—Salta
Turkmenistan
Lebanon
Nigeria
Brazil—Onshore CC
Bangladesh
Thailand
Romania
Northern Territory
Tunisia
Angola
Mozambique
Peru
Somaliland
Madagascar
Kenya
Ukraine
Ireland
Western Australia
Yukon
Australia—Offshore
Mexico
Tanzania
Norway—Other Offshore (except North Sea)
Cambodia
Argentina—Chubut
Israel
Poland
Pennsylvania
Albania
Iraq
Brazil—Offshore presalt area PSC
United Kingdom—North Sea
New Brunswick
Indonesia
Argentina—Santa Cruz
Algeria
South Africa
UK—Other Offshore (except North Sea)
Kuwait
Norway—North Sea
Queensland
British Columbia
Egypt
Colorado
Uganda
Kazakhstan
Venezuela
China
Niger
France
Timor Gap (JPDA)
Libya
US Offshore—Gulf of Mexico
India
Russia—Other
Russia—Offshore Arctic
Alaska
Ecuador
Japan
Greece
Germany
California
New South Wales
New York
Bolivia
Iran
US Offshore—Alaska
Mali
Hungary
Quebec
Russia—Offshore Sakhalin
Russia—Eastern Siberia
Spain—Offshore
US Offshore—Pacific
Italy
Spain—Onshore
0%
20%
40%
60%
80%
100%
95
Figure 26: Uncertainty Regarding Protected Areas
Mild deterrent to investment
Mississippi
Alabama
Guyana
Suriname
United Arab Emirates
Oklahoma
Manitoba
Argentina—Tierra del Fuego
Jordan
Japan
Faroe Islands
Denmark
Angola
Qatar
Saskatchewan
Texas
Yemen
Romania
Brunei
Netherlands—Offshore
North Dakota
Oman
Malaysia
Mauritania
Kuwait
Iraq
Nigeria
Vietnam
Illinois
Ivory Coast
Ohio
Uruguay
Kansas
Azerbaijan
Ghana
Pakistan
Bahrain
Algeria
South Sudan
Mali
Kyrgyzstan
Arkansas
Morocco
Argentina—Chubut
Alberta
Ireland
Namibia
Argentina—Neuquen
Timor Gap (JPDA)
Somaliland
Papua New Guinea
Equatorial Guinea
Malta
Libya
United Kingdom—North Sea
Argentina—Salta
China
Argentina—Santa Cruz
West Virginia
Norway—North Sea
Philippines
US Offshore—Gulf of Mexico
Louisiana
Syria
Iran
Kazakhstan
Thailand
Tunisia
Michigan
Trinidad and Tobago
Gabon
Democratic Republic of the Congo (Kinshasa)
Republic of the Congo (Brazzaville)
Newfoundland & Labrador
Northern Territory
Turkmenistan
Cambodia
Albania
Strong deterrent to
investment
Would not pursue
investment due to this factor
0%
96
20%
40%
60%
80%
100%
Turkey
Cyprus
Tasmania
New Brunswick
Chile
Nova Scotia
India
Myanmar
Mexico
French Guiana
Niger
Netherlands—Onshore
Argentina—Mendoza
Indonesia
Cameroon
Montana
Wyoming
Utah
Lebanon
Ethiopia
Norway—Other Offshore (except North Sea)
Chad
Bangladesh
Brazil—Offshore CC
South Australia
Egypt
Russia—Eastern Siberia
Poland
Pennsylvania
UK—Other Offshore (except North Sea)
New Zealand
Mozambique
Bulgaria
Venezuela
Western Australia
Australia—Offshore
Victoria
Germany
Ukraine
Israel
South Africa
Brazil—Onshore CC
Hungary
New Mexico
British Columbia
Russia—Other
Yukon
Brazil—Offshore presalt area PSC
Russia—Offshore Arctic
Guatemala
Uzbekistan
Kenya
Colombia
Uganda
Madagascar
Queensland
Bolivia
Russia—Offshore Sakhalin
Northwest Territories
Georgia
New York
Greenland
Colorado
Tanzania
California
Peru
Spain—Offshore
France
Spain—Onshore
Quebec
Greece
Italy
Alaska
US Offshore—Alaska
New South Wales
Seychelles
US Offshore—Pacific
Ecuador
0%
20%
40%
60%
80%
100%
Fraser Institute Global Petroleum Survey, 2014
www.fraserinstitute.org
Figure 27: Trade Barriers
French Guiana
Georgia
Oklahoma
Mississippi
Arkansas
North Dakota
Wyoming
Spain—Offshore
Saskatchewan
Norway—Other Offshore (except North Sea)
Kansas
Guyana
Manitoba
Illinois
Romania
Peru
Louisiana
New Zealand
South Australia
Uruguay
Malta
Cyprus
Alabama
Texas
Denmark
Utah
New Mexico
Faroe Islands
Michigan
Alberta
Ohio
US Offshore—Gulf of Mexico
Northern Territory
Seychelles
Greenland
Greece
US Offshore—Pacific
Norway—North Sea
Italy
United Kingdom—North Sea
Germany
Netherlands—Offshore
Netherlands—Onshore
Victoria
Queensland
Pennsylvania
US Offshore—Alaska
Ivory Coast
Ireland
Montana
Suriname
Kyrgyzstan
UK—Other Offshore (except North Sea)
West Virginia
Australia—Offshore
Newfoundland & Labrador
Nova Scotia
Trinidad and Tobago
United Arab Emirates
Alaska
Northwest Territories
New Brunswick
Colorado
Colombia
Oman
Bahrain
Tasmania
California
Qatar
Kenya
British Columbia
Western Australia
Spain—Onshore
Poland
Chile
Brunei
Thailand
Papua New Guinea
Mild deterrent to investment
Strong deterrent to investment
Would not pursue investment due to
this factor
0%
20%
40%
60%
Fraser Institute Global Petroleum Survey, 2014
www.fraserinstitute.org
80%
100%
Philippines
New York
Tunisia
Chad
Mexico
Albania
New South Wales
Jordan
Yukon
Madagascar
Nigeria
Ghana
Morocco
Namibia
Lebanon
France
Syria
Malaysia
Timor Gap (JPDA)
Mauritania
Gabon
Brazil—Offshore CC
Mozambique
Equatorial Guinea
Azerbaijan
Guatemala
Israel
South Africa
Ethiopia
Cameroon
Japan
Cambodia
Bulgaria
South Sudan
Yemen
Brazil—Onshore CC
Uganda
Pakistan
Vietnam
Niger
Brazil—Offshore presalt area PSC
Hungary
Turkey
Myanmar
Kazakhstan
Angola
Republic of the Congo (Brazzaville)
Bangladesh
Tanzania
Ecuador
Somaliland
Iraq
Ukraine
India
Egypt
Mali
Quebec
Indonesia
Democratic Republic of the Congo (Kinshasa)
Libya
China
Kuwait
Algeria
Bolivia
Russia—Offshore Sakhalin
Russia—Other
Uzbekistan
Russia—Offshore Arctic
Argentina—Salta
Iran
Argentina—Tierra del Fuego
Turkmenistan
Argentina—Neuquen
Russia—Eastern Siberia
Venezuela
Argentina—Santa Cruz
Argentina—Chubut
Argentina—Mendoza
0%
20%
40%
60%
80%
100%
97
Figure 28: Labor Regulations and Employment Agreements
Seychelles
Georgia
Utah
Oklahoma
Mississippi
Arkansas
Alabama
Kansas
North Dakota
Wyoming
Saskatchewan
Louisiana
Texas
Montana
Manitoba
Uruguay
Alaska
Ireland
New Mexico
West Virginia
Guyana
Ohio
Alberta
French Guiana
Madagascar
Michigan
US Offshore—Gulf of Mexico
Netherlands—Offshore
Philippines
Chile
Namibia
Ivory Coast
Illinois
Colorado
Netherlands—Onshore
Faroe Islands
Cyprus
US Offshore—Alaska
New Zealand
United Arab Emirates
Quebec
Greenland
Denmark
Cambodia
Suriname
Guatemala
Bahrain
United Kingdom—North Sea
Thailand
Myanmar
Kenya
Pennsylvania
Romania
Uzbekistan
Malta
Northwest Territories
Qatar
Colombia
Republic of the Congo (Brazzaville)
UK—Other Offshore (except North Sea)
Mauritania
Brunei
Oman
Jordan
Somaliland
Ethiopia
Yukon
New York
Poland
Morocco
Timor Gap (JPDA)
New Brunswick
Chad
Pakistan
Bangladesh
Ghana
California
Northern Territory
Mild deterrent to investment
Strong deterrent to investment
Would not pursue investment
due to this factor
0%
98
20%
40%
60%
80%
100%
British Columbia
Mozambique
Vietnam
South Sudan
Nova Scotia
Israel
Cameroon
Hungary
Papua New Guinea
US Offshore—Pacific
Niger
Albania
Peru
Germany
Democratic Republic of the Congo (Kinshasa)
Victoria
South Australia
Trinidad and Tobago
Equatorial Guinea
Russia—Other
Kazakhstan
Turkmenistan
Japan
India
Ukraine
Spain—Offshore
Tasmania
Gabon
Tanzania
Newfoundland & Labrador
Yemen
Brazil—Offshore CC
Syria
Mali
Nigeria
South Africa
Lebanon
Azerbaijan
Queensland
Spain—Onshore
Western Australia
Malaysia
Kyrgyzstan
Brazil—Onshore CC
Iraq
Angola
Uganda
New South Wales
Libya
Tunisia
Norway—Other Offshore (except North Sea)
Australia—Offshore
Russia—Offshore Arctic
China
Mexico
Norway—North Sea
Brazil—Offshore presalt area PSC
Egypt
Turkey
Russia—Offshore Sakhalin
Italy
Ecuador
Indonesia
Argentina—Salta
Bolivia
Argentina—Neuquen
Bulgaria
Argentina—Santa Cruz
Iran
Argentina—Tierra del Fuego
Argentina—Chubut
Algeria
Argentina—Mendoza
Kuwait
Russia—Eastern Siberia
Greece
Venezuela
France
0%
20%
40%
60%
80%
Fraser Institute Global Petroleum Survey, 2014
www.fraserinstitute.org
100%
Figure 29: Quality of Infrastructure
Mild deterrent to investment
Oklahoma
Manitoba
Texas
Victoria
Kansas
Japan
Netherlands—Offshore
Alabama
Germany
South Australia
Louisiana
Norway—North Sea
UK—Other Offshore (except North Sea)
Mississippi
Qatar
Arkansas
Spain—Onshore
France
Denmark
New Mexico
Bahrain
New South Wales
Alberta
Netherlands—Onshore
United Kingdom—North Sea
Saskatchewan
Ohio
Wyoming
Australia—Offshore
Brunei
Uruguay
Hungary
North Dakota
United Arab Emirates
US Offshore—Gulf of Mexico
Utah
Oman
Norway—Other Offshore (except North Sea)
Italy
Montana
Michigan
Colorado
Queensland
New Zealand
Spain—Offshore
Western Australia
Tasmania
Chile
Thailand
Malaysia
Kuwait
Trinidad and Tobago
New York
Illinois
California
Argentina—Mendoza
Malta
Faroe Islands
US Offshore—Pacific
Argentina—Salta
US Offshore—Alaska
Argentina—Neuquen
French Guiana
Israel
Northern Territory
Nova Scotia
Bulgaria
Pennsylvania
British Columbia
Ukraine
Ireland
Jordan
Seychelles
Romania
Argentina—Santa Cruz
Newfoundland & Labrador
Argentina—Tierra del Fuego
Syria
Strong deterrent to investment
Would not pursue investment
due to this factor
0%
20%
40%
60%
Fraser Institute Global Petroleum Survey, 2014
www.fraserinstitute.org
80%
100%
Vietnam
Algeria
China
West Virginia
Tunisia
Azerbaijan
Suriname
Morocco
South Africa
Poland
Peru
Timor Gap (JPDA)
Pakistan
Argentina—Chubut
Colombia
New Brunswick
Cyprus
Kazakhstan
Brazil—Offshore CC
Yukon
Ghana
Iran
Mexico
Ecuador
Republic of the Congo (Brazzaville)
Russia—Other
Philippines
Ivory Coast
Egypt
Brazil—Onshore CC
India
Albania
Quebec
Uganda
Yemen
Cameroon
Russia—Offshore Sakhalin
Northwest Territories
Brazil—Offshore presalt area PSC
Turkey
Georgia
Alaska
Angola
Lebanon
Equatorial Guinea
Guatemala
Turkmenistan
Namibia
Indonesia
Libya
Nigeria
Gabon
Greece
Kenya
Guyana
Niger
Mauritania
Madagascar
Chad
Bangladesh
Cambodia
Bolivia
Venezuela
South Sudan
Tanzania
Mozambique
Uzbekistan
Russia—Offshore Arctic
Russia—Eastern Siberia
Iraq
Myanmar
Ethiopia
Papua New Guinea
Mali
Somaliland
Kyrgyzstan
Greenland
Democratic Republic of the Congo (Kinshasa)
0%
20%
40%
60%
80%
100%
99
Figure 30: Geological Database
Mild deterrent to investment
South Australia
Wyoming
Utah
Arkansas
United Kingdom—North Sea
Australia—Offshore
Saskatchewan
North Dakota
Alberta
New Mexico
Norway—North Sea
Alabama
New Zealand
Oklahoma
British Columbia
Netherlands—Onshore
Netherlands—Offshore
Western Australia
Queensland
Kansas
Denmark
Norway—Other Offshore (except North Sea)
Manitoba
Illinois
Texas
Northern Territory
Colorado
New South Wales
US Offshore—Gulf of Mexico
Michigan
UK—Other Offshore (except North Sea)
Victoria
Louisiana
California
Brazil—Offshore CC
Alaska
Mississippi
Montana
Colombia
French Guiana
Qatar
Pennsylvania
Newfoundland & Labrador
Ohio
France
Japan
US Offshore—Pacific
Brazil—Onshore CC
US Offshore—Alaska
Thailand
Poland
Namibia
West Virginia
Nova Scotia
Ireland
Italy
United Arab Emirates
Malta
Greenland
Yukon
South Africa
Spain—Offshore
Trinidad and Tobago
Oman
Brazil—Offshore presalt area PSC
Argentina—Tierra del Fuego
Tasmania
New Brunswick
Timor Gap (JPDA)
Argentina—Neuquen
New York
Peru
Argentina—Mendoza
Russia—Offshore Sakhalin
Northwest Territories
Argentina—Salta
Russia—Offshore Arctic
Chile
Strong deterrent to investment
Would not pursue investment
due to this factor
0%
100
20%
40%
60%
80%
100%
Morocco
Lebanon
Nigeria
Algeria
Ivory Coast
Argentina—Santa Cruz
Pakistan
Kuwait
Romania
Egypt
Germany
Philippines
Venezuela
Suriname
Syria
Jordan
Seychelles
Republic of the Congo (Brazzaville)
Spain—Onshore
Faroe Islands
Brunei
Quebec
India
Tunisia
Kenya
Argentina—Chubut
Ghana
Libya
Ukraine
Malaysia
Vietnam
Bahrain
Albania
Uruguay
Hungary
Israel
Russia—Other
China
Equatorial Guinea
Gabon
Mauritania
Greece
Angola
Azerbaijan
Chad
Guyana
Russia—Eastern Siberia
Bulgaria
Papua New Guinea
Uganda
Cameroon
Mexico
Kazakhstan
Georgia
Cyprus
Tanzania
Madagascar
Bangladesh
Bolivia
Niger
Indonesia
Somaliland
Ethiopia
Yemen
Iran
Ecuador
South Sudan
Iraq
Mozambique
Myanmar
Guatemala
Democratic Republic of the Congo (Kinshasa)
Uzbekistan
Mali
Turkey
Cambodia
Turkmenistan
Kyrgyzstan
0%
20%
40%
60%
80%
100%
Fraser Institute Global Petroleum Survey, 2014
www.fraserinstitute.org
Figure 31: Labor Availability
Netherlands—Offshore
UK—Other Offshore (except North Sea)
Netherlands—Onshore
Oklahoma
Mississippi
US Offshore—Gulf of Mexico
Wyoming
Alabama
Kansas
Utah
Saskatchewan
Norway—Other Offshore (except North Sea)
Texas
Ohio
Louisiana
Arkansas
New Mexico
Colorado
Italy
United Kingdom—North Sea
Denmark
Norway—North Sea
Victoria
West Virginia
Manitoba
Michigan
Ireland
South Australia
Argentina—Neuquen
US Offshore—Alaska
Germany
India
Poland
Romania
Montana
Pakistan
Pennsylvania
Colombia
Alberta
British Columbia
New Zealand
Israel
France
New York
Queensland
California
Argentina—Mendoza
Jordan
Hungary
US Offshore—Pacific
United Arab Emirates
Thailand
North Dakota
New South Wales
Spain—Offshore
Alaska
Vietnam
Trinidad and Tobago
Oman
Peru
Western Australia
Ivory Coast
Illinois
French Guiana
Chile
Kuwait
Argentina—Santa Cruz
Russia—Other
Argentina—Salta
Qatar
Australia—Offshore
Argentina—Chubut
Tasmania
Malta
Malaysia
South Africa
Ghana
Northern Territory
Mild deterrent to investment
Strong deterrent to investment
Would not pursue investment
due to this factor
0%
20%
40%
60%
Fraser Institute Global Petroleum Survey, 2014
www.fraserinstitute.org
80%
100%
Iran
Philippines
Brazil—Offshore CC
Tunisia
Kenya
Uruguay
Ecuador
Argentina—Tierra del Fuego
Lebanon
Bahrain
Nigeria
Namibia
Kazakhstan
China
Yukon
Timor Gap (JPDA)
Morocco
Indonesia
Nova Scotia
Mexico
Ukraine
Albania
Egypt
Algeria
Japan
Newfoundland & Labrador
Northwest Territories
Spain—Onshore
Venezuela
New Brunswick
Uganda
Turkey
Faroe Islands
Yemen
Republic of the Congo (Brazzaville)
Gabon
Cambodia
Tanzania
Brazil—Offshore presalt area PSC
Equatorial Guinea
Russia—Offshore Sakhalin
Seychelles
Uzbekistan
Greece
Chad
Azerbaijan
Mozambique
Brunei
Suriname
Quebec
Niger
Iraq
Cameroon
Angola
Brazil—Onshore CC
Myanmar
South Sudan
Libya
Syria
Ethiopia
Russia—Eastern Siberia
Bulgaria
Bangladesh
Mali
Bolivia
Guatemala
Turkmenistan
Kyrgyzstan
Mauritania
Guyana
Russia—Offshore Arctic
Georgia
Papua New Guinea
Somaliland
Democratic Republic of the Congo (Kinshasa)
Cyprus
Madagascar
Greenland
0%
20%
40%
60%
80%
100%
101
Figure 32: Disputed Land Claims
Mild deterrent to investment
Uruguay
French Guiana
Jordan
Seychelles
Poland
Norway—Other Offshore (except North Sea)
Netherlands—Onshore
Malta
Faroe Islands
Denmark
Manitoba
Norway—North Sea
Brazil—Offshore CC
Netherlands—Offshore
Mississippi
United Kingdom—North Sea
Arkansas
Namibia
Germany
Oklahoma
Saskatchewan
Illinois
Ireland
Texas
Kansas
US Offshore—Gulf of Mexico
North Dakota
Oman
Japan
UK—Other Offshore (except North Sea)
Ohio
France
Alabama
Michigan
Wyoming
Trinidad and Tobago
Guyana
Suriname
Australia—Offshore
Louisiana
Ivory Coast
Republic of the Congo (Brazzaville)
Hungary
Pennsylvania
United Arab Emirates
New Mexico
Qatar
Montana
Algeria
Utah
Brazil—Offshore presalt area PSC
Argentina—Tierra del Fuego
Chile
Angola
Bulgaria
Albania
Romania
Pakistan
Tunisia
Colorado
US Offshore—Alaska
Newfoundland & Labrador
Ghana
California
Kuwait
Greenland
Argentina—Mendoza
Georgia
New Zealand
Brazil—Onshore CC
Italy
South Australia
West Virginia
Mozambique
Brunei
Argentina—Neuquen
Cyprus
Alberta
Strong deterrent to investment
Would not pursue investment
due to this factor
0%
102
20%
40%
60%
80%
100%
Egypt
Argentina—Santa Cruz
Mauritania
Morocco
Nova Scotia
Malaysia
Argentina—Salta
Alaska
New York
Victoria
Argentina—Chubut
Turkey
Russia—Other
Azerbaijan
Chad
India
South Africa
Gabon
Venezuela
Thailand
Spain—Offshore
Israel
Bahrain
Tanzania
Niger
Equatorial Guinea
Kyrgyzstan
Ukraine
Russia—Offshore Sakhalin
Timor Gap (JPDA)
Tasmania
US Offshore—Pacific
Quebec
New Brunswick
Bangladesh
Western Australia
Yemen
Indonesia
Madagascar
Libya
Papua New Guinea
Lebanon
Russia—Eastern Siberia
Colombia
Nigeria
Russia—Offshore Arctic
Vietnam
Cameroon
Kazakhstan
Ethiopia
Cambodia
Kenya
Greece
Iraq
Mali
Myanmar
China
Northern Territory
Iran
Mexico
Turkmenistan
Queensland
Peru
Uganda
New South Wales
Guatemala
British Columbia
Democratic Republic of the Congo (Kinshasa)
Northwest Territories
Somaliland
Spain—Onshore
Philippines
Uzbekistan
Yukon
Bolivia
Syria
South Sudan
Ecuador
0%
20%
40%
60%
80%
Fraser Institute Global Petroleum Survey, 2014
www.fraserinstitute.org
100%
Figure 33: Political Stability
Chile
Seychelles
Norway—Other Offshore (except North Sea)
Netherlands—Offshore
Netherlands—Onshore
Faroe Islands
Tasmania
South Australia
Northern Territory
Mississippi
Alabama
Saskatchewan
Manitoba
Oklahoma
Norway—North Sea
Western Australia
Oman
Ireland
Texas
Arkansas
Alberta
Kansas
North Dakota
Australia—Offshore
New Zealand
Denmark
Utah
Wyoming
Louisiana
Germany
Queensland
Namibia
Trinidad and Tobago
Victoria
Alaska
UK—Other Offshore (except North Sea)
United Arab Emirates
Brunei
Uruguay
Suriname
French Guiana
West Virginia
New Mexico
New Brunswick
Colombia
Qatar
Montana
Ohio
Ghana
Japan
British Columbia
United Kingdom—North Sea
Malta
Newfoundland & Labrador
Michigan
Guyana
Malaysia
Vietnam
Northwest Territories
Israel
Pennsylvania
Nova Scotia
Peru
Kuwait
Poland
Yukon
Greenland
Illinois
New South Wales
Brazil—Offshore CC
Mozambique
India
US Offshore—Gulf of Mexico
Brazil—Offshore presalt area PSC
US Offshore—Alaska
Morocco
Philippines
Romania
Strong deterrent to investment
Would not pursue investment
due to this factor
0%
20%
40%
60%
Fraser Institute Global Petroleum Survey, 2014
www.fraserinstitute.org
Timor Gap (JPDA)
Spain—Onshore
Ethiopia
Angola
Russia—Offshore Sakhalin
US Offshore—Pacific
Brazil—Onshore CC
Quebec
Kazakhstan
China
Colorado
Spain—Offshore
France
Mexico
Bahrain
Russia—Other
Bulgaria
California
Ivory Coast
South Africa
Gabon
Hungary
Cameroon
New York
Azerbaijan
Greece
Kenya
Russia—Eastern Siberia
Jordan
Niger
Republic of the Congo (Brazzaville)
Turkey
Uganda
Tunisia
Mauritania
Guatemala
Albania
Bangladesh
Chad
Uzbekistan
Georgia
Indonesia
Papua New Guinea
Italy
Tanzania
Nigeria
Algeria
Cyprus
Cambodia
Yemen
Russia—Offshore Arctic
Argentina—Tierra del Fuego
Argentina—Salta
Pakistan
Madagascar
Equatorial Guinea
Thailand
Turkmenistan
Argentina—Santa Cruz
Myanmar
Argentina—Mendoza
Argentina—Neuquen
Ukraine
Argentina—Chubut
Somaliland
Bolivia
Mali
Ecuador
Lebanon
Iran
Democratic Republic of the Congo (Kinshasa)
Libya
South Sudan
Iraq
Egypt
Syria
Kyrgyzstan
Venezuela
Mild deterrent to investment
80%
100%
0%
20%
40%
60%
80%
100%
103
Figure 34: Security
United Kingdom—North Sea
Spain—Onshore
Norway—North Sea
Norway—Other Offshore (except North Sea)
Netherlands—Offshore
Netherlands—Onshore
Greenland
Faroe Islands
Denmark
Australia—Offshore
Victoria
Tasmania
South Australia
Northern Territory
US Offshore—Alaska
West Virginia
Utah
Pennsylvania
Ohio
New York
Montana
Mississippi
Michigan
Arkansas
Alaska
Alabama
Yukon
Saskatchewan
Manitoba
Alberta
North Dakota
Wyoming
Western Australia
New Zealand
Kansas
Queensland
UK—Other Offshore (except North Sea)
Oklahoma
New Mexico
Illinois
Germany
Louisiana
British Columbia
Texas
Chile
Newfoundland & Labrador
Spain—Offshore
Brunei
Uruguay
US Offshore—Gulf of Mexico
Japan
Hungary
US Offshore—Pacific
Nova Scotia
Colorado
New South Wales
Seychelles
California
United Arab Emirates
Oman
Greece
France
Northwest Territories
Timor Gap (JPDA)
Quebec
French Guiana
Ireland
New Brunswick
Vietnam
Qatar
Brazil—Offshore CC
Cyprus
Namibia
Argentina—Tierra del Fuego
Poland
Malta
Brazil—Offshore presalt area PSC
Guyana
Mild deterrent to investment
Strong deterrent to investment
Would not pursue investment
due to this factor
0%
104
20%
40%
60%
80%
100%
Brazil—Onshore CC
Romania
Malaysia
Ghana
Suriname
Argentina—Mendoza
Italy
Trinidad and Tobago
Argentina—Neuquen
Peru
China
India
Morocco
Jordan
Israel
Tunisia
Bulgaria
Argentina—Salta
Kuwait
Albania
Kazakhstan
Ivory Coast
Argentina—Chubut
Bahrain
Uzbekistan
Georgia
Myanmar
Cameroon
Bangladesh
Argentina—Santa Cruz
Russia—Offshore Sakhalin
Cambodia
Equatorial Guinea
Thailand
Azerbaijan
Gabon
Russia—Other
Mozambique
Indonesia
Turkey
Republic of the Congo (Brazzaville)
Niger
Angola
Bolivia
Russia—Eastern Siberia
Uganda
Ecuador
Kenya
Philippines
Tanzania
Russia—Offshore Arctic
Madagascar
Chad
Ethiopia
Ukraine
Colombia
South Africa
Algeria
Mexico
Turkmenistan
Kyrgyzstan
Yemen
Mauritania
Guatemala
Iran
Somaliland
Pakistan
Nigeria
Mali
Lebanon
Egypt
Democratic Republic of the Congo (Kinshasa)
Libya
Venezuela
Syria
Iraq
South Sudan
Papua New Guinea
0%
20%
40%
60%
80%
100%
Fraser Institute Global Petroleum Survey, 2014
www.fraserinstitute.org
Figure 35: Regulatory Duplication
Mild deterrent to investment
Uruguay
Jordan
Saskatchewan
Netherlands—Offshore
Denmark
Oman
Norway—Other Offshore (except North Sea)
Chile
Arkansas
Manitoba
Oklahoma
Norway—North Sea
North Dakota
Mississippi
Namibia
Texas
Netherlands—Onshore
Kansas
United Arab Emirates
Ohio
UK—Other Offshore (except North Sea)
Guyana
Qatar
Seychelles
Germany
New Zealand
Alberta
United Kingdom—North Sea
Bahrain
South Australia
Alabama
Australia—Offshore
French Guiana
Mauritania
Japan
Morocco
Louisiana
Kenya
Wyoming
Faroe Islands
Trinidad and Tobago
British Columbia
Mozambique
Suriname
Georgia
Cyprus
West Virginia
Montana
Michigan
Illinois
Ivory Coast
Newfoundland & Labrador
New Mexico
Western Australia
Tunisia
Ghana
Russia—Offshore Sakhalin
Queensland
Thailand
Malaysia
Brazil—Offshore CC
Azerbaijan
Romania
Ireland
Timor Gap (JPDA)
Utah
Malta
Greenland
Albania
Victoria
New Brunswick
US Offshore—Gulf of Mexico
Peru
Pennsylvania
Madagascar
Philippines
Northern Territory
Brunei
Strong deterrent to investment
Would not pursue investment
due to this factor
0%
20%
40%
60%
Fraser Institute Global Petroleum Survey, 2014
www.fraserinstitute.org
80%
100%
Colombia
Algeria
Brazil—Onshore CC
Russia—Eastern Siberia
US Offshore—Alaska
New South Wales
Vietnam
Colorado
Pakistan
Brazil—Offshore presalt area PSC
Israel
Bangladesh
Turkey
Poland
New York
Angola
Alaska
Cameroon
Equatorial Guinea
Hungary
Nova Scotia
Tasmania
Northwest Territories
China
Democratic Republic of the Congo (Kinshasa)
Chad
Gabon
Turkmenistan
Libya
Egypt
Somaliland
Kyrgyzstan
Greece
Mexico
Kazakhstan
South Sudan
Argentina—Tierra del Fuego
Kuwait
Niger
Russia—Offshore Arctic
US Offshore—Pacific
Nigeria
France
Bolivia
Cambodia
Argentina—Chubut
Uganda
California
Republic of the Congo (Brazzaville)
Guatemala
Ecuador
Argentina—Salta
Argentina—Santa Cruz
Yemen
Mali
Uzbekistan
Myanmar
Argentina—Neuquen
Russia—Other
South Africa
Papua New Guinea
Spain—Offshore
Argentina—Mendoza
Indonesia
Lebanon
Ukraine
Bulgaria
Venezuela
Iran
India
Iraq
Quebec
Tanzania
Ethiopia
Yukon
Syria
Italy
Spain—Onshore
0%
20%
40%
60%
80%
100%
105
Figure 36: Legal System Processes
Mild deterrent to investment
UK—Other Offshore (except North Sea)
Norway—North Sea
Norway—Other Offshore (except North Sea)
Netherlands—Offshore
Netherlands—Onshore
Malta
Greenland
Faroe Islands
New Zealand
Australia—Offshore
Western Australia
Victoria
Tasmania
South Australia
Northern Territory
Arkansas
Yukon
Saskatchewan
Northwest Territories
Manitoba
Alberta
United Kingdom—North Sea
Queensland
British Columbia
Utah
Wyoming
Germany
North Dakota
Nova Scotia
Newfoundland & Labrador
Mississippi
Denmark
Kansas
Montana
Oklahoma
Alabama
New Brunswick
New South Wales
Chile
Namibia
Texas
Michigan
Ohio
West Virginia
Ireland
Alaska
US Offshore—Alaska
Illinois
New Mexico
Oman
Trinidad and Tobago
France
US Offshore—Gulf of Mexico
Pennsylvania
Louisiana
Seychelles
Spain—Onshore
Colorado
Uruguay
Israel
Japan
Quebec
Spain—Offshore
Kenya
United Arab Emirates
Brazil—Offshore CC
Madagascar
Suriname
French Guiana
Jordan
Brunei
California
Ghana
Hungary
Brazil—Onshore CC
Colombia
New York
Brazil—Offshore presalt area PSC
Strong deterrent to investment
Would not pursue investment
due to this factor
0%
106
20%
40%
60%
80%
100%
Peru
Mozambique
US Offshore—Pacific
Guyana
Ivory Coast
South Africa
Cyprus
Turkey
Romania
Qatar
Thailand
Poland
Malaysia
Timor Gap (JPDA)
Morocco
Uganda
India
Philippines
Tunisia
Guatemala
Azerbaijan
Tanzania
Algeria
Bahrain
Somaliland
Gabon
Italy
Vietnam
China
Argentina—Salta
Mauritania
Republic of the Congo (Brazzaville)
Chad
Ethiopia
Nigeria
Mexico
Pakistan
Kuwait
Kazakhstan
Bulgaria
Bolivia
Angola
Niger
Argentina—Tierra del Fuego
South Sudan
Turkmenistan
Albania
Argentina—Santa Cruz
Iran
Argentina—Mendoza
Uzbekistan
Georgia
Papua New Guinea
Mali
Yemen
Equatorial Guinea
Cameroon
Cambodia
Greece
Russia—Other
Argentina—Chubut
Myanmar
Argentina—Neuquen
Bangladesh
Russia—Offshore Sakhalin
Indonesia
Russia—Eastern Siberia
Iraq
Ukraine
Egypt
Libya
Venezuela
Russia—Offshore Arctic
Ecuador
Syria
Lebanon
Kyrgyzstan
Democratic Republic of the Congo (Kinshasa)
0%
20%
40%
60%
80%
100%
Fraser Institute Global Petroleum Survey, 2014
www.fraserinstitute.org
Appendix 1: Proved Oil and Natural Gas Reserves
Except for Canada and the United States, the proved oil and gas reserve data for countries were
sourced from the US Energy Information Administration’s (EIA) online International Energy Statistics site (US Energy Information Administration, 2014a). This approach is different from that
used in 2013 when some of the data were obtained from British Petroleum’s Statistical Review of
World Energy, and the remaining data from the EIA. Sourcing most of the data from a single source
helps to ensure consistency.
Data for the United States state and offshore regions included in the survey were obtained from the
EIA’s detailed report, US Crude Oil and Natural Gas Reserves, 2012, published in April 2014 (US
Energy Information Administration, 2014b). The US crude oil reserves data include lease condensate. Natural gas reserves comprise unprocessed or “wet” gas as the EIA now considers dry or processed natural gas as a product rather than a component of reserves.
The EIA indicates in International Energy Statistics that the oil and gas reserve data for countries
other than the US is sourced from the Oil and Gas Journal, where oil reserves generally comprise
crude oil, condensate, and natural gas liquids; natural gas reserves consist of dry gas.16 For Canada,
we relied on the oil and gas reserve data provided in the National Energy Board’s report, Canadian
Energy Overview 2013—Energy Briefing Note (June 2014) (Canada, 2014). These figures were used
rather than the EIA estimates because they are more recent and reflect the National Energy Board’s
significant upward adjustment in British Columbia’s natural gas reserves.
The way the Norwegian petroleum reserves were apportioned between Norway—North Sea and
Norway—Other Offshore was based on information from the Norwegian Petroleum Directorate
about the oil and gas reserves in the North Sea, the Norwegian Sea, and the Barents Sea. Norway
has no onshore reserves. In the case of the Netherlands, the allocation of reserves between the
onshore and the continental shelf (North Sea) regions was made according to information in the
Natural Resources and Geothermal Energy Annual Review in the Netherlands 2013 (Netherlands,
2014).
Because the United Kingdom only publishes data for so-called “P2” (proved plus probable)
reserves, we were advised to allocate the EIA’s estimate of that country’s total proved oil and gas
reserves between the North Sea and “other” offshore regions (i.e., in the Irish Sea and West of the
Shetland Islands) according to the information about those reserves as of December 31, 2013. The
UK has no significant onshore oil and gas reserves. While there has been considerable discussion
regarding possible production of natural gas from shale formations, the country’s shale deposits
remain to be commercialized.
16
For this reason, there is some inconsistency between the reserve data reported for the US and that for
other countries.
Fraser Institute Global Petroleum Survey, 2014
www.fraserinstitute.org
107
Like the UK, the government of Australia only publishes data for P2 reserves. Data for combined
proved and probable reserves in the respective states and territories, and in the offshore (like the
Northern Territory, under federal jurisdiction), were provided by Geoscience Australia. This information was used to allocate the EIA’s estimate of proved reserves among the eight Australian jurisdictions. Updated oil and gas estimates for the Australia—East Timor JPDA (also in terms of the
P2 reserves definition) were again kindly provided by Mr. G. Bethune, CEO of the Australian consulting firm Energy Quest.
For Argentina, estimates of proved oil and gas reserves as at December 31, 2012, by region were
obtained from the Argentina Department of Energy website. This information and the EIA’s estimate for the country as a whole were used to break out proved reserves for each of the six Argentine
provinces included in the survey.
With respect to Brazil, total reserves were allocated to the Brazil—Onshore and Brazil—Offshore
Concession Contracts regions according to data as at December 31, 2013 that was available on the
website of the Agencia Nacional do Petroleo (National Petroleum Agency). Because no profit sharing contracts are in place as yet for the Brazilian offshore, no reserves were allocated to the
Brazil—Offshore PSC Contracts region.
In the case of Spain, the EIA’s oil reserve estimate of 150 million barrels was reduced to 9 million
barrels according to advice provided by Spanish geologist Jorge Navarro of Compania Espanola de
Petroleos, S.A.U. (CEPSA). The allocation of total oil and gas reserves to the Spain—Onshore and
Spain—Offshore jurisdictions was based on updated information that he provided.
The most challenging task was again the allocation of reserves to the four Russian regions included
in the survey: Eastern Siberia, Offshore Sakhalin Island, Offshore Arctic, and Other. Unable to find
any definitive information about to their respective shares of the country’s reserves, we relied in
large part on insight about the allocation of Russian oil resources from a 2012 article by Ms. Yulia
Grama and on information found in the US Energy Information Administration’s most recent
country brief on Russia (Grama, 2012; US Energy Information Administration, 2013).
108
Fraser Institute Global Petroleum Survey, 2014
www.fraserinstitute.org
References
Canada, National Energy Board (2014). Canadian Energy Overview 2013—Energy Briefing Note
(June). Web page. Government of Canada. <http://www.neb-one.gc.ca/clf-nsi/
rnrgynfmtn/nrgyrprt/nrgyvrvw/cndnnrgyvrvw2013/cndnnrgyvrvw2013-eng.html>, as of
October 14, 2014.
Grama, Yulia (2012). The Analysis of Russian Oil and Gas Reserves. International Journal of
Economics and Policy 2(2): 82-91.
Netherlands, Ministry of Economic Affairs (2014). Natural Resources and Geothermal Energy in
the Netherlands. Annual Review 2013 (May). Government of the Netherlands.
<http://www.nlog.nl/resources/Jaarverslag2013/Annual_review_2013_version_0_NLOG.
pdf>, as of October 14, 2014.
US Energy Information Administration (2014a). International Energy Statistics. Web table. US
Department of Energy. <http://www.eia.gov/cfapps/ipdbproject/
IEDIndex3.cfm?tid=3&pid=3&aid=6>, as of October 14, 2014
US Energy Information Administration (2014b). U.S. Crude Oil and Natural Gas Reserves, 2012
(April). US Department of Energy <http://www.eia.gov/naturalgas/crudeoilreserves/
pdf/uscrudeoil.pdf>, as of October 14, 2014.
US Energy Information Administration (2013). Country Brief: Russia. Web page. US Department of Energy. http://www.eia.gov/countries/cab.cfm?fips=rs, as of October 14, 2014
(last updated November 26, 2013).
Fraser Institute Global Petroleum Survey, 2014
www.fraserinstitute.org
109
About the Authors
Taylor Jackson is a Policy Analyst at the Fraser Institute. He holds a BA in Political Science and is
currently an MA candidate at Simon Fraser University. Taylor is the coauthor of The Effect of Wait
Times on Mortality in Canada and of “The USA and Canada: Political and Economic Challenges
to Deeper Co-operation” in The USA and Canada, with Alexander Moens (Routledge).
Gerry Angevine is a Fraser Institute Senior Fellow. From July 2006 to the end of 2012 he was a
Senior Economist with the Institute with responsibility for energy policy studies. He launched the
global Petroleum Survey in 2007. Dr. Angevine has been President of Angevine Economic Consulting Ltd., an energy economics consulting firm, since 1999, and was a Managing Consultant with
Navigant Consulting Ltd. from 2001 to 2004. He was President, CEO, and a Director of the Canadian Energy Research Institute from 1979 to 1999. Gerry has advised the Alberta Department of
Energy and testified before the National Energy Board as an expert witness. He has also written
analyses for the Fraser Institute of Ontario’s 2007 Integrated Power System Plan and Alberta electric transmission policy as well as several studies addressing aspects of a continental energy strategy
and policy changes required to expedite investment in Canadian crude oil and natural gas transportation infrastructure. He has AM and PhD degrees in Economics from the University of Michigan, an MA Economics degree from Dalhousie University, and a BCom degree from Mount
Allison University.
Frazier Fathers received his bachelor degree from Wilfrid Laurier University before completing
graduate studies at the University of Windsor and University of Michigan where he received a pair
of Master’s degrees in Political Science and Public Policy, respectively. After completing his education, Frazier was a summer research intern for the Fraser Institute in 2013 before beginning work
as a contract researcher for the Institute and other organizations.
Kenneth P. Green is Senior Director, Natural Resources at the Fraser Institute. He received his
doctorate in Environmental Science and Engineering from the University of California, Los
Angeles (UCLA), an MS in Molecular Genetics from San Diego State University, and a BS Biology
from UCLA. Dr. Green has studied public policy involving risk, regulation, and the environment
for more than 16 years at public policy research institutions across North America. He has an
extensive publication list of policy studies, magazine articles, opinion columns, book and encyclopedia chapters, and two supplementary text books on climate change and energy policy. Ken’s
writing has appeared in major newspapers across the US and Canada, and he is a regular presence
on both Canadian and American radio and television.
110
Fraser Institute Global Petroleum Survey, 2014
www.fraserinstitute.org
Publishing Information
Distribution
These publications are available from <http://www.fraserinstitute.org> in Portable Document
Format (PDF) and can be read with Adobe Acrobat® 7 or later, or with Adobe Reader® 7 or later.
Adobe Reader® 9, the most recent version, is available free of charge from Adobe Systems Inc. and
may be downloaded from: <http://get.adobe. com/reader/>. We encourage you to install the most
recent version.
Ordering publications
For information about ordering the Fraser Institute’s printed publications, please contact the
publications coordinator
·
·
e-mail: [email protected]
telephone: 604.688.0221 ext. 580 or, toll free, 1.800.665.3558 ext. 580
Media
For media inquiries, please contact our Communications Department:
telephone: 604.714.4582 or e-mail: [email protected]
Copyright
Copyright © 2014 by the Fraser Institute. All rights reserved. No part of this publication may be
reproduced in any manner whatsoever without written permission except in the case of brief passages quoted in critical articles and reviews.
ISBN
978-0-88975-326-6
Date of issue
November 2014
Editing, design, and production
Kristin McCahon
Cover design
Bill Ray
Cover images
Glenn Beltz, Flickr
Fraser Institute Global Petroleum Survey, 2014
www.fraserinstitute.org
111
Supporting the Fraser Institute
To learn how to support the Fraser Institute, please contact
·
Development Department,
The Fraser Institute,
Fourth Floor, 1770 Burrard Street,
Vancouver, British Columbia,
Canada V6J 3G7
·
telephone, toll-free: 1.800.665.3558 ext. 586
·
e-mail: [email protected]
Purpose, funding, and independence
The Fraser Institute provides a useful public service. We report objective information about the
economic and social effects of current public policies, and we offer evidence-based research and
education about policy options that can improve the quality of life.
The Institute is a non-profit organization. Our activities are funded by charitable donations, unrestricted grants, ticket sales and sponsorships from events, the licensing of products for public distribution, and the sale of publications.
All research is subject to rigorous review by external experts, and is conducted and published separately from the Institute’s Board of Trustees and its donors.
The opinions expressed by staff or author(s) are those of the individuals themselves, and should
not be interpreted to reflect those of the Institute, its Board of Trustees, or its donors and
supporters.
As a healthy part of public discussion among fellow citizens who desire to improve the lives of people through better public policy, the Institute welcomes evidence-focused scrutiny of the research
we publish, including verification of data sources, replication of analytical methods, and intelligent debate about the practical effects of policy recommendations.
112
Fraser Institute Global Petroleum Survey, 2014
www.fraserinstitute.org
About the Fraser Institute
Our vision is a free and prosperous world where individuals benefit from greater choice, competitive markets, and personal responsibility. Our mission is to measure, study, and communicate the
impact of competitive markets and government interventions on the welfare of individuals.
Founded in 1974, we are an independent Canadian research and educational organization with locations throughout North America and international partners in over 85 countries. Our work is
financed by tax-deductible contributions from thousands of individuals, organizations, and foundations. In order to protect its independence, the Institute does not accept grants from government or
contracts for research.
Nous envisageons un monde libre et prospère, où chaque personne bénéficie d’un plus grand choix, de
marchés concurrentiels et de responsabilités individuelles. Notre mission consiste à mesurer, à étudier et
à communiquer l’effet des marchés concurrentiels et des interventions gouvernementales sur le
bien-être des individus.
Peer review
Validating the accuracy of our research
The Fraser Institute maintains a rigorous peer review process for its research. New research, major
research projects, and substantively modified research conducted by the Fraser Institute are
reviewed by a minimum of one internal expert and two external experts. Reviewers are expected to
have a recognized expertise in the topic area being addressed. Whenever possible, external review
is a blind process.
Commentaries and conference papers are reviewed by internal experts. Updates to previously
reviewed research or new editions of previously reviewed research are not reviewed unless the
update includes substantive or material changes in the methodology.
The review process is overseen by the directors of the Institute’s research departments who are
responsible for ensuring all research published by the Institute passes through the appropriate peer
review. If a dispute about the recommendations of the reviewers should arise during the Institute’s
peer review process, the Institute has an Editorial Advisory Board, a panel of scholars from Canada, the United States, and Europe to whom it can turn for help in resolving the dispute.
Fraser Institute Global Petroleum Survey, 2014
www.fraserinstitute.org
113
Editorial Advisory Board
Professor Terry L. Anderson
Professor Michael Parkin
Professor Robert Barro
Professor Friedrich Schneider
Professor Michael Bliss
Professor Lawrence B. Smith
Professor Jean-Pierre Centi
Dr. Vito Tanzi
Professor John Chant
Professor Bev Dahlby
Professor Erwin Diewert
Past members
Professor Stephen Easton
Professor Armen Alchian*
Professor J.C. Herbert Emery
Professor James M. Buchanan*†
Professor Jack L. Granatstein
Professor Friedrich A. Hayek*†
Professor Herbert G. Grubel
Professor H. G. Johnson*
Professor James Gwartney
Professor F. G. Pennance*
Professor Ronald W. Jones
Professor George Stigler*†
Dr. Jerry Jordan
Professor Edwin G. West*
Professor Ross McKitrick
Sir Alan Walters*
* Deceased
† Nobel Laureate
114
Fraser Institute Global Petroleum Survey, 2014
www.fraserinstitute.org


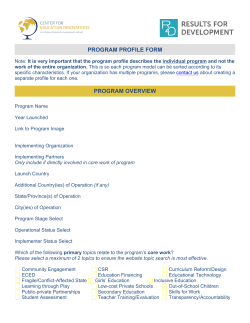


© Copyright 2026