
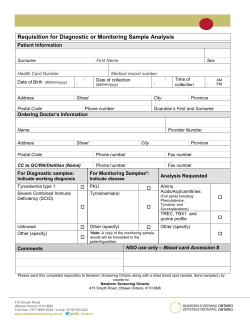
The jellification of north temperate lakes rspb.royalsocietypublishing.org
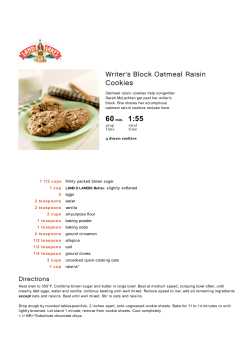
Downloaded from http://rspb.royalsocietypublishing.org/ on November 24, 2014
The jellification of north temperate lakes
rspb.royalsocietypublishing.org
Research
Cite this article: Jeziorski A et al. 2015
The jellification of north temperate lakes.
Proc. R. Soc. B 282: 20142449.
http://dx.doi.org/10.1098/rspb.2014.2449
Received: 5 October 2014
Accepted: 21 October 2014
Subject Areas:
ecology, environmental science
Keywords:
Holopedium, Daphnia, lakes, calcium decline,
jellification, nutrients
Author for correspondence:
John P. Smol
e-mail: [email protected]
Adam Jeziorski1,†, Andrew J. Tanentzap2,†, Norman D. Yan3,†, Andrew
M. Paterson4, Michelle E. Palmer5, Jennifer B. Korosi1,6, James A. Rusak4,
Michael T. Arts7, Wendel (Bill) Keller8, Ron Ingram4, Allegra Cairns3
and John P. Smol1
1
Paleoecological Environmental Assessment and Research Lab (PEARL), Department of Biology, Queen’s
University, Kingston, Ontario, Canada K7L 3N6
2
Ecosystems and Global Change Group, Department of Plant Sciences, University of Cambridge, Downing St.,
Cambridge CB2 3EA, UK
3
Department of Biology, York University, 4700 Keele St., Toronto, Ontario, Canada M3J 1P3
4
Ontario Ministry of the Environment and Climate Change, Dorset Environmental Science Centre, 1026 Bellwood
Acres Road, PO Box 39, Dorset, Ontario, Canada P0A 1E0
5
Ontario Ministry of the Environment and Climate Change, Environmental Monitoring and Reporting Branch, 125
Resources Road, Toronto, Ontario, Canada M9P 3V6
6
Department of Biology, University of Ottawa, 75 Laurier Avenue East, Ottawa, Ontario, Canada K1N 6N5
7
Department of Chemistry and Biology, Ryerson University, 350 Victoria St., Toronto, Ontario, Canada M5B 2K3
8
Cooperative Freshwater Ecology Unit, Laurentian University, 935 Ramsey Lake Road, Greater Sudbury, Ontario,
Canada P3E 2C6
Calcium (Ca) concentrations are decreasing in softwater lakes across eastern
North America and western Europe. Using long-term contemporary and
palaeo-environmental field data, we show that this is precipitating a dramatic change in Canadian lakes: the replacement of previously dominant
pelagic herbivores (Ca-rich Daphnia species) by Holopedium glacialis, a
jelly-clad, Ca-poor competitor. In some lakes, this transformation is being
facilitated by increases in macro-invertebrate predation, both from native
(Chaoborus spp.) and introduced (Bythotrephes longimanus) zooplanktivores,
to which Holopedium, with its jelly coat, is relatively invulnerable. Greater
representation by Holopedium within cladoceran zooplankton communities
will reduce nutrient transfer through food webs, given their lower phosphorus content relative to daphniids, and greater absolute abundances
may pose long-term problems to water users. The dominance of jelly-clad
zooplankton will likely persist while lakewater Ca levels remain low.
1. Introduction
†
These authors contributed equally to this
study.
Electronic supplementary material is available
at http://dx.doi.org/10.1098/rspb.2014.2449 or
via http://rspb.royalsocietypublishing.org.
The ecological impacts associated with calcium (Ca) decline are a growing
concern in aquatic ecosystems of eastern North America and northern Europe
[1–3]. This is especially true in softwater lakes where abundances of Ca-rich
Daphnia (Crustacea, Cladocera), often the dominant and keystone herbivores in
the pelagic zone, are declining [3–5]. However, not all taxa suffer when Ca
declines. Daphniids compete for food resources with another large cladoceran,
Holopedium glacialis [6–8] (previously H. gibberum [9] and hereafter called Holopedium). Because Daphnia has a heavily calcified carapace supported by a dense
network of phosphorus-rich, polyploid cells [10], it has high Ca and phosphorus
(P) needs. Holopedium lacks such a carapace, giving it about one-tenth the Ca [11]
and one-half the P [12,13] requirements of daphniids. This likely explains why
Holopedium commonly outcompetes Daphnia in softwater, oligotrophic lakes
[14]. Holopedium also sports a mucopolysaccharide jelly capsule that largely protects it from macro-invertebrate predators (figure 1), including the larval
phantom midge, Chaoborus, and the recent Eurasian invader, Bythotrephes longimanus (the spiny water flea), both of which can be major energy conduits to
fish [15], and to which most daphniid species are vulnerable [8,16].
Here we report the replacement of previously dominant Ca-rich daphniids by
Holopedium in two major lake regions of Canada separated by approximately
& 2014 The Author(s) Published by the Royal Society. All rights reserved.
Downloaded from http://rspb.royalsocietypublishing.org/ on November 24, 2014
(1) Holopedium abundances have increased since pre-industrial
times. We tested this hypothesis using sedimentary cladoceran assemblages from 84 Ontario and Nova Scotia lakes
(see electronic supplementary material, table S1).
(2) Relative and/or absolute abundances of Holopedium have
increased during the period of recent lakewater Ca
decline. We tested this hypothesis by surveying pelagic
zooplankton in 31 Ontario lakes between 1981 and 1990,
and resampling from 2004 to 2005, and with a longitudinal study of eight other Ontario lakes that were sampled
monthly for 30 years (see electronic supplementary
material, tables S2 and S3).
We expected that Ca decline would be the ultimate driver
of increases in relative and/or absolute Holopedium abundance,
both of which we term ‘jellification’, but it might not be the
proximate cause. The proximate causes could be either
bottom-up, i.e. changes in competition for food, or top-down,
i.e. changes in predation. To tease these apart, we used the
30-year longitudinal study to test four potentially co-occurring
mechanisms.
Declining populations mechanism: Holopedium increased
only in relative abundance within the planktonic cladoceran
assemblage because non-Holopedium Cladocera declined
with falling lake Ca.
2. Material and methods
(a) Have Holopedium abundances increased since
pre-industrial times?
We examined long-term changes in the relative abundance of Holopedium within the pelagic cladoceran assemblages in lake sediments
from 36 south-central Ontario lakes in 2007 [4], and 48 Nova Scotia
lakes in 2002–2004 [5] (see electronic supplementary material, table
S1). Sediment cores were collected from the deepest basin of each
lake using a gravity corer, and sectioned at 0.25 cm intervals. We
then employed the well-established ‘top/bottom’ palaeolimnological sampling design [30], wherein the chitinous cladoceran remains
were isolated, identified and compared between a ‘top’ interval
(surface sediments) representing present-day assemblages and a
‘bottom’ interval (sediment depth . 15.0 cm) representing assemblages present prior to the onset of lake acidification. Although
this protocol cannot document the timing of changes, it clearly separates modern from historical assemblages, which is what the test of
our first hypothesis required.
We counted and identified remains from a minimum of
90 individual cladocerans per sample [31,32], of which a mean
of 78 and 61% were pelagic taxa in the Ontario and Nova Scotia
lakes, respectively. This count is sufficient to characterize the
taxonomic assemblage accurately [33]. We tested whether the contribution of Holopedium to planktonic cladoceran assemblages had
changed since pre-industrial times using paired t-tests comparing
Holopedium relative abundance in the pre-industrial versus recent
Proc. R. Soc. B 282: 20142449
1500 km, i.e. south-central Ontario and Nova Scotia. In recent
decades, these Ontario lakes have changed in many ways: Ca
[3] and P concentrations [17] have declined in response to
changes in climate and acid deposition, coloured dissolved
organic carbon (DOC) has increased [16,18] partly because
increasingly base-poor catchments are retaining less organic
matter [19], and Bythotrephes has been introduced and is spreading [20]. Bythotrephes reduces populations of most daphniids
more than it does that of Holopedium [21]. The Nova Scotia
lakes have experienced similar acid deposition and Ca trends
[22,23], but they have not, as yet, been invaded by Bythotrephes.
Our goal was to determine whether declining lakewater
Ca concentrations are increasing the contribution of Holopedium to crustacean zooplankton abundance at the expense
of Daphnia. We tested two hypotheses:
2
rspb.royalsocietypublishing.org
Figure 1. A handful of Holopedium collected in a less than 10 m horizontal
net haul from Plastic Lake, Ontario, Canada. Photo by Ron Ingram, August
2011. (Inset) Holopedium painting by G.O. Sars ( property of the National
Library of Norway), with arrows demarcating the margins of the jelly capsule.
(Online version in colour.)
Less competition mechanism: Holopedium increased in absolute
abundance because there was more phytoplankton available to
support its growth, as Daphnia, the dominant cladoceran herbivore, declined with falling lakewater Ca, releasing Holopedium
from their primary cladoceran competitor [14].
More food mechanism: Holopedium increased in absolute
abundance in response to greater phytoplankton abundance
in lakes where P inputs have increased over time.
Increasing predation mechanism: Holopedium increased in
absolute and/or relative abundance because they suffered
less than daphniids from increasing predator densities. Chaoborus spp., the primary native invertebrate predator in our
lakes [15], should benefit from temporal increases in the
volume of their refuge from fish predation [24]. We predicted
greater refuge volume would accompany increased hypolimnetic oxygen depletion associated with climate warming [25]
and/or greater coloured DOC concentrations [24], both of
which might reduce predation from fish. As Chaoborus preferentially select Daphnia over Holopedium [26], greater Chaoborus
densities should thus increase the relative abundance of
Holopedium. Predation could also promote greater absolute
abundances of Holopedium if reductions in Daphnia reduce
competition for food.
By using structural equation modelling (SEM), we were
explicitly able to test the strength and direction of causal
associations underlying these four mechanisms [27]. SEM
works by optimizing the fit between predicted and observed
patterns of covariance, while respecting the constraints of a
hypothesized network of interactions [28]. Thus, it is more
powerful for disentangling the associations between the
many interacting chemical and ecological factors that
covary with zooplankton abundance than simple linear
regression [29]. An additional advantage of SEM is its incorporation of latent (i.e. unmeasured) variables, which can be
inferred from measured data (see [27,29] for details).
Downloaded from http://rspb.royalsocietypublishing.org/ on November 24, 2014
sediment datasets. We excluded lakes where Holopedium was
absent from both intervals.
(c) Discriminating among alternative mechanisms
underlying increases in Holopedium abundance
We attempted to distinguish the causal processes underlying the
long-term changes in daphniid and Holopedium abundances
using ice-free season means from the eight longitudinal study
lakes [34,36] (see electronic supplementary material, table S3).
These lakes vary in acid-sensitivity [34] and have patterns of
environmental change reflecting those of the broader region [17].
We needed composition and abundance data for crustacean zooplankton and phytoplankton, water chemistry, oxygen profiles
and abundances of Chaoborus spp. to choose among our four
hypothesized causal mechanisms. Briefly, zooplankton were
enumerated from the volume-weighted composites as described
above. Phytoplankton were sampled through the euphotic zone,
and water chemistry samples were volume-weighted composites
of all depths during isothermal periods, and of the mixed layers
during periods of vernal and autumnal stratification. Dissolved
oxygen profiles were generated at 1–2 m intervals from all
depths. Finally, abundances of the zooplanktivore Chaoborus
spp. were quantified in samples from night-time vertical hauls at
10 stations visited during the autumn in all lakes in 1986 and in
one lake from 1987 to 1994 [37]. In the laboratory, a minimum
of 300 cells, colonies or filaments of phytoplankton were counted
within the Bacillariophyceae, Chlorophyceae, Cryptophyceae,
Dinophyceae and Euglenophyceae. Dimensions of all counted
algae were measured, and standing stocks were expressed as biovolumes [38]. We derived an index of ‘edible phytoplankton’ by
summing phytoplankton biovolumes across these five families,
which are preferentially consumed by zooplankton (see the
electronic supplementary material).
Using an SEM approach, we then estimated a series of equations
(2.1)–(2.6) describing a causal network that simultaneously tested
our four hypothesized mechanisms.
(1)
y(1)
ij B(pij , Nij ):
Thus, the relative abundance of Holopedium within the planktonic cladoceran assemblage could increase simply because the
absolute number of non-Holopedium Cladocera declined (i.e. Nij
becomes smaller over time). Relative increases over time could
also arise because both p(1)
and Nij increased. Alternatively,
ij
there could be an increase in the absolute abundance of Holopedium, calculated independently of any other taxa in the
assemblage. The probability p(1)
ij would correspondingly have
increased over time.
(ii) Less competition mechanism
To test whether the number of Holopedium y(1)
ij increased with
food availability ( jij ), and whether jij increased as the dominant
Cladocera in our lakes (Daphnia spp.) declined with falling lake
Ca, we first modelled p(1)
ij as an inverse-logit of jij
(1)
logit(p(1)
þ g1 jij þ g2 Chaobij þ ni (1) þ nj (1) ,
ij ) ¼ a
(2:1)
where a (1) is the estimated mean probability of observing Holopedium across all lakes and years, g1 is the effect of food availability,
g2 is an estimated effect accounting for predation by Chaoborus
spp. (Chaobij, square-root transformed, individuals m23) and
ni (1) and nj (1) account for random variation among the i lakes
and j years and are each drawn from a normal distribution
with a mean of 0 and separately estimated standard deviation.
Although we did not observe values directly for jij, a latent
variable, we parametrized it using observed data.
We assumed that jij was approximately N(hij,sj ), and modelled mean food availability hij in each lake i in year j given
abundances of potential Daphnia competitors. Exploitative competition for limiting resources, namely food, is a major factor
structuring zooplankton communities [14]. Although larger zooplankton species can exclude smaller species because their
greater body reserves survive low food periods, this competitive
hierarchy depends on how the abundances of species vary with
levels of predation and abiotic conditions [39]. For Daphnia, the
abundances of species, and thus their competitive effects,
depend on species-specific Ca requirements [14]. We therefore
classified Daphnia species into either relatively Ca-rich
(D. dubia, D. longiremis, D. mendotae, D. pulicaria and D. retrocurva)
or Ca-poor (D. ambigua and D. catawba) groups using interspecific
differences in body Ca content [11,40] and prevalence thresholds
in field surveys [20,40] (electronic supplementary material, figure
S1). However, one single metric cannot summarize the responses
of all Ca-rich daphniids because body-size and Ca sensitivity still
vary within this group (electronic supplementary material, figure
S2). We additionally allowed for different responses within this
group by summarizing community composition with an index
Dij that reflects both the relative abundances of species and their
differences in Ca sensitivity [41]. The resulting Dij is an ‘effective’
diversity measure; e.g. a community with three species and Dij ¼
2.5 is slightly less diverse than a community of three equally
abundant taxa with totally dissimilar Ca requirements (see the
electronic supplementary material). This combination of approaches essentially allows both linear and nonlinear interactions
between Holopedium and Daphnia in our model, without assuming
any specific effect. Finally, we could not ignore herbivorous copepod species (Copij ), as their biomass (mg dry weight m23)
Proc. R. Soc. B 282: 20142449
We tested our second hypothesis using two datasets: a longitudinal study of eight Ontario lakes sampled over a 30-year period
[34], and a regional survey of 31 other Ontario lakes sampled
in the 1980s and 2004 or 2005 [35] (see electronic supplementary
material, table S2). Zooplankton were sampled during the icefree season near the point of maximum depth by using a
metered, 76 mm mesh, tow net. The net was deployed in four
to seven vertical hauls and its contents were combined to produce a composite that corrected for the diminution of lake
stratum volume with depth. A minimum of 250 crustacean zooplankton were enumerated in each composite, subsampling to
ensure that no taxon comprised more than 10% of the total
count. All Cladocera were identified to the species level [34].
To test whether the relative and absolute abundance of
Holopedium had increased in the 31 lake regional dataset, we
compared the 1980s versus 2004 – 2005 ice-free means using,
respectively, a paired t-test and a Wilcoxon signed-rank test.
The five lakes that were invaded by Bythotrephes between the
two sampling periods were analysed separately. For the eight
lake longitudinal dataset, we used Mann – Kendall trend tests
to identify whether the absolute and relative abundances of
Holopedium, daphniids and lakewater Ca concentrations had
changed in a monotonic fashion over time when averaged
across lakes in each year of the dataset. Prior to averaging absolute abundances, we standardized observations to a mean of 0
and s.d. of 1 across years in each lake.
3
We estimated the probability of observing that a random cladoceran individual in each lake i in year j was a Holopedium [p(1)
ij ],
independent of the other species in the community. We did so
assuming that the number of Holopedium individuals y(1)
ij
annually counted in each lake could be described by a binomial
distribution with Nij total number of planktonic cladoceran
individuals
rspb.royalsocietypublishing.org
(b) Are Holopedium increases consistent with recent
lakewater Ca decline?
(i) Declining populations mechanism
Downloaded from http://rspb.royalsocietypublishing.org/ on November 24, 2014
(3)
hij ¼ g3 p(2)
ij þ g4 pij þ g5[i] Dij þ g6 Copij ,
(2:2)
(2)
þ g7 Caij þ g8 Chaobij þ ni (2) þ nj (2) , ;
and logit(p(2)
ij ) ¼ a
(3)
y(3)
ij B(pij , Nij )
(2:3)
9
=
(3)
2
(3)
(3) ;
and logit(p(3)
ij ) ¼ a þ g9 Caij þ g10 Caij þ g11 Chaobij þ ni þ nj ,
(2:4)
where a (k) is the estimated mean probability of observing individuals of life group k across all lakes and years, g7, g9, g10 are
estimated effects of lake Ca, g8 and g11 are estimated effects accounting for the fact that predation by Chaoborus influences daphniid
(k)
abundances, and n(k)
i and nj account for random variation among
the i lakes and j years and are drawn from zero-mean normal distributions with separately estimated s.d. for each source of variation
associated with each life group k. We allowed the response of Carich daphniids to lakewater Ca to be nonlinear, as observed in
mid-summer surveys of 304 regional lakes [40], by including the
quadratic effect g9 Ca2ij . There was no reason to do so for Ca-poor
taxa as these are not positively associated with lakewater Ca [40].
(iii) More food mechanism
We then defined food availability jij as increasing with edible
phytoplankton biovolume (Pij, mm3 . m23), and drew Pij from a
Poisson distribution modelled as
9
=
Pij Pois(lij )
(4) ;
and log(lij ) ¼ a(4) þ jij þ g12 Nsam pij þ g13 TPij þ n(4)
i þ nj ,
(2:5)
where a (4) is mean biovolume across all years and lakes, g12 – g13
are estimated effects of the number of sampling events and total
phosphorus (TP), and ni and nj account for variation among the i
lakes and j years, respectively, and are drawn from zero-mean,
normal distributions with separately estimated s.d. We expected
Pij to increase primarily with TP, so we did not include other
chemistry variables in equation (2.5) because they covaried
with TP (e.g. Pearson’s correlation with DOC ¼ 0.68).
(iv) Increasing predation mechanism
Finally, we considered whether the relative abundances of
Holopedium and their competition for food could be changed
by Chaoborus, a principal predator of Daphnia. We modelled the
densities of Chaoborus spp. (Chaobij ) as a function of the
thickness of the hypolimnetic water layer with less than 3 mg l21
O2 (Oij ) and concentration of DOC in lakewater (DOCij ), which
both reduce predation from fish [24]
9
=
Chaobij N(mij , sChaob )
(2:6)
;
and mij ¼ a(5) þ g14 Oij þ g15 DOCij þ n(5)
i ,
(v) Model estimation
The SEM was estimated within a hierarchical Bayesian framework
using Markov chain Monte Carlo (MCMC) sampling by calling
Stan v. 2.0 [44] from R v. 3.0 [45]. Four MCMC chains of 1000 iterations were simulated, with a burn-in period of 4000 runs (see the
electronic supplementary material for details). We standardized
all estimated coefficients to a common scale with a mean of 0
and s.d. of 1, so that their effects were directly comparable. This
allowed us to test the relative importance of different causal linkages. To infer effects, we calculated posterior means and 95%
credible intervals (CIs) for each parameter by drawing a subset
of 800 simulations. We did not reject our predictions about specific
causal linkages if 95% CIs excluded zero. To summarize overall
model fit, we calculated a Bayesian R 2 at the level of our measured
data, analogous to the proportion of variance explained by a
model in classical linear regression [46]. We used three approaches
to verify convergence of our model and the structure of the SEM
was assessed using a graphical modelling approach [47] (see the
electronic supplementary material).
3. Results
(a) Have Holopedium abundances increased since
pre-industrial times?
Across both study regions, the relative contribution of Holopedium to planktonic cladoceran assemblages clearly increased
since pre-industrial times (i.e. pre-1850 or prior to the onset of
acid deposition). These increases were evident in both of our
palaeolimnological surveys as the relative abundance of Holopedium increased in 25 of the 35 Ontario lakes and 17 of the 23
Nova Scotia lakes in which it was present (paired t-test, t34 ¼
2.7, p ¼ 0.012 and t22 ¼ 2.7, p ¼ 0.013, respectively; figure 2a,b).
Furthermore, Holopedium appeared (i.e. was present in the
‘top’ samples, but was absent from the pre-industrial samples)
in 15 Ontario lakes and 11 Nova Scotia lakes, while disappearing
from only two and one lakes, respectively, suggesting that
increases in absolute abundances have also occurred.
(b) Have Holopedium abundances increased during the
recent period of lakewater Ca decline?
Holopedium has become more abundant in the 31 south-central
Ontario lakes between the 1980s and 2004–2005 as Ca declined
4
Proc. R. Soc. B 282: 20142449
where g3 – g6 are estimated effects and sj is the estimated s.d.
(3)
Mean food availability hij is directly proportional to p(2)
ij and pij .
As these probabilities will vary with lakewater Ca, we modelled
them using binomial distributions based on the number of individ(3)
uals of Ca-poor [y(2)
ij ] and Ca-rich [yij ] daphniids, respectively,
counted in lake i in each year j
9
(2)
=
y(2)
ij B(pij , Nij )
where a (5) is the estimated mean density of Chaoborus, g14 – g15 are
estimated effects of O2 and DOC and n(5)
accounts for random
i
variation among the i lakes and is drawn from a zero-mean
normal distribution with estimated s.d. Chaoborus spp. were
measured only in one lake outside of 1986, and so we could not
adequately estimate both variation among lakes and years (total
n ¼ 16). Thus, we only accounted for variation among lakes. For
all the other year lake combinations in equations (2.1), (2.3)
and (2.4), we let Chaobij take on mean observed values.
We did not directly consider how variation in predation on
Chaoborus spp. themselves influenced daphniid abundances. We
expect Chaoborus populations are likely to experience similar topdown control among lakes and whole-lake manipulative work on
nearby lakes has shown that changes in piscivorous fish communities do not influence the overall importance of Chaoborus as
zooplanktivores [43]. We did not model copepod biomass as a function of Chaoborus densities as we were not interested in estimating
the associated effects. Any changes in copepod biomass associated
with Chaoborus was reflected in the raw data and allowed us to
determine the influence of copepods on food availability.
rspb.royalsocietypublishing.org
can account for the majority of zooplankton biomass in our
study lakes, and temporal changes in their densities will influence
food available for Cladocera [6,42]. hij was then a function of the
probability of observing Ca-poor [p(2)
ij ] and Ca-rich daphniids
[p(3)
ij ], the composition of Ca-rich daphniid communities (Dij )
and Copij
Downloaded from http://rspb.royalsocietypublishing.org/ on November 24, 2014
n = 36
paired t = 2.7
p = 0.01
10
5
0
1:
1
15
n = 48
paired t = 2.5
p = 0.02
10
5
0
0
5
10
15
20
% Holopedium
pre-industrial sediments (‘bottoms’)
0
5
10
15
20
% Holopedium
pre-industrial sediments (‘bottoms’)
Holopedium in 2004−2005 (# ⋅ m−3)
3000
50
40
30
20
n = 31
paired t = 3.8
p £ 0.01
10
1:
1
1:
60
% Holopedium in 2004−2005
1
(d )
(c)
2500
2000
n = 31
W = 123
p = 0.01
1500
1000
500
w Bythotrephes
w/o Bythotrephes
0
0
0
10
20
30
40
50
% Holopedium in the 1980s
60
0
500 1000 1500 2000 2500 3000
Holopedium in the 1980s (# ⋅ m−3)
Figure 2. Temporal increases in Holopedium in two lake districts. Change in relative abundance of Holopedium since pre-industrial times in the sedimentary pelagic
cladoceran assemblages of (a) 36 lakes in south-central Ontario and (b) 48 lakes in Nova Scotia, Canada (Holopedium remains were absent from 1 and 25 of the
lakes, respectively). Change in (c) relative abundance of Holopedium in the planktonic cladoceran assemblage and (d ) absolute abundance of Holopedium from the
1980s to 2004/2005 in 31 south-central Ontario lakes, five of which were invaded by Bythotrephes between the two surveys.
by a median of 25% [17]. Holopedium relative abundances
increased in 17 of the 26 lakes that have not been invaded by
Bythotrephes; these increases ranged from 3 to 37% (paired
t-test, t25 ¼ 2.8, p ¼ 0.009, figure 2c). In each of the five invaded
lakes, Holopedium was more abundant (by 5–30%) in 2004–2005
than in the 1980s (paired t-test, t4 ¼ 3.5, p ¼ 0.024, figure 2c).
The absolute abundance of Holopedium also increased; median
abundance in the lakes doubled, from 304 animals m23 in the
1980s to 607 animals m23 in 2004–2005 (W30 ¼ 123, p ¼ 0.013,
figure 2d).
Increasing absolute abundances of Holopedium in the eight
longitudinal study lakes mirror the trends in the regional
dataset. The relative abundance of Holopedium increased in
these lakes as lakewater Ca declined (figure 3a; Mann –
Kendall test: t ¼ 0.41, p ¼ 0.002 and t ¼ 20.71, p , 0.001,
respectively). This arose partly because there were lower
absolute abundances of both Ca-rich daphniids and all
other Cladocera as Ca declined (t ¼ 20.48 and 20.55,
respectively; p , 0.001 for both). Greater absolute abundances of the two Ca-poor daphniid species over this
period (t ¼ 0.50, p , 0.001; figure 3b) could not offset these
declines, i.e. the trend in absolute abundance of all nonHolopedium Cladocera was negative (t ¼ 20.48, p , 0.001).
The increased relative abundance of Holopedium in the longitudinal study lakes was also attributable to an increase in its
absolute abundance in Harp, Heney and Red Chalk Lakes
from 1981 to 2009 (t . 0.37, p , 0.010), and in Dickie Lake
prior to recent dust suppressant (CaCl2) additions [48],
which raised lakewater Ca levels (one-tailed test for increasing
trend: t ¼ 0.33, p ¼ 0.029; see electronic supplementary
material, table S3).
(c) Discriminating among alternative mechanisms
underlying increases in Holopedium abundance
Our SEM revealed that the relative rise of Holopedium in the
eight lakes of the longitudinal study could be explained by
both declines in non-Holopedium Cladocera (‘declining populations’ mechanism) and increases in absolute numbers of
Holopedium. The latter changes were specifically associated
with reduced interspecific competition for food and declines
5
Proc. R. Soc. B 282: 20142449
% Holopedium
recent sediments (‘tops’)
15
20
rspb.royalsocietypublishing.org
20
(b)
% Holopedium
recent sediments (‘tops’)
1:
1
(a)
0.5
0.4
0.3
0.2
0.1
0
2.5
2.0
1.5
1.0
0.5
0.4
0.3
0.2
0.1
0
1980
1990
2000
2010
year
Figure 3. Effects of Ca decline on abundances of large Cladocera in eight
lakes in south-central Ontario, Canada, from 1980 to 2009. (a) Declines in
mean Ca + s.e. (grey) across the study lakes and increases in mean relative
abundances of Holopedium +95% CIs summed across the eight lakes
(black). (b) Temporal changes (mean + 95% CIs) in relative abundances
of Ca-rich (black) and Ca-poor daphniids (grey).
in Cladocera predicted by the ‘less competition’ and ‘increasing
predation’ mechanisms (figure 4).
Falling lakewater Ca was the primary explanation for
declines in dominant Daphnia spp. that have favoured Holopedium. The probability of observing Daphnia increased with
lakewater Ca in the SEM, with the effect much stronger for
Ca-rich as opposed to Ca-poor species (95% CIs: 1.09–1.14
and 0.13 –0.25, respectively). Thus, as Ca has fallen over
time, so too have Ca-rich daphniids (trends reported
above), thereby favouring a greater proportional representation of Holopedium within communities (i.e. lower Nij
predicted by ‘declining populations’ mechanism).
Falling abundances of Ca-rich Daphnia have also reduced
competition for food, supporting the ‘less competition’ mechanism. The SEM revealed that Ca-rich but not Ca-poor
Daphnia spp. reduced food availability (95% CIs: 20.06 to
20.01 and 20.32 to 0.17, respectively), and the probability
of observing Holopedium increased with more food (95% CI:
1.01– 1.17). Thus, as Ca-rich species declined, there was
more food available for Holopedium. For example, a decline
in lakewater Ca from 3 to 1 mg l21 corresponded with an
approximately 34% increase in the absolute probability of
observing Holopedium at mean levels of all other covariates
(e.g. TP and Chaoborus spp. densities) when the pathways
influenced by Ca were followed from start to finish in our
SEM (figure 4). Copepods have similarly declined over time
(t ¼ 20.40, p ¼ 0.002), increasing food available for Holopedium (95% CI for their effect on food: 20.15 to 20.12).
However, food availability did not increase in all lakes
despite declines in non-Holopedium zooplankton. This was
because the total food supply, determined by the abundance
of edible phytoplankton, depended on TP concentrations
(95% CI: 0.02–0.08), which have declined over time across
lakes (t ¼ 20.33, p , 0.014). These declining trends lend no
support to the ‘more food’ mechanism.
Although Ca-rich Daphnia have declined, the net effect on
food availability could be offset by changes associated with
their species composition (95% CIs for composition were
4. Discussion
Collectively, our analyses reveal that (i) the contribution of
Holopedium to pelagic cladoceran abundance has increased
in central and eastern softwater Canadian lakes since preindustrial times; (ii) relative and absolute abundances of
Holopedium have increased over the last 3 decades, a time of
recent lakewater Ca decline; and (iii) declining lakewater Ca
concentration is the ultimate driver explaining the Holopedium
rise, though changes in TP, hypolimnetic anoxia and invading
Bythotrephes may be contributing causes in some lakes.
(a) Drivers of increased relative and absolute
abundances
Holopedium abundance increased principally because Ca-rich
daphniid populations fell with declining lakewater Ca. The
survival, growth, development and reproduction of daphniids
is known to be reduced at Ca levels below 1.5–2 mg l21 [49,50].
Delayed maturation at low Ca consequently limits the population growth of daphniids consistent with our ‘declining
populations’ mechanism. Daphniids are also more vulnerable
to at least one key predator (Chaoborus) at low Ca because
their ability to produce anti-Chaoborus defences (larger
bodies, more rigid carapaces and projecting neck teeth) is compromised [50]. Thus, greater predation on daphniids at low Ca,
predicted by our ‘increasing predation’ mechanism, likely
further increased the relative abundance of Holopedium.
Our SEM also suggests that ‘less competition’ for
resources with other herbivorous zooplankton, principally
daphniids, is linked to increasing absolute abundances of
Holopedium as Ca levels decline. Competition between Holopedium and Daphnia is well documented [6–8,14], and a
comparison of recent daphniid and Holopedium fecundity
supports the competition mechanism. In the regional-scale
monitoring survey, the average clutch size of Holopedium
was twice that of its most common daphniid competitors
(electronic supplementary material, figure S2), suggesting it
6
Proc. R. Soc. B 282: 20142449
proportional abundance
(b)
negative in five lakes and positive in three; electronic supplementary material, table S4). Thus, overall food availability
increased only in two lakes (Heney and Red Chalk), explaining
why the absolute number of Holopedium has increased in these
two lakes but not the others. There was no increase in food
availability in Harp Lake despite increases in Holopedium
reported earlier, because we only included years prior to
Bythotrephes invasion in the SEM (1980–1992; electronic supplementary material, table S3). Absolute abundances of
Holopedium only increased when we also considered the
years after the invasion.
Finally, the SEM supported our ‘increasing predation’ mechanism, which predicted that Holopedium increased in relative
abundance because they suffered less from predation by
Chaoborus than did Daphnia (95% CIs for effect on Ca-rich Daphnia, Ca-poor Daphnia, Holopedium: 20.21 to 20.11, 20.20 to
20.09, 20.26 to 1.01, respectively). Declines in Daphnia from
predation will have also increased food availability, promoting
greater absolute abundances of Holopedium (figure 4). These
changes may continue into the future as Chaoborus densities
increased with the thickness of hypoxic water (95% CI: 0.23–
13.6), which has increased over time (t ¼ 0.30, p ¼ 0.023), and
most strongly in recent years.
rspb.royalsocietypublishing.org
Ca (mg l–1)
(a) 3.0
proportional abundance
Downloaded from http://rspb.royalsocietypublishing.org/ on November 24, 2014
Downloaded from http://rspb.royalsocietypublishing.org/ on November 24, 2014
(i)
7
increasing predation
rspb.royalsocietypublishing.org
volume
<3 mg l–1 O2
DOC
Chaoborus
lakewater Ca
(ii) less competition
copepods
Ca-rich
diversity
Ca-rich
Daphnia
Ca-poor
Daphnia
no. Cladocera (N)
available food
probability of
Holopedium
no. Holopedium
(iii) more food
phytoplankton
sampling
intensity
TP
effect direction
negative
neutral
positive
absolute effect size
0–1.0
1.0–4.0
4.0–8.0
Figure 4. Structural equation model predicting causal linkages among lakewater Ca and Cladocera groups. Directional arrows denote direct effects of one variable on
another and are proportional to effect size (see legend). Four alternate and mutually inclusive mechanisms explaining increased abundances of Holopedium are
associated with broken boxes. These test whether Holopedium are more abundant because they have more access to food, associated with (i) increased predation
by Chaoborus on Daphnia due to larger refuge from fish predation; (ii) declines in competition from lower abundances of Ca-rich and Ca-poor Daphnia due to
lakewater Ca, accounting for compositional changes in Daphnia (Ca-rich diversity) and copepod biomass; (iii) eutrophication and/or (iv) because other Cladocera
have become rarer. Bayesian R 2 measuring model fit to Holopedium, Ca-rich and Ca-poor daphniids, phytoplankton and Chaoborus measurements ¼ 0.99, 0.65,
0.60, 0.50 and 0.75, respectively (see electronic supplementary material, figure S3). (Online version in colour.)
was better able to secure the limiting food resources that
reproduction requires. Among daphniids, only the relatively
rare D. dentifera and D. pulicaria, which are much larger
and thus more likely controlled by fish predation, equalled
Holopedium’s fecundity.
Declining TP levels did not support our ‘more food’
mechanism, but they could be promoting greater absolute
abundances of Holopedium by reducing the competitive
effects of Daphnia. First, daphniids likely have to eat more
than Holopedium to get the P they need, because their P content is twice as high [12,13]. This should make them more
vulnerable than Holopedium to falling food levels, particularly
if they are poorer competitors. Thus, the competitive effects of
daphniids may further depend on whether food supplies
exceed the levels required to meet basic metabolic needs.
Holopedium’s advantage could also be enhanced if algal P
content declines with falling TP levels [51]. Additional data
on nutritional thresholds and phytoplankton community
composition would help to test these explanations.
Many environmental changes other than Ca decline
influence zooplankton, though they are unlikely to be the dominant factor explaining the rise of Holopedium. For example, the
SEM suggests that recent declines in hypolimnetic oxygen
levels due to climate warming [25] can promote abundances
of Chaoborus, which prey more heavily on daphniids than
Holopedium (‘increasing predation’ mechanism). However, predation risk is not increasing universally, as factors such as the
spread of the piscivorous bass across Ontario [52] may lower
the abundance of some planktivores, in turn reducing pressure
on both Daphnia and Holopedium. Levels of coloured DOC
[17,18] have also been rising in many Ontario lakes, though
we found no evidence in our SEM that this has been large
enough to benefit Holopedium. Holopedium abundances have
increased over a broad range of DOC concentrations in both
Ontario and Nova Scotia (1.4–12.7 mg l21) [4,5], so high DOC
is clearly not a requirement of Holopedium increases. While
our survey data also suggest the Bythotrephes invasion is promoting Holopedium (figure 2), Holopedium have increased in
the majority of our study lakes in the absence of this invasion.
One factor we excluded from our SEM was pH, because
lake acidity was an unlikely factor in the observed increases
in Holopedium. Although Holopedium is much more acidtolerant than Daphnia [14,53], and its relative abundance
increased in Nova Scotia lakes that declined in pH [22],
there have also been widespread reductions in lake acidity
in south-central Ontario [34]. We might have expected
increases in Daphnia abundance at the expense of Holopedium
in Ontario, if lake acidity was the key driver, but the reverse
was observed.
(b) Consequences of an increasingly jellied future
Our results signal a shift in the ecological state of temperate
softwater lakes of eastern North America. Holopedium is
widespread in these lakes [54], and we have shown both its
relative and absolute abundances are increasing with widespread Ca decline. This will likely reduce vertical energy
and nutrient transport in lake food webs [55]. Both the
Proc. R. Soc. B 282: 20142449
(iv) declining populations
Downloaded from http://rspb.royalsocietypublishing.org/ on November 24, 2014
of filter-clogging jelly capsules increase [62]. In Ontario, 20%
of government-monitored drinking water systems draw only
from surface waters within landscapes containing lakes
with Ca concentrations less than or equal to 3.5 mg l21 (electronic supplementary material, figure S4), levels that favour
Holopedium (electronic supplementary material, figure S3).
Our results show that the continued jellification of pelagic
food webs, due to ongoing declines in lakewater Ca, and exacerbated by other environmental stressors, has the potential to
negatively impact the functioning of, and services provided
by, temperate lakes in eastern North America.
Funding statement. This work was primarily supported by grants from
the Natural Sciences and Engineering Research Council of Canada
and funding from the Ontario Ministry of the Environment and
Climate Change.
References
1.
Stoddard JL et al. 1999 Regional trends in aquatic
recovery from lake acidification in North America and
Europe. Nature 401, 575–578. (doi:10.1038/44114)
2. Skjelkva˚le BL et al. 2005 Regional scale evidence for
improvements in surface water chemistry 1990 –
2001. Environ. Pollut. 137, 165–176. (doi:10.1016/
j.envpol.2004.12.023)
3. Jeziorski A et al. 2008 The widespread threat of
calcium decline in fresh waters. Science 322, 1374 –
1377. (doi:10.1126/science.1164949)
4. Jeziorski A, Paterson AM, Smol JP. 2012 Changes
since the onset of acid deposition among calciumsensitive cladoceran taxa within softwater lakes of
Ontario, Canada. J. Paleolimnol. 48, 323 –337.
(doi:10.1007/s10933-012-9600-y)
5. Korosi JB, Smol JP. 2012 A comparison of presentday and pre-industrial cladoceran assemblages from
softwater Nova Scotia (Canada) lakes with different
regional acidification histories. J. Paleolimnol. 47,
43 –54. (doi:10.1007/s10933-011-9547-4)
6. Hessen DO. 1985 Filtering structures and particle
size selection in coexisting Cladocera. Oecologia 66,
368–372. (doi:10.1007/BF00378300)
7. Persaud AD, Dillon PJ, Lasenby D, Yan ND. 2009
Stable isotope variability of meso-zooplankton
along a gradient of dissolved organic carbon.
Freshw. Biol. 54, 1705–1719. (doi:10.1111/j.13652427.2009.02224.x)
8. Allan JD. 1973 Competition and the relative
abundances of two cladocerans. Ecology 54,
484–498. (doi:10.2307/1935334)
9. Rowe CL, Adamowicz SJ, Hebert PDN. 2007 Three new
cryptic species of the freshwater zooplankton genus
Holopedium (Crustacea: Branchiopoda: Ctenopoda),
revealed by genetic methods. Zootaxa 1656, 1–49.
10. Beaton MJ, Hebert PDN. 1989 Miniature genomes
and endopolypoidy in cladoceran crustaceans.
Genome 32, 1048– 1053. (doi:10.1139/g89-552)
11. Jeziorski A, Yan ND. 2006 Species identity and
aqueous calcium concentrations as determinants of
calcium concentrations of freshwater crustacean
zooplankton. Can. J. Fish. Aquat. Sci. 63, 1007–
1013. (doi:10.1139/f06-019)
12. Andersen T, Hessen DO. 1991 Carbon, nitrogen, and
phosphorus content of freshwater zooplankton.
Limnol. Oceanogr. 36, 807– 814. (doi:10.4319/lo.
1991.36.4.0807)
13. McCarthy V, Irvine K. 2010 A test of stoichiometry
across six Irish lakes of low-moderate nutrient status
and contrasting hardness. J. Plankton Res. 32,
15 –29. (doi:10.1093/plankt/fbp103)
14. Hessen DO, Faafeng BA, Andersen T. 1995
Competition or niche segregation between
Holopedium and Daphnia; empirical light on abiotic
key parameters. Hydrobiologia 307, 253– 261.
(doi:10.1007/BF00032019)
15. McQueen DJ, Ramcharan CW, Yan ND. 2001 Summary
and emergent properties—part 12 of the Dorset
food web piscivore manipulation project. Arch.
Hydrobiol. Spec. Issues Adv. Limnol. 56, 257–288.
16. Wissel B, Boeing WJ, Ramcharan CW. 2003 Effects of
water color on predation regimes and zooplankton
assemblages in freshwater lakes. Limnol. Oceanogr.
46, 1965–1976. (doi:10.4319/lo.2003.48.5.1965)
17. Palmer ME, Yan ND, Paterson AM, Girard RE. 2011
Water quality changes in south-central Ontario lakes
and the role of local factors in regulating lake
response to regional stressors. Can. J. Fish. Aquat.
Sci. 68, 1038 –1050. (doi:10.1139/f2011-041)
18. Monteith DT et al. 2007 Dissolved organic carbon
trends resulting from changes in atmospheric
deposition chemistry. Nature 450, 537– 541.
(doi:10.1038/nature06316)
19. Kerr JG, Eimers MC. 2012 Decreasing soil water
Ca2þ reduces DOC adsorption in mineral soils:
implications for long-term DOC trends in an upland
20.
21.
22.
23.
24.
25.
26.
forested catchment in southern Ontario, Canada. Sci.
Total Environ. 427 – 428, 298–307. (doi:10.1016/j.
scitotenv.2012.04.016)
Kim N, Walseng B, Yan ND. 2012 Will
environmental calcium declines in Canadian Shield
lakes help or hinder Bythotrephes establishment
success? Can. J. Fish. Aquat. Sci. 69, 810 –820.
(doi:10.1139/f2012-024)
Kim N, Yan ND. 2010 Methods for rearing the
invasive zooplankter Bythotrephes in the laboratory.
Limnol. Oceanogr. Methods 8, 552–561. (doi:10.
4319/lom.2010.8.552)
Clair TA, Dennis IF, Vet R. 2011 Water chemistry and
dissolved organic carbon trends in lakes from
Canada’s Atlantic Provinces: no recovery from
acidification measured after 25 years of lake
monitoring. Can. J. Fish. Aquat. Sci. 68, 663–674.
(doi:10.1139/f2011-013)
Korosi JB, Ginn BK, Cumming BF, Smol JP. 2013
Establishing past environmental conditions and
tracking long-term environmental change in the
Canadian Maritime provinces using lake sediments.
Environ. Rev. 21, 15 –27. (doi:10.1139/er-20120041)
Wissel B, Yan N, Ramcharan C. 2003 Predation
and refugia: implications for Chaoborus
abundance and species composition. Freshw. Biol. 48,
1421–1431. (doi:10.1046/j.1365-2427.2003.01100.x)
Stefan HG, Hondzo M, Fang X, Eaton JG, McCormick
JH. 1996 Simulated long-term temperature and
dissolved oxygen characteristics of lakes in the
north-central United States and associated fish
habitat limits. Limnol. Oceanogr. 41, 1124– 1135.
(doi:10.4319/lo.1996.41.5.1124)
Vinyard GL, Menger RA. 1980 Chaoborus americanus
predation on various zooplankters; functional
response and behavioral observations. Oecologia 45,
90– 93. (doi:10.1007/BF00346712)
Proc. R. Soc. B 282: 20142449
Acknowledgements. We thank the Ontario Ministry of the Environment
and Climate Change Drinking Water Surveillance Program for
enabling the production of electronic supplementary material,
figure S4 and three reviewers for their constructive comments.
8
rspb.royalsocietypublishing.org
declining availability of daphniid prey and the relative ease
with which planktivorous fish consume Holopedium [56],
suggest that this taxon will increasingly dominate the diet
of zooplanktivorous fish. Although Holopedium and daphniids have similar fatty acid content and composition [57],
Holopedium has much lower P and Ca content than its daphniid competitors [11– 13]. Thus, with its increasing
dominance, fewer essential nutrients will be transferred to
planktivorous fish [58]. The co-occurring copepods have
low P content matching Holopedium [12,59]. These changes
may also be quite long-lasting if acid deposition rates continue to exceed mineralogical weathering rates [60,61],
reducing exchangeable Ca levels in soils, and ultimately in
downstream waters.
As Ca declines, the rise in the absolute abundance of
Holopedium may also have socioeconomic consequences,
because increased concentrations of pelagic jelly may impede
the withdrawal of lakewater for residential, municipal and
industrial uses. The costs of operating infrastructure for water
users will therefore rise as Ca continues to decline and densities
Downloaded from http://rspb.royalsocietypublishing.org/ on November 24, 2014
39.
40.
41.
43.
44.
45.
46.
47.
48.
49.
50.
51. Painter DS, Kamaitis G. 1987 Reduction of
Cladophora biomass and tissue phosphorus in Lake
Ontario, 1972–1983. Can. J. Fish. Aquat. Sci. 44,
2212– 2215. (doi:10.1139/f87-271)
52. Vander Zanden MJ, Olden JD, Thorne JH, Mandrak NE.
2004 Predicting occurrences and impacts of
smallmouth bass introductions in north temperate
lakes. Ecol. Appl. 14, 132–148. (doi:10.1890/02-5036)
53. Keller W, Pitblado JR. 1984 Crustacean plankton in
Northeastern Ontario lakes subjected to acidic
deposition. Water Air Soil Pollut. 23, 271–291.
(doi:10.1007/BF00283204)
54. Merrix-Jones FL, Thackeray SJ, Ormerod SJ. 2013
A global analysis of zooplankton in natural and
artificial fresh waters. J. Limnol. 72, 140 –153.
(doi:10.4081/jlimnol.2013.e12)
55. Ramcharan CW, McQueen DJ, Perez-Fuentetaja A, Yan
ND, Demers E, Rusak J. 2001 Analyses of lake food
webs using individual-based models to estimate
Chaoborus production and consumption. Arch.
Hydrobiol. Spec. Issues Adv. Limnol. 56, 101–126.
56. Arts MT, Sprules WG. 1989 Use of enclosures to
detect the contribution of particular zooplankton to
growth of young-of-the-year yellow perch (Perca
flavescens Mitchell). Oecologia 81, 21 –27. (doi:10.
1007/BF00377004)
57. Persson J, Vrede T. 2006 Polyunsaturated fatty acids
in zooplankton: variation due to taxonomy and
trophic position. Freshw. Biol. 51, 887–900.
(doi:10.1111/j.1365-2427.2006.01540.x)
58. Malzahn A, Aberle N, Clemmesen C, Boersma M. 2007
Nutrient limitation of primary producers affects
planktivorous fish condition. Limnol. Oceanogr. 52,
2062–2071. (doi:10.4319/lo.2007.52.5.2062)
59. Sterner RW, Elser JJ, Hessen DO. 1992
Stoichiometric relationships among producers,
consumers and nutrient cycling in pelagic
ecosystems. Biogeochemistry 17, 49 –67. (doi:10.
1007/BF00002759)
60. Whitfield CJ, Watmough SA, Aherne J, Dillon PJ. 2006
A comparison of weathering rates for acid-sensitive
catchments in Nova Scotia, Canada and their impact
on critical load calculations. Geoderma 136, 899–911.
(doi:10.1016/j.geoderma.2006.06.004)
61. Watmough SA, Aherne J. 2008 Estimating calcium
weathering rates and future lake calcium
concentrations in the Muskoka-Haliburton region of
Ontario. Can. J. Fish. Aquat. Sci. 65, 821–833.
(doi:10.1139/f07-196)
62. Thelen AC. 2012 Population dynamics of
Holopedium gibberum in a Pacific Northwest
drinking water reservoir: effects of temperature,
food, and competition. MSc thesis, University of
Washington, USA.
9
Proc. R. Soc. B 282: 20142449
42.
waterworks operation internal methods manual.
Toronto, Canada: Queen’s Printer for Ontario.
Lynch M. 1979 Predation, competition, and
zooplankton community structure: an experimental
study. Limnol. Oceanogr. 24, 253–272. (doi:10.
4319/lo.1979.24.2.0253)
Cairns A. 2010 Field assessments and evidence of
impact of calcium decline on Daphnia (Crustacea,
Anomopoda) in Canadian Shield lakes. MSc thesis,
York University, Canada.
Leinster T, Cobbold CA. 2012 Measuring diversity:
the importance of species similarity. Ecology 93,
477 –489. (doi:10.1890/10-2402.1)
Geller W, Mu¨iller H. 1981 The filtration apparatus of
Cladocera: filter mesh-sizes and their implications
on food selectivity. Oecologia 49, 316 –321. (doi:10.
1007/BF00347591)
Ramcharan C, Yan ND, McQueen DJ, PerezFuentetaja A, Demers E, Rusak J. 2001 Complex
responses of Chaoborus to changes in fish
populations. Arch. Hydrobiol. Spec. Issues Adv.
Limnol. 56, 81 –100.
Stan Development Team. 2012 Stan modeling
language: user’s guide and reference manual.
Version 2.0. See http://mc-stan.org/
R Development Core Team. 2013 R: a language and
environment for statistical computing. Vienna,
Austria: R Foundation for Statistical Computing. See
http://www.R-project.org/.
Gelman A, Pardoe I. 2006 Bayesian measures of
explained variance and pooling in multilevel
(hierarchical) models. Technometrics 48, 241–251.
(doi:10.1198/004017005000000517)
Grace JB, Schoolmaster DR, Guntenspergen GR,
Little AM, Mitchell BR, Miller KM, Schweiger EW.
2012 Guidelines for a graph-theoretic
implementation of structural equation modeling.
Ecosphere 3, art73. (doi:10.1890/ES12-00048.1)
Yao H, McConnell C, Somers KM, Yan ND,
Watmough S, Scheider W. 2011 Nearshore human
interventions reverse patterns of decline in lake
calcium budgets in central Ontario as demonstrated
by mass-balance analyses. Water Resour. Res. 47,
W06521. (doi:10.1029/2010WR010159)
Ashforth D, Yan ND. 2008 The interactive effects of
calcium concentration and temperature on the
survival and reproduction of Daphnia pulex at high
and low food concentrations. Limnol. Oceanogr. 53,
420 –432. (doi:10.4319/lo.2008.53.2.0420)
Riessen HP, Linley RD, Altshuler I, Rabus M, Sollradl
T, Clausen-Schaumann H, Laforsch C, Yan ND. 2012
Changes in water chemistry can disable plankton
prey defenses. Proc. Natl Acad. Sci. USA 109,
15 377– 15 382. (doi:10.1073/pnas.1209938109)
rspb.royalsocietypublishing.org
27. Shipley B. 2000 Cause and correlation in biology.
Cambridge, UK: Cambridge University Press.
28. Shipley B. 1999 Testing causal explanations in
organismal biology: causation, correlation and
structural equation modelling. Oikos 86, 374–382.
(doi:10.2307/3546455)
29. Tanentzap AJ, Lee WG, Monks A, Ladley K, Johnson
PN, Rogers GM, Comrie JM, Clarke DA, Hayman E.
2014 Identifying pathways for managing multiple
disturbances to limit plant invasions. J. Appl. Ecol.
51, 1015 –1023. (doi:10.1111/1365-2664.12271)
30. Smol JP. 2008 Pollution of lakes and rivers: a
paleoenvironmental perspective, 2nd edn. Oxford,
UK: Wiley-Blackwell Publishing.
31. Korosi JB, Smol JP. 2012 An illustrated guide to the
identification of cladoceran subfossils from lake
sediments in northeastern North America: part 1—
the Daphniidae, Leptodoridae, Bosminidae,
Polyphemidae, Holopedidae, Sididae, and
Macrothricidae. J. Paleolimnol. 48, 571–586.
(doi:10.1007/s10933-012-9632-3)
32. Korosi JB, Smol JP. 2012 An illustrated guide to the
identification of cladoceran subfossils from lake
sediments in northeastern North America: part 2—
the Chydoridae. J. Paleolimnol. 48, 587 –622.
(doi:10.1007/s10933-012-9636-z)
33. Kurek J, Korosi JB, Jeziorski A, Smol JP. 2010
Establishing reliable minimum count sizes for
cladoceran subfossils sampled from lake sediments.
J. Paleolimnol. 44, 603–612. (doi:10.1007/s10933010-9440-6)
34. Yan ND et al. 2008 Long-term trends in
zooplankton of Dorset, Ontario, lakes: the probable
interactive effects of changes in pH, total
phosphorus, dissolved organic carbon, and
predators. Can. J. Fish. Aquat. Sci. 65, 862 –877.
(doi:10.1139/f07-197)
35. Palmer ME, Yan ND. 2013 Decadal-scale regional
changes in Canadian freshwater zooplankton: the
likely consequence of complex interactions among
multiple anthropogenic stressors. Freshw. Biol. 58,
1366–1378. (doi:10.1111/fwb.12133)
36. Paterson AM, Winter JG, Nicholls KH, Clark BJ,
Ramcharan CW, Yan ND, Somers KM. 2008 Longterm changes in phytoplankton composition in
seven Canadian Shield lakes in response to multiple
anthropogenic stressors. Can. J. Fish. Aquat. Sci. 65,
846–861. (doi:10.1139/f08-022)
37. Yan N, Nero R, Keller W, Lasenby D. 1985 Are
Chaoborus larvae more abundant in acidified than in
non-acidified lakes in central Canada. Ecography 8,
93–99. (doi:10.1111/j.1600-0587.1985.tb01158.x)
38. Hopkins GE, Standke SJ. 1992 Phytoplankton
methods manual: with special emphasis on


© Copyright 2026