
Astronomy Astrophysics
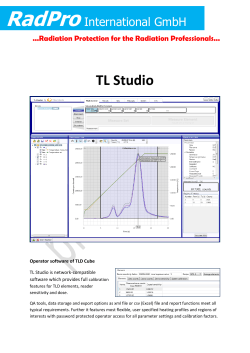
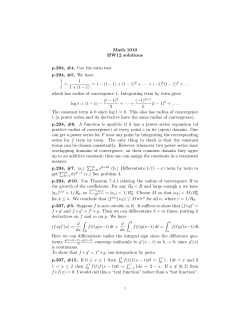
Astronomy
&
Astrophysics
A&A 571, A97 (2014)
DOI: 10.1051/0004-6361/201424487
c ESO 2014
Fast gain calibration in radio astronomy using alternating direction
implicit methods: Analysis and applications
Stefano Salvini1 and Stefan J. Wijnholds2
1
2
Oxford e-Research Centre, 7 Keble Road, OX1 3QG, Oxford, UK
e-mail: [email protected]
Netherlands Institute for Radio Astronomy (ASTRON), PO Box 2, 7990 AA Dwingeloo, The Netherlands
e-mail: [email protected]
Received 27 June 2014 / Accepted 18 August 2014
ABSTRACT
Context. Modern radio astronomical arrays have (or will have) more than one order of magnitude more receivers than classical synthesis arrays, such as the VLA and the WSRT. This makes gain calibration a computationally demanding task. Several alternating
direction implicit (ADI) approaches have therefore been proposed that reduce numerical complexity for this task from O(P3 ) to O(P2 ),
where P is the number of receive paths to be calibrated
Aims. We present an ADI method, show that it converges to the optimal solution, and assess its numerical, computational and statistical performance. We also discuss its suitability for application in self-calibration and report on its successful application in LOFAR
standard pipelines.
Methods. Convergence is proved by rigorous mathematical analysis using a contraction mapping. Its numerical, algorithmic, and
statistical performance, as well as its suitability for application in self-calibration, are assessed using simulations.
Results. Our simulations confirm the O(P2 ) complexity and excellent numerical and computational properties of the algorithm. They
also confirm that the algorithm performs at or close to the Cramer-Rao bound (CRB, lower bound on the variance of estimated parameters). We find that the algorithm is suitable for application in self-calibration and discuss how it can be included. We demonstrate
an order-of-magnitude speed improvement in calibration over traditional methods on actual LOFAR data.
Conclusions. In this paper, we demonstrate that ADI methods are a valid and computationally more efficient alternative to traditional
gain calibration methods and we report on its successful application in a number of actual data reduction pipelines.
Key words. instrumentation: interferometers – methods: numerical – methods: statistical – techniques: interferometric
1. Introduction
Antenna-based gain calibration is a key step in the data reduction
pipeline of any radio telescope. A commonly used method of
estimating these antenna-based gains and possible other parameters in a (self-)calibration process is the Levenberg-Marquardt
(LM) nonlinear least squares solver. Theoretically, the LM algorithm has at least O(N 3 ) complexity, where N is the number
of free parameters to be estimated. The LM solver has proved
its value in self-calibration processes, but it is becoming a limiting factor in (near) real-time pipelines for modern telescopes,
such as the Low Frequency Array (LOFAR, de Vos et al. 2009;
Van Haarlem et al. 2013) and the Murchison Widefield Array
(MWA, Lonsdale et al. 2009; Bowman et al. 2013), owing to
its cubic scaling with the number of receivers. The situation
will only become worse for the Square Kilometre Array (SKA,
Dewdney et al. 2009, 2013).
This has motivated researchers to search for faster solvers
with better scalability for antenna based gain calibration.
Hamaker (2000) has already noted that solving for the gain of
one specific receive path, assuming that all other receive paths
are already calibrated while iterating over all antennas, could
potentially be a fast way to solve for antenna-based gains in full
polarization. This leads to an alternating direction implicit (ADI)
method, which is used in the MWA real-time system for tile
based calibration (Mitchell et al. 2008). In the MWA pipeline,
the gain estimates found for a given timeslice are used as initial
estimates for the next timeslice. This makes a single iteration
sufficient for achieving the required calibration accuracy. This
cleverly exploits the electronic stability of the MWA system.
Mitchell et al. (2008) also proposed to reduce the noise on the
estimates by using a weighted average between the current and
previous gain estimates.
Salvini et al. (2011) showed that averaging the odd and even
iterations not only reduces the noise on the estimates, but also
considerably increases the rate of convergence and the robustness of the method. ADI methods have O(P2 ) complexity where
P is the number of receive paths to be calibrated. Since the number of visibilities also scales with P2 , these algorithms scale linearly with the number of data points and therefore have the lowest possible computational complexity for algorithms exploiting
all available information.
Iterative algorithms, such as the ADI method presented in
this paper, can be sensitive to the choice of initial estimates
or exhibit slow convergence. In Sect. 4 we therefore provide a
rigorous convergence analysis. This gives a clear view of the
algorithm’s effectiveness and its potential limitations. We also
discuss why these limitations are unlikely to hamper proper
performance of the algorithm in practical radio astronomical
applications, as by its actual use.
Hamaker (2000), Mitchell et al. (2008), and Salvini et al.
(2011) have derived the basic ADI iteration from the unweighted
least squares cost function. In practice, weighted least squares
methods are known to provide more accurate estimates if the
Article published by EDP Sciences
A97, page 1 of 14
A&A 571, A97 (2014)
signal-to-noise ratio (S/N) varies widely among data points. In
this paper, we therefore start our derivation from the weighted
least squares cost function and show that radio astronomical arrays can usually exploit the unweighted LS method.
In Sect. 5, we compare the statistics of the gain estimates
produced by the algorithm in Monte Carlo simulations with the
Cramer-Rao bound (CRB). The CRB is the theoretical lower
bound on the covariance of the estimated parameters obtained
by an ideal unbiased estimator. The results indicate that the algorithm performs at the CRB when the covariance matched and
unweighted least squares cost functions coincide (as expected)
while performing very close to the CRB in most realistic scenarios. In the radio astronomical community, the ADI method
presented in this paper is now usually referred to as StefCal, a
name coined in jest by our colleagues Oleg Smirnov and Ilse
van Bemmel. In view of its (close to) statistically efficient performance and high computational efficiency, we adapted the name
to StEFCal, an admittedly rather contrived acronym for “statistically efficient and fast calibration”.
StEFCal provides a considerable computational advantage
over algorithms derived from the weighted least squares cost
function, which usually scale with P3 (Ng & See 1996; Boonstra
& van der Veen 2003; Wijnholds & van der Veen 2009). In
Sect. 5 we also consider the computational performance of
StEFCal, highlighting its low computational complexity as well
as its efficiency, its very small memory footprint, and scalability
with problem size.
In Sect. 6, we briefly discuss the extension of StEFCal to
full polarization calibration. This is now used routinely within
MEqTrees (Noordam & Smirnov 2010) and the LOFAR standard preprocessing pipeline (Salvini & Wijnholds 2014a). Our
simulations in Sect. 5 also show that StEFCal is suitable for integration in self-calibration approaches that rely on iterative refinement of the source model. In Sect. 7, we show that StEFCal
can be easily integrated in an actual system by reporting on the
successful integration of StEFCal in a calibration pipeline for a
LOFAR subsystem.
We conclude our paper in Sect. 8 by discussing possible
alternative variants of the algorithm and possibilities for integrating StEFCal as a building block in other calibration algorithms, including algorithms dealing with direction-dependent
gains, such as SAGECal (Yatawatta et al. 2009; Kazemi et al.
2011) and the differential gains method proposed by Smirnov
(2011), corrupted or missing data values and polarization. For
convenience of the reader, Table 1 summarizes the notational
conventions and frequently used symbols in this paper.
2. Problem statement
2.1. Measurement equation
The radio astronomical system to be calibrated can have
many different architectures. For example, antenna-based gain
calibration can be applied to a synthesis array of dishes in interferometers, such as the VLA or the WSRT, but also to a synthesis array of stations in instruments, such as LOFAR or the
envisaged Low Frequency Aperture Array (LFAA) system for
the SKA (Dewdney et al. 2013). Antenna-based gain calibration
is also required within an aperture array station, where it becomes tile-based calibration in systems, such as the LOFAR high
band antenna system (Van Haarlem et al. 2013) or the MWA. In
this paper, we will therefore use generic terms, such as “receiving element”, “element” or “antenna” to denote an individual
element in a (synthesis) array instead of architecture-dependent
A97, page 2 of 14
Table 1. Notation and frequently used symbols.
a
a
A
A:,k
diag (·)
(·)∗
(·)T
(·)H
(·)[i]
E {A}
R
M
scalar value
vector a
matrix A
kth column of the matrix A
converts a vector into a diagonal matrix
Hadamard or element-wise product of matrices or
vectors
conjugation
transpose
Hermitian transpose
value at the ith iteration
expected value of A
array covariance matrix, diagonal set to zero
model cov. matrix of observed scene, diagonal set
to zero
vector of complex valued receiver path gains
G = diag (g)
− GMGH
Δ=R
g
G
Δ
terms such as “dish”, “station” or “tile”. We will also use the
word “array” to refer to the system of elements to be calibrated
instead of specific terms such as “station array”, “synthesis array” or “tile array”.
In this paper, we consider the scalar measurement equation
or data model. The ADI method can be extended to full polarization as shown by Hamaker (2000), Mitchell et al. (2008) and
Salvini & Wijnholds (2014a,b), but this complicates the analysis unnecessarily. In our analysis, we assume that the source and
noise signals are represented by complex valued samples that are
mutually and temporally independent and that can be modeled
as identically distributed Gaussian noise. We assume that these
signals are spectrally filtered such that the narrowband condition (Zatman 1998) holds, which ensures that time delays can be
represented by multiplication by phasors.
Besides allowing this representation of time delays, spectral filtering is a crucial step in (ultra-)wide band systems like
modern radio telescopes for two other reasons. Firstly, it ensures
that the noise in each channel can be assumed to be white noise
regardless of bandpass fluctuations of the instrument or the inherent power spectrum of the observed sources. Secondly, observations using an increasingly larger fractional bandwidth are
more likely to be affected by human-generated radio frequency
interference (RFI). Most of this RFI can be detected and flagged
(Boonstra 2005; Offringa 2012; Offringa et al. 2013). If the channel width matches the bandwidth of the RFI signals (typically a
few kHz), the S/N of the RFI in the occupied channel is maximized, thereby facilitating detection. As an additional bonus, the
amount of spectrum that is flagged is minimized in this case. RFI
that escapes detection can cause outliers in the measured data
that do not fit a Gaussian noise model. In such cases, an appropriate weighting of the data samples can help to improve robustness
to such outliers (Kazemi & Yatawatta 2013). In Sect. 8 we briefly
discuss how such weighting can be incorporated in StEFCal, although at the expense of some computational efficiency.
The direction-independent gain of the pth receive path of an
array consisting of P elements can be represented by the complex valued scalar g p . The output signal of the pth element, receiving signals from Q sources, as a function of time t can be
described by
Q
x p (t) = g p
a p,q sq (t) + n p (t),
(1)
q=1
S. Salvini and S. J. Wijnholds: Analysis of ADI methods for gain calibration
where a p,q is the pth antenna’s response to the qth source, sq (t) is
the source signal, and n p (t) represents the noise on the measurement. Since we assume that the narrowband condition holds, the
factors a p,q are the geometry-dependent phase terms that result
in the familiar Fourier-transform relationship between the source
structure and the measured visibilities (Thompson et al. 2004).
We can stack the element-indexed quantities in vectors
of length P: the output signals of the individual sensors
in x(t) = [x1 (t), · · · , xP (t)]T ; the complex valued gains in
g = g1 , · · · , gP T ; the array response vector to the qth
T
source as aq = a1,q , · · · , aP,q ; finally, the noise vector as
n(t) = [n1 (t), · · · , nP (t)]T .
With these definitions, we can describe the array signal
vector as
Q
x(t) = g aq sq (t) + n(t).
(2)
q=1
Defining the P × P diagonal
matrix G = diag(g), the P × Q
array response matrix A = a1 , · · · , aQ , and the Q × 1 source
T
signal vector s(t) = sq (t), · · · , sQ (t) , we can reformulate (2)
in a convenient matrix form:
x(t) = GAs(t) + n(t).
(3)
Defining X = [x(T ), · · · , x(KT )], where K is the number of samples and KT defines the overall measurement duration, we can
then estimate the array covariance matrix, often referred to as
visibility matrix or matrix of visibilities, by
= 1 XXH .
R
K
R = GR0 G + Σn .
F
g
(4)
The model for the array covariance matrix follows from
1
XXH = GAΣs AH GH + Σn ,
R=E
(5)
K
where Σs = E s(t)sH (t) is the covariance matrix of the source
signals, and Σn = E n (t) nH (t) is the noise covariance matrix. In (5), we have assumed that the source and noise signals
are mutually uncorrelated. We also assume that the noise signals on the individual sensors are uncorrelated, such that the
noise covariance matrix is diagonal, i.e., Σn = diag(σn ). In
Sect. 8, we indicate how the algorithm can deal with more complicated noise models. For convenience of notation, we introduce
R0 = AΣs AH , so that we can write (5) as
H
maximum likelihood estimates (Ottersten et al. 1998). However,
in radio astronomy, sources are typically much weaker than the
noise, i.e., the S/N per sample is usually very low. Exceptions
to this statement are observations of the brightest sources on the
sky, such as Cas A, Cyg A, and the Sun, in which self-noise
becomes a significant issue (Kulkarni 1989; Wijnholds 2010).
Besides such exceptional cases, the model covariance matrix can
be approximated by R ≈ Σn . Since many radio astronomical instruments are arrays of identical elements, whereby Σn ≈ σn I,
we are justified in using W = I. In the Monte Carlo simulations
presented in Sect. 5.3, we demonstrate that violating these assumptions only leads to small deviations from the CRB, even in
extreme situations unlikely to occur in reality.
In many practical cases, we have an incomplete model of the
observed field, and we employ the best available model M ≈ R0
which, for example, only includes the brightest sources. In our
simulations, we consider both complete and incomplete information on the observed field. Another practical matter is that the
autocorrelations are dominated by the noise power of the array
elements. Since accurate modeling of the diagonal of the array
covariance matrix involves estimating the noise power of each
individual element, we are forced to estimate the antenna-based
gains using the crosscorrelations followed by estimation of the
noise powers using the diagonal elements. For the gain estimation step, it is therefore convenient to set the diagonal entries
and M to zero. This assumption is made throughout this
of R
paper, thus ignoring Σn . This simplifies the estimation problem
described in (7) to
2
− GMGH = argmin Δ2F
g = argmin R
(8)
(6)
2.2. Optimization problem
The antenna based gains and phases can be calibrated by a
measurement in which the source structure is known, so we
can predict model visibilities R0 . Since the receiver path noise
powers σn are usually not known, the calibration problem is
described by
2
− GR0 GH − Σn W .
g, σn = argmin WH R
(7)
F
g,σn
This equation describes our problem as a weighted least squares
estimation problem. This allows us to apply covariance matched
weighting by taking W = R−1/2 , leading to estimates that are
asymptotically, for a large number of samples, equivalent to
g
− GMGH for brevity of
where we have introduced Δ = R
notation.
3. The algorithm
Using an ADI approach, we first solve for GH holding G constant, then for G holding GH constant. Since Δ is Hermitian, the
two steps are equivalent and the iteration consists of only the
following step:
− G[i−1] MGH F .
G[i] = argmin R
(9)
G
Since xF = x2 for any vector x, and setting
Z[i] = G[i] M
(10)
we can write
P 2
H
R
:,p − Z:,p g∗p .
ΔF = R − ZG =
2
F
(11)
p=1
Equation (11) shows that the complex gains g p are decoupled
and that each iteration consists of solving P independent P ×
1 linear least squares problems. Using, for example, the normal
equation method we readily obtain:
⎫∗
⎧ [i−1]
[i−1]
H H
⎪
⎪
R
⎪
:,p ⎪
:,p · Z:,p
⎬
⎨ (Z:,p ) · R
[i]
gp = ⎪
=
,
(12)
⎪
⎪
[i−1] ⎪
[i−1]
⎭
⎩ (Z[i−1]
H
H
(Z[i−1]
:,p ) · Z:,p
:,p ) · Z:,p
which is the basic ADI iteration.
In practice, the basic iteration may converge very slowly. For
example, in the case of the sky model used in Sect. 5, it does
A97, page 3 of 14
A&A 571, A97 (2014)
not converge at all, bouncing to and fro between two vectors g.
We resolved this issue by replacing the gain solution of each
even iteration by the average of the current gain solution and the
gain solution of the previous odd iteration. This simple process
makes the iteration both very fast and very robust. This is the
basic variant of the StEFCal algorithm, which is described here
as Algorithm 1. Its convergence properties are studied in detail
in the next section, while its numerical, computational, and statistical performance are discussed in Sect. 5.
Algorithm 1 Algorithm StEFCal
Initiate G[0] ; G[0] = I is adequate in most cases
for i = 1, 2, · · · , imax do
for p = 1, 2, · · · , P do
z ← G[i−1] · M:,p ≡ g[i−1] M:,p
H:,p · z)/(zH · z)
g p ← (R
end for
if mod2 (i) = 0 then
if g[i] − g[i−1] F /g[i] F ≤ τ then
Convergence reached
else
G[i] ← (G[i] + G[i−1] )/2
end if
end if
end for
∂Tr ΔΔH
∂ Im(g p )
Thus, the algorithm can be readily implemented on many-core
architectures (such as GPUs, Intel Xeon Phi, etc.), as well as on
multiple cores, for example by employing OpenMP. Codes and
algorithms are in a very advanced development stage and are
available on request.
The gain estimation problem has an inherent phase ambiguity. In this paper, we choose, entirely arbitrarily, to use the first
receiver as phase reference. This constraint can be imposed either within each iteration at the cost of O(P) operations or at the
end of the computation. In practical terms, we did not find any
difference in rate of convergence and results between these two
options.
We now look at the algorithm in terms of the gradient with
respect to the real and imaginary parts of the complex gains of
the function
A97, page 4 of 14
g
(14)
where c.c. stands for complex conjugate and E p denotes the
P × P elementary matrix, which only contains zeros except for
the (p, p)-element, which is unity. We used the properties of the
trace of a product of matrices; we used the Hermitian properties
of Δ, M, and E p ; and finally, we used Z:,p = (GM):,p . Likewise,
for the imaginary part of g p we obtain
– There are no parallel dependencies in the inner loop (the
dependency on z is trivially resolved by employing a local vector z on each computational unit or core, or by using the individual elements of z at once without needing to
store the vector, although at the cost of potentially lower
performance).
– All data are accessed through unit strides (contiguous memory locations).
– The memory footprint is very small. Basically, only one extra P-vector is required (for requirements of z see above)
besides the visibility matrices.
g
∂ ΔΔH
∂
Tr ΔΔH = Tr
=
∂ Re(g p )
∂ Re(g p )
= −Tr E p MGH + GME p ΔH + c.c.
= −2Re Tr E p MGH ΔH + Tr GME p ΔH
= −4Re Tr ΔE p ZH
= −4Re ZH
:,p Δ:,p
∗
= −4Re ZH
:,p · R:,p − Z:,p g p
= 0
We want to stress a few important points
g = argmin Δ2F = argmin Tr ΔΔH .
At a minimum, the partial derivatives with respect to the real and
imaginary parts of the complex gains must all be zero. Hence,
(13)
∗
= −4Im ZH
:,p · R:,p − Z:,p g p = 0.
(15)
Looking at (11), (14), and (15), and at Algorithm 1, we can see
that the termination condition in the algorithm implies zero gradient as a function of the real and imaginary parts of all g p , for
p = 1, . . . , P, achieved through a process of local minimization
via a linear least squares method. Because the algorithm shows
very good convergence in all realistic cases studied, we can infer
that StEFCal does indeed produce gains that minimize Δ in the
least squares sense.
Moreover, using Eqs. (14) and (15), we can obtain the components of the gradient with respect to the real and imaginary
part of g at the ith iteration by
:,p − z[i−1]H
z[i−1]
∇Re(g p ) Δ2F = −4Re z[i−1]H
g[i−1]∗
R
p
p
p
p
:,p − z[i−1]H
∇Im(g p ) Δ2F = −4Im z[i−1]H
z[i−1]
g[i−1]∗
R
p
p
p
p
[i−1]
where we used the notation z[i−1]
= Z[i−1]
M:,p . The dot
p
:,p = g
products have already been computed to generate the new gain
estimate g[i]
p , so the components of the gradient can be generated
at virtually no cost.
4. Analysis of convergence
In this section we first introduce the concept of contraction mapping and then employ this concept to analyze the convergence
properties of the proposed algorithm. The special case of calibration on a single point source shows that the algorithm converges for all initial estimates except for initial estimates in the
null space of g. Finally, we study the general case of an arbitrary
source distribution, showing that convergence is achieved when
certain conditions on the observed scene and the initial estimate
are met. We discuss these conditions and argue that they are met
in practical situations. The convergence analysis presented below considers convergence in the noise-free case. The effect of
measurement noise is studied in detail using Monte Carlo simulations in Sect. 5.3.
S. Salvini and S. J. Wijnholds: Analysis of ADI methods for gain calibration
4.1. Condition for convergence
A contraction mapping on a complete metric space M with distance measure d is a function f : M → M with the property that
a real valued number μ < 1 exists such that for all x, y ∈ M
d ( f (x) , f (y)) ≤ μd (x, y) .
(16)
The Banach fixed point theorem states that the sequence of values resulting from iterative application of a contraction mapping converges to a fixed point (Palais 2007). This theorem can
be understood intuitively. We consider two arbitrary points in
a Euclidian space using the induced norm of their difference
to measure the distance between them. If a given operation is
a contraction mapping, applying that operation to both points
separately will produce two new points that are closer together.
Repeated application of the operation on the resulting points will
make the distance between each pair of new points shorter than
the previous pair. If we continue applying the operation long
enough, we can make this distance arbitrarily small, thus effectively converging to a single point. If we can show that the full
iteration (two basic iteration as described by (12) and the averaging step) is a contraction mapping, we can conclude that the
iterative application of the full iteration leads to a converging
sequence of values g[i] .
with R = GMGH = ggH M, the basic iteration
Replacing R
for a single element described by (12) reads as
g[i]
p
H g M:,p g[i−1] M:,p
=
H gp.
g[i−1] M:,p g[i−1] M:,p
(17)
For the gain vector, the full iteration is described by
⎞
⎛
*
(
β + β ⎟⎟⎟
1 )
1 ⎜⎜⎜ |α|2 )
1
[i+1]
=
αβ g + ∗ β g = ⎝⎜
g
⎠⎟ g,
2
α
2
α∗
(21)
where we defined )
β p = β g, gw p / β g2w p (note the similarity in form and hence interpretation as β p ) and the vector
T
)
β = )
β1 , · · · , )
βP for brevity of notation. Although not recognizable in this equation, the initial estimate g[i−1] comes in via α,
β and )
β.
For convergence, we like to show that, if we have two distinct
[0]
initial estimates g[0]
1 and g2 , we have
$
$
$
$
$
$
$
$
$
$
[2]
[2] $
[0]
[0] $
$
$
$
$
$
(22)
$≤$
$,
$g1 − g2 $
$g1 − g2 $
where we used the Euclidian norm (induced norm) as distance
measure in the linear space of potential gain vectors. Since we
are considering the change in Euclidian distance between these
two initial estimates, we can attribute the differential error vector
to one of the gains without loss of generality, and model the
[0]
initial estimates as g[0]
1 = α1 (g + ) and g2 = α2 g, leading to
$
$
⎛
⎞
$
$
$
$
$
$
$
$
β1 + β1 |α2 |2 )
β2 + β2 ⎟⎟⎟⎟
1 ⎜⎜⎜⎜ |α1 |2 )
$
$
$
$
$
$
−
g
≤ α1 (g + ) − α2 g .
⎜
⎟
$
$
⎝
⎠
∗
∗
$
$
$
$
2
α
α
$
$
1
2
(23)
)
Since = 0 for g[0]
2 , we have β2 = β2 = 1. This allows us to
simplify the lefthand side of (23) to
M:,p , we can read the
Introducing the weight vector w p =
products in the numerator and denominator as weighted inner
products and write the basic iteration as
g[i−1] , g
wp
g[i]
gp.
(18)
p = [i−1] [i−1]
g ,g
wp
$
$
⎞
⎛
$
$
2
$
$
$
$
β1 + α∗2 β1 − α∗1 |α2 |2 − α∗1 ⎟⎟⎟
$
$
1 ⎜⎜⎜⎜ α∗2 |α1 | )
$
$
$
$
⎟
$
$
g
=
⎟
⎜
$
$
⎠
⎝
∗
∗
$
$
$
$
α1 α2
$2
$
$
* $
(
$
$
$
$
α∗2 β1 − α∗1 $
1$
$
$
$
)
$
$
g$
diag α1 β1 − α2 +
$
$
$
∗ α∗
$
$
2$
α
$
$
1 2
(
(
**
α∗2 β1 − α∗1
1
)
g ,
≤ σmax diag α1 β1 − α2 +
2
α∗1 α∗2
The initial estimate g[i−1] can be written in terms of a scaling α of
the true gain values g and an error vector orthogonal to g (in the
usual Euclidean sense) , i.e., we may write g[i−1] = α (g + ).
Substitution in (18) gives
where σmax (·) denotes the largest singular value of a matrix. For
a diagonal matrix D, such as that in (24), we have:
(25)
σ2max (D) = λmax DH D = maxn |dn |2 ,
M∗:,p
g[i]
p =
1 g + , gwp
1
gp = ∗ βpgp.
α∗ g + 2wp
α
(19)
This formulation gives interesting insight into the operation of
the basic iteration. If the initial estimate is purely a scaling of
the true value, β p = 1, and the algorithm only tries to adjust the
amplitude. If the initial estimate has a component that is orthogonal to the true gain vector, the algorithm tries to remove by
projecting the guessed gain vector on the true gain vector. The
impact of depends on the element being considered, because
the scene used for calibration may be such that the calculation
of β p involves geometry in a weighted Euclidean space.
Introducing the vector β = β1 , · · · , βP T , we can write the
full iteration for a single element as
⎞
⎛ 1
⎟⎟⎟
⎜⎜⎜ α∗ β g, g
1 ⎜⎜
1
wp
⎟⎟⎟
[i]
g
+
β
g
g p = ⎜⎜⎜ $
(20)
p
$
⎟⎠ .
$
∗ p p⎟
2
1
$
$
2⎝$
α
$
$
$ β g$
α∗
wp
(24)
where dn denotes the nth element on the main diagonal of D.
Squaring the left- and righthand sides of (22) and exploiting
the fact that ⊥ g, we require
+
+
α∗2 β1,pmax − α∗1 ++2
1 +++ )
++
+α1 β1,pmax − α2 +
+
4+
α∗1 α∗2
≤ |α1 − α2 |2 + |α1 |2
2
g2
(26)
for convergence, where pmax is the value of p that maximizes the
lefthand side.
4.2. Convergence for single point source calibration
When the observed scene consists of a single point source, we
can assume M = R0 = 11H without loss of generality. The
weighted inner products in β and )
β therefore reduce to the standard Euclidean inner product since w p = 1 for all p. Since the
A97, page 5 of 14
A&A 571, A97 (2014)
Substitution of
⎛
++
+
α∗2 − α∗1 ++2 ⎜⎜⎜
++
+
++α1 − α2 + ∗ ∗ ++ ≤ ⎜⎜⎝|α1 − α2 | +
α1 α2
= |α1 − α2 |2 +
1
2 |α1 | |α2 | + 1 ≤ 3 |α1 | |α2 | ,
2
(28)
(29)
which holds if |α1 | |α2 | ≥ 1. This may not be true for the initial
estimate provided to the algorithm, but as long as the initial estimate does not lie in the null space of g, this condition will be
met after the first full iteration, since 12 |1/α + α| ≥ 1 for all values α satisfying |α| ≥ 0. Equation (29) also shows that if |α1 | and
|α2 | are close to unity, i.e., if the estimates are close to the true
value, the rate of convergence becomes quite slow. Slow convergence close to the true solution has indeed been observed in our
simulations.
Another interesting insight from this analysis lies in the distribution of consecutive estimates around the true value. Each
full iteration involves a gain estimate that scales the true gain
vector with |α| and a gain estimate scaling 1/ |α| with |α| moving
closer to unity in each full iteration. The algorithm thus generates two sequences of points that converge to the true value, one
from above and one from below.
4.3. Convergence in general
To assess the convergence in the general case of calibration on an
arbitrary scene, we first note that the condition for convergence
in (26) is tightest if either one of the terms on the righthand side
equals zero. We therefore analyze those two extreme cases. In
the first case, = 0, we have β1 = )
β1 = 1. This leads to the condition expressed in (27), for which convergence was discussed
in the previous subsection.
In the second case α1 = α2 = α, making the first term of the
righthand side of (26) zero, such that the condition for convergence holds if
+
1
+++2
1 ++ )
2
++α β1,pmax − 1 +
·
(30)
β1,pmax − 1 ++ ≤ |α|2
4
α
g2
Since β pmax is based on a weighted inner product instead of the
usual Euclidean inner product (as in the single point source
case), we cannot show that (30) holds in general. The significance of this is that it is possible to construct cases for which
the algorithm fails. For example, when M:,p = 0 for some value
of p (this holds for all p in the case of an empty scene) or if, for
specific weights w p , g + w p → 0, β pmax becomes very large.
In summary, we conclude that, to ensure convergence, the
following conditions should be met:
1. The inner product between the initial estimate and the true
value should be nonzero; i.e., the initial estimate should not
lie in the space orthogonal to the true value or be close to the
zero vector.
A97, page 6 of 14
0
−60
in (27), followed by some algebraic manipulation, gives
2
20
−40
2
|α1 |2 |α2 |2
40
−20
++
+ ⎞2
+α∗2 − α∗1 ++ ⎟⎟⎟
++ ++ ++ ++ ⎟⎟⎠
+α∗ + +α∗ +
(2 |α1 | |α2 | + 1) |α1 − α2 |2
60
y (m)
error vector is assumed to be perpendicular to g, (19) shows
that will be projected out in the first basic iteration. As a result,
we have β p = 1 for all p after the first iteration, which reduces
the condition for convergence in (26) to
+
+
α∗2 − α∗1 ++2
1 +++
2
(27)
+α1 − α2 + ∗ ∗ +++ ≤ |α1 − α2 | .
4+
α1 α2
−100
−50
0
x (m)
50
Fig. 1. Positions of the first 200 (circles) and 100 (crosses) antennas in the random configuration of 4000 antennas generated for the
simulations.
2. The observed scene should be such that γ in , gwp =
γ w p gwp is small for all values of p. This ensures that
β pmax remains small. Physically, this means that the observed
scene should be suitable for a calibration measurement. For
example, it is not possible to do gain amplitude and phase
calibration on a homogeneously filled or empty scene.
The first criterion can usually be ensured by available knowledge
of the measurement system, either from precalibration or design.
The second criterion is a requirement for any calibration measurement. We therefore conclude that the algorithm will work
in most practical situations. This conclusion was confirmed by
extensive testing in simulation, of which some examples will be
presented in the next section.
5. Simulations
In this section we show how the algorithm performs in terms of
numerical, computational, and statistical performance.
5.1. Numerical performance and practical convergence
We tested StEFCal with an extensive number of cases that cover
a wide range of simulated sky models, with varying numbers
and locations of receivers and levels of corruption and noise.
These simulations all supported the conclusions drawn from the
specific cases reported here.
The results shown here, unless otherwise indicated, employ
a simulated sky consisting of 1000 point sources with powers
exponentially distributed between 100 and 10−4 Jy (1 Jy equals
10−26 W/m2 /Hz) randomly positioned in the sky. The array configuration consists of up to 4000 antennas randomly distributed
over a circular range with a diameter of 160 m and minimum
separation of 1.5 m, corresponding to a Nyquist frequency of
100 MHz. Where a smaller number of antennas was required,
the upper left portion of the visibility matrix (associated with the
first P antennas) was used, as illustrated by the antenna layouts
in Fig. 1. For convenience of presentation, uncorrelated receiver
noise was not included in the example illustrated in this section.
The effect of noise is studied in more detail in Sect. 5.3.
The model visibility matrix was built for two cases:
Case 1: Incomplete sky model: only the 18 brightest sources (all
sources brighter than 1% of the brightest source) were included in the model visibilities.
S. Salvini and S. J. Wijnholds: Analysis of ADI methods for gain calibration
−1
−1
4
0.045
3
0
2
l (directional cosine)
l (directional cosine)
0.04
−0.5
−0.5
0.035
0.03
0.025
0
0.02
0.015
0.5
0.5
0.01
1
0.005
−0.5
0
0.5
1
m (directional cosine)
Fig. 2. Scene as observed by a perfectly calibrated array. The sky model
contains 1000 sources but only the brightest are visible with this color
scale. The weakest sources are even drowned in the sidelobe response
of the brightest sources.
−1
0
−0.5
0
0.5
m (directional cosine)
1
Fig. 4. Difference between the image after calibration and the model sky
containing only the 18 brightest sources.
−4
x 10
8
−1
6
0.1
0.08
l (directional cosine)
1
−1
0
−0.5
0.06
0.04
0
l (directional cosine)
1
−1
−0.5
4
2
0
0
−2
0.5
0.02
−4
0.5
0
1
−1
1
−1
−0.5
0
0.5
m (directional cosine)
1
−0.02
−0.5
0
0.5
m (directional cosine)
1
Fig. 3. Observed sky: sky image as seen by the instrument prior to
calibration.
Case 2: Complete sky model: all 1000 sources were included.
Case 1 represents a typical situation in practical radio astronomical calibration scenarios. For both cases, convergence to machine accuracy (10−15 ) and to a much looser tolerance (10−5 )
was studied and compared to give an indication of the convergence requirements in realistic cases.
Figure 2 shows the “exact” sky, i.e. the sky image as
viewed by the perfectly calibrated array. “Corrupted” skies were
obtained by perturbing the antenna-based gains with amplitudes randomly distributed between 0.5 and 1.5 with unit mean
and phases randomly distributed between 0 and 2π radians.
The results for Case 1 are shown in Figs. 3 through 5, using P = 500 antennas and at a frequency of about 35.5 MHz.
Figure 3 shows the sky as imaged by the instrument prior to calibration. We ignored the autocorrelations of the measured visibility matrix and the matrix of model visibilities. As discussed
in Sect. 8, it is straightforward to use StEFCal in scenarios with
more entries of the covariance matrix set to zero to flag specific
data values. This was studied, but not reported here for reasons
of brevity, and supports the conclusions drawn.
The images obtained after calibration are indistinguishable
from Fig. 2 at the resolution of the array, so they are not shown
here. The difference between the image after calibration and
the incomplete sky model (which includes just 18 sources for
Fig. 5. Difference between the image after calibration on only the
18 brightest sources and the exact sky.
Table 2. Maximum difference between exact sky and image after calibration to different tolerances.
max (skyexact – sky10−5 )
max (skyexact – sky10−15 )
max (sky10−5 – sky10−15 )
3.2 × 10⁻⁸
1.3 × 10⁻¹⁵
3.2 × 10⁻⁸
Case 1) is more interesting and is shown in Fig. 4. This clearly
shows that the next brightest sources can be identified correctly
after calibration and subtraction of the 18 brightest sources.
Figure 5 shows the difference between the image after calibration and the exact sky showing that the errors due to ignoring the
weak sources in the model are two orders of magnitude smaller
than the next brightest sources. This shows that StEFCal can be
used as an algorithmic component in self-calibration procedures
based on iterative source model refinement.
We also carried out simulations with different settings for the
tolerance for convergence. The results for Case 2 (complete sky
model) are reported here. Table 2 summarizes the results for tolerances of 10−5 and 10−15 . In the table, we show the maximum
difference between the absolute value of the image pixels between the exact sky and the image after calibration for both convergence tolerances. The maximum difference we found is on
the order of 10−8 , which is well below the noise level. This led
us to conclude that effective convergence can be achieved with
limited effort and reasonably “loose” convergence requirements.
A97, page 7 of 14
A&A 571, A97 (2014)
Table 3. Algorithm measured performance.
Nit fixed
Nit
time
40 0.0006
40
0.002
40
0.008
40
0.017
40
0.036
40
0.062
40
0.093
40
0.220
40
0.258
40
0.579
40
1.029
40
2.321
40
4.108
Nit
12
14
16
16
16
18
18
18
18
18
20
20
20
Tolerance 10−5
time convergence
0.0002
3.5E-06
0.001
4.9E-06
0.003
1.9E-06
0.007
3.6E-07
0.014
2.6E-06
0.028
3.0E-08
0.042
1.7E-08
0.099
5.5E-07
0.116
3.8E-08
0.260
1.9E-07
0.515
4.5E-09
1.169
1.6E-08
2.059
1.6E-07
Notes. In the table, Nit is the number of iterations and all times are in
seconds.
The table also reports the difference between two images obtained after calibration for the two tolerances.
As already mentioned, we have run a long series of tests with
the number of antennas ranging from 20 to 4000, a variety of
source models, with and without adding antenna-based noise.
All cases showed similar outcomes to those reported here. This
supports the suitability of StEFCal for practical use in terms of
numerical performance and speed of convergence. The number
of iterations required appears to depend only very weakly on the
number of receivers. Typically, in the cases reported here, irrespective of the number of antennas, 10−5 or better convergence
could be achieved in 20 iterations or less and 10−15 convergence
in 40 iterations or less. Benchmarks are reported in Sect. 5.2.
5.2. Computational performance
The incomplete source model introduced in Sect. 5.1 (Case 1)
was used in the computational benchmarks reported here, although far more extensive tests were carried out. In all cases,
StEFCal has shown very good performance characteristics despite its iterative nature. This requires a refresh of the data for
each iteration for problems too large to fit in cache, as is the case
for any other iterative approach.
A number of factors underpin StEFCal’s performance:
– All computations are carried out through vector operations.
– Data are accessed by unit-stride, contiguous memory patterns. This ensures maximum utilization of data loaded, ensuring full use of cache lines, as well as emphasizing the role
of prefetching.
– StEFCal requires only a modest memory footprint (as discussed below).
We coded the algorithm in Fortran 90, compiled using the Intel
MKL Fortran compiler version 11.00. We used either Intel MKL
BLAS or handwritten code. The difference between these two
versions was 3% at most, so we only report on the results using
the Intel MKL library. We used a desktop system with an Intel
dual core Core 2 running at 3.0 GHz, single threaded (only one
core active), with single-threaded MKL BLAS.
We would like to mention that multithreaded parallelism
over frequency channels and/or time slices have also been developed and tested to very good effect. Table 3 and Fig. 6 report the
performance obtained for arrays with 50 to 4000 antennas. The
A97, page 8 of 14
0
10
Time (seconds)
P
50
100
200
300
400
500
600
800
1000
1500
2000
3000
4000
Performance scaling
1
10
−1
10
−2
10
−3
10
−4
10
1
10
2
10
3
10
4
10
Number of antennas
Fig. 6. Algorithm scaling on a logarithmic scale. The red crosses denote the measured computing times; the black line shows the expected
computing times for quadratic scaling, normalized to P = 500: T P =
P 2
( 500
) · T 500 .
figure compares the measured computing times against those expected for perfect quadratic scaling with the number of antennas,
normalized to P = 500. Both the table and figure highlight the
efficiency of the algorithms, as well as its quadratic scalability
over the number of elements.
One full iteration requires the element-wise product of two
complex vectors and two complex dot products per gain parameter. In terms of real valued floating point operations, this is
equivalent to 24P2 flop, where each complex multiply-add requires 8 flop. One dot product corresponds to computing the
square of the 2-norm (or F-norm) and the cost of that dot product
can be halved, leading to a grand total per iteration of 20P2 flop.
The algorithm does indeed require O(P2 ) operations as in our
initial claim.
The system used for benchmarking had a peak speed of
12 Gflops, and the peak speed observed for MKL DGEMM
was ∼11 Gflops. StEFCal showed performance figures of over
3 Gflops. Given the nature of the computation, both the speed
and the scalability observed are very good (over 25% peak
speed). Tests have shown that even better performance can be
obtained on more modern CPUs.
The memory footprint of StEFCAL is modest:
– The measured visibilities and the model visibilities are complex valued P × P matrices, requiring 16P2 bytes per matrix for storage in double-precision floating-point format.
Thanks to their Hermiticity, one could store these matrices in compressed triangular storage format. However, this
would require accessing their elements with non-unit variable strides, thus considerably lowering computational performance: given the memory available on current systems,
performance issues are overriding.
– One complex valued vector of length P is returned as output.
– One internally allocated complex valued vector of length P
is used.
– Depending on code internals, other complex vectors of
length P may be required.
The total amount of input and output data (32P2 + 16P bytes assuming double precision floating point
format) results
in the low
computational intensity of 24P2 Nit / 32P2 + 16P flop per byte
or approximately 3Nit /4 flop per byte for high values of P. Thus
StEFCal is memory bound, as observed in practice. As already
mentioned, this is greatly ameliorated by the memory access pattern. While traditional O(P3 ) methods may increase the number
S. Salvini and S. J. Wijnholds: Analysis of ADI methods for gain calibration
−5
of operations per memory transfer, they also increase the number
of operations by the same amount, thus resulting in much lower
performance overall.
1.2
0.8
5.3.1. Calibration on two weak point sources
In this scenario, two sources with source power σq = 1 for
q = 1, 2 were located at (l1 , m1 ) = (0, 0) (field center or zenith)
and (l2 , m2 ) = (0.4, 0.3), where l and m are direction cosines.
We set the measurement frequency to 60 MHz (λ = 5.0 m)
and defined σn = 10 for all antennas, such that both sources
have an S/N of −10 dB per time sample. This ensures that the
assumption R ≈ σn I, which we used to derive the algorithm
from the weighted LS cost function, holds. In this Monte Carlo
simulation, we calibrated the data using StEFCal, as well as
the multisource calibration algorithm proposed in Wijnholds &
van der Veen (2009), to compare the two approaches in terms of
statistical and computational efficiency. Simulations were done
for K = {103 , 3 × 10³ , 104 , 3 × 10⁴ , 105 , 3 × 10⁵ , 106 } time samples and each simulation was repeated 100 times. For Nyquistsampled time series, the number of samples is equal to the product of bandwidth and integration time, i.e., K = Bτ. The chosen
range of values for K thus covers the most commonly used
range of values for bandwidth and integration time in radio astronomical calibration problems with high spectral and temporal
resolution.
The biases found in the simulations are considerably smaller
than the standard deviation for this scenario based on the CRB.
This indicates that our algorithm is unbiased, hence that a comparison with the CRB is meaningful to assess the statistical
performance of the algorithm. Figure 7 shows the variance of
the estimated gain amplitude and phase parameters for K =
106 , clearly showing that both algorithms achieve the CRB for
large K. Figure 8 shows the variance for a representative complex valued gain estimate for all simulated values of the number of samples K. The result indicates that the CRB is already
variance
0.6
0.4
1. Calibration on two weak (S/N of −10 dB per time sample)
point sources.
2. Calibration on a realistic sky model.
3. Calibration on two strong (S/N of 20 dB per time sample)
point sources.
0.2
0
0
50
100
150
200
250
parameter index
300
350
400
Fig. 7. Variance on the estimated gain amplitudes (indices 1 through
200, dimensionless) and phases (indices 201 through 399, in units of
rad2 ) parameters for calibration on two point sources with a S/N of
−10 dB. The solid line indicates the CRB.
−2
10
|g|, StefCal
|g|, optimal
|g|, CRB
arg(g), StefCal
arg(g), optimal
arg(g), CRB
−3
10
variance
By choosing these scenarios, we try to explore the sensitivity of
StEFCal to violation of the assumption that R ≈ σn I, which was
used to derive the algorithm from the weighted least squares cost
function and hence get a feel for the range of applicability of the
algorithm. The antenna configuration used in these simulations
is the 200-element configuration shown in Fig. 1.
Since we can only estimate the phase difference between the
antennas, we assume that the first antenna will be used as phase
reference. We can therefore define the (3P − 1) × 1 vector of free
parameters θ = γ1 , · · · , γP , ϕ2 , · · · , ϕP , σn,1 , · · · , σn,P T , where
γ p , ϕ p , and σn,p are the gain amplitude, gain phase, and the
noise power of the pth element, respectively. Expressions for the
Cramer-Rao bound (CRB), the minimum achievable variance for
an unbiased estimator (Kay 1993; Moon & Stirling 2000), for
this scenario is derived by Wijnholds & van der Veen (2009).
StefCal
optimal
CRB
1
5.3. Statistical performance
We performed a series of Monte Carlo simulations to assess
the statistical performance and robustness of the proposed algorithm. We have defined three scenarios:
x 10
−4
10
−5
10
−6
10
3
10
4
5
10
10
number of samples
6
10
Fig. 8. Variance (dimensionless for amplitude parameters, in units of
rad2 for phases) of a representative complex valued gain estimate (p =
10) as function of the number of time samples. The lines mark the CRB
for the two parameters involved.
achieved for very low values of K. Based on the theory of random matrices, matrix-wise convergence of the covariance matrix estimate starts when the number of samples is about ten
times bigger than the number of elements (Couillet & Debbah
2011), which, in the case of a 200-element array, would be at
K ≈ 2 × 10³ . The proposed algorithm does not rely on mathematical operations that depend on matrix-wise convergence to
work properly, and this may provide an intuitive explanation for
this attractive feature of StEFCal.
The simulation results indicate that StEFCal achieves statistically optimal performance when R ≈ σn I and thus has statistical performance similar to statistically efficient methods, such as
the algorithm described by Wijnholds & van der Veen (2009) or
optimization of the cost function using the Levenberg-Marquardt
solver. However, the proposed algorithm has only O(P2 ) complexity instead of the O(P3 ) complexity of many commonly used
methods. This should give a significant reduction in computational cost of calibration, especially for large arrays. The Monte
Carlo simulations described here were done in Matlab on a single core of a 2.66 GHz Intel Core i7 CPU. Gain calibration
for a single realization took, on average, 2.24 s when using the
method described by Wijnholds & van der Veen (2009) while
taking only 0.12 s when using StEFCal.
A97, page 9 of 14
A&A 571, A97 (2014)
−5
4
−3
x 10
10
StefCal
CRB
3.5
10
−5
3
10
variance
variance
|g|, StefCal
|g|, CRB
arg(g), StefCal
arg(g), CRB
−4
2.5
−6
10
2
−7
10
1.5
−8
10
1
−9
10
0.5
0
50
100
150
200
250
parameter index
300
350
Fig. 9. Variance on the estimated gain amplitudes (indices 1
through 200, dimensionless) and phases (indices 201 through 399, in
units of rad2 ) parameters for calibration on the scene shown in Fig. 2
with noise power equal to the integrated power of all sources.
−1
10
|g|, StefCal
|g|, CRB
arg(g), StefCal
arg(g), CRB
−2
10
variance
−3
10
−4
10
−5
10
−6
10
3
10
4
5
10
10
number of samples
6
10
Fig. 10. Variance (dimensionless for gain amplitude, in units of rad2 for
gain phase) of a representative complex valued gain estimate (p = 20)
as function of the number of time samples. The lines mark the CRB of
the two corresponding parameters.
5.3.2. Calibration on a realistic scene
In many array applications, the scene on which the array needs
to be calibrated in the field is considerably more complicated
than one or just a few point sources. To see how the algorithm
performs in a more realistic scenario, we used the scene shown
in Fig. 2 for calibration. We are still in the low-S/N regime, with
the noise power in each antenna being about ten times the total
power in the scene and the strongest sources having an S/N per
sample of −13.3 dB, so R ≈ σn I still holds.
We set up our Monte Carlo simulations in the same way as
for the first scenario. After checking that the algorithm produced
unbiased results, we compared the variance on the estimated parameters with the CRB. The results are shown in Figs. 9 and 10.
They indicate that the performance of StEFCal is still very close
to statistically optimal.
5.3.3. Calibration on two strong point sources
For our last scenario, we defined a simulation with two point
sources located at (l1 , m1 ) = (0, 0) and (l2 , m2 ) = (0.4, 0.3) with
an S/N of 20 dB per time sample. This is a scenario that clearly
A97, page 10 of 14
3
10
400
4
5
10
10
number of samples
6
10
Fig. 11. Variance (dimensionless for gain amplitude, in units of rad2 for
gain phase) of a representative complex valued gain estimate (p = 5)
as function of the number for time samples. The lines mark the CRB of
the two corresponding parameters.
violates the assumption that R ≈ σn I. We performed the Monte
Carlo simulation in the same way as in the previous cases.
Figure 11 shows the variance of the gain and phase associated with a representative element as function of the number of
samples. The gain estimates, while not as close to the CRB as in
the previous cases, are still quite close to the bound. The average
gain amplitude error is still only 55% higher than the CRB, while
the average phase error is only 26% higher than the CRB. This
is acceptable given the high accuracy achieved in such a highS/N regime. We conclude that StEFCal provides a performance
that is close to optimal, even in scenarios designed to break the
underlying assumptions made to use the LS rather than the WLS
cost function. This shows that the algorithm is fairly robust in
terms of its statistical performance and will provide statistically
efficient estimates in scenarios typical of radio astronomy.
6. Extension to full polarization calibration
It is straightforward to apply the ADI approach to the full polarization case as demonstrated by Hamaker (2000) and Mitchell
et al. (2008). Initial results for StEFCal have been presented by
Salvini & Wijnholds (2014a) and Salvini & Wijnholds (2014b)
and confirm the validity of StEFCal for full polarization calibration, still retaining O(P2 ) computational complexity. In this section, we sketch the StEFCal algorithm for the full polarization
case. A full analysis will be provided in a future paper.
The mathematical problem is structured in terms of matrices
whose elements are two-by-two complex blocks, rather than by
individual complex values. In particular, the gain matrix G is a
block diagonal matrix whose 2 × 2 blocks on the main diagonal
describe the response of the two feeds of each receiver:
G2p−1,2p−1 G2p−1,2p
Gp =
.
(31)
G2p,2p−1 G2p,2p
Taking this structure into account, the full polarization calibration problem can still be formulated as
2
= argmin R
− GMGH .
G
(32)
G
F
It naturally follows that the basic step of full polarization
StEFCal consists of solving P 2 ×2 linear least squares problems
for each iteration, within the same StEFCal iteration framework
as for the scalar case described in this paper.
S. Salvini and S. J. Wijnholds: Analysis of ADI methods for gain calibration
5
1
10
1.6
−0.8
0
10
1.5
−0.6
−1
East ← l → West
Time (seconds)
x 10
−1
10
−2
10
1.4
−0.4
1.3
−0.2
1.2
0
1.1
0.2
1
0.4
−3
10
0.9
0.6
0.8
−4
10
0.8
1
10
2
3
10
10
Number of receivers
4
Fig. 12. Full polarization algorithm scaling on a logarithmic scale. The
red crosses denote the measured computing times; the black line shows
the expected computing times for quadratic scaling, normalized to P =
2
P
500: T P = 500
· T 500 .
Table 4. Full polarization StEFCal performance (see text). Times are in
seconds.
N. cores
1
2
3
4
8
10
12
16
Time
16.63
8.34
5.57
4.19
2.90
2.35
1.92
1.72
GFlops/s
17.9
35.8
53.5
71.2
102.9
127.0
155.3
173.3
0.7
10
% CGEMM
41.8
41.9
42.2
41.8
42.0
42.2
41.3
38.3
Notes. In the table, all times are in seconds.
In general, the simple StEFCal algorithm, which has proved
very successful for the scalar case, exhibits slow or difficult convergence. As shown by Salvini & Wijnholds (2014b), this can
be corrected by employing a multistep approach, whereby the
two previous solutions at the even steps are also included in the
averaging process. Moreover, some heuristics can be employed
to regularize the convergence rate.
Performance again proved very good, since the same considerations as for the scalar algorithm apply. Since the density of
operations increases by a factor two per data item, a marginally
better speed has been obtained, in terms of Gflop per second.
An example of performance results is shown in Table 4. This
involved a realistic scenario of full polarization calibration of
the proposed SKA LFAA station, comprising of 256 antennas
(512 dipoles) for 1024 frequencies. The code was parallelized
over frequencies using OpenMP, whereby each core grabs the
first available frequency still to be calibrated (dynamic load balancing). All computations were carried out using single precision to a tolerance of 10−5 , delivering better than 1% accuracy
in the complex gains, as required. Performance figures are compared to the performance of MKL CGEMM (complex matrix–
complex matrix product), which virtually runs at peak speed and
gives a good indication of maximum speeds achievable.
Figure 12 shows that scalability with problem size has very
similar characteristics to those for the scalar problem. In this
simulation, we fixed the number of iterations to 100 and compared the measured data against exact P2 scalability, normalized
to P = 500. It should be noted that the number of operations
per iteration now reads as 48P2 . We also like to point out that
1
−1
−0.5
0
0.5
South ← m → North
1
Fig. 13. Calibrated all-sky image at 59.67 MHz made with the
288-antenna AARTFAAC system.
the convergence rate, i.e. the number of iterations required for
a given accuracy, exhibits the same very weak dependence on
problem size, i.e. the number of receivers, as in the case of scalar
StEFCal.
7. Applications
Figure 13 shows a calibrated all-sky map produced by the
Amsterdam-ASTRON Radio Transient Facility and Analysis
Centre (AARTFAAC1 , Prasad & Wijnholds 2013). This system
is a transient monitoring facility installed on the six innermost
stations of the LOFAR, which this facility combines as a single
station with 288 antennas spread over an area with a diameter
of about 350 m. In this section, we describe the integration of
StEFCal in the AARTFAAC calibration pipeline to demonstrate
the ease of integration of the proposed algorithm in an existing
pipeline and the computational benefits.
The calibration of the AARTFAAC system involves estimating the direction-independent complex valued gains of the receiving elements, the apparent source powers of the four bright
point sources seen in Fig. 13, and a non-diagonal noise covariance matrix to model the diffuse emission seen in the image
and the system noise. The non-diagonal noise covariance matrix was modeled with one complex valued parameter for every entry associated with a pair of antennas that were less than
ten wavelengths apart and a real valued parameter for every entry on the main diagonal. This calibration challenge was solved
using the weighted alternating least squares (WALS) algorithm
described by Wijnholds (2010). In each main iteration of the
WALS method, the direction-independent gains are first estimated assuming that the other parameters are known, then the
source powers are updated, and finally the noise covariance matrix is updated. To calibrate the AARTFAAC data set used to
produce Fig. 13, six main iterations were required. The middle
column of Table 5 shows the average time estimation of each
group of parameters took in Matlab on an Intel Core i7 CPU on
a machine with 4 GB RAM.
StEFCal was easily integrated in the WALS algorithm by
simply replacing
the gain estimation step (which used an algorithm of O P3 complexity) with the StEFCal algorithm.
StEFCal was configured to iterate to convergence in each main
loop of the WALS method. Table 5 reports the computational
1
www.aartfaac.org
A97, page 11 of 14
A&A 571, A97 (2014)
2
Table 5. Processing time in seconds per main iteration of array calibration using the original WALS as described by Wijnholds (2010) and
WALS with StEFCal.
Original
6.528
0.023
0.003
6.554
With StEFCal
0.184
0.030
0.003
0.217
Stefcal 2
−2
Log10 (convergence)
Parameter
Gain
Source power
Noise covariance
Total
Stefcal 1
0
−4
−6
−8
times, showing that StEFCal resulted in an increase in performance of over a factor 30 when “cold starting”, i.e. without
any prior information for any timeslice. As gains are expected
to vary smoothly over time, a further eight-fold increase in performance was obtained by using the results from the previous
timeslice as initial guess in the calibration of each snapshot (a
factor 250+ overall). This underscores the capability of StEFCal
to make good use of initial gain estimates.
The full polarization version of StEFCal is currently employed in MEqTrees (Noordam & Smirnov 2010). It is being implemented in the standard LOFAR pre-processing pipeline and
studied for the SKA. As an example, the LOFAR central processor requires a number of steps including direction-independent
gain calibration (station-based) to provide initial corrections for
clock drift and propagation effects. The latter are mainly caused
by the ionosphere and may require full polarization corrections
on baselines to stations outside the core area. Recently, Dijkema
(2014) has implemented the basic version of full polarization
StEFCal for the standard processing pipeline of LOFAR. This
implementation was used to run the same pipeline on several
data sets from actual LOFAR observations twice, once with the
standard Levenberg-Marquardt (LM) solver and once with the
LM solver replaced by StEFCal. In all cases, the results obtained were practically identical, but the pipeline with StEFCal
was typically a factor 10 to 20 faster than the pipeline running
the LM solver. Based on the material presented in this paper, we
expect that we can improve performance significantly by optimizing the implementation of StEFCal used.
8. Discussion and future work
8.1. Other variants of StEFCal
We also studied a variant of StEFCal with relaxation, in which
the complex gains are used as soon as they become available,
rather than using the full set of complex gains from the previous iteration; i.e. the gain vector gets updated while looping
over all receivers and is then applied immediately. This variant
is listed in Algorithm 2. In general, this variant needs fewer iterations. However, the receiver loop (the p-loop) for each iteration
has parallel dependencies, which makes this variant much less
portable to multicore and many-core platforms, such as GPUs,
although it could be valuable for more traditional CPUs.
Numerical performance appears very close to the standard
StEFCal, shown as Algorithm 1, but we have not attempted to
obtain a formal proof of convergence. Figure 14 shows the faster
convergence of Algorithm 2, in particular at the beginning of the
iteration.
Another variant of Algorithm 2, whose details are not reported here, aims to decrease the parallel dependencies by blockwise updates of the estimated gain vector (thus the latest values
of the previous block are used, while the old values of the current
A97, page 12 of 14
−10
−12
0
5
10
15
Iteration number
20
25
30
Fig. 14. Comparing algorithm performance for P = 500.
Algorithm 2 Algorithm StEFCal2
Initiate G[0] ; G[0] = I is adequate in most cases
for i = 1, 2, · · · , imax do
G[i] = G[i−1]
for p = 1, 2, · · · , P do
z ← G[i] · M:,p ≡ g[i] M:,p
H
H
g[i]
p ← (R:,p · z)/(z · z)
end for
if g[i] − g[i−1] F /g[i] F ≤ τ then
Convergence reached
end if
end for
block are used). As expected, performance falls in between the
full relaxation and the original algorithm. It is felt by the authors
that loss of parallelism is more important than a rather modest
gain in performance.
The first version of StEFCal included an initial stage (again
with operation count O(P2 )), which purified the largest eigenvalues and vectors of the observed visibilities (including estimation
of the autocorrelation terms), and then matched these against the
corresponding ones in the model sky. This worked very well and
was very fast, when the number of bright sources present in the
field of view was much smaller than the array size P. This variant
was presented at various meetings but was then dropped because
of the simplicity and power of the current version of StEFCal.
8.2. Extension to iterative reweighted least squares
In Sect. 2.1, it was pointed out that appropriate weighting of
each data point may be required to reduce the effects of outliers.
Typically, this is done by assigning weights to the data values
based on their reliability or use a different norm, for example the
1-norm, that is less sensitive to outliers. To handle such cases,
we have developed a variant of StEFCal that follows an iterative reweighed least squares (IRLS) approach (Moon & Stirling
2000). In an IRLS algorithm, the data values are weighted so
that the 2-norm minimization becomes equivalent to minimization using another norm. In our example below, we minimize the
1-norm of the residuals. The resulting algorithm still has O(P2 )
complexity, but the individual iterations require more operations
to calculate and apply the weights.
S. Salvini and S. J. Wijnholds: Analysis of ADI methods for gain calibration
We aim to minimize the 1-norm of the residuals, which is not
the matrix 1-norm but the sum of the absolute values of all data
points
q,p − gq Mq,p g∗p |,
Δ1 =
|R
(33)
q
p
where the indices p and q run over the receiving elements. The
kernel of the algorithm is modified by using the weights
Wq,p =
1
q,p − gq Mq,p g∗p |
|R
(34)
with appropriate checks and actions for very small (or zero) entries in the denominator.
We can apply these weights in the basic StEFCal iteration by
replacing (12) by
[i−1]
H
R
:p · W:p Z:p
[i]
(35)
gp = H Z[i−1]
W:p Z[i−1]
:p
:p
and applying corresponding changes to Algorithm 1. At the end
of each iteration, the appropriate weights would need to be computed using (34).
As an example, we consider the calibration in the 2- and
1-norm of test data for 200 receivers with a tolerance of 10−7 .
The 2-norm calibration required 28 iterations, while the 1-norm
calibration required 52 iterations. Computational costs per iteration were higher by a factor 1.5. This factor can be explained
by the increased number of operations required for relatively
expensive calculations like taking the absolute value of a complex number. An interesting question, which is beyond the scope
of this paper, is whether it is necessary to do 1-norm optimization until convergence or whether the weights can be fixed after
a limited number of iterations when the solution is sufficiently
close to the optimum. Such an approach would reduce computational costs by avoiding the recalculation of weights from a
certain point in the iteration process.
8.3. Integration of StEFCal in other algorithms
In Sect. 7, we saw an example of how StEFCal was integrated
in an existing calibration pipeline. This particular example involved a non-diagonal noise covariance matrix that was modeled by introducing an additional noise parameter for each offdiagonal entry of the noise covariance matrix that was assumed
to be non-zero. In this paper, we set the diagonal entries of the
and the model covariance matrix M
array covariance matrix R
to zero. We could easily accommodate the estimation of the nondiagonal noise covariance matrix by setting not only the entries associated with the autocorrelations to zero, but also the
entries associated with the non-zero off-diagonal entries of the
noise covariance matrix. We can use the same procedure to account for corrupted or missing data or for when short baselines
should be excluded. Of course, this should not be done unnecessarily, because exclusion of potentially useful information from
the gain estimation process will degrade the gain estimation
performance.
Estimation of direction-dependent gains is currently a hot
topic in radio astronomy (Wijnholds et al. 2010). Apart from
brute force approaches using the Levenberg-Marquardt solver,
two iterative approaches, the differential gains method proposed by Smirnov (2011) and calibration using space alternating generalized expectation maximization (SAGECal) proposed
by Yatawatta et al. (2009) and Kazemi et al. (2011), have become quite popular. Both methods iterate over the directions
for which antenna-based gains need to be estimated, assuming
that the other directions are already calibrated. In doing so, both
methods reduce the estimation problem for each specific direction to the problem of estimating direction independent gains.
Currently, the Levenberg-Marquardt solver is used for each of
these subproblems, but given the nature of the problem, those
estimation steps could be replaced by StEFCal, which is a solver
specific to the problem. Introducing StEFCal in such an algorithm can potentially reduce their computational requirements
significantly as demonstrated by Salvini & Smirnov (2013) and
Salvini & Wijnholds (2014a).
8.4. Summary of main results
In this paper we have analyzed the performance of ADI methods for solving antenna-based complex valued gains with O(P2 )
complexity. We have
– done a rigorous analysis of convergence showing that the algorithm converges to the optimal value except in a number
of special cases unlikely to occur in any practical scenario;
– reported on its numerical and computational performance;
in particular, we highlighted its raw speed, as well as its
scalability;
– assessed the statistical performance and shown that it performs very close to the Cramer Rao bound (CRB) in most
realistic scenarios;
– commented on variations in the basic ADI method, extension
to full polarization cases, and inclusion in more complex calibration scenarios.
Acknowledgements. We would like to thank Oleg Smirnov, Marzia Rivi, Ronald
Nijboer, Alle-Jan van der Veen, Jaap Bregman, Johan Hamaker, and Tammo Jan
Dijkema for their useful contributions during discussions, and their constructive feedback on earlier versions of this paper. The research leading to this paper has received funding from the European Commission Seventh Framework
Programme (FP/2007−2013) under grant agreement No. 283393 (RadioNet3).
References
Boonstra, A. J. 2005, Ph.D. Thesis, Delft University of Technology, The
Netherlands
Boonstra, A.-J., & van der Veen, A.-J. 2003, IEEE Transactions on Signal
Processing, 51, 25
Bowman, J. D., Cairns, I., Kaplan, D. L., et al. 2013, Publ. Astron. Soc. Aust.,
30, 28
Couillet, R., & Debbah, M. 2011, in IEEE Int. Conf. on Acoustics, Speech and
Signal Processing (ICASSP) [arXiv:1105.0060]
de Vos, M., Gunst, A. W., & Nijboer, R. 2009, Proc. IEEE, 97, 1431
Dewdney, P. E., Hall, P. J., Schilizzi, R. T., & Lazio, T. J. L. W. 2009, Proc. of
the IEEE, 97, 1482
Dewdney, P. E., et al. 2013, SKA1 System Baseline Design, Tech. Rep.
SKA-TEL-SKO-DD-001, SKA Project Office, Manchester (UK)
Dijkema, T. J. 2014, in CalIm 2014 Workshop, Kiama (Australia)
Hamaker, J. P. 2000, A&AS, 143, 515
Kay, S. M. 1993, Fundamentals of Statistical Signal Processing – Volume I:
Estimation Theory, Prentice Hall Signal Processing Series (Prentice Hall)
Kazemi, S., & Yatawatta, S. 2013, MNRAS, 435, 597
Kazemi, S., Yatawatta, S., Zaroubi, S., et al. 2011, MNRAS, 414, 1656
Kulkarni, S. R. 1989, AJ, 98, 1112
Lonsdale, C. J., Cappallo, R. J., Morales, M. F., et al. 2009, Proc. IEEE, 97,
1497
Mitchell, D. A., Greenhill, L. J., Wayth, R. B., et al. 2008, IEEE J. Selected
Topics in Signal Processing, 2, 707
A97, page 13 of 14
A&A 571, A97 (2014)
Moon, T. K., & Stirling, W. C. 2000, Mathematical Methods and Algorithms for
Signal Processing (Upper Saddle River (New Jersey): Prentice Hall)
Ng, B. C., & See, C. M. S. 1996, IEEE Trans. Antennas Propag., 44, 827
Noordam, J. E., & Smirnov, O. M. 2010, A&A, 524, A1
Offringa, A. R. 2012, Ph.D. Thesis, University of Groningen, Groningen,
The Netherlands
Offringa, A. R., de Bruyn, A. G., Zaroubi, S., et al. 2013, A&A, 549, A11
Ottersten, B., Stoica, P., & Roy, R. 1998, Digital Signal Processing, A Review
Journal, 8, 185
Palais, R. S. 2007, J. Fixed Point Theory and Applications, 2, 221
Prasad, P., & Wijnholds, S. J. 2013, Phil. Trans. Roy. Soc. A
Salvini, S., & Smirnov, O. 2013, in 3rd Workshop on 3rd Generation Calibration
(3GC3)
Salvini, S., & Wijnholds, S. J. 2014a, in CALIM 2014 Workshop, Kiama
(Australia)
Salvini, S., & Wijnholds, S. J. 2014b, in 31st URSI General Assembly and
Scientific Symposium, Beijing (China)
A97, page 14 of 14
Salvini, S., Dulwich, F., Mort, B., & Zarb-Adami, K. 2011, in Aperture Array
Verification Programme (AAVP) Workshop, Dwingeloo (The Netherlands)
Smirnov, O. M. 2011, A&A, 527, A106
Thompson, A. R., Moran, J. M., & Swenson, G. W. 2004, Interferometry and
Synthesis in Radio Astronomy, 2nd edn. (Weinheim, Germany: Wiley-VCH
Verlag GmbH)
Van Haarlem, M. P., Wise, M. W., Gunst, A. W., et al. 2013, A&A, 556, A2
Wijnholds, S. J. 2010, Ph.D. Thesis, Delft University of Technology, Delft,
The Netherlands
Wijnholds, S. J., van der Tol, S., Nijboer, R., & van der Veen, A.-J. 2010, IEEE
Signal Process. Mag., 27, 30
Wijnholds, S. J., & van der Veen, A.-J. 2009, IEEE Transactions on Signal
Processing, 57, 3512
Yatawatta, S., Zaroubi, S., de Bruyn, G., Koopmans, L., & Noordam, J. 2009, in
13th IEEE DSP Workshop, Marco Island (Florida), 150
Zatman, M. 1998, IEE Proc. Radar, Sonar and Navig., 145, 85


© Copyright 2026