
Executive Board Meeting Agenda
ExecutiveBoardMeeting Agenda Friday,November21,2014,9:00a.m.–12:30p.m. SFPUC,HetchHetchyRoom, 13thFloor,SanFrancisco,CA ____________________________________________________________________________________________________________________________________ Agenda Item Time Page # ROLL CALL AND INTRODUCTIONS PUBLIC COMMENT CONSIDERATION TO TAKE AGENDA ITEMS OUT OF ORDER CONSENT CALENDAR 1. September 26, 2014 BACWA Executive Board Meeting Minutes 9:00 a.m. – 9:03 a.m. 9:03 a.m. – 9:05 a.m. 9:05 a.m. – 9:10 a.m. 9:10 a.m. ‐ 9:15 a.m. 2. August & September, 2014 Treasurer’s Reports 3. Fiscal Year 2013‐14 Financial Reports* ‐ Scott Klein (BACWA Treasurer) REPORTS 4. Committee Reports 5. Executive Board Reports 6. Executive Director Report 7. Regulatory Program Manager Report 8. Other BACWA Representative Reports a. RMP‐TRC: Rod Miller b. RMP Steering Committee: Karin North; Jim Ervin c. Summit Partners: Dave Williams d. ASC/SFEI: Laura Pagano; Dave Williams e. Nutrient Governance Steering Committee: Ben Horenstein; Jim Ervin f. SWRCB Nutrient SAG: Dave Williams g. SWRCB Focus Group – Bacterial Objectives: Lorien Fono; Amy Chastain h. SWRCB Focus Group – Mercury Amendments to the State Plan: Tim Potter i. Nutrient Technical Workgroup – Eric Dunlavey j. NACWA Taskforce on Dental Amalgam – Tim Potter 9:15 a.m. – 10:00 a.m. 3‐7 8‐21 *Refer to links below 22‐31 32‐38 39‐40 41‐51 52 53 CHAIR & EXECUTIVE DIRECTOR AUTHORIZED ACTIONS 9. Executive Director Authorization of funds for BAPPG/O’Rorke for “No Drugs Down the Drain” Campaign support 10. Chair Authorization of funds for Agreement with Univision for BAPPG FOG Outreach, Hispanic Radio Public Service Announcements OTHER BUSINESS 11. Discussion: Annual Member Meeting Planning 12. Discussion: Options for Incorporating AIR Committee into BACWA 13. Discussion: Treasure Island NPDES Permit 14. Discussion: Nutrients a. Technical Work b. Regulatory i. Update on Scoping/Evaluation Plans c. Governance Structure i. Steering Committee Meeting #3 ii. Program Coordinator 15. Discussion: Cap & Trade Update 16. Discussion: Air Regulations Impacts on Flaring 17. Discussion: Risk Management Update 18. Discussion: Toxicity Plan 19. Discussion: Ebola Virus Activities* 20. Discussion: BACWA Website Development Update SUGGESTIONS FOR FUTURE AGENDA ITEMS 10:00 a.m. – 10:05 a.m. 54‐56 57‐65 10:05 a.m. – 10:20 a.m. 66‐84 10:20 a.m. – 10:40 a.m. 85 10:40 a.m. – 11:00 a.m. 86‐89 11:00 a.m. – 11:15 a.m. 90‐113 114‐116 11:15 a.m. – 11:30 a.m. 117‐121 11:30 a.m. – 11:40 a.m. 122‐126 11:40 a.m. – 11:50 a.m. 127‐131 11:50 a.m. – 12:00 p.m. 132‐167 12:00 p.m. – 12:10 p.m. 168‐69 *Refer to links below 12:10 p.m. – 12:25 p.m. 170‐173 12:25 p.m. – 12:30 p.m. NEXT REGULAR MEETING The next regular meeting of the Board is scheduled for December 19, 2014 from 9:00 am – 12:30 pm at the EBMUD Treatment Plant Lab Library, 2020 Wake Avenue, Oakland, CA. ADJOURNMENT 12:30 p.m. *BACWA Fiscal Year 2013‐14 Financial Reports are available on the BACWA website at the following links: Audit Report FY12‐13: Memo on Internal Control and Required Communications, June 30, 2014: http://bacwa.org/Portals/0/ExecutiveBoard/Library/EBMUD%20BACWA%202014%20MOIC.pdf Audit Report FY12‐13: Basic Financial Statements for June 30, 2013 and 2012: http://bacwa.org/Portals/0/ExecutiveBoard/Library/EBMUD%20BACWA%202014%20BFS.pdf *Water Environment Federation Webcast Presentation Handouts: http://www.wef.org/EbolaWastewaterConcerns/ ExecutiveBoardMeetingMinutes September26,2014 ROLL CALL AND INTRODUCTIONS Executive Board Representatives: Mike Connor, Chair (East Bay Dischargers Authority); Amy Chastain (San Francisco Public Utilities Commission); Jim Ervin (San Jose); Ben Horenstein/Vince De Lange (East Bay Municipal Utility District); Roger Bailey (Central Contra Costa Sanitary District). Other Attendees: Name Agency/Company Bhavani Yerrapotu Sunnyvale Tim Potter Central Contra Costa Sanitary District Vince De Lange East Bay Municipal Utility District Karin North Palo Alto Amanda Roa Delta Diablo Amy Chastain SFPUC Denise Connors Larry Walker Associates Tricia McGovern PME Steve Bui RMC Monica Oakley RMC Yuan Yu EBMUD Vince Falzon Burlingame David Williams BACWA Sherry Hull BACWA PUBLIC COMMENT None. CONSIDERATION TO TAKE AGENDA ITEMS OUT OF ORDER None. CONSENT CALENDAR 1. August 15, 2014 BACWA Executive Board Meeting Minutes 2. July 2014 Treasurer’s Report 3. September 9, 2014 BACWA Executive Board Special Meeting Minutes Consent Calendar items 1, 2 and 3 were approved in a motion made by Roger Bailey and seconded by Jim Ervin. The motion carried unanimously. REPORTS Committee Reports were included in the handout packet for agenda item 4. 1 3 of 201 AIR Committee: Report in Handout. BAPPG: No meeting. Biosolids Committee – No meeting. Collections Committee: Report in Handout. InfoShare Group: Two meeting reports in Handout. Maintenance group asked if BACWA would consider paying for lunch. Budget provides support for the committee this year in the amount of $12,000. Approved by Executive Director with limits. Committee must inform the ED and get approval in advance. Lab Committee: Two meeting reports in Handout. Permits Committee: Two meeting reports in Handout. EBMUD has consent decree. Recycled Water Committee: Report in Handout. Executive Board representatives (Board) were given an opportunity to provide updates from each of the Principal agencies under agenda item 5, Executive Board Reports. Non‐principal members were also given an opportunity to report out on behalf of their agencies. No actions were taken on the report‐outs. EBMUD reported on the Food Waste Program. The City of Oakland contracted with California Waste Solutions, but Waste Management challenged the contract and 2 of 3 were reversed. EBMUD will still get commercial source‐separated organics. Also noted are upcoming changes to security at the Treatment Plant. The SFPUC reported that they had a good meeting with Regulatory Board about best practices for backup power. The Oceanside permit process still going on. The primary concern is ammonia. San Jose reported that their permit has been reissued. They have 14 projects in the works for next year. Central San is finalizing a study on phytoplankton production. Final report will be completed in February 2015. The study was coordinated with the NMS efforts. EBDA noted that the recent scientific data doesn’t support the ammonia toxicity hypothesis. Also noted comments from the CA Attorney General on wetlands goals. There were 95 specific goals recommended in the report. These are worth reviewing. 2 4 of 201 The Executive Director’s June Report was included in the handout packet for agenda item 6 and David Williams highlighted items in the report. Announcement for the next Workshop on Wheels will be in the BACWA Bulletin. It will focus on nutrients. BACWA has contracted with Computer Courage to design a new website. There will be a “members only” section on the new site. EBMUD has completed their audit of BACWA financials. The audit noted that the JPA requires additional insured certificates which have been procured. A “blanket waiver” letter has been sent to the Water Board. He noted that 3 action items remain incomplete from fiscal year 2013‐14 and 11 of the 16 action items from fiscal year 2014‐15 have been completed. The Regulatory Program Manager (RPM) Report under agenda item 7 was included in the handout packet. The ED suggested that the RPM make HDR aware of the Committees and coordinate the committees with HDR. Other BACWA Representative Reports were given an opportunity to provide updates under agenda Item 8, Other BACWA Representative Reports. No actions were taken based on the reports. a. RMP‐TRC: Rod Miller b. RMP Steering Committee: Karin North; Jim Ervin – The annual meeting will be October 14, 2014. c. Summit Partners: Dave Williams – d. ASC/SFEI: Laura Pagano; Dave Williams – The quarterly meeting was a closed session to discuss the search for a new director. Negotiations continue. e. Nutrient Governance Steering Committee: Ben Horenstein; Jim Ervin – f. SWRCB Nutrient SAG: Dave Williams – A presentation was made to the State Board from CASA with a focus on management actions and a link to benefits. g. SWRCB Focus Group – Bacterial Objectives: Lorien Fono; Amy Chastain – h. SWRCB Focus Group – Mercury Amendments to the State Plan: Tim Potter ‐ i. Nutrient Technical Workgroup – Eric Dunlavey – j. NACWA Taskforce on Dental Amalgam – Tim Potter – Amalgam rules out, going forward with standard. Low impact per EPA. Will create dental industry user category. Needs definition. Several questions were raised; including should BACWA comment? Should BACWA support NACWA in request for extension? should BACWA focus on education of dentists? The Board expressed general support for the rule. Board also supported extending comment time and Tim will take the lead in drafting a comment letter. CHAIR & EXECUTIVE DIRECTOR AUTHORIZED ACTIONS The following Executive Director Authorized Actions were taken since the August 15, 2014 Board meeting, listed under agenda item 9, and reviewed by the ED. Agenda Item 9 –Executive Director Authorization of funds for BAPPG/O’Rorke for social marketing ads for P2 Week. OTHER BUSINESS 3 5 of 201 Agenda Item10 ‐ Approve – JPA Funding Resolution. The ED noted that pages 45‐47 of the Handout show details of BACWA revenues as requested by the Board at the August 15, 2014 EB meeting. A motion to approve the JPA Funding Resolution was made by Jim Ervin and seconded by Ben Horenstein. The motion carried unanimously. Agenda Item 11 –Discussion‐ Feedback on Joint Meeting with Water Board: Discussed Nutrients, RMP Fees, Drought Issues, Chlorine. San Jose gave a presentation on net environmental benefit. Agreed that Risk Reduction would be discussed at Pardee Seminar. The Board discussed what it wishes to accomplish in discussions with the Water Board at the Pardee Technical Seminar. The issues include toxicity, bacterial objectives and mercury (no burden on POTW’s). Agenda Item 12 –Discussion‐ Feedback on Meeting with Chair of RWQCB – Planning to meet in November. Issues are sustainability, update of Basin Plan, Coordinate with ReNUWIt, grant to Conserve Our Wetlands, joint strategy in the South Bay. Agreed to provide details to BayKeeper. Agenda Item 13 –Discussion‐ Collection Systems Committee Support – Page 48 Monica Oakley is taking a leave of absence. Lenny Rather, Chair of the committee, indicated that they would support Monica’s replacement from RMC on a month to month basis. The Board indicated that the committees should have a process for transitions that include transparency. The issue will be discussed further at the Pardee Technical Seminar. The committee is deciding on its strategic direction. Dave Williams will attend a meeting. Karin North thanked Monica Oakley for her years of service. Agenda Item 14 –Discussion‐ SSO Enforcement Options – Meeting Handout. Monica noted that the most promising options are being identified and they are creating a template. Need to vet with committee. Next step is for BACWA to take to the Water Board. Looking for least burden on Water Board. There may be policy issues. Agencies would use the template when they are noticed or when they submit annually. The Board directed Monica to take it back to the Committee for review. Agenda Item 15 ‐ Discussion ‐ Nutrients a) Technical Work i) Update on WS Case Studies Symposium – Pages 49‐53 of the Handout: Yun Shang, EBMUD, provided a presentation on wastewater sidestream treatment project at EBMUD. The Board agreed that sidestream data questionnaire should be finalized and data collection should start. BACWA may add a link on its website. b) Regulatory i) HDR Contract for Optimization/Upgrade Studies – Pages 55‐63 of the Handout: 4 6 of 201 A contract with HDR was approved. BACWA will identify a main point of contact for all POTW’s. It was suggested that the CMG should participate in site visits. There will be a Scoping/Evaluation Plan review with the WB in December 2014. c) Governance Structure i) Steering Committee Governance Workgroup Meeting – Pages 64‐70 of the Handout show notes of the 2nd and 3rd meetings: Dave Ceppos is making sure that issues at Steering Committee meetings get moved forward. Developing a better process and relationship with BayKeeper. ii) Program Coordinator – To improve direction. 17 tasks identified that need to be undertaken. The Program Coordinator would be the person to undertake these tasks.. Agenda item 16 – Discussion: Next Steps on Chlorine Residual Monitoring (Amada Roa): Agenda item 17 – Discussion: Toxicity Update (Mike Connor): Pages 71‐87 of the Handout: LA County will challenge all recommendations. Not objecting to testing but to how it’s being implemented. Lead through Permits Committee. Should BACWA meet with EPA? Invite the EPA to BACWA Annual Meeting? On Agenda for Pardee Technical Seminar. Notify the Water Board. Agenda item 18 – Discussion: Regulatory Issue Matrix, Updated: Pages 88‐96 of the Handout: The Matrix will be updated before the Pardee Technical Seminar. CASA is looking to streamline the process. The level of detail is good. Agenda item 19 – Discussion: Pardee Planning. Pages 97‐98 of the Handout show the draft Agenda: Discussed deadlines for inclusion in handout. Discussed attendee invitations. Asked David Senn to give a conceptual model presentation. Agenda item 20 – Discussion: Annual Member Meeting Planning. Pages 99‐100 of the Handout show the Agenda for the last meeting: Discussed invitations. Discussed the length of the meeting vs. Committee participation. Agenda item 21 – Discussion: Summit Partners Meeting Agenda: Meets quarterly. Discussed value. There is little cost. Suggestions: micro‐beads, cigarette butts, plastics. SUGGESTIONS FOR FUTURE AGENDA ITEMS: None The meeting adjourned at 12:35 p.m. The next regular meeting of the Board is scheduled for November 21 26, 2014 from 9:00 am – 12:30 pm at the SFPUC, Hetch Hetchy Room, 13th Floor, San Francisco, CA. Pardee Technical Seminar is scheduled for October 21‐23, 2014. 5 7 of 201 8 of 201 Fund Balances as of month end 08/31/14 DESCRIPTION BACWA TRNG FND AIR BAPPG BEGINNING FUND BALANCE 07/1/14 777,507 TOTAL DISBURSEMENTS TOTAL RECEIPTS 12,737 80,268 ENDING FUND OUTSTANDING BALANCE ENCUMBRANCES 8/31/14 709,976 448,480 - - - - - 19,063 5,335 - 24,398 77,064 UNOBLIGATED FUND BALANCE 08/31/14 261,496 (52,666) 60,537 42 - 60,579 29,044 31,535 LEGAL RSRV 300,000 - - 300,000 - 300,000 WQA CBC 675,382 33,974 113,028 596,328 288,910 307,418 BACWAOPRES 160,000 - - 160,000 - 160,000 16,780 10 - 16,790 - 16,790 - - - - - - 58,295 11,033 - 69,328 - 69,328 158,082 2,366,678 2,279,438 245,322 24,451 220,872 - - - - - - RWR RESERVE WOT PRP84 WQA EMERG TECHACTION - - - - - - CBC OPRSRV 1,198,890 969 - 1,199,859 - 1,199,859 PRP50 109,015 64 3,233 105,847 14,820 91,026 3,533,551 2,430,841 2,475,966 3,488,425 882,769 2,605,657 9 of 201 BACWA Revenue Report for August 2014 DEPARTMENT Bay Area Clean Water Agencies Bay Area Clean Water Agencies Bay Area Clean Water Agencies Bay Area Clean Water Agencies Bay Area Clean Water Agencies BACWA TOTAL REVENUE TYPE BDO Member Contributions BDO Other Receipts BDO Fund Transfers BDO Interest Income BDO Assoc.&Affiliate Contr AIR-Air Issues&Regulation Grp AIR-Air Issues&Regulation Grp AIR TOTAL BDO Member Contributions BDO Interest Income BAPPG-BayAreaPollutnPreventGrp BAPPG TOTAL BDO Interest Income WQA-WtrQualityAttainmntStratgy WQA-WtrQualityAttainmntStratgy WQA-WtrQualityAttainmntStratgy WQA CBC TOTAL BDO Member Contributions BDO Other Receipts BDO Interest Income AMENDED BUDGET 459,000 41,354 6,500 4,000 168,300 679,154 DIRECT - 81,120 81,120 - 675,000 627,369 1,302,369 CURRENT PERIOD INVOICED 12,240 12,240 YEAR TO DATE INVOICED JVS 497 12,240 12,240 497 - DIRECT - 5,320 5,320 - - 5,320 5,320 - - - - - 17,162 8,261 25,423 - 8,153 8,153 10 of 201 JVS ACTUAL 497 12,240 12,737 UNOBLIGATED 459,000 41,354 6,500 3,503 156,060 666,417 15 15 5,320 15 5,335 75,800 (15) 75,785 - 42 42 42 42 (42) (42) 17,162 8,261 25,423 399 399 17,162 16,414 399 33,974 657,838 610,955 (399) 1,268,395 - BACWA Revenue Report for August 2014 AMENDED BUDGET - DIRECT - BDO Member Contributions BDO Interest Income - - Prop84BayAreaIntegRegnlWtrMgmt Prop84BayAreaIntegRegnlWtrMgmt Prop84BayAreaIntegRegnlWtrMgmt Prop84BayAreaIntegRegnlWtrMgmt Prop84BayAreaIntegRegnlWtrMgmt Prop84BayAreaIntegRegnlWtrMgmt Prop84BayAreaIntegRegnlWtrMgmt Prop84BayAreaIntegRegnlWtrMgmt Prop84BayAreaIntegRegnlWtrMgmt Prop84BayAreaIntegRegnlWtrMgmt Prop84BayAreaIntegRegnlWtrMgmt Prop84BayAreaIntegRegnlWtrMgmt Prop84BayAreaIntegRegnlWtrMgmt Prop84BayAreaIntegRegnlWtrMgmt Prop84BayAreaIntegRegnlWtrMgmt Prop84BayAreaIntegRegnlWtrMgmt Prop84BayAreaIntegRegnlWtrMgmt Prop84BayAreaIntegRegnlWtrMgmt Prop84BayAreaIntegRegnlWtrMgmt Prop84BayAreaIntegRegnlWtrMgmt Prop84BayAreaIntegRegnlWtrMgmt PRP84 TOTAL BDO Interest Income Administrative Support CCCSD-Concord RW Pipeline Central Dublin RW Project EBMUD East Bayshore I-80 PL Novato So. Area, Hamilton Fiel South Bay Salt Pond Habitat Re Regional Green Infrastructure Water Efficient LRP Bay Friendly Landscape TP Weather Based Irrigation Cntrl High Efficiency Toilet & UR High Efficiency Toilet & UI Napa Co. Rainwater HP Conservation Program Admin Flood Infrastructure Mapping T Stormwater Improvements & PBP Pescadero Integrated FRAH Restoration Guidance, San FC SF Estuary Steelhead MP Watershed Program Admnstrtn - CBC Operating Resrve Fnd CBC OPRSRV TOTAL BDO Interest Income Prop50BayAreaIntegRegnlWtrMgmt PRP50 TOTAL BDO Interest Income DEPARTMENT Regional Water Recycling RWR TOTAL REVENUE TYPE BDO Interest Income WOT - Wtr/Wwtr Operat Training WOT - Wtr/Wwtr Operat Training WOT TOTAL CURRENT PERIOD INVOICED - YEAR TO DATE INVOICED JVS 10 10 - DIRECT - 11,000 11,000 - - 11,000 11,000 - - - - 91,906 978,500 56,500 703,950 31,250 63,250 33,760 65,230 78,374 3,924 134,098 33,359 6,566 7,106 9,647 5,378 14,417 18,549 28,306 2,497 2,366,566 - - - - - - - - - - 11 of 201 JVS ACTUAL 10 10 UNOBLIGATED (10) (10) 33 33 11,000 33 11,033 (11,000) (33) (11,033) 112 112 112 91,906 978,500 56,500 703,950 31,250 63,250 33,760 65,230 78,374 3,924 134,098 33,359 6,566 7,106 9,647 5,378 14,417 18,549 28,306 2,497 2,366,678 (112) (91,906) (978,500) (56,500) (703,950) (31,250) (63,250) (33,760) (65,230) (78,374) (3,924) (134,098) (33,359) (6,566) (7,106) (9,647) (5,378) (14,417) (18,549) (28,306) (2,497) (2,366,678) - 969 969 969 969 (969) (969) - 64 64 64 64 (64) (64) - BACWA Treasurer's Report Expenses and Encumbrances Period Covering July 1, 2014 through August 30, 2014 Deptid Total Disbursements Outstanding Encumbrances 800 802 803 805 811 815 80,268 113,028 2,279,438 3,233 448,480 77,064 29,044 288,910 24,451 14,820 TOTAL 2,475,966 882,769 12 of 201 BACWA Expense Report for August 2014 DEPARTMENT Bay Area Clean Water Agencies Bay Area Clean Water Agencies Bay Area Clean Water Agencies Bay Area Clean Water Agencies Bay Area Clean Water Agencies Bay Area Clean Water Agencies Bay Area Clean Water Agencies Bay Area Clean Water Agencies Bay Area Clean Water Agencies Bay Area Clean Water Agencies Bay Area Clean Water Agencies Bay Area Clean Water Agencies Bay Area Clean Water Agencies Bay Area Clean Water Agencies Bay Area Clean Water Agencies Bay Area Clean Water Agencies Bay Area Clean Water Agencies Bay Area Clean Water Agencies Bay Area Clean Water Agencies Bay Area Clean Water Agencies Bay Area Clean Water Agencies Bay Area Clean Water Agencies Bay Area Clean Water Agencies Bay Area Clean Water Agencies Bay Area Clean Water Agencies Bay Area Clean Water Agencies Bay Area Clean Water Agencies BACWA TOTAL EXPENSE TYPE BC-Collections System BC-Permit Committee BC-Water Recycling Committee BC-Biosolids Committee BC-InfoShare Groups BC-Laboratory Committee BC-Miscellaneous Committee Sup LS-Regulatory Support LS-Executive Board Support CAS-PSSEP CAS-CPSC CAS-PSI CAR-BACWA Annual Report CAR-BACWA Website Development/ AS-BACWA Admin Expense CAR-Other Communications GBS- Meeting Support AS-Executive Director AS-Assistant Executive Directo AS-EBMUD Administrative Servic AS-Insurance BC-Pretreatment Committee BC-BAPPG CAS-CWCCG AS-Regulatory Program Manager BDO-CAS-Stanford ERC CAS-FWQC AIR-Air Issues&Regulation Grp AIR-Air Issues&Regulation Grp AIR TOTAL Administrative Support BDO Contract Expenses BAPPG-BayAreaPollutnPreventGrp BAPPG-BayAreaPollutnPreventGrp BAPPG-BayAreaPollutnPreventGrp BAPPG TOTAL BAPPG-CE-Emerging Issues BAPPG-CE-Other BAPPG-CE-Multi-Pollutant WQA-WtrQualityAttainmntStratgy WQA-WtrQualityAttainmntStratgy WQA-WtrQualityAttainmntStratgy WQA-WtrQualityAttainmntStratgy WQA-WtrQualityAttainmntStratgy WQA-WtrQualityAttainmntStratgy WQA-WtrQualityAttainmntStratgy WQA CBC TOTAL WQA-CE-Technical Support WQA-CE-Collaborations & Sponso WQA-CE-Commun. & Reporting WQA-CE-Other WQA-CE-Nutrient WS Permit Comm WQA-CE-Nutrient Tech Support WQA-CE Risk Reduction Prop84BayAreaIntegRegnlWtrMgmt Prop84BayAreaIntegRegnlWtrMgmt Prop84BayAreaIntegRegnlWtrMgmt Prop84BayAreaIntegRegnlWtrMgmt Administrative Support BDO Contract Expenses CCCSD-Concord RW Pipeline Central Dublin RW Project AMENDED BUDGET 26,000 1,000 8,365 5,000 12,000 7,000 28,064 4,475 2,000 20,000 5,000 500 1,000 8,300 5,500 200 15,600 178,500 76,500 40,000 4,500 1,000 81,000 25,000 120,000 10,000 5,000 691,504 ENC (126) (14,152) (4,895) (402) (760) (29,750) (7,264) (17,305) (74,653) CURRENT PERIOD PV DA 374 600 1,833 29,750 7,089 2,940 25,000 37,213 30,373 JV - ENC 22,420 7,365 12,000 148,064 4,475 1,626 1,500 877 148,750 61,403 40,000 448,480 YEAR TO DATE PV DA 2,580 374 600 1,917 123 29,750 14,127 7,007 2,940 25,000 46,954 37,464 JV (850) (300) (3,000) (4,150) OBLIGATED 24,150 7,365 12,000 148,064 4,475 2,000 2,100 1,917 700 178,500 82,537 39,940 25,000 528,748 UNOBLIGATED 1,850 1,000 1,000 5,000 7,000 (120,000) 20,000 5,000 500 1,000 6,200 3,583 200 14,900 (6,037) 60 4,500 1,000 81,000 120,000 10,000 5,000 162,756 4,056 77,064 81,120 (0) (0) - - - 77,064 77,064 - - - 77,064 77,064 4,056 4,056 8,044 8,044 (2,349) (50) (1) (2,400) - - - 8,044 5,000 16,000 29,044 - - - 8,044 5,000 16,000 29,044 1 (5,000) (16,000) (21,000) 377,369 21,000 880,000 450,000 15,000 1,743,369 (203,280) (32,219) 15,000 (220,499) - - 267,910 6,000 15,000 288,910 151,228 151,228 5,000 5,000 (43,200) (43,200) 375,939 5,000 6,000 15,000 401,939 1,430 (5,000) 15,000 865,000 450,000 15,000 1,341,430 - - 500 23,951 - 4,778 - 978,500 56,500 - 500 28,728 978,500 56,500 (500) (28,728) (978,500) (56,500) - - 148,358 148,358 - 13 of 201 Prop84BayAreaIntegRegnlWtrMgmt Prop84BayAreaIntegRegnlWtrMgmt Prop84BayAreaIntegRegnlWtrMgmt Prop84BayAreaIntegRegnlWtrMgmt Prop84BayAreaIntegRegnlWtrMgmt Prop84BayAreaIntegRegnlWtrMgmt Prop84BayAreaIntegRegnlWtrMgmt Prop84BayAreaIntegRegnlWtrMgmt Prop84BayAreaIntegRegnlWtrMgmt Prop84BayAreaIntegRegnlWtrMgmt Prop84BayAreaIntegRegnlWtrMgmt Prop84BayAreaIntegRegnlWtrMgmt Prop84BayAreaIntegRegnlWtrMgmt Prop84BayAreaIntegRegnlWtrMgmt Prop84BayAreaIntegRegnlWtrMgmt Prop84BayAreaIntegRegnlWtrMgmt Prop84BayAreaIntegRegnlWtrMgmt PRP84 TOTAL EBMUD East Bayshore I-80 PL Sonoma Valley RWP Stage 1 Bair Island Restoration Regional Green Infrastructure Water Efficient LRP Bay Friendly Landscape TP Weather Based Irrigation Cntrl High Efficiency Toilet & UR High Efficiency Toilet & UI Napa Co. Rainwater HP Conservation Program Admin Flood Infrastructure Mapping T Stormwater Improvements & PBP Pescadero Integrated FRAH Restoration Guidance, San FC SF Estuary Steelhead MP Watershed Program Admnstrtn - - - - - 24,451 4,778 Prop50BayAreaIntegRegnlWtrMgmt Prop50BayAreaIntegRegnlWtrMgmt PRP50 TOTAL Administrative Support BDO Contract Expenses - - - - - 500 14,320 14,820 3,233 3,233 30,373 - 882,769 206,193 2,524,037 (297,552) 185,571 14 of 201 703,950 31,250 63,250 33,760 65,230 78,374 3,924 134,098 33,359 6,566 7,106 9,647 5,378 14,417 18,549 28,306 2,497 2,274,660 2,317,124 - 703,950 31,250 63,250 33,760 65,230 78,374 3,924 134,098 33,359 6,566 7,106 9,647 5,378 14,417 18,549 28,306 2,497 2,303,888 (703,950) (31,250) (63,250) (33,760) (65,230) (78,374) (3,924) (134,098) (33,359) (6,566) (7,106) (9,647) (5,378) (14,417) (18,549) (28,306) (2,497) (2,303,888) - 500 17,553 18,053 (500) (17,553) (18,053) 3,358,735 (834,698) (47,350) 15 of 201 Fund Balances as of month end 09/30/14 DESCRIPTION BACWA TRNG FND AIR BAPPG BEGINNING FUND BALANCE 07/1/14 777,507 TOTAL DISBURSEMENTS TOTAL RECEIPTS 596,437 95,184 ENDING FUND OUTSTANDING BALANCE ENCUMBRANCES 9/30/14 1,278,759 441,299 UNOBLIGATED FUND BALANCE 09/30/14 837,460 - - - - - - 19,063 60,135 - 79,198 77,064 2,134 60,537 42 4,042 56,537 25,002 31,535 300,000 - - 300,000 - 300,000 WQA CBC 675,382 791,510 1,006,480 460,413 260,459 199,954 BACWAOPRES 160,000 - - 160,000 - 160,000 16,780 10 - 16,790 - 16,790 - - - - - - 58,295 115,333 - 173,628 - 173,628 158,082 2,366,678 2,279,438 245,322 24,451 220,872 - - - - - - LEGAL RSRV RWR RESERVE WOT PRP84 WQA EMERG TECHACTION - - - - - - CBC OPRSRV 1,198,890 969 - 1,199,859 - 1,199,859 PRP50 109,015 64 3,233 105,847 14,820 91,026 3,533,551 3,931,177 3,388,376 4,076,352 843,095 3,233,257 16 of 201 BACWA Revenue Report for September 2014 DEPARTMENT Bay Area Clean Water Agencies Bay Area Clean Water Agencies Bay Area Clean Water Agencies Bay Area Clean Water Agencies Bay Area Clean Water Agencies BACWA TOTAL REVENUE TYPE BDO Member Contributions BDO Other Receipts BDO Fund Transfers BDO Interest Income BDO Assoc.&Affiliate Contr AIR-Air Issues&Regulation Grp AIR-Air Issues&Regulation Grp AIR TOTAL BDO Member Contributions BDO Interest Income BAPPG-BayAreaPollutnPreventGrp BAPPG TOTAL BDO Interest Income WQA-WtrQualityAttainmntStratgy WQA-WtrQualityAttainmntStratgy WQA-WtrQualityAttainmntStratgy WQA CBC TOTAL BDO Member Contributions BDO Other Receipts BDO Interest Income AMENDED BUDGET 459,000 41,354 6,500 4,000 168,300 679,154 DIRECT - 81,120 81,120 - - - 675,000 627,369 1,302,369 - CURRENT PERIOD INVOICED 459,000 2,300 122,400 583,700 YEAR TO DATE INVOICED JVS 459,000 2,300 497 134,640 595,940 497 - DIRECT - 54,800 54,800 - - 60,120 60,120 - - - - - 8,153 8,153 525,041 232,495 757,536 17 of 201 JVS 542,203 240,756 782,959 ACTUAL 459,000 2,300 497 134,640 596,437 UNOBLIGATED 39,054 6,500 3,503 33,660 82,717 15 15 60,120 15 60,135 21,000 (15) 20,985 42 42 42 42 (42) (42) 399 399 542,203 248,909 399 791,510 132,797 378,460 (399) 510,859 - BACWA Revenue Report for September 2014 AMENDED BUDGET - DIRECT - BDO Member Contributions BDO Interest Income - - Prop84BayAreaIntegRegnlWtrMgmt Prop84BayAreaIntegRegnlWtrMgmt Prop84BayAreaIntegRegnlWtrMgmt Prop84BayAreaIntegRegnlWtrMgmt Prop84BayAreaIntegRegnlWtrMgmt Prop84BayAreaIntegRegnlWtrMgmt Prop84BayAreaIntegRegnlWtrMgmt Prop84BayAreaIntegRegnlWtrMgmt Prop84BayAreaIntegRegnlWtrMgmt Prop84BayAreaIntegRegnlWtrMgmt Prop84BayAreaIntegRegnlWtrMgmt Prop84BayAreaIntegRegnlWtrMgmt Prop84BayAreaIntegRegnlWtrMgmt Prop84BayAreaIntegRegnlWtrMgmt Prop84BayAreaIntegRegnlWtrMgmt Prop84BayAreaIntegRegnlWtrMgmt Prop84BayAreaIntegRegnlWtrMgmt Prop84BayAreaIntegRegnlWtrMgmt Prop84BayAreaIntegRegnlWtrMgmt Prop84BayAreaIntegRegnlWtrMgmt Prop84BayAreaIntegRegnlWtrMgmt PRP84 TOTAL BDO Interest Income Administrative Support CCCSD-Concord RW Pipeline Central Dublin RW Project EBMUD East Bayshore I-80 PL Novato So. Area, Hamilton Fiel South Bay Salt Pond Habitat Re Regional Green Infrastructure Water Efficient LRP Bay Friendly Landscape TP Weather Based Irrigation Cntrl High Efficiency Toilet & UR High Efficiency Toilet & UI Napa Co. Rainwater HP Conservation Program Admin Flood Infrastructure Mapping T Stormwater Improvements & PBP Pescadero Integrated FRAH Restoration Guidance, San FC SF Estuary Steelhead MP Watershed Program Admnstrtn - - CBC Operating Resrve Fnd CBC OPRSRV TOTAL BDO Interest Income - Prop50BayAreaIntegRegnlWtrMgmt PRP50 TOTAL BDO Interest Income - DEPARTMENT Regional Water Recycling RWR TOTAL REVENUE TYPE BDO Interest Income WOT - Wtr/Wwtr Operat Training WOT - Wtr/Wwtr Operat Training WOT TOTAL CURRENT PERIOD INVOICED - YEAR TO DATE INVOICED JVS 10 10 - DIRECT - - - 115,300 115,300 - - - 91,906 978,500 56,500 703,950 31,250 63,250 33,760 65,230 78,374 3,924 134,098 33,359 6,566 7,106 9,647 5,378 14,417 18,549 28,306 2,497 2,366,566 - - - - - - - - 104,300 104,300 18 of 201 JVS ACTUAL 10 10 UNOBLIGATED (10) (10) 33 33 115,300 33 115,333 (115,300) (33) (115,333) 112 112 112 91,906 978,500 56,500 703,950 31,250 63,250 33,760 65,230 78,374 3,924 134,098 33,359 6,566 7,106 9,647 5,378 14,417 18,549 28,306 2,497 2,366,678 (112) (91,906) (978,500) (56,500) (703,950) (31,250) (63,250) (33,760) (65,230) (78,374) (3,924) (134,098) (33,359) (6,566) (7,106) (9,647) (5,378) (14,417) (18,549) (28,306) (2,497) (2,366,678) - 969 969 969 969 (969) (969) - 64 64 64 64 (64) (64) - BACWA Treasurer's Report Expenses and Encumbrances Period Covering July 1, 2014 through September 30, 2014 Deptid Total Disbursements Outstanding Encumbrances 800 802 803 805 811 815 95,184 4,042 1,006,480 2,279,438 3,233 441,299 77,064 25,002 260,459 24,451 14,820 TOTAL 3,388,376 843,095 19 of 201 BACWA Expense Report for September 2014 DEPARTMENT EXPENSE TYPE Bay Area Clean Water Agencies Bay Area Clean Water Agencies Bay Area Clean Water Agencies Bay Area Clean Water Agencies Bay Area Clean Water Agencies Bay Area Clean Water Agencies Bay Area Clean Water Agencies Bay Area Clean Water Agencies Bay Area Clean Water Agencies Bay Area Clean Water Agencies Bay Area Clean Water Agencies Bay Area Clean Water Agencies Bay Area Clean Water Agencies Bay Area Clean Water Agencies Bay Area Clean Water Agencies Bay Area Clean Water Agencies Bay Area Clean Water Agencies Bay Area Clean Water Agencies Bay Area Clean Water Agencies Bay Area Clean Water Agencies Bay Area Clean Water Agencies Bay Area Clean Water Agencies Bay Area Clean Water Agencies Bay Area Clean Water Agencies Bay Area Clean Water Agencies Bay Area Clean Water Agencies Bay Area Clean Water Agencies BACWA TOTAL BC-Collections System BC-Permit Committee BC-Water Recycling Committee BC-Biosolids Committee BC-InfoShare Groups BC-Laboratory Committee BC-Miscellaneous Committee Sup LS-Regulatory Support LS-Executive Board Support CAS-PSSEP CAS-CPSC CAS-PSI CAR-BACWA Annual Report CAR-BACWA Website Development/ AS-BACWA Admin Expense CAR-Other Communications GBS- Meeting Support AS-Executive Director AS-Assistant Executive Directo AS-EBMUD Administrative Servic AS-Insurance BC-Pretreatment Committee BC-BAPPG CAS-CWCCG AS-Regulatory Program Manager BDO-CAS-Stanford ERC CAS-FWQC AIR-Air Issues&Regulation Grp AIR-Air Issues&Regulation Grp AIR TOTAL Administrative Support BDO Contract Expenses BAPPG-BayAreaPollutnPreventGrp BAPPG-BayAreaPollutnPreventGrp BAPPG-BayAreaPollutnPreventGrp BAPPG TOTAL BAPPG-CE-Emerging Issues BAPPG-CE-Other BAPPG-CE-Multi-Pollutant WQA-WtrQualityAttainmntStratgy WQA-WtrQualityAttainmntStratgy WQA-WtrQualityAttainmntStratgy WQA-WtrQualityAttainmntStratgy WQA-WtrQualityAttainmntStratgy WQA-WtrQualityAttainmntStratgy WQA-WtrQualityAttainmntStratgy WQA CBC TOTAL WQA-CE-Technical Support WQA-CE-Collaborations & Sponso WQA-CE-Commun. & Reporting WQA-CE-Other WQA-CE-Nutrient WS Permit Comm WQA-CE-Nutrient Tech Support WQA-CE Risk Reduction Prop84BayAreaIntegRegnlWtrMgmt Administrative Support AMENDED BUDGET CURRENT PERIOD PV DA ENC JV ENC YEAR TO DATE PV DA JV OBLIGATED UNOBLIGATED 26,000 1,000 8,365 5,000 12,000 7,000 28,064 4,475 2,000 20,000 5,000 500 1,000 8,300 5,500 200 15,600 178,500 76,500 40,000 4,500 1,000 81,000 25,000 120,000 10,000 5,000 691,504 (605) (578) (82) (5,916) (7,181) 605 578 82 5,916 7,181 3,000 428 4,308 7,736 - 21,815 7,365 12,000 148,064 4,475 1,048 1,500 795 148,750 55,487 40,000 441,299 3,185 952 205 29,750 20,043 54,135 3,600 2,345 7,007 2,940 4,308 25,000 45,200 (850) (300) (3,000) (4,150) 24,150 7,365 12,000 148,064 4,475 2,000 5,100 2,345 700 178,500 82,537 39,940 4,308 25,000 536,484 4,056 77,064 81,120 - - - - 77,064 77,064 - - - 77,064 77,064 4,056 4,056 8,044 8,044 (3,328) (714) (4,042) 3,328 714 4,042 - - 4,716 5,000 15,286 25,002 3,328 714 4,042 - - 8,044 5,000 16,000 29,044 1 (5,000) (16,000) (21,000) 377,369 21,000 880,000 450,000 15,000 1,743,369 (26,007) (2,444) (28,451) 26,007 2,444 28,451 - 241,903 6,000 12,556 260,459 177,236 2,444 179,680 375,939 5,000 6,000 880,000 1,266,939 1,430 (5,000) 15,000 450,000 15,000 476,430 - - - 500 500 (500) - 865,000 865,000 20 of 201 - - 5,000 865,000 870,000 - (43,200) (43,200) - 1,850 1,000 1,000 5,000 7,000 (120,000) 20,000 5,000 500 1,000 3,200 3,155 200 14,900 (6,037) 60 192 1,000 81,000 120,000 10,000 5,000 155,020 BACWA Expense Report for September 2014 AMENDED BUDGET CURRENT PERIOD PV DA EXPENSE TYPE Prop84BayAreaIntegRegnlWtrMgmt Prop84BayAreaIntegRegnlWtrMgmt Prop84BayAreaIntegRegnlWtrMgmt Prop84BayAreaIntegRegnlWtrMgmt Prop84BayAreaIntegRegnlWtrMgmt Prop84BayAreaIntegRegnlWtrMgmt Prop84BayAreaIntegRegnlWtrMgmt Prop84BayAreaIntegRegnlWtrMgmt Prop84BayAreaIntegRegnlWtrMgmt Prop84BayAreaIntegRegnlWtrMgmt Prop84BayAreaIntegRegnlWtrMgmt Prop84BayAreaIntegRegnlWtrMgmt Prop84BayAreaIntegRegnlWtrMgmt Prop84BayAreaIntegRegnlWtrMgmt Prop84BayAreaIntegRegnlWtrMgmt Prop84BayAreaIntegRegnlWtrMgmt Prop84BayAreaIntegRegnlWtrMgmt Prop84BayAreaIntegRegnlWtrMgmt Prop84BayAreaIntegRegnlWtrMgmt Prop84BayAreaIntegRegnlWtrMgmt PRP84 TOTAL BDO Contract Expenses CCCSD-Concord RW Pipeline Central Dublin RW Project EBMUD East Bayshore I-80 PL Sonoma Valley RWP Stage 1 Bair Island Restoration Regional Green Infrastructure Water Efficient LRP Bay Friendly Landscape TP Weather Based Irrigation Cntrl High Efficiency Toilet & UR High Efficiency Toilet & UI Napa Co. Rainwater HP Conservation Program Admin Flood Infrastructure Mapping T Stormwater Improvements & PBP Pescadero Integrated FRAH Restoration Guidance, San FC SF Estuary Steelhead MP Watershed Program Admnstrtn - - - - - 23,951 24,451 4,778 4,778 Prop50BayAreaIntegRegnlWtrMgmt Prop50BayAreaIntegRegnlWtrMgmt PRP50 TOTAL Administrative Support BDO Contract Expenses - - - - - 500 14,320 14,820 3,233 3,233 (39,674) 39,674 - 843,095 245,866 2,524,037 ENC JV 872,736 21 of 201 ENC YEAR TO DATE PV DA DEPARTMENT JV 978,500 56,500 703,950 31,250 63,250 33,760 65,230 78,374 3,924 134,098 33,359 6,566 7,106 9,647 5,378 14,417 18,549 28,306 2,497 2,274,660 3,189,860 OBLIGATED UNOBLIGATED - 28,728 978,500 56,500 703,950 31,250 63,250 33,760 65,230 78,374 3,924 134,098 33,359 6,566 7,106 9,647 5,378 14,417 18,549 28,306 2,497 2,303,888 (28,728) (978,500) (56,500) (703,950) (31,250) (63,250) (33,760) (65,230) (78,374) (3,924) (134,098) (33,359) (6,566) (7,106) (9,647) (5,378) (14,417) (18,549) (28,306) (2,497) (2,303,888) - 500 17,553 18,053 (500) (17,553) (18,053) 4,231,471 (1,707,434) (47,350) AIR Committee – Report to BACWA Board AIR Committee Meeting on: 11/12/14 Executive Board Meeting Date: 11/21/14 Committee Co-Chairs: Nohemy Revilla and Randy Schmidt Committee Request for Board Action: None Meeting held at the EBMUD facility at 2020 Wake Ave in Oakland. 18 attendees, representing 9 member agencies Committee Update: Chris Dembiczak and John Hake led a tour of the East Bay Municipal Utilities District (EBMUD) wastewater plant, focusing on the Co-Gen and the Resource Recovery Program. Following the tour, Elyse Engel of CH2M HILL provided an overview of regulatory updates, upcoming webinars and workshops, and current grant opportunities: http://bacwa.org/Portals/0/Users/045/57/557/2014Nov12-AIR_Mtg_FINAL.pdf. The total budget for Fiscal Year (FY) 2014/2015 is $77,064, with $28,910 spent (through 11/7/14). AIR Meetings will be held the 2nd Wednesday of every other month to better accommodate BACWA Board Meetings. Additionally, the AIR Committee discussed the opportunity to become a standing BACWA committee. There were concerns of preserving the autonomy of the committee with discussion of establishing a charter or bilaws. It was noted that the committee appreciates the unbiased and comprehensive perspective and presentations provided by having an independent consultant manage the meetings. EBMUD Energy and Resource Recovery Program: The meeting included a presentation and tour featuring EBMUD's electricity generation area, which includes 3 cogeneration engines, 1 turbine, and 1 boiler (all fueled with digester gas), and the Resource Recovery Program, which includes the food, oil, and grease (FOG) and solid food waste receiving, processing, and blending areas. State Regulatory Updates: On December 18, 2014, there will be a hearing to discuss amendments to greenhouse gas (GHG) mandatory reporting regulations anticipated to become effective on January 1, 2015. The amendments clarify reporting for biofuel production facilities and add renewable diesel as a reportable biomassderived transportation fuel. Amendments to compost and anaerobic digestion regulations have been proposed, which could affect POTWs. The amendments clarify several compostable material feedstock definitions, clarify the types of facilities that can accept these feedstocks, establish criteria for land application of compostable materials, clarify the inspection frequency of biosolids composting at POTWs, and exclude POTWs accepting hauled-in organic waste for co-digestion from the transfer operations requirements. Comments are due December 5, 2014. CalRecycle will hold a public hearing on December 10, 2014. Senate Bill 605 (Short-Lived Climate Pollutants) requires the California Air Resources Board to develop a strategy to reduce emissions of short-lived climate pollutants by January 1, 2016. This could affect methane emissions at POTWs. Grant Opportunities: CalRecycle is providing loans to reduce GHG emissions associated with California-generated green and food materials. $4.7 million in funding is available for FY 2014/2015, with a $2 million maximum loan amount and a 25% matching funds requirement. Primary applications are due December 1, 2014. The Water-Energy Grant Program supports the implementation of water, wastewater, and recycled water efficiency projects that reduce GHG emissions or water and energy consumption. $19 million is available in funding with a $2.5 million maximum award per proposal, a $5 million maximum award per applicant, and no minimum cost-share contribution. Proposals are due December 12, 2014. WaterSMART is offering 2 grant programs. Water and Energy Efficiency Grants include $19 million in funding for FY 2015, with $500,000 available per applicant per year. Applications are due January 15, 2014. Title XVI Water Reclamation and Reuse Program offers $20 million in funding for FY 2015, with applications due December 15, 2014. State Water Board’s Clean Water State Revolving Fund (CWSRF) Program is currently focused on recycled water projects for drought releif. CWSRF recently approved $800 million in 1% loans. Funding is still available. Eligible projects must apply for funding by December 2, 2015 and be completed by January 17, 2017. Tentative 2015 meeting dates: January 14, March 11, and May 13. 1 22 of 201 BAPPG Committee Report to BACWA Board Meeting Date: September 24, 2014 Prepared By: Robert C. Wilson, Petaluma BAPPG Vice Chair Committee Request for Board Action None Committee Updates BAPPG Pollutant Prioritization Meeting The BAPPG Chair Mike Auer, USD gave a general Pollution Prevention update explaining the changes in the prioritization meeting from prior years. The largest difference from prior meeting involved focus on specific pollutants and brainstorming sessions for project ideas. Included in the update was a discussion of the five focus pollutants triclosan, pharmaceuticals, fats oils and grease, pesticides, and a multi‐pollutant category including wipes Karri Ving and Manon Fisher, SFPUC and O’Rorke presented on the BAPPG’s Social Marketing Plan. The discussion covered the technical memorandum prepared by O’Rorke and addressed comments submitted by BAPPG members regarding program needs. Additional comments were requested as the Social Marketing Plan is a living document and member feedback will make the report more comprehensive. In addition to discussing the Marketing Plan, Karri explained the differences between Social Media and Social Marketing. Member agencies divided into groups to discuss one of the five focus pollutants. The triclosan group discussed reaching out to the consumer groups in an attempt to rally support for a ban. The pharmaceuticals group discussed outreach to veterinarians and hospice workers. The pesticides group discussed the continued support of the Our Water Our World program. The multi‐pollutant group mentioned revitalizing the “It” guides. The Fog group discussed resuming the holiday turkey fryer sticker program and possible outreach at food truck events. Current Project Summary Not General meeting. Projects summaries will be presented at the BAPPG general meeting on October 1, 2014. Date of Next BAPPG Meeting BAPPG Steering Committee Meeting October 1, 2014: 9:00am‐10:00am 1515 Clay Street, Second Floor, Room 12 Oakland, CA BAPPG General Meeting October 1, 2014: 10:00am‐12:00pm 1515 Clay Street, Second Floor, Room 12 Oakland, CA 23 of 201 BAPPG Committee Report to BACWA Board Meeting Date: October 1, 2014 Prepared By: Robert C. Wilson, Petaluma BAPPG Vice Chair Committee Request for Board Action None Committee Updates BAPPG General Committee Meeting and Steering Committee General discussion: The Sonoma Mendocino County Safe Medicine Disposal Symposium on Wednesday, October 29, 8:00 AM to 2:00 PM Our Water Our World messaging is expanding throughout stores including Home Depot throughout the Bay Area. New dental amalgam policies from USEPA to add pretreatment requirements for municipal staff. CASA Statewide Pesticides Steering Committee is working with the Department of Pesticide Regulation (DPR) to potentially regulate pet groomers. San Jose pursuing a county‐wide pharmaceutical ordinance similar to Alameda requiring all pharmacies to be take‐back locations. Annual P2 Award to be presented to Phil Bobel of Palo Alto Three member agencies presented school outreach programs to the BAPPG: Jennifer Kaiser from the Vallejo Sanitary District presented the STRAW (Students and Teachers Restoring a Watershed) Program that provides teachers and students resources for hands‐on watershed restoration activities in Marin and Sonoma Counties. In addition to the STRAW Program, in class presentations are available for students who have already done treatment plant tours. Joe Neugebauer from the West County Wastewater District gave a demonstration of tours provided for 4th, 8th, and 11th graders. The public outreach provided by the plant tours assists the West County Wastewater District in complying with the requirements of their NPDES. The district provides gift bags to tour attendees and reimburses the school districts for transportation cost. Rob Cole from the Central Marin Sanitation Agency (CMSA) spoke on the outreach CMSA provides for residents of Marin County at fairs and events in their service area. The CMSA attends school functions and events like farmer’s markets ecofests, and county fairs. In addition to the public outreach, CMSA changes their logo every two years and has giveaways that display the current logo and slogan. Current Project Summary Pollution Prevention Week messaging regarding proper disposal of wipes ‐ "Wipes Clog Pipes" campaign to run in mid‐September Messaging regarding proper disposal of cooking grease in Spanish to coincide with the upcoming holidays. 24 of 201 BAPPG Committee Report to BACWA Board Messaging regarding proper disposal of unwanted medications to run through social media in October/November and coordinated with projects of outside agencies to install additional medicine collection bins Date of Next BAPPG Meeting BAPPG Steering Committee Meeting November 5, 2014: 9:00am‐10:00am Teleconference BAPPG General Meeting December 3, 2014: 10:00am‐12:00pm 1515 Clay Street, Second Floor, Room 12 Oakland, CA 25 of 201 Collection Systems Committee Report to BACWA Board November 21, 2014 From: Vince Falzon, Committee Chair Prepared By: Steve Bui Committee Request for Board Action: None Highlights of New Items Discussed and Action Items for October & November. Sanitary Sewer Overflow (SSO) Mobile App – October Meeting David Patzer from the California Sanitation Risk Management Authority (CSRMA) provided the committee with an update on the development of the SSO reporting mobile app and demonstration of the app. The app has a variety of tools including volume estimation, photo and video documentation, and field report templates that ask for the same SSO information as the California Integrated Water Quality System (CIWQS). Only one subscription per Agency is required. Information uploaded to the app is stored on a cloud server and reports can be exported to Microsoft Excel and Adobe PDF. David’s presentation will be made available on the BACWA website. SSO Enforcement Options – October Meeting Monica Oakley provided the committee with an update on the SSO enforcement options, including a description of the refined (recommended) option, and the September BACWA Board meeting discussion. Committee meeting discussion included requiring a maximum 60-day response time from third parties and Regional Water Quality Control Board (RWQCB) staff, possible maximum dollar penalty, multiple spills could be included for one reporting, and not including spills that have gone to surface waters. Approximately 20 committee members support the recommended option. However, every agency will require senior management and legal staff to support a recommended action. EBMUD Consent Decree – October Meeting Heidi Oriol from the East Bay Municipal Utility District (EBMUD), Doug Humphrey from Humphrey Consulting, and Erin Smith from the City of Alameda presented information on EMBUD’s and the East Bay communities’ consent decree (CD). The presentation included: 1) historical background information; 2) an overview of the consent decree; 3) positive aspects and risks associated with the CD; and 4) next steps for EBMUD and East Bay Satellite Agencies. Next steps include working with the RWQCB on NPDES permit renewals, EBMUD’s plan for developing initial CD deliverables, and developing regional standards. Report from Regional Water Board Staff – November Meeting Claudia Villacorta from the RWQCB provided information about their regional SSO control program. The presentation included: 1) program goal; 2) metrics and trends in sewage spills in our Region from 2008-2013 and past enforcement actions; and 3) adjusted strategy for reducing spills and improving sewer systems in our Region. The same information was presented at the RWQCB July 9, 2014 Board meeting. Other Collection System New Items For the February meeting, Doug Humphrey and Paul Causey will present on the SSMP guidance manual. Announcements of Upcoming Training, Conferences, and Meetings • CSRMA is holding its 9th Annual Sewer Summit in Fremont on November 13. Three tracks are scheduled: 1) sewer system management; 2) emergency preparedness and response; and 3) sewer collections worker safety. • California Water Environment Association (CWEA) San Francisco Bay Section is holding “Collection Workers’ Job Safety” training in San Leandro on November 5. • National Association of Sewer Service Companies (NASSCO) is holding a Pipeline Assessment and Certification Program (PACP) classes in Alameda from November 12-14. Next Collection System Committee Meeting Our next committee meeting will be held on February 12, at 1:30 PM, at the Boy Scouts facility in San Leandro. The committee will meet bi-monthly until June 2015 and re-evaluate if committee meetings should be monthly. 26 of 201 Laboratory Committee – Report to BACWA Board Laboratory committee meeting on: 8 October 14 Committee Chair: Noel Enoki Vice Chair: Nirmela Arsem Committee Request for Board Action: None Audits: No audits mentioned or noted from members present at the meeting Regulatory developments: The formal objection letter from EPA Region 9 to RWQCB (LA Region) regarding the draft NPDES permits for Whittier Narrows and Pomona Water Reclamation plants was distributed to attending members for their information/review. Daniel Jackson (Benicia) and Lila Tang asked for comment on the proper analytical method for high level mercury analysis (>10ppb; previously established cutoff/threshold point determined in 1999 by Khalil Abu-Saba) and the proposed revision in the footnote of Pretreatment and Biosolids Monitoring (Table E-5) would be: “The Discharger shall use ultra-clean sampling (USEPA 1669) and ultra-clean analytical method (USEPA 1631) for mercury monitoring, except when expected levels are greater than 10µg/L in which case use of ultra-clean sampling and analysis would be optional” The Laboratory committee recognizes the importance of ultra-clean methodology for the sampling and analysis of low level mercury concentrations and the analytical options for concentrations greater than 10µg/L, particularly in the case of biosolid samples. The Laboratory committee does not have reservations in the revised/modified footnote for the pretreatment section of Benicia’s Permit but recommends that future revisions continue to be considered on a case by case permit basis. Open forum: General discussion of regulatory development and focus topics Focus topics: Overview presentation of USEPA 1668C by Martha Maier of Vista Analytical Laboratory. Martha covered general principles of the analytical method including method development, congener structures, isotopes (carbon/chlorine) and ratio assessment, chromatograms and mass spectra, detection limits, sample preparation, reporting, and evaluation of reports/results. Training Opportunities: No scheduled training for the November meeting Action Items: Noel will respond to Daniel Jackson and Lila Tang’s request for comment on the proposed revision to the pretreatment monitoring footnote. Next BACWA Laboratory Committee Meeting: Wednesday, November 12, 2014, at EBMUD Laboratory Library. 1 27 of 201 Laboratory Committee – Report to BACWA Board Laboratory committee meeting on: November 12, 2014 Committee Chair: Noel Enoki Vice Chair: Nirmela Arsem Committee Request for Board Action: None Audits: Raj Gumber (DSRSD) was recently audited with issues noted in micro, instrumentation/chemist MDL determination protocols, cyanide preservation, QA Manual waste disposal section, and data entry “write overs”. Raj conveyed specific details of his audit and shared his views/responses. Regulatory developments: Open forum: Continuous chlorine monitoring and reporting limits: Jessica Watkins (SFRQWCB) requested the lab groups input on continuous chlorine monitoring and associated reporting limits. According to Jessica, a number of discharger’s SMR reports are submitted with detection limits of “0.0” for total residual chlorine without numeric RLs or MDLs. The general consensus was continuous chlorine monitoring wouldn’t fall under the laboratory’s purview but would be part of the Treatment Facility. A copy of the WB’s 2008 Investigation of Continuous Online Measurement of Chlorine and Sulfite in Wastewaters was circulated to the lab group. Discussion included continuous monitoring of residual chlorine and bisulfite, lab methods used by group members, and other related details. Future toxicity requirements: Topic was requested for discussion by Jessica in reference to the recent LACSD permit reissuance for Pomona and Whittier with EPA requiring the incorporation of numeric rather than narrative limits for toxicity. San Jose commented on their statistical evaluation/comparison of chronic toxicity data using the TST, IC25, and NOEC. Questions raised included implementation timeline, the use of numeric limits, and manner of implementation (imposed amendment on current Permits or at renewal). Permit related QC Failure: Raj (DSRSD) requested discussion of QC failure data reporting in CIWQS. He also provide the FAQ response from the CIWQS website: Question- If a sample goes bad, how do I report it? Response- You should report it in your cover letter. Groups members shared their current practices and thoughts on reporting of qualified data, types and levels of qualified data (i.e. type of QC failures), where should it be reported or documented (cover letter or comment section), and the impact/consequences of qualified data reporting for Permit required sampling frequencies as interpreted by the RWQCB. The BOD analysis was discussed in detail referencing QC parameters/considerations, the 5 day result factor (limitations on re-sampling), meeting Permit weekly frequencies, other related analytical and reporting details. Additional comments were provided via email from Diane Lawyer (Quality Assurance Solutions), Bill Ray (William Ray Consulting), and Tony Pirondoni (City of Vacaville) on the above topics. Focus topics: Time allocated to Open Forum discussion. Recruitment Opportunities: Environmental Services Lab Director recruitment for Las Galinas Valley Sanitary District Action Items: Noel will forward a copy of the 2008 Investigation of Continuous Online Measurement of Chlorine and Sulfite in Wastewaters to BACWA Lab members via the group site. Next BACWA Laboratory Committee Meeting: Wednesday, December 10, 2014, at EBMUD Laboratory Library. 1 28 of 201 Permits Committee – Report to BACWA Board Permits Committee Meeting on: 10/28/14 Executive Board Meeting Date: 11/21/14 Committee Chair: Meg Herston Committee Request for Board Action: None 21 attendees representing 14 BACWA member agencies Robert Schlipf from Regional Water Board in attendance Presentation by RWQCB on13267 Order nutrient data (Robert Schlipf) Trends were presented using the two years of data. The following was surmised by RWQCB: Nitrogen concentrations increased with economic recovery Effluent loads increase in winter months Phosphorus removal is less efficient in wet weather Mr. Schlipf identified some remaining questions: How does economic growth impact loads? How to explain extremes/variability between plants? Will seasonal loads become more pronounced during wet weather? Will nitrogen loads trend by subembayment? The presentation is available electronically. Permits/Permit Amendments: January – Fairfield Suisun Sewer District – The administrative draft is expected soon. EPA is not expected to comment on toxicity for this permit. Report out from Executive Committee Meeting, September 26, 2014 and Board Retreat October 21-23, 2014 Yun Shang from EBMUD presented an update at the Executive Committee Meeting on nutrient optimization and side stream treatment case studies from the following agencies: Delta Diablo, OLSD, USD, SFPUC, and EBMUD. General feedback was that the Nutrient Symposium was interesting; hearing other case studies, the Bay Area is fortunate to have regulators willing to take a science based approach rather than implementing stringent effluent limits. Nutrients Optimization/Upgrade Studies –BACWA will be asking each agency for a point of contact with authority to approve/endorse HDR’s characterization of their plant. The characterization will be based on both survey(s) and site visit(s). A two-phase survey will be distributed to all plants in November. Phase I results are due December 15th; Phase II results are due in January 2015. Follow-up site visits will be conducted by HDR from April through December 2015. Steering Committee – Met 10/27/14. David Senn presented on the Science Plan, which will inform decisions of what studies need to be conducted in 2015. USGS will have no major reductions in funding in SF Bay. Nutrient Conceptual Model - David Senn has provided the Nutrient Conceptual Model report, which is the latest summary on how to define the SF nutrient problem. The report can be found at: http://sfbaynutrients.sfei.org/sites/default/files/SFBNutrientConceptualModel_Draft_Final_Oct2014.pdf Toxicity EPA provided comments on the Whittier Narrows permit in the LA region, objecting to toxicity requirements. LA Regional Board conceded to EPA demands. CASA and BACWA members have been working with State Board on a statewide Toxicity Plan. EPA’s comments undermine the work that is being done statewide. Both CASA and BACWA submitted comments to the LA Region. The permit and all comment letters can be found here. Informational Items/Announcements Pretreatment Reporting – The EPA no longer wants mailed paper copies of your pretreatment reports. The EPA address for submittal of all pretreatment reports is [email protected] Cancelation of November meeting –November meeting is cancelled due to the Veteran’s Day holiday Electronic Reporting – Agencies were required to report via eSMR 2.5 beginning October 1. Robert Schlipf from RWQCB reported that all agencies but two small agencies did so. Darleen Reddaway from Azura presented on the company’s WaterBits software capabilities for compliance with eSMR reporting. Next BACWA Permits Committee Meeting: Tuesday, December 9, 2014, at EBMUD Plant Library, 11-2pm with RWQCB staff and pot luck holiday lunch. 1 29 of 201 Pretreatment Committee – Report to BACWA Board Pretreatment Committee Meeting on: 10/9/2014 Executive Board Meeting Date: 11/21/14 Committee Chairs: Tim Potter, Kirsten Struve Committee Request for Board Action: None 10/9/14 Pretreatment Committee Meeting – 30 attendees representing 22 agencies 1. BACWA Updates Tim provided updates on the toxicity standards and the dental amalgam rule. 2. PCA/PCI Debrief SFPUC and Millbrae are scheduled in October San Jose received audit report, which included issues related to IU survey, monitoring periods and sampling, jurisdictional authority, dioxin, and consistent compliance definition. 3. Data Management Systems Agencies shared data management systems (Linko, Ipax, Filemaker, custom Access, PIMS, and Excel) Most agencies have dedicated/designated staff and/or contractor to assist. Learnings from going to off‐the‐shelf database include: i. It takes a long time (10 plus years) ii. Business practices may not fit the structure of the database and may need to be revised (e.g. enforcement and sampling) to fit the package software iii. Need buy in from staff level iv. Link to LIMS can be problematic 4. Root Control and CIPP lining Discussion of various approaches including permitting and reporting for root control applications in the collection system. Some reports of impacts with treatment processes. Discussion of approach to permitting for Cured‐in‐Place Pipe (CIPP) lining projects (control styrene discharges) 5. CROMERR Certification Complete for State of California Will track Federal Electronic Reporting Rule; current reports submitted through CIWQS (e.g. Pretreatment Reports) will meet standards; some reports not currently submitted through CIWQS will need development in order to meet standards 6. Federal Dental Amalgam Rule This committee will take lead on developing BACWA comments Tim will coordinate a working group Discussed the draft rule and potential issues 7. Next meeting: January in Hayward, invite Regional Board and EPA staff to discuss audit experience, dental amalgam rule (audit focus topics), pH guidance, hazardous waste report Future Meeting Topics Meet with EPA and Regional Board staff Resource Template 30 of 201 Recycled Water Committee – Report to BACWA Board Recycled Water Committee Meeting on: 10/1/14 Executive Board Meeting Date: 11/21/14 Committee Chair: Cheryl Muñoz Committee Request for Board Action: None. 16 attendees (incl. 6 on phone) representing 8 BACWA member agencies. Detailed notes from previous meetings are posted online. 2014 Prop 84 Drought Relief Regional Application DWR announced draft recommendations on funding on 9/23. Although many projects were not recommended for funding, over $28 million of the $33 million requested, was recommended for SF Bay Area projects. The DERWA Recycled Water Project and the Santa Clara Valley Water District project were disqualified, although DERWA intends to challenge the decision. ABAG held a kickoff workshop for Round 2 on October 31. General Reuse Order 2014-0090 SWRCB’s new statewide General Reuse Order 2014-0090 includes additional monitoring and reporting requirements. The SF Bay Area would like to retain the option to not only have existing or expanded recycled water projects covered under General Order 96-011, but also new projects. State Revolving Fund Loan Program Very low interest loans are available through the Drinking Water State Revolving Fund and can be used for construction with no limits on how much you can request. Comments on draft guidelines for this program were due 10/6. It is likely that recycling administration of the Water Bond will be administered by SRF program and will fall under these guidelines. 2014 Water Bond There was discussion and clarification of AB 1471. Chapter 9 includes $725 million for both recycled water and desalination. The funding allocation between recycled water and desalination will most likely need to be legislated. End-user retrofit projects are eligible for funds under Chapter 9. With respect to funding requirements in the bond, Chapter 9 includes references to California Water Code sections 79140 and 79141. These codes mandate that 50% of total funding will be for loans, and 50% will be for grants. There is concern about the new requirement of a 50% local funding match for the grant portion. Prop 50 and 84 required only a 25% funding match. This could cater to larger agencies, as smaller agencies may not have the local match. Jennifer West stated that it is possible to apply the loan portion of funding to the required 50% local match of the grant. Chapter 7 contains $65 million for SF Bay Region Integrated Regional Water Management projects, including recycled water projects. A 25% local match is required. Jennifer indicated that the loan match and allocation to desalination projects issues will be put before the WateReuse CA Board and discussed at their 10/24 meeting. WateReuse will coordinate with California Desal Association and the Board to determine recommendations. For more information, see http://ct3k1.capitoltrack.com/Bills/13Bills/asm/ab_1451-1500/ab_1471_bill_20140813_amended_sen_v96.pdf. California Environmental Dialogue (CED) CED is a subgroup of California for Environmental and Economic Balance (CEEB) to bring industry, environmentalists, and some public agencies together. Tam Dudoc and Fran Spivey-Weber from the State Board are involved. The CED has developed a small recycled water workgroup that will be developing a policy paper on recycled water that is planned to include potential revisions to General Order 2014-0900. The Committee concluded that the CED is not the right forum for BACWA agencies’ recycled water permitting issues given that the CED is looking for broad-based recommendations rather than technical and application-based suggestions. Bay Area Recycled Water Truck-Fill Facilities Survey A SurveyMonkey survey has been developed to gather information that will be used to create a BACWA Bay Area Recycled Water Truck-Fill Location Guide with basic information (hours, costs, training, etc.) on local water recycling and a map of recycled water truck-fill locations. The survey was sent out to BACWA agencies on 10/7, giving participants two week to fill out and submit results. Dave Williams had an initial conversation with Dyan Whyte from the RWQCB about granting approval for recycled water to be trucked across use area boundaries, provided that there is approval from both the local agency that is the supplier, and the agency that has jurisdiction over the use area where the water is the be used (receiving agency). Dave will follow-up with a letter to Dyan. Next BACWA Recycled Water Committee Meeting November 5, 2014 from 10:00 am to 12:00 pm, 2nd Floor Small Training Room at EBMUD Headquarters. 1 31 of 201 ExecutiveDirector’sReporttotheBoard October/November2014 NUTRIENTS: Completed a variety of tasks and activities associated with BACWA’s interests on nutrients and collaborating with the Water Board including: ‐ Attended and participated in the 4th meetings of the Steering Committee Governance Workgroup and served as scribe. Following the meeting prepared detailed meeting minutes and summary of action items. Materials delivered to the Steering Committee Facilitator. ‐Coordinated the efforts of the CMG and the consultant and held the Kickoff meeting to begin planning for the next two years of effort on the Optimization and Upgrade Studies. ‐Set up monthly meetings of the CMG and consulting teams and participated in the November monthly conference call. ‐Participated in conference calls with the Carollo and the BACWA team in planning and the Nutrient Watershed Case Studies Symposium. ‐Successfully conducted the 2nd BACWA Symposium entitled Nutrient Watershed Case Studies ‐Continued coordination on the in‐kind support committed by BACWA for the EBMUD EPA grant for nutrient research ‐Coordinated with the Science Manager on providing a Conceptual Model update at the Pardee Technical Seminar. ‐Coordinated with the Freshwater Trust on future interest in nutrient trading as part of the SF Bay Nutrient Management Strategy. BACWA BOARD MEETING: ‐Worked with the AED in preparing for the October Annual Technical Seminar and the November BACWA Board agenda including reviewing the agenda with the chair. ‐Attended the BACWA September Board meeting and worked with the AED and RPM in preparing the minutes and Action Items. ‐Prepared for and attended the Annual BACWA Technical Seminar and worked with the AED and RPM in preparing the minutes and Action Items. ‐Continuing to track all action items to completion. ASC/SFEI: ‐Participated in the ASC/SFEI monthly Executive Committee conference call for October ‐as the Chair of the Governance Committee, laid plans for the revitalization of the committee now that the new Executive Director had been hired. FINANCE: ‐Engaged in discussion with the AED and EBMUD regarding meeting to discuss improvements for reporting of financial data for BACWA. ‐Reviewed the BACWA financial reports with the AED and planned for revisions of the reports to make them more effective in conveying financial information to the Board. 32 of 201 ExecutiveDirector’sReporttotheBoard October/November2014 PERMIT: ‐Meet with the WB, WSPA, and BASMAA to discuss options for meeting the risk management requirement under the Watershed Permit COLLABORATION: ‐Coordinated with the CASA ED on topics on mutual interest (i.e. upcoming annual retreat, State Nutrient objectives, toxicity and potential litigation, and utility leadership committee). ‐Attended the CASA Annual Planning Retreat as the President of CASA. ‐Participated in a conference call of the Summit Partners Executive Directors to plan for the next Summit Partners meeting. ‐Participated in the monthly CASA Board meeting conference calls ‐Attended the quarterly Summit Partners meeting. ‐Discussed collaboration on the Watershed Permit Risk Reduction requirements with the Executive Director of WSPA. ‐Attended the CWCCG November meeting and discussed the State’s Cap and Trade Program. ADMINISTRATION: ‐Reviewed the proposed scope of work for the new IT/Website consultant. ‐Signed off on invoices, reviewed correspondence, prepared for upcoming Board meeting, responded to inquiries on BACWA efforts, oversaw updating of web page and provided general direction to BACWA staff. ‐Worked with the RPM in the preparation of the monthly BACWA bulletin. ‐Coordinated with the AED to coordinate activities and review duties, schedules, and priorities. MISCELLANEOUS MEETINGS/CALLS: ‐Paul Gilbert Snyder on Prop 50 and Prop 84 ‐BACWA Chair and Committee Chairs on items that arose during the month ‐Water Board staff on coordinating the nutrient activities ‐Jim Kelly as the Interim Executive Director of SFEI ‐other misc. calls and inquiries regarding BACWA activities ‐Attended WEFTEC sessions on nutrients, not funded by BACWA ‐Attended the November RWQCB meeting 33 of 201 October 21‐13 Technical Seminar at Pardee Action Items Number 2014.10‐ 30 2014.10‐ 29 2014.10‐ 28 2014.10‐ 26 2014.10‐ 25 2014.10‐ 24 2014.10‐ 22 Subject (Lead) Review of CBC fees (ED) Risk Management (RPM) AIR Committee becoming a regular BACWA Committee (ED) Approval of Scoping/Evaluation Plan(ED) Request by CCCSD for BACWA to testify at Water Board Hearing (CCCSD) Nutrients Regulatory (ED) Annual Meeting (ED) Task Deadline Status Prepare options for changing the CBC fees Dec 19,2014 Nov 21, 2014 Nov 21, 2014 Pending Set date with Water Board Dec 15, 2014 Done Provide speaking notes for review by BACWA and decision on testifying Nov 10,2014 Done Arrange for workshop for Points of Contact Jan 2015 Pending Invite EPA , RWQCB and SWRCB to Annual Meeting Nov 15, 2014 Done Respond to letter from WB requesting submittal of a plan Prepare options for Board consideration Done Done Action Items Remaining from Previous BACWA Executive Board Meetings Number Subject (Lead) Task Deadline Status 2014.08‐ IT update (AED) 08 Develop Scope and Enter into a Contract Pending 2014.06‐ 113 2014.05‐ 105 2014.05‐ 102 Joint meeting with Air District (ED, Air Comm. Chair) Annual Report (ED) NACWA Inquiry Regarding Collaboration with Agriculture (ED) Set up meeting with senior staff at BAAQMD 12/31/2014 Pending Produce scaled‐down version. Pending Forward request to Napa and Sonoma agencies and respond to NACWA. Pending FY15: 27 of 30 Action Items completed. FY14: 125 of 128 Action Items completed. FY13: 67 of 67 Action Items completed. 1 34 of 201 Board Calendar thru December 2014 As of Tuesday, November 18, 2014 at 10:09 PM DATE 12/15/2015 Joint Meeting Items due: 12/8 ASSIGNMENT Other Business: Discussions Review of Optimization and Upgrade Studies. STATUS NOTES Connor; Chastain; Horenstein; Ervin; Bailey Water Board Staff CMG HDR BayKeeper Williams; Fono 12/19/2014 Monthly Board Mtg Items due: 12/12 Connor; Pagano; Horenstein; Ervin; Bailey Williams; Fono; Hull Consent Previous Board Meeting Minutes (AED) Monthly Treasurer’s Report (EBMUD Accounting) Reports Committee Reports (Committee Chairs) Board Reports (Executive Board) ED Report (ED) RPM Report (RPM) Chair/ED Authorizations (AED) Other Business: Authorizations Chair Authorization of funds for Kelly Moran's assistance to BAPPG for monitoring and helping to develop comments on pesticides Other Business: Discussions Quarterly Update from CWCCG (S. Deslauriers) Annual Member Meeting Planning (ED) FY2016 Budget Planning Recycled Water Update (Bhavani) Sea Level Rise Update Info Share Groups: consider bidding contract; update on participation and regular updates to e-mail list in FY15 (M. Barnes) Optimization/Upgrade Studies Quarterly Update (CMG) 5m 40m CURRENTLY UNSCHEDULED AND SIGNIFICANT Approval of Annual Report FY12 & FY13 Defining BACWA Priorities/Revisit Strategic Plan BACWA Membership Engagement Opportunities Tech Seminar/Workshop: CCCSD Cogen explosion, SFPUC force main leak and repair, and BACWA member pilot plants. Chlorine Residual Analyzer Investigation Suggestions for Monthly Meeting Guest Speakers/Presenters: ie. Jim McGrath, State Water Board; ? CEC’s (Kelly Moran) Strategy Development for Triennial Review (Permits Committee/Board) Optimization/Upgrade Studies Quarterly Report to Board(CMG) Mar, Jun, Sept, Dec 2015-2017 BACWA BODCAL as of 11/18/2014 – Page 1 35 of 201 Optimization/Upgrade Studies Biannual Report to Members (CMG/Consultant) Oct, April BAAQMD Biannual Joint Meetings (Feb, Aug 2015) BOARD COMMITTEES WITH NO MEETINGS CURRENTLY SCHEDULED BACWA BODCAL as of 11/18/2014 – Page 2 36 of 201 November 18, 2014 Subject: USGA Modeling Proposal to NOAA Dear Dr. Martyr and Dr. Elias: BACWAisajointpowersagency,formedundertheCaliforniaGovernmentCodebythefive largestwastewatertreatmentagenciesintheSanFranciscoBayArea.Ourmembers includethemanymunicipalitiesandspecialdistrictsthatprovidesanitarysewerservices tomorethan6.5millionpeople.BACWAisdedicatedtoworkingwithourmembers,state andfederalregulatoryagencies,andnon‐governmentalorganizationstoimproveand enhancetheSanFranciscoBayenvironment.Weprovidetechnicalexpertise,financial support,andapublicutilityperspectivetoensurethatregulationsaffectingourmembers arewell‐informed,thoughtfulandeffective. BACWA has a long history of working closely with the San Francisco Bay Regional Water Quality Control Board (SFBRWQCB) and other regulators on studies to inform management decisions in the Bay. This collaborative approach between BACWA and SFBRWQCB has developed over the past 20 years of BACWA participating in and funding a portion of the Bay Regional Monitoring Program. Over the past 2 years, BACWA has been working with the SFBRWQCB to fund the implementation of the San Francisco Bay Nutrient Management Strategy (NMS), a joint fact finding science program, overseen by a steering committee comprised of regulators, resource agencies, dischargers, NGOs, and other stakeholders. The NMS calls for a coordinated science program, including monitoring, modeling, and mechanistic studies, to inform important and costly nutrient management decisions, and its implementation is directed by the San Francisco Estuary Institute, working in close collaboration with USGS and regional academic institutions. The understanding developed through this science program will help inform multi-billion dollar decisions about nutrient removal from the 42 WWTPs that service the Bay Area’s 7.2 million people. Hydrodynamic and water quality modeling are central components of the Nutrient Management Strategy. Those models will play critical roles in helping to identify nutrient management strategies that will be effective at mitigating or preventing any current adverse impacts from nutrients. In addition, because the service life of large wastewater capital improvement plans ranges over 30-50 years, the NMS will quantitatively explore ecosystem response under climate change and sea level rise scenarios to help inform long-term wastewater infrastructure planning. BACWA strongly supports your modeling proposal to the NOAA Sea Level Rise RFP. As you PO Box 24055, MS 702 • Oakland, CA 94623 • 415.308.5172 • www.bacwa.org Central Contra Costa Sanitary District • East Bay Dischargers Authority • City of San Jose • East Bay Municipal Utility District • City & County of San Francisco 37 of 201 know, the NMS is already collaborating with USGS to pursue a water quality modeling approach that builds upon CASCADE’s and Deltares’ modeling work to date. Both the future sea level rise scenarios and hydraulic connectivity themes of your proposal are highly relevant to nutrientrelated management decisions, and will improve our understanding about how the ecosystem behaves currently, how it may respond under changing drivers in the future, and what management actions will be most effective at protecting the Bay’s ecological health. Moreover, BACWA endorses the community model approach being pursued by CASCADE and the NMS, and its furtherance through this proposal. We expect there will be sustained NMS funding for modeling, and the NMS and NOAA funding combined will help ensure the success of the community modeling approach. We look forward to cooperating with UC San Diego/USGS, Deltares, and SFEI on this effort. Respectfullysubmitted, David R. Williams Executive Director Bay Area Clean Water Agencies cc: BACWA Board 38 of 201 REGULATORY PROGRAM MANAGER’S REPORT TO THE BOARD September23,2014–November17,2014 PreparedfortheNovember21,2014ExecutiveBoard Meeting SFEI CONTRACT OVERSIGHT: Reviewed SFEI invoices for September, 2014 and October, 2014. Approximately $550K of $675K has been spent for Fiscal Year 2014. SFEI released two reports for review by the Nutrient Technical Workgroup: draft-Final Conceptual Model Report and the Stormwater Nutrient Monitoring Report (links were distributed to BACWA members via the November BACWA Bulletin). They also facilitated the Science Plan discussion for the October 27th Nutrient Steering Committee meeting. RISK REDUCTION: Spoke with Jan O’Hara from the Water Board about the October 2, 2014 letter the Water Board sent to EBMUD, BASMAA, and WSPA regarding Mercury and PCB TMDL Risk Management Activities. Communicated with the ED and drafted a potential response letter that could be used as a basis of discussion on collaborating amongst these groups and also reaching out to the Aquatic Science Center. NUTRIENT WATERSHED SUPPORT: Review of the HDR Scoping and Evaluation Plan Outlines and provided comments, especially with regards to requirements in both the Nutrient Watershed Permit and original BACWA Request for Proposal. Attendance of the Contract Management Group meetings. BACWA BULLETIN: Updated October Bulletin and provided draft November Bulletin to AED to be sent out at the beginning of the month. COMMITTEE SUPPORT: Drafted agenda and Board Report for Permits Committee. Drafted comment letter on LACSD permits regarding EPA toxicity objections for Permits Committee. Reviewed Kim West’s meeting notes and Board Report for October Recycled Water meeting and AIR committee. REGULATORY ISSUES SUMMARY: Updated draft Regulatory Issues Matrix for review by Executive Committee. A final version will be distributed at the Annual Meeting. MEETINGS ATTENDED: Nutrient Contract Management Group (10/3/14 and 11/14/14), Recycled Water Committee (11/5/14), Permits Committee (10/28/14), AIR Committee (11/12/14) 39 of 201 SF Bay Nutrient Strategy FY2014 Status (Contract with SFEI) Updated 11/13/14 Total Spent of $675,000 $549,967.00 Task Description Upcoming Deliverable Original Date Updates 11 Lower South Bay Synthesis Draft Report December 2013 Expected in November 2014 4 (FY13) Suisun Synthesis I Final Report December 2013 Delivered March 2014 12 Suisun Synthesis II Draft Report April 2014 Expected in December 2014 13 Nutrient Science Plan Draft Plan February 2014 Work is ongoing 22 Moored Sensor Program Progress Update April 2014 Circulated for comment September 2014 23 Characterizing Phytoplankton Community Composition Draft Report April 2014 Manuscripts in preparation 24 Nutrient Monitoring Program Development Draft Plan March 2014 Circulated for comment September 2014 Draft Report July 2013 Delivered February 2014 Conceptual Model of Nutrient Exchange 3 (FY13) through Golden Gate 40 of 201 Clean Water Summit Partners 1225 8th Street Suite 595 Sacramento, CA 95814 p: 916.446.0388 f: 916.231.2141 Summit Partners: -‐ Bay Area Clean Water Agencies (BACWA) -‐ California Association of Sanitation Agencies (CASA) -‐ Central Valley Clean Water Association (CVCWA) -‐ California Water Environment Association (CWEA) -‐ Southern California Alliance of Publicly Owned Treatment Works (SCAP) November 10, 2014 9:30 AM – 1:30 PM Sutter Club - Capitol Room 3rd Floor 1220 9th Street, Sacramento, CA 95814 AGENDA 9.30 AM Call to Order, Mike Connor, Chair, BACWA Ø Welcome and Introductions Ø Approval of Minutes of May 6, 2014 Meeting Ø Review and Adjust Agenda 9:45 AM Key Issues Overview Ø Proposed Federal Rule re: Waters of the United States [Link] Ø Toxicity o Litigation Status [Pastore] o LACSD Permit Hearing [Link] o Next Steps re Proposed State Policy [Larson/all] Ø Ebola Issues related to Wastewater [Kester] 10:45 AM Updates • State Water Board Cost of Compliance [Link] • Wheeler Institute Research [Link] • Proposed Regulations for hauled in organic waste [Kester] • SCAQMD Rule 1110.2 implementation [Kester] 11:00 AM Break 11:15 AM Prepare for invited Guest [Pastore et. al) 11:30 AM Lunch with invited Guests: Matthew Buffleben and Jim Fischer, State Water Board Office of Enforcement 12:45 PM Strategic Planning Preparation [Williams/all] Ø Focus Questions Ø Triple bottom line analysis/cost drivers 1.30 PM Adjourn Ø Next Meeting: February 2015 Ø Date and Time Ø Hosted by CASA Ø Strategic Planning Blue font= attachment 41 of 201 Clean Water Summit Partners Meeting Minutes Tuesday, May 6, 2014 Sacramento Sutter Club, Sacramento Room Call to Order A meeting of the leaders from the state and regional clean water association was called to order on May 6, 2014 at 9:40 a.m. by Bob Ghirelli, President of SCAP. Present were: First Mike Steve Bobbi Greg Adam Michael Debbie Christoph Elizabeth Bob John Jackie Last Connor Hogg Larson Kester Link Riddell Webster Dobson Allan Ghirelli Pastore Kepke E-mail [email protected] [email protected] [email protected] [email protected] [email protected] [email protected] [email protected] [email protected] [email protected] [email protected] [email protected] [email protected] Assn BACWA CASA CASA CASA CASA CVCWA CVCWA CWEA CWEA SCAP SCAP CASA Approval of Minutes and Agenda The minutes of the February 19, 2014 meeting were approved unanimously on motion by John Pastore and second by Mike Connor. There were two additions to the agenda: (1) an item on a bacteria workshop meeting on May 15 and (2) an overview of the new recycled water general order. Action Items Proposed Federal Rule on Waters of the United States: Bobbi Larson discussed the contours of the proposed rule as applicable to wastewater facilities, noting that it leaves the waste treatment exception in place and provides some clarity regarding groundwater being outside the scope of the rule. CASA will be drafting a letter led by the attorneys and federal legislative committee, and CASA will be sending out a meeting request to the group to get thoughts on the contents of the letter. Adam and/or Jackie will also put this on the agenda for the May 8 CASA regulatory workgroup committee meeting. Bay Area Nutrient Process: Mike Connor discussed the status of the effort in Region 2 and provided graphs describing some of the elements being looked at within the stakeholder group. He also discussed the implementation timeframe, the investment in research and evaluation being made, and several other aspects of the process. No action items at this time. 42 of 201 Statewide Nutrient Policy: Adam Link discussed the status of the statewide nutrient policy development, including recent discussions with SWRCB staff and the potential entities that could pilot the CASA alternative, the status of the SCCWRP work being done, and the future of the stakeholder process. No action items at this time. Central Valley Salinity Variance: Debbie Webster discussed efforts in Region 5 to get a variance process in place for the Central Valley, Public comments have been submitted on the proposal and there have been no negative comments from USEPA. It was noted that the SWRCB was very interested in potentially utilizing this approach as part of the Inland Surface Waters Plan, and that we should be very supportive of that idea. USEPA Blending Panel: Bobbi Larson discussed the formation of a USEPA panel to address blending requirements in light of the 8th Circuit Iowa League of Cities decision. It was referenced that Ben Horenstein would be a good candidate to represent us on the panel, and as an action item, Bobbi will draft a letter of support on behalf of the summit partners in support of Ben’s role on the panel. SRCSD Permit and Actions: Christoph Dobson provided an overview of the status of the SRCSD EchoWater project, permit related litigation, and other aspects of the compliance process. No action items. Bacteria Workgroup: Bobbi Larson discussed the upcoming bacteria small workshop on May 15 and asked if each summit partner member could identify a representative interested in attending that meeting. On behalf of SCAP Jim Colston was determined to be the representative and Jackie/Adam will find a CASA representative at the workgroup meeting on May 8. As an action item, Bobbi offered to reach out to Vicki Whitney and try to reschedule the May 15 meeting to another date due to conflicts with association events. Salinity in Southern California Water: John Pastore brought up an item off-‐agenda related to increased salinity levels in Colorado River water supplies being used due to the drought. Bobbi Larson indicated that CASA is working with WateReuse CA to convene a group of interested stakeholders to develop a plan for engaging the State Water Board to provide interim relief for water recyclers. Proposed Recycled Water WDR: Greg Kester discussed the contours of the proposed recycled water general WDR and the need to clarify that entities can use their existing permits and that transition to enrolling in this WDR is optional. WateReuse will take the lead on commenting, and Mary Grace Pawson will be the contact person. As an action item, Bobbi suggested all the summit partners work through WateReuse to get any issues addressed and Bobbi will contact Mary Grace to let her know that summit partners may be reaching out to her on an individual association basis. 43 of 201 Resource Alignment / Wheeler Institute: Adam Link provided a brief overview of the resource alignment and SSO duplication items, as well as progress on the Wheeler Institute item, and thanked those who pledged to contribute to the research. No action items from this update at this time. CASA Regulatory Workgroup: Jackie Kepke reported that the transition from Tri-‐ TAC to the CASA regulatory workgroup has gone well with no complaints or issues. No action items at this time. Next Meeting: BACWA will host the next meeting. Bobbi (or Debbie Welch) will send out a doodle poll to find an agreeable time for the next meeting, targeted for September after Labor Day. At that point the group may be able to have a strategic planning session, likely with a speaker in the morning and the session in the afternoon. Jane Diamond, Director of Water Programs at EPA Region 9 will be invited to attend. The meeting adjourned at 1:30 pm. 44 of 201 CALIFORNIA ASSOCIATION of SANITATION AGENCIES 1225 8th Street, Suite 595• Sacramento, CA 95814 • TEL: (916) 446-0388 • www.casaweb.org November 5, 2014 Submitted via Federal eRulemaking Portal and via Email to [email protected] Water Docket, Environmental Protection Agency, Mail Code 2822T 1200 Pennsylvania Avenue NW Washington, DC 20460 Attention: Docket ID No. EPA–HQ–OW–2011–0880. Subject: Comments of the California Association of Sanitation Agencies on the Proposed Rule Defining “Waters of the United States” Dear Administrator McCarthy, The California Association of Sanitation Agencies (CASA) is pleased to provide comments on the proposed rule to define “waters of the United States” (hereafter “proposed rule”) under the federal Clean Water Act (CWA). CASA represents more than 100 local public wastewater agencies engaged in collecting, treating and recycling wastewater to ensure protection of public health and the environment. Collectively, our agencies serve over 90 percent of the sewered population of California. CASA’s member agencies operate wastewater treatment and water recycling facilities that discharge into waters of the United States as well as to waters of the state, and as such they may be impacted by the proposed rule’s promulgation as well as its implementation. CASA appreciates that the proposed rule explicitly specifies that the agencies propose no changes to the longstanding regulations that exclude waste treatment systems designed to meet the requirements of the CWA and prior converted cropland from the definition of ‘‘waters of the United States.’’ (79 FR 22217) These regulations provide an essential component of the existing regulatory framework that ensures effective agency operations. The retention of the waste treatment exemption is one of the highest priorities for clean water agencies. We also endorse the proposed rule’s clarification that the agencies do not intend alter the regulation of groundwater at the federal level and, in fact, the proposed rule codifies a number of the waters and features that the agencies have by longstanding practice generally considered not to be ‘‘waters of the United States.’’ (Id. at 22218) CASA holds several concerns about the expansion of federal jurisdiction under the proposed rule and potentially adverse ramifications for wastewater agencies across the state and the nation. Our primary concerns are: (1) the lack of clarity in the proposed rule as to what is included in the waste treatment exemption will create regulatory barriers to the effective implementation of recycled water projects without a commensurate benefit to the environment, thereby threatening recycled water projects that are vital to California water supply; and (2) expansion of jurisdictional waters under the proposed rule that could complicate and interfere with aspects of the wastewater treatment process. Specific issues and the manner in which the proposed rule could impact wastewater agencies are provided in more detail below. Ensuring Clean Water for California 45 of 201 CASA Comments on Proposed Waters of the U.S. Rule Administrator McCarthy November 5, 2014 The Waste Treatment Exemption Should Specifically Include Water Recycling Facilities and Effluent Storage Ponds In order to address the historic drought conditions currently plaguing the western states, water and wastewater agencies must rely on a full suite of flexible options to provide potable and recycled water supplies for a variety of ongoing uses. Thus, CASA opposes any direct or indirect regulatory impacts on water recycling, water storage, and other mechanisms that play a part in recycled water infrastructure and processes as a result of the proposed rule. As noted above, we appreciate the explicit acknowledgement and codification of the waste treatment exemption in the proposed rule. However, we believe it is important that the proposed rule expressly states that the waste treatment exemption extends to recycled water facilities. California water recycling projects often depend upon artificially created wetlands and storage ponds to treat millions of gallons of water a day. If these features are considered waters of the U.S. and are excluded from the waste treatment exemption, they could theoretically no longer be used as an integral component of the waste treatment systems, forcing the closure of important recycled water projects critical to California’s water supply. Moreover, a lack of clarity on this issue may stall or halt the development of recycled water projects at a time when recycling is needed the most to address climate resiliency priorities. Because recycled water demand is variable with time of day and season, recycled water agencies maintain reservoirs or storage basins/ponds to store recycled water during periods of low usage in anticipation of peak demands. These features are an essential component of the recycled water process and integral to an agency’s ability to continue reliably producing and supplying recycled water in many instances. The proposed rule should affirm that such reservoirs along with influent and treated effluent storage ponds are within the scope of the waste treatment exemption, consistent with the regulatory definition of “complete waste treatment system” found in existing federal regulations.1 As the proposed rule and existing practice acknowledge, waste treatment systems designed to meet the requirements of the Clean Water Act are not waters of the U.S., and treatment systems should include any facilities, including storage ponds and basins, related not only to traditional treatment facilities and processes, but also to the production of recycled water. In the alternative, recycled water facilities and features (including storage ponds, basins, artificially created wetlands, recycled water reservoirs and other features associated with water recycling) should be expressly exempted as part of the specifically identified features that are not considered waters of the U.S. within the proposed rule. In this case, recycled water facilities would be treated similar to artificial lakes, ponds, swimming pools, ornamental waters, and groundwater, which are specifically identified and expressly exempted. In either case, whether recycled water facilities are considered part of the waste treatment exemption or have their own 1 See 40 C.F.R. §35.2005(b)(12), defining “complete waste treatment system” as “all the treatment works necessary to meet the requirements of title III of the [CWA], involving . . . the ultimate disposal, including recycling or reuse, of the treated wastewater and residues which result from the treatment process.” (Emphasis added); see also 40 C.F.R. §35.2005(b)(49) [definition of “treatment works” includes “storage of treated wastewater in land treatment systems before land application” among other things] Ensuring Clean Water for California 46 of 201 2 CASA Comments on Proposed Waters of the U.S. Rule Administrator McCarthy November 5, 2014 specifically identified exemption, it is essential that the proposed rule not interfere with recycled water production and treatment by making those features jurisdictional. The failure to include an explicit statement in the final rule would leave open the question of whether these features are considered “waters of the U.S.” Such a situation could lead to regulatory disincentives to produce recycled water in California and other western states, compounding a water scarcity situation that is already dire. Pending and adopted federal and state legislation to address the impacts of our historic drought contain a number of approaches to encourage recycled water projects. Transforming components of the recycled water process (including integral systems such as storage ponds) into jurisdictional waters would completely undercut efforts to address the drought and have resoundingly negative water supply ramifications across the state. We concur with the comments of Representative Grace Napolitano (D-CA) delivered to the House Committee on Transportation and Infrastructure Committee at the hearing held on June 11, 2014, as she questioned why in light of the severe drought in California, USEPA would not expressly include recycled water within the scope of the waste treatment exception. Given the drought and dire need to develop recycled water facilities in the arid west, clarification that excludes recycled water facilities from additional federal regulation is absolutely vital. Spreading Grounds and Related Features of the Wastewater Treatment Process Should Be Expressly Exempted Under the Final Rule As the proposed rule and existing practice acknowledge, waste treatment systems designed to meet the requirements of the Clean Water Act are not waters of the U.S., and CASA wants to ensure that as part of these proposed amendments spreading grounds/basins, treatment ponds/lagoons, and constructed treatment wetlands used as part of the wastewater process are subject to the same exemption. Since these facilities are clearly part of the treatment process, providing additional treatment, residence and settling prior to discharge, these facilities should be expressly recognized in the rule as falling under the Waste Treatment Exception. In addition, many CASA member agencies utilize spreading grounds or basins in order to facilitate groundwater replenishment; a vital part of water management throughout California. Others utilize artificially created effluent storage ponds as part of their treatment process. Many agencies maintain reservoirs or storage basins/ponds to store recycled water. These artificially created features and spreading grounds have not previously been defined or regulated as “waters of the United States,” and should remain separate. For this reason, the proposed rule should expressly include treatment ponds/lagoons, spreading grounds/basins, and constructed treatment wetlands within the scope of the Waste Treatment Exception, along with effluent storage reservoirs and recycled water storage facilities discussed previously. The Proposed Amendments to What is Considered an “Adjacent Water” Must be Reexamined to Consider Wastewater Treatment Processes Many wastewater treatment processes, including man-made spreading basins, are located near or even “adjacent” to rivers and tributaries that have been (or under the proposed rule, would be) designated as waters of the U.S. and may be located in the riparian or floodplain areas Ensuring Clean Water for California 47 of 201 3 CASA Comments on Proposed Waters of the U.S. Rule Administrator McCarthy November 5, 2014 of these rivers. Because the proposed rule defines “adjacency” and includes the incorporation of waters within the flood plain or riparian area of a designated water of the U.S. as also being a jurisdictional water (see section 328.3(c)(2)-(4), FR 22263), this could lead to an interpretation that such spreading basins and artificial storage ponds are jurisdictional. Specifically, the proposed rule would revise the current category of an “adjacent wetland” to include all “adjacent waters.” (FR 22206) As a result, numerous treatment ponds, recycled water reservoirs, and spreading grounds/basins across California could become jurisdictional, creating a significant problem and interference with existing wastewater treatment processes. For example, under the proposed rule, the Montebello Forebay spreading grounds in Southern California would appear to become jurisdictional. Under existing rules, regulations and case law, a waterbody is considered a water of the U.S. if it is a wetland adjacent to a water of the U.S. In contrast, under the proposed rule, all waterbodies (of many types) adjacent to a water of the U.S. could be considered themselves waters of the U.S., regardless of whether any sort of nexus or hydraulic connection has been shown and without any consideration of whether a berm or levee separates them. Under the proposed rule, a significant nexus appears to be assumed, as it states “…even in cases where a hydrologic connection may not exist, there are other important considerations…that result in a significant nexus between the adjacent wetlands or waters and the nearby “waters of the United States” and (a)(1) through (a)(3) waters.” (79 FR 22244) As one seeming justification for this expanded interpretation, the proposed rule states that “many major species that prefer habitats at the interface of wetland and stream ecosystems remain able to utilize both habitats despite the presence of such a berm.” (Id. at 22245) This use of species preference and behavior to justify incorporation of a water with no proven hydrologic connection as a water of the U.S. closely resembles the previously invalidated migratory bird rule. As such, terrestrial species preference is not an acceptable basis for the assertion of jurisdiction. If these “adjacent” wastewater and recycled water facilities, including spreading grounds, are defined to be within the jurisdiction of the CWA, it would adversely impact CASA’s member agencies’ ability to augment groundwater supplies and to effectively provide wastewater treatment services. The plethora of additional and unnecessary requirements, regulations, and permitting associated with making these areas into jurisdictional waters, including but not limited to the procurement of an NPDES permit, assigning designated uses, exposure to penalties and potential third party liability for effluent violations, and impairment of the ability to operate and maintain these areas, would erect new mandates with no benefit to the surrounding ecosystems and waterbodies. Such a result represents an extreme disincentive to sustainable water supply development and a significant impairment of wastewater agencies’ ability to protect public health and safety through innovative and effective wastewater treatment. Within the proposed rule, there are two specific exemptions that could potentially address this issue. Pursuant to section 328.3(b)(5)(i) and 122.2(b)(5)(i)2, a spreading ground could fall under the definition of “[a]rtificially irrigated areas that would revert to upland should application of irrigation water to that area cease” (79 FR 22263 and 22268) Spreading grounds 2 All references are to Part 328 and Part 122, however the language suggestions contained herein similarly apply to other regulatory sections that have the potential to impact wastewater entities, including Part 230 (79 FR 2226822269), Part 232 (79 FR 22269-22270), and Part 401 (79 FR 22273-22274). Ensuring Clean Water for California 48 of 201 4 CASA Comments on Proposed Waters of the U.S. Rule Administrator McCarthy November 5, 2014 utilized by wastewater treatment facilities are generally artificially created and might not otherwise exist aside from the application of wastewater effluent to the area. However, without being explicitly stated, it is not clear enough that this definition would apply to upland wastewater spreading grounds. Similarly, pursuant to section 328.3(b)(5)(ii) and 122.2(b(5)(ii), wastewater and recycled water ponds and spreading grounds could fall under an expanded definition of “[a]rtificial lakes or ponds created by excavating and/or diking dry land and used exclusively for such purposes as stock water, irrigation, settling basins, or rice growing.” (79 FR 22263 and 22268) The word “such” seems to indicate that these are merely examples, not an exhaustive list, and thus spreading grounds utilized in conjunction with and/or as part of the overall wastewater treatment process could fall under this exclusion. However, without specific references within these provisions to treatment ponds and spreading grounds, CASA and its members are very concerned that these facilities could become jurisdictional and create significant problems for agencies attempting to protect public health and the environment. This, we would request the explicit inclusion of the terms such as “spreading grounds” and “wastewater and recycled water storage,” within this section. “Tributary” is Defined Too Broadly and Will Likely be Construed to Include Certain Conveyances and Ditches For the first time, the proposed rule seeks to define what constitutes a “tributary” under the Clean Water Act. The proposed rule drastically expands the number of waters potentially subject to federal jurisdiction. Specifically, the proposed rule defines ‘‘tributary’’ as a water “physically characterized by the presence of a bed and banks and ordinary high water mark…which contributes flow, either directly or through another water…” to a water of the U.S. (79 FR 22201-22202) Even wetlands, lakes, and ponds without an ordinary high water mark (OHWM) or bed and banks would be considered tributaries if they contribute flow, either directly or through another water to a water of the U.S. (Id. at 22201-22202) Perhaps most significantly, under the proposed rule, a tributary, including wetlands, can be a natural, manaltered, or man-made water and includes waters such as rivers, streams, lakes, ponds, impoundments, canals, and ditches not otherwise explicitly excluded. (Id. at 22202) This overly broad definition of tributary could potentially increase the number of manmade conveyances, ditches and conveyance facilities, including those utilized by wastewater entities, under federal jurisdiction, and the lack of certainty surrounding the rule’s definition of a tributary could lead to regulation of previously unregulated waters. This broad classification of “tributaries” would be considered jurisdictional regardless of perennial, intermittent or ephemeral flow. Even dry washes could be considered jurisdictional under the proposed rule. This is significant for a variety of reasons. One example of the potential impacts of defining what constitutes a “tributary” too broadly is the potential discharge from sanitary sewer systems to dry creeks/sloughs/washes when no pollutants ever actually reach water. It is entirely unclear whether this constitutes a discharge of pollutants to a water of the U.S. Under the broad definition of tributary in the proposed rule, it is possible that spills to dry creeks, sloughs, or washes would be considered a “discharge” even if there is absolutely no real or potential impacts to surface waters of any kind. Similarly, there are circumstances where sewer spills occur in a street that drains to a roadside Ensuring Clean Water for California 49 of 201 5 CASA Comments on Proposed Waters of the U.S. Rule Administrator McCarthy November 5, 2014 ditch or local creek bed that has no flow and is unconnected to a water of the U.S. The responsible party may fully remediate the spill and address all real and potential water quality impacts before the spill ever reaches a water source. It is difficult to understand how can this kind of circumstance could be envisioned as a discharge to “waters of the United States” when there is no actual water in a dry creek or ditch nor an adverse impact to the environment. CASA appreciates your consideration of our comments. If you have questions or wish to discuss our perspective further, please contact Adam D. Link, CASA’s Director of Government Affairs at (916) 446-0388 or Eric Sapirstein, CASA’s federal representative, at (202) 466-3755. Thank you for your consideration of our comments. Sincerely, Adam D. Link CASA Director of Government Affairs Ensuring Clean Water for California 50 of 201 6 FOCUS QUESTIONS FOR STRATEGIC PLAN • What is the biggest challenge facing the CA wastewater/clean water community? • What is the most promising opportunity facing the CA wastewater/clean water community? • Which of these challenges/opportunities are best suited to action by the summit partners in particular (as opposed to another entity or one of the individual partners)? • What does success look like? What obstacles do we have to overcome? 51 of 201 52 of 201 Sherry Hull From: Sent: To: Subject: Sherry Hull Wednesday, November 19, 2014 3:50 PM Sherry Hull FW: SFB Nutrient Technical Workgroup - Work Products...Conceptual Model report, and Stormwater Monitoring Data From: David Senn [mailto:[email protected]] Sent: Tuesday, October 21, 2014 2:16 PM To: David Senn; Emily Novick Subject: SFB Nutrient Technical Workgroup - Work Products...Conceptual Model report, and Stormwater Monitoring Data Dear NTW participants Two new work products are available for review, at the links below. Please provide comments within 4 weeks (Nov 18), or if you need longer please let us know that comments are coming. 1. Conceptual Model report: This is the draft-Final version, that incorporates comments and some new information since the April 2013 draft. It's a long document, but the Summary recommends the sections to read for an abridged version. http://sfbaynutrients.sfei.org/sites/default/files/SFBNutrientConceptualModel_Draft_Final_Oct2014.pdf 2. Stormwater nutrient monitoring report: A purposefully short summary of data collected at multiple sites during WY2012 and WY2013, piggybacking on the RMP and BASMAA funded sampling efforts, with additional analytes funded by RMP. http://sfbaynutrients.sfei.org/sites/default/files/Stormwater_data_analysis_draft_Sep2014.v3_clean.pdf **Please send comments to both me and Emily ([email protected]) - Dave p.s. If you don't want to receive future NTW messages, please send us a message and we will remove your name from the list. ooo David Senn, PhD Senior Scientist San Francisco Estuary Institute 4911 Central Avenue Richmond, CA 94804 mobile: (510) 999-1105 office: (510) 746-7366 [email protected] 1 53 of 201 BACWA CHAIR / EXECUTIVE DIRECTOR AUTHORIZATION REQUEST FILE NO.: DATE: 13,414 October 17, 2014 TITLE: O’RORKE, INC. for “NO DRUGS DOWN THE DRAIN” CAMPAIGN SUPPORT RECOMMENDED ACTION Executive Director authorization for an agreement with O’Rorke, Inc. in an amount not to exceed $4,952 to develop, manage and implement an online Facebook campaign focused on the message “No Drugs Down the Drain” in collaboration with the “Don’t Rush to Flush, Meds in the Bin, We All Win” messaging of the California Product Stewardship Council’s (CPSC) project. This will also include a press release on the DEA new regulations. SUMMARY This is part of the planned coordination between BAPPG's “No Drugs Down the Drain” campaign promoting safe medication disposal which will be coordinated with CPSC’s “Don’t Rush To Flush” (DRTF) project and vice versa. The campaign will drive traffic to the Baywise.org website. The Baywise site will be updated to include information about the DRTF project so it links and can drive traffic there. The DRTF web site will be updated to drive traffic back to Baywise.org as well so each site is linked to the other with coordinating information. This contract will provide a regional online campaign encouraging the public to properly dispose of pharmaceuticals. The campaign will include updated banner ads through Facebook on accounts operating throughout the San Francisco Bay Area. If a Facebook user clicks on the banner ad, they will be directed to a page on www.Baywise.org, a website sponsored by both BACWA and BASMAA. Links on that site will be included to also drive traffic towww.dontrushtoflush.org/ that contains additional information about how to properly dispose of pharmaceuticals. The bulk of the cost of this contract ($3,500) will be used for running the banner ads. Facebook operates on a per-click basis, meaning a fee is paid only when users click on the banner ad. The balance ($1,452) will cover O’Rorke’s costs for updating the campaign message. This work will be carried out under the supervision of Paul Prange from the City of San José. FISCAL IMPACT This campaign was specifically budgeted in the BACWA-approved 2014/2015 BAPPG Budget, under the line item “No Drugs Down the Drain.” ALTERNATIVES BACWA could elect not to move forward on this project, but it is not recommended. No other alternatives were considered as the BACWA contracting policies authorize a sole source selection process for contracts under $50,000. Attachments: 1. Scope of Work 2. Purchase Order Approved By: Date: October 24, 2014 __________________________________________________________ 54 of 201 55 of 201 O’RORKE, INC. 55 HAWTHORNE STREET, #550 SAN FRANCISCO, CA 94105 NoDrugsDowntheDrain Fall2014 Facebookadsplacementofcost‐per‐click campaign O’Rorkeservices:developandplaceFB ads,writepressrelease,distributetomedia contactsandconductfollow‐uptosecure coverage.MonitorandreportonFBad performance 56 of 201 $3,500 $1,452 CHAIR AUTHORIZATION REQUEST FILE NO.: DATE: TITLE: 13,410 October 21, 2014 Chair Authorization for Agreement with Univision for BAPPG FOG Outreach, Hispanic Radio Public Service Announcements RECOMMENDED ACTION BACWA Chair authorization for an agreement with Univision, in an amount not to exceed $8,000, to air radio ads, online streaming ads, and public service announcements about proper fats, oils, and grease (FOG) disposal during the period of October 31, 2014 – January 1, 2015. SUMMARY This BAPPG project will air 120 paid radio and audio streaming ads, and 60 free public service announcements (PSAs) in Spanish informing Bay Area residents about proper FOG disposal through January 1, 2015. The stations may be able to air additional PSAs as the broadcast schedule permits. This project is in the BAPPG fiscal year 2014-2015 workplan and budget approved by the BACWA Executive Board. This project will be managed by Paul Prange of the City of San José. FISCAL IMPACT This project is included in the approved Fiscal Year 2014-2015 BAPPG budget and workplan, and sufficient funds are available for this work. ALTERNATIVES This action does not require consideration of alternatives. Attachments: 1. Univision BAPPG FOG 2014-15, XXXX Scope of Work 57 of 201 58 of 201 2014 BAPPG SPANISH LANGUAGE OUTREACH CAMPAIGN PRESENTED TO: Paul Prange Watershed Pollution Prevention JOSE JOSE SERRANO 408 599-4644 [email protected] 59 of 201 60 of 201 61 of 201 Audio Streaming Stream BAPPG radio spots online Increase BAPPG awareness audio streaming spots on Univision Radio stations online. Spots will have the flexibility to run by: •Specific station or multiple stations •Days •Times Campaigns will be in sync with a 300x250 ad banner that will link to client’s website. Banner provided by client 62 of 201 4 BAPPG 2014 SUMMARY UNIVISION ON LINE AUDIO STREAMING •TOTAL of Fifty Five (55) :60sec spots UNIVISION ON AIR SPOTS •Twenty Seven (27) :30sec spots •Thirty Eight (38) :60sec spots UNIVISION PSA’s SPOTS •Sixty (60) :15sec spots Total of 180 spots Total Net Investment $8,000 63 of 201 KSOL 98.9 FM Estereo Sol 98.9 - 99.1 FM’s two powerful signals, situated atop Mt. Sutro (the tallest point in San Francisco) and Loma Prieta (the tallest point in Santa Clara), delivers total ninecounty San Francisco metro coverage – from Napa and Sonoma in the north to Santa Clara in the south to Contra Costa and Alameda in the east. Estereo Sol’s strong signals also carry outside the Bay Area into the neighboring markets of Monterey/Salinas and Sacramento. KSQL 99.1 FM 64 of 201 With one of the Bay Area’s most powerful signals, Recuerdo 100.3-FM delivers crystal-clear signal coverage in the heaviest, Hispanic populated counties within the San Francisco Bay Area. KBRG 100.3 FM 65 of 201 SurveyMonkey - Survey Results 1 of 5 http://www.surveymonkey.com/MySurvey_Responses.aspx?sm=1elP_... Upgrade Home My Surveys Survey Services [email protected] Sign Out Help Plans & Pricing You have a BASIC account | To remove the limits of a BASIC account and get unlimited questions, upgrade now! BACWA Annual Members Meeting 2013 Design Survey Collect Responses Analyze Results View Summary Browse Responses Filter Responses Crosstab Responses Download Responses Share Responses + Add Report Total Started Survey: 21 Total Finished Survey: 21 (100%) Response Summary PAGE: BACWA ANNUAL MEMBERS MEETING 2013 1. What are your reasons for attending the annual meeting? Create Chart Download Response Response Percent Count Learn about BACWA activities 66.7% 14 Learn about regulatory developments 95.2% 20 Network with agency staff 52.4% 11 0.0% 0 answered question 21 skipped question 0 Create Chart Download Other: 2. How satisfied were you with the presentations? Response Response Percent Count Very Satisfied 57.1% 12 Somewhat Satisfied 28.6% 6 Satisfied 9.5% 2 Dissatisfied 4.8% 1 Comment/Suggestions for Future Presentation Topics Show Responses 66 of 201 3 answered question 21 skipped question 0 2/22/2013 11:55 AM SurveyMonkey - Survey Results 2 of 5 http://www.surveymonkey.com/MySurvey_Responses.aspx?sm=1elP_... 3. What topics did you find MOST useful and/or interesting? Create Chart Download Response Response Percent Count Year in Review (Jim Kelly) 30.0% 6 Mercury/PCB Watershed Permit Renewal (Lorien Fono/Jim Ervin) 15.0% 3 TST & WET Policy (Jim Ervin) 40.0% 8 SWRCB WDR from Collection Systems (Monica Oakley) 40.0% 8 State Water Board Priorities (Frances SpivyWeber) 35.0% 7 SF Bay Water Board Priorities (Bruce Wolfe) 65.0% 13 Baykeeper Priorities (Deb Self) 35.0% 7 Nutrients - US EPA Perspective on SF Bay (Terry Flemming) 60.0% 12 Nutrients - SF Bay Water Regional Water Board Perspective (Naomi Feger) 40.0% 8 Nutrients 101: Framing for Boards and Councils (Amanda Roa) 40.0% 8 Bay Area Nutrient Strategy (David Senn) 50.0% 10 Nutrients - Considerations of Alternative Regulatory Framework (Tom Grovhoug) 40.0% 8 Nutrient Removal Technologies (Don Gray) 45.0% 9 Wrap Up (Laura Pagano/Dave Williams) 10.0% 2 5.0% 1 answered question 20 skipped question 1 Create Chart Download Other/Comment: Show Responses 4. What topics did you find LEAST useful and/or interesting? Year in Review (Jim Kelly) Mercury/PCB Watershed Permit Renewal (Lorien Fono/Jim Ervin) 67 of 201 Response Response Percent Count 7.7% 1 23.1% 3 answered question 13 skipped question 8 2/22/2013 11:55 AM SurveyMonkey - Survey Results 3 of 5 http://www.surveymonkey.com/MySurvey_Responses.aspx?sm=1elP_... 4. What topics did you find LEAST useful and/or interesting? Create Chart Download 7.7% 1 SWRCB WDR from Collection Systems (Monica Oakley) 23.1% 3 State Water Board Priorities (Frances SpivyWeber) 23.1% 3 SF Bay Water Board Priorities (Bruce Wolfe) 0.0% 0 30.8% 4 Nutrients - US EPA Perspective on SF Bay (Terry Flemming) 0.0% 0 Nutrients - SF Bay Water Regional Water Board Perspective (Naomi Feger) 7.7% 1 30.8% 4 Bay Area Nutrient Strategy (David Senn) 0.0% 0 Nutrients - Considerations of Alternative Regulatory Framework (Tom Grovhoug) 7.7% 1 Nutrient Removal Technologies (Don Gray) 0.0% 0 15.4% 2 15.4% 2 answered question 13 skipped question 8 Create Chart Download TST & WET Policy (Jim Ervin) Baykeeper Priorities (Deb Self) Nutrients 101: Framing for Boards and Councils (Amanda Roa) Wrap Up (Laura Pagano/Dave Williams) Other/Comment: Show Responses 5. Did you find the overall length of the meeting to be appropriate? If not, please explain. Response Response Percent Count Yes 57.1% 12 No (please include comment) 42.9% 9 Comment Show Responses 6. Would you recommend that we continue to have the meeting at this venue? (California Endowment Conference Facility) If not, please explain. answered question 21 skipped question 0 Create Chart Download Response 68 of 201 11 Response 2/22/2013 11:55 AM SurveyMonkey - Survey Results 4 of 5 http://www.surveymonkey.com/MySurvey_Responses.aspx?sm=1elP_... 6. Would you recommend that we continue to have the meeting at this venue? (California Endowment Conference Facility) If not, please explain. Create Chart Percent Download Count Yes 89.5% 17 No (please include comment) 10.5% 2 Comment 3 Show Responses 7. What are the most important benefits that you receive from BACWA membership? Regulatory updates and advocacy answered question 19 skipped question 2 Create Chart Download Response Response Percent Count 100.0% 20 Training opportunities 45.0% 9 Information sharing with other agencies 85.0% 17 0.0% 0 answered question 20 skipped question 1 Create Chart Download Other (please specify) 8. What BACWA events did you attend in 2012? Response Response Percent Count Committee meetings 66.7% 12 Workshops 27.8% 5 Workgroups 11.1% 2 Executive Board meetings 11.1% 2 2012 Annual meeting 83.3% 15 0.0% 0 answered question 18 skipped question 3 Other: (please specify) 69 of 201 2/22/2013 11:55 AM SurveyMonkey - Survey Results 5 of 5 http://www.surveymonkey.com/MySurvey_Responses.aspx?sm=1elP_... 9. What could BACWA do to better serve your agency? Download Response Count Show Responses 3 answered question 3 skipped question 18 10. Any other suggestions for improving the meeting? Download Response Count Show Responses 5 answered question 5 skipped question 16 Follow Us: Facebook • Twitter • LinkedIn • Our Blog • Google+ • YouTube Help: FAQs & Tutorials • Contact Support About Us: Management Team • Board of Directors • Partners • Newsroom • Contact Us • We're Hiring • Sitemap Policies: Terms of Use • Privacy Policy • Anti-Spam Policy • Security Statement • Email Opt-Out Dansk • Deutsch • English • Español • Français • 한국어 • Italiano • Nederlands • 日本語 • Norsk • Português • Русский • Suomi • Svenska • 中文(繁體) Copyright © 1999-2013 SurveyMonkey 70 of 201 2/22/2013 11:55 AM Comments Regarding presentations and meeting format/length (Q’s 2 – 5): Presentations seemed rushed due to time constraints. The previous year's meeting was much better. Less presentations and more in depth was better than numerous presentations with little time for explanations. I missed hearing from each of the committee chairs, and the annual member meeting seems an appropriate place to hear what all the other committees are doing. The committee chairs are in a position to do a better job highlighting their committees activities and accomplishments, and future plans then is the executive director. The speakers seemed rushed and pressured to stay in time limit. There were few question and comments from the audience, this might have been a result of the whole room feeling the need to "speed things up and not delay." In past annual meetings the dialog between the audience and the speakers has been most informative – especially between the regulator and the regulated - and I missed that dimension. Monica had a very good presentation - easy to understand and informative. I would have like to hear more from David Senn and more about EPA priorities beyond nutrients All (presentations were) helpful Don Gray's presentation was very informative. I consider myself a layman in the field and while I admit that I did not understand every point, I did take away that there are several options for nutrient removal and that Don is well-versed in the area. Those two take-aways alone are valuable. However, the value of Don's presentation may have been reduced by its placement in the agenda. Ending the agenda with such a highly technical discussion, (after much brain power was already expended during the earlier potions of the meeting) may have diminished the strength of Don's message. Simply put, Don had a great message and I think that message would have been better absorbed had it been placed earlier in the agenda, when audience brain power would have been relatively higher. Given the number of presenters, meeting would benefit from extended time frame--the presentations seemed rushed...or keep meeting length the same with fewer presenters. Too little time I thought we should have had a couple of breaks thoughout the meeting to break it up a bit. ie bathroom breaks. I missed parts of important talks due to restroom runs. I understand that the agenda was intiially planned to be X hours long, and had to be compressed to fit a smaller window, which must have made planning quite difficult. In a perfect world, I would have appreciated a break or two, and I think it would have rejuvenated the room's ability to focus on the discussion topics. However, given the hand you were dealt, I thought BACWA played it quite well! Could have used a few breaks for networking, etc. 71 of 201 too short The presentations felt rushed at times. No, not (enough time) for the agenda you had. If felt like you had planned six hours of content - and then decided to avoid the cost of lunch and shoved all the speakers into four hours, and took the morning break away too. If you can only afford a half day meeting, plan an agenda that fits comfortably in a half day. An alternative is to go back to the 6 hour meeting and charge people for lunch, or give them an hour to get something on their own. No opporunity for breaks/networking with colleagues But a break is needed as 3.5 hours of straight sitting is difficult I would have preferred a slightly later start time and a longer meeting with more breaks and chances for networking. Regarding meeting location (Q #6): Yes I liked it being in downtown Oakland by a BART station. The seating arrangements could be improved. It was very cramped. Prefer the room set-up to be in theater style, everyone facing the front of the room at a narrow table, like it was at the Boy Scout building. If you don't have the narrow table, then just rows of chairs. Fits more people in in the center of the room, closer to the speakers. Terrible location, especially in terms of traffic and parking.BART makes it more convenient, but either way, it is an additional cost to agencies. Also felt like we were crammed into the room. Latecomers seated at the sides could not see the PowerPoints. Too small -felt very crowded. Regarding what BACWA can do to provide additional support for your agency (Q #9): Nothing, you do a great job Keep up the good work! Provide more information on issues and on-going activities (e.g., opportunities to provide input on comment letters) via more postings on the BACWA website and/or emails to members. 72 of 201 Regarding suggestions for improving the meeting (Q #10): Give the speakers enough time to talk. I am happy that Ms. Spivy-Weber was able to attend the meeting. As a SWB rep, her presentation carried great potential to be informative for all agencies in attendance. Unfortunately, I would rate her time as a lost opportunity. Though her section was entitled SWB Priorities, I have difficulty recalling any useful points or priorities from her presentation. I think a Powerpoint Presentation would have been useful for Ms. Spivy-Weber. Frankly, as a SWB rep, her words carry weight at meetings like this. Therefore, it is of primary importance that her message is delivered clearly. A Powerpoint would have helped in two key ways: 1) it would have kept her talk on-point and on-message and 2) her points and priorities could then be uploaded to the BACWA site for later reference and examination, as with the other presentations. I love that BACWA posts the presentations after the meetings! Especially when there are meetings where a lot of information is broadcasted, posting the Powerpoints after the meeting is tremendously helpful and allows for thorough examination and maximum absorption of information. Ms. Spivy-Weber’s presentation was arguably the most important presentation on the agenda, and it’s a shame that no one can refer back to her presentation or glean SWB’s priorities. Further, a Powerpoint could have helped Ms. Spivy-Weber stay within time. I saw that she consumed an outsized portion of the timeslot, forcing Deb Self to shorten her discussion at the end. At meetings like this one where time is at a premium, a Powerpoint could have kept Ms. Spivy-Weber within the planned timeframe. I am happy that the vast majority of the presenters recognized the value of Powerpoint. Please strongly suggest Powerpoint to future presenters. Even with mediocre Powerpoints, at least there is something attendees can point and refer to. Especially for presentations like Ms. SpivyWebster’s, I’d rather have something rather than nothing. Again, please strongly suggest Powerpoints to all future presenters – they are a great tool for both the speaker and the audience! build in a 15 minute break into the meeting. It is good for the body to get up and move every few hours. breaks, lunch more of David Senn on the science -- he was rushed Have a scheduled break so people can network. 73 of 201 BACWA Annual Members Meeting 2014 SurveyMonkey Q1 What are your reasons for attending the annual meeting? Answered: 46 Skipped: 0 Learn about BACWA... Learn about regulatory... Network with agency staff Other: 0% 10% 20% 30% 40% Answer Choices 50% 60% 70% 80% 90% 100% Responses Learn about BACWA activities 58.70% 27 Learn about regulatory developments 80.43% 37 Network with agency staff 67.39% 31 Other: 8.70% 4 Total Respondents: 46 1 / 12 74 of 201 BACWA Annual Members Meeting 2014 SurveyMonkey Q2 How satisfied were you with the presentations? Answered: 45 Skipped: 1 Very Satisfied Somewhat Satisfied Satisfied Dissatisfied 0% 10% 20% 30% 40% Answer Choices 50% 60% 70% 80% 90% 100% Responses Very Satisfied 77.78% 35 Somewhat Satisfied 11.11% 5 Satisfied 11.11% 5 Dissatisfied 0.00% 0 Total 45 2 / 12 75 of 201 BACWA Annual Members Meeting 2014 SurveyMonkey Q3 What topics did you find MOST useful and/or interesting? Answered: 46 Skipped: 0 Introduction and Year in... US EPA Priorities... SF Bay Water Board... Nutrients Overview (Da... Nutrient Watershed... Nutrients Next Steps... Nutrients Technical... BACWA Business Meeting (Dav... SWRCB WDR from Collection... Bay Area Pollution... Biosolids Committee (M... Collection Systems... Permits and Pretreatment... AIR Regulatory Update (Sara... State Water Board Update... BACWA Collaboratio... Regulatory Updates (Lor... Water Recycling... Resource 3 / 12 76 of 201 BACWA Annual Members Meeting 2014 SurveyMonkey Recovery/Ene... Other/Comment: 0% 10% 20% 30% 40% Answer Choices 50% 60% 70% 80% 90% 100% Responses Introduction and Year in Review (Mike Connor) 21.74% 10 US EPA Priorities (David Smith) 80.43% 37 SF Bay Water Board Priorities (Bruce Wolfe) 73.91% 34 Nutrients Overview (David Williams) 58.70% 27 Nutrient Watershed Permit (Lila Tang) 54.35% 25 Nutrients - Next Steps (Naomi Feger) 39.13% 18 Nutrients - Technical Update (David Senn) 76.09% 35 BACWA Business Meeting (David Williams) 15.22% 7 SWRCB WDR from Collection Systems (Monica Oakley) 2.17% 1 Bay Area Pollution Prevention Group (Karri Ving) 28.26% 13 Biosolids Committee (Matt Krupp) 13.04% 6 Collection Systems Committee (Dan Stevenson) 17.39% 8 Permits and Pretreatment Committees (Tim Potter) 13.04% 6 AIR Regulatory Update (Sara Deslauriers, Jim Sandoval) 21.74% 10 State Water Board Update (Steven Moore) 47.83% 22 BACWA Collaboration / Regional Role (Laura Pagano) 19.57% 9 Regulatory Updates (Lorien Fono) 30.43% 14 Water Recycling (Linda Hu, Cheryl Munoz) 23.91% 11 Resource Recovery/Energy Conservation (Ben Horenstein, Gary Darling) 23.91% 11 Other/Comment: 4.35% 2 Total Respondents: 46 4 / 12 77 of 201 BACWA Annual Members Meeting 2014 SurveyMonkey Q4 What topics did you find LEAST useful and/or interesting? Answered: 33 Skipped: 13 Introduction and Year in... US EPA Priorities... SF Bay Water Board... Nutrients Overview (Da... Nutrient Watershed... Nutrients Next Steps... Nutrients Technical... BACWA Business Meeting (Dav... SWRCB WDR from Collection... Bay Area Pollution... Biosolids Committee (M... Collection Systems... Permits and Pretreatment... AIR Regulatory Update (Sara... State Water Board Update... BACWA Collaboratio... Regulatory Updates (Lor... Water Recycling... Resource 5 / 12 78 of 201 BACWA Annual Members Meeting 2014 SurveyMonkey Recovery/Ene... Other/Comment: 0% 10% 20% 30% 40% Answer Choices 50% 60% 70% 80% 90% 100% Responses Introduction and Year in Review (Mike Connor) 9.09% 3 US EPA Priorities (David Smith) 0.00% 0 SF Bay Water Board Priorities (Bruce Wolfe) 3.03% 1 Nutrients Overview (David Williams) 0.00% 0 Nutrient Watershed Permit (Lila Tang) 3.03% 1 Nutrients - Next Steps (Naomi Feger) 6.06% 2 Nutrients - Technical Update (David Senn) 9.09% 3 BACWA Business Meeting (David Williams) 21.21% 7 SWRCB WDR from Collection Systems (Monica Oakley) 6.06% 2 Bay Area Pollution Prevention Group (Karri Ving) 21.21% 7 Biosolids Committee (Matt Krupp) 24.24% 8 Collection Systems Committee (Dan Stevenson) 21.21% 7 Permits and Pretreatment Committees (Tim Potter) 18.18% 6 AIR Regulatory Update (Sara Deslauriers, Jim Sandoval) 36.36% 12 State Water Board Update (Steven Moore) 15.15% 5 BACWA Collaboration / Regional Role (Laura Pagano) 15.15% 5 Regulatory Updates (Lorien Fono) 9.09% 3 Water Recycling (Linda Hu, Cheryl Munoz) 6.06% 2 Resource Recovery/Energy Conservation (Ben Horenstein, Gary Darling) 15.15% 5 Other/Comment: 21.21% 7 Total Respondents: 33 6 / 12 79 of 201 BACWA Annual Members Meeting 2014 SurveyMonkey Q5 Did you find the overall length of the meeting to be appropriate? If not, please explain. Answered: 45 Skipped: 1 Yes No (please include... 0% 10% 20% 30% 40% Answer Choices 50% 60% 70% 80% 90% 100% Responses Yes 97.78% 44 No (please include comment) 2.22% 1 Total 45 7 / 12 80 of 201 BACWA Annual Members Meeting 2014 SurveyMonkey Q6 Would you recommend that we continue to have the meeting at this venue? (Boy Scouts Meeting Facility) If not, please explain. Answered: 45 Skipped: 1 Yes No (please include... 0% 10% 20% 30% 40% Answer Choices 50% 60% 70% 80% 90% 100% Responses Yes 95.56% 43 No (please include comment) 4.44% 2 Total 45 8 / 12 81 of 201 BACWA Annual Members Meeting 2014 SurveyMonkey Q7 What are the most important benefits that you receive from BACWA membership? Answered: 43 Skipped: 3 Regulatory updates and... Training opportunities Information sharing with... Other (please specify) 0% 10% 20% 30% 40% Answer Choices 50% 60% 70% 80% 90% 100% Responses Regulatory updates and advocacy 90.70% 39 Training opportunities 23.26% 10 Information sharing with other agencies 76.74% 33 Other (please specify) 4.65% 2 Total Respondents: 43 9 / 12 82 of 201 BACWA Annual Members Meeting 2014 SurveyMonkey Q8 What BACWA events did you attend in 2013? Answered: 44 Skipped: 2 Committee meetings Workshops Workgroups Executive Board meetings 2013 Annual meeting Other: (please specify) 0% 10% 20% 30% 40% Answer Choices 50% 60% 70% 80% 90% 100% Responses Committee meetings 72.73% 32 Workshops 61.36% 27 Workgroups 20.45% 9 Executive Board meetings 38.64% 17 2013 Annual meeting 75.00% 33 Other: (please specify) 2.27% 1 Total Respondents: 44 10 / 12 83 of 201 ANNUAL MEETING Draft Agenda 1. Welcome 2. EPA and SFRWQCB Priorities 3. Nutrient Overview 4. Optimization/Upgrade Activities 5. Nutrient Technical Update 6. Nutrient Governance Update 7. BACWA Business Meeting 8. Other Hot Topics a. b. c. d. e. Toxicity Plan Dental Amalgam Risk Reduction RMP CEC Monitoring 9. Select Committee Highlights 10. Wrap-Up and View of Next Year 11. Adjourn 84 of 201 FINANCIAL OPTIONS FOR INCORPORATING AIR AS A REGULAR BACWA COMMITTEE BY PHASING OUT AIR MEMBER CONTRIBUTIONS FY 15 City American Canyon CCCSD CCSF (City and County of San Francisco) DDSD (Delta Diablo Sanitation District) EBMUD FSSD (Fairfield Suisun Sewer District) Las Gallinas Valley Sanitary District City of Palo Alto CSJ (City of San Jose) San Mateo WWTP Silicon Valley Clean Water City of Sunnyvale Union Sanitary District West County Wastewater District City of Santa Rosa (not BACWA member) Total BACWA Projected Dues ADJUSTED fy 15 FY 16 OPTION 1 FY 17 FY 18 FY 16 OPTION 2 FY 17 FY 18 FY 19 FY 16 FY 17 OPTION 3 FY 18 FY 19 FY 20 $3,000 $6,000 $6,000 $6,000 $6,000 $6,000 $1,320 $6,000 $6,000 $6,000 $6,000 $6,000 $6,000 $4,800 $6,000 $0 $6,000 $6,000 $6,000 $6,000 $6,000 $1,320 $6,000 $6,000 $6,000 $6,000 $6,000 $6,000 $4,800 $6,000 $0 $4,000 $4,000 $4,000 $4,000 $4,000 $880 $4,000 $4,000 $4,000 $4,000 $4,000 $4,000 $3,200 $6,000 $0 $2,000 $2,000 $2,000 $2,000 $2,000 $440 $2,000 $2,000 $2,000 $2,000 $2,000 $2,000 $1,600 $6,000 $0 $0 $0 $0 $0 $0 $0 $0 $0 $0 $0 $0 $0 $0 $6,000 $0 $4,500 $4,500 $4,500 $4,500 $4,500 $990 $4,500 $4,500 $4,500 $4,500 $4,500 $4,500 $3,600 $6,000 $0 $3,000 $3,000 $3,000 $3,000 $3,000 $660 $3,000 $3,000 $3,000 $3,000 $3,000 $3,000 $2,400 $6,000 $0 $1,500 $1,500 $1,500 $1,500 $1,500 $330 $1,500 $1,500 $1,500 $1,500 $1,500 $1,500 $1,200 $6,000 $0 $0 $0 $0 $0 $0 $0 $0 $0 $0 $0 $0 $0 $0 $6,000 $0 $4,800 $4,800 $4,800 $4,800 $4,800 $1,056 $4,800 $4,800 $4,800 $4,800 $4,800 $4,800 $3,840 $6,000 $0 $3,600 $3,600 $3,600 $3,600 $3,600 $792 $3,600 $3,600 $3,600 $3,600 $3,600 $3,600 $2,880 $6,000 $0 $2,400 $2,400 $2,400 $2,400 $2,400 $528 $2,400 $2,400 $2,400 $2,400 $2,400 $2,400 $1,920 $6,000 $0 $1,200 $1,200 $1,200 $1,200 $1,200 $264 $1,200 $1,200 $1,200 $1,200 $1,200 $1,200 $960 $6,000 $0 $0 $0 $0 $0 $0 $0 $0 $0 $0 $0 $0 $0 $0 $6,000 $81,120 $78,120 $54,080 $30,040 $6,000 $60,090 $42,060 $24,030 $6,000 $63,696 $49,272 $34,848 $20,424 $6,000 $639,846 $652,643 $665,696 $679,010 $627,300 $639,846 $652,643 $665,696 $639,846 $652,643 $665,696 $679,010 $692,590 BACWA Incremental Dues Increase Over FY 15 Baseline $12,546 $25,343 $38,396 $12,546 $25,343 $38,396 $51,710 $12,546 $25,343 $38,396 $51,710 $65,290 Total Available Revenues to Offset AIR Committee Costs $66,626 $55,383 $44,396 $72,636 $67,403 $62,426 $57,710 $76,242 $74,615 $73,244 $72,134 $71,290 CH2M contract for as-needed support for AIR $77,064 85 of 201 86 of 201 87 of 201 88 of 201 89 of 201 BACWA Potential Nutrient Reduction by Treatment Optimization and Treatment Upgrades Scoping and Evaluation Plan – DRAFT November 3, 2014 90 of 201 Table of Content Scoping and Evaluation Plan ........................................................................................................ 1 Schedule ................................................................................................................................... 1 Nutrient Removal Objectives ..................................................................................................... 3 Data Collection and Preliminary Assessment ........................................................................... 5 Data Collection ...................................................................................................................... 5 Preliminary Assessment ........................................................................................................ 6 Site Visits ............................................................................................................................... 6 Nutrient Reduction through Plant Optimization ......................................................................... 7 Plant Optimization.................................................................................................................. 7 Sidestream Treatment ........................................................................................................... 9 Nutrient Reduction with Plant Upgrades ................................................................................. 11 Technology Plant Groupings ............................................................................................... 11 Determining Upgrade Requirements ................................................................................... 11 Facility Upgrades ................................................................................................................. 14 Impacts of Sea Level Rise ................................................................................................... 16 Nutrient Reduction by Other Means ........................................................................................ 18 Economic Impacts Approach ................................................................................................... 18 Approach ............................................................................................................................. 18 Unit Cost .............................................................................................................................. 19 Greenhouse Gas Emissions Accounting ................................................................................. 19 91 of 201 Scoping and Evaluation Plan The Regional Water Quality Control Board issued a Regional Watershed Permit (Order R22014-0014), dated April 9, 2014 that requires municipal dischargers to the San Francisco Bay to perform nutrient reduction studies. Thirty seven plants (see Appendix A) will conduct the nutrient reduction studies collectively as members of Bay Area Clean Water Agencies (BACWA). The Order (R2-2014-0014) sets forth a regional framework to facilitate collaboration on studies that will inform future management decisions and regulatory strategies. A component of this phase is to conduct treatment plant optimization and upgrade studies for nutrient removal. These studies will increase the understanding of external nutrient loads, improve the inputs used in load response models, support development of nutrient objectives, and identify load reduction opportunities and costs for different dischargers to the Bay. Order R2-2014-0014 requires a Scoping and Evaluation Plan that describes the approach and schedule for completing the nutrient reduction studies by plant optimization and plant upgrade, as well as by other means for nutrient removal studies. Nutrients of interest are ammonia, total nitrogen, and total phosphorus. The evaluation considers current flows for plant optimization/sidestream treatment but uses the permitted design capacity flows for plant upgrades. The effort comprises the following steps: • Establish a range of nutrient removal objectives • Collect data for each plant and do a preliminary assessment based on this data • Evaluate nutrient reductions achievable through plant optimization and sidestream treatment for each plant • Evaluate nutrient reductions through plant upgrades for each plant • Compile existing information to identify reducing nutrient loads by other means, such as water reclamation, wetlands, etc. The sections below describe the schedule and work necessary for completing the aforementioned steps. Schedule The two studies for optimization/sidestream treatment and for plant upgrades will be performed in parallel. The plants are required to submit a status report for each study on July 1st for years 2015, 2016, and 2017. The final reports are due for both studies the following year on July 1, 2018. An accelerated schedule is proposed that performs the two studies in parallel. An overview of the schedule along with descriptions for the tasks and completion dates is presented in Table 1. 92 of 201 Table 1. BACWA Schedule by Tasks Task 1.) Project Management and QA/QC 2.) Scoping and Evaluation Plans 3.) Data Collection, Data Synthesis, and Site Visits 4.) Plant Optimization and Sidestream Treatment 5.) Plant Upgrades 6.) Nutrient Reduction By Other Means 7.) Group Annual Report 8.) Report Submittal Description Scheduled meetings, status updates, and QA/QC Prepare documents for BACWA and RWQCB Disseminate questionnaire and compile data Evaluate optimization and sidestream treatment strategies at each plant Evaluate plant upgrades for each plant; identify plants that are vulnerable to sea level rise Compile previous reports to identify attractive strategies Assist BACWA with preparing the Annual Reports to RWQCB Submittal to RWQCB for the two studies 93 of 201 End Date 12/2017 Comment Manage the overall project and QA/QC 12/2014 Documents that define the project approach and schedule Collect plant data, compile data, and site visits to produce site specific solutions Discuss the beneficial and adverse ancillary impacts for each strategy; develop capital and operating costs (energy and chemicals) Discuss the beneficial and adverse ancillary impacts for each upgrade; develop capital and operating costs (energy and chemicals) Discuss the beneficial and adverse ancillary impacts for any strategies; discuss institutional barriers to water recycling along with proposals for overcoming such barriers 10/2015 10/2015 10/2015 10/2015 9/2018 6/2016 Nutrient Removal Objectives Three different average monthly nutrient removal objectives or levels were selected for this effort as listed in Table 1. The optimization effort is listed as Level 1 where there are no defined limits. Rather, the Level 1 nutrient loads are reduced as much as possible with little or no capital investment. The discharge limits for plant upgrades are listed as Levels 2 and 3. For both Levels 2 and 3, the ammonia limits assume full nitrification as ammonia is considered toxic. In contrast, total nitrogen and total phosphorus are not considered toxic and thus have more flexibility in discharge limits. As a result, two different levels were selected for such nutrients. The Level 2 and 3 limits were selected based the typical tipping point for treatment technologies to achieve such limits. For most plant configurations, the less stringent Level 2 can be achieved with conventional nutrient removal processes without adding an external carbon source (typically methanol) and without adding effluent filtration. The more stringent Level 3 requires an external carbon source for nitrogen removal and metal salt addition with filtration for most plant configurations. The results for both Treatment Levels are beneficial for making informed future management decisions. Appropriate NPDES discharge permit structures for total nitrogen and phosphorus should be based on long averaging periods linked to the specific waterbody response to nutrient enrichment. Unlike BOD, ammonia nitrogen, and some toxic pollutants that can have acute effects in the aquatic environment, nitrogen and phosphorus have seasonal impacts on receiving waters. Short-term limitations, such as maximum daily and maximum weekly averaging periods, is not required for nutrients. Short averaging periods for nutrient removal facilities will result in conservatively designed nutrient removal treatment technologies to provide the required reliability to meet the limits, but will provide little, or no, additional water quality benefit. As a result, we have proposed average monthly limits 1 as a conservative averaging period for total nitrogen and phosphorus discharges. In order to capture the seasonality impacts, both year round average monthly permit limits and dry season average monthly permit limits will be evaluated. A dry season average monthly permit is attractive as it excludes sizing treatment facilities for peak wet weather events and low temperatures. Biological kinetics is more rapid at warmer temperatures and thus results in a reduced footprint if sized for the dry season. During a significant precipitation event, plants are subjected to peak flows with subsequently less hydraulic residence time within the plant. Year round average monthly permit limits will capture the critical wet period. The dry season, assumed to range from May 1 to September 30, will have different temperature and loading conditions. For example, the effluent temperature from a plant in Northern California is presented in Figure 1. For this facility, the design low temperature for a year round average monthly limit is 15 degrees C, while the dry season low temperature is 21 degrees C. The design loads also will change. 1 WERF, 2010, Nutrient Management: Regulatory Approaches to Protect Water Quality, Volume 1 – Review of Existing Practices, HDR Engineering, Inc., Project No. NUTR1R06i. 94 of 201 Table 1. Average Monthly Nutrient Removal Objectives for Year round and Dry Season Averaging Periods* Treatment Level Study Ammonia Total Nitrogen Total Phosphorus Level 1 Optimization -- -- -- Level 2 Upgrades Full Nitrification 15 mg N/L 1.0 mg P/L Level 3 Upgrades Full Nitrification 6 mg N/L 0.3 mg P/L Comment Removal potential to be determined Without filters and external carbon ** Filters and external carbon source required *** * The seasonal impacts will be considered for all three treatment levels. ** Achievable by conventional nutrient removal processes without effluent filtration and without adding an external carbon source. Certain participating plant configurations and technologies will require chemicals. *** An external carbon source will not be required for certain plant configurations and technologies. 30 25 Degrees, C 20 15 10 5 0 10/2/07 1/1/08 4/2/08 7/2/08 10/2/08 1/1/09 4/3/09 7/3/09 Figure 1. Effluent Temperature Data from a Plant Data from each plant will be collected as flows and concentrations. The treatment level objectives are also based on concentration. However, the potential nutrient reductions will be presented as load reductions. Using loads is beneficial because they are independent of the impact on flows (e.g., water conservation) while also providing nutrient removal credit for plants that divert flows (e.g., recycled water). The base case for identifying load reductions is the 2013 load in the 13267 Letter data, which required the municipal dischargers listed in Appendix A to submit information on nutrients in wastewater discharges. 95 of 201 Data Collection and Preliminary Assessment A questionnaire and site visit will be used to collect plant data. The questionnaire requests plant specific information, such as historical plant flows and loads, performance, treatment assets, etc. Based on the information received from the questionnaire, the team will perform a preliminary assessment to identify potential optimization strategies and plant upgrades for each plant. Following the preliminary assessment, a site visit of each plant will occur to confirm the preliminary assessment and identify any new nutrient reduction strategies. A description on the questionnaire, preliminary assessment, and site visit is provided in the subsections below. Data Collection The questionnaire will be disseminated to each participating plant during the fall of 2014. This detailed request will create a high level understanding of how the plant operates. Plant performance data will be collected. A questionnaire reduces coordination between plants and our team, and it collects the essential information needed for producing plant-specific results. The questionnaire will request the following information: • • • • • • • • • • Plant process and service area description Site layout Major unit process dimensions and info on number of units in service Annual energy and chemical usage Future upgrade plans/expansion plans Identify site constraints (e.g., space constraints, poor soils require piles, off-limits spaces, odor constraints, etc.) Prior reports and memorandums on existing facilities/nutrient removal plans Prior reports for the “By Other Means” evaluation. For example, plans for recycled water, wetlands treatment, etc. Background on regulatory drivers Others The questionnaire will provide an electronic workbook for each plant to submit its historical data. The questionnaire responses will be broken out into two: data related to sidestream treatment and data related to the total plant performance. The first questionnaire (deadline Dec. 15, 2014) will include influent, effluent, and sidestream data (if available). Information gathered from the responses pursuant to the first deadline will be used for the on-going United States Environmental Protection Agency (USEPA) sponsored Sidestream Treatment Grant being led by East Bay Municipal Utility District (EBMUD). The second questionnaire (deadline Jan. 31, 2015) will include remaining information, including major unit process dimensions, site constraints, prior reports, historical plant data, etc. 96 of 201 Preliminary Assessment Upon receiving all the questionnaire responses, the data will be organized and compiled for each participating plant. Any data gaps will be documented per plant and disseminated to each plant via email with a request to perform additional sampling. The request will include: • • • • • Constituents of interest (example BOD, TKN, TP, alkalinity) Sampling location (example: primary effluent, secondary effluent) Sampling frequency (example: daily, weekly) Sample method (example: daily composite, hand composite, grab) Laboratory reporting limits The sampling campaigns will be short in duration by design (for instance, two weeks), just enough to provide general guidance. In situations where additional sampling is not practical within the time frame of the optimization effort, reasonable assumptions will be made for missing information. The initial step in handling the dataset is to remove any outliers or questionable data. Such data will be removed with its values noted. Following the data screening, the organized data will be used to perform a preliminary assessment on each plant. The approach is to plot performance trends and calculate loading rates for the major unit processes (e.g., primary clarifiers). The values for each plant will be compared against typical design criteria to identify any opportunities for optimization. For example, if a plant with activated sludge has historical data that suggests there is sufficient capacity to increase the solids residence time (SRT) and remove ammonia during the summer months, then this will be documented. The data questionnaire also will provide information from each utility on planned future optimization/upgrades at their plant. The preliminary assessment will address how these optimization/upgrade projects will impact discharge nutrient loads. For example, a plant that plans to import organic waste would most likely increase its nutrient discharge load. Site Visits The third component is to visit each participating plant. Two-person teams that include a process and operations expert will visit each participating plant. The site visits will confirm our understanding of how the plant operates, validate chemical use, and identify “no capital cost” and “low capital cost” strategies. For example, they may look for any unused tanks for additional treatment, or examine operational practices such as the dissolved oxygen set-point. An example list of information that will be generated during the site visit is as follows: • Validate and confirm facility mode of operation • Validate and confirm whether the plant is a candidate for sidestream treatment • Validate and confirm the historical performance trends, number of units in service, etc. 97 of 201 • Generate a list of optimization strategies and implications, such as: • Flow routing • Chemical dosing strategy • Pumping strategy • Aeration strategy • Non-economic impacts (e.g., biosolids yield) • Impacts on sustainability (e.g., energy demand and greenhouse gas (GHG) emissions) • Confirm the on-going optimization/upgrade projects and summarize their impacts on nutrient discharge loads Within 3 days of each site visit, a memo will be crafted for each POTW that summarizes the site visit. The memo will include the following: • • • • • • • • Description of the plant and the current discharge requirements Describe the impact on nutrient discharge loads from on-going optimization/upgrade projects Check-list confirming the preliminary assessment findings List the optimization strategies Quantify the nutrient removal benefits (probably a range) Impacts on chemicals, biosolids yield, energy, GHG emissions, etc. Facility upgrades requirements Summary and conclusions Nutrient Reduction through Plant Optimization This first study focuses on plant optimization and sidestream treatment. The effort will generate a list of optimization strategies and sidestream treatment and develop cost for the most attractive option. Details for these two elements are provided in the sub-sections below. Plant Optimization Optimization of existing facilities is the first step toward nutrient reduction. Nutrient removal is possible at existing facilities due to operating below design load and thus unused available “capacity” might be devoted for nutrient reduction on an interim basis. It takes advantage of unused tankage, new process approaches, instrumentation improvements, and, without a permit limit with potential enforcement penalties, gets as much nutrient reductions as possible. The plant optimization strategies are based on current flows and loads plus 15 percent to account for a modest growth in flows and loads. It is important to stress that implementing some of the strategies might impact overall treatment capacity. The plant might need revert back to the prior mode of operation or add new facilities as flows and loads increase. Our team will generate a list of the most common optimization strategies for each treatment category during the preliminary assessment effort. For example, a plant could implement chemically enhanced primary treatment (CEPT) as a means to remove total phosphorus and increase the aeration basin capacity for ammonia removal. This list will serve as the starting point during each site visit. The strategies will be simple, low cost improvements that can be 98 of 201 implemented quickly. The strategies will be grouped into “no capital cost” and “low capital cost” strategies with a sample of what these strategies might look like: • No Capital Cost Strategies: • • • • • • Use offline tankage to provide additional treatment Modify operational mode, such as raising the solids residence time Modify blower operating set points Operate in split treatment mode Change to simultaneous nitrification/denitrification operation Shut down aeration to create unaerated zones • Low Capital Cost Strategies • • • • • • Add instruments for nutrient removal in ammonia based aeration control mode Add chemicals for phosphorus removal Add chemicals to reduce load, unlock capacity Add anoxic and/or anaerobic zones for biological nutrient removal Add internal recycle for denitrification Add mixers for unaerated zones During the site visits, the optimization strategies from our preliminary assessment will be confirmed. Additionally, the two-person process and operations experts will walk the plant to identify additional optimization strategies. This two-person team will visit with operations staff to confirm the findings and ask for any additional input from operations. Because the strategies are intended to reduce nutrient loads where possible, the solutions will be aggressive as the plant can always revert back to the prior mode of operation. However, the recommended strategies will be intended to maintain stable operation. The optimization section under the memo produced for each site visit will include the following: • Listing of optimization strategies • Summary of adverse and ancillary impacts (e.g., greenhouse gas impacts) • Prepare capital and operations and maintenance (O&M) cost estimates per strategy (if pertinent). The O&M cost will discuss the impacts on energy, chemicals, and labor. • Estimate nutrient reduction and unit costs per optimization strategy (e.g., $/lb nutrient; lb GHG/lb nutrient) • Discuss seasonal nutrient reduction as some of the optimization strategies might only apply during the dry season and vice versa 99 of 201 Sidestream Treatment The sidestream refers to the return streams from biosolids processing. Despite their small flows (typically<5 percent of raw plant flow), the sidestream represents about 15 to 40 percent of the discharge nutrient load as shown in Figure 2. The benefits of removing nutrients in the sidestream are as follows: • • • • • • • Warm water (favorable kinetics; small footprint) Concentrated nutrients (favorable kinetics; small footprint) Low flows (ability to equalize) More cost-effective than complete liquid stream treatment conversion Less aeration and chemicals than liquid stream treatment (limited to nitrogen removal) Easy to phase construction than liquid stream treatment It is not a sunken cost if a plant does liquid stream treatment Nutrient Discharge Load Distribution 100% 80% 60% 40% 20% 0% Nitrogen Sidestream Contribution Phosphorus Main Stream Contribution Figure 2. Nutrient Discharge Load Contribution Despite all these benefits, not all plants are candidates for sidestream treatment. The approach for identifying candidate plants is separated by nutrient in the sub-sections below. AMMONIA REMOVAL AND RECOVERY The most commonly implemented sidestream treatment applications are for ammonia and total nitrogen removal. A graphic illustrating a decision tree to identify candidate plants for sidestream nitrogen removal is provided in Figure 3. The questionnaire will include the appropriate questions to identify candidate plants. For plants deemed non-candidates, the report will provide the basis for this decision. 100 of 201 There are dozens of technologies to consider. For candidate plants, the evaluation will consider either conventional nitrification or a deammonification technology, depending on their questionnaire response. PHOSPHORUS REMOVAL AND RECOVERY The sidestream treatment of phosphorus typically relies on either chemical precipitation using metal salts or phosphorus recovery via struvite precipitation. There are two commonly used phosphorus removal and recovery technologies for sidestream phosphorus reduction. For candidate plants, the evaluation will consider either conventional phosphorus removal by metal salts and settling, or phosphorus recovery (typically struvite precipitation technology) for plants using biological phosphorus removal. Anaerobic Digestion/ Dewatering? No • Liquid stream Nutrient Removal is more appropriate Yes Is the Dewatered Return Stream Temp >30°C No Yes • • • • • Deammonification at such low temps is emerging Nitritation at such low temps is emerging Ammonia Recovery Process (ARP) is emerging and temp independent Conv Nitrification is proven Conv Nit/Denit is proven (probably requires external C source) Heat Feed Water Measure Water Quality: • Temperature • Ammonia (500+ mg N/L) • Alkalinity (Is about half the Ammonia demand; 3.6*Ammonia Conc) Yes • • • • No • Conv Nit/Denit is proven • Ammonia Recovery Process (ARP) is emerging • If you add Alkalinity (to meet 50% ammonia demand) • Deammonification • Nitritation • If you add Alkalinity (to meet 100% ammonia demand) • Conv Nitrification is proven • Conv Nit/Denit is proven (probably requires external C source) Deammonification Nitritation Ammonia Recovery Process (ARP) is emerging If you add Alkalinity (to meet 100% ammonia demand) • Conv Nitrification is proven • Conv Nit/Denit is proven (probably requires external C source) Figure 3. Decision Tree to Identify Candidates for Sidestream Nitrogen Removal 101 of 201 SIDESTREAM TREATMENT DELIVERABLE The memo for each plant will identify candidates for sidestream treatment. For candidate plants, the facilities and unit cost for removing ammonia or nitrogen and phosphorus will be presented. For plants deemed non-candidates, the report will provide the basis for this decision. Nutrient Reduction with Plant Upgrades Each facility will be evaluated to determine capital improvements that would be necessary to provide nitrification and to meet the Level 2 and Level 3 nutrient removal objectives provided in Table 1. Situations where dischargers have already upgraded existing treatment systems or implemented pilot studies for nutrient removal will be identified and incorporated into the analysis. Established treatment technologies will be used to determine cost estimates (both capital and operating) and to determine site footprint requirements. However, innovative and/or emerging technologies will be identified for future consideration where they may be appropriate at individual facilities. As part of the evaluation, both beneficial and adverse ancillary impacts associated with plant upgrades will be identified for each facility and will be incorporated into the cost estimates, where appropriate. Technology Plant Groupings The first step in determining the plant upgrades that are necessary to meet the different nutrient removal levels is to classify each of the facilities. Table 2 provides a list of all of the 37 participating facilities and their respective classifications with respect to nutrient removal. Currently, none of these facilities have been designed for deliberate phosphorus removal and some have nitrification or partial nitrogen removal. Determining Upgrade Requirements For nutrient removal upgrades, the general approach will be to consider Level 3 nutrient removal as a potential endpoint for all facilities. The intent is to avoid situations where a Level 2 scenario requires the construction of facilities that would be stranded in a Level 3 scenario. In determining upgrade requirements, each facility will be evaluated based on existing infrastructure and space constraints. Existing infrastructure will be included in future upgrades as much as possible, especially if facilities are less than 10 years old. Space constraints will determine which technologies will be considered for implementation. For instance, a facility with limited footprint may consider membrane bioreactor and a facility with ample footprint could consider a 5-stage Bardenpho process for meeting Level 3 requirements. In cases of severely constrained sites, removal and replacement of existing facilities may be required. Several technologies will be considered that represent well established technologies for cost and footprint estimates. Table 3 lists the established technologies that will be considered for upgrades. 102 of 201 Table 2. Summary of Current Secondary Processes for BACWA Facilities Current Secondary Process Conventional Activated Sludge Discharger Central Contra Costa Sanitary District City of Burlingame Dublin San Ramon Services District City of Livermore City of Benicia City of Millbrae Oro Loma/Castro Valley Sanitary District City of Pinole City of Richmond Municipal Sewer District Rodeo Sanitary District City of San Mateo City and County of San Francisco (San Francisco International Airport) Cities of South San Francisco and San Bruno Activated Sludge with Seasonal Nitrification Biological Nutrient Removal (BNR) High Purity Oxygen Activated Sludge Nitrifying Activated Sludge Nitrifying MBR Facility Central Contra Costa Sanitary District Wastewater Treatment Plant Burlingame Wastewater Treatment Plant Dublin San Ramon Services District Wastewater Treatment Plant City of Livermore Reclamation Plant Wastewater Treatment Plant Water Pollution Control Plant Oro Loma/Castro Valley Sanitary Districts Water Pollution Control Plant Pinole-Hercules Water Pollution Plant West County Agency Combined Outfall Rodeo Sanitary District Water Pollution Control Facility City of San Mateo Wastewater Treatment Plant Mel Leong Treatment plant, Sanitary Plant South San Francisco and San Bruno Water Quality Control Plant Raymond A. Boege Alvarado Union Sanitary District Wastewater Treatment Plant Novato Sanitary District Novato Sanitation District Wastewater Treatment Plant San Jose/Santa Clara Water City of San Jose/Santa Clara Pollution Control Plant Ellis Creek Water Recycling City of Petaluma Facility East Bay Municipal Utility District, East Bay Municipal Utility District Special District No. 1 Wastewater Treatment Plant City and County of San Southeast Water Pollution Control Francisco (Southeast Plant) Plant Sonoma Valley County Sanitary Municipal Wastewater Treatment District Plant Wastewater Treatment and City of American Canyon Reclamation Facility 103 of 201 Pond System and partial nitrifying activated sludge Pond with nitrifying trickling filter Napa Sanitation District City of Sunnyvale Sausalito-Marin City Sanitary District Trickling Filter Trickling filter and nitrifying trickling filter Sewage Agency of Southern Marin U.S. Department of Navy (Treasure Island) Mt. View Sanitation District Las Gallinas Valley Sanitary District Central Marin Sanitation Agency Silicon Valley Clean Water Trickling Filter/Activated Sludge City of San Leandro West County Agency Vallejo Sanitation and Flood Control District Trickling Filter/Solids Contact Trickling filters with nitrifying activated sludge Delta Diablo City of Hayward Fairfield-Suisun Sewer District City of Palo Alto Soscol Water Recycling Facility Sunnyvale Water Pollution Control Plant Sausalito-Marin City Sanitary District Wastewater Treatment Plant Wastewater Treatment Plant Wastewater Treatment Plant Mt. View Sanitation District Wastewater Treatment Plant Las Gallinas Valley Sanitary District Sewage Treatment Plant Central Marin Sanitation Agency Wastewater Treatment Plant Silicon Valley Clean Water Wastewater Treatment Plant San Leandro Water Pollution Control Plant West County Wastewater District Treatment Plant Vallejo Sanitation and Flood Control District Wastewater Treatment Plant Wastewater Treatment Plant Hayward Water Pollution Control Facility Fairfield-Suisun Wastewater Treatment Plant Palo Alto Regional Water Quality Control Plant There are other technologies that could be considered at this time, but that may be less established in the wastewater sector. Using less established technologies for cost estimation and determining footprint introduces an added level of risk that is not appropriate for planning. However, situations where innovative or emerging technologies may be appropriate in the future will be identified, but will not be included in the cost estimate or site layout. For instance, BioMag® represents an innovative technology that could be implemented, but the number of installations is currently less than 10 in North America. 104 of 201 Table 3 Established Technologies for Ammonia, Nitrogen and Phosphorus Removal Level 2 Technologies Level 3 Technologies1 Nitrifying Technologies Nitrifying air activated sludge Level 2 meets Level 3 ammonia limits Integrated fixed film activated sludge (IFAS) Membrane bioreactor (MBR) Nitrifying trickling filter (NTF) Biological aerated filter (BAF) Oxidation ditch Nitrogen Removal Technologies Modified Ludzack-Ettinger (MLE) 4-stage Bardenpho2 2 Denitrification filter Denitrification filter2 2 Moving bed biofilm reactor (MBBR) MBBR2 Step feed activated sludge Oxidation ditch Oxidation ditch Phosphorus Removal Technologies Oxidation ditch Direct filtration3 2-stage Phoredox (P only) Sedimentation/filtration3 3-stage Phoredox Membrane filtration3 5-stage Bardenpho (both N and P) Chemical3 addition to primary clarifiers Chemical3 addition to aeration basin Tertiary chemical3 addition/solids removal Notes: 1. In addition to or expansion of Level 2 2. Carbon source may be required (e.g. methanol) 3. Metal salt or other chemical added Facility Upgrades The analysis will first determine plant upgrades that are necessary to meet the Level 3 requirements. For less stringent conditions, the unit processes will be removed to determine Level 2 and nitrification only scenarios. This approach avoids the situation where Level 2 upgrades would result in upgrades becoming obsolete at Level 3 limits. Figure 4 shows a progression of how technologies could be selected to meet nitrification requirements as well as Level 2 and Level 3 nitrogen removal requirements. This approach illustrates the progression of unit processes to meet Level 2 and later Level 3 requirements. For instance, Figure 4 shows that if a facility were upgraded to a membrane bioreactor (MBR) facility to meet Level 3 nitrogen limits, then a MBR process would also be used for Level 2 nitrogen removal and nitrification. 105 of 201 Figure 4. Existing Treatment Categories and the Nitrogen Removal Technologies Progression 106 of 201 Figure 5 shows a similar approach for phosphorus removal technologies. Certain facilities are well positioned to be upgraded to enhanced biological phosphorus removal (e.g. 5-stage Bardenpho or oxidation ditch) to meet Level 2 requirements. For all facilities, Level 3 phosphorus requirements would be met by chemical addition and filtration regardless of the technology implemented for Level 2 removal. Figure 4 and Figure 5 provide guidance for the overall selection process for plant upgrades. However, the actual selection process will be driven by several factors including existing infrastructure, space constraints and existing solids processing technologies. Therefore, plant upgrades will be tailored to each facility based on factors such as these. Once a representative technology that will comply with Level 3 nitrogen and phosphorus requirements has been selected for each facility, conceptual cost estimates will be prepared to determine capital and operating costs for the most attractive option. Operating costs will represent the change that would occur for an upgraded facility and will include O&M (includes energy, chemicals, and labor). For instance, upgrading from a conventional activated sludge process to a membrane bioreactor will increase electrical, chemical, and labor costs and only that increase will be quantified. Cost estimates will be presented so that unit processes are line items that can be removed to evaluate other scenarios. For instance, change from a Level 2 nitrogen removal scenario to a nitrification-only scenario by eliminating anoxic zones. Changes in GHG emissions from additional energy and chemical demands will be estimated. Expected changes in sludge production will be identified where appropriate. A qualitative estimate of changes in micro-constituent removal will be provided. Impacts of Sea Level Rise Participating agencies that are vulnerable to the impacts of sea level rise will be identified. The analysis will be based on publically available data from the United States Army Corps of Engineers, the Federal Emergency Management Agency, and publically available topography data. Participating agencies will provide key plant elevation data in the data collection template. The impacts of sea level rise with respect to potential for inundation will be determined for each of those identified agencies. Results will be presented in a map format, illustrating location of the participating plants and areas of inundation. The costs associated with sea level rise mitigation will not be determined. 107 of 201 Figure 5. Existing Treatment Categories and the Phosphorus Removal Technologies Progression 108 of 201 Nutrient Reduction by Other Means Strategies that reduce nutrients are not limited to inside the plant fence concepts; rather, a holistic view that also considers outside the plant fence strategies is essential. The optimization and plant upgrades sections focus on inside the plant fence concepts. This section attempts to serve as a first step in considering outside the plant fence concepts. A list of potential nutrient reduction by other means is listed below: • • • • • Nutrient Recovery: Typically focuses on the sidestream Effluent Management: Nutrient trading, water reclamation and reuse Effluent Polishing: Wetlands treatment (e.g., Hayward Marsh) Solids Management: Biosolids export (un-stabilized) to a joint facility Source Control: Septic source abatement, urine separation, phosphorus dish detergent ban, etc. • Non-Point Sources: Non-point source reduction program A big-picture perspective that considers nutrient removal by other means will identify costeffective and innovative solutions for nutrient load reduction strategies. The ancillary benefits and adverse impacts for the attractive strategies will be discussed. The effort associated with this task is to compile any previous reports or documents prepared for each plant that addresses nutrient reduction by other means. Additionally, the compiled report will identify any institutional barriers to water recycling along with proposals for overcoming such barriers. Economic Impacts Approach The economic impacts for capital, O&M, and life-cycle analysis will be quantified for each plant. The O&M includes the cost for energy, chemicals, and labor. The cost estimates will be based on opinions of probable construction costs based on professional experience and not an official bid document. The estimates are considered planning level values. A more detailed analysis would be needed to refine these costs. Approach The capital cost estimates will be consistent with the American Association of Cost Engineers, Recommended Practice No. 17R-97, Class 4 and the American National Standards Institute definition of a “budget estimate”. The estimates will be accurate within a range of +40 percent to -20 percent. The life-cycle costs will be prepared using the Net Present Value (NPV) method. The O&M cost estimates will be calculated using the HDR Water Cost Model. The HDR Water Cost Model was created using the HDR authored Environmental Protection Agency (EPA) document “Estimating Water Treatment Costs: Volume 2-Cost Curves Applicable to 1 to 200 mgd Treatment Plants” dated August 1979, to derive approximate O&M needs. Energy and chemical costs will be estimated from preliminary process calculations. 109 of 201 Unit Cost Unit costs will be developed in coordination with BACWA, such that they represent typical costs for the participating agencies. One set of unit costs will be used for all agencies, such that the results are directly comparable from one plant to another. An example of the unit cost parameters is presented in Table 2. Table 2. Unit Economics Sample Table Parameter Engineering News and Review Cost Index Construction Cost Index Nominal Discount Rate Inflation Rate: General Energy Chemicals Base Year Project Life Energy Unit -% % % % Years $/kWh Chemicals: Ferric $/ton Alum $/ton Methanol $/gal Alkalinity $/gal Labor Value -------------- $/FTE Greenhouse Gas Emissions Accounting The impact of process changes on the GHG emissions will be included in the analysis for both studies. This includes increases in GHG emissions associated with any recommended plant optimization and/or upgrade strategies. The GHG emissions accounting will focus on the operating energy and chemical demand. The approach relies on the USEPA eGRID values 2 for each plants regional energy production and the GHG emissions associated with chemical mining/fabrication. For example, converting energy demand to GHG emissions is based on an initial conversion to electrical demand, followed by a conversion to GHG emissions. The plant questionnaire will include questions to determine fuel type and consumption at each plant, as well as chemical demands. 2 http://www.epa.gov/cleanenergy/energy-resources/egrid/ 110 of 201 Appendix A – Participating Facilities Discharger American Canyon, City of Facility Name Wastewater Treatment and Reclamation Facility Benicia, City of Benicia Wastewater Treatment Plant Burlingame, City of Burlingame Wastewater Treatment Plant Central Contra Costa Sanitary District Central Contra Costa Sanitary District Wastewater Treatment Plant Central Marin Sanitation Agency Wastewater Treatment Plant Wastewater Treatment Plant Central Marin Sanitation Agency Delta Diablo East Bay Dischargers Authority (EBDA), City of Hayward, City of San Leandro, Oro Loma Sanitary District, Castro Valley Sanitary District, Union Sanitary District, Livermore-Amador Valley Water Management Agency, Dublin San Ramon Services District, and City of Livermore EBDA Common OutfallA Hayward Water Pollution Control Facility San Leandro Water Pollution Control Plant Oro Loma/Castro Valley Sanitary Districts Water Pollution Control Plant Union Sanitary District, Raymond A. Boege Alvarado Wastewater Treatment Plant Livermore-Amador Valley Water Management Agency Export and Storage FacilitiesA Dublin San Ramon Services District Wastewater Treatment Plant (LAVMA) City of Livermore Water Reclamation Plant (LAVMA) 111 of 201 Facility Address 151 Mezzetta Court American Canyon, CA 94503 Napa County 614 East Fifth Street Benicia, CA 94510 Solano County 1103 Airport Boulevard Burlingame, CA 94010 San Mateo County 5019 Imhoff Place Martinez, CA 94553 Contra Costa County 1301 Andersen Drive San Rafael, CA 94901 Marin County 2500 Pittsburg-Antioch Highway Antioch, CA 94509 Contra Costa County EBDA Common Outfall 14150 Monarch Bay Drive San Leandro, CA 94577 Alameda County East Bay Municipal Utility District Fairfield-Suisun Sewer District Las Gallinas Valley Sanitary District Millbrae, City of East Bay Municipal Utility District, Special District No. 1 Wastewater Treatment Plant Fairfield-Suisun Wastewater Treatment Plant Las Gallinas Valley Sanitary District Sewage Treatment Plant Water Pollution Control Plant Mt. View Sanitary District Mt. View Sanitary District Wastewater Treatment Plant Napa Sanitation District Soscol Water Recycling Facility Novato Sanitary District Novato Sanitary District Wastewater Treatment Plant Palo Alto, City of Palo Alto Regional Water Quality Control Plant Petaluma, City of Ellis Creek Water Recycling Facility Pinole, City of Pinole-Hercules Water Pollution Control Plant Rodeo Sanitary District Rodeo Sanitary District Water Pollution Control Facility San Francisco (San Francisco International Airport), City and County of Mel Leong Treatment Plant, Sanitary Plant San Francisco (Southeast Plant), City and County of Southeast Water Pollution Control Plant San Jose/Santa Clara Water Pollution Control Plant and Cities of San Jose and Santa Clara San Mateo, City of San Jose/Santa Clara Water Pollution Control Plant Sausalito-Marin City Sanitary District Sausalito-Marin City Sanitary District Wastewater Treatment Plant City of San Mateo Wastewater Treatment Plant 112 of 201 2020 Wake Avenue Oakland, CA 94607 Alameda County 1010 Chadbourne Road Fairfield, CA 94534 Solano County 300 Smith Ranch Road San Rafael, CA 94903 Marin County 400 East Millbrae Avenue Millbrae, CA 94030 San Mateo County 3800 Arthur Road Martinez, CA 94553 Contra Costa County 1515 Soscol Ferry Road Napa, CA 94558 Napa County 500 Davidson Street Novato, CA 94945 Marin County 2501 Embarcadero Way Palo Alto, CA 94303 Santa Clara County 3890 Cypress Drive Petaluma, CA 94954 Sonoma County 11 Tennent Avenue Pinole, CA, 94564 Contra Costa County 800 San Pablo Avenue Rodeo, CA 94572 Contra Costa County 918 Clearwater Drive San Francisco International Airport San Francisco, CA 94128 San Mateo County 750 Phelps Street San Francisco, CA 94124 San Francisco County 4245 Zanker Road San Jose, CA 95134 Santa Clara County 2050 Detroit Drive San Mateo, CA 94404 San Mateo County #1 Fort Baker Road Sausalito, CA 94965 Marin County Sewerage Agency of Southern Marin Wastewater Treatment Plant U.S. Department of Navy (Treasure Island) Wastewater Treatment Plant Vallejo Sanitation and Flood Control District Vallejo Sanitation and Flood Control District Wastewater Treatment Plant Richmond Municipal Sewer District No.1 (RMSD) Water Pollution Control Plant 450 Sycamore Avenue Mill Valley, CA 94941 Marin County 1400 Radio Road Redwood City, CA 94065 San Mateo County 22675 8th Street East Sonoma, CA 95476 Sonoma County 195 Belle Air Road South San Francisco, CA 94080 San Mateo County 1444 Borregas Avenue Sunnyvale, CA 94089 Santa Clara County 681 Avenue M, Treasure island San Francisco, CA 94130-1807 San Francisco County 450 Ryder Street Vallejo, CA 94590 Solano County 601 Canal Blvd. Richmond, CA 94804 Contra Costa County Silicon Valley Clean Water Silicon Valley Clean Water Water Treatment Plant Sonoma Valley County Sanitary District Municipal Wastewater Treatment Plant South San Francisco and San Bruno, Cities of South San Francisco and San Bruno Water Quality Control Plant Sunnyvale Water Pollution Control Plant West County Wastewater District (WCWD) Treatment Plant 2377 Garden Tract Road Richmond, CA 94801 Contra Costa County Sunnyvale, City of West County Agency (West County Wastewater District and City of Richmond Municipal Sewer District) West County Agency Combined Outfall Note: A. Conveyance; not treatment facility. 113 of 201 San Francisco Bay Nutrient Management Strategy (NMS) Steering Committee October 27, 2014 San Francisco Bay Regional Water Quality Control Board (RWQCB) Room 12, Second Floor 1515 Clay St, Oakland, CA 94612 AGENDA Agenda Item Lead 1 Welcome, Introductions, and Agenda Review Facilitator 2 Review of Action Items from Meeting 2 Facilitator / Dave Senn ‐ Science Program Manager Dave Senn 3 4 5. Science Plan Development Update and Related Information Purpose of Plan Review and Discussion of Planning Approach / Schedule Key Questions Lunch Break – Working Lunch Standing Committee Reports Governance Subgroup o Long‐Range Program Coordination o Recommendation to create a Planning Subcommittee Review of proposed Charter revision o Long‐Range NMS Budget Status and Funding Options Updates Delta NMS USGS Research Vessel 114 of 201 Time 10:00‐10:15 10:15‐10:30 10:30‐12:30 12:30‐12:50 Ben Horenstein/Ian Wren 12:50‐1:50 Chris Foe‐Central Valley RWQCB / Lisa Thompson‐ Sacramento Regional San Joe Holomuzki – USGS 1:50‐2:30 6 Review of Action Items 7 Facilitator Adjourn 2:30‐3:00 3:00 NOTES: Public comment periods will be accommodated at the end of each agenda item (excluding item 1). The duration of each comment period will be at the discretion of the meeting facilitator. Breaks will be taken at the discretion of the meeting facilitator and the Steering Committee. 115 of 201 Proposed Charter Revision – October 27, 2014 4.2 Planning Subcommittee ThePlanningSubcommitteeisaformaladvisorysubcommitteeoftheSteering Committeestructuredtoreasonably,butnotexhaustively,representthevarious stakeholdersectorsontheSteeringCommittee,andtorepresentthediversityof thosesectors.PlanningSubcommitteemeetingsareheldinvariousformats includingin‐person,virtualweb‐basedmeetings,and/orconference‐callsettings. 4.2.1–PlanningSubcommitteeRole:TheroleofthePlanningSubcommitteeisto serveasanadvisorybodytotheSteeringCommitteeonadministrative,project managementandprojectcommunicationtopicssuchasresourceallocation,staff andadvisorreportingmechanisms,projectcoordinationpriorities,andsimilarin ordertomoveNMSworkforwardbetweenSteeringCommitteemeetings.The PlanningSubcommitteewillassesskeyissuesrelatedtothesetopics,investigate itemsasrequestedbytheSteeringCommittee,andwillbringrecommendationsto theSteeringCommitteeforconsiderationanddecision‐making. 4.2.2–PlanningSubcommitteeMembership:PlanningSubcommitteemembership adequatelyrepresentsthediversityoftheSteeringCommittee,andis representative,butnotexhaustive,ofthestakeholdersectorsontheSteering Committee.MembersofthePlanningSubcommitteewillbelimitedtoSteering CommitteemembersthatvolunteertoserveonthePlanningSubcommittee,and thatareapprovedbytheSteeringCommittee.TheSteeringCommitteewillseekto maintainabalancedrangeofinterestsandasizeoftheSubcommitteethatissmaller thantheSteeringCommittee. 4.3.3–PlanningSubcommitteeDecision‐Making:ThePlanningSubcommitteeis “consensus‐seeking”whereinallparticipantstakereasonableandappropriatesteps toreachconsensus.Specificdecision‐makingmethodsaredescribedinAppendixB. 4.4.4‐PlanningSubcommitteeOperatingProtocols:ThePlanningSubcommittee maybefacilitatedbyathirdparty,neutralfacilitatoronanas‐neededandas‐ availablebasisorwillbefacilitatedbySubcommitteemembers.Meetingsoccuron anas‐neededbasis,asdeterminedbythePlanningSubcommitteeand/orSteering Committee.MeetingagendaswillbepreparedbythePlanningSubcommittee membersand/orthefacilitatorandshallcontainitemsreferredbytheSteering Committeeand/orthePlanningSubcommitteeforconsideration.Itemsconsidered bythePlanningSubcommitteewillbebroughtbacktotheSteeringCommitteewith recommendations. 116 of 201 CALIFORNIA ASSOCIATION of SANITATION AGENCIES 1225 8th Street, Suite 595• Sacramento, CA 95814 • TEL: (916) 446-0388 • www.casaweb.org November 6, 2014 Board of Directors President DAVID R. WILLIAMS Central Contra Costa Sanitary District Vice President KEVIN M. HARDY Encina Wastewater Authority Secretary-Treasurer JEFF MOORHOUSE Carpinteria Sanitary District DAVID BACHTEL HDR, Inc. TIMOTHY P. BECKER Oro Loma Sanitary District PAUL BUSHEE Leucadia Wastewater District JASON DOW Central Marin Sanitation Agency SCOTT M. GOLDMAN El Toro Water District JOHN E. HOAGLAND Rancho California Water District STEPHEN A. HOGG City of Fresno WILLIAM C. LONG Novato Sanitary District TRACI MINAMIDE City of Los Angeles, LA Sanitation E.J. SHALABY West County Wastewater District Executive Director ROBERTA L. LARSON The Honorable Edmund G. Brown, Governor State of California State Capitol Sacramento, CA 95814 RE: Cap and Trade Funding for Bioenergy Development Dear Governor Brown: I am writing on behalf of the California Association of Sanitation Agencies (CASA) to offer our strong recommendation that a portion of the Cap and Trade proceeds for the 2015-16 fiscal year be allocated to the wastewater community to further the development of bioenergy and mitigate climate change impacts. CASA is a statewide organization representing cities, counties, and special districts that provide essential public services through wastewater collection, treatment, biosolids management and recycling, renewable energy production, and water recycling services to millions of Californians. CASA’s membership includes small, medium and large agencies representing more than 90% of California's sewered population. CASA members are actively engaged as partners with the state to fulfill by 2020 a number of mandates and initiatives intended to deliver renewable energy and mitigate climate change impacts. These include: (1) providing 33% of the state’s energy needs from renewable sources; (2) reducing carbon dioxide equivalent emissions to 1990 levels; (3) reducing the carbon intensity of transportation fuel used in the state by 10%; and (4) recycling 75% of the solid waste generated in the state. Publicly owned treatment works (POTWs), and others involved in the production of bioenergy have a multitude of projects that can provide tangible greenhouse gas (GHG) reductions consistent with the goals of Cap and Trade and should be eligible to receive a significant amount of Cap and Trade auction proceeds through the FY 2015-16 State Budget process. POTWs stand ready to be proactive partners with the state in achieving its many ambitious goals and mandates related to climate change mitigation and renewable energy production. Of tremendous importance is the fact that POTWs can help the state meet its objectives largely by utilizing existing infrastructure, with minor modifications. This makes wastewater agency projects immediate, cost effective and extremely competitive candidates for funding through Cap and Trade auction revenues. Anaerobic digestion (AD) is a typical part of the wastewater treatment process employed at many POTWs across the state. Roughly 95% of wastewater flow in California is treated at POTWs that have AD as the solids treatment process. The AD process produces biomethane, which is converted into power at the majority of these POTWs. This power production generally provides between 40 and 70 percent of the POTWs energy needs, significantly reducing demand from the grid and offsetting the need for fossil-fuel based power with waste Ensuring Clean Water for California 117 of 201 The Honorable Edmund G. Brown, Governor November 6, 2014 page 2 from renewable energy. Many POTWs are now also hauling in additional organic feedstocks such as fats, oils, and grease (FOG) and food waste for introduction into digesters for co-digestion with sewage sludge. The addition of these feedstocks into the AD system leads to the production of more methane (and hence, additional power production) and simultaneously diverts the organic landfills. Some wastewater entities have been able to meet 100 percent of their power needs by taking advantage of these processes and are now able to produce excess renewable energy that could potentially be fed back onto the grid. The biomethane produced (or a portion of it) can, if cost effective, be converted to low carbon intensity transportation fuel. This may especially be attractive in air districts certified as being in severe nonattainment for ground level ozone standards under the Clean Air Act. Using very conservative assumptions from the United States Environmental Protection Agency (US EPA) Combined Heat and Power Partnership program, CASA estimates that POTWs in California are currently producing more than 611,000 megawatthours per year (MWh/year) of electricity or more than 2,350,000 million British thermal units per year (MMBtu/year) of thermal energy. If converted to low carbon transportation fuel, 611,000 MWh/year would produce 18 million gasoline gallon equivalents (gge) or 16.2 million diesel gallon equivalents (dge). Similarly 2,350,000 MMBtu/year of thermal energy would produce 20.2 million gge or 18.3 million dge. If all POTWs currently producing biomethane were to utilize all of that biomethane, then using those same conservative assumptions we could produce an additional 300,000 MWh/year of electricity or an additional 1,150,000 MMBtu/year of thermal energy. These estimates do not account for the additional biomethane produced from co-digesting solids with FOG or food waste, which means the potential for producing additional renewable energy is even greater. Moreover, biosolids produced as part of the wastewater treatment and AD process can be land applied in agricultural or horticultural settings helping to mitigate climate change by substituting for the use of fossil fuel intense inorganic fertilizer and by improving long-term sequestration of carbon in soil. Roughly 0.22 gallons of fossil fuel is required to produce every pound of inorganic nitrogen fertilizer, illustrating the tremendous offset gained by using biosolids for land application. Because biosolids are an organic matrix, rich in organic carbon and nitrogen as well as other valuable micro and macro nutrients, biosolids improve soil tilth, reduce the need for irrigation because of their excessive water holding capacity, and increase crop production. Furthermore, biosolids can be utilized to reclaim fire-ravaged land, control erosion, and reduce the potential severity, and climate change impacts, of future fires by allowing native vegetation to outcompete invasive species which become dried out fuel by early summer. Allocating a portion of Cap and Trade funding to POTW’s for bioenergy projects as part of the FY 2015-16 State Budget to supplement local matching funds is essential to making many of these projects costeffective. Some of the many investments that POTWs can make include: (1) upgrades of AD systems (improved mixing, heating, etc.) to increase biomethane generation; (2) construction of receiving facilities to accept hauled in organic waste for co-digestion to increase biomethane generation; (3) upgrading power generating and heating systems to convert biomethane into usable energy; or (4) addition of emission controls to power generating equipment as may be required in some Air Districts thereby allowing the continued production and utilization of renewable energy as opposed to flaring; (5) development and implementation of systems designed to convert biomethane into low carbon fuel; (6) construction of facilities to condition of the biomethane for pipeline injection (thereby offsetting the need for natural gas); Ensuring Clean Water for California 118 of 201 The Honorable Edmund G. Brown, Governor November 6, 2014 page 3 (7) increasing biosolids land application (only 56% is now land applied); and the use of biosolids on fireravaged land and for superfund mine reclamation; and (8) adaptive management of coastal POTWs to protect against sea level rise. This is an extensive, though certainly not exhaustive, list of the types of multi-benefit projects that POTWS could engage in with Cap and Trade revenues. All of these types of projects will create tangible, measurable GHG reductions that coincide with the overarching goals of the Cap and Trade program. Additionally, there are many opportunities for wastewater agencies to partner with other sectors (i.e. forestry, transportation, agriculture, etc.) to realize significant air quality improvements utilizing the many technologies outlined in this letter. In summary, CASA strongly recommends that Cap and Trade auction proceeds be specifically allocated in the FY 2015-16 State Budget for the public wastewater sector. For all of the reasons above, CASA and its members stand as ready and willing partners with the state to help realize the many objectives and mandates for climate change mitigation. POTWs offer some of the most cost-effective solutions available to achieve these goals, needing only to modify existing infrastructure in order to maximize benefits. CASA is also a founding member of the Bioenergy Association of California (BAC) and strongly endorses their letter articulating a similar funding request for a broad suite of bioenergy producers. Thank you for your consideration of these comments. Please do not hesitate to contact me or Greg Kester, CASA’s Director of Renewable Resources, ([email protected]) or 916-844-5262 with any questions or for further clarification of any of our comments. We look forward to working together as proactive partners on our multitude of shared objectives. Sincerely, Roberta L. Larson Executive Director cc: The Honorable Kevin De Leon, President Pro Tem, California Senate (Hand Deliver) The Honorable Toni Atkins, Speaker, California State Assembly (Hand Deliver) The Honorable Nancy Skinner, Chair, Assembly Budget Committee Hand Deliver) The Honorable Mark Leno, Chair, Senate Budget Committee (Hand Deliver) The Honorable Jim Nielsen, Vice Chair, Senate Budget Committee (Hand Deliver) Karen Ross, Secretary, California Department of Food and Agriculture ([email protected]) Mary Nichols, Chair, California Air Resources Board ([email protected]) Caroll Mortensen, Director, CalRecycle ([email protected]) Ken Pimlott, Chief, Calfire ([email protected]) Duane Shintaku, Calfire ([email protected]) Felicia Marcus, Chair, Water Resources Control Board ([email protected]) Cliff Rechtschaffen, Office of Governor Edmund G. Brown (Hand Deliver) Martha Guzman-Aceves, Office of Governor Edmund G. Brown (Hand Deliver) Michael Cohen, Director, Department of Finance (Hand Deliver) Gabrielle Meindl, Assembly Budget Committee Chief Consultant (Hand Deliver) Catherine Freeman, Senate Budget Committee Chief Consultant (Hand Deliver) Kip Lipper, Office of Senate Pro Tem (Hand Deliver) Arnie Sowell, Office of the Assembly Speaker (Hand Deliver) Greg Kester, Director of Renewable Resource Programs, CASA ([email protected]) Michael Dillon, CASA State Lobbyist ([email protected]) Ensuring Clean Water for California 119 of 201 The result is a prioritized list of AB 32 Scoping Plan goals that are relevant to POTWs CarolloTemplateWaterWave.pptx/14 CarolloTemplateWaterWave.pptx/13 Agencies provided feedback in the matrix below EJ Projects Get ~1/3rd of Cap and Trade $$$ How is SB 535 Being Implemented? EJ Projects Include: Identify Communities Maps of EJ Communities Agency Guidance $100 MM for Low Carbon Transportation Maximize EJ Benefits $107 MM $75 MM for Weatherization $65 MM for Sustainable Communities TOTAL: $832 million, FY 2014-15 $18 MM for Urban Forestry Agencies: ARB, CSD, SGC, CAL FIRE, CDFA, DFW, CEC, HSRA, CalSTA, CalRecycle, Caltrans $14 MM Low Carbon Transit and Rail CarolloTemplateWaterWave.pptx/16 CarolloTemplateWaterWave.pptx/15 SB 535: $275 million, so far (EJ) $130 MM $95 MM $??? MM TBD CalEnviroScreen Results Are Meant to Screen for Combined Impacts Socioeconomic Scores Environmental Scores Population metrics like poverty, and educational status, and health indices like asthma rates and low birth weights… Are multiplied by environmental metrics like exposure to Diesel particulates and proximity to impaired bodies of water CarolloTemplateWaterWave.pptx/18 How Does CalEnviroScreen Work? CarolloTemplateWaterWave.pptx/17 $500 MM 3 120 of 201 CalEnviroScreen Questionable Results CalEnviroScreen Questionable Results Scores Cannot Be Calculated for Over 80,000 People US EPA is Now Active in “Climate Justice” Identified EJ Communities No Score for These Areas. US EPA to Release Its Own Screening Tool US EPA to Release Its Own Screening Tool CarolloTemplateWaterWave.pptx/24 CarolloTemplateWaterWave.pptx/23 Identified EJ Communities CarolloTemplateWaterWave.pptx/22 CarolloTemplateWaterWave.pptx/21 No EJ Communities Identified in Marin County No EJ Communities Identified in These Mainly Rural Counties 29 Counties Contain NO EJ Communities if the Highest 25% Scores Are Chosen CarolloTemplateWaterWave.pptx/20 CarolloTemplateWaterWave.pptx/19 Identified EJ Areas Can Get Cap and Trade Funds under SB 535 4 121 of 201 Sherry Hull From: Sent: To: Subject: Attachments: Sherry Hull Tuesday, November 18, 2014 11:20 AM Sherry Hull FW: Flaring Regulations 120417 Rule 1110 2 SCAP Final Comment Letter.pdf From: John Pastore [mailto:[email protected]] Sent: Tuesday, November 18, 2014 10:09 AM To: Dave Williams Subject: RE: Flaring Regulations Dave I have attached our 2012 letter plus the following is our latest update to be given to our Board at next month’s meeting. ‐‐John SCAQMD Rule 1110.2 On July 25th, SCAQMD staff provided an annual Rule 1110.2 status report to the Stationary Source Committee. At this meeting, several SCAP members summarized research and construction difficulties posed by Rule 1110.2 and requested additional time to complete their respective retrofit projects. In response, SCAQMD Board members concurred that these agencies should be provided additional time to retrofit their biogas engines. SCAQMD staff committed to holding another biogas technology meeting in January 2015 to discuss the status of the demonstrations and determine how much additional time might be required to achieve compliance. On October 29th, a Rule 1110.2 Biogas Technology Advisory Committee meeting was held to discuss: (1) the status of ongoing demonstrations and (2) extending the compliance deadline beyond January 1, 2016. At this meeting SCAQMD staff seemed hesitant to formally extend the retrofit deadline. Another Biogas Technical Advisory Committee meeting is tentatively scheduled for January 2015, where this subject will be discussed again. In the meantime, the Air Quality Committee will request a meeting with SCAQMD executive management to secure relief for members that have worked in good‐faith to comply with this rule. 1 122 of 201 Big Bear Area RWA Camarillo SD Carpinteria SD City of Anaheim City of Barstow P.O. Box 231565 City of Burbank Encinitas, CA 92024-1565 City of Carlsbad City of Chula Vista City of Corona DWP April 17, 2012 City of Downey City of El Cajon City of Encinitas Las Virgenes MWD Mr. Kevin Orellana Planning, Rule Development and Area Sources South Coast Air Quality Management District 21865 Copley Drive City of Glendale City of Lancaster Re: Comments on Proposed Amended Rule 1110.2 City of Lompoc City of Los Angeles City of Montclair City of Newport Beach City of Ontario City of Oxnard City of Palm Springs City of Placentia City of Poway City of Redlands MUD City of Rialto City of Riverside City of San Bernardino City of San Diego City of San Juan Cap. City of Santa Barbara City of Santa Maria City of Santa Monica City of Sierra Madre City of Thousand Oaks City of Ventura City of Vista County of San Bernardino W/S County of San Diego Crescenta Valley WD Crestline San. District Eastern Municipal WD El Toro Water District Elsinore Valley MWD Encina WA JPA Fairbanks Ranch CSD Fallbrook PUD Laguna County San District Lake Arrowhead CSD City of Coronado DPS City of Culver City Fallbrook PUD Goleta Sanitary District Goleta West SD Inland Empire Utilities Agency Irvine Ranch WD Dear Mr. Orellana: The Southern California Alliance of Publicly Owned Treatment Works (SCAP) represents 84 public agencies that provide essential water and wastewater treatment to nearly nineteen million people in Los Angeles, Orange, San Diego, Santa Barbara, Riverside, San Bernardino and Ventura counties. We provide environmentally sound, cost-effective management of more than two billion gallons of wastewater each day and, in the process, convert wastes into resources such as reclaimed water and renewable energy. We appreciate this opportunity to comment on South Coast Air Quality Management District (SCAQMD) Proposed Amended Rule 1110.2. Our membership is extremely concerned that the rule, as proposed, will force most agencies to abandon existing renewable engine biogas projects and flare a renewable energy source. Accordingly, our membership opposes the proposed amended rule, as currently drafted. Leucadia WW District Los Angeles County DPW Los Angeles County Sanitation Districts Metro Wastewater JPA Metropolitan WD of Southern CA Montecito Sanitary District Moulton Niguel WD Ojai Valley Sanitary District Olivenhain MWD Orange County Sanitation District Orange County Water District Otay Water District Ramona Municipal WD Rancho California WD Rancho Santa Fe CSD Rubidoux CSD SCAP member agencies have worked collaboratively with SCAQMD staff to address our concerns, but we regret to report that additional efforts are required to develop cost-effective and commercial technologies for our small and rather unique industry. As a foundation for our comments, we would like to reference the Governing Board’s February 1, 2008 Rule 1110.2 resolution, which states: San Elijo JPA “…the AQMD Governing Board in amending this regulation directs staff to conduct a technology assessment of the availability, feasibility, cost-effectiveness, compliance schedule, and global warming gas impacts of commercial biogas engine control technologies needed to comply with the biogas engine emission limits of July 2012. Staff is also directed to report back to the Board at its regularly scheduled public meeting by no later than July 2010, two years before the standards go into effect, to assure that cost-effective and commercial technologies are available to comply with the proposed limits, that Valley Center Municipal WD 1 123 of 201 Santa Margarita WD South Coast Water District South Orange County WWA Vallecitos WD Valley Sanitary District Victor Valley WWRA West Basin MWD Western Municipal Water District Whispering Palm CSD increased flaring of landfill and biogas will not occur, and that the schedule for compliance is reasonable and to make appropriate recommendation on potential rule changes if necessary…” As described below, cost-effective and commercial technologies have yet to be identified. The proposed requirements would force most facilities to either commit to a project that would operate at a loss of about two to seven cents per kW-hour or shut-down biogas engines and flare1. Even if a facility elected to install the single technology recommended by SCAQMD staff, insufficient time is provided for design and construction. We respectfully request that ongoing demonstration projects, which are being conducted by our member agencies, be completed prior to the adoption of the proposed amended rule. Technology Demonstrations Several of our members are in the process of performing technology demonstrations. These technologies include catalytic oxidation and selective catalytic reduction, NOxTech and hydrogen injection. Although the catalytic oxidation and selective catalytic reduction technology appears to achieve the desired emissions limits, insufficient data has been provided for the two pilot projects described in the Staff Report. Specifically, the Orange County Sanitation District’s (OCSD) demonstration recently experienced catalyst fouling and information regarding Ox Mountain’s success is practically nonexistent. We request that additional information should be presented and vetted before the completion of SCAQMD’s technology assessment. Our membership is very interested in both the NOxTech and hydrogen injection demonstration projects. Unlike other technologies, which require extensive pretreatment to eliminate contaminants, NOxTech and hydrogen injection would not require any pretreatment. Due to their inherent simplicity and potential cost-effectiveness, we believe that these demonstrations must be completed before facilities are forced to either install extremely costly technology or flare biogas. Problems with the Proposed Retrofit Technology Despite ongoing demonstrations for other potentially affordable control technologies, no technology was determined to meet the originally proposed Rule 1110.2 limits, SCAQMD staff identified that catalytic oxidation and selective catalytic reduction is commercially available technology that can achieve the modified biogas limits currently proposed. While this technology is well-established for natural gas engines, biogas is not natural gas. Our industry must provide significant biogas pretreatment for the recommended technology to function properly. This task is further complicated by the difficulty associated with detecting siloxane2 breakthough from the pretreatment process, which requires time-consuming laboratory analyses. If the pretreatment process cannot guarantee continuous contaminant removal, catalysts can be fouled in a matter of hours. As illustrated in Figure 1, wastewater treatment plants and to a lesser extent landfills have variable contaminant loading rates. In order to remove these contaminants, the pretreatment system must be designed to remove the greatest anticipated contaminant levels to avoid catalyst failure. Such a reasonable design comes at a premium, which is not addressed by the Staff Report. As shown in Figure 1, OCSD’s contaminant levels are low and fairly consistent in stark contrast to many other facilities. We are concerned that SCAQMD’s cost-effectiveness assessment, which relies heavily upon OCSD’s demonstration, ignores this fact and artificially reduces anticipated project costs. 1 Source: Rule 1110.2 Estimated Retrofit Costs to Achieve Proposed Biogas Limits Proposed, Southern California Alliance of Publicly Owned Treatment Works, PowerPoint presentation provided to SCAQMD staff on October 26, 2010. 2 Siloxanes are cyclic organic silicon monomers used in the manufacture of personal hygiene, health care, and industrial silicone products, which are found in wastewater and solid wastes. 2 124 of 201 Cost Effectiveness Although we understand that SCAQMD’s cost-effectiveness metric is the cost to reduce a ton of pollution, our membership needs to justify their respective retrofit projects with their boards. These decision-makers, which are typically elected officials, want to ensure that such a project is both environmentally sound and economically viable. Especially in these difficult economic times, biogas energy recovery projects must eventually pay for themselves. Accordingly, the metric used by our industry is the cost per kW-hour. Energy recovery projects that are able to provide a minimal return on the capital investment may be allowed to proceed, while other projects that are not economically viable are dismissed. On October 26, 2010, SCAP members provided a PowerPoint presentation to SCAQMD staff to indicate our technical and economic concerns pertaining to the proposed emission limits. The presentation and supporting information indicated that required retrofits would cause seven of eight facilities to operate at loss of about two to seven cents per kW-hour. Subsequently, with the decline of electricity prices and other factors have made previously economically viable projects questionable endeavors at best. While we understand the difficulty in performing the requested economic assessment on a cost per kW-hour basis, we would like to remind SCAQMD staff that their Interim Technology Assessment provided to the Governing Board on July 9, 2010, committed to analyzing costs considering this metric3. We again respectfully request SCAQMD staff to conduct the requested analysis. Future Emissions Limits The few facilities that may proceed with the required engine retrofits envisioned by the proposed amended rule are concerned that SCAQMD will again lower the biogas engine emissions limits in the near future. SCAQMD staff has indicated that more stringent limits are possible, and the timetable for such standards is unknown. This uncertainty raises even more questions about the SCAQMD staff's determination of control technology cost-effectiveness, as the predicted 20-year lifetime may be significantly reduced. Furthermore, based on the SCAQMD's need to revise the averaging times of the emissions limits in the proposed amended rule to bring the results of OCSD's pilot study into compliance, it is unlikely that the recommended technology would be capable of achieving future emission limits. Due to this uncertainty, we respectfully request that the Board allow facilities to amortize their capital investment before another round of emission reductions are required. In addition, we request the continued use of the Efficiency Correction Factor (ECF) in determining the NOx concentration limit in the proposed amended rule. Even after the installation and subsequent operation of a proven control technology, once available, it is likely there would be some NO x excursions above the proposed amended concentration limit due to variations in gas quality and contaminant concentrations. Use of the ECF will provide an appropriate adjustment to maintain consistent compliance with higher efficiency biogas engines per the ECF-adjusted NOx concentration limit. The inclusion of the ECF has been long standing in Rule 1110.2 and there appears to be no basis for removal of the ECF Compliance Schedule Results obtained from OCSD’s demonstration project have provided valuable site-specific operating data, which will facilitate the retrofit of their remaining engines. Nevertheless, OCSD has indicated that completion of their project will require four more years. Unfortunately, SCAQMD staff appears to be unwilling to provide an adequate amount of time to facilitate their project. Clearly, the two year implementation schedule is not a realistic timeline for a public agency to complete the significant retrofits necessary to meet the proposed limits, especially those that have yet to perform site-specific studies needed to support the design of their pretreatment system. If the proposed emission limits are 3 Source: SCAQMD Interim Report on Technology Assessment for Biogas Engines Subject to Rule 1110.2, July 9, 2010. 3 125 of 201 adopted, at a minimum, adequate time should be provided to design and install the required pretreatment and emission control systems. Use of Biogas as a Renewable Resource Biogas has been identified as a potential resource eligible for the Renewables Portfolio Standard program, which was intended to increase California's usage of renewable resources to 33 percent by 2020. The California Energy Commission has stated that biogas is an essential component of an efficient electricity generation portfolio. Moreover, the SCAQMD's own Energy Policy includes a goal to promote and develop biogas technologies for energy generation. Counter to the intent of these programs, there is currently no incentive to retrofit existing renewable biogas energy projects, where self-generated electricity is utilized onsite to displace fossil fuel based energy. It was our understanding that SB2 (1x) was to provide an incentive of about $0.035 per kWhour for such renewable energy projects, but to our dismay the self-generated renewable energy credits have been relegated to a worthless category. This coupled with the current electricity rates makes the required retrofits associated with the proposed amended rule extremely difficult to justify financially. We believe there is an opportunity to work together and provide a legislative fix to SB2 (1x) for our mutual benefit. With adequate financial incentives for our renewable energy projects, the emission controls envisioned by the proposed amended rule should become economically feasible. SCAP acknowledges SCAQMD’s challenge to reduce ozone forming emissions in an extreme nonattainment area. As stewards of the environment our members share your vision of clean healthy air and commit to reduce our emissions with your assistance. We are enthusiastic about the promise of NOxTech and hydrogen injection as cost-effective and commercially available technologies, but we respectfully request the additional time needed to complete these demonstrations and your support for a legislative fix to SB2 (1x) that will allow more of our members to install clean and renewable biogas power projects. Thank you for your consideration of this important matter. We look forward to working with you to identify practical solutions to achieve clean air. Sincerely, John Pastore, Executive Director cc: Enrique Zaldivar, President SCAP Mayor Dennis Yates, SCAQMD Governing Board Member Jane Carney, SCAQMD Governing Board Member Mayor Ronald Loveridge, SCAQMD Governing Board Member Dr. Joseph Lyou, SCAQMD Governing Board Member Council Member Judith Mitchell, SCAQMD Governing Board Member Supervisor Shawn Nelson, SCAQMD Governing Board Member Attachment: Figure 1 4 126 of 201 [BACWA LETTERHEAD] DRAFT November 21, 2014 Attn: Dyan Whyte Assistant Executive Officer Regional Water Quality Control Board 1515 Clay Street, Suite 1400 Oakland, CA 94612 Subject: Mercury and PCB TMDL Risk Management Activities Dear Ms. Whyte, The Bay Area Clean Water Agencies (BACWA) is a joint powers agency whose members own and operate publicly-owned treatment works (POTWs) and sanitary sewer systems that provide sanitary services in the nine-county San Francisco Bay Area. The dischargers we represent are tasked with meeting the risk reduction requirements outlined in the Mercury/PCB Watershed Permit (R2-2012-0096). As part of the risk reduction efforts required during the previous permit term, we provided funding for the San Francisco Bay Fish Project conducted by the California Department of Public Health (CDPH). Our intent is to continue efforts to reduce exposure to mercury and polychlorinated biphenyls (PCBs) from consumption of fish in San Francisco Bay, as is the “spirit and intent” of the mercury and PCB TMDLs. Our desire is to again work collaboratively by providing grant funds to community-based organizations (CBOs) to distribute fish consumption safety information and educate public groups most at risk. Over the last year several options have been explored as part of our efforts to meet the permit requirements. Unfortunately many of these options either failed or were not ready to launch. In discussion with your staff, we have at this time identified three alternatives that appear viable for completing the risk reduction activities as required by the current watershed permit. These alternatives are as follows: 1. Collaborate with the Bay Area Stormwater Management Agencies Association (BASMAA) whose members are currently undertaking pilot studies in San Mateo and Santa Clara counties. The pilot efforts consist of utilizing the outreach materials developed under the Fish Project and distribute the materials to at-risk communities. They would then report back providing metrics on their efforts. Based on the results of these pilot efforts other BASMAA members may expand the program into their counties. BACWA would contribute funds in support of these county programs. 2. Utilizing the expertise of staff from the Aquatic Science Center/San Francisco Estuary Institute (ASC/SFEI) who managed the last risk reduction effort in the Bay Area, will provide us a structure under which we can work with CBOs. Under this alternative ASC/SFEI will provide two important services: 1) convening a steering committee to choose grant recipients and reviewing their reports, and 2) to serve as the "banker" to collect and distribute funds for this effort., BACWA, and perhaps other dischargers would sit on the steering committee along with the Water Board, EPA, OEHHA and CDPH. The dischargers would provide funding to the steering committee to be distributed as grants to CBOs based on submitted proposals. The steering committee would meet once or twice a year to award grants and receive progress reports from the grantees. 3. Based on the successful 2012 Fish Project, BACWA would contact one or more of the four CBOs who were trained to conduct outreach and to evaluate the effectiveness of their outreach efforts and request proposals. These would be evaluated and one or more grants would be awarded. The CBOs would conduct their outreach efforts and provide progress reports which would be submitted to the Water Board. BACWA is prepared to contribute $50,000 to fund one of these alternatives over the current 5 Year Permit term which expires on December 31, 2017. We look forward to working with your staff over the coming couple of months and collaborating with other dischargers who can also help fund one of these risk reduction efforts to put a program in place and proceed with completing this requirement under the Watershed Permit. Respectfully, David R. Williams, Executive Director Bay Area Clean Water Agency October 2, 2014 Dave Williams, Executive Director Bay Area Clean Water Agency PO Box 24055, MS 59 Oakland, CA 94623 Sent via email: [email protected] Geoff Brosseau, Executive Director Bay Area Stormwater Management Agencies Association 437 Encina Avenue Menlo Park, CA 94025 Sent via email: [email protected] Kevin Buchan, Bay Area Regional Coordinator Western States Petroleum Association 1415 L Street, Suite 600 Sacramento, CA 95814 Sent via email: [email protected] Subject: Mercury and PCB TMDL Risk Management Activities – Permittee Responsibilities Dear BACWA, BASMAA and WSPA Directors and Members: We would like to take this opportunity to communicate our expectations in regard to the adequacy of discharger actions to reduce the risk to consumers of contaminated Bay fish. These actions are called for in the Mercury and PCB TMDLs and required as part of watershed or regional permits implementing those TMDLs. We have reviewed the reports on the San Francisco Bay Fish Project (Fish Project) submitted in 2012. These reports document outreach activities that effectively delivered messages about the health risks of consuming certain Bay-caught fish to people who likely eat such fish on an ongoing basis. As part of the Fish Project, a framework for conducting this type of outreach was developed; outreach materials were crafted; and four community-based organizations (CBO) were trained to conduct the outreach and to evaluate the effectiveness of their outreach efforts. We consider this effort a success and support building upon it as a means to satisfy the Mercury and PCB TMDL requirements that dischargers conduct, or cause to be conducted, this type of outreach. We will continue to collaborate with the Central Valley Regional Water Board and State Water Board and the California Department of Public Health and to encourage a broader approach to managing fish-consumption risks. However, until a larger framework is established, dischargers will be directly responsible for fish-consumption risk reduction outreach. 129 of 201 At this time, dischargers under the San Francisco Bay Mercury Watershed Permit are investigating ways to comply with that permit’s Risk Reduction Program requirement, and Water Board staff is preparing to reissue the Municipal Regional Stormwater Permit. Given the lag in permit reissuance schedules, the need for on-going risk reduction, and statements made by the dischargers on the desire to collaborate, the discharger groups are encouraged to collaborate and submit one consolidated proposal by November 21, 2014. An acceptable level of outreach could include, at a minimum, ongoing cumulative and collaborative funding of at least three CBOs conducting the types of outreach done under the Fish Project 1. We recommend that the proposal include a plan for implementing an on-going risk management program that not only fulfills permit requirements, but that meets the spirit and intent of the TMDLs. If you have any questions, please feel free to discuss this in more detail with Jan O’Hara at [email protected] or 510.622.5681. Sincerely, Dyan Whyte Assistant Executive Officer cc: BACWA, BASMAA and WSPA members: Peter Lee ([email protected]) Jeff Gregory ([email protected]) Syed Murtuza ([email protected]) Melody LaBella ([email protected]) Michael Kirker ([email protected]) Robert Cole ([email protected]) Meg Herston ([email protected]) Gary W. Darling ([email protected]) Mike Connor ([email protected]) Ben Horenstein ([email protected]) Dale McDonald ([email protected]) Mark Williams ([email protected]) Tony Rubio ([email protected]) Joe Magner ([email protected]) Neal Allen ([email protected]) Lilia Corona ([email protected]) Tim Healy ([email protected]) Sandeep Karkal ([email protected]) James Allen ([email protected]) Lena Cox ([email protected]) Ron Tobey ([email protected]) Steven S. Beall ([email protected]) Tommy Moala ([email protected]) Bill Zolan ([email protected]) Ramon Towne ([email protected]) 1 Per the San Francisco Bay Fish Project Final Report, four CBOs conducting outreach over approximately one year under the Fish Risk Project reported reaching 5000 individuals, and these individuals had over 17,000 family members who ate Bay Fish. 130 of 201 Jim Ervin ([email protected]) Daniel Child ([email protected]) Craig Justice ([email protected]) Mark Grushayev ([email protected]) Wendy Gjestland ([email protected]) E.J. Shalaby ([email protected]) Brian Schumacker ([email protected]) Melody Tovar ([email protected]) Patricia McFadden ([email protected]) Melissa Morton ([email protected]) Darren Greenwood ([email protected]) Alex Ameri ([email protected]) Dean Wilson ([email protected]) Jason Warner ([email protected]) Tim Grillo ([email protected]) Daniel Gallagher ([email protected]) Don Landeck ([email protected]) Mike Armour ([email protected]) Peter Carroll ([email protected]) Kimberly Ronan ([email protected]) Pasha McAllister ([email protected]) Warren Schenstrom ([email protected]) John Ferons ([email protected]) Donald Moore ([email protected]) Jim Scanlin [email protected] Adam Olivieri [email protected] Matt Fabry [email protected] Kevin Cullen [email protected] Lance Barnett [email protected] Tom Dalziel [email protected] 131 of 201 Sherry Hull From: Sent: To: Subject: Sherry Hull Tuesday, November 18, 2014 9:18 AM Sherry Hull FW: Conference Call re Toxicity Plan: CORRECTION--Dec 1 at Noon pacific From: Bobbi Larson [mailto:[email protected]] Sent: Monday, November 17, 2014 10:54 AM Subject: Re: Conference Call re Toxicity Plan: CORRECTION--Dec 1 at Noon pacific My apologies— just after I sent this out I learned of a CASA staff conflict for the original time of the call. Please see revised call information below: Monday, December 1, 2014 Noon To 1:00 p.m. Dial in Number: (712) 432‐1212 Meeting ID: 637‐929‐852 Bobbi Larson Executive Director CASA 1225 8th St, Suite 595 Sacramento, CA 95814 Office : 916.446.0388 ext 1 Cell : 916.798.7488 www.casaweb.org From: Roberta Larson <[email protected]> Date: Mon, 17 Nov 2014 09:06:45 ‐0800 Subject: Conference Call re Toxicity Plan: Dec 1 at 10:00 a.m. pacific Thanks very much for your prompt responses. It appears that Monday December 1st is the best date for the call. (Apologies to those who cannot make it.) Please mark your calendars for the call: Monday, December 1, 2014 10:00 a.m. To 11:00 a.m. Dial in Number: (712) 432‐1212 Meeting ID: 637‐929‐852 An agenda will be circulated prior to the call. Thanks, Bobbi Larson Executive Director CASA 1225 8th St, Suite 595 Sacramento, CA 95814 1 132 of 201 Office : 916.446.0388 ext 1 Cell : 916.798.7488 www.casaweb.org From: Roberta Larson <[email protected]> Date: Wed, 12 Nov 2014 11:31:53 ‐0800 Subject: Toxicity Plan Issues Hi all, For many months, there has not been much to report on the status of developing the state toxicity plan. Recent activity has centered on numeric toxicity limits and other requirements included in permits issued by the LA regional water board, including those of the Calleguas dischargers (which have been petitioned to the State Water Board) and two issued to LACSD facilities last Thursday. EPA Region 9 has taken the position that (1) numeric limits for chronic toxicity are legally required; (2) the state policy must include a single test numeric limit and may not rely on a monthly median (we understand the draft policy proposes the single test as a trigger not as a limit); and (3) the “safe harbor”provision we had negotiated to prevent a discharger from continuing to rack up violations during accelerated testing and the TIE/TRE process is also illegal. EPA has met with the State Water Board to articulate this position, and the Water Board lawyers are looking into these legal issues now. It is very concerning that EPA’s position may prompt the Water Board to revise the draft policy in a way that undermines all of the work that the state and regional associations jointly pursued with the Water Board to ensure that if the plan moves forward with numeric limits, the manner in which the limits are expressed and the associated implementation approach would protect against compliance jeopardy for dischargers who are doing what they can to address real toxicity. At the Clean Water summit meeting on Monday, we agreed that we will set up meetings with the individual State Water Board members in December to discuss our concerns. Prior to meeting with the State Water Board, we will convene by conference call to discuss our approach and agree on our message points. Please use the poll below to indicate your availability for the planning call no later than COB on Tuesday 11/19: http://doodle.com/m2eadd7eukbrb9si We will set the call at the date and time that works best for most. In the meantime, I will be contacting Water Board members to set the meeting dates and times. Bobbi Larson Executive Director CASA 1225 8th St, Suite 595 Sacramento, CA 95814 Office : 916.446.0388 ext 1 Cell : 916.798.7488 www.casaweb.org CONNECT WITH US: www.casaweb.org www.twitter.com/casacleanwater www.facebook.com/casacleanwater 2 133 of 201 3 134 of 201 October 10, 2014 Veronica Cuevas Los Angeles Regional Water Quality Control Board 320 West 4th Street, Suite 200 Los Angeles, CA 90013 VIA EMAIL [email protected] Subject: Bay Area Clean Water Agencies (BACWA) Comments on Tentative NPDES Permits for Whittier Narrows and Pomona Water Reclamation Facilities Dear Ms. Cuevas, The Bay Area Clean Water Agencies (BACWA) appreciates the opportunity to comment on the Tentative Orders issued to the Whittier Narrows and Pomona Water Reclamation Facilities. BACWA is a joint powers agency whose members own and operate publiclyowned treatment works (POTWs) and sanitary sewer systems that collectively provide sanitary services to over 6.5 million people in the nine-county San Francisco Bay Area. BACWA members are public agencies, governed by elected officials and managed by professionals who protect the environment and public health. As you are already familiar, the State Water Resources Control Board has been developing a toxicity plan with the goal to establish uniform toxicity requirements across the State. It is our understanding that the statewide plan will be adopted in the near future. As such, BACWA believes it is important to voice our concerns on the toxicity provisions included in the Tentative Orders, in order that they do not undermine the statewide effort in a manner that will adversely impact our member agencies. We support the comments that are being sent by the California Association of Sanitation Agencies (CASA), and reiterate these comments below. On behalf of our member agencies, BACWA requests that the Los Angeles Bay Regional Water Quality Control Board (Water Board) consider the following comments. 1. Adoption of Permits with Numeric Effluent Limits for Toxicity Is Premature and Contrary to Existing State Water Board Precedent Adoption of a permit that contains numeric effluent limits for toxicity and mandates use of the Test of Significant Toxicity (TST) in advance of the promulgation of a statewide policy on this issue is inappropriate and premature. As noted in comments submitted by the Sanitation Districts of Los Angeles County (LACSD), the current policy in effect for toxicity effluent limitations specifies inclusion of narrative effluent limitations with PO Box 24055, MS 702 • Oakland, CA 94623 • 415.308.5172 • www.bacwa.org Central Contra Costa Sanitary District • East Bay Dischargers Authority • City of San Jose • East Bay Municipal Utility District • City & County of San Francisco 135 of 201 triggers for initiation of toxicity identification and reduction evaluation (TIE/TRE) procedures, consistent with precedential State Water Board Order WQO 2003-0012. There, the State Water Board found that the applicability of final numeric effluent limitations in permits for wastewater treatment plants discharging to inland waters, bays and estuaries is a statewide issue that should be addressed in the statewide implementation plan (SIP). The State Water Board has been working with stakeholders, U.S. EPA and regional water boards to develop revised toxicity provisions for inclusion in a statewide water quality control plan through a public process. Release of a revised draft is expected soon for public comment. A statewide plan will achieve the State Board’s objective to establish a standardized approach to toxicity. Adoption of numeric effluent limits for toxicity in an individual Regional Board permit interferes with work being done at the state level. BACWA requests that the chronic toxicity limits contained in the tentative permits be removed and replaced with a narrative chronic toxicity limit and triggers, at least until such time as there is a comprehensive statewide toxicity plan. 2. Provisions Restricting How the TST Is Utilized Are Inappropriate and Entirely Inconsistent with Promulgated Methods and the Anticipated Statewide Plan A. Dischargers Must be Allowed to Conduct Multi-Concentration Tests, Dose Response Evaluations, and Use All 40 CFR Part 136 Testing Protocols for Compliance Purposes Several conditions within the permits improperly limit or restrict 40 Code of Federal Regulations (CFR) Part 136 required and recommended data evaluation procedures. Limiting the ability of a permittee to utilize the appropriate promulgated chronic toxicity testing protocols, including the availability of a multi-concentration test and dose response evaluations, will significantly increase the false positive rate when using the TST.1 Moreover, prohibiting such activities is inconsistent with what is expected to be contained in the statewide toxicity plan, and could result in confusion and the need to reopen this permit once such a plan is adopted. Numeric limits based on a single effluent concentration chronic toxicity test using the TST, as prescribed in the tentative permit will result in a substantial increase of tests with “false positives” incorrectly indicating violations occurred. Allowing a discharger to conduct multiple concentration tests and evaluate the dose-response relationship is a critical method-defined procedure for validating data that has been acknowledged to be inherently variable. In recognition of this, interpretation of the 40 CFR Part 136 methods has called for evaluation of the dose-response relationship as necessary for ensuring that test results are reported accurately, and why USEPA has in the past suggested that multiple concentration testing be conducted for all NPDES effluent compliance 1 See Pomona Permit at Part VII.J, p. 26, “…the concentration-response relationship for the effluent and/or PMSDs shall not be used to interpret the TST result reported as the effluent compliance monitoring result. While the Permittee can opt to monitor the chronic toxicity of the effluent using five or more effluent dilutions (including 100% effluent and negative control) only the TST result will be considered for compliance purposes.” 136 of 201 determination tests. Thus, BACWA concurs with LACSD in recommending that the permits be modified to include language to specifically allow the permittee to monitor chronic toxicity of the effluent using five or more effluent dilutions and utilize all 40 CFR Part 136 specified procedures, including evaluation of the dose-response relationship, to determine if results are reliable. These are common-sense quality assurance / quality control procedures that must be available to permittees. Moreover, it is anticipated that these procedures will be available under the terms of the statewide toxicity plan when it is released, meaning any restrictions in these permits will be inconsistent with statewide policy. B. Continued Monitoring for Compliance Purposes During Accelerated Testing is Inappropriate, and Does Not Serve to Address Any Underlying Toxicity Issues Toxicity is not a pollutant, but an effect that must be identified. BACWA has been working with State Water Board staff and numerous stakeholders across the State in developing the statewide toxicity plan, and it is our understanding that after an initial toxicity violation, accelerated testing and/or TIE/TRE implementation will occur. During that time no further violations should be incurred provided that the permittee conducts the required and appropriate actions to address the exceedance. Accelerated monitoring and the TIE/TRE process are established methods a discharger uses to investigate potential sources of the recorded toxicity event. Requiring that TST results be reported as effluent compliance monitoring during these accelerated monitoring schedules and initiation of the TIE/TRE is inappropriate, counterproductive, and should not be included in the tentative permit for Pomona or Whittier Narrows.2 Moreover, placing dischargers in immediate jeopardy of compliance violations is entirely inconsistent with what is expected to be contained in the statewide toxicity plan, and could result in confusion and the need to reopen this permit once such a plan is adopted. Dischargers should not be liable for continued toxicity violations after triggering accelerated testing and initiation of the TRE. BACWA appreciates the opportunity to comment on the Tentative Orders and thanks you for considering our concerns. Respectfully Submitted, David R. Williams Executive Director Bay Area Clean Water Agencies cc: BACWA Board 2 See Pomona Permit at Part V.8, p. E-15, “During the TRE Process, monthly effluent monitoring shall resume and TST results (“Pass” or “Fail”, “Percent Effect”) for chronic toxicity tests shall be reported as effluent compliance monitoring results for the chronic toxicity MDEL and MMEL.” 137 of 201 Certified 7009 2820 0000 7042 6045 August 12, 2014 File No. 31-370-40.4A Via Electronic Mail Mr. Sam Unger, Executive Officer California Regional Water Quality Control Board Los Angeles Region 320 West 4th Street, Suite 200 Los Angeles, CA 90013 Dear Mr. Unger: Comments Regarding USEPA Region IX’s “Pre-notice draft permits initial objection letter – NPDES permits for the Joint Outfall System’s Whittier Narrows Water Reclamation Plant (NPDES No. CA0053716) and Pomona Water Reclamation Plant (NPDES No. CA0053619)” On July 31, 2014, the United States Environmental Protection Agency, Region IX (EPA) filed the subject initial objection letter (Initial Objection Letter) on two NPDES permits up for reissuance for the Sanitation Districts of Los Angeles County (Sanitation Districts). In particular, the Initial Objection Letter disagreed with the lack of numeric effluent limits for chronic toxicity in the two pre-notice draft permits. The Sanitation Districts have reviewed the Initial Objection Letter and have concerns that the letter unfortunately is not fully correct with respect to the legal issues related to chronic toxicity effluent limits in these permits. To assist the California Regional Water Quality Control Board, Los Angeles Region (Regional Board) in its interpretation of the Initial Objection Letter, the Sanitation Districts are providing some additional legal information and analysis, prepared by its special counsel, as detailed below. 1. EPA’s Concern About the Toxicity Trigger is Misplaced. a. The Draft Permits Contain A Valid and Enforceable Chronic Toxicity Effluent Limitation. EPA expressed concern “that the proposed chronic toxicity effluent “limit” in the pre-notice draft permits is a “trigger” rather than an actual WQBEL [Water Quality Based Effluent Limit].” This concern is unfounded because the trigger is not the effluent limit. 1 The permits, as recognized on pages 2 and 3 of EPA’s letter, contain narrative effluent limitations for chronic toxicity, which state: “There shall be no 1 In addition, EPA guidance acknowledges the use of triggers for additional monitoring to confirm the presence of toxicity. “EPA recommends that regulatory authorities evaluate the merits of a step-wise approach to address toxicity. This approach can determine the magnitude and frequency of toxicity and appropriate follow-up actions for test results that indicate exceedances of a monitoring trigger or permit limit.” Understanding and Accounting for Method Variability in Whole Effluent Toxicity Applications under the NPDES System, EPA 833-R-00-003 at p. 7-4 (June 2000); 65 Fed. Reg. 44528-9 (July 18, 2000) (“EPA recommends that NPDES permitting authorities implement the statistical approach as described in the TSD [Technical Support Document] to evaluate effluent and to derive [Whole Effluent Toxicity] WET limits or monitoring triggers.”) 138 of 201 chronic toxicity in the effluent discharge.” Narrative limits meet the statutory requirements for being an “effluent limit” as it is a restriction on the discharge from a point source. 2 The Initial Objection Letter also states that the triggers and required additional actions in the NPDES permits do not meet the definition of “effluent limitation” under the Clean Water Act (CWA) because they do not establish a “restriction” on the “quantity, rate, or concentration” of pollutants in the effluent. In Water Quality Order (WQO) 2003-0012 at p. 10, the State Water Resources Control Board (State Board) cited a letter from EPA, dated June 25, 2003. This letter described the conditions under which EPA would consider a narrative effluent limit valid, described in WQO 2003-0012 as “US EPA has also stated that if a narrative effluent limitation is used, the permits must also contain (1) numeric benchmarks for triggering accelerated monitoring, (2) rigorous toxicity reduction evaluation (TRE)/toxicity investigation evaluation (TIE) conditions, and (3) a reopener to establish numeric effluent limitations for either chronic toxicity or the chemical(s) causing toxicity.” While the Sanitation Districts were not given an opportunity to review the pre-notice draft permits, as long as these elements are present EPA should find them to be acceptable. Regarding the question as to whether TRE/TIE requirements are “rigorous” and establish a restriction on concentration, the existing NPDES permits require preparation and approval of an initial TRE Workplan at the time of permit issuance. Furthermore, upon completion of this initial TRE workplan, if toxicity remains and is not sufficiently characterized, the Sanitation Districts have 15 days to submit a detailed workplan to the Regional Board including “a. Future actions to investigate and identify the cause of toxicity; b. Actions the Discharger will take to mitigate the impact of the discharge and prevent the recurrence of toxicity; and c. A schedule for these actions.” Furthermore, in WQO 2003-0012, the State Board held that the “addition of an enforceable narrative effluent limitation for chronic toxicity, along with the existing TRE/TIE requirements and the reopener for a numeric effluent limitation for chronic toxicity, if necessary, will ensure that the requirements to perform a TRE/TIE and to implement it to eliminate toxicity are clear and enforceable. We also expect that where the TRE/TIE indicates a pollutant is causing the toxicity, the Regional Board will reopen the permit to include numeric effluent limitations for that constituent.” WQO 2003-0012 at p. 10. Toxicity provisions in Regional Board NPDES permits issued since 2003 have been consistent with these State Board requirements. This State Board precedent has been in place for over 11 years without objection from EPA. b. The Proposed Narrative Effluent Limits and Supplemental Numeric Triggers are Consistent with Binding State Board Precedent. On September 16, 2003, the State Board adopted Order Nos. WQO 2003-0012 and WQO 2003-0013, in response to petitions filed by the Sanitation Districts for the Los Coyotes and Long Beach Water Reclamation Plant (WRP) NPDES permits [SWRCB/OCC File Nos. A-1496 and A-1496(a)] and the Whittier Narrows WRP NPDES permit [SWRCB/OCC File Nos. A-1509 and A-1509(a).]. In these precedential orders, the State Board found that the use of final numeric effluent limitations in permits for POTWs that discharge to inland surface waters was an issue of statewide importance that should be addressed in the statewide implementation plan (SIP). 3 In addition, the State Board replaced the numeric chronic toxicity effluent limitations with narrative chronic toxicity limitations until the SIP is modified. Thus, the numeric limits were deleted and replaced with: “There shall be no chronic toxicity in the effluent discharge.” A reopener was also added to allow inclusion of additional effluent limitations as needed to address toxicity. This is consistent with the language in the Sanitation Districts’ proposed draft permits and has been in all inland-discharging POTW permits statewide for over eleven years without objection by EPA until now. As previously stated, since the federal rules have not changed to justify this objection, EPA’s initial objection to these draft permits is not appropriate. 2 33 U.S.C. §1362(11). However, it is not clear whether this definition actually applies to toxicity, since it is not a constituent or pollutant, but instead an effect. 3 Prior to the issuances of these orders, the permits contained numeric effluent limitations with a daily maximum of 1.6 TUc and a monthly median of 1.0 TUc for chronic toxicity. 139 of 201 Moreover, because the SIP has not yet been modified, the 2003 precedential orders are still in effect. As such, the inclusion of new numeric chronic toxicity effluent limitations without authority to do so would violate State Board precedent and represent an abuse of discretion. The recent permits referenced by EPA in the Initial Objection Letter that were adopted by the Regional Board on May 8, 2014 and contain numeric chronic toxicity effluent limits have all been appealed to the State Board for these reasons.4 It should also be noted that the State Board has confirmed WQO 2003-0012 in at least two other more recent cases. See State Board Order No. WQ 2012-0001 (City of Lodi); Order No. WQ 2008-0008 (City of Davis). Thus, there are at least four precedential State Board orders mandating a narrative chronic toxicity limit. The Sanitation Districts also question why EPA is raising these objections now since EPA never objected to any of these other permits (e.g., Lodi, Davis, or any other California POTW permit) that were reissued after remand by the State Board. The Sanitation Districts believe that to make the permits more clear, perhaps the permits can be modified to move the language stating that “There shall be no chronic toxicity in the effluent discharge” from the section on “Chronic Toxicity Trigger and Requirements,” to the “Effluent Limitations” section. Then the trigger language can be part of the “Compliance Determination” steps to confirm compliance with the narrative effluent limitation. This would be consistent with WQO 2008-0008 at pages 6-7, which stated: “In Order WQO 2003-012, we stated that, pending adoption of a policy, it was not appropriate to include final numeric effluent limitations for chronic toxicity in NPDES permits for publicly owned treatment works, but that permits must contain the following: 1. 2. 3. 4. A narrative limit such as: “There shall be no chronic toxicity in the effluent discharge;” Numeric benchmarks for triggering accelerated monitoring; Rigorous toxicity reduction evaluation/toxicity investigation evaluation conditions; and A reopener to establish numeric effluent limitations for either chronic toxicity or the chemical(s) causing toxicity.” To the extent the Sanitation Districts’ draft permits contain these four items, EPA has no valid basis for objection at this time since this has been the State’s policy and procedure for such limits since 2003. 2. EPA’s Statements Regarding the Need for Numeric Limits are Mistaken. EPA states that “[e]ven if the requirements related to the aim of “no chronic toxicity” were expressed as a valid narrative WQBEL for WET [Whole Effluent Toxicity], the Regional Board has failed to justify how such a narrative requirement would achieve water quality standards, as would be the case with a numeric limit.” The Toxicity objective for chronic toxicity, as stated above is “[t]here shall be no chronic toxicity in ambient waters, outside mixing zones.” (Emphasis added.) The narrative effluent limit stating “[t]here shall be no chronic toxicity in the effluent discharge” (emphasis added) is more stringent than the objective, because it applies to the discharge itself and, therefore, will be protective of the ambient water even within any mixing zone. Thus, EPA’s statements that the narrative limit will not meet the objective or “is not as stringent as necessary for the discharge” are incorrect. Further, the inclusion of numeric limits does not necessarily mean that water quality standards will be achieved in the receiving waters given other inputs to those waters; numeric limits just generally make 4 EPA also references permits issued in Arizona, which are not precedential for California as state rules and policies differ between the states. EPA further references permits for POTWs not governed by WQO 2003-0012 in which toxicity limits are expressed numerically. These permits are apparently those for POTWs with ocean outfalls, which are covered under the California Ocean Plan. The California Ocean Plan specifically requires numeric toxicity effluent limitations when there is reasonable potential. Due to the high dilution factors applied to ocean discharges, along with use of different species to conduct the toxicity testing, the issues relating to toxicity control are fundamentally different that for discharges to inland waters. 140 of 201 for an easier comparison to a numeric objective. In this case, where no chronic toxicity is allowed in the receiving waters or in the effluent discharge, that comparison is just as easy. To the extent EPA is stating in its Initial Objection Letter that numeric limits are required, case law and other binding precedent holds exactly the opposite is true. Courts in California have resoundingly rejected any suggestion that effluent limitations are required to be numeric. The definition of “effluent limitation” in the Clean Water Act refers to “any restriction,” and may include a “schedule of compliance” (33 U.S.C. § 1362(11); 40 C.F.R. §122.2.) The term “schedule of compliance” means a “schedule of remedial measures,” including an enforceable sequence of interim requirements leading to compliance with an effluent limitation or standard (33 U.S.C. § 1362(17); 40 C.F.R § 122.2.) See accord Statement of Decision Granting Writ of Mandate, City of Tracy v. SWRCB, Sacramento Superior Court Case No. 342009-80000392 (2010) at p. 41 (case is binding on the Water Boards since not appealed). Thus, an effluent limitation could consist entirely of remedial measures, such as triggers to additional monitoring and a TIE/TRE and the addition of chemical-specific effluent limitations, as set forth in the current permit construct under WQO 2003-0012 and WQO 2008-0008. In addition, in the Communities fora Better Environment case, the First Appellate District Court of Appeal specifically rejected the argument that the federal regulations mandate numeric WQBELs. Instead, the Court found that Congress intended a “flexible approach” including alternative effluent control strategies. Communities for a Better Environment (“CBE”) v State Water Resources Control Bd. (2003) 109 Cal. App 4th 1089, 1105; Communities for a Better Environment v State Water Resources Control Bd. (2005) 132 Cal. App 4th 1313, 1318; see also Divers' Environmental Conservation Organization v SWRCB (2006) 145 Cal.App.4th 246, 262 (following Communities for a Better Environment.) Thus, numeric effluent limitations are not necessary to meet the requirements of the federal Clean Water Act. CBE, supra, 109 Cal.App.4th at p. 1093. Indeed, federal regulations expressly permit non-numeric effluent limitations such as narrative limitations, source control and other best management practices. 40 C.F.R. § 122.44(d)(1)(i) and (v)(discussing “Limitations” and “effluent limits for whole effluent toxicity” without using the word “numeric”) 5; 40 C.F.R. §122.44(k)(3); see also State Board Order WQ 2006-0012, p. 16 (“programs of prohibitions, source control measures, and BMPs [Best Management Practices] constitute effluent limitations and can be written to achieve compliance with water quality standards.”) 3. Binding Case Law Supports the Regional Board’s Interpretations Justifying its Approach. EPA’s letter states that “WQO 2003-0012 misinterprets 40 CFR 122.44(k)(3) – which provides that effluent limits may be other than numeric – because the WQO ignores the need to show the infeasibility of numeric WQBELs…. Absent a demonstration that numeric WQBELs are infeasible to calculate, the narrative WQBELs in these permits are inconsistent with regulatory requirements at 40 CFR 122.44(k)(3).” There are many problems with this statement, as follows: a. Section 122.44(k)(3) Does Not Apply Where the Permit Contains WQBELs. EPA regulations at 40 C.F.R. §122.44(k)(3) relate to the use of BMPs in lieu of numeric effluent limitations. This section is not discussing or authorizing narrative effluent limitations; it is authorizing BMPs. In this case, as discussed above, the permits contain valid narrative effluent limitations for chronic toxicity so section 122.44(k)(3) is not applicable. b. If Section 122.44(k) applied, there is no requirement that numeric effluent limitations be infeasible to calculate. 5 In fact, section 122.44(d) references “any requirements… necessary to (1) Achieve water quality standards…,” and does not limit these requirements to “effluent limitations.” 141 of 201 EPA states in its letter that “For the Whittier Narrows and Pomona permits, the L.A. Regional Water Board has not provided any explanation as to why it would be infeasible to calculate numeric WET limits for chronic toxicity.” EPA is using the language of section 122.44(k)(3) which allows BMPs in lieu of effluent limitations when “numeric effluent limitations are infeasible.” The words “to calculate” are not included in this regulation. Nevertheless, EPA apparently believes that feasibility turns on the ability and propriety of calculating or establishing numeric effluent limitations, rather than the ability of a discharger to comply. However, this argument is unfounded and is not supported by case law or any other authority. “It will nearly always be possible to establish numeric effluent limitations, but there will be many instances in which it will not be feasible for dischargers to comply with such limitations. In those instances, states have the authority to adopt non-numeric effluent limitations.” See City of Tracy Statement of Decision at p. 42. The CBE case made clear that one factor a board may consider in determining whether a numerical effluent limitation is “feasible” is the “ability of the discharger to comply.” See CBE, supra, 109 Cal.App 4th at 1100. The court expressly approved the regional board's consideration of this factor in upholding the determination that numeric effluent limits were not “appropriate” for the refinery at issue in that case. Id. at 1105 (approving determination that numeric WQBEL was not feasible “for the reasons discussed above,” which included inability of discharger to comply). In Natural Res. Def. Council, Inc. v. Costle, 568 F.2d 1369 (D.C.Cir.1977), the D.C. Circuit stressed that when numerical effluent limitations are infeasible to comply with, EPA may issue permits with conditions designed to reduce the level of effluent discharges to acceptable levels. This may well mean opting for a gross reduction in pollutant discharge rather than the fine-tuning suggested by numerical limitations. Id. at 1380, and at n. 21 (noting the proposition that Congress did not regard numeric effluent limitations as the only permissible limitation was supported by section 302(a) of the Act, 33 U.S.C. §1312(a)). Accordingly, Courts have rejected the argument that in determining the “feasibility” or “propriety” of numeric effluent limitations, the Board may not consider the ability (or inability) of the discharger to comply with such limitations. 6 The ability to comply is a critical factor in determining the “feasibility” or “propriety” of numerical limitations. City of Tracy v. SWRCB, Statement of Decision at p. 42. Regarding the ability to comply with numeric effluent limitations, the inherent variability of biological testing and the likelihood of false positive test results needs to be carefully handled or compliance will not be feasible. False positive results put the permittee in compliance jeopardy when the effluent is not really “toxic.” Any numeric effluent toxicity limitations must be carefully crafted, to recognize this inherent variability and potential for false positives. That is one reason the State Water Board has repeatedly, in four precedential orders with the most recent in 2012, indicated its preference for establishing the method of setting any numeric chronic toxicity effluent limits through a statewide process. On variability and false positives, EPA recognizes that “the precision of freshwater chronic toxicity tests is discussed in the representative methods sections in the methods manual (EPA/600/4-91/002). NOEC … is generally in the range of 30-60% [coefficient of variation].” See 60 Fed. Reg. 53533-4 (Oct. 16, 1995). This variation is similar to a range of non-detect to 2.2 TUc for any particular clean (method blank) 6 The State Board recognized the following in the June 10, 2003 draft of Long Beach/Los Coyotes Order No. 2003-0012 at page 10 (emphasis added): Because the influent can consist largely of domestic wastewater over which the District has little or no control, we find that a numeric effluent limitation should not have been used … for chronic toxicity. It is not feasible, at least initially, to impose numeric effluent limitations since it will result in a permit violation whenever there is toxicity in the effluent, even if the cause were from the domestic influent, the District had no basis for knowing the cause, and the District was pursuing the cause and its elimination through vigorous compliance with stringent TRE requirements. 142 of 201 sample, which is higher than almost all the Sanitation Districts’ data of exceedances of the current 1.0 TUc trigger. In addition, chronic toxicity tests have been shown to have 5-40% false failures (failing when there is no actual toxicity), further placing their regulatory usefulness in question and raising constitutional due process issues in the context of strict liability for permit violations. Even EPA itself has determined that “the accuracy of toxicity tests cannot be determined.” See Short Term Methods for Estimating the Chronic Toxicity of Effluents and Receiving Waters to Freshwater Organisms; EPA/600/4-91/002 at 139, 193, and 225 (July 1994). Even if there is only a 5% false failure level, with a monthly sampling requirement, this essentially guarantees at least one numeric effluent limit “violation” in the five year permit term, even if there is no actual toxicity for those incidents. This could constitute a violation that is subject to citizen suit enforcement. Without adequate consideration of false positives, it should be considered infeasible to set numeric limitations for toxicity. c. The State Board has held that Numeric Limits for Chronic Toxicity are Not Feasible or Appropriate. The State Board’s order, WQO 2003-0012 held the following, which was referred to by EPA. While numeric effluent limitations are generally preferred, NPDES permits can legally contain “best management practices” in lieu of numeric limitations where the permitting authority determines that numeric effluent limitations are not “feasible.” Order No. WQO 2003-0012 at p. 9 and fn. 25, citing 40 C.F.R. § 122.44(k); Communities for a Better Environment v. Tesoro (2003) 109 Cal.App.4th 1089; Natural Resources Defense Council v. Costle (D.C. Cir. 1977) 568 F.2d 1369; Order No WQ 91-03 (Citizens for a Better Environment). Under state law, “infeasible” is defined as “not capable of being accomplished in a successful manner within a reasonable period of time, taking into account economic, environmental, legal, social, and technological factors.” Cal. Water Code §8307(c)(4); see also SIP at Appendix 1-3. According to the State Board, when making its determination as to whether “numeric effluent limitations are infeasible,” the State Board stated: “The issue we will explore is whether the use of numeric effluent limitations for chronic toxicity is appropriate.” See WQO 2003-0012 at 9, fn 26, citing Tesoro, supra, slip opn., p. 18. The State Board has repeatedly found that the imposition of numeric limitations for chronic toxicity is not appropriate. See State Board Order Nos. WQO 2003-0012, WQ 2008-0008, and WQ 2012-0001. In the State Board Order No. WQ 2008-0008 (City of Davis), adopted on September 2, 2008, the Board concluded that a numeric effluent limitation for chronic toxicity was not appropriate in the permit under review, but that the permit had to include a narrative effluent limitation for chronic toxicity. These permits are consistent with that binding precedent. d. EPA Ignores the Existence of Section 122.44(k)(4). Section 122.44(k)(3), regarding infeasibility of numeric limits, is not the only exemption available. Subdivision (k)(4) authorizes BMPs where “the practices are reasonably necessary to achieve effluent limitations and standards or to carry out the purposes and intent of the CWA.” 40 C.F.R. §122.44(k)(4). Here, the trigger approach confirming toxicity and then, where toxicity is confirmed, performing a TIE and TRE represents BMPs that are reasonably necessary to determine the underlying source of toxicity to remedy that issue. Having numeric limits that merely result in the imposition of penalties for violation does not remedy any potential water quality issue, it just penalizes the sampling results. Thus, the BMP trigger approach is authorized under 40 C.F.R. §122.44(k)(4). 143 of 201 4. Daily Limits are Not Required by Law and Not Practicable for Chronic Toxicity. EPA’s letter states: “We agree with the permits’ fact sheets impracticability determination under 40 CFR 122.45(d) that a maximum daily WQBEL is necessary to protect against highly toxic short-term peaks of toxicity and meet water quality standards. Despite this determination, the permits do not include the necessary daily and monthly WQBELs for chronic WET. Therefore, the permits do not meet 40 CFR 122.45(d) or 40 CFR 122.44(d)(i).” EPA’s analysis is inaccurate. 40 C.F.R. Section 122.45(d)(2) requires “Average weekly and average monthly discharge limitations for POTWs.” Only if the weekly and monthly limits are demonstrated to be impracticable can other limits be imposed. 7 Here, the permits have determined that numeric limits are not feasible or appropriate (e.g., are impracticable), therefore weekly and monthly limits are not required. A narrative effluent limitation has been imposed instead stating that “there shall be no chronic toxicity in the effluent discharge.” Thus, this limit complies with both Section 122.45(d) and, for the reasons provided above, 122.44(d). A daily maximum limit is inappropriate for chronic toxicity, which is not either “highly toxic” or “short-term.” 8 Chronic toxicity testing is meant to assess long-term impacts to biological communities of organisms, not the impact of a single day’s discharge. Furthermore, use of a daily maximum chronic toxicity limit to protect against a single discharge event capable of exceeding the objective makes no sense when a single chronic test itself typically consists of three (3) or more discrete samples collected over an exposure period of up to nine (9) days. (See 67 Fed. Reg. 69953 (2002 Final WET Rule)(“short term methods for estimating chronic toxicity [ ] use longer durations of exposure (up to nine days) to ascertain the adverse effects of an effluent or receiving water on survival, growth and/or reproduction of the organisms.” (emphasis added).) Therefore, a short term average or daily maximum limit for chronic WET is impracticable and a chronic toxicity limit (as is recognized for other long-term chronic objectives, such as to protect human health) should be expressed only in narrative form “There shall be no chronic toxicity in the effluent discharge,” interpreted as a monthly average, or a median monthly if the monthly average is demonstrated to be impracticable. See accord In the Matter of the Own Motion Review of City of Woodland, Order WQO 2004-0010, 2004 WL 1444973, *10 (June 17, 2004) (“Implementing the limits as instantaneous maxima appears to be incorrect because the criteria guidance value, as previously stated, is intended to protect against chronic effects.” The limits were to be applied as monthly averages instead). Additionally, the preamble to the 2002 WET Rule says “EPA policy states that ‘EPA does not recommend that the initial response to a single exceedance of a WET limit, causing no known harm, be a formal enforcement action with a civil penalty.’” 67 Fed. Reg. 69968 citing EPA memo entitled National Policy Regarding Whole Effluent Toxicity Enforcement (1995a) (emphasis added). The appropriate response to a chronic toxicity test indicating the presence of toxicity is not to declare a violation, but to investigate the cause, starting with follow-up testing to confirm the initial result. (See accord 67 Fed. Reg. 69968 (EPA policy suggests additional testing is an appropriate initial response to a single WET exceedance); Basin Plan at 3-17 (recommending TIE to identify cause of toxicity prior to imposing effluent limitation to implement the narrative Toxicity objective); see accord Ocean Plan at pg. 45 (triggering TRE Process).) The permits appropriately set up that investigation process and should be upheld. Additionally, while state law generally does not require mandatory minimum penalties for violations of toxicity limits, exceedances of any limits are subject to discretionary enforcement by the Water Boards and to third party liability. 7 California courts have already held that daily limits are not allowed unless demonstrated with substantial evidence to be impracticable and these decisions are binding since not appealed. (See City of Burbank v. State Water Resources Control Board, 35 Cal. 4th 613, 623, n.6 (2005) (The Supreme Court held: “Unchallenged on appeal and thus not affected by our decision are the trial court’s rulings that… (2) the administrative record failed to support the specific effluent limitations; (3) the permits improperly imposed daily maximum limits rather than weekly or monthly averages;…)(emphasis added).) 8 While these terms may apply to acute toxicity, they do not describe chronic toxicity. 144 of 201 In conclusion, we hope that the Regional Board has found the information contained in this letter useful. We would be happy to answer any questions you may have or provide additional information. We look forward to working with you and your staff on the reissuance of NPDES permits for the Sanitation Districts’ water reclamation plants. Very truly yours, Grace Robinson Hyde Philip L. Friess Department Head Technical Services Department PLF:lmb cc: Deborah Smith – Los Angeles Regional Board 145 of 201 146 of 201 147 of 201 148 of 201 149 of 201 150 of 201 151 of 201 152 of 201 153 of 201 154 of 201 155 of 201 156 of 201 157 of 201 158 of 201 159 of 201 160 of 201 161 of 201 162 of 201 163 of 201 164 of 201 165 of 201 166 of 201 167 of 201 Sherry Hull From: Sent: To: Subject: Sherry Hull Tuesday, November 18, 2014 11:00 AM Sherry Hull FW: Ebola update From: Biosolids [mailto:[email protected]] On Behalf Of Greg Kester via Biosolids Sent: Thursday, November 6, 2014 3:01 PM To: '[email protected]' Subject: [CASA Biosolids] Ebola update Hello everyone – I wanted to provide you an update on where we are concerning recommendations for managing wastewater from patients ill with the Ebola virus. CDC has not yet issued their revised guidance but please see my message below which I sent to our workgroup following the webinar held by WEF on Tuesday November 4th. Of course, we remain very fortunate that these are academic discussions at this point since we have only 1 patient in the entire nation currently suffering from the virus. That also means that this is the correct time to analyze the data and make sound recommendations should the need arise. Please do let me know if you have questions and I will keep you posted as new information is released. I will also forward you the CDC guidance as soon as it is released. Thanks ‐ Greg Adapted Message from 11/4/14 “A point which I think needs to be made is that we continue to have conflicting messages on Ebola from very diverse sources. We have found a true lack of communication between health organizations, regulatory agencies, research organizations and individual researchers, and hospitals given the clearance to treat Ebola patients. There also appears to be a real communication gap between hospitals and wastewater plants destined to receive Ebola waste. There appears to be no consensus on critical questions regarding survivability, dose‐response, and means of denaturing the virus. Some claim Ebola cannot survive outside of its host for more than seconds or minutes while others maintain it may be hours or days and that no real data exists to know for certain. A Canadian Public Health Agency Fact Sheet notes four references stating that Ebola can survive in semen for between 61 and 82 days, which raises multiple questions on transmission of the disease. http://www.phac‐aspc.gc.ca/lab‐bio/res/psds‐ftss/ebola‐eng.php As an example of confusion between hospitals and wastewater plants, at Emory University Hospital, the wastewater plant thought the University was doing something completely differently that what did occur (double autoclaving and incineration versus bleach disinfection). In Madison WI, UW Hospital had initially informed their staff that fluids/waste from Ebola could be discharged to the sanitary sewer and that they had been in close contact with MMSD on this issue. Although there had been some dialog, MMSD had not taken an official position nor issued directives to local hospitals. The Wisconsin Department of Health Services subsequently issued Interim Guidance On The Safe Disposal Of Ebola Patient Waste In Sanitary Sewers http://www.dhs.wisconsin.gov/communicable/diseasepages/docs/DHSInterimGuidanceSafeDisposal.pdf . The interim guidance recommends pre‐treatment of Ebola patient waste with bleach prior to flushing. MMSD then contacted area hospitals and required them to follow the recommend procedure. All hospitals have indicated that they have incorporated this step into their operating procedures. Even on today’s webinar we had statements that Ebola would only survive for “minutes” in wastewater, while that has been disputed by many and no evidence has supported that assertion. Following both last Thursday’s and today’s webinar, I am convinced that CDC will state that it is fine to discharge Ebola patient wastewater directly to the sewer system without any treatment. They seem to base this on the fact that other pathogenic organisms are routinely 1 168 of 201 discharged to POTWs, including Hepatitis B. What they seem to not consider are numerous facts: (1) Many wastewater workers are required to have immunization shots for Hepatitis B; (2) we know so much more about survivability of Hepatitis B and other viruses than we do about Ebola and have comfort in their treatability, though we also know that workers have contracted Hepatitis B; (3) that we know virtually nothing about the survivability of Ebola in wastewater; (4) that it is so much more pragmatic to treat such wastewater at its source rather than require wastewater workers to wear Hazmat suits as part of their normal work day. As a former blue collar wastewater worker, I can attest that Hazmat suits and PPE’s will not be willingly utilized as an everyday precaution ( they may work on an emergency short term basis, but will be vehemently objected to as a routine procedure). I really think the wastewater community has to insist on denaturing of the Ebola patient waste prior to discharge to the sewerage system even if CDC refuses to do so. As has occurred at every hospital we have investigated to date, the sewerage system is requiring on their own that pretreatment occur. The level of pretreatment has varied, but it seems prudent for us to develop treatment recommendations as best as we can. I hope we can build upon a plan to develop a strategy which will mitigate the issue to the best of our ability prior to introduction to the wastewater system. Thanks again and I am happy to continue the discussion. – Greg” Greg Kester California Association of Sanitation Agencies Director of Renewable Resource Programs 1225 8th Street, Suite 595 Sacramento, CA 95814 PH: 916 446‐0388 Mobile: 916 844‐5262 [email protected] Ensuring Clean Water for California 2 169 of 201 198 of 201 199 of 201 200 of 201 201 of 201


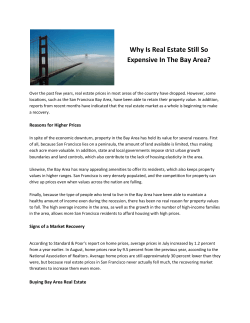

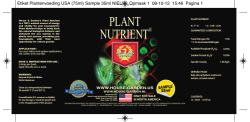


© Copyright 2026