
In the name of God
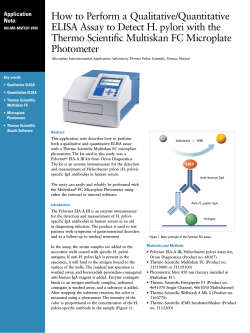
In the name of God Summer School Influenza Unit, Pasteur Institute of Iran summer 2014 PROTEINS Assay Methods (Protein quantitation) Behrokh.Farahmand Summer School INTRODUCTION Summer School Protein quantitation • • is often necessary prior to handling protein samples for isolation and characterization is a required step before chromatographic, electrophoretic and immunochemical analyses Summer School Proteins • Proteins are highly complex natural compounds composed of large number of . different amino acids Summer School Amino acids Summer School Levels of Protein Organization • Primary structure = linear chain of amino acids • • Secondary structure = domains of repeating structures, such as β-pleated sheets and α-helices • • • Tertiary structure = 3-dimensional shape of a folded polypeptide, maintained by disulfide bonds, electrostatic interactions, hydrophobic effects • • Quaternary structure = several polypeptide chains associated together to form a functional protein Summer School Summer School Physico-chemical properties of proteins • Shape • Size • Electrical charge Summer School Protein Estimation is a part of any laboratory workflow involving protein extraction, purification, labeling and analysis Summer School METHODS OF PROTEIN ESTIMATION Biuret method Folin- Lowry method Bradford method Bicinchoninic method UV method Flourimetric method Kjeldahl method Mass Spectrometry Colorimetrc assay Summer School Chemistry of Colorimetric Protein Assays • Copper-based Colorimetric Protein Assays: – Biuret Protein Assays – Lowry Assay – BCA Protein-copper chelation and secondary detection of the reduced copper • Dye-based Colorimetric Protein Assays: – Coomassie (Bradford) Assay Protein-dye binding and direct detection of the color change associated with the bound dye Summer School BIURET TEST By reducing the copper ion from cupric to cuprous form, the reaction produces a faint blue-violet color Summer School Biuret Test • Adventage • Reproduciple • Very few interfering agents (ammonium salts being one such agent ) • Fewer deviations than with the Lowry or ultraviolet absorption methods • Disadventage • Requires large amounts protein (1-20mg) • Low sensitivity Summer School Folin-Ciocalteu ( Lowry ) Assay Step 1 Step 2 Summer School Comparison of Lowry and Biuret Lowry reaction Summer School Bicinchoninic method Summer School BCA Test • • • • Adventage The color complex is stable There is less suceptibility to detergents Fewer deviations than with the Lowry or Beradford methods • Disadventage • Bicinchonic acid is expensive Summer School Dye-Binding ( Bradford ) Assay • • • • • • CBBG primarily responds to arginine residues (eight times as much as the other listed residues) If you have an arginine rich protein, You may need to find a standard that is arginine rich as well. CBBG binds to these residues in the anionic form Absorbance maximum at 595 nm (blue) The free dye in solution is in the cationic form, Absorbance maximum at 470 nm (red). Bradford, MM. A rapid and sensitive for the quantitation of microgram quantitites of protein utilizing the principle of protein-dye binding. Analytical Biochemistry 72: 248-254. 1976. Stoscheck, CM. Quantitation of Protein. Methods in Enzymology 182: 50-69 (1990). Summer School Mechanism of Dye response and interference in the Bradford protein assay Anionic dye Protonated or cationic amino acids Summer School Summer School Dye-Binding ( Bradford ) Assay • • • • • • • • • • Adventage Fast and inexpensive Highly specific for protein Very sensitive [1-20 µg (micro assay) 20-200 µg (macro assay)] Compatible with a wide range of substances Extinction co-efficient for the dye-protein complex is stable over 10 orders of magnitude (assessed in albumin) Dye reagent complex is stable for approximately one hour Disadventage Non-linear standard curve over wide ranges Response to different proteins can vary widely, choice of standard is very important Summer School Comparison of standard curve of Bradford, Lowry and BCA assays • In Bradford Absorption spectra of anionic(-) and cationic(+) forms of the dye overlap So the standard curve is non-linear. • The assay performs linearly over short concentration stretches. Summer School Selecting a Protein Assay & a Standard protein Summer School Important criteria for choosing an assay Compatibility with the sample type and components Assay range and required sample volume Protein-to-protein variation Speed and convenience for the number of samples to be tested • Availability of spectrophotometer or plate reader necessary to measure the color produced (absorbance) by the assay • • • • Summer School Selecting a Protein Standard • If a highly purified version of the protein of interest is not available or it is too expensive to use as the standard, the alternative is to choose a protein that will produce a very similar color response curve in the selected protein assay method and is readily available to any laboratory at any time. Summer School Examples of Standard Protein • Generally, bovine serum albumin (BSA) works well for a protein standard because it is widely available in high purity and relatively inexpensive. • Alternatively, bovine gamma globulin (BGG) is a good standard when determining the concentration of antibodies because BGG produces a color response curve that is very similar to that of immunoglobulin G (IgG). Summer School Standard Protein Selection Protein-to-protein variation of Thermo Scientific Pierce Protein Assays. For each of the protein assays presented here, 14 proteins were assayed using the standard test tube protocol. The net (blank corrected) average absorbance for each protein was calculated. The net absorbance for each protein is expressed as a ratio to the net absorbance for BSA (e.g., a ratio of 0.80 means that the protein produces 80% of the color obtained for an equivalent mass of BSA). All protein concentrations were at 1000µg/mL, except for those used in the Micro BCA Assay which were at a concentration of 10µg/mL. 1. Albumin, bovine serum BCA (Note 1) Micro BCA Modified Lowry Coomassie Plus Coomassie (Bradford) Pierce 660 nm 1.00 1.00 1.00 1.00 1.00 1.00 2. Aldolase, rabbit muscle 0.85 0.80 0.94 0.74 0.76 0.83 3. a-Chymotrypsinogen 1.14 0.99 1.17 0.52 0.48 — 4. Cytochrome C, horse heart 0.83 1.11 0.94 1.03 1.07 1.22 5. Gamma Globulin, bovine 1.11 0.95 1.14 0.58 0.56 0.51 6. IgG, bovine 1.21 1.12 1.29 0.63 0.58 — 7. IgG, human 1.09 1.03 1.13 0.66 0.63 0.57 8. IgG, mouse 1.18 1.23 1.20 0.62 0.59 0.48 9. IgG, rabbit 1.12 1.12 1.19 0.43 0.37 0.38 10. IgG, sheep 1.17 1.14 1.28 0.57 0.53 — 11. Insulin, bovine pancreas 1.08 1.22 1.12 0.67 0.60 0.81 12. Myoglobin, horse heart 0.74 0.92 0.90 1.15 1.19 1.18 13. Ovalbumin 0.93 1.08 1.02 0.68 0.32 0.54 14. Transferrin, human 0.89 0.98 0.92 0.90 0.84 0.8 15. a-Lactalbumin — — — — — 0.82 16. Lysozyme — — — — — 0.79 17. Trypsin inhibitor, soybean — — — — — 0.38 Average ratio 1.02 1.05 1.09 0.73 0.68 0.74 Standard Deviation 0.15 0.12 0.13 0.21 0.26 0.27 Coefficient of Variation 14.7% 11.4% 11.9% 28.8% 38.2% 37% Relative Uniformity High High High Medium Low (Note 2) Low Notes: 1. The BCA - Reducing Agent Compatible (BCA-RAC) Assay also produced a low coefficient of variation. 2. The Bio-Rad Bradford Protein Assay tested with the same proteins as our Coomassie (Bradford) Assay produced a very high coefficient of variation (46%), corresponding to very low relative uniformity Summer School Protein-to-Protein Variation(PPV) • PPV refers to differences in the amount of color (absorbance) obtained when the same mass of various proteins is assayed concurrently by the same method. These differences in color response relate to differences in: - amino acid sequence, - isoelectric point (pI), - secondary structure - and the presence of certain side chains or prosthetic groups. • Protein assay methods based on similar chemistry have similar protein-toprotein variation. Summer School Biosafety in protein assays • Wear Gloves and Labcoat • MSDS (Material Safety Data Sheet) Folin reagent, Phosphoric acid, … … Summer School Practical work • Bradford assay • Lowry assay Summer School Steps of assays • Standard solution preparation • Absorbance or Optical Density reading of Standards • Standard curve drawing • tgα calculation • Unknown sample estimation Summer School An example of Beer–Lambert law: green laser light in a solution of Rhodamine 6B. The beam intensity becomes weaker as it passes through solution Summer School Comments for standard preparation For greatest accuracy in estimating total protein concentration in unknown samples, it is essential to include a standard curve each time the assay is performed. • This is particularly true for the protein assay methods that produce nonlinear standard curves. • Deciding on the number of standards and replicates used to define the standard curve depends upon the degree of non-linearity in the standard curve and the degree of accuracy required. - In general, fewer points are needed to construct a standard curve if the color response is linear. -Typically, standard curves are constructed using at least two replicates for each point on the curve. • Summer School Sample Preparation for Protein Assays • it must be solubilized • inhibit microbial growth • avoid casual contamination of the sample by foreign debris such as dust, hair, skin or body oils. • After filtration or centrifugation to remove the cellular debris, typical samples will still include nucleic acids, lipids and other non-protein compounds. • nonprotein components (detergents, biocides or antimicrobial agents , protease inhibitors, different salts, denaturants, reducing agents and chaotropes) are critical for choosing an appropriate assay Summer School Strategies for interfering substance elimination • Choose a different protein assay method or a version of the same assay method that includes components to overcome the interference. • Dialyze or desalt the sample to remove interfering substances that are small (i.e., less than 1000 daltons), such as reducing agents. • Precipitate the protein in TCA or other appropriate reagent, remove the solution containing the interfering component, and then redissolve the protein for analysis. Summer School Instrument for Lowery assay Summer School Instrument for Bradford assay Summer School Calculations and Data Analysis Note: - Protein samples and standards are processed in the same manner by mixing them with assay reagent and using a spectrophotometer to measure the absorbances. - standards are used to plot or calculate a standard curve. - Absorbance values of unknown samples are then interpolated onto the plot or formula for the standard curve to determine their concentrations. Summer School Unknown sample concentration calculation • Direct calculation Absorbance values of unknown samples are then interpolated onto the plot • Indirect calculation formula for the standard curve to determine their concentrations. Summer School Standard Curve Summer School Indirect calculation Summer School Indirect calculation • C= Concentration • OD= Optical Density • tgα=Slope of standard curve • tgα=∆Cs/∆ODs • CX = tgα × ODX Summer School Thanks


© Copyright 2026