
High Throughput Screening Assay Development and Performance of the Oris™ Pro 384 Cell Migration Assay
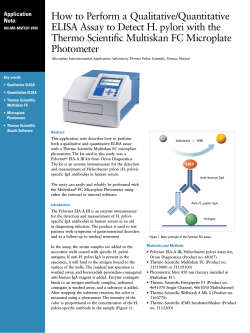
High Throughput Screening Assay Development and Performance of the Oris™ Pro 384 Cell Migration Assay
Jennifer A. Fronczak*, Laura Vollmer§, Gopal Krishnan*, and Andreas Vogt§
§University of Pittsburgh Drug Discovery Institute, 10047 BST‐3, 3501 Fifth Avenue, Pittsburgh, PA 15260, USA
*Platypus Technologies, LLC, 5520 Nobel Drive, Suite 100, Madison, WI 53711, USA
Abstract
Establishment of Minimum and Maximum Migration Controls
The discovery of anti‐metastatic agents that inhibit cancer cell motility has been
hindered by a dearth of high‐throughput screening (HTS) ‐compatible cell
motility assays. The Oris™ Pro 384 well cell migration assay, developed by
Platypus Technologies, is an innovative cell motility assay designed to enable
HTS for the discovery of potential anti‐cancer agents on adherent tumor and
endothelial cell lines. The assay utilizes a centrally located, non‐toxic,
biocompatible gel (BCG) to form a uniformly sized, cell‐free detection zone into
which cells migrate. The assay is logistically simple and does not require any
mechanical processing steps, such as cell wounding or removal of physical
barriers. The assay is fully compatible with laboratory automation, including
robotic liquid handlers, plate washers, and high‐content screening (HCS)
readers.
A
A formal investigation of the accuracy, robustness, and HTS performance of the
assay was conducted following guidelines in place at the University of
Pittsburgh Drug Discovery Institute (UPDDI). The assay was optimized for
migration kinetics, cell seeding density, and DMSO tolerance. In multi‐day
variability studies, the assay delivered signal‐to‐background ratios > 10 and Z‐
factors above 0.5 on three consecutive days, was insensitive to process errors or
edge‐effects, and passed UPDDI Assay Protocol Approval Committee (APAC)
criteria. The assay delivered equal HTS performance on two different HCS
platforms – the Thermo Scientific Cellomics ArrayScan II and the Molecular
Devices ImageXpress®Ultra.
Results from this investigation validate the Oris™ Pro 384 cell migration assay as
a logistically
l i ti ll simple
i l and
d information‐rich
i f
ti
i h cellll motility
tilit analysis
l i platform
l tf
th t
that
meets the demands of large scale compound screening.
Multi‐day Variability Studies
A
B
C
B
Assay Schematic
A
B
Figure 5: Multi‐day variability and reproducibility studies. Using two Oris™ Pro 384 plates of maximum and
minimum controls on three separate days, HTS performance parameters were calculated. The assay delivered
signal‐to‐background ratios > 10, Z‐factors above 0.5, and low intra‐ and inter‐plate variability on all 3 days (data
not shown). A. Scatter plots document that the assay performed well with full automation, with few process
errors and tight distribution of positive and negative control samples. B. Dose‐response reproducibility and
activity profiling of compound activity. The control inhibitor, Cytochalasin D, gave essentially identical IC50 values
of 65 nM, 90 nM, and 80 nM on three consecutive days. C. Multiparametric profiling of motility and toxicity,
derived from single channel measurements of nuclear morphology, revealed that Cytochalasin D is a selective
inhibitor of cell migration that slightly enlarges nuclei but does not cause apoptotic cell death or excessive cell
loss.
D
C
Compatibility With Multiple Instruments
Figure 1: Schematic of Oris™ Pro 384 Cell Migration Assay.
A. Cells are seeded and allowed to adhere in an annular monolayer surrounding
the Biocompatible Gel (BCG). B. BCG dissolves to reveal a cell‐free Detection Zone.
C. Cells migrate into the Detection Zone. D. Cells are imaged via microscopy or
High Content Imagers. Images are then analyzed for cell migration as well as
phenotypical changes.
HTS Workflow
Figure 3: Establishment of minimum and maximum migration controls. MDA‐MB‐231 cells were plated at
different densities in duplicate Oris™ Pro 384 plates. After 2h, cell culture medium was removed and cells were
treated with vehicle (0.5% DMSO) or 1μM Cytochalasin D. The “Pre‐migration” plate was immediately fixed and
stained with Hoechst 33342, while cells on the other plate (“2‐day migration”) were allowed to migrate for 48h at
37°C. Using a 5X objective on the ArrayScan II, an image was acquired in the center of each well, and nuclei
enumerated by the Thermo Scientific Cellomics Target Activation Bioapplication. A. Images illustrating migratory
phenotype. (Top row) Premigration plate with cell free detection zone. (Middle row) 2‐day migration plates
showing cell migration into detection zone, with optimal gap closure observed at 15,000 cells/well. (Bottom row)
Cytochalasin D fully inhibited cell migration. B. Quantification of cell migration. HTS assay performance
parameters were calculated based on number of cells in the exclusion zone comparing 2‐day migration and Pre‐
migration or Cytochalasin D‐treated
D treated wells as maximum and minimum controls,
controls respectively.
respectively Reproducibility of the
assay was determined by computing Coefficient of Variance (CV) and Optimum assay parameters ‐(i) Signal‐to‐
Background (S/B) ratios and (ii) Z‐factors assay performance, when cells were seeded at a density of 15,000 cells/
well, based on 48 wells per condition.
ArrayScan
ImageXpress® Ultra
Day 1
CV min (%)
32.7
44.1
Day 2
CV max (%)
S/B
Z‐factor
CV min (%)
6.3
19.1
0.74
35.1
8.6
26.7
0.68
44.6
Day 3
y
CV max (%)
S/B
Z‐factor
CV min (%)
6.5
14.1
0.71
44.4
7.7
31.7
0.68
58.6
ALL DAYS
CV max (%)
S/B
Z‐factor
CV min (%)
10.4
17.2
0.57
37.4
12.9
25.0
0.53
49.1
CV max (%)
Optimization of DMSO Tolerance
Cell seeding, media removal, washing Titertek MAP‐C2
Compound retrieval Matrical MiniStore
A
B
7.7
9.7
16.8
0.67
27.8
0.63
Figure 6: The Oris™ Pro 384 Cell Migration Assay is compatible with multiple HCS readers. The identical
microplates from the three‐day variability studies were rescanned on a Molecular Devices ImageXpress® Ultra
confocal point scanning HCS reader. A custom journal was generated that detected migrated cells in a circular
region of interest. The assay delivered essentially equivalent results on both HCS platforms.
Compound treatment Perkin Elmer EP3
Incubation S/B
Z‐factor
Conclusions
Fixation & Staining
Titertex MAP‐C2
C
• Results from a formal HTS development and implementation study indicate that the Oris™
Pro 384 Cell Migration Assay is a robust and convenient 2D cell migration assay, that is
compatible with robotic liquid handlers and HCS equipment for multi‐parametric analysis
• In stringent multi‐day variability assessment studies, the assay delivered Z‐factors > 0.5,
signal‐to‐background ratios > 10, and low intra‐plate and inter‐plate variability, thus
documenting HTS readiness
• The Oris™ Pro 384 Cell Migration Assay passed the University of Pittsburgh Drug Discovery
Institute Assay Protocol Approval Committee criteria and is currently used for chemical
library screening
Imaging & Analysis
Cellomics ArrayScan II
Multiplexing
Figure 2: HTS workflow for laboratory automation. The Oris™ Pro 384 Cell
Migration Assay is compatible with automated liquid handling equipment and
meets HTS performance parameters. The HTS workflow was developed and setup
using laboratory automation equipment as shown: Titertek MAP‐C2 bulk liquid
handlers, Perkin Elmer EP3 workstation for compound treatment, pipetting robots,
TC incubator and Cellomics ArrayScan II automated microscopy.
Figure 4: Optimization of DMSO Tolerance. Cells were treated with a ten‐point, two‐fold dilution gradient of
dimethyl sulfoxide (DMSO), and fixed and stained with Hoechst 33342 either immediately after treatment or after
2 days in culture. A. Concentrations higher than 0.3% DMSO had anti‐migratory activity, causing a drop in assay
performance. B. Inhibition of cell migration by DMSO did not appear to be a result of DMSO toxicity. C.
Quantification of assay performance parameters indicated that assay performance was stable up to 0.6% DMSO
and fell sharply thereafter. Results are based on 16 wells per condition. Based on these results, a concentration of
0.1% DMSO was chosen for further experiments.
Acknowledgements
This work was partially supported by IMAT grant # 5R21CA147985‐02 from the National Cancer Institute.


© Copyright 2026