
Statnett Submarine Fiber Evaluation
Statnett Submarine Fiber Evaluation Evaluation of Additional Submarine Fiber Cable Projects to the NSN and NordLink HVDC Projects June 2015 Version 1.0 3333 - Nexia Statnett Submarine Fiber Evaluation 2015 Title Statnett Submarine Fiber Evaluation Date and version June 2015 – Version 1.0 About this report The Statnett Submarine Fiber Evaluation report has been prepared by Jan Morten Ruud, Tore Røraas, Mikael Christiansson and Harald Wium Lie at Nexia Management Consulting AS on behalf of Statnett in the period from October 2014 to June 2015. Special thanks to We will like to thank the many experts that has shared their insight with us through interviews, phone calls and emails. About Nexia Management Consulting AS Nexia Management Consulting AS is a management consultancy with expertise in telecommunications, ICT infrastructure and technology. Nexia Management Consulting AS provides expertise in business analysis, strategy development, business development and management to the telecommunications, ICT infrastructure and technology sector. Disclaimer Information and opinions contained in this publication is provided by the authors and by Nexia Management Consulting AS, and does not necessarily represent the opinions of Statnett. This report is based on information from Statnett, publicly available information and information from sources deemed to be reliable. Nexia has not been able to verify the information in many cases, and cannot guarantee for the correctness of the information. All rights are reserved. 2 - Nexia Statnett Submarine Fiber Evaluation 2015 Content 1 1.1 1.2 1.3 1.4 INTRODUCTION ....................................................................................................................5 Our Scope .............................................................................................................. 5 Fiber Alongside the HVDC-cable Projects.............................................................. 6 Sources and Methods ............................................................................................ 6 Limitations ............................................................................................................. 7 2 EXECUTIVE SUMMARY .........................................................................................................8 3 3.1 3.2 3.3 3.4 3.5 3.6 MARKET ANALYSIS ............................................................................................................ 11 Introduction......................................................................................................... 11 International Capacity and Internet Transit ........................................................ 12 International Data Center Services ..................................................................... 17 Oil and Gas Sector Demands ............................................................................... 20 General national interests ................................................................................... 21 Market for NordLink and NSN fiber .................................................................... 23 4 4.1 4.2 4.3 4.4 4.5 4.6 TECHNOLOGY .................................................................................................................... 25 Introduction to Fiber Communication ................................................................ 25 System Components............................................................................................ 29 Manufacture, Freight and Loading ...................................................................... 29 The Installation Process....................................................................................... 30 The Operation of Bundled Cables ....................................................................... 31 Comparable Fiber Sea Cable Systems ................................................................. 34 5 5.1 5.2 5.3 5.4 ALTERNATIVES AND ASSUMPTIONS ................................................................................. 36 About the Fiber Alternatives ............................................................................... 36 Method for Benchmarking .................................................................................. 37 Calculation of Payback and Net Present Value ................................................... 37 Sensitivity Analysis .............................................................................................. 38 6 6.1 6.2 6.3 6.4 POTENTIAL NORDLINK FIBER PROJECT ............................................................................. 40 The NordLink Project ........................................................................................... 40 The NordLink Fiber Project .................................................................................. 42 Summary of figures ............................................................................................. 45 Synergies and Sensitivities .................................................................................. 47 7 7.1 7.2 7.3 7.4 POTENTIAL NSN FIBER PROJECT ....................................................................................... 50 The NSN Project................................................................................................... 50 The NSN Fiber Project ......................................................................................... 52 Summary of figures ............................................................................................. 55 Synergies and Sensitivities .................................................................................. 56 8 RISK ELEMENTS ................................................................................................................. 59 8.1 Risks Related to the Power Cable Project when Bundled with Fiber .................. 59 8.2 Risks Related to the Fiber Cable Project when Bundled with the Power Cable Project ............................................................................................................................. 61 8.3 Issues for Consideration ...................................................................................... 62 9 9.1 9.2 9.3 DISCUSSION AND RESULTS ............................................................................................... 64 NordLink Discussion and Results ......................................................................... 64 NSN Discussion and Results................................................................................. 66 Discussion and Results Related to Our Scope ..................................................... 68 10 LIST OF SOURCES .............................................................................................................. 73 3 - Nexia Statnett Submarine Fiber Evaluation 2015 APPENDIX I - METHODOLOGY ..................................................................................................... 74 APPENDIX II – ASSESSMENT OF TERMINATION POINTS ............................................................. 76 APPENDIX III - BASIS FOR MARKET SIZE ...................................................................................... 80 APPENDIX IV – SENSITIVITY DATA ............................................................................................... 81 4 - Nexia Statnett Submarine Fiber Evaluation 2015 1 Introduction 1.1 Our Scope Statnett vurderer å legge undersjøisk fiberkabel sammen med HVDC-kabler på hhv 516 og 750 km mellom Norge og Tyskland og Norge og England. I den forbindelse skal følgende problemstillinger analyseres: I hvilken grad det er praktisk gjennomførbart å etablere fiberkabler uten at signalene må regenereres. Hvilken risiko og driftsmessige konsekvenser som en samleggning av fiberkabler med HVDC-kabel vil ha. Realistiske nivåer for etablerings- og driftskostnader som et fibernett med og uten regenerering av signaler vil ha. Hvilke markedsmuligheter som finnes for salg av mørk fiber og/eller optiske kanaler til aktører i telebransjen. Oppdragsmottaker må gjennomføre minst 5 intervjuer med leverandører og/eller tekniske eksperter og minst 3 intervjuer med aktører i telebransjen i tillegg til intervjuer med Statnett sitt drifts- og prosjektmiljø. Leveransen skal dokumenteres i form av en rapport som inneholder tekniske vurderinger om fiberkablene med tilhørende kalkyle for inntekter og kostnader med og uten regenerering av signaler. Rapporten skal ha en kvalitet som gjør den egnet for offentliggjøring, og kalkylene skal ha en detaljeringsgrad på linje med andre offentlig tilgjengelige rapporter om investeringer i telenett (se f.eks. rapporten «Kostnadsanalyse –bredbåndsdekning i ulike varianter» som Nexia utarbeidet for Fornyingsdepartmentet i 2013). Our translation to English: Statnett considers the installation of fiber optic cables alongside HVDC-cables of respectively 516 and 750 km between Norway and Germany and Norway and England. The following problems shall be analyzed: To which degree it is technically viable to establish fiber cables without amplification. Identification of the risks and operational consequences of a bundled installation of HVDC and fiber cables. Identification of realistic levels of investment and operational costs that a fiber network with or without amplification will have. Which market opportunities that exist for sale of dark fiber and/or optical wavelengths to telecom customers. The recipient of the assignment shall perform at least 5 interviews with equipment suppliers and/or technical experts and at least 3 interviews with telecom providers, in addition to interviews with Statnett’s operations and project groups. The deliverables shall be a report containing technical considerations of fiber cables with estimates on potential income and costs, with and without amplification of signals. The report shall have a quality that makes it suitable for being made public, and the estimates shall have a level of detail in line with other available reports on investments in telecom networks (reference made to Nexia’s report on costs of broadband coverage by technology, made for the Norwegian Ministry for Reform in 2013). In addition, the scope has been extended to cover: Cost of standalone fiber systems for reference purposes 5 - Nexia Statnett Submarine Fiber Evaluation 2015 The distances have been adjusted to 521 and 730 km for NordLink and NSN respectively in this report. 1.2 Fiber Alongside the HVDC-cable Projects Statnett, the Norwegian grid operator, has recently been granted consent by the Norwegian government to install two high-voltage direct current (HVDC) cables between Norway and Germany (jointly together with Tennet and KfW) and Norway and UK (jointly together with National Grid). The HVDC-cables are hereafter called the “power cables”. The planned power cables are illustrated in Figure 1. This report considers the technical and commercial viability of installing fiber optic telecommunication cables (hereafter “fiber cables”) alongside (and physically bundled) to the power cables. Statnett and its partners have, for operational purposes, planned using other means of telecommunication than a separate fiber cable along the power cable. The internal operational needs of Statnett and partners are therefore not part of the business case for the fiber cable. Figure 1 The NordLink and NSN Cable Paths 1.3 Sources and Methods We have collected data from several sources: Information supplied by Statnett Third parties such as potential suppliers, customers and experts Open sources, internet web pages, etc. Background information held by Nexia 6 - Nexia Statnett Submarine Fiber Evaluation 2015 The data has been compared between sources for validity. Nexia has conducted interviews with: Suppliers of fiber sea cable and telecom equipment Telecom operators Potential customers Data center providers Statnett employees Other experts A list of organizations is included in Chapter 10. We have not been able to interview cable suppliers that are involved in Statnett’s power cable project due to ongoing negotiations related to the NSN project. 1.4 Limitations The data that is the base for the market assessment is not publicly available. The market is small and terms and conditions can vary significantly between markets, customers and service levels. Our market assessment has been conducted on a general level, and a search for potential investors or customers (in a possible bundled fiber cable along NordLink or NSN) has not been included in our scope. Product information and methods of fiber cable systems are specialized and applied in small numbers, and some may even be on the scientific frontier, which means that data is difficult to assess and compare. Furthermore, some of the information collected is under non-disclosure agreements. It is therefore significant room for interpretation of data, and general descriptions cannot cover the full aspects of this area. As a result, it is possible to find examples that show deviations from the trends and developments that are described in the report. Our scope has not included an assessment of probabilities and consequences of risk elements, nor mitigation or handling of risks. 7 - Nexia Statnett Submarine Fiber Evaluation 2015 2 Executive Summary Nexia’s scope of work has four distinct topics and we have taken a broad view to answer them. We have interviewed experts from 27 different organizations, considered different technical alternatives related to the power cable routes, and in addition, deviations from the power cable routes in order to investigate potential benefits. Furthermore, we have evaluated the market for new fiber cables, and been in contact with several vendors to obtain data on the cost elements for fiber cable systems. We have worked closely with Statnett to understand the power cable projects and the challenges arising from a bundled power and fiber cable. Finally, we have built a financial model with market and income prognosis, investment and operational costs to be able to calculate net present values of the fiber alternatives. We have summarized risks, but have not assessed the risks or considered remedies. Closely connected to our scope, but not explicitly given, is the question of whether Nexia finds bundled fiber cables to NordLink and NSN to be profitable and commercially viable. We find clear cost synergies of bundling the power and fiber cable, but even large synergies are not sufficient to result in a positive business case by itself. Compared to the NordLink and NSN bundled fiber cable alternatives, we find that existing fiber cables and potential other standalone fiber cables carry less risk elements and are more economically attractive and competitive. Scope (a): To which degree is it practically viable to establish fiber cables without signal amplification. For NSN and NordLink, it is not practically viable to establish fiber cables without amplification. Nexia considers it practically viable to establish a passively amplified fiber cable bundled to NordLink, but with significant limitations in the available capacity which reduces the commercial attractiveness. A passively amplified fiber system with the length of the NordLink route of 521 km will be approximately 20% longer than any previously installed passively amplified system. For NordLink, a passively amplified system without capacity limitations can only be obtained by deviating from the NordLink route and make a landfall in Denmark. This would however include an 80 km standalone fiber route, outside the scope of Statnett’s power cable project, from the NordLink cable to the landfall in Denmark. For NSN it is not practically viable to establish a bundled fiber cable with passive amplification due to the distance of 730 km. By deviating from the original route and enter the fiber cable to an oil or gas platform close to the route (and by installing repeater equipment at the platform), passive amplification technology can be practically viable. The installation of an actively amplified system bundled to the NordLink and NSN power cables may be practically viable, even though such a solution has not been installed to date. There are several areas of risk related to installation and design of an active amplified system compared to passive amplified and unamplified systems. However, some of the expert interviewed say the technical challenges can be solved, while other discourage a bundled active amplified solution. Scope (b): What are the risks and operational consequences of a bundled installation of an HVDC and a fiber cable. Risks to a bundled installation are related to the complexity during installation, operation, maintenance and repair, and commercial risk of the fiber cable investment. 8 - Nexia Statnett Submarine Fiber Evaluation 2015 The installation risk is related to the bundling of the cables during laying and protection at the seabed and landfall. The fiber cable will in all alternatives involve splice boxes or other items along the cable, which need to be handled specially during burial at the seabed. The complexity and risk elements in the shallow water area close to the German shore of NordLink, will be a challenge. Potential use of active amplification bundled to a power cable has not been done before, and involves several technical risks. Risk and complexity during operation and maintenance is mainly related to the case where either or both of the fiber and power cable are physically damaged, and in need of repair. Any repair or maintenance of only the fiber cable will most likely need to be performed in the maintenance periods of the power cable, which typically is once a year, and will involve risks to both the fiber and the power cable. There may be cases of fiber cable failure that are not possible to repair, or that cannot be carried out because of the risk of damage to the power cable. The commercial risk of a fiber cable installation is related to the highly competitive market for international capacity out of Norway. Continuous strong growth in capacity demand, combined with decreasing prices, creates market risks and opportunities that need to be handled. We have not assessed the risks’ probabilities and consequences, and neither potential remedies. Some of the risks we have identified are complex and some technical risks may not have welldeveloped remedies. The investment costs and business cases presented must be seen in relation to the risks related to the various alternatives. Scope (c): Find realistic levels of investment and operational costs that a fiber network with or without amplification will have. Cost of a standalone fiber system for reference purposes. Budgets on potential income and costs. We have estimated the investments and operational costs as well as revenues for three fiber cable alternatives for NordLink, and three alternatives for NSN. The construction cost for the alternatives are in range of NOK 131–168 million for NordLink and of NOK 195–210 million for NSN. The standalone benchmarks are in the range of NOK 107–307 million for NordLink and NOK 364 million for NSN. There are uncertainties connected to cost and revenue estimates since they are not based on firm offers. The low-cost standalone benchmark for NordLink involves crossing of Skagerrak (which is significantly shorter than NordLink), and using terrestrial fiber onwards, giving approximately a NOK 24 million lower investment than the lowest cost alternative. Nexia has not planned this benchmark in detail and found whether it may serve the same market and obtain the same market share as the alternatives. The model assumes the same revenue streams for all alternatives and standalone benchmarks. In our model each fiber cable will obtain an annual revenue of NOK 7.4 million by 2024, and have an OpEx between NOK 1.5 and 3 million annually. Scope (d): Which market opportunities exist for the sale of dark fiber and/or optical wavelengths to telecom customers Our model shows that a “fair” share of the international capacity market out of Norway is not enough to enable a profitable business case. The whole or a large share of a potential fiber cable investment must be secured from anchor customers or other partners in order to make an economically viable business case. 9 - Nexia Statnett Submarine Fiber Evaluation 2015 Nexia estimates that the Norwegian market for international fiber-based capacity is worth approximately NOK 39 million in 2015. The market is growing, and we assume a market value of around NOK 140 million in 2050. During the last 15 years, the price of capacity has fallen steadily and traffic volumes risen exponentially. Nexia consider the international capacity market between Norway and neighboring countries in Northern and Western Europe to be generally well served today with a significant number of providers. There is a significant over-capacity in all international routes out of Norway, especially from the Oslo area. Other areas have less options and competition. The south and west of Norway where the NordLink and NSN have landfall, are among these. Our scenario describes a market where the current development continues for the next 35 years. Even if a possible NordLink and NSN fiber cable takes its relative fair share of the market (one cable in addition to existing 12, which is equivalent to an 8% market share for each cable), all alternatives have a negative business case. In our financial model, we have not included any payments from anchor customers or other partners. We have received opinions pointing at potential international data center customer in south and west of Norway that could be a source of such financing. We have not received sufficient details in order to include such funding in our model. Furthermore, a potential customer will compare the alternatives to NordLink and NSN (i.e. standalone cables and capacity in existing cables), and Nexia finds the alternatives to be competitive. The business case for the NordLink fiber cable is less financially attractive than a standalone crossing of Skagerrak, as seen in our benchmark calculation of the shortest route. In addition, the two existing fiber cables crossing Skagerrak and the two Tampnet cables to the UK will have a competitive and financial advantage to the NordLink and NSN fiber project. On this basis, Nexia find that a NordLink and NSN fiber project should secure full financing (CapEx, OpEx and risk coverage) of the cable projects prior to start-up. 10 - Nexia Statnett Submarine Fiber Evaluation 2015 3 Market Analysis 3.1 Introduction There exist no public statistical data on the total market for international transmission capacity out of Norway. Nexia has therefore collected data on market prices and volumes from experts during interviews and from available sources on international markets. We have further aggregated this data and discussed the results with same and other experts and made corrections. The figures of the addressed market size and growth rates are therefore Nexia’s analysis. The names of our expert sources are included in Chapter 10. For the scope of the report, we consider four relevant markets and stakeholders: 1. 2. 3. 4. International capacity and Internet transit International data center services Oil and gas sector demands General national interests The total market of large transmission capacity between Norway and neighboring countries is estimated by Nexia to be approximately NOK 39 million in 20151. The price of capacity has fallen steadily while traffic volumes have risen exponentially. We consider the International capacity market between Norway and neighboring countries in Northern and Western Europe to be generally well served today with a significant number of providers and competitive prices. Cisco published recently a report on growth of global and regional IP traffic, showing an annual growth rate of peak traffic at 37% in 2014.2 Industry experts, that Nexia considers trustworthy, indicated that during recent years the annual unit volume growth in capacity has been even higher and around 50%. Cisco also notes that peak traffic has a higher growth rate, and underlying capacity requirements may very well have a higher growth rate than IP traffic. Nexia finds that the 50% growth rate in international capacity corresponds well to development in unit price that has been falling at around 30% annually.3 This gives a total market turnover growth of 5% annually. Nexia believes the current trend in volume growth and price reduction will continue during the next years. The market is now shifting from transmission equipment based on 10 or 40 Gigabit per second (Gbps) channels to equipment that enables 100 Gbps. We believe this will be concluded within 5-8 years as transmission equipment is upgraded. In a ten-year perspective (or more), it is uncertain how transmission equipment will develop beyond 100 Gbps. Based on information from our sources, we believe equipment will continue to deliver increased capacities also in the long term. The modeling of this development4 is therefore based on a continued increase in demand and supply until 2050 which we consider is the end-of-life of the fiber cable. 1 See Section 3.2.1 2Cisco, Visual Networking Index, May 2015. http://www.cisco.com/c/en/us/solutions/collateral/serviceprovider/visual-networking-index-vni/VNI_Hyperconnectivity_WP.html 3 http://drpeering.net/white-papers/Internet-Transit-Pricing-Historical-And-Projected.php 4 See Section 3.2.2 11 - Nexia Statnett Submarine Fiber Evaluation 2015 Furthermore, the model uses a fixed rate of 7% as the annual price reduction for new equipment related to unit capacity. This corresponds to the average long-term decrease in the price of capacity. There are large regional differences with regards to availability of international routes and pricing. Outside the Oslo area, the choice and competition for international capacity is significantly reduced. This has minor consequences for smaller bandwidth demands and most customers. However, it may have an important impact for internationally oriented data centers. 3.2 3.2.1 International Capacity and Internet Transit Current Situation The market for international capacity and Internet transit enables the core and backbone of the Internet. There are approximately 8-10 independent and competing companies that controls the major share of backbone traffic between and from northern European cities. Internet transit is a wholesale service that gives access to the global Internet, and international providers sell this service to national or regional providers. The largest operators use peering (non-paid exchange of Internet traffic) which makes up a large part of the total traffic. In this report, capacity means dedicated transmission at a given bit rate between two points which is offered as a service for lease. Capacity is here limited to being optical channels (wavelengths) in a transmission system without protection (no protection implies that if the link breaks, no capacity is available for the user).5 Capacity is often offered as two geographically separated links or in a ring topology in order to provide redundant communication. There are several routes of fiber cables between each major city in northern Europe. Each route consists of tens of cables, and each cable typically consists of 96 or 144 fiber strands. Only a small share of the fibers is taken into use. One fiber pair (two strands) has a typical maximum capacity of about 150 optical channels and a new channel can be taken into use with a marginal investment in the end-point equipment. 10 Gbps capacity is the basic capacity of optical channels in transmission networks today, with some systems operating on 40 Gbps channels. The market is starting a shift to 100 Gbps channels. However, as the price of 100 Gbps equipment is still high, it will take several years before equipment prices comes down and 100 Gbps becomes the standard. It is also important to point out that 10 Gbps is currently sufficient (as aggregated capacity) to serve a medium-sized Norwegian city with all telecom use. Based on expert interviews we have estimated the Norwegian peak Internet international transit and peering traffic in 2014 to be approximately 500 Gbps. Furthermore, it is assumed that all Internet traffic is based on dual routes, with one route being redundant to the other. This indicates a market volume of 1 000 Gbps transport capacity. We also assume that non-Internet international traffic is half of this volume. This gives a total Norwegian international capacity demand of about 1 500 Gbps for 2014 which is used as a starting point for our prognosis. The price of a 10 Gbps connection between major cities in North Europe has fallen significantly during recent years. This is primarily due to a large capacity surplus in most installed routes but 5 “Capacity” is a term that also may include small bandwidth delivered between any two points in the world. Such small bandwidth capacity services is not relevant for our scope, as capacity in a potential fiber cable bundled to NordLink and NSN will be a wholesale offer that will not be able to address small bandwidth demand. 12 - Nexia Statnett Submarine Fiber Evaluation 2015 also because of a steady fall in equipment prices. Data series on 10 Gbps pricing are not publicly available, but it is generally known to be correlated with the pricing development of Internet transit. Based on US figures, we estimate that the unit price for capacity has fallen 30% annually the last years.6 Existing international cables and routes from Norway to neighboring countries include both terrestrial and sea cable routes (a general overview is illustrated in Figure 2). To our knowledge, all routes in operation have spare capacity. The list may not be exhaustive, and routes may not be fully diversified (have physically separated cables):7 1. Scandinavian Ring via Sweden Two routes built by Telia IC, owned by TeliaSonera with several fiber users. 2. "Utfors ring" via Sweden Two routes built by Utfors, with several fiber/duct users. Owned by Telenor. 3. Railroad routes to Sweden Two routes operated by Trafikverket/Broadnet and probably also Telenor/TeliaSonera. 4. Overhead power line routes to Sweden Two routes operated by Triangelbolaget/Broadnet. 5. Sea cable Denmark-Norway 5 Owned by TDC/Telenor 6. Sea cable Norsea Com, Norway – UK Owned by Tampnet 7. Sea cable Tampnet and CNSFTC, Norway – UK Owned by Tampnet 8. Skagerrak 4, fiber along power cable, Norway – Denmark Owned by Statnett In addition, there are connections between Norway and Sweden from the Trøndelag and Nordland counties. We believe these are primarily used for diversity between north and south of Norway, and carry limited international traffic. 6 http://drpeering.net/white-papers/Internet-Transit-Pricing-Historical-And-Projected.php 7 http://news.cision.com/se/telia/r/telia-international-carrier-forst-med-skandinaviskt-nat,e33078 http://www.realtid.se/ArticlePages/200711/26/20071126190401_Realtid063/2007 http://www.trafikverket.se/Foretag/Natkapacitetstjanster/ http://triangelbolaget.se/ http://www.tampnet.com/north-sea/ 13 - Nexia Statnett Submarine Fiber Evaluation 2015 Figure 2 International Cables Between South of Norway and Neighboring Countries Many of the routes are not heavily used for international capacity. Nexia has reason to believe routes number 1 and 2 carry the overwhelming share of Norwegian International traffic as of today. 3.2.2 Prognosis for Capacity Development We expect that ongoing shift from 10 to 100 Gbps technology will continue to reduce the price of international capacity at the current rate of 30% per year. On the other hand, the demand for capacity has grown internationally by about 50% annually, giving a growth of 5% of the total market turnover. We believe this trend is likely to continue the next five years. The growth rate in the international capacity market includes capacity of national-oriented data centers, the oil and gas sector and other users. We have assumed a growth in installed capacity of 40% annually.8 This growth rate implies that total system capacity will tenfold within seven years. The reinvestment period for such equipment is between 5 and 10 years. The total market revenue includes international peering between providers, even when peering does not involve pricing of exchanged capacity. The prognosis probably overestimates market value for that reason. 8 “Installed capacity” refers to the total capacity each lit fiber can transmit in installed systems (with marginal cost for upgrades of new channels). 14 - Nexia Statnett Submarine Fiber Evaluation 2015 Table 1 shows a market with significant over-capacity and a small share of the installed capacity in use. Furthermore, the installed capacity can be increased easily as there are hundreds of unused fibers and even spare ducts for more cables. The total installed capacity mentioned above can therefore be multiplied by a factor of 10 (or 100) at a low cost per Gbps if demand increases. Prognosis for capacity between Norway and neighboring countries Shows unprotected (radial) large capacity only (10 and 100 Gbps) Year Net use in Unit value in Annual value Estimated As % of total Gbps radials NOK per in NOK million total installed month capacity 2014 1 500 20 000 36 12 800 12% 2015 2 300 14 000 39 18 000 13% 2016 3 500 9 800 41 25 000 14% 2017 5 300 6 900 44 35 000 15% 2018 8 000 4 800 46 49 000 16% 2019 12 000 3 400 49 69 000 17% 2020 18 000 2 400 52 97 000 19% Internet transit is assumed to be 2/3 of total use, other wholesale capacity 1/3 Total capacity is based on 8 DWDM systems of 80 x 10 Gbps wavelengths in two routes Calculation made by Nexia Table 1 International Capacity Prognosis (source: Nexia) After 2020, we have assumed in the model that the market will change from exponential growth to linear growth, with the annual rate of 6 000 Gbps (6 Tbps). The total market revenue growth is assumed to be approximately NOK 3 million per year9. Applying these prerequisites to the financial model results in an estimated total capacity in 2050 of about 200 000 Gbps, more than 100 times the current demand. The market turnover is assumed to grow to approximately NOK 140 million, as illustrated in Figure 3. 9 See Section 3.6 for more information 15 - Nexia Statnett Submarine Fiber Evaluation 2015 Figure 3 Prognosis for Market Revenue and Total Capacity 2014 – 2050 Furthermore, this leads to the assumption that the price of a 100 Gbps channel will be NOK 5 820 per month in 2050. The prognosis of market price per optical channel is illustrated in Figure 4. Figure 4 Prognosis for International Capacity Market Price development 2014 – 2050 3.2.3 The Market for New Cables and Routes The low upgrade cost and significant surplus capacity on the main routes into Oslo will make it hard to compete on price only against other networks on the main routes to Frankfurt, Amsterdam and London (where the largest Internet exchanges in Europe are located). For routes 16 - Nexia Statnett Submarine Fiber Evaluation 2015 coming into the south or west coast of Norway, the additional transportation route to Oslo will reduce the sea cable share of the total net income. The demand for capacity between Stavanger/Bergen and London, and Kristiansand/Stavanger – Copenhagen/Frankfurt is probably more beneficial for a new cable due to quality aspects (alternative route / lower latency) and somewhat higher price levels today than the routes out of Oslo. In addition, a successful, internationally oriented data center in south or west of Norway may create significant increase in demand for capacity outside the Oslo area. As described in Section 3.2.1, there are existing cables that may serve such a demand. A high level of connectivity makes networks more efficient and provides better quality of service. A higher level of connectivity between Norwegian providers’ networks and international networks can result in more security, less vulnerability and higher quality to Norwegian users. Latency is a quality parameter that may have an impact of the price of capacity. Latency describes the time for signals to travel between end-points. It is normally measured in roundtrip-delays, which are the number of milliseconds it takes for a data packet to travel to its destination and back again. Direct routes between countries will benefit latency. When the Danish network operator TDC took into use a new connection between South Norway and Denmark in mid-2014, the company stated that latency between Kristiansand and Amsterdam was reduced by 39%.10 Low latency is generally a quality mark for communication services, and an important parameter for many applications. Financial services and data centers customers are general examples of latency-aware customers. On this basis, we have assumed in the financial model that the capacity in the NordLink and NSN fiber alternatives has a 50% price premium compared to the average market price. This price premium reflects the anticipated value of alternative routing, reduced latency and the possibility to avoid transit through Sweden. A sensitivity analysis for the case of no price premium has been constructed in Section 6.4 and 7.4. 3.3 International Data Center Services Data centers are dedicated premises for processing and storage of data. The centers can provide services to local, national or international customers, and typically vary in size from less than 100 m2 to several thousand m2 floor space. Data centers need reliable electrical power, and there is a growing concern globally that data centers consume electricity in an environmental unfriendly way.11 Norwegian data centers have the benefit of stable and environmentally friendly electrical power, a cool climate (resulting in a lower cost of cooling), a low cost of land and an easy access to airports. 10 https://wholesale.tdc.dk/nordic/customer/Sider/Nordic_Newsletter.aspx?newsletterId=14&articleId=33 11 http://www.theguardian.com/environment/2011/oct/27/facebook-green-datacentre-sweden-renewables http://www.apple.com/pr/library/2015/02/23Apple-to-Invest-1-7-Billion-in-New-European-Data-Centres.html 17 - Nexia Statnett Submarine Fiber Evaluation 2015 One challenge for Norwegian data centers competing in the international market is the Norwegian tax on electricity. The general tax is currently NOK 0.1365 per kWh,12 compared to NOK 0.29 per kWh being the average price during first quarter 2015 for industrial sector.13 Hence, the tax was 32% of the cost of electricity in that period. In May 2015, the Norwegian Government made statements indicating that from 2016 this tax may be reduced for “green data centers”.14 Due to the significant fall in price of telecommunication capacity, there is an opportunity to locate data centers in places with a cool climate, stable and low-cost energy supplies and a stable political and economic environment. For example, Facebook has selected Sweden and Google has selected Finland as sites for data centers in Northern Europe. These data centers typically serve Europe or Northern Europe. The alternatives to sites in the Nordics, are often large facilities in Ireland (Google, Amazon, Apple, Microsoft, etc.) and in the Netherlands (Google, Microsoft, etc.). 15 Within Norway, there are several existing initiatives to offer data center services to large international customers as well as Norwegian customers. These initiatives are not limited to the south and west of Norway. Examples are:16 Digiplex, Oslo region Green Mountain, Stavanger/Rjukan Fjord IT, Halden Infragreen, Kristiansand region Lefdal Mine, Nordfjord Aurland Data Center, Sogn Arctic Circle Data Center, Mo i Rana We have been in contact with some of the companies mentioned above. In general, they see a number of benefits from the establishment of new fiber cables. They think it will increase their own competitiveness and the likelihood of the establishment of one (or several) large data center from large international data center clients and/or operators in Norway. We have also been approached by IKT-Norge and Innovasjon Norge, both of whom are promoting Norway as a location for international data center customers. Furthermore, we have unsuccessfully attempted to collect more information through Innovasjon Norge about their prospects. Our understanding is that confidentiality issues prohibit the sharing of relevant information. Generally, we believe that the capacity market described in Section 3.2.2 will include capacity demand from national data center customers, and that these payments are included in our market assumptions. 12 http://www.toll.no/upload/aarsrundskriv/2015/2015_Elektrisk_kraft.pdf 13 https://www.ssb.no/elkraftpris/ 14 https://www.regjeringen.no/nb/aktuelt/Sporsmal-vedrorende-Representantforslag-88-S-2014-2015-/id2351139/ http://www.digi.no/juss_og_samfunn/2015/05/12/og-det-blir-billigere-for-datasentrene 15 http://www.google.com/about/datacenters/inside/locations/index.html https://www.microsoft.com/online/legal/v2/en-us/MOS_PTC_Geo_Boundaries.htm http://www.apple.com/pr/library/2015/02/23Apple-to-Invest-1-7-Billion-in-New-European-Data-Centres.html http://aws.amazon.com/about-aws/global-infrastructure/ 16 http://www.digiplex.com/, http://www.greenmountain.no/, http://fjordit.com/, http://www.infragreen.no/, http://www.lefdalmine.com/, http://www.aurlanddatacenter.com/, http://www.arcticcircledatacenter.com/ 18 - Nexia Statnett Submarine Fiber Evaluation 2015 We have not had the opportunity to consider whether its correct that new international fiber cables are needed for international data center clients to locate in south and west of Norway. We have, however, tried to estimate what revenue potential a large international data center client could represent, and in what competitive landscape we think the capacity has to be offered. As described above, we have not been able to talk with any of the possible customers of such initiatives. We have learned that large customers tend to require at least three separate fiber access routes to the data center and the option to control the fiber themselves. This may be more costly in Norway than in other countries such as Denmark which already has more redundant infrastructure. Except for the Oslo region, such infrastructure is not easily available in Norway today. Nexia has compared existing systems and possible new fiber cable bundled to NordLink and NSN, based on cost and length of the system. The length of the cable systems drives some important quality parameters, as described in Section 3.2.3. The cost is an upfront payment related to get the full usage rights for one fiber pair with related amplifiers (i.e. the complete system on one fiber par). We have used approximate values for distances and a upfront payment of NOK 15 per meter for terrestrial distances. Based on this, calculations have been made on the pricing of NordLink / NSN bundled fiber to be competitive. Operational cost is assumed to be 3% of the upfront payment and NOK 1 500 per repeater site per month. The operational cost is calculated as the net present value with a 7% discount rate. Evaluating the options for NordLink, using what we believe is the best trace of the NordLink alternatives, the options for a data center customer located in Agder, connecting to Hamburg is illustrated in Table 2. The case for connecting (own fiber pair) an imaginary data center close to Flekkefjord with an existing network in Hamburg Route 1a - via Oslo, Copenhagen Route 1b - via Skagerrak 4 Route 1c - via Nordlink to Nørre Nebel km kNOK pr km Cost (MNOK) km kNOK pr km Cost (MNOK) km kNOK pr km Cost (MNOK) Land cable distance 1 400 15 21 675 15 10 385 15 6 Sea cable distance 150 50 8 320 50 16 NPV of 15 y. of oper. 9 4 7 Total 1 400 30 825 22 705 29 Table 2 The Case for Data Center Connections via the NordLink Route Table 2 shows that the assumed cost to compete is approximately NOK 29 million in total, of which NOK 16 million is for the sea cable distance. The total lengths of the two sea cable-based routes are significantly shorter than the land-based route, which in itself is an advantage. Similarly, for the NSN alternatives, Table 3 illustrates the example options for a data center customer in Stavanger that requires a connection to London. The case for connecting (own fiber pair) an imaginary data center close to Stavanger with an existing network in London Route 2a - via Oslo, Copenhagen Route 2b - via Skagerrak 4 Route 2c - via Nordlink to Nørre Nebel Route 2d - via NSN to Blyth km kNOK pr km Cost (MNOK) km kNOK pr km Cost (MNOK) km kNOK pr km Cost (MNOK) km kNOK pr km Cost (MNOK) Land cable distance 2 800 15 42 2000 15 30 1700 15 26 630 15 9 Sea cable distance 150 50 8 325 50 16 715 50 36 NPV of 15 y. of oper. 17 12 15 15 Total 2 800 59 2 150 50 2 025 57 1 345 60 Table 3 The Case for Data Center Connections via the NSN Route 19 - Nexia Statnett Submarine Fiber Evaluation 2015 For the NSN route, the estimated value is approximately NOK 36 million for the sea cable distance. The route via NSN is significantly shorter than the other options. The route via NordLink is in the same range as Skagerrak 4. It is worth mention that the NSN distance will be approximately equal to Tampnet’s existing route, which we will address in the next chapter. The general demand for international capacity from nationally oriented data centers is included in the market prognosis in Section 3.2. The calculations show that payments from a new large international data center customer could be in the range of an upfront one-time payment of NOK 16-36 million per fiber pair (or similar capacity) in the sea cable. We have not been able to verify any such interests directly with any of the potential actors of such initiatives, and have therefore not included any of this potential in our base case of the financial modeling. We have, however, included a sensitivity analysis in Sections 6.4 and 7.4 for large upfront payments from anchor customers and other partners. 3.4 Oil and Gas Sector Demands Fiber-based communication has for more than a decade served oil and gas installations in the Norwegian sector. Offshore fiber communication enables control and operation of many tasks from land, which raises efficiency and lowers costs. Furthermore, high-speed connections between global oil and gas centers (e.g. Stavanger, Aberdeen, London and Houston) enable more gains and secure the competitiveness of Norwegian companies in the global marketplace. This area is in constant development based on the need of oil companies’ offshore communication. Tampnet has a number of projects in progress for connecting new and old platforms and creating offshore 4G mobile coverage in the North Sea (illustrated in Figure 5). We have been in contact with suppliers and customers in this sector, and these find that a new cable connected to platforms (especially along the NSN route) could have some benefit for diversity in a timeframe of 5-10 years. Tampnet shares this view and finds the potential NordLink and NSN fiber cable interesting. However, no one finds this to be crucial to the sector. One customer stated that a new cable could provide competition in this field, in which only Tampnet operates today. Tampnet is a specialized telecom operator that operates a significant network in the North Sea, linking Hordaland, Rogaland and Vest-Agder in Norway to Aberdeen in Scotland and London (via Lowestoft) in England. Tampnet serves about 200 platforms and vessels in the North Sea. The potential synergy between this market and the international capacity market or data center services is not utilized in large scale as of today. A new link between UK and Norway, potentially along the NSN route, is a parallel and direct alternative to Tampnet’s existing infrastructure when it comes to Norway-UK traffic. Bringing a fiber cable along the NSN route into a platform connected to Tampnet’s network, may increase the options for Tampnet and the oil industry of reliable offshore communication. However, we do not see this market as a significant contributor to the income of the cable system. We believe the extra operational cost on a platform will (more or less) equal the income from sales of capacity at that platform. The benefit for the sea cable will therefore probably be a potential saving in investment and reduced risk by moving from an actively amplified to a passively amplified system. 20 - Nexia Statnett Submarine Fiber Evaluation 2015 Figure 5 Tampnet’s Network in the North Sea Area17 On the other hand, to our knowledge, Tampnet has not a significant share of traffic between Norway and UK outside of the oil and gas sector. As Tampnet’s marginal cost of providing international capacity probably is low, this is an indication that the demand for large capacity between south and west of Norway and UK currently has been limited up to today. During discussions with Tampnet we have understood that Tampnet is now directing broad offer of their capacity and transit services to data centers, operators and businesses directly. Tampnet also states the willingness to offer dark fiber or dedicated, bespoke systems to customers. We have not included any revenue from oil and gas activities in our financial model. If such income can be secured through a partnership with Tampnet or others, it might improve the business case. 3.5 General national interests Individual customers of telecom services purchase service that has the best price-to-quality ratio, and pay little attention to general quality and vulnerability issues that may have an impact on the society. Security involves protection against eavesdropping and misuse of information by private or public entities (including breach of privacy), against hampering of communication and data (including hacking of IT and communication systems) and against loss of communication abilities. 17 http://www.tampnet.com/northsea/ 21 - Nexia Statnett Submarine Fiber Evaluation 2015 The overwhelming share of Norwegian international Internet traffic passes through Sweden. As more services are offered over web services, it is increasingly difficult for users to know where data is stored. Many Norwegian companies use data center services offered by Amazon, Google and Microsoft, which all have data centers abroad. Growing concerns internationally are related to privacy and security of data transmission passing through a few points of connection. Other countries’ data retention policies and laws may be seen as an infringement of Norwegian users’ rights and security. Direct fiber links to different countries and diversity in the connectivity, will improve Norwegian provider’s ability to offer services that better protect the rights of users. As described in 3.2 there are alternative fiber optic links between Norway and UK and Norway and Denmark, and higher use of these and additional alternative links may reduce such concerns.18 Concerns about international capacity have been raised by several public officials: Members of Stortinget, Terje Breivik and Ketil Kenseth, made a proposal for the Government to develop a national broadband plan (29th of January 2014), that was adopted by Stortinget.19 A letter sent by the Minister of Communication to Stortinget (26th of February 2014).20 Members of Stortinget from Agder (“Sørlandsbenken”) has in a letter to the Minister of Communication (14th of January 2015) expressed concern along the same lines, especially related to data center initiatives in the south and west of Norway.21 So far, no public funds, preferences in public purchase or regulatory actions have improved the business case for new cables. We have therefore not included any contribution to the income of a potential NordLink or NSN fiber project from public sources or regulation. In our sensitivity analysis in chapter 6.4 and 7.4, we will evaluate this subject by the inclusion of a one-time upfront payment. Such upfront payment (in Norwegian: “anleggsbidrag”) may come from both public and private sources. While the government’s financial support for deploying broadband networks has traditionally been lower in Norway than in Sweden, the Norwegian Central Government normally allocates more than NOK 100 million every year to important network deployments22. In 2007 and 2008 the 530 km Ishavslink fiber cable from Alta to Tana Bru in Finnmark county received almost NOK 30 million in government support23. In addition, the Norwegian Communications Authority has an annual NOK 75 million budget to improve 18http://www.nrk.no/fordypning/her-gar-din-nett-trafikk-1.11403663 19https://www.stortinget.no/no/Saker-og-publikasjoner/Publikasjoner/Representantforslag/2013-2014/dok8- 201314-019/?lvl=0 20https://www.stortinget.no/no/Saker-og-publikasjoner/Publikasjoner/Innstillinger/Stortinget/2013-2014/inns- 201314-164/5/ 21http://www.lister.no/phocadownload/Dok_Listersamarbeidet/NordLink_og_fiberkabel/Sorlandsbenk_brev_fiber_ utland_Samferdselsminister.pdf 22 Ø. Thygesen, «A Comparative Study of The Internet Access Markets in Norway and Sweden», Norwegian University of Science and Technology, 2015 23 Nexia, «Resultat av arbeid med bredbånd i fylkeskommunene», 2013 22 - Nexia Statnett Submarine Fiber Evaluation 2015 telecom security and preparedness24. Finally, local and regional authorities have been known to help finance important network links. Green and secure power is one of the main sales arguments for Norwegian data center projects. Adding power interconnectors to other countries, this argument can also be used by the interconnected country. There is evidence that data center initiatives in Denmark used this argument to secure a contract with Apple (relating to benefits of the Skagerrak cables offering secure Norwegian hydroelectric power).25 Therefore, the power exchange by NordLink and NSN may introduce a competing benefit for data centers in north of Germany and UK, as power will be increasingly stable and green in these areas as the new power cables go into operation. We have not incorporated this effect into our financial model. 3.6 Market for NordLink and NSN fiber In the financial model, we assume that a fiber sea cable takes its proportionate share of the estimated total market by 2023. With about 12 other existing route alternatives out of Norway (counting ring networks as double), the target market share is assumed to be 8% of the total capacity for a new sea cable by 2023. The financial model does not include assumptions about payments made upfront for dark fiber or a large share of capacity of a fiber cable. Such agreements are by nature few and there exists an uncertainty whether such agreements can be secured. Reading the results of the financial analysis, the lack of such anchor-customers or partner agreements should be taken into account. Figure 6 Prognosis for International Capacity Volume Development 2014–2050 and Potential Share of NordLink/NSN 24 Statsbudsjettet 2015 – tildelingsbrev til Nasjonal kommunikasjonsmyndighet 25 http://ing.dk/artikel/apple-vores-danske-datacenter-skal-koere-paa-100-procent-vedvarende-energi-174308 23 - Nexia Statnett Submarine Fiber Evaluation 2015 Nexia estimates that one or two new sea cables along NordLink and/or NSN will need a period of about 4 years to take the available market share and become an established alternative. However, as capacity requirements continue to increase, we believe it will be difficult to maintain the market share over time (as illustrated in Figure 6). The main routes out of Oslo will have a lasting benefit in terms of cost of capacity upgrade, direct connection to Oslo as a telecom hub of Norway and most importantly: these networks have a high share of sunk cost in provider’s accounts. After 2023, we assume that the increase in demand for capacity will be served by terrestrial routes that is owned and operated by backbone capacity providers mentioned above. Some of these may use the sea cables, but we believe these providers will primarily see the cables as a low latency route for special purpose traffic. We therefore assume that fiber sea cables (NSN and NordLink) will have a slower growth in capacity sale beyond 2023 than the terrestrial routes, but be able to uphold a higher price per unit. Section 6.4 and 7.4 include sensitivity analyses where the sea cables are able to uphold their market share for the whole lifetime. 24 - Nexia Statnett Submarine Fiber Evaluation 2015 4 Technology 4.1 4.1.1 Introduction to Fiber Communication Long Distance Communication Fiber optic communication is limited by distance, as the light signal will weaken and degenerate as it travels along the fiber. As a result, signals have to be amplified after certain lengths in order to reach the receiver without loss of data. In addition, signals will degenerate after a certain length and number of amplifications, meaning that even if the signal has sufficient strength, it will not have sufficient quality to carry data without failure. This will, in general, add investment cost and/or reduce capacity, as fiber optic links get longer. There are three main technologies for long distance fiber communication: 26 1. Standard technology used in terrestrial systems, where the distance between amplifier equipment can be selected at will. The optimal length is somewhere between 80 and 100 km. By introducing extra amplification at the sending and receiving end of each segment, a longer distance can be achieved (however, this equipment has a rising cost as length increases). The current maximal length is about 330 km between each amplifier, depending on type of fiber used. 2. Passive remote amplifier technology, where no electrically powered equipment is included along the cable. The passive amplification can by various techniques be done along the route by remotely “pumping” the signal by another optical signal with high effect. The current maximum theoretically length is between 350 and 630 km depending on capacity requirements. Generally, as the distance is increased, the number of available channels will decrease accordingly due to lower signal-to-noise ratio. The longest length only accommodates a single channel per fiber pair, thus giving a high cost per channel. 3. Active amplifier technology, where remotely electrically powered equipment is located along the cable. Such systems are used for longer distances when capacity demand cannot be met by a passively amplified system. This includes distances from around 400 km and up to several thousand km. Technological progress has been significant in this area, as new generations of equipment can carry higher capacities over a longer distance and at a lower cost. This will likely continue in the coming years. However, there are a number of physical limitations. During expert interviews, we have learned that progress in the number of channels of ultra-long-length (that is about 500 km) may rise from 2 to 4 with the available type of fiber, but it is not likely to rise further to 10 or 100 due to laws of physics. 26 See e.g. http://en.wikipedia.org/wiki/Optical_amplifier and http://www.cisco.com/c/en/us/td/docs/optical/15000r7_0/dwdm/planning/guide/70epg/d7ovw.html 25 - Nexia Statnett Submarine Fiber Evaluation 2015 There is also technological progress on developing low attenuation fiber, giving increased distances, especially for passive amplification systems. This will not help after the fiber type is selected for a potential project. 4.1.2 Actively Amplified Systems An actively amplified system consists of a cable with amplifiers placed at regular intervals, typically 80–120 km. The amplifiers are electrically powered from a land station on one or either side, by a separate power conductor in the telecom cable. The active remote amplifier technology is costly, meaning that it is optimal to amplify a small number of fiber (up to 6 pairs) with very high capacity (e.g. 150 channels of 10 Gbps, upgradeable to 100 Gbps or more in the future)27. In contrast, in standard systems, it may be more optimal to install a higher number of parallel systems with less capacity in each (typically with a fiber count of 24, 48 or more). An actively amplified system will normally have a higher initial investment, where passively amplified systems can be scaled more easily as demand increases and cost of equipment falls over time. Up until the late 1990’s, the normal organizational model for intercontinental cables was to form a consortium, where one party operates the land station on behalf of the consortium, and where all capacity is shared between members according to corresponding investments. TAT-14, a cable system for Northern Europe to USA, was the last such venture in the North Atlantic, and the only consortium cable still in full operation between Northern Europe and USA. Our scope is to investigate the installation of a fiber cable bundled to a power cable. This raises several issues related to active systems: 27 We are not aware of any actively amplified systems of today that have been installed bundled to power cables. The power cable generates a strong electromagnetic field, which may negatively affect the amplifiers (i.e. repeaters). It has to be considered more closely if changes in the power load (e.g. a power outage) can induce unwanted charges in the power cable of the actively amplified system and what measures that needs to be taken to protect the repeaters. The laying of an amplified system will add complexity to the laying process since the telecom cable is thicker and has repeaters attached at regular intervals. It is unclear whether the repeaters can be bundled to the power cable, or if they have to be installed at some distance (some meters) from the power cable in order to avoid electromagnetic transients. In the case of a separated placement of the repeaters, the trenching of the power cable will probably need to be halted before the repeater, and started again after the repeater is separately buried into the seabed. It is unclear if the ship providing the burial can bury the repeater by using a separate ROV trencher (“remotely operated vehicle”), or if that has to be done by an another ship. http://www.xtera.com/en-US/Solutions/Terrestrial/BackboneNetworks 26 - Nexia Statnett Submarine Fiber Evaluation 2015 A physical damage to the cable bundle may lead a high voltage current into the fiber cable. This could cause damage to repeaters and land stations. Different suppliers have different opinions regarding these risks. One of the suppliers that we interviewed explicitly discouraged such a solution due to the risks involved. Another supplier stated that the risk is manageable. For actively amplified systems, one vendor normally proves power feed to the subsea repeaters and the transmission systems. Such systems are not normally split on a fiber basis between different operators. It may be technically feasible to arrange for different parties to have their own and separate equipment connected to different fiber pairs. However, one party must in any case take responsibility for the power feeding equipment of the repeaters. The operation of the land stations can be a dedicated telecom task. To our knowledge, there is no professional service that can be sourced independently of telecom operators. Such an operation is more complex than in a passively amplified system and may require special skills related to equipment that power the subsea repeaters. An actively amplified system has a higher cable cost since it has a power conductor. Also, it needs power feeding equipment and subsea repeaters. The initial cost is related to the number of fiber pairs that is installed. We have assumed the following costs: NOK 1.5 million for one subsea repeater, NOK 5 million for the power feed equipment and a cost of NOK 150 per meter for the fiber cable for actively amplified systems. 4.1.3 Passively Amplified Technology Passive amplifiers utilize various techniques for increasing optical signal strength without a power conductor and electrically powered amplifiers along the telecom cable. Different technologies for passive amplification28: EDFA – Erbium-doped fiber amplification RAMAN – Raman laser amplification ROPA – Remote optically pumped amplification Non-standard fiber types EDFA is widely used in both passive and active amplifiers. Within passive systems, the EDFA has the ability to “pump” (gain strength) a communication signal by sending a parallel high-powered signal in the fiber at another wavelength. By using higher power, a stronger signal and thus a longer communication distance can be obtained. RAMAN laser amplification is based on the effect of Raman scattering. It is used to amplify a signal with the help of another power signal. This can typically be used in combination with EDFA. ROPA is a technique where the passive amplification unit is normally located 100 km or more along the cable from each landfall and is remotely pumped from the transmission site at landfall. The number of fibers that can be amplified in this manner, is limited by the size of the subsea 28 https://en.wikipedia.org/wiki/Optical_amplifier 27 - Nexia Statnett Submarine Fiber Evaluation 2015 box containing the amplifier. Currently, 24 fiber pairs can be handled, and each fiber pair can be used independently and with different systems. The ROPA technology has been used for two decades or more, it is stable and well proven with several suppliers of equipment. There is no specific operational cost of the subsea elements. Longer distances for dense multiplexing of wavelengths with high capacity can be obtained by using non-standard types of fiber. Non-standard fiber includes fiber with less attenuation (thus giving the signal longer reach) and less optical/chromatic dispersion (thus giving the signal higher accuracy for capacity). A ROPA unit is similar to an actively amplified unit in physical size. The ROPA seen in Figure 7 is used in the Nordbalt project. Figure 7 ROPA Units for Passive Fiber Amplification29 To our knowledge, the longest distance of a ROPA-enabled fiber is about 610 km for a single 100 Gbps system and 630 km for a single 10 Gbps.30 This has been achieved in a test/laboratory setup using ultra-low attenuation fiber and RAMAN amplification. A real-life sea cable system will need margins for aging of fiber, splices, repairs, etc. which will reduce the distance that can be achieved. The longest real-life ROPA-enabled system today is therefore shorter. To our knowledge the longest passively amplified commercial subsea systems are: Silphium, Libya–Greece 425 km, total design capacity 1.2 Tbps, installed by Huawei Marine and ready for service in 2013.31 Mataram – Kupang, Indonesia, 430 km, initial capacity of 40 Gbps, installed by Huawei Marine and ready for services in 2011.32 29http://www.tykoflex.se/1.0.1.0/21/download_1742.php 30http://www.xtera.com/en-US/NewsAndEvents/News/Ultra-Long-Unrepeatered-Transmission-over-607-km-a and https://www.alcatel-lucent.com/press/2015/alcatel-lucent-achieves-submarine-cable-breakthrough-recordtransmission-distance-more-610km 31http://www.huaweimarine.com/marine/marine/commonWeb.do?method=showContent&webId=320 32 http://www.huaweimarine.com/marine/marine/commonWeb.do?method=showContent&webId=367 28 - Nexia Statnett Submarine Fiber Evaluation 2015 Papua New Guinea, 436 km, capacity of 3.4 Tbps on one fiber pair, equipment installed by Xtera communication.33 We have different sources stating that for NordLink (with a distance of 521 km), a design with passive amplification can provide capacity of 1-4 channels of 100 Gbps each by 2019. Our sources say that technological development beyond 2019 may not be likely to increase the number of channels beyond this level. 100 Gbps capacity will by 2020 be less than 0.6% of total market capacity demand according to our prognosis, see Section 3.2.2. To our knowledge, a passively amplified fiber bundled to NordLink will be about 85 km longer than the longest passively amplified commercial systems in operation today. We have assumed a cost per ROPA of NOK 1 million each, and a cost of transmission equipment of between NOK 7.5 and 20 million dependent on configuration. The cost of the fiber cable is assumed to be NOK 120 per meter for the passively amplified systems. 4.2 System Components The fiber optic cable system consists of several parts: 4.3 The sea cable containing a number of optical fiber strands Passive or active amplifiers placed along the cable Backhaul land cable connecting the sea cable to customer’s/user’s existing network Communication equipment, normally for DWDM (dense wavelength division multiplexing) where a number of optical wavelengths are transmitted from end to end (or perhaps added or dropped at an intermediate point) Technical room for communication equipment close to landfall Manufacture, Freight and Loading The possible synergies of a bundled fiber and power cable are, among other things, related to planning, path survey, laying and protection of both cables at once, and potential gain during operation from common protection. An important challenge for realizing the synergies during installation is that a delay or an error related to fiber cable can have a high impact on the highcost power cable installation project. On the other hand, a separate installation of a fiber cable can be done by a smaller and less expensive ship. Such separate installation will be the benchmark for our business case. Generally speaking, a fiber sea cable can be lightweight and single or double armored. Different cable construction and armoring are offered by different suppliers. It is a question whether costeffective lightweight fiber cable with less armor for protection can be used when bundled to the power cable. 33http://www.xtera.com/en-US/Media/Resources/ArticlesAndTechnicalPapers/Raman-amplification-benefits-100G- networks-in-real 29 - Nexia Statnett Submarine Fiber Evaluation 2015 Cable cost will also vary depending on fiber type, number of fibers and if a conductor is included (in the case of actively amplified system). We have assumed that the cost of cable will be NOK 120 per meter for a passively and NOK 150 per meter for an actively amplified cable system. The longest passively amplified system may need a slightly more expensive low attenuation fiber, this potential cost has not been included. The power cable will be constructed and loaded in segments, but we believe it will be most effective to manufacture the whole fiber cable at once, and have it delivered to the ports of loading. As the power cable installation takes place over 2–4 seasons (summers), the fiber cable will be stored at port until time of loading. For NordLink, 2 or 3 different ports and 3 different ships/barges will be used for loading, adding to cost of freight and preparing the ship/barge for loading of the fiber cable. NSN will be installed during 4 seasons, and it is not decided which installers and ports that will be used. We have assumed a cost of freight for the fiber cable of NOK 1.5 million per port. This includes loading, offloading and potential storage at port (also between seasons). The ships laying the cable bundle will need to be prepared for the loading and bundled laying of cables. This includes a fiber cable basket, feeders for cable and a system for bundling of the cables. We have assumed a one-time initial cost of preparation of ship and equipment of NOK 15 million per ship (NOK 5 million for small ship for coastal waters), independent of the number of seasons, and a cost of NOK 2.5 million per campaign season to prepare the ship (even at the first season). Each loading operation has an assumed cost of NOK 0.5 million in addition. These costs are estimates from Statnett and Nexia combined with general cost levels given from interviewed suppliers and experts. These costs cannot be verified before an actual negotiation with suppliers are concluded. There are risks of additional cost in this area. 4.4 The Installation Process The installation process of a bundled power and fiber cable will have to be planned carefully in order to identify a more precise budget. We have based our figures on expert interviews and previous experience of Statnett, and have not discussed this topic with the selected installers. During laying, a team of fiber engineers needs to be on board the installation vessel. This team will make splices and handle the fiber part of the laying process. We have assumed a cost of personnel to be NOK 180 000 per person per installation campaign, with 4 people in the team and a laying campaign of average 12 days. The laying ship will strap the fiber cable to the power cable, in order for the bundle to be buried in a common trench. As straps may hinder future maintenance and repair of the fiber cable, it may be viable to use straps that dissolve in water after some time (some years). The fiber cable will be installed in the bundle without tension; this is to ensure that the power cable takes on physical forces in the length direction. This creates some extra challenges during burial, as the fiber cable may become loose in the bundle. During laying, a strapped fiber cable can wander. Consequently, the fiber cable may be in any position after being installed (see Figure 8 and 9). Currently, there is no method for keeping a bundled fiber cable in one position. During burial, the visibility is low, and visual inspection of where the fiber cable is placed may not be possible at all times. Whether there exist other methods for detecting the position of the fiber cable in a bundle is not known to Nexia. 30 - Nexia Statnett Submarine Fiber Evaluation 2015 The change in relative position may also result in the fiber cable twisting around the power cable, which will make isolated repair of the fiber cable (if the fiber cable is damaged) more difficult. A fiber cable positioned in the upper half of the power cable is probably more likely to be damaged, but can also more easily be repaired without lifting power cable. Figure 8 Possible target burial position Figure 9 Real burial, where the fiber cable can be in any position Both NordLink and NSN will be installed by one ship laying the cable at the sea bed, and another ship for burial of laid cable into the sea bed. As the laying process can be done at a relatively high speed (while the burial operation is slower), guard vessels will be used to ensure that no trawling happens across the unprotected cable. The laying ship will have a separate basket for the fiber cable, and the bundling of fiber to the power cable will take place as the bundle is being laid. During the Skagerrak 4 installation, the bundling could only take strapping yarn for 1.5 km of cable, before shifting the yarn drum. This led to a halt for the laying ship, and added extra time related to the fiber cable. Based on information from Statnett for the Skagerrak 4-project, we have added a 10% increase in laying time due to this. The additional cost is estimated to be NOK 1.6 million per campaign. NordLink will, in the German sector, be installed as a bundle of two power cables. A potential fiber will be installed as a third element to this bundle during the laying process. Furthermore, the power cable will be installed in separate segments, which will require splices to be made on the fiber cable as well. A fiber splice is done in a dedicated fiber splice box. As the power cable also will need a splice, which will take longer time to finalize, we assume that the two splices can be handled without delay. The landfalls of a bundled fiber and power cable will for both NordLink and NSN in Norway be made through microtunnels drilled in solid rock. These are large enough to fit the cable bundle and will make an effective and secure landing for the fiber cable. In Germany and UK the landfall will be trenched. Compared to a separate landfall for the fiber cable, there will be synergies with a bundled landfall. We have assumed no extra cost of a landfall for the fiber cable bundled to a power cable. 4.5 The Operation of Bundled Cables During operation, we believe the common path of a more solid power cable and the less solid telecom cable, will be a benefit to the fiber cable. Furthermore, we believe that the marine survey and seabed assessment, trenching/burial by more heavy equipment, the protection at 31 - Nexia Statnett Submarine Fiber Evaluation 2015 pipeline crossings, documentation and control of cable as-built will be at least as good as or better than a normal telecom-only cable system. The NSN UK Environmental Statement of March 2014 describes the installation and operational issues and risks related to fishing and anchoring, as well as measures being taken in the installation and operational phase. The Statement concludes that the risk of impact is not significant.34 We have not had access to data that makes it possible to assess whether a bundled fiber cable will be less exposed to damage, than a standalone fiber cable during the lifetime of the fiber cable. The risk of cable damage is mainly related to the seabed areas where the sand moves due to currents. This means that once the cable is buried at a depth of 1.5 meter, it can be exposed on the seabed after some time. Statnett has made prior surveys to minimize this effect, and have a program for monitoring such areas during operation by periodic inspections. In the case of cable exposure at the seabed, preemptive protection, e.g. by rock dumping, may take place. Statnett has a historical track record of a 2.5% probability of damage per 100 km per year to power cables. This implies that a 521 km cable path is expected to have one damage that needs to be repaired one time every 7 years and 8 months. We have not had available general data on the probability of damage to fiber cables in the North Sea. On this basis, we will use the probability of 2.5% per 100 km per year for the financial model for a full bundle repair. Generally, in order to repair a sea cable, it is necessary to bring a sufficient part of the cable onto a ship, usually after cutting the cable (if the damage did not cut it). As an example, for a sea depth of 50 meters, at least 200 meters of cable must be dug up from the seabed in each direction. The repair is done by two splices, and the addition of some hundred meters of new cable in between. Finally, the cable must be trenched down into the seabed or protected in another way. For a fiber cable bundled to a power cable, there are three different cases where damage may occur: 1. The complete bundle of fiber and power cable is damaged, and both need repair. 2. Only the power cable in a bundle is damaged, and the fiber cable is operational. 3. Only the fiber cable in a bundle is damaged, and the power cable is operational. In the first and second case, Statnett will (given certain prerequisites) start a repair operation as soon as possible. This will be carried out by cutting both cables and then make two splices on both cables as described above. This operation will have added cost compared to a situation where there is no fiber bundle. This extra cost is related to a fiber splice team, splice boxes, cable and other equipment and the potential extra time it takes to repair a fiber cable in addition to a power cable. Nexia has estimated this to be an additional cost of NOK 2 million, and this is included into our financial model. According to Statnett, the complete repair campaign could have a cost of approximately of NOK 60 million. 34 http://nsninterconnector.com/pdf/P1568_RN3057-Norway-UK-Environmental-Statement.pdf 32 - Nexia Statnett Submarine Fiber Evaluation 2015 For standalone benchmark systems, the cost of repair will be higher as there is no power cable to share costs. We have assumed a double cost per incident for standalone benchmarks. It is clear that an actual repair cost of a standalone cable will be significant higher than NOK 4 million, but the probabilities are not either comparable. We have used this figure for sake of simplicity, which gives the bundled alternatives some synergy during operation compared to the benchmarks. The third case would involve the repair of a fiber cable without distorting a power cable in operation. It is unclear to Nexia whether there exists a method for repair that is sufficiently safe. We have been in contact with other owners of similar sea cables and with suppliers, but have not succeeded in obtaining a definite answer. During a potential repair operation, it will be necessary to obtain consent from both Statnett and Tennet / National Grid in order to expose the cables on the seabed, to cut the fiber cable and to remove the fiber cable from its bundled position. Ultimately, it may also be necessary to lift the power cable out of its position to make the fiber cable exposed. Both operations will require a larger capacity of lifting and increase the potential risk of damage to the power cable. It is unclear what guarantees that can be made by a repair contractor to perform this operation without creating damage to power cable. In meetings with Statnett, Nexia has understood that a repair of the fiber cable bundled to a power cable, can only securely be done during a service window (when the power cable is not operational). Such service windows are typically only available once a year. As a sea fiber cable damage normally should be repaired within a few weeks, such a limitation of the repair process would be an increased risk and potentially reduce the commercial value of the fiber cable significantly. We consider this damage situation to be a risk and it is not included in the financial model. To our knowledge, no fiber cable installed in a bundle with an HVDC cable has been damaged and then been a subject of repair. Therefore, there is a lack of operational experience from repairs of fiber cables bundled to power cables. As a consequence, no assumptions have been made if there is a lower risk of damage to the fiber cable, or if there is a higher risk of the fiber cable not being able to be repaired. With a bundled installation of an actively amplified fiber cable, there exists a special risk related to the possibility of a physical damage to the power and fiber cable, resulting in a high voltage current entering the electrical conductor in the fiber cable. Such an incident may be caused by an anchor of a large vessel hitching the cable bundle, e.g. during accidental anchor drag. Nexia has not been able to conclude if fuses or other measures can be inserted into the fiber cable conductor, in order to avoid a high voltage current in the fiber cable burning electrical components in repeaters and land station equipment as well as creating a risk for personnel that may be in the land station. 33 - Nexia Statnett Submarine Fiber Evaluation 2015 4.6 4.6.1 Comparable Fiber Sea Cable Systems Skagerrak 4 Considering the potential and costs of fiber bundled to NordLink, it is interesting to note the experience of fiber cable bundled to Skagerrak 4.35 Skagerrak 4 is a HCDV cable installed by Statnett between Kristiansand in Norway and Tjele in Denmark, with a total length of 240 km (of which 140 km is at the seabed). The cable was ready for commercial service in 2014. Skagerrak 4 is installed with a fiber cable bundled to the power cable, primarily to be used for the power cable operation. Statnett has leased spare dark fiber to telecom providers. The cable contains 48 fiber strands. Skagerrak 4 is connected to the Norwegian electrical grid in Vennesla, 20 km outside of Kristiansand. The site is well suited for connection to the national fiber networks. In Denmark, we believe the land power path crosses several national fiber routes. The project did not develop a method for repair of fiber cable (in the case of fiber damage only). How the fiber cable is buried related to the power cable (i.e. on top, bottom or the side at any specific point), is not documented. It is therefore not possible to estimate the possibility of damage to fiber cable only, nor the challenge of a repair. 4.6.2 East-West Interconnector36 The East-West Interconnector is a 500 MW HVDC power cable installed between Ireland and Wales by Eirgrid (the Irish electric grid operator) with a fiber cable bundled. The system consists of 186 km sea cable and 70 km of land cable. The East-West Interconnector was ready for service in 2013. Geo Networks (now Zayo Group) was selected in 2011 as an exclusive partner for developing the fiber part of the sea cable technically and commercially. We have only obtained limited information about this partnership, and on which terms and conditions that Geo was selected as partner. 4.6.3 NordBalt, Sweden–Lithuania37 NordBalt is a 700 MW HVDC power cable in the process of installation between Sweden and Lithuania, to be ready for service in 2015/2016. The power cable is owned and operated by Svenska Kraftnät (SvK) and LitGrid (the Lithuanian grid operator). NordBalt will be installed with a bundled fiber. The rationale for installing a fiber cable bundled to the power cable was internal 35 http://www.statnett.no/Nettutvikling/Skagerrak-4/ http://www.nexans.no/eservice/Norway-no_NO/navigatepub_0_28751/Nexans_tildeles_kontrakt_pa_HVDC_sjokabel_til_Skag.html 36http://www.eirgrid.com/media/EIRGRID%20TO%20INCREASE%20HIGH%20SPEED%20INTERNET%20CAPACITY%20 FOR%20IRELAND.pdf 37 http://www.svk.se/natutveckling/utbyggnadsprojekt/nordbalt/ 34 - Nexia Statnett Submarine Fiber Evaluation 2015 communication needs of SvK and LitGrid. Spare capacity in the cable will be marketed and sold in the future. Nordbalt total length is 450 km, where 400 km is a sea cable. ABB is the power cable supplier. The fiber cable has two ROPA units installed and contains 48 fiber strands. SvK and LitGrid will install communication rooms by the landfall on each side, enabling future fiber customers to have 400 km distance between repeaters, and also install fiber onwards to converter stations. From the Swedish converter station, SvK offers fiber onwards to Stockholm and Malmö on SvK’s Swedish fiber network. SvK owns a part of Triangelbolaget, which offers dark fiber on the networks of SvK, Vattenfall, Fortum and Tele2, including connections to Norway. 4.6.4 C-Lion (Sea-Lion) – Baltic Fiber Cable C-Lion (also named Sea-Lion) is a standalone fiber cable between Finland and Germany that is under planning / in the early construction phase. It is an actively amplified system that will be ready for service in 2016 and will have a length of 1 100 km and an ultimate capacity of 15 Tbps. The Finnish government has funded €20 million on the basis that Cinia Group could raise equal amount of risk capital from the private sector. The rest of the capital (about €20 million) will be secured as debt. The financing was secured in 2014. In September 2014, the deal was cleared by the EU to not infringe state subsidies rules. Cinia Group is owned by the Finnish government. The total budget of the project is €60 million, which gives an approximate cost per meter of less than NOK 500. We have information on the contracted sum being well within budget. Cinia announced on the 28th of April 2015 that a contract worth €10 million was made with Hetzner Online (a German data center company) for capacity in C-Lion.38 The objective is, among others, to attract more data center business to Finland. Google has (for example) established a data center, and Finland finds that direct and low latency fiber connectivity is an important part of this strategy.39 38 http://cinia.fi/en/news/cinia-group-building-digital-highway-between-finland-and-germany-hetzner-online 39 http://cinia.eu/en/c-lion http://ec.europa.eu/competition/elojade/isef/case_details.cfm?proc_code=3_SA_36918 http://ec.europa.eu/competition/state_aid/cases/252810/252810_1582447_89_2.pdf http://www.alcatel-lucent.com/press/2014/alcatel-lucent-and-cinia-group-deploy-1100-km-undersea-cablesystem-linking-finland-germany 35 - Nexia Statnett Submarine Fiber Evaluation 2015 5 Alternatives and Assumptions 5.1 About the Fiber Alternatives The opportunity of bundled installation of a power and fiber cable, will be discussed during four stages: 1. Fully bundled alternatives Our base case is to install a fiber cable bundled to the complete route of the NordLink and NSN cables. For NordLink we will consider two options, actively and passively amplified fiber cables. For NSN we will not consider a passively amplified system, as the total length of 730 km is not considered technical viable in a commercial setting by any of the experts and suppliers we have met. These alternatives are: NordLink bundled passive (alternative 1) NordLink bundled active (alternative 2) NSN bundled active 2. Standalone benchmark for fully bundled alternatives As a standalone benchmark, we will consider two actively amplified systems on the approximately same route as NordLink and NSN (only with minor deviations). The standalone benchmark will not have any synergies with the power cable. These benchmarks are: NordLink parallel standalone benchmark – active NSN parallel standalone benchmark – active 3. Partially bundled alternatives Furthermore, we will consider partially bundled alternatives, meaning that the synergies with NordLink and NSN is used only as far as seemed optimal. The route may deviate from the power cable route if this can improve the business case. These alternatives are: NordLink partially bundled passive to Nørre Nebel NSN partially bundled active NSN partially bundled passive via Ula 4. Standalone benchmarks for partially bundled alternatives Finally, we will present a possible standalone benchmark that is not following the route of NordLink, but can serve more or less the same market demand. This standalone benchmark is: NordLink standalone benchmark – shortest route The alternatives and standalone benchmarks are not an exhausted list of potential solutions. It may also be possible to combine elements from the alternatives, e.g. by having an actively amplified system with branching cables that (for a marginal investment) may increase the overall profitability given the right customers or partners. 36 - Nexia Statnett Submarine Fiber Evaluation 2015 However, it may not be available market data to model such alternatives, and we will therefore leave such refinement to potential further work. 5.2 Method for Benchmarking Nexia finds that comparing the marginal cost of the alternatives against the cost of a standalone benchmark case, is (in most cases) the best way to estimate the synergies of a bundled installation of a power and fiber cable. Our sources for cost data is public information available, and confidential information received from cable and equipment suppliers. We have also discussed cost levels and synergies with other experts for further benchmarking. Standalone benchmarks are assumed to have the same construction phase and operational timing as the alternatives, i.e. technical completion in 2019 and commercial operation from start of 2020. The NSN will not be finished before 2021, meaning that commercial operation of a fiber cable can earliest be at end of year 2021. Our financial model is based on all alternatives being operational the full year of 2020. A standalone system can be planned and built quicker than a power cable, and could potentially, with a decision in 2015, be built by 2017 and be ready for service by the start of 2018. Related to market development, this may represent a benefit. We have made a sensitivity analysis based on this potential benefit. 5.3 Calculation of Payback and Net Present Value In order to calculate the payback of the fiber cable investments and the net present value of the projects, a number of assumptions have been made. The main assumptions are listed in Table 4. Assumption Assumed value Total capacity market revenue development ≈6%, falling to ≈3% after 2020 Sea cable share of total capacity volume in market Rising to 8% in 2023, thereafter falling Price premium for capacity in sea cables (higher 50% higher unit price price due to cable route being unique) Reduction in price of equipment 7% annually after 2020 Discount rate (annual) 7% Fiber cable lifetime 30 years Mean time between failure to cable (bundled) 40 years per 100 km route 37 - Nexia Statnett Submarine Fiber Evaluation 2015 Average cost of repair when cable is damaged NOK 2 million40 First year of commercial operation of the fiber cable 2020 Cost per meter of fiber sea cable (passive/active) NOK 120/15041 Cost per meter of cable installation and protection NOK 300 Table 4 Calculation of Payback and Net Present Value (List of Assumptions) The cost calculations are made without explicit cost overrun margins for uncertainties. Level of uncertainty will depend on the project design, and cannot simply be set as a percentage margin of the budget cost for each alternative. For example, the uncertainties of a bundled cable can be more related to the total installation cost, than to the cost of the fiber cable itself. Risk and necessary levels of uncertainties should be set as a part of the detailed design, if going forward with the fiber cable project. Our financial model is therefore not making any assumption on the level of uncertainty or risks in general. Investments is in our model assumed to take place in 2019 for cable and installation and 2020 for telecom equipment, for the sake of comparison between alternatives. In a potential real project, all investment in the alternatives will take place over several years. The effect of this will not be taken into account in the model. Each calculation is made without connection fee for capacity sale, and without any cost of connection. For simplicity, we assume that the connection fee covers the connection cost. The cost of a pair of 100 Gbps transponder/line cards is currently in the range NOK 1–1.5 million. As previously stated, we believe this cost will come down by 2020, and that the cost and corresponding connection fee will not be an obstacle for customers to purchase capacity. Any upfront payments from the sale of fiber or capacity is not included in the calculation. Such payments can be significant, e.g. C-Lion’s sale of capacity for € 10 million, ref Section 4.6.4. 5.4 Sensitivity Analysis The calculations in the model are made without margins for cost overrun. Instead, we have chosen to estimate such risks as sensitivities to various risk elements. We have selected income and cost elements for the sensitivity analysis that are considered to have the most impact and the highest uncertainty. The elements and selected values should not be considered as a best or worst case. 40 Symbolizes the average additional fiber cable repair cost. Three types of faults can occur. Case 1: Fault in fiber cable only. Case 2: Fault in HVDC cable only. Case 3: Fault in both HVDC and fiber cable. The additional cost will be estimated to NOK 2 million for case 2 and 3. Case 1 is considered a risk that has not been incorporated in the model. 41 This difference is only for cable. An active amplified system will have additional cost elements, like repeaters and power feed equipment. 38 - Nexia Statnett Submarine Fiber Evaluation 2015 Our sensitivity analysis will be based on changes in the following elements: 42 Cable cost o 20 % higher cost o 20 % lower cost Discount rate for net present value calculation (instead of 7%) o Higher rate of 12 % o Lower rate of 5 % Annual cost reduction of transmission electronics (instead of 7%) o Lower reduction of 4 % o Higher reduction of 10 % Transmission equipment cost in 2020 o 60 % higher cost o 30 % lower cost Cost for additional cable laying operations (all cost elements) o 30 % higher cost o 30 % lower cost Revenue development o No price premium for capacity (compared to 50% price premium) o Fixed market share of 8 % throughout the lifetime of the system (compared to a falling market share after 2023) o Up-front payment of NOK 85 million + 3 % operation and maintenance (O&M) recurring revenue (compared to no upfront payments)42 Offset of the revenue profile due to the system being ready for service later of sooner than 2020 o Ready for service one year earlier: first full year is 2019 o Ready for service one year later: first full year is 2021 The upfront payment of NOK 85 million and 3% O&M is selected as C-Lion has secured an agreement of such size from a customer, see Section 4.6.4. 39 - Nexia Statnett Submarine Fiber Evaluation 2015 6 Potential NordLink Fiber Project 6.1 6.1.1 The NordLink Project NordLink Project Path43 NordLink is to be built between Ertsmyra/Tonstad, Sirdal in Norway and Wilster in Germany. The path consists of a sea cable between Vollesfjord (Flekkefjord, Norway) and Büsum (Germany) as well as an aerial line connection in Norway and a ground cable connection in Germany. The overview of the path is illustrated in Figure 10. Figure 10 NordLink Cable Alternatives and Standalone Benchmarks NordLink is in early construction phase, and is planned to be ready for test by 2019 and for commercial service by 2020. NordLink will be built with bipolar technology, i.e. the cable system will have two electrical conductors. The sea cable is constructed as two physical cables, and laid in parallel (except for the distance within German economic zone, where the two parts will be joint into one physical 43 http://www.statnett.no/PageFiles/6553/Dokumenter/~1S%C3%B8knad%20om%20utenlandskonsesjon/150513%20Konsesjonss%C3%B8knad_Mellomlandsforbindelser.p df http://www.statnett.no/Nettutvikling/NORDLINK/ https://library.e.abb.com/public/aaa99cf7067cd258c1257e0d002c9a7b/NordLink%20White%20Paper%20from%2 0ABB.pdf 40 - Nexia Statnett Submarine Fiber Evaluation 2015 cable (bundle)). Except where explicitly noted, this report uses the singular term “cable” in both cases. The sea cable path has a length of 521 km and a maximum depth of 450 meters. At the landfall in Vollesfjord, the cable will pass through a drilled tunnel (solid rock) of some hundred meters length and enter directly onto the seabed. The landfall north of Büsum will have a long part of shallow water. After the landfall in Norway, the power cable system will continue by a 54 km overhead line to a converter station in Tonstad (Sirdal), located north of the landfall. In Germany, the cable system will continue as an underground cable into a converter station in Wilster, 55 km southeast of the landfall. The sea cable will, for protection, be trenched to a target depth of 1 to 1.5 meter below the seabed. There will be 36 crossings of telecommunication cables, electrical cables and oil/gas pipelines. Crossings will be carried out in different physical ways. Part of the path is subject to seabed change by sand drift. The German landfall is located at a shallow water area, protected by German environmental laws. The installation campaign in the shallow water area will be conducted by laying cable from a barge for the length of about 50 km. The remaining part of the German sector will be installed by a cable ship. The barge used for the power cable installation may or may not have space for a fiber cable basket. If not, a separate barge must be used for the fiber cable, which adds some complexity. A total of four cable segments will be installed in the German sector. One of the parts will be installed in an area with a water depth of less than 1 meter. A second smaller barge will be used for installation in this shallow area by offloading cable from the larger barge. The burial process of the cable will take place with the help of a fixed sword at the barge. A cable bundle, with an additional fiber cable, may change the design of the sword (in order for a fiber cable splice box to pass through the sword). Potentially, another way of burial of the bundle (at the splice area) has to be found. The install operation in the German shallow water area is complex, and involves various risks. We have not included additional cost of engineering, design or additional work for such a solution, and this remains a risk area for adding a fiber cable. Except for the 50 km close to the German shore, the cable is planned to be installed by one laying ship and a second ship trenching the cable into the seabed. Additional protection will be used when necessary. ABB and Nexans are contracted as cable suppliers and installers, ABB in the German part and Nexans in the Norwegian and Danish part. The installation work is planned to start in 2017 and be concluded in 2019. As a potential fiber cable will only be bundled to one of the two parallel cables in Norwegian and Danish sector, the first bundled cable can be installed in 2018. 6.1.2 NordLink Termination Points The NordLink offers different connection points to other fiber networks on the Norwegian side: Tonstad in Sirdal, a remote site in relation to existing fiber networks by national providers. However, Tonstad is a hub in the Norwegian electrical grid (with available 41 - Nexia Statnett Submarine Fiber Evaluation 2015 fiber via Statnett’s lines to other transformer stations). This makes integration into the national fiber network viable. Vollesfjord in Flekkefjord, a remote site in relation to existing fiber networks. However, a new overhead power line is to be built to Tonstad, and it is likely to cross several fiber routes used by national and local providers. Careful planning of the connection point for the fiber line along the overhead line, can reduce the cost and increase market opportunities. Connection points to fiber networks on the German side: Büsum is a small town on the North Sea coast in Schleswig-Holstein, where the landing site is located nearby. The site is not a landing site for international telecom sea cables. The site is probably not suitable for connection to German fiber networks reaching several providers. The landfall may also be technically challenging, as environmental regulation has requirements for installation of a bundled cable. Wilster is a town in Schleswig-Holstein, where the converter station will be located nearby. One of the fiber routes between Hamburg and Denmark passes between Wilster and Itzehoe. A path of 21 km is used for calculating the cost of backhaul construction attributed to the fiber cable system. We have obtained competitive budget price of dark fiber from Itzehoe to Hamburg data centers. The closest known fiber hubs and data centers in Germany are located in the northern parts of Hamburg, about 60 km from Wilster. 6.2 6.2.1 The NordLink Fiber Project Fully Bundled Alternatives Our base case has two alternatives. Alternative 1 is a passively amplified system between Büsum and Vollesfjord, fully bundled to the NordLink power cable. The system will have two ROPA units, positioned about 130 km from the landfalls on each side (illustrated in Figure 11). The exact position of the ROPAs must be considered in detail by cable and equipment manufacturers. It will save cost if the positions of the ROPA installations and power cable splices are the same. Both alternatives are based on the assumption that the fiber cable can be loaded to the installation ship (Norway and Denmark) and to the installation barge or in a separate barge (Germany). 42 - Nexia Statnett Submarine Fiber Evaluation 2015 Figure 11 NordLink Bundled Passive - Alternative 1, with a Passively Amplified Fiber Cable Alternative 2, the second base case for NordLink, consists of an actively amplified system, involving four repeaters along the cable (illustrated in Figure 12). Security and protection of an actively amplified system bundled to a power cable must be more carefully considered. Figure 12 NordLink Bundled Active – Alternative 2, with an Actively Amplified Fiber Cable Furthermore, the alternative will need carefully planning related to securing the repeaters and land station equipment. The installation of a bundled repeater and a power cable has not been done before. Nexia has not looked at how this can be technically done, and it is treated as a risk element of the alternative. 43 - Nexia Statnett Submarine Fiber Evaluation 2015 6.2.2 Standalone Benchmark We have considered one benchmark alternative for the full NordLink route, a cable with active amplification technology in parallel to the NordLink power cable between Flekkefjord and North Germany. This case is called NordLink parallel standalone benchmark – active. The sea cable would be 521 km long, and assumes the same backhaul cost as NordLink bundled active – alternative 2. The landfall to Büsum in Germany is probably not viable for a fiber cable to use. The geographical area is a protected environment with a more difficult landfall than other sites in North Germany (which are located with the approximately same length from Norway). A standalone cable case would most likely consider a landfall where the cost of entry is low and governmental regulations are easy to meet. As this case is used for benchmark purposes, we have not studied potential other landfalls. 6.2.3 Partially Bundled Alternative The two fully bundled alternatives of NordLink both have risks related to the difficult installation process in Germany. The passive alternative has risks related to a world-record long distance and a high cost of equipment. The active alternative has risks related to a bundled installation to a power cable that has, to Nexia’s knowledge, never been done before. Nexia has therefore considered the options to only partially bundle the cables (illustrated in Figure 13), and find another landfall along the coast of Denmark or Germany that reduces the cable length and avoids using active amplification technology. Furthermore, it would be preferable to have a landfall at a site with better market opportunities than Büsum/Wilster. This discussion is included in Appendix II, and leads to an alternative landfall in Nørre Nebel on the west coast of Denmark. NordLink partially bundled passive to Nørre Nebel utilizes approximately 239 km of the power cable route from Norway to a point in the Danish sector. From this point, the route deviates from the NordLink path and follows in parallel to the route of the TAT-14-cable. Finally, the fiber cable reaches a landfall in Nørre Nebel, Denmark. The cable will most likely be installed with a ROPA unit, preferably at the branching point of the NordLink cable. This fiber alternative can be finished one year ahead of the fully bundled alternatives, by utilizing laying campaigns in 2017 and 2018. We have assumed a cost of installation of NOK 300 per meter, and a mobilization and demobilization cost of NOK 15 million for the campaign. The installation is assumed to be done by a single ship laying and burying the fiber cable onto shore. The landfall is assumed to have a separate cost of NOK 5 million. 44 - Nexia Statnett Submarine Fiber Evaluation 2015 Figure 13 NordLink Partially Bundled Passive to Nørre Nebel The initial cost of the partially bundled alternative is similar to the passive fully bundled alternative. However as the distance is shorter, there is significant benefits for lower cost of capacity upgrades. Finally, this alternative does not include lease of fiber between Nørre Nebel and Hamburg or Copenhagen, as we assume that the market available at the TAT-14 land station will be satisfactory for the needs of the fiber cable. 6.2.4 Standalone Benchmark Another standalone benchmark, in order to save cost, would be to cross Skagerrak at one of the shortest distances. Lease of terrestrial fiber, through Denmark and Germany, could then serve the same market demand as both fully and partially bundled alternatives. The “NordLink standalone benchmark – shortest route” case uses a fiber cable between south of Norway and north of Denmark in parallel to Skagerrak 4. From a business case standpoint, Grimstad and Hirtshals are chosen as the landfalls. The sea cable would be 122 km long, and have approximately 18 km of total land cable involved. The cost of backhaul for connecting to Copenhagen, Nørre Nebel or Hamburg would be higher than the other alternatives. Our calculation therefore includes a long-term lease of fiber between Hirtshals and Nørre Nebel for each new operational fiber pair and corresponding equipment along the route. We assumes a cost of installation of NOK 300 per meter, and a mobilization/demobilization cost of NOK 15 million. Each landfall is assumed to cost NOK 5 million. In our calculation we have assumed the same income profile as the alternatives. 6.3 Summary of figures The figures of the alternatives and standalone benchmarks are illustrated in Table 5. 45 - Nexia Statnett Submarine Fiber Evaluation 2015 Figures in million NOK NordLink bundled passive alt. 1 NordLink bundled active alt. 2 NordLink parallel standalone benchmark – active 6 6 11 11 11 68 87 85 41 15 3 3 2 2 2 Cable Installation 45 48 186 63 62 Backhaul Connection 11 11 11 5 10 Equipment (Initial) 10 13 13 10 7 143 168 307 131 107 Planning Cable Production Cable Logistics Sum NordLink partially bundled passive to Nørre Nebel NordLink standalone benchmark – shortest route Table 5 Installation Cost of the NordLink Alternatives and Standalone Benchmarks The shortest crossing of Skagerrak has a lower cost of installation than any cable fully or partially bundled to NordLink, even when the cost of terrestrial fiber between the landfall and Nørre Nebel is included. This situation will not change even if fiber to Hamburg is included. The existence of a standalone lower cost route than the fully or partially bundled fiber to NordLink does not necessarily imply that there are no synergies of a bundled fiber cable to NordLink. NordLink will constitute a separate routing and direct access to Germany or Nørre Nebel that may be of importance. This may be the case for a partner or a customer that will use NordLink in addition to the Skagerrak 4 fiber (in order to create routing diversity). Operational cost of the alternatives and benchmarks is illustrated in Table 6. Figures in million NOK NordLink per year bundled passive alt. 1 NordLink bundled active alt. 2 NordLink parallel standalone benchmark – active NordLink partially bundled passive to Nørre Nebel NordLink standalone benchmark – shortest route Commercial 0.5 0.5 0.5 0.5 0.5 Operation and Repair 1.2 1.0 1.5 1.2 1.4 Sum 1.7 1.5 2.0 1.7 1.9 Table 6 Operational cost of the NordLink Alternatives and Benchmarks 46 - Nexia Statnett Submarine Fiber Evaluation 2015 Based on the cost figures and assumptions mentioned in Section 5.3, our financial analysis has produced figures for the installation cost, net present value and payback that are illustrated in Table 7. Cost of cable, fixed backhaul and initial telecom Installequipment (figures in million NOK) ation cost Net present value (NPV) Payback in years after 2020 NordLink bundled passive alt. 1 143 -157 n/a NordLink bundled active alt. 2 168 -108 > lifetime NordLink parallel standalone benchmark – active 307 -255 n/a NordLink partially bundled passive to Nørre Nebel 131 -74 26 NordLink standalone benchmark – shortest route 107 -52 23 Table 7 Investment Summary of the NordLink Alternatives and Standalone Benchmarks 6.4 Synergies and Sensitivities Our estimates of the synergy benefits of a bundled installation are given in Table 8. The figures are based on the difference between the cost of NordLink bundled active alternative 2 and NordLink parallel standalone benchmark – active. Synergies (million NOK) Benefits Benefit of planning 5 Benefit of bundled installation 139 Annual benefit of maintenance (lifetime maintenance of 30 years) 0.5 (6) High synergy estimate (incl. 30 years of maintenance) 150 Table 8 Synergies of the Bundled NordLink Fiber Cable The synergy of a fully bundled installation compared to a parallel standalone benchmark is 47% of the standalone initial cost. The calculation does not take risk and uncertainties into account. These are not assessed and may change the figures in both directions. In order to understand the impact of potential fluctuations in the different parameters, the main parameters will be analyzed in the following section. For more details on sensitivities, see Appendix IV – Sensitivity Data. 47 - Nexia Statnett Submarine Fiber Evaluation 2015 The sensitivity element of one upfront payment of NOK 85 million (including 3% of NOK 85 million per year as operation and maintenance fee), makes two of the alternatives’ NPVs positive (illustrated in Table 9). The added value of the upfront and consecutive payments is about NOK 117 million for all alternatives. No other sensitivity element (with the chosen boundaries) makes the alternatives positive from an NPV perspective. NPV Sensitivity - Revenue Development Base Case NordLink Bundled Passive Alternative 1 NordLink Bundled Active Alternative 2 NordLink Parallel Standalone Benchmark – Active NordLink Partially Bundled Passive to Nørre Nebel NordLink Standalone Benchmark – Shortest Route -157 -108 -255 -74 -52 NOK 85 mn+3% annually -41 9 -138 43 65 Table 9 NordLink NPV Sensitivity - Revenue Development (Upfront Payments) We have assumed that the alternatives reach an 8% market share in the 4th year of operation, and thereafter have a slightly falling market share due to competition from terrestrial systems. Some of the alternatives will improve by assuming a fixed market share throughout the lifetime (illustrated in Table 10). All alternatives improve their values with about NOK 16 million, except for the bundled passive alternative. The equipment upgrade for this alternative is too high to justify its market share in an economically viable way. NPV Sensitivity - Revenue Development Base Case NordLink Bundled Passive Alternative 1 NordLink Bundled Active Alternative 2 NordLink Parallel Standalone Benchmark – Active NordLink Partially Bundled Passive to Nørre Nebel NordLink Standalone Benchmark – Shortest Route -157 -108 -255 -74 -52 8% Fixed Market Share -157 -92 -239 -59 -37 Table 10 NordLink NPV Sensitivity - Revenue Development (8% Fixed Market Share) Furthermore, we have assumed a price premium for the sea cable capacity, compared to the average market price. By removing this premium, the alternatives will lose about NOK 21 million of their value, except for the NordLink bundled passive alt 1. This is illustrated in Table 11. NPV Sensitivity - Revenue Development NordLink Bundled Passive Alternative 1 NordLink Bundled Active Alternative 2 NordLink Parallel Standalone Benchmark – Active NordLink Partially Bundled Passive to Nørre Nebel NordLink Standalone Benchmark – Shortest Route Base Case -157 -108 -255 -74 -52 0% Premium -160 -129 -276 -95 -73 Table 11 NordLink NPV Sensitivity - Revenue Development (0% Premium) 48 - Nexia Statnett Submarine Fiber Evaluation 2015 The effect of changing the discount rate is illustrated in Table 12. A rate of 5% (instead of the original 7%) improves the alternatives’ NPVs with about NOK 16 million, and a rate of 12% reduces the NPVs with about NOK 23 million. The exception is the NordLink bundled passive, which has a negative operational cash flow. Hence, a higher discount rate will improve the case. Base Case (7 %) NordLink Bundled Passive Alternative 1 -157 NordLink Bundled Active Alternative 2 -108 NordLink Parallel Standalone Benchmark – Active -255 NordLink Partially Bundled Passive to Nørre Nebel -74 NordLink Standalone Benchmark – Shortest Route -52 NPV Sensitivity - Discount Rate 5% 12% -162 -91 -240 -57 -36 -151 -132 -276 -97 -74 Table 12 NordLink NPV Sensitivity - Discount Rate NordLink is planned to be ready for service in 2020. We have simulated the effect of late and early deployment by comparing the income up to 2024 (illustrated in Table 13). This shows an effect of about NOK 8 million in reduction compared to the base case of starting in 2020, and a gain of NOK 4 million with an early start in 2019. Dependent on installation schedule, the Nørre Nebel alternative has the potential to be ready for service one year earlier and have a full year of operation in 2019. NPV Sensitivity - Revenue Offset Base Case: 2020-2024 Advanced: 2019-2024 Postponed: 2021-2024 NPV 14 18 6 Table 13 NordLink NPV Sensitivity - Revenue Offset The potential NOK 4 million gain of the Nørre Nebel alternative does not include the financial cost of investments that need to be taken at an earlier point in time. A change in the cost of transmission equipment has a positive impact on the NordLink partially bundled passive to Nørre Nebel of approximately NOK 9 million in net present value, when both a 30% lower starting cost and a higher reduction in cost of 10% per year is applied. For the other alternatives, this impact is less. The sensitivity of change in cable cost is closely related to the length of cable, and +/- 20% gives up to NOK 16 million higher or lower net present values. Similarly, a change in cost of the cable laying parameters has an impact on the alternatives of up to NOK 17 million. Neither one of these two elements changes the general picture of the alternatives’ valuation. When all positive sensitivities are applied, except for the upfront payments, the effect is not enough to make any alternative positive from a NPV perspective. However, the NordLink standalone benchmark – shortest route alternative, achieves a positive NPV. 49 - Nexia Statnett Submarine Fiber Evaluation 2015 7 Potential NSN Fiber Project 7.1 7.1.1 The NSN Project NSN Project Path44 NSN is to be built between Kvilldal in Suldal (Rogaland, Norway) and Blyth in Northumberland (UK), which is located 20 km north of Newcastle. The cable will connect the Norwegian electrical grid to the UK national grid. The main distances are illustrated in Figure 14. Figure 14 The NSN Fiber Cable Alternatives NSN is in an early construction phase, and is planned to be ready for service in 2021. Furthermore, the power cable path is ca 730 km long and has a maximum depth of ca 600 meters. In Norway, the path from the converter station will pass on land to Suldalsvannet. After crossing the lake, the cable will enter the seabed in Hylsfjorden at about a sea depth of 95 meters. The cable will then continue through a regular tunnel (in solid rock) of about 2 km in length, and finally pass through a microtunnel into the fjord. The total length from Hylsfjorden to the converter station is about 6 km. 44 http://www.statnett.no/Nettutvikling/Kabel-til-england/ http://nsninterconnector.com/pdf/P1568_RN3057-Norway-UK-Environmental-Statement.pdf 50 - Nexia Statnett Submarine Fiber Evaluation 2015 The sea cable path follows Hylsfjorden and Boknafjorden and is about 120 km in Norwegian territorial waters. Distances are approximates. In the UK, the cable system will be built as an underground cable between the landfall and the converter station (which will be located near Blyth, 2.5 km inland from the landing site). The sea cable will, for protection, be trenched to a target depth of 1 meter below the seabed. Part of the path may be subject to seabed changes by sand drift, especially close to the UK coast. There will be 65 crossings of telecommunication cables, electrical cables and oil/gas pipelines. Crossings will be carried out in different physical ways. The cable is planned to be installed by one laying ship and a second ship trenching the cable. Additional protection will be constructed when necessary. NSN is planned to be installed by six separate laying campaigns, during four seasons during 2017–2020. There may be three, two or one installing contractors. A higher number of suppliers of power cable will involve a higher cost as more freight of fiber cable as well as more change and preparation of ships for bundled laying need to be performed. 7.1.2 NSN Termination Points As in the NordLink case, the main synergies between the NSN power cable and a possible fiber cable are related to the common path and simultaneous laying and trenching of cables in one operation. NSN offers different connection points to other networks on the Norwegian side: In Kvilldal, the converter station is connected to the national grid, where Statnett has available fiber to other transformer stations. However, the distance to the national fiber networks is significant and availability of fiber may be limited. However, there exist national fiber networks (passing Suldal) on Statnett’s power lines that could provide an opportunity for connection (in the direction of Oslo, Haugesund, Stavanger and Kristiansand). Connection points to other networks on the UK side:45 The landfall is located in Chambois, just north of Blyth. The converter station will be located in East Sleekburn, about 2.5 km from the landfall. There are no existing subsea fiber cable landfalls in the area. There exist several fiber routes (that passes within 10 km of the site) controlled by different parties between Newcastle and Edinburgh. The closest data centers in the UK are located in Newcastle, about 20 km from the converter station. There is fiber infrastructure that may be available at a distance of less than 10 km from the converter station, which will reduce the needs for construction. Nexia believes the cost of capacity and dark fiber, between Blyth and London, can be a challenge for NSN’s market of capacity. Any other customer than the established operators mentioned below, would need to purchase capacity from one of these four operators, thus reducing the potential revenue of the NSN fiber system. 45 http://nsninterconnector.com/the-onshore-cables/uk/ http://nsninterconnector.com/pdf/Non-Technical-Summary_NSN%20Link_July%202014_070714.pdf 51 - Nexia Statnett Submarine Fiber Evaluation 2015 We have been in contact with four UK companies that have fiber networks nearby the Blyth landfall. These are: BT wholesale, the network operator part of the UK telecom incumbent Level 3, the tier 1 Internet transit and global network provider Virgin Media, which offers fiber services and cable TV in the UK Zayo Group, which offers capacity services, dark fiber and bespoke networks in the US and Europe More than one of these is interested in providing backhaul in the form of dark fiber, capacity and other services to a potential NSN fiber cable. We believe some of these operators also are willing to take part in a commercial development of a potential NSN fiber cable. Distances of 15 km in the UK and 23-146 km in Norway are used for calculating the cost of backhaul construction attributed to the fiber cable system. 7.2 7.2.1 The NSN Fiber Project Fully Bundled Alternative The base case for NSN is the NSN bundled active alternative, a cable with active amplification fully bundled between Kvilldal and Blyth (illustrated in Figure 15). This alternative will need careful planning related to securing the repeaters and the land station equipment. The installation of bundled repeaters and power cable has not been done before to Nexia’s knowledge. Furthermore, Nexia has not looked at how this can be technically performed, and it is treated as a risk element. Figure 15 The NSN Bundled Active Alternative NSN bundled active will have land stations in Blyth and Kvilldal. The backhaul fiber connections to potential customer has an assumed added cost of NOK 11 million. 52 - Nexia Statnett Submarine Fiber Evaluation 2015 Excluding deviations of the cable route, no passively amplified fiber alternative exists for the full length of NSN. 7.2.2 Standalone Benchmark Nexia has analyzed one standalone benchmark for NSN, the NSN parallel standalone benchmark – active alternative. The standalone benchmark is a fiber cable with active amplification technology between Stavanger and Newcastle. Furthermore, the cable path is located in parallel to NSN. The calculations are based on a complete separate installation, without any synergies with NSN power cable project. The standalone cable will be built similar to the base case, with active amplification technology. The sea cable is approximately 620 km long, and has 38 km of additional backhaul connections. The cost of construction will be affected by the number of cable and pipeline crossings that the route will involve. NSN has a total of 65 crossings (including a number of pipelines) which involves the risk of higher cost depending on pipeline crossing agreement negotiations. The benchmark will only avoid a small number of crossings by using a landfall in the Stavanger area instead of Kvilldal. The cost for cable laying operations is assumed to be NOK 300 per meter, and includes the cost of pipeline crossings etc. The overall cost is in line with budget figures Nexia has obtained from suppliers. 7.2.3 Partially Bundled Alternatives The distance along Boknafjorden (and into Kvilldal) is over 100 km and gives no apparent benefit. An obvious alternative will be to deviate from the NSN path north of Kvitsøy, enter Kvitsøy (along the existing cable routes), and further route the cable to Randaberg near Stavanger (alternative is illustrated in Figure 16). For more information, see appendix “NSN Alternative Termination Points”. Figure 16 The NSN Partially Bundled Active Alternative with a Landfall near Stavanger 53 - Nexia Statnett Submarine Fiber Evaluation 2015 A partially bundled alternative, with landfall in Stavanger, would save about 100 km of sea cable, one repeater and will have lower cost of backhaul. The alternative will have a higher cost related to a separate cable route into the Stavanger area (including landfall). The operation near Stavanger is assumed to have a mobilization/demobilization cost of NOK 5 million since a smaller ship is assumed to be used in the coastal waters. The cost of a beach landing is NOK 5 million and cable laying operations are assumed to cost NOK 300 per meter. In order to avoid active amplification technology bundled to the power cable, we have considered an alternative using an intermediate platform as a repeater site. The alternative is illustrated in Figure 17. The platform used as a repeater site could be Ula (see Figure 14) or some other along the path. Ula is operated by BP Norge. The downside of this solution is the cost of deviation from the NSN path. Ula is located about 40 km from the NSN path, and a branch point has to be installed (with an assumed cost of NOK 1.5 million). We have assumed a cost of NOK 15 million for mobilization/demobilization of a separate ship to install this section, and NOK 330 per meter for cable laying operations (which equals NOK 13 million for the distance from the power cable route to Ula). The cost of platform entry is assumed to be NOK 3 million and it will require active participation from the platform operator in order to be met. Furthermore, the cable will land near Stavanger as the previous alternative, but we assume the same ship that installs the cable to Ula can do the installation near Stavanger, thus saving one mobilization/demobilization session. Figure 17 The NSN Partially Bundled via Ula Alternative Since there exist different routes from North Sea platforms to Norway, it can be of interest to look at the alternative of terminating the installation at Ula (or a similar fiber-connected platform) and use existing fiber sea cables to Norway. However, as capacity in the existing sea cables to Norway is not available at a known market price, we have not modeled this alternative. 54 - Nexia Statnett Submarine Fiber Evaluation 2015 7.3 Summary of figures The figures of the alternatives and standalone benchmarks are illustrated in Table 14. Figures in million NOK NSN bundled active Planning NSN parallel standalone benchmark – active NSN partially NSN partially bundled active bundled passive via Ula 6 21 11 16 122 102 104 83 3 2 3 3 Cable installation 43 217 55 78 Backhaul connection 11 10 10 10 Equipment (initial) 13 13 13 20 197 364 195 210 Cable production Cable logistics Sum Table 14 Installation Cost of the NSN Alternatives and the Standalone Benchmark The operational cost of the alternatives and benchmarks is illustrated in Table 15. Figures in million NOK NSN bundled per year active NSN parallel standalone benchmark – active NSN partially NSN partially bundled active bundled passive via Ula Commercial 0.5 0.5 0.5 0.5 Operation and repair 1.1 1.6 1.0 2.3 Sum 1.6 2.1 1.5 2.8 Table 15 Operational Cost of the NSN Alternatives and the Standalone Benchmark The financial figures and assumptions mentioned in Section 5.3 have been used to calculate net present values and paybacks for the different alternatives and the benchmark (illustrated in Table 16). 55 - Nexia Statnett Submarine Fiber Evaluation 2015 Cost of cable, fixed backhaul and initial telecom Installation equipment (figures in million NOK) cost Net present value Payback in years after 2020 NSN bundled active 197 -138 > lifetime NSN parallel standalone benchmark – active 364 -314 n/a NSN partially bundled active 195 -135 > lifetime NSN partially bundled passive via Ula 210 -174 n/a Table 16 Investment Summary of the NSN Alternatives and the Standalone Benchmark 7.4 Synergies and Sensitivities Our estimates of the synergies are illustrated in Table 17 between NSN bundled active and NSN parallel standalone benchmark – active: Subject (million NOK) Benefits Benefit of planning 15 Benefit of installation 167 Annual benefit of maintenance (lifetime maintenance of 30 years) 0.5 (6) High synergy estimate (incl. 30 years of maintenance) 188 Table 17 Synergies of the Bundled NSN Fiber Cable The savings of a fully bundled installation compared to a parallel standalone benchmark is 50% of the standalone cost. The calculation does not take risk and uncertainties into account. These are not assessed and may change the figures in both directions. In order to understand the impact of potential fluctuations in the different parameters, the main parameters will be analyzed in the following section. For more details on sensitivities, see Appendix IV – Sensitivity Data. As for NordLink, the sensitivity element of one upfront payment of NOK 85 million (including 3% of NOK 85 million per year as operation and maintenance fee) gives an added value of about NOK 117 million for all alternatives (illustrated in Table 18). For NSN, none of the alternatives has a positive NPV with this added revenue. 56 - Nexia Statnett Submarine Fiber Evaluation 2015 NPV Sensitivity - Revenue Development Base Case NSN Bundled Active NSN Parallel Standalone Benchmark - Active NSN Partially Bundled Active NSN Partially Bundled Passive via Ula -138 -314 -135 -174 NOK 85 mn+3% annually -22 -197 -19 -57 Table 18 NSN NPV Sensitivity - Revenue Development (Upfront Payments) Furthermore, we have assumed that the alternatives reach an 8% market share in the 4th year of operation, and thereafter have a slightly falling market share due to competition from terrestrial systems. All the alternatives will improve by assuming a fixed market share throughout the lifetime. This is illustrated in Table 19. All alternatives improves their values with about NOK 15 million, except for the partially bundled passive via Ula (which has higher equipment upgrade cost). NPV Sensitivity - Revenue Development Base Case NSN Bundled Active NSN Parallel Standalone Benchmark - Active NSN Partially Bundled Active NSN Partially Bundled Passive via Ula -138 -314 -135 -174 8% Fixed Market Share -123 -298 -120 -165 Table 19 NSN NPV Sensitivity - Revenue Development (8% Fixed Market Share) Furthermore, we have assumed a price premium for the sea cable capacity, compared to the average market price. By removing this premium, the alternatives will lose approximately NOK 21 million of their values. This is illustrated in Table 20. NPV Sensitivity - Revenue Development 0% Price Premium Base Case NSN Bundled Active NSN Parallel Standalone Benchmark - Active NSN Partially Bundled Active NSN Partially Bundled Passive via Ula -138 -314 -135 -174 -159 -335 -157 -195 Table 20 NSN NPV Sensitivity - Revenue Development (0% Premium) The effect of changing the discount rate is illustrated in Table 21. A rate of 5% (instead of the original 7%) improves the alternatives’ NPVs with up to NOK 17 million, and a rate of 12% reduces the NPVs with up to NOK 24 million. 57 - Nexia Statnett Submarine Fiber Evaluation 2015 NPV Sensitivity - Discount Rate NSN Bundled Active NSN Parallel Standalone Benchmark - Active NSN Partially Bundled Active NSN Partially Bundled Passive via Ula Base Case (7 %) -138 -314 -135 -174 5% 12% -121 -299 -118 -163 -162 -334 -159 -188 Table 21 NSN NPV Sensitivity - Discount Rate NSN is planned to be ready for service in 2021. We have simulated the effect of late deployment by comparing the income up to 2024 (illustrated in Table 22). This shows an effect of about NOK 8 million in difference to the base case of starting in 2020. This effect will be reduced some by postponing CapEx (however, CapEx will start to run from the first installation campaign in 2017). NPV Sensitivity - Revenue Offset Base Case: 2020-2024 Advanced: 2019-2024 Postponed: 2021-2024 NPV 14 18 6 Table 22 NSN NPV Sensitivity - Revenue Offset Finally, we have assumed that CapEx is applied the year ahead of ready for service, and has not taken into account the effect of CapEx being distributed over four years for NSN. The other sensitivity elements have similar results as for NordLink. See Appendix IV – Sensitivity Data for more information. 58 - Nexia Statnett Submarine Fiber Evaluation 2015 8 Risk Elements The risks are divided into three categories: Risks related to the power cable project when bundled with fiber Risks related to the fiber cable project when bundled with the power cable project Issues for consideration Assessment of probabilities and consequences of the risk elements are not included due to the lack of details currently available. The risk elements (with probabilities and consequences) and the issues for considerations, must be considered by Statnett based on further work and dialog with relevant stakeholders (project partners, cable suppliers, authorities etc.) before a potential decision to proceed with a bundled power/fiber cable. 8.1 8.1.1 Risks Related to the Power Cable Project when Bundled with Fiber Delivery and Loading of Fiber The power and fiber cable will be produced at different sites. Therefore, the logistics of the fiber and power cable will differ, giving a risk of delay for the total project if the fiber cable is not delivered in time for loading. The production time of the fiber cable is normally shorter than the power cable, and transport and storage of the fiber cable has lower cost than of the power cable. Simultaneous loading of power and fiber cable, onto two different cable baskets on the ship, should be possible. As the fiber cable is thinner and lighter, it should be possible to load the fiber cable simultaneously and within the timeframe of the power cable loading. However, the simultaneous loading may create delays if not carefully planned. 8.1.2 Problems during Bundled Installation and Protection In general, simultaneous laying of a power and a fiber cable involves a more complicated process than installing the two cables separately. The bundled installation involves strapping the fiber cable to the power cable onboard the installation vessel as the cable bundle is installed in the sea. If problems arise during bundling with either the strapping or handling of the cable bundle, there is a risk of potential delays. The probability and consequence of the risk will depend on the specific installation and bundling method used by the installer. The inclusion of an actively amplified system and branching or ROPA units will further complicate the installation, thus increasing the risk of delays. At landfall, the cable bundle must fit into a prepared duct and/or microtunnel. This will, compared with a separate power cable installation, involve an increased risk of cable blockage (due to the bundle), and potentially delay the installation accordingly. For NordLink, in the area close to the German landfall (a distance of 50 km), the cable will be installed in an environmentally protected area. This area has strict regulations, from the German authorities, relating to the installation period and method. Operation in the area is only allowed during restricted times. If the installation is delayed outside of the allowed installation windows, 59 - Nexia Statnett Submarine Fiber Evaluation 2015 the consequence may be that further operations are delayed until the next season. This will have a large time and cost impact on the project. In the same area the installation is made difficult by areas of shallow water, and crossings of areas of 0-1 meter sea depth. The installation process is carried out from barges, which are designed for laying and burying the power cable in one operation. Adding a fiber cable in this area will require a review and potential changes to the installation procedure. There is a risk of additional cost related to design, engineering and installation time required for a potential new procedure. 8.1.3 Licenses and Regulations The licenses and permits already obtained in the projects does not include a fiber cable, and will have to be amended. There is a risk of delaying the projects if the necessary amendments are not obtained in due time. 8.1.4 Problems Related to Protection of Fiber Cable Units or Branches The protection of the cable bundle at the seabed has some additional risks compared to a single power cable. At the branching point or the repeater/ROPA units, the burial may involve more work for sufficient burial. This may include several passes by a burial engine, a separate burial or even separate protection like rock dumping (which involves an increased cost and time risk compared to a standalone power cable installation). 8.1.5 Problems Related to Unprotected Area due to Fiber Cable Units Lack of protection of the cable bundle at the seabed due to problems of burial and protection, may lead to the cable bundle being unprotected for a longer time than needed at the seabed. This may increase the risk of the power and fiber cable being damaged by fishing vessels before sufficient protection can be made. 8.1.6 Damages to Power Cable Related to Fiber Cable Installation In addition to the protection work for the bundled cables, it might be necessary to do additional protection of fiber splice boxes, branching points and ROPA units at seabed using, e.g., an ROV. Operating such equipment along the power cable involves a risk of damaging the power cable. 8.1.7 Damages to Power Cable during Repair of Fiber Cable As described in Section 4.5, there are no known secure methods for repair of a fiber cable bundled to a power cable. The repair of a fiber cable will involve uncovering the cable bundle in the seabed (length dependent on the sea depth), cutting the fiber cable in the bundle, and freeing the fiber cable from the bundle. In the case where the fiber cable is positioned below the power cable (in the area that must be unbundled), the whole cable bundle must be made free from the seabed and lifted to be able to make the fiber cable free from the power cable bundle. This operation involves risk of damage to the power cable (if such an operation will be allowed by the power cable operator). 60 - Nexia Statnett Submarine Fiber Evaluation 2015 8.2 8.2.1 Risks Related to the Fiber Cable Project when Bundled with the Power Cable Project Higher Cost of Fiber Cable in Project The need for additional cable, cable-related equipment and additional protection work, is a risk. Unforeseen circumstances leading to additional work on landfalls and areas close to shore are areas of potential cost overrun. The German landfall is in shallow waters and in an environmentally protected area. This may involve a number of risks related to the bundled laying and burial process: Preparing barges for the bundled installation Logistics of the fiber cable when the power cable may be loaded in another port Operation of the installation barges when three cables (two power cables and one fiber cable) is to be bundled Additional time used for splicing and restarting of the burial process after splicing where the fiber splice box has to pass through the fixed-mounted burial sword Off-loading of cable from a large barge to a smaller barge for installation in the shallow water area In the alternatives with deviation from the power cable route, risks related to consents/licenses, method, route, protection and general cost overrun has to be assessed. 8.2.2 Commercial Risk Related to Fiber Cable The commercial risk of the fiber cable business case is related to lower prices and sales volumes. The market for the fiber cables will partly depend on local demand in the south and west of Norway (especially the success of the data center industry), but must also take a large share of the national market for international capacity in order to obtain the assumed revenue. Changes in the market conditions, e.g. easily available dark fiber at high quality between south and west of Norway and Oslo (which will lead to more competition from terrestrial networks), increased capacity at competitive rates from Tampnet and others, will increase risk and reduce profit potential. Higher cost of sales is an additional risk, as our assumption in the financial model is that sales cost are small. As the project is planned for finalizing laying and protection by 2019/2020/2021, the fiber cable is exposed to the risk of negative market shift (lower demand), new technologies, increased competition, etc. 8.2.3 Higher Cost of Backhaul Unforeseen higher cost of backhaul might happen, as we have no clear picture of customers’ needs 30 years from now. Customers of capacity may have requirements that providers of backhaul are able to monopolize, thus reducing the revenue potential of the cable. 61 - Nexia Statnett Submarine Fiber Evaluation 2015 8.2.4 Bundled Repair Repair of sea cables are generally costly and time-consuming, and the additional complexity of a bundled fiber repair is hard to predict. As described in Section 4.5, various situations for damage to a bundled cable may occur. The situation where only the fiber cable is damaged (and not the power cable), is the risk with the most uncertain probabilities and consequences. As there is no established method for repair of a fiber cable bundled to a power cable, it is a risk that a repair campaign may not be allowed by the power cable operator during operation. As a result, a repair would have to wait for a maintenance window that may occur only once a year. Even during a maintenance window, it may prove too expensive or include too much risk of damaging the power cable, resulting in the fiber cable not being able to be repaired. A repair campaign may in this situation prove to be unsuccessful. This risk involves several potential consequences: The fiber cable can be out of operation for longer time than comparable standalone cables, potentially for several months Cost of repair of the fiber cable can be higher than for comparable standalone cables A repair campaign during a maintenance window may be unsuccessful A repair campaign may damage the power cable and take on additional costs The fiber cable may not be possible to repair at a reasonable cost The commercial development of the fiber cable can be problematic due to long repair times etc., making it difficult to sell additional capacity in the cable later and thus uphold revenue of the cable We have not assessed the probabilities of these risks and the net present value calculations have no impact from these risks. 8.2.5 Active Amplification System Bundled to Power Cable In the case of power outage of the power cable, currents will be induced in the power feed of the fiber cable (in an actively amplified system). These currents may damage the active amplifiers if security measures do not work satisfactory. In the case of common damage to both the fiber and power cable, the high voltage of the power cable may follow the power conductor or the protection sheet of the fiber cable and damage the active repeaters. The currents may also enter the telecom land stations. Hence, necessary security measures must be in place for equipment and personnel that may be at the sites. If several repeaters are damaged, it may not be economically viable to repair the fiber cable system. 8.3 Issues for Consideration Before going forward with one or two fiber projects, a number of issues should be considered by Statnett and the project partners. Our list may not be covering all aspects of importance. 62 - Nexia Statnett Submarine Fiber Evaluation 2015 8.3.1 Ownership of Fiber Cable Ownership of fiber cable should be addressed if going forward with any of the fiber projects. As a cable bundle will have issues related to the installation and operation of both the fiber and power cable, the ownership of the fiber cable will decide the type of agreements that must be in place and how the risks are handled. Furthermore, it will address formal issues related to licenses, permits and, potentially, third party agreements (e.g. pipeline crossings and right-ofway). Related to the structure of ownership, financing of the fiber cable investment must be handled. 8.3.2 Responsibility of Fiber Cable during Installation The responsibility of cost and risk during installation of the cable bundle between the parties involved must be handled. These parties are the power cable owners, the power cable contractors, the fiber cable suppliers and potential fiber customers/partners. 8.3.3 Responsibility of Fiber Cable during Operation and Maintenance The responsibility between the parties of costs and risk during operation and maintenance of the bundled cables must be handled. This includes the responsibility of Statnett and power cable partners, maintenance/repair contractors, fiber cable suppliers (for spare parts), potential fiber partners, etc. 8.3.4 Statnett’s Role in the Fiber Operation There is a need for clarification of Statnett’s priorities if a conflict between the grid operator role and fiber development arise. Statnett’s current role does not include operation of a commercial fiber cable. 8.3.5 Third Party Agreements A fiber project will need agreements to install landfall telecom stations and right-of-way for installing cables over private land (when this is not covered by power cable projects agreements and rights). For sea fiber cable routes deviating from the power cable routes, all consents must be obtained related to cable and pipeline crossings, private lands, etc. 63 - Nexia Statnett Submarine Fiber Evaluation 2015 9 Discussion and Results To be able to better understand the performance and rationale for the two possible fiber cable projects, we have decided to summarize our view on the NordLink and NSN fiber alternatives, which is outside the scope given by the four distinct questions in Section 1.1. However, we believe the overviews given in Sections 9.1 and 9.2 gives important contexts to our discussion of the scope in Sections 9.3. 9.1 NordLink Discussion and Results All NordLink alternatives have negative net present values in the range of NOK -74 to -157 million when excluding income from anchor customers or other partners, as shown in our discussion of the NordLink system in Section 6.3. The calculation of payback has been done with a discount rate of zero, and it shows that one alternative and one benchmark have a possible payback late in their lifetimes. There is a number of risks identified in Section 8.2, and the sensitivity analysis cover some of these. Generally, none of the sensitivity elements individually change the overall picture of the net present value for each alternative, the exception for this is the large up-front payments. Revenues All alternatives and standalone benchmarks have the same revenue profile. The alternatives have different landfalls and properties that we have taken into account by assuming differences in the backhaul costs. The revenues are assumed to grow to 8% of total market capacity during the first 4 years of operation. This is equivalent to over NOK 7 million of income. Such a growth will be challenging to reach due to competition from existing fiber systems which already represents overcapacity. With the coming technology shift from 10 to 100 Gbps, this overcapacity will be significant. Even if NordLink takes its partial share of the market (8%), it will not be sufficient to provide an NPV positive business case for any of the alternatives, without upfront payment from anchor customers or other partners. Some considerations are to be taken into account, e.g. that some regions of Norway (south/west) are not as well connected to the NordLink fiber market. The market for the NordLink system is described in Section 3.6. The analysis of sensitivities shows that only large (upfront) payments can make the alternatives net positive. Even a potential combined positive effect of all the other sensitivities analyzed, is not equally significant. We have included an annual sales cost of NOK 0.5 million in the financial model, which is assumed to be the marginal cost of sales for an organization that already has a sales operation in the relevant telecom markets. A new dedicated sales organization for NordLink and NSN (see Section 9.2), will have higher costs. Our calculation of market price for dark fiber in Section 3.3 gives a value of NOK 16 million for a dark fiber pair in the NordLink fiber bundle. With a net present value of NOK -74 to -157 million, there has to be a number of dark fibers committed, or a price that is higher than the market price to cover the gap. This is briefly discussed in the NordLink alternatives below: 64 - Nexia Statnett Submarine Fiber Evaluation 2015 NordLink Bundled Passive Alternative 1 The NordLink fully bundled passive alternative is the least financially attractive alternative. This is due to the limited capacity that each fiber pair can give (400 Gbps), giving a significantly higher equipment cost for upgrades than for the alternatives. The only possibility we see for this alternative is if there is a customer in need of a unique direct route between Norway and Germany, with a willingness to pay for capacity that is well above current and future market price. In addition to the general risks described in Chapter 8 for bundled fiber and power cables, this alternative has several special risks related to installation in the shallow water area in German sector. NordLink Bundled Active Alternative 2 The NordLink bundled active alternative has a higher net present value and higher installation cost than the NordLink bundled passive (see Table 7, page 15). The benefit of this alternative compared to the bundled passive alternative, is the significantly more capacity it can provide, thus being able to keep up with marked demand. There are some challenging risks to this alternative (discussed in Chapter 8) that need to be carefully studied before going forward with this alternative: Several types of risks related to the bundling of an actively amplified system to a power cable Risk of installation in the shallow water area in German sector We have received different indications on cost of actively amplified systems, and there is a risk of higher cost to such systems generally. NordLink Parallel Standalone Benchmark – Active The parallel standalone benchmark alternative has the highest cost and the lowest net present value. It may be built during a shorter timeframe than the bundled alternatives, but our sensitivity on timing shows that this will not change the valuation much. Comparing this standalone benchmark with the NordLink bundled active, the difference in installation cost is NOK 139 million, being the potential synergy of a bundled installation. Nexia considers it unlikely that such a standalone system will be built on a commercial basis. NordLink Partially Bundled Passive to Nørre Nebel Among the NordLink bundled alternatives, the NordLink partially bundled to Nørre Nebel has the lowest cost of installation and least negative NPV. In addition, this alternative has other benefits compared to the other alternatives: A short fiber distance makes passively amplified (or even unamplified) systems technically viable Since the German sector is avoided, this alternative has the lowest complexity and installation risk of the bundled alternatives Less technology-related risk than an actively amplified system fully bundled to NordLink. It offers direct access to the TAT-14 landing station in Nørre Nebel It may be finalized in 2018, one year ahead of the complete NordLink project However, there are some downsides as well: 65 - Nexia Statnett Submarine Fiber Evaluation 2015 The need for a separate installation campaign when deviating from the NordLink route to the landfall (and associated risks) The risk of not obtaining consents of installation at the sea and land route Of the NordLink bundled alternatives, this alternative is the most economically viable. The distance offers high capacity and easily available equipment, and terminates at an interesting telecommunication point in Denmark. However, the case has still a negative NPV of NOK 74 million. In addition, the deviation from the power cable route requires a large fiber sea cable installation campaign outside the scope of Statnett’s project. NordLink Standalone Benchmark – Shortest Route The standalone benchmark of a short route across Skagerrak has the lowest installation cost and the least negative net present value of the NordLink alternatives and benchmarks. This benchmark has a NOK 22 million higher NPV than the Nørre Nebel alternative, and even if it turns out that bundled fiber and power cables have less risk of damage, this benchmark may very well still be better when all risks are taken into account. However, as the bundling gives other types of risks (not being able to repair because the fiber/power cable bundle), we believe such decision should be taken by those taking this risk. Depending on the role and usage the new fiber cable will have for a potential customer, the standalone benchmark might be a better option than the NordLink bundled, with lower installation cost and less risk than a bundled installation. For some customers, a possible use of existing infrastructure in Denmark for backhaul might be negative if they are looking for diversity and redundant routes to existing fiber routes. On this basis, one could argue that this benchmark is overvalued when it uses the same revenue assumptions as the other alternatives. 9.2 NSN Discussion and Results The financial analysis of the NSN alternatives is based on the same pricing and volume assumptions as NordLink. All alternatives have negative net present values in the range NOK -135 to -174 million when excluding income from anchor customers or other partners (as shown in the NPV column in Table 16, in Section 7.3). None of the alternatives have payback in their lifetime. There is a number of risks identified in chapter 8 and the sensitivities cover some of these. Generally, none of the sensitivity elements individually change the overall picture of the net present value for each alternative, the exception for this is the large up-front payments. Revenues All NSN alternatives and standalone benchmarks have the same revenue profile as the NordLink alternatives. A deeper analysis of the business potential may have uncovered whether the Norway–UK market is larger or smaller than the Norway–German market. Nexia has no basis to believe either. As a result, we use same revenue assumptions for the NSN alternatives. It may be argued that a landfall near Stavanger has a larger business potential than Kvilldal and giving less cost and risk than a long backhaul connection from Kvilldal. However, we have not taken this into account. Our calculation of the market price for dark fiber in Section 3.3 gives a value of NOK 36 million for one dedicated fiber pair in the NSN fiber bundle. Compared to a net present value of the 66 - Nexia Statnett Submarine Fiber Evaluation 2015 least NPV negative NSN alternative (of NOK -135 million), there has to be more capacity committed, or a price that is higher than market price to cover the gap. The risk of higher cost of backhaul may be larger in the UK, as the distance is longer and alternatives may be fewer than in Denmark or Germany. NSN Bundled Active The fully bundled alternative represent an initial investment of NOK 197 million and a negative net present value of NOK 138 million. The benefits of the alternative: Follows NSN the whole path, with no deviations There are some downsides of this alternative: The landfall in Kvilldal gives long backhaul to Stavanger/Kristiansand or other connection points of potential customers Several types of risks related to the bundling of an actively amplified system to a power cable This alternative has a large negative net present value and involves the uncertainties of a bundled actively amplified system. This results in an alternative which needs large up-front payments in order to be commercially viable. Compared to the existing fiber routes offered by Tampnet, such financing might be a challenge. NSN Parallel Standalone Benchmark – Active The parallel standalone benchmark alternative has an initial investment of NOK 364 million and a negative NPV of NOK 314 million. It is unlikely that such a system can be financed and built based on commercial principles in a competitive market where Tampnet operates with their existing fiber routes. NSN Partially Bundled Active The NSN partially bundled active deviates from the NSN path and lands near Stavanger. This gives a slightly lower installation cost and the least negative net present value of the NSN alternatives. The benefits of the alternative: Direct access to Stavanger, hence lower cost and complexity of backhaul There are some downsides of this alternative: Cost and complexity of a separate campaign for a landfall near Stavanger Several types of risks related to the bundling of an actively amplified system to a power cable This alternative has a slightly lower investment cost and higher NPV than the fully bundled alternative. A landfall close to Stavanger can represent a small improvement in market opportunity and improved quality (lower latency) than the fully bundled alternative. This will however not make a significant difference regarding the valuation. 67 - Nexia Statnett Submarine Fiber Evaluation 2015 NSN Partially Bundled Passive via Ula This alternative has a NOK 15 million higher installation cost, but a NOK 39 million lower net present value than the NSN partially bundled active. The reason for this is the higher cost of equipment upgrade of two long passively amplified routes, including equipment on the Ula platform (operated by BP Norge). An improvement in cost and value could have been obtained by using Lomond, a platform operated by BG Gas very close to the NSN cable path. BG Gas has however shown no interest in discussing such an option. We have therefore used Ula in our calculations. The benefits of the alternative: No risks of an actively amplified system bundled to a power cable The option to sell capacity or fiber to oil and gas sector customers The downsides of the alternative: Two deviations from the NSN path, giving more complexity Risk of costly access and operation of equipment on a platform A long distance of 406 km will require ROPA, more costly equipment and less channels/capacity than an actively amplified system. This alternative is only possible to realize with a close co-operation with a platform operator (e.g. BP or BG Gas). In that case, it may be possible to improve the business case slightly, e.g. by coordinating the cable installation with other offshore work. If such interest does not materialize, there is no basis for this option. 9.3 Discussion and Results Related to Our Scope Our scope contains four distinct questions. In this chapter we have summarized the findings for each of the systems, NordLink and NSN, related to our 4 different scopes. Scope (a): To which degree is it practically viable to establish fiber cables without signal amplification. We have discussed the technical distances of fiber with and without amplification in Section 4.1.2 and 4.1.3. Our conclusion is that for both NordLink and NSN, it is not practically viable to establish fiber cable without amplification, since the distances of NSN and NordLink are 730 km and 521 km respectively. Both of the distances are regarded to be out of the technical reach without the use of either passive or active amplification. The supplier and expert sources we have interviewed believe that the NordLink alternative with passive amplification can have a capacity of up to 4x100 Gbps per fiber pair by 2020. However, our financial model shows that this alternative cannot achieve a high market share in a financially attractive way. The reason is that the equipment investment level per lit fiber pair is high. Nexia considers it practically viable to establish a passively amplified fiber cable bundled to NordLink, but with significant limitations in the available capacity which reduces the commercial attractiveness. A passively amplified fiber system with the length of the NordLink route of 521 km will be approximately 20% longer than any previously installed passively amplified system. 68 - Nexia Statnett Submarine Fiber Evaluation 2015 For NordLink, a passively amplified system without capacity limitations can only be obtained by deviating from the NordLink route and make a landfall in Denmark. This would however include an approximately 80 km standalone fiber route, outside the scope of Statnett’s power cable project, from the NordLink cable to the landfall in Denmark. For NSN, it is not practically viable to establish a bundled fiber cable without active amplification due to the distance of 730 km. By deviating from the original route and enter the fiber cable to an oil or gas platform close to the route (and by installing transmission equipment at the platform), passive amplification technology can be practically viable. The installation of an actively amplified system bundled to the NordLink and NSN power cables may be practically viable, even though such a solution has not been installed to date. There are several areas of risk related to installation and design of an actively amplified system compared to passively amplified and unamplified systems. However, some of the expert interviewed say the technical challenges can be solved, while other discourage a bundled active amplified solution. For NSN and NordLink, It is not practically viable to establish fiber cables without amplification. There exists several alternatives by using amplification and/or deviation from the power cable route with various risks and challenges. Scope (b): What are the risks and operational consequences of a bundled installation of an HVDC and a fiber cable. We have in Chapter 8 identified and described a number of risks for a bundled installation. We have not assessed the risks’ probabilities and consequences, and neither potential remedies. However, some of the risks we have identified are complex and some technical risks may not have well-developed remedies. The risks to a bundled installation of fiber and power cable are related to the following issues: 1. The bundled installation of fiber and power cables 2. Complexity during operation and potential repair 3. Commercial risk of the fiber cable investment The installation risk is related to the bundling of the cables during laying and protection (at the seabed and landfall). The fiber cable will in all alternatives involve splice boxes or other items along the cable, which need to be handled specially during burial at the seabed. The complexity and risk elements in the shallow water area close to the German shore of NordLink, will be a challenge. Potential use of active amplification bundled to a power cable has not been done before, and involves several technical risks. Risk and complexity during operation and maintenance is mainly related to the case where either or both of the fiber and power cable are physically damaged, and in need of repair. Any repair or maintenance of only the fiber cable will most likely need to be performed in the maintenance periods of the power cable, which typically is once a year, and will involve risks to both the fiber and the power cable. There may be cases of fiber cable failure that are not possible to repair, or that cannot be carried out because of the risk of damage to the power cable. 69 - Nexia Statnett Submarine Fiber Evaluation 2015 The commercial risk of a fiber cable installation is related to the highly competitive market for international capacity out of Norway. Our analysis in Section 3.2 shows a continuous strong growth in capacity demand, combined with decreasing prices, creates market risks and opportunities that need to be handled. The potential NordLink and NSN fiber bundled installation have several risk areas and operational consequences with possible impact on the power cable project. We have not assessed these in detail, but our mapping shows complex and challenging risks related to all alternatives. If going further, these risk should be assessed and responsibilities towards the power cable project should be defined, before making an investment decision. Some bundled alternatives involve first-time risks and may not have existing technical remedies. All alternatives involve large market risks. Scope (c): Find realistic levels of investment and operational costs that a fiber network with or without amplification will have. Cost of a standalone fiber system for reference purposes. Budgets on potential income and costs. The estimates of cost elements are covered in Chapter 6 and 7. For this part of our scope, the discussion in Sections 9.1 and 9.2 is relevant. We have estimated the investments and operational costs as well as revenues for three fiber cable alternatives for NordLink, and three alternatives for NSN. The initial construction cost for the alternatives are in range of NOK 131–168 million for NordLink and of NOK 195–210 million for NSN. The standalone benchmarks are in the range of NOK 107–307 million for NordLink and NOK 364 million for NSN. There are uncertainties connected to cost and revenue estimates since they are not based on firm offers. The low-cost standalone benchmark for NordLink involves crossing of Skagerrak (which is significantly shorter than NordLink), and using terrestrial fiber onwards, giving approximately a NOK 24 million lower investment than the lowest cost alternative. Nexia has not planned this benchmark in detail and found whether it may serve the same market and obtain the same market share as the alternatives. The model assumes the same revenue streams for all alternatives and standalone benchmarks. Based on our market and revenue analysis presented in Section 3.2.3, each potential fiber cable can obtain an annual revenue of NOK 7.4 million by 2024, and have an OpEx between NOK 1.5 and 3 million annually. 70 - Nexia Statnett Submarine Fiber Evaluation 2015 Investments related to a fiber bundled to NordLink is NOK 143 million for a passively amplified system, and NOK 168 million for an actively amplified system.There exist comparable standalone options with lower investments than systems bundled to NordLink. Investments related to the fiber cable along NSN is at least NOK 195 million. A standalone fiber system will have a CapEx between NOK 107 million (Skagerrak crossing) and NOK 364 million (Norway–UK). Our budget indicates an annual revenue of up to NOK 7.4 million and operational cost of NOK 1.5 to 3 million for each of the fiber cables. Scope (d): Which market opportunities exist for the sale of dark fiber and/or optical wavelengths to telecom customers. For this part of our scope, the discussion in Sections 9.1 and 9.2 is relevant. Nexia estimates that the Norwegian market for international fiber-based capacity is worth approximately NOK 39 million in 2015. The market is growing, and we assume a market value of around NOK 140 million in 2050. The analysis is presented in Chapter 3. During the last 15 years, the price of capacity has fallen steadily and traffic volumes risen exponentially. Nexia considers the international capacity market between Norway and neighboring countries in Northern and Western Europe to be generally well served today with a significant number of providers. There is a significant over-capacity in all international routes out of Norway, especially from the Oslo area. Other areas have less options and competition. The south and west of Norway where the NordLink and NSN have landfalls, are among these. A very large share of the Norwegian international traffic is transported on terrestrial cables from Oslo through Sweden and Denmark. Tampnet has fiber connections between Norway and UK and has traditionally targeted the oil and gas sector. Tampnet has recently started to offer capacity to customers outside of this sector, and will offer capacity with diverse routing and less latency than the terrestrial routes. We find the requirement from the oil and gas sector to be well served by existing solutions by Tampnet, and that their existing networks are under-utilized currently. We see no obvious source of finance from this sector for NSN or NordLink. Our scenario describes a market where the current development continues for the next 35 years. Even if a possible NordLink and NSN fiber cable takes its relative fair share of the market (one cable in addition to the existing 12, equivalent to an 8 % market share), all alternatives have a negative business case when no up-front payments from anchor customers or partners are included. In our financial model, we have not included any large (upfront) payments. We have received opinions pointing at potential international data center customer in south and west of Norway that could be a source of such financing. We have not received sufficient details in order to include such funding in our model. Furthermore, a potential customer will compare the alternatives to NordLink and NSN (i.e. standalone cables and capacity in existing cables), and Nexia finds the alternatives to be competitive. The business case for the NordLink fiber cable is less financially attractive than a standalone crossing of Skagerrak, as seen in our benchmark calculation of the shortest route. In addition, the two existing fiber cables crossing Skagerrak (Denmark-Norway 5 and Skagerrak 4) and the 71 - Nexia Statnett Submarine Fiber Evaluation 2015 two Tampnet cables to the UK will have a competitive and financial advantage to the NordLink and NSN fiber projects. On this basis, Nexia finds that a NordLink and an NSN fiber project should secure full financing (CapEx, OpEx and risk coverage) of the cable projects prior to start-up. Our model shows that a “fair” share of the international capacity market out of Norway is not enough to enable a profitable business case. The whole or a large share of the fiber cable investment must be secured from anchor customers or other partners in order to create an economically viable business case. 72 - Nexia Statnett Submarine Fiber Evaluation 2015 10 List of Sources Suppliers Cisco Ciena/Lambda Networks Xtera Transpacket Huawei Potential customers/partners Telenor TeliaSonera Infragreen Tampnet Altibox Broadnet Zayo Group Level 3 Green Mountain BT Virgin Media Other sources that may be experts in various areas Simula Westnet Statnett Lister-rådet Agder Energi Svenska Kraftnät Free-standing consultant Global Connect BP Norge BG Group Cinia 73 - Nexia Statnett Submarine Fiber Evaluation 2015 Appendix I - Methodology Financial Modeling Our financial model calculates the economical viability of each fiber cable alternative, combining Statnett’s marginal cost and synergies with the assumed market access ability and operational synergy of a well-established service provider/telecom operator. The different alternatives (along with the standalone benchmark alternatives) have all been simulated in a financial model in order to obtain an understanding of the income potential as well as associated installation and maintenance cost. Figure 18 The Financial Modeling Process An overview of the modeling process is illustrated in Figure 18. The first step involves categorizing all of the cost components associated to each alternative. The second step is the construction of a model in Microsoft Excel 2013. Each alternative is analyzed with respect to income potential, installation cost, maintenance cost, etc. As a third and final step, all of the data is summarized and graphically visualized with corresponding sensitivity analyses. Figure 19 The Main Parts of the Financial Model 74 - Nexia Statnett Submarine Fiber Evaluation 2015 Figure 19 illustrates the general parts of the financial model. There are mainly three parts of the model: 1. Input Section The input section gathers all alternative-specific data as well as common data for the different installation alternatives. 2. Calculations Section The calculation section consists of 11 main functions. Function 1 considers all prerequisites discussed in the Market Analysis section and estimates the market development, appropriate market shares obtained by the fiber optic systems, etc. Function 2-6 and function 7-9 are cost summaries of the installation and maintenance costs involved for each of the different alternatives. Furthermore, function 10 performs a cash flow analysis of the eight alternatives and calculates the corresponding Net Present Value (NPV), payback, Internal Rate of Return (IRR), etc. Finally, function 11 performs a sensitivity analysis of all major revenue- and cost-driven parameters. 3. Output Section The output section summarizes the main financial parameters for each of the alternatives with corresponding sensitivity analyses. 75 - Nexia Statnett Submarine Fiber Evaluation 2015 Appendix II – Assessment of Termination Points NordLink Alternative Termination Points A connection from the Norwegian landfall in Vollesfjord to existing fiber cable systems can be made by constructing fiber along the power lines to Flekkefjord, Feda or along the railroad close to Sira (where the new overhead lines to Tonstad will be built). We assume that a fiber cable can be integrated in the overhead line as an optical phase or ground wire (OPGW). However, reaching one existing cable infrastructure may not be sufficient to enable the full market potential of the cable. As an alternative to investing in more fiber (to reach other fiber networks), alternative landfalls in Norway can be of interest to consider. The landfall of the Valhall power and fiber cable at Lista, is one alternative with an existing landfall facility. Based on an alternative landfall in Lista, the cable path will be about 10 km shorter. There will be an extra cost of laying and trenching of the fiber cable along the alternative route, and potential higher cost for establishing a landfall, as no synergies with NordLink will be achieved. The benefit can be lower backhaul cost, as an existing fiber connection is established for the Valhall cable landfall. The backhaul options from Vollesfjord (Flekkefjord, Feda, Sira) or Lista (Farsund) include Telenor, Broadnet, TDC and Agder Breiband in combination with Altibox. Jernbaneverket is in the process of upgrading fiber cables to Stavanger and Oslo, which makes dark fiber available in the market. Statnett also has dark fiber available on grid lines built in the recent years, which may help providing backhaul (e.g. reaching other routes). On the German side, several alternative landfalls exist. As the cable is routed in parallel to Denmark, it is an option to make the cable route shorter, market potential larger and backhaul cost smaller by considering another landfall. The additional cost of deviation from the route would be a separate laying and protection process of the fiber cable (without any synergies from the power cable). There are several existing landfalls of other fiber cables along the German and Danish west coast. To our knowledge, the most interesting existing landfalls are: The landfall of TAT-14 in Nørre Nebel, Denmark The landfall of Pangea near Esbjerg, Denmark The landfall of AC-1 at Sylt, Germany Establishing a new landfall is possible, but would involve a higher risk for obtaining governmental consents and a higher cost of backhaul (to reach existing fiber network operated by potential customers). The landfall at Nørre Nebel is operated by TeliaSonera International Carrier and it is a part of the TAT-14 connection. TAT-14 connects USA to Denmark, Germany, the Netherlands, France and UK in a ring structure. TAT-14 is one of the seven operational North Europe to North America systems, and operates currently at 3.15 Tbps. As a large number of carriers have and still use capacity in TAT-14, Nexia believes that TAT-14 carry a large share of Norwegian traffic to and from USA. Both TeliaSonera and Telenor were among the 19 original members of TAT-14. Fore more information, see https://www.tat-14.com/tat14/ Using Nørre Nebel as a landfall (and following the northern path of TAT-14 from the crossing and to the landfall) would result in a total fiber cable length of 322 km, of which 83 km would be the deviation distance from the NordLink path. An agreement on access for co-location with 76 - Nexia Statnett Submarine Fiber Evaluation 2015 TeliaSonera or another operator present in at the site would reduce costs. We have estimated the number of potential customers in Nørre Nebel to be four operators (including TeliaSonera). The number is based on consortia members with significant business in Norway. Dark fiber from Nørre Nebel to Copenhagen or Hamburg can be leased by additional customers. A full mapping of potential customers and the fiber networks at Nørre Nebel would give a better understanding of the full potential. There have been Internet postings on possible surveillance of TAT-14 traffic made by foreign intelligence units. For more information, see http://www.dr.dk/nyheder/viden/tech/ervestjylland-centrum-i-spionage-program We do not see the existence of possible surveillance programs related to TAT-14 as a parameter that reduces the value of a new fiber cable to the TAT-14 landing site. Both lawful and illegal surveillance can happen in any cable landfall or data center. Increasing connectivity and number of international links will increase users’ options to reduce the number of sites where surveillance can occur. The landfall of the Pangea North cable near Esbjerg gives a longer total path, and about the same deviation from the NordLink path. Pangea North connects UK and Denmark, but it is unclear to us who operates the cable (Pangea went bankrupt in 2002). As the landfall most likely also gives less potential than the alternatives, we have chosen not consider the landfall in question any further. The landfall of AC-1 (Atlantic Crossing 1) in Sylt, Germany, is about 90 km northwest of Büsum. AC-1 is a transatlantic cable system between USA, UK, Germany and the Netherlands in a ring solution built in 1999 and it is owned by Level 3. A landfall in Sylt would give a shorter total cable length, but Nexia has reason to believe that the site most likely presents a challenge as far as the landfall and the backhaul situation are concerned. Therefore, Sylt is considered to be less favorable than Nørre Nebel. NSN Alternative Termination Points The NSN path continues about 100 km to Kvilldal after passing Stavanger. Therefore, there exists a strong argument for a landfall of the fiber cable near Stavanger. This would result in a shorter total length, which saves cable and equipment cost, and a landfall closer to customers in the Stavanger area. In the financial model a landfall at Kvitsøy with a telecom site close to the landfall, has been used. From there, the fiber cable continues to Randaberg (13 km north of Stavanger). The fiber cable uses the same path as the current fiber and power cable crossing of Boknafjorden. This will give a total length of 620 km, and a deviation from the NSN cable of about 3 km. This landfall on the Norwegian side is the basis for all NSN alternatives (including the benchmark) except for the NSN Bundled Active alternative (which uses the full power cable route). We think Kvilldal only should be considered as a landfall if Statnett obtains a guarantee for coverage of both the extra cost and lost opportunities of a Stavanger landfall. We do not consider other landfalls to be of interest in the UK, as these would involve a longer path. The total length of the NSN fiber will still be too long for a cost-effective passively amplified system. If the system is to be within the range of such technology, an intermediate installation must be considered. 77 - Nexia Statnett Submarine Fiber Evaluation 2015 There are platforms for oil and gas production near the NSN route. Thus, route deviations of the fiber cable to offshore installations are possible. However, entering a fiber cable onto a platform involves a number of challenges: Formal agreements with platform operators and field owners Security for platforms when ships install the fiber cable Existence of available J-tubes for pulling in the fiber cable Existence of available data room capacity with sufficient and secure power Available staff on platforms to perform simple technical tasks Logistics capabilities (i.e. transport of equipment & engineers) There are a number of platforms (within reach of the route) which are located nearby the midpoint of the NSN route. Some examples are: Lomond, operated by the BG Group, ca 2.3 km from NSN Ula, operated by BP, ca 40 km from NSN Everest, operated by BG Group, ca 50 km from NSN We have been in contact with BG Group, which operates the oil and gas producing platform of Lomond. Lomond is connected to a gas and oil pipeline system in the area, and is for communication purposes, connected to Tampnet’s network. A connection to Lomond would be about 342 km from Blyth and about 270 km from Kvitsøy, involving less than 3 km of fiber cable from a branching point along the NSN, and the Lomond platform. Nexia has not been able to obtain an answer from BG Group of such a connection can be discussed with BG Group. Nexia has been in contact with BP, which operates the oil producing platform of Ula, and the initial response from BP is positive. A connection of Ula would, in the shortest alternative, be about 400 km from Blyth and about 310 km from Kvitsøy. This calculation is based on the shortest route from NSN to Ula, and gives about 40 km of fiber cable installation between NSN and Ula. The amount of cross pipelines can be avoided by making the branch further east. However, this will result in the Blyth segment being longer, the Kvitsøy segment somewhat shorter, and the distance from the branching point to Ula longer. For sake of simplicity, we will use Ula and the direct and short route as the basis for calculation, but that does not rule out the use of the other platforms and routes to be of equal potential or better. Ula is also connected to the fiber cables NorSea Com and CNSFTC. NorSea Com is a fiber cable between Kårstø in Rogaland and Lowestoft in Suffolk (UK) and the cable is owned and operated by Tampnet. NorSea Com connects to several offshore installations, and it also delivers capacity between Stavanger and London. CNSFTC is a fiber cable between Ula and Cruden Bay near Aberdeen (via Forties and Everest). Tampnet acquired CNSFTC from BP in September 2014. Connecting a NSN fiber cable to Ula could be a part of different alternatives: Breaching the Stavanger–Blyth link into two parts of 400 and 310 km, thus making passively amplified systems viable. This would offer diversified capacity to Tampnet and, thus, Tampnet’s offshore customers. 78 - Nexia Statnett Submarine Fiber Evaluation 2015 Construction of the route Blyth–Ula, and enter into an agreement with Tampnet for resell of capacity Ula–Stavanger via NorSea Com. Construction of the route Blyth–Ula, and construction of a new cable between Ula to Valhall. Futhermore, enter into agreement with BP for fiber connection between Valhall and Lista. This would involve more than 100 km of additional cable path in an area with a high level of offshore activity, pipeline crossings and other costly elements. Construction of the route Stavanger–Ula, and enter into an agreement with Tampnet for capacity Ula-London via NorSea Com. All these alternatives would involve an agreement with BP and/or Tampnet. For the financial model, we will use Ula as an intermediate repeater station in the alternative “NSN Partially Bundled Passive via Ula”. 79 - Nexia Statnett Submarine Fiber Evaluation 2015 Appendix III - Basis for Market Size The calculation made in Section 3.2.1 is based on the assumptions for 2014 illustrated in Table 23. Operator 1 Operator 2 Operator 3 Operator 4 Operator 5 Operator 6 Other operators Total Transit and peering 200 100 60 40 40 30 30 500 Transit and peering diversity 200 100 60 40 40 30 30 500 Capacity sales Sum Gbps 120 0 0 80 20 80 200 500 520 200 120 160 100 140 260 1500 Table 23 Basis for Market Size As Other operators sell transit to and perform peering with Operators 1–6, this volume is only counted once for Operator 1–6. The volume of Other operators is therefore other sales and use. 80 - Nexia Statnett Submarine Fiber Evaluation 2015 Appendix IV – Sensitivity Data Fiber Cable Price The following tables and figures show the impact on the net present value of each case when the fiber cable price is increased and decreased with 20 % respectively. NPV Sensitivity - Fiber Cable Price (NOK million) NordLink Bundled Passive Alternative 1 NordLink Bundled Active Alternative 2 NordLink Parallel Standalone Benchmark – Active NordLink Partially Bundled Passive to Nørre Nebel NordLink Standalone Benchmark – Shortest Route Base Case NPV Sensitivity - Fiber Cable Price (NOK million) NSN Bundled Active NSN Parallel Standalone Benchmark - Active NSN Partially Bundled Active NSN Partially Bundled Passive via Ula Base Case -157 -108 -255 -74 -52 +20 % -170 -123 -271 -82 -55 -20 % -145 -92 -239 -66 -49 -138 -314 -135 -174 +20 % -160 -332 -154 -190 -20 % -116 -295 -117 -158 81 - Nexia Statnett Submarine Fiber Evaluation 2015 Discount Rate The following tables and figures show the impact on the net present value of each case when the discount rate is increased and decreased to 12 % and 5 % respectively. NPV Sensitivity - Discount Rate NordLink Bundled Passive Alternative 1 NordLink Bundled Active Alternative 2 NordLink Parallel Standalone Benchmark – Active NordLink Partially Bundled Passive to Nørre Nebel NordLink Standalone Benchmark – Shortest Route Base Case (7 %) -157 -108 -255 -74 -52 5% -162 -91 -240 -57 -36 12% -151 -132 -276 -97 -74 NPV Sensitivity - Discount Rate NSN Bundled Active NSN Parallel Standalone Benchmark - Active NSN Partially Bundled Active NSN Partially Bundled Passive via Ula Base Case (7 %) -138 -314 -135 -174 5% -121 -299 -118 -163 12% -162 -334 -159 -188 82 - Nexia Statnett Submarine Fiber Evaluation 2015 Annual Cost Reduction of Transmission Equipment The following tables and figures show the impact on the net present value of each case when the annual cost reduction of transmission equipment is increased and decreased to 10 % and 4 % respectively. NPV Sensitivity - Annual Cost Red. of Transm. Euipment (NOK million) NordLink Bundled Passive Alternative 1 NordLink Bundled Active Alternative 2 NordLink Parallel Standalone Benchmark – Active NordLink Partially Bundled Passive to Nørre Nebel NordLink Standalone Benchmark – Shortest Route Base Case (7 %) -157 -108 -255 -74 -52 4% -161 -111 -258 -77 -56 10% -155 -105 -253 -71 -48 NPV Sensitivity - Annual Cost Red. of Transm. Euipment (NOK million) NSN Bundled Active NSN Parallel Standalone Benchmark - Active NSN Partially Bundled Active NSN Partially Bundled Passive via Ula Base Case (7 %) -138 -314 -135 -174 4% -141 -317 -138 -183 10% -136 -312 -133 -167 83 - Nexia Statnett Submarine Fiber Evaluation 2015 Cost of Transmission Equipment The following tables and figures show the impact on the net present value of each case when the cost of transmission equipment is increased and decreased with 60 % and 30 % respectively. NPV Sensitivity - Cost of Transm. Equipment NordLink Bundled Passive Alternative 1 NordLink Bundled Active Alternative 2 NordLink Parallel Standalone Benchmark – Active NordLink Partially Bundled Passive to Nørre Nebel NordLink Standalone Benchmark – Shortest Route Base Case NPV Sensitivity - Cost of Transm. Equipment NSN Bundled Active NSN Parallel Standalone Benchmark - Active NSN Partially Bundled Active NSN Partially Bundled Passive via Ula Base Case -157 -108 -255 -74 -52 +60% -170 -118 -265 -87 -62 -30% -151 -103 -250 -67 -47 -138 -314 -135 -174 +60% -148 -324 -145 -202 -30% -133 -309 -130 -159 84 - Nexia Statnett Submarine Fiber Evaluation 2015 Cost of Additional Cable Laying Operations The following tables and figures show the impact on the net present value of each case when the cost of additional cable laying operations is increased and decreased with 30 % respectively. NPV Sensitivity - Cost of Add. Cable Laying Operations Base Case NordLink Bundled Passive Alternative 1 -157 NordLink Bundled Active Alternative 2 -108 NordLink Parallel Standalone Benchmark – Active -255 NordLink Partially Bundled Passive to Nørre Nebel -74 NordLink Standalone Benchmark – Shortest Route -52 +30% -164 -116 -311 -90 -70 -30% -150 -100 -199 -57 -33 NPV Sensitivity - Cost of Add. Cable Laying Operations Base Case NSN Bundled Active -138 NSN Parallel Standalone Benchmark - Active -314 NSN Partially Bundled Active -135 NSN Partially Bundled Passive via Ula -174 +30% -146 -379 -147 -192 -30% -131 -249 -124 -156 Revenue Development The following tables and figures show the impact on the net present value of each case when the following three scenarios occur: 85 - Nexia Statnett Submarine Fiber Evaluation 2015 Scenario 1: The 50 % premium on revenues is reduced to 0 %. Scenario 2: The market share is fixed to 8 %. Scenario 3: An initial up-front payment of NOK 85 million and an annual additional operational revenue of NOK 2.6 million (3 % of NOK 85 million) are added. NPV Sensitivity - Revenue Development NordLink Bundled Passive Alternative 1 NordLink Bundled Active Alternative 2 NordLink Parallel Standalone Benchmark – Active NordLink Partially Bundled Passive to Nørre Nebel NordLink Standalone Benchmark – Shortest Route NPV Sensitivity - Revenue Development NSN Bundled Active NSN Parallel Standalone Benchmark - Active NSN Partially Bundled Active NSN Partially Bundled Passive via Ula Base Case -157 -108 -255 -74 -52 Base Case -138 -314 -135 -174 0% 8 % Fixed Up-front Paym. Premium Market Share (NOK 85 mn+3 %) -160 -157 -41 -129 -92 9 -276 -239 -138 -95 -59 43 -73 -37 65 0% 8 % Fixed Up-front Paym. Premium Market Share (NOK 85 mn+3 %) -159 -123 -22 -335 -298 -197 -157 -120 -19 -195 -165 -57 86 - Nexia Statnett Submarine Fiber Evaluation 2015 Revenue Offset This table shows net present value of advancing or postponing revenues in different periods. The figures should be read as differences, where an earlier start gives a revenue value of NOK 4 million, a postponed start gives NOK 8 million less. NPV Sensitivity - Revenue Offset NPV Base Case: 2020-2024 14 Advanced: 2019-2024 18 Postponed: 2021-2024 6 Full Positive Sensitivities This following tables show the net present value effect of applying all positive sensitivities except for: The up-front payments of NOK 85 million (and its recurring annual revenue of 3% of NOK 85 million) The revenue offset effect The results show that the up-front payments have a larger impact on the net present values of all alternatives (except for the standalone cases) than the effect of all positive sensitivities combined. NPV Sensitivity – All Positive Sensitivities NordLink Bundled Passive Alternative 1 NordLink Bundled Active Alternative 2 NordLink Parallel Standalone Benchmark – Active NordLink Partially Bundled Passive to Nørre Nebel NordLink Standalone Benchmark – Shortest Route NPV Sensitivity – All Positive Sensitivities NSN Bundled Active NSN Parallel Standalone Benchmark - Active NSN Partially Bundled Active NSN Partially Bundled Passive via Ula -157 -108 -255 -74 -52 All Pos. Sens. Up-front (excl. Up-front Paym. (NOK Payments) 85 mn+3 %) -133 -41 -36 9 -137 -138 1 43 18 65 -138 -314 -135 -174 All Pos. Sens. Up-front (excl. Up-front Paym. (NOK Payments) 85 mn+3 %) -61 -22 -185 -197 -57 -19 -85 -57 Base Case Base Case 87


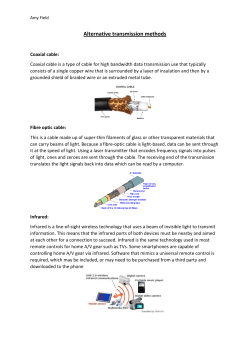

© Copyright 2026