
Fiscal Survey of States The
The
Fiscal
Survey of
States
FA L L 2 0 1 1
An Update of State Fiscal Conditions
A report by the National Governors Association and
the National Association of State Budget Officers
Copyright 2011 by the National Governors Association and the National Association of State Budget Officers.
All rights reserved.
National Association of State Budget Officers
444 North Capitol Street, NW, Suite 642
Washington, DC 20001-1511
Tel: (202) 624-5382 • Fax: (202) 624-7745
www.nasbo.org
Price: $25.00
THE NATIONAL GOVERNORS
ASSOCIATION
THE NATIONAL ASSOCIATION OF
STATE BUDGET OFFICERS
Founded in 1908, the National Governors Association (NGA)
Founded in 1945, NASBO is the instrument through which the
is the collective voice of the nation’s governors and one of
states collectively advance stage budget practices. The major
Washington, D.C.’s, most respected public policy organiza-
functions of the organization consist of research, policy devel-
tions. Its members are the governors of the 50 states, three
opment, education, training, and technical assistance. These
territories and two commonwealths. NGA provides governors
are achieved primarily through NASBO’s publications, mem-
and their senior staff members with services that range from
bership meetings, and training sessions. Association member-
representing states on Capitol Hill and before the Adminis-
ship is composed of the heads of state finance departments,
tration on key federal issues to developing and implementing
the states’ chief budget officers, and their deputies. All other
innovative solutions to public policy challenges through the
state budget office staff are associate members. NASBO has
NGA Center for Best Practices. NGA also provides manage-
four standing committees on major issues, Health and Human
ment and technical assistance to both new and incumbent
Services; Financial Management and Reporting; Education; and
governors.
a 2011-2012 Critical Issue Committee on Lessons Learned
from the Downturn. NASBO is an independent professional and
education association and is also an affiliate of the National
Governors Association.
2011-2012 Executive Committee
2011-2012 Executive Committee
Governor Dave Heineman, Nebraska, Chair
John Hicks, Kentucky, President
Governor Jack Markell, Delaware, Vice Chair
John Nixon, Michigan, Past President
Governor John Hickenlooper, Colorado
Jason Dilges, South Dakota, President-Elect
Governor Mitch Daniels, Indiana
Linda Luebbering, Missouri, Member-at-Large
Governor Deval Patrick, Massachusetts
David Treasure, Maryland, Member-at-Large
Governor Mark Dayton, Minnesota
Thomas Mullaney, Rhode Island, Eastern Regional Director
Governor Chris Christie, New Jersey
Wayne Hammon, Idaho, Western Regional Director
Governor Mary Fallin, Oklahoma
Debbie Dlugolenski, Georgia, Southern Regional Director
Governor Christine O. Gregoire, Washington
Jerry McDaniel, Florida, Chair, Health and Human Services
Committee
Dan Crippen, Executive Director
Gerry Oligmueller, Nebraska, Chair, Fiscal Management and
Reporting Committee
Dan Timberlake, Virginia, Chair, Education Committee
George Naughton, Oregon, Chair, 2011-2012 Critical Issue
Committee on Lessons Learned from the Downturn
Scott D. Pattison, Executive Director
THE FISCAL SURVEY
OF
S TAT E S
•
FALL 2011
i
ii
N AT I O N A L G O V E R N O R S A S S O C I AT I O N
•
N AT I O N A L A S S O C I AT I O N
OF
S TAT E B U D G E T O F F I C E R S
Acknowledgments
The Fiscal Survey was written, compiled and produced by Ben Husch with assistance from Lauren Cummings, Stacey Mazer, Brian
Sigritz and Michael Streepey. In addition, the report represents substantial work by state budget office staff throughout the United
States. NASBO thanks these individuals for their assistance in providing state data for this report:
Ann Franklin, Alabama
Lyn Heaton, Nebraska
Sarah Brinkley, Alaska
Reese Tietje, Nevada
Duong Nguyen, Arizona
Joe Bouchard, New Hampshire
Josh Joyner, Arkansas
Cathy Nonamaker, New Jersey
Phuong La, California
Adrienne Kreipke, New Jersey
Monica Flowers, California
Richard Blair, New Mexico
Diana Schmiegel, California
Michael Marcelli, New Mexico
Alexis Senger, Colorado
James Kaufman, New York
Alison Newman Fisher, Connecticut
David Brown, North Carolina
Bert Scoglietti, Delaware
Sheila Peterson, North Dakota
Jeanine Pumphrey, Florida
Jeff Newman, Ohio
Robert Giacomini, Georgia
Shelly Paulk, Oklahoma
Kalbert Young, Hawaii
Brian DeForest, Oregon
Anita Hamann, Idaho
Ann Bertolino, Pennsylvania
Jared Brunk, Illinois
Colleen Newman, Puerto Rico
Jon Vanator, Indiana
Thomas Mullaney, Rhode Island
Joel Lunde, Iowa
David Seigler, South Carolina
Elaine Frisbee, Kansas
Jim Terwilliger, South Dakota
Sandy Russel, Kansas
Charles Brown, Tennessee
John Hicks, Kentucky
Juan V. Garcia, Texas
Mike Barbier, Louisiana
Tenielle Young, Utah
Ternisa Hutchinson, Louisiana
Juliette Tennert, Utah
Paul Dube, Maine
Matt Riven, Vermont
Amber Tetitt, Maryland
Manju Robertson, Virginia
Robert Dolan, Massachusetts
Pam Davidson, Washington
Colleen Gossman, Michigan
Tammy Scruggs, West Virginia
Nancy Rooney, Minnesota
Mike McKown, West Virginia
Gerald Joyner, Mississippi
Kirsten Grinde, Wisconsin
Marty Drewel, Missouri
Folbert Ware, Jr., Wyoming
Ryan Evans, Montana
THE FISCAL SURVEY
OF
S TAT E S
•
FALL 2011
iii
Table of Contents
Preface ...................................................................................................................................................................................vi
Executive Summary .....................................................................................................................................................vii
Chapter 1: State Expenditure Developments .........................................................................................1
Overview .......................................................................................................................................................................................1
State Spending from All Sources ................................................................................................................................................1
State General Fund Spending .....................................................................................................................................................1
Table 1: State Nominal and Real Annual Budget Increases, Fiscal 1979 to Fiscal 2012 ....................................................2
Figure 1: Annual Percentage Budget Increases, Fiscal 1979 to Fiscal 2012 .....................................................................3
Table 2: State General Fund Expenditure Growth, Fiscal 2011 and Fiscal 2012 ...............................................................3
Table 3: Fiscal 2010 State General Fund, Actual ..............................................................................................................4
Table 4: Fiscal 2011 State General Fund, Preliminary Actual ............................................................................................5
Table 5: Fiscal 2012 State General Fund, Appropriated....................................................................................................6
Table 6: General Fund Nominal Percentage Expenditure Change, Fiscal 2011 and Fiscal 2012 .......................................7
Budget Cuts, Budget Gaps, and the Recovery Act ...................................................................................................................8
Table 7: Mid-Year Budget Cuts: Fiscal 2011 and Fiscal 2012 ...........................................................................................9
Table 8: Fiscal 2011 Mid-Year Program Area Cuts ........................................................................................................10
Table 9: Fiscal 2011 Mid-Year Program Area Cuts by Value ...........................................................................................11
Table 10: Fiscal 2012 Mid-Year Program Area Cuts .......................................................................................................12
Table 11: Fiscal 2012 Mid-Year Program Area Cuts by Value .........................................................................................13
Table 12: Fiscal 2012 Enacted Program Area Adjustments ............................................................................................14
Table 13: Fiscal 2012 Enacted Program Area Adjustments by Value ..............................................................................15
Table 14: Strategies Used to Reduce or Eliminate Budget Gaps, Fiscal 2011 ................................................................16
Table 15: Strategies Used to Reduce or Eliminate Budget Gaps, Fiscal 2012 ................................................................18
Table 16: Strategies Used to Reduce or Eliminate Budget Gaps, Fiscal 2013 ................................................................20
Figure 2: Budget Cuts Made After the Budget Passed, Fiscal 1990 to Fiscal 2012 ........................................................22
State Employment Changes .....................................................................................................................................................22
Table 17: Number of Filled Full-Time Equivalent Positions at the End of Fiscal 2010 to Fiscal 2012, in All Funds ............23
Table 18: State Employee Compensation Changes, Fiscal 2012 ....................................................................................24
Medicaid Outlook .......................................................................................................................................................................28
Temporary Assistance for Needy Families Program (TANF) ....................................................................................................29
Table 19: Enacted Cost-of-Living Changes for Cash Assistance Benefit Levels Under the Temporary
Assistance For Needy Families Block Grant, Fiscal 2012 ................................................................................29
Notes...........................................................................................................................................................................................30
Chapter 2: State Revenue Developments..................................................................................................44
Overview .....................................................................................................................................................................................44
Revenues ....................................................................................................................................................................................44
Projected Collections in Fiscal 2012 .........................................................................................................................................44
Collections in Fiscal 2011 ..........................................................................................................................................................44
iv
N AT I O N A L G O V E R N O R S A S S O C I AT I O N
•
N AT I O N A L A S S O C I AT I O N
OF
S TAT E B U D G E T O F F I C E R S
Forecast Collections in Fiscal 2012 ..........................................................................................................................................45
Table 20: Number of States with Revenues Higher, Lower or on Target with Projections ................................................45
Table 21: Fiscal 2011 Tax Collections Compared with Projections Used in Adopting Fiscal 2011 Budgets .....................46
Table 22: Comparison of Tax Collections in Fiscal 2010, Fiscal 2011, and Enacted Fiscal 2012 .....................................47
Table 23: Percentage Changes Comparison of Tax Collections in Fiscal 2010, Fiscal 2011, and
Enacted Fiscal 2012 .......................................................................................................................................48
Enacted Fiscal 2012 Revenue Changes....................................................................................................................................49
Table 24: Enacted State Revenue Changes, Fiscal 1979 to Fiscal 2012.........................................................................50
Figure 3: Enacted State Revenue Changes, Fiscal 1979 to Fiscal 2012 .........................................................................51
Table 25: Enacted Mid-Year Fiscal 2011 Revenue Actions by Type of Revenue and
Net Increase or Decrease................................................................................................................................52
Table 26: Enacted Fiscal 2012 Revenue Actions by Type of Revenue and
Net Increase or Decrease................................................................................................................................53
Notes...........................................................................................................................................................................................54
Chapter 3: Total Balances ...................................................................................................................................55
Overview .....................................................................................................................................................................................55
Total Balances ............................................................................................................................................................................55
Budget Stabilization Funds .......................................................................................................................................................55
Table 27: Total Year-End Balances, Fiscal 1979 to Fiscal 2012.......................................................................................56
Table 28: Total Year-End Balances as a Percentage of Expenditures, Fiscal 2010 to Fiscal 2012 ...................................57
Figure 4: Total Year-End Balances Fiscal 1979 to Fiscal 2012 ........................................................................................58
Figure 5: Total Year-End Balances as a Percentage of Expenditures Fiscal 1979 to Fiscal 2012 .....................................58
Figure 6: State Total Balance Levels 2008......................................................................................................................59
Figure 7: State Total Balance Levels 2010......................................................................................................................59
Figure 8: State Total Balance Levels 2012......................................................................................................................59
Table 29: Total Balances and Balances as a Percentage of Expenditures, Fiscal 2010 to Fiscal 2012 ............................60
Table 30: Total Rainy Day Fund Balances and Rainy Day Fund Balances as a Percentage of Expenditures,
Fiscal 2010 to Fiscal 2012 ..............................................................................................................................61
Notes...........................................................................................................................................................................................62
Chapter 4: Other State Budgeting Changes .......................................................................................63
Enacted Changes to Budgeting and Financial Management Practices .................................................................................63
Enacted Changes in Aid to Local Governments, Fiscal 2012 .................................................................................................63
Changes in State Aid to Local Governments............................................................................................................................64
Table 31: Enacted Changes to Budgeting and Financial Management Practices ............................................................64
Table 32: Enacted Changes in Aid to Local Governments, Fiscal 2012 ..........................................................................67
Appendix Tables .............................................................................................................................................................73
Table A-1: Enacted Mid-Year Revenue Changes by Type of Revenue, Fiscal 2011 .........................................................73
Table A-2: Enacted Mid-Year Revenue Measures, Fiscal 2011 .......................................................................................75
Table A-3: Enacted Revenue Changes by Type of Revenue, Fiscal 2012........................................................................76
Table A-4: Enacted Revenue Measures, Fiscal 2012 ......................................................................................................82
THE FISCAL SURVEY
OF
S TAT E S
•
FALL 2011
v
Preface
The Fiscal Survey of States is published twice annually by the
Fiscal 2010 data represent actual figures, fiscal 2011 figures are
National Association of State Budget Officers (NASBO) and the
preliminary actual, and fiscal 2012 data reflect state enacted
National Governors Association (NGA). The series was started
budgets.
in 1979. The survey presents aggregate and individual data on
the states’ general fund receipts, expenditures, and balances.
Although not the totality of state spending, these funds are
used to finance most broad-based state services and are the
most important elements in determining the fiscal health of the
states. A separate survey that includes total state spending,
NASBO’s State Expenditure Report, also is conducted annually.
The field survey on which this report is based was conducted
Forty-six states begin their fiscal years in July and end them in
June. The exceptions are Alabama and Michigan, with October
to September fiscal years; New York, with an April to March
fiscal year; and Texas, with a September to August fiscal year.
Additionally, 21 states operate on a biennial budget cycle.
NASBO staff member Ben Husch compiled the data and prepared the text for the report.
by NASBO from August through September 2011. The surveys
were completed by Governors’ state budget officers in all
50 states. This survey also includes Puerto Rico; however,
their data is not included in the 50 state totals.
vi
N AT I O N A L G O V E R N O R S A S S O C I AT I O N
•
N AT I O N A L A S S O C I AT I O N
OF
S TAT E B U D G E T O F F I C E R S
Executive Summary
This edition of the Fiscal Survey of States demonstrates that
likely to continue to see above average growth due to increased
while state fiscal conditions are slowly improving in fiscal 2012,
demand as a result of the economic downturn, the loss of ad-
they are likely to remain constrained due to the lack of a
ditional federal funds associated with the Recovery Act, and
strong national economic recovery and the withdrawal of federal
the implementation of the Affordable Care Act.
stimulus funds provided through the American Recovery and
Reinvestment Act of 2009 (ARRA). The slow improvement in
state finances began in 2011 as highlighted by 38 states reporting that they had higher general fund spending in fiscal
2011 compared to fiscal 2010 and continued with 43 states
enacting fiscal 2012 budgets with increasing general fund expenditures as compared to fiscal 2011. However, 29 states still
have lower general fund spending in fiscal 2012 compared to
the pre-recession levels of fiscal 2008, illustrating how significantly state fiscal conditions were affected by the recession.
Additionally, state revenue collections will continue to be affected by this less than robust economic recovery, especially
in light of the disruption experienced by the national economy
earlier this year, as unemployment remains high and consumer
spending remains weak. At the same time states are beginning
to experience some improvement in revenue collections, pressure for state spending in areas such as healthcare and education continues to grow. Even though states are experiencing
a slight improvement over one of the worst time periods in state
fiscal conditions since the Great Depression, fiscal 2012 con-
Fiscal 2010 was a very difficult year for state finances as 43
states enacted budgets with declining levels of spending. The
improvement in state finances that began in fiscal 2011 highlighted by the fact that 38 states reported that they had higher
general fund spending in fiscal 2011 compared to fiscal 2010.
This improvement is expected to continue in fiscal 2012 as 43
states enacted a fiscal 2012 budget with higher general fund
spending than fiscal 2011. Overall, state enacted budgets in
fiscal 2012 call for $666.6 billion in general fund expenditures.
This represents a 2.9 percent increase compared to $648.1 billion in general fund spending in fiscal 2011. Furthermore, the
$648.1 billion in general fund spending in fiscal 2011 represents
a 4.0 percent increase over the $623.4 billion spent in fiscal
2010. However, even with these increases in fiscal 2011 and
fiscal 2012, total enacted general fund spending in fiscal 2012
is still $20.7 billion, or 3.0 percent, less than the pre-recession
high of $687.3 billion in fiscal 2008. This aggregate reduction
is illustrated by the 29 states that enacted a fiscal 2012 budget
with lower general fund spending than they had in fiscal 2008.
tinues to present states with significant financial management
State enacted budgets for fiscal 2012 forecast total general
challenges.
fund revenues of $659.4 billion, 1.6 percent above the $649.0
The recent severe national recession drastically reduced state
tax revenues from every revenue source. Additionally, increases
in state revenue collections historically lag behind any national
economic recovery, which itself has been slow to develop. Total
state revenues in 2012 remain below their 2008 levels by nearly
$20.8 billion. This significant drop in revenue led to actual declines in state general fund expenditures in both fiscal 2009 and
fiscal 2010, which was only the second and third time that state
general fund spending has declined in the history of this report.
billion collected in fiscal 2011. However, state revenue collections may be impacted by the economic slowdown experienced earlier this year. States also reported that total general
fund revenues increased 6.4 percent in fiscal 2011 compared
to fiscal 2010. Although state general fund revenues are expected to increase in both fiscal 2011 and fiscal 2012, the drastic declines in revenue collections experienced in fiscal 2009
and fiscal 2010 means that total general fund revenues in fiscal
2012 will still be $20.8 billion below their fiscal 2008 level.
This also marked the first time in which states have had con-
The slow recovery of state revenue continues to result in signif-
secutive years of declining general fund spending. As the econ-
icant gaps between projected spending and revenue collections.
omy slowly improves, state general fund spending is expected
Additionally, certain demands and requirements for additional
to increase, although at a slower rate than the historical average
spending will continue to be higher than the revenue coming
of 5.6 percent. This slow rate of growth is evident by examining
into many state coffers. As such, states reported $230 billion
state enacted budgets for fiscal 2012 which include an aggre-
in budget gaps between fiscal 2009 and fiscal 2011. Addition-
gate 2.9 percent increase over fiscal 2011 spending levels. Ad-
ally, based on data reported to NASBO and other state gov-
ditionally, while state general fund spending is expected to grow
ernment reports, 39 states had to close $95 billion in gaps for
slowly over the next few years, state spending on Medicaid is
fiscal 2012. Although not all state budget offices have com-
THE FISCAL SURVEY
OF
S TAT E S
•
FALL 2011
vii
pleted official forecasts, 17 states reported $40 billion in budget
Over the past three years, states were able to make use of
gaps for fiscal 2013, which does not begin until July 1, 2012
$135 billion in flexible emergency funding that was provided
for most states. State budget gaps that arise during the fiscal
through the American Recovery and Reinvestment Act of 2009.
year are primarily solved through a reduction in previously appro-
Spending from these funds peaked in fiscal 2010 at $61.1 bil-
priated spending, fund transfers, and enacted revenue increases.
lion and then fell slightly to $50.3 billion in fiscal 2011. However,
fiscal 2012 will see states make use of only $3.0 billion due to
In fiscal 2011, 19 states enacted aggregate mid-year budget
cuts totaling $7.4 billion. Although these actions represent a
large number of states, this figure still represents a decline from
previous years. In fiscal 2010, 39 states made $18.3 billion in
mid-year budget cuts and in fiscal 2009 43 states made midyear cuts totaling $31.3 billion. In addition to the $7.8 billion in
the wind down of funds. These funds were distributed through
increases in state Federal Medical Assistance Percentage
(FMAP) rates as well as the State Fiscal Stabilization Fund. The
reduction of this funding stream for states, when combined with
a slow recovery in state revenue collections, will continue the
tight resource environment for states in fiscal 2012.
mid-year budget cuts in fiscal 2011, 9 states enacted $3.5 billion in mid-year tax and fee increases.
While the overall fiscal situation of states has improved from the
depths of the recession with both revenue collections and
States’ enacted fiscal 2012 budgets include a $584.1 million
reduction in new net taxes and fees. Additionally, states enacted decreases of $2.6 billion in net revenue measures. Many
of the larger decreases in both taxes and revenue measures
are the result of expiring tax increases that were not renewed.
In previous years, in response to the significant loss of revenue
during the recession, states enacted $23.9 billion in increased
taxes and fees along with an additional increase of $7.5 billion
in revenue measures in fiscal 2010 as well as $6.2 billion in
new taxes and fees and $2.9 billion in revenue measures in
fiscal 2011.
spending increasing, the Fall 2011 Fiscal Survey of States
demonstrates the precarious financial situation facing states. In
2012, states appear on track for continued, at least moderate,
financial improvement, highlighted by increasing general fund
expenditures, rising tax collections, and the slow restoration of
state rainy day funds. However, aggregate figures do not show
states back to pre-recession levels, as the growth in revenue
collections is not improving significantly enough to cover both
the wind down of Recovery Act funds and the increased expenses states face in areas like health care and corrections.
The trends in this report show that if the economy continues to
The slight improvement in state fiscal conditions is also high-
improve, state finances will stay on a positive, albeit slow mov-
lighted by an increase in states’ balances. Balances reflect the
ing track.
funds that states may use to respond to unforeseen circumstances after budget obligations have been met and include
State Spending
budget stabilization funds, sometimes known as “rainy day
States enacted general fund spending of $666.6 billion in fiscal
funds.” While balances had been built up during the middle part
2012 is 2.9 percent above the $648.1 billion in fiscal 2011. The
of the last decade, the sudden and drastic loss of revenue re-
$648.1 billion in general fund expenditures in fiscal 2011 is 4.0
sulted in a significant depletion of balance levels during the re-
percent above the $623.4 billion spent in fiscal 2010. Forty-
cession. Specifically, after reaching a peak of $69 billion or 11.5
three states enacted budgets with increasing general fund ex-
percent of general fund expenditures in fiscal 2006, total bal-
penditures for fiscal 2012 compared to fiscal 2011. However,
ance levels fell to $30.6 billion or 4.6 percent of expenditures
even with these proposed increases, 29 states would still have
at the end of fiscal 2009. Based on states’ enacted budgets
lower general fund spending in fiscal 2012 compared to the
for fiscal 2012, states’ balances are expected to be $41.2 bil-
pre-recession levels of fiscal 2008. Nineteen states made mid-
lion, or 6.2 percent of expenditures. It is important to note that
year budget cuts to their fiscal 2011 budgets totaling $7.4 bil-
the balance levels of Texas and Alaska total $18.6 billion in fiscal
lion. Thirty-nine states made mid-year budget cuts of $18.3
2012 and without these two states, the remaining 48 states
billion in fiscal 2010, while 43 states made $31.3 billion in mid-
have balance levels that represent only 3.7 percent of general
year cuts in fiscal 2009.
fund expenditures for fiscal 2012.
viii
N AT I O N A L G O V E R N O R S A S S O C I AT I O N
•
N AT I O N A L A S S O C I AT I O N
OF
S TAT E B U D G E T O F F I C E R S
State Revenue Actions
States fiscal 2012 enacted budgets include tax and fee
changes that will decrease general fund revenue collections by
a cumulative $584.1 million. Thirteen states recommended net
increases while 18 states proposed net decreases. States also
enacted $2.6 billion in revenue measure decreases.
state general fund revenue collections as fiscal 2012 continues.
Compared to fiscal 2011 collections, state enacted budgets for
fiscal 2012 reflect a 0.3 percent decrease in sales tax revenue,
although this is mostly due to the end of temporary sales increases in a few states. State enacted budgets for fiscal 2012
reflect a 5.2 percent increase in personal income tax revenue
and a 0.1 percent decrease in corporate income tax revenue.
In fiscal 2011, revenues from all sources, which include sales,
Within state budgets, about 40 percent of general fund revenue
personal income, corporate income and all other taxes and
is from personal income tax, 33 percent is from sales tax, and
fees, exceeded forecasts in 32 states, were on target in nine
seven percent is from corporate tax, with the rest from various
states, and were below forecasts in nine states. While a number
other sources.
of states reported a surplus following the end of fiscal 2011,
these surpluses should not be taken as a sign that state fiscal
conditions have returned to their pre-recession level. Such surpluses are more likely the result of cuts in spending from previous fiscal years as well as conservative revenue forecasts.
Year-End Balances
Total balances—ending balances and the amounts in budget
stabilization “rainy day” funds—are a crucial tool that states
heavily rely on during fiscal downturns and budget shortfalls.
Specifically, in fiscal 2011, revenues from sales tax collections
After reaching a peak in fiscal 2006 at $69 billion or 11.5 per-
rose 4.8 percent, while personal income tax collections were
cent of general fund expenditures, the severe deterioration in
9.7 percent higher, and corporate income tax collections were
state fiscal conditions resulted in balance levels falling to $30.6
9.4 percent higher relative to fiscal 2010 collections.
billion by fiscal 2010, representing 4.6 percent of expenditures.
Balance levels have begun to recover, as states’ enacted budg-
Thus far in fiscal 2012, 15 states are exceeding revenue col-
ets for fiscal 2012 would raise total balance levels to $41.2 bil-
lection estimates, 22 states are on target, while 7 states are
lion, 6.2 percent of general fund expenditures.
below expectations. Additionally, the disruption experienced by
the national economy earlier this year may negatively impact
THE FISCAL SURVEY
OF
S TAT E S
•
FALL 2011
ix
x
N AT I O N A L G O V E R N O R S A S S O C I AT I O N
•
N AT I O N A L A S S O C I AT I O N
OF
S TAT E B U D G E T O F F I C E R S
State Expenditure Developments
CHAPTER ONE
Overview
Fiscal 2012 is expected to continue the slow improvement in
corrections, 3.1 percent; public assistance, 1.6 percent; and all
other expenditures, 33.9 percent.
state fiscal conditions that began in fiscal 2011. However states
For estimated fiscal 2011, components of general fund are el-
still face a challenging fiscal environment due to the lack of a
ementary and secondary education, 35.0 percent; Medicaid,
strong national economic recovery, the wind down of federal
17.4 percent; higher education, 11.5 percent; corrections,
stimulus funds, and the potential for significant reductions of
7.4 percent; public assistance, 1.8 percent; transportation,
federal aid. State fiscal conditions have improved when com-
0.5 percent; and all other expenditures, 26.5 percent.
pared to the situation states faced in fiscal 2009 and fiscal
2010. Going forward, the spending increases associated with
this improvement are likely to be slower than the historical av-
State General Fund Spending
erage growth rate of 5.6 percent. Additionally, while state gen-
State general fund spending for fiscal 2012 is forecast to be
eral fund spending is expected to grow much slower over the
$666.6 billion based on states’ enacted budgets. This repre-
next few years, spending on Medicaid is likely to continue to
sents an increase of 2.9 percent above the $648.1 billion spent
see above average growth due to increrased demand as a re-
in fiscal 2011. The slight increase in state general fund spending
sult of the economic downturn, the loss of additional federal
in fiscal 2012, as compared to fiscal 2011, is evident in the 43
funds associated with the Recovery Act, and the implementa-
states which enacted a fiscal 2012 budget with general fund
tion of the Affordable Care Act.
spending levels above those of fiscal 2011. This spending increase will be the second consecutive year-over-year increase
State Spending from All Sources
in general fund expenditures following back-to-back declines
in general fund spending in fiscal 2009 and fiscal 2010, at 3.8
This report captures only state general fund spending. General
percent and 5.7 percent respectively. However, even after two
fund spending represents the primary component of discre-
years of increases in state general fund spending, such spend-
tionary expenditures of revenue derived from general sources
ing remains $20.7 billion, 3.0 percent, below the $687.3 billion
which have not been earmarked for specific items. According
spent in fiscal 2008. Likewise, when examining individual
to the most recent edition of NASBO’s State Expenditure Re-
states, there are still 29 states which enacted a fiscal 2012
port, estimated fiscal 2011 spending from all sources (general
budget with general fund spending levels below fiscal 2008.
funds, federal funds, other state funds and bonds) is approxi-
These 29 states highlight that a significant number of states still
mately $1.7 trillion with the general fund representing 37.7 per-
face an uphill path to full recovery. (See Table 1, Figure 1, and
cent of the total. However, as recently as fiscal 2008, general
Tables 3 - 5.)
fund spending accounted for 45.9 percent of total state spending. This decrease in the general fund’s impact on total state
For fiscal 2011, general fund spending increased by 4.0 per-
spending is evidence of the gap that ARRA funds filled. Federal
cent, the largest increase in state spending since 2008. Specif-
funds went from representing 26.3 percent of total state spend-
ically, 12 states had negative general fund expenditure growth
ing in fiscal 2008 to an estimated 34.1 percent in fiscal 2010
2010 levels, while 23 states had general fund expenditure
due primarily to Recovery Act funds. The components of total
growth between 0 and 4.9 percent, and 15 states had general
state spending for estimated fiscal 2011 are: Medicaid, 23.6
fund spending growth greater than five percent. (See Table 2
percent; elementary and secondary education, 20.1 percent;
and Table 6)
higher education, 10.1 percent; transportation, 7.6 percent;
THE FISCAL SURVEY
OF
S TAT E S
•
FALL 2011
1
TABLE 1
State Nominal and Real Annual Budget Increases,
Fiscal 1979 to Fiscal 2012
State General Fund
Fiscal Year
Nominal Increase
2012
2011
2010
2009
2008
2007
2006
2005
2004
2003
2002
2001
2000
1999
1998
1997
1996
1995
1994
1993
1992
1991
1990
1989
1988
1987
1986
1985
1984
1983
1982
1981
1980
1979
1979-2012 average
2.9%
4.0
-5.7
-3.8
4.9
9.4
8.7
6.5
3.0
0.6
1.3
8.3
7.2
7.7
5.7
5.0
4.5
6.3
5.0
3.3
5.1
4.5
6.4
8.7
7.0
6.3
8.9
10.2
8.0
-0.7
6.4
16.3
10.0
10.1
5.6%
Real Increase
2.4
-7.8
-3.4
-1.0
3.9
3.4
0.2
-1.0
-3.6
-1.4
4.0
4.0
5.2
3.9
2.3
1.6
3.2
2.3
0.6
1.9
0.7
2.1
4.3
2.9
2.6
3.7
4.6
3.3
-6.3
-1.1
6.1
-0.6
1.5
1.3%
Notes: *The state and local government implicit price deflator cited by the Bureau of Economic
Analysis in October 2011 is used for state expenditures in determining real changes. Fiscal 2011
figures are based on the change from fiscal 2010 actuals to fiscal 2011 preliminary actual.
Fiscal 2012 figures are based on the change from fiscal 2011 preliminary actual to fiscal 2012
appropriated.
SOURCE: National Association of State Budget Officers.
2
N AT I O N A L G O V E R N O R S A S S O C I AT I O N
•
N AT I O N A L A S S O C I AT I O N
OF
S TAT E B U D G E T O F F I C E R S
Figure 1:
Annual Percentage Budget Increases, Fiscal 1979 to Fiscal 2012
25
Percentage Budget Increase
20
15
10
5
0
-5
-10
1979 1981
1980
1983
1982
1985
1984
1987 1989
1986
1988
1991 1993 1995 1997 1999 2001 2003 2005 2007 2009 2011
1992 Fiscal
1994Year1996 1998 2000 2002 2004 2006 2008 2010
1990
SOURCE: National Association of State Budget Officers.
TABLE 2
State General Fund Expenditure Growth,
Fiscal 2011 and 2012
Number of States
Spending Growth
Fiscal 2011
(Preliminary Actual)
Fiscal 2012
(Appropriated)
Negative growth
0.0% to 4.9%
5.0% to 9.9%
10% or more
12
23
12
3
7
19
17
7
NOTE: Average spending growth for fiscal 2011 (preliminary actual) is 4.0 percent; average
spending growth for fiscal 2012 (enacted) is 2.9 percent. See Table 6 for state-by-state data.
SOURCE: National Association of State Budget Officers.
THE FISCAL SURVEY
OF
S TAT E S
•
FALL 2011
3
TABLE 3
Fiscal 2010 State General Fund, Actual (Millions)
Region/State
Alabama**
Alaska**
Arizona**
Arkansas
California* **
Colorado* **
Connecticut
Delaware*
Florida
Georgia* **
Hawaii
Idaho**
Illinois* **
Indiana**
Iowa**
Kansas
Kentucky**
Louisiana**
Maine**
Maryland**
Massachusetts* **
Michigan**
Minnesota**
Mississippi**
Missouri**
Montana**
Nebraska**
Nevada**
New Hampshire* **
New Jersey* **
New Mexico
New York* **
North Carolina
North Dakota**
Ohio
Oklahoma**
Oregon**
Pennsylvania**
Rhode Island**
South Carolina
South Dakota**
Tennessee**
Texas
Utah**
Vermont
Virginia
Washington**
West Virginia**
Wisconsin**
Wyoming**
TERRITORIES
Puerto Rico**
Total***
Adjustments
Expenditures
Adjustments
Ending
Balance
105
0
-481
0
-5,375
443
0
379
631
1,738
-37
0
2,094
964
0
50
40
782
26
87
1,017
177
447
8
311
393
424
212
9
614
479
1,948
92
362
735
26
0
-2,030
-61
121
0
77
2,427
22
0
161
189
481
90
5
6,484
5,617
6,460
4,323
87,041
6,410
17,689
3,235
22,165
15,216
4,852
2,265
25,254
12,321
5,634
5,191
8,331
7,174
2,693
12,891
30,310
6,506
14,620
4,491
6,774
1,627
3,207
3,007
1,398
28,144
4,799
52,556
18,657
1,241
24,950
5,166
5,982
26,523
3,017
5,242
1,110
9,732
38,371
4,193
1,038
14,758
13,571
3,758
12,132
1,745
162
18
1,866
0
228
0
0
0
0
156
0
71
5,261
371
0
0
234
619
202
795
0
1,209
0
0
670
6
-21
143
28
526
653
0
0
295
0
-30
0
2,854
-74
0
22
195
118
220
52
0
715
1
742
0
6,751
5,635
7,846
4,323
81,894
6,853
17,689
3,614
22,796
17,110
4,816
2,336
32,609
13,656
5,634
5,241
8,604
8,575
2,921
13,773
31,327
7,892
15,067
4,499
7,755
2,026
3,610
3,362
1,436
29,284
5,930
54,504
18,750
1,898
25,685
5,163
5,982
27,346
2,881
5,363
1,132
10,004
40,916
4,435
1,090
14,919
14,475
4,240
12,963
1,750
7,457
6,603
7,852
4,323
87,237
6,716
17,208
3,077
21,223
15,971
4,838
2,507
25,165
12,877
5,298
5,268
8,452
8,683
2,849
13,429
30,424
7,705
14,627
4,320
7,570
1,716
3,313
3,212
1,405
28,480
5,358
52,202
18,513
1,585
25,175
5,119
6,371
27,641
2,864
5,117
1,132
9,451
39,465
4,441
1,088
14,787
15,036
3,677
12,824
1,750
-778
461
0
0
0
0
0
0
0
0
0
-171
6,991
-52
48
0
72
0
71
0
0
0
0
175
0
-1
0
-163
-45
0
0
0
0
0
0
2
0
0
-1
0
0
314
-82
22
2
0
0
11
68
0
72
-1,429
-6
0
-5,342
137
481
537
1,573
1,138
-22
0
453
831
287
-27
80
-108
0
344
903
187
440
5
185
311
297
314
75
804
572
2,302
237
313
510
42
-390
-294
18
245
0
240
1,533
-28
0
132
-561
552
71
0
0
10,364
0
0
-6,113
133
0
186
275
116
63
31
0
0
422
0
0
644
0
612
670
2
0
257
260
0
467
0
9
0
278
1,206
150
325
0
373
216
1
112
111
107
453
7,693
210
57
295
95
556
0
398
0
$10,181
7,670
$609,870
2,500
10,170
$638,354
10,170
$623,394
0
0
$8,014
0
$21,034
Revenues
NOTES: NA Indicates data are not available. *In these states, the ending balance includes the balance in the budget stabilization fund. **See Notes to Table 3.
SOURCE: National Association of State Budget Officers.
4
Rainy
Day Fund
Balance
Total
Resources
Beginning
Balance
N AT I O N A L G O V E R N O R S A S S O C I AT I O N
•
N AT I O N A L A S S O C I AT I O N
OF
S TAT E B U D G E T O F F I C E R S
TABLE 4
Fiscal 2011 State General Fund, Preliminary Actual (Millions)
Region/State
Alabama**
Alaska**
Arizona**
Arkansas
California* **
Colorado* **
Connecticut
Delaware*
Florida
Georgia* **
Hawaii
Idaho* **
Illinois**
Indiana**
Iowa**
Kansas
Kentucky**
Louisiana**
Maine**
Maryland**
Massachusetts* **
Michigan**
Minnesota* **
Mississippi**
Missouri**
Montana**
Nebraska**
Nevada**
New Hampshire* **
New Jersey* **
New Mexico
New York* **
North Carolina
North Dakota**
Ohio
Oklahoma**
Oregon
Pennsylvania**
Rhode Island**
South Carolina
South Dakota**
Tennessee**
Texas
Utah**
Vermont**
Virginia
Washington**
West Virginia**
Wisconsin**
Wyoming**
TERRITORIES
Puerto Rico**
Total
Rainy
Day Fund
Balance
Adjustments
Resources
Expenditures
Adjustments
Ending
Balance
72
0
-6
0
-5,343
137
0
537
1,573
1,138
-22
0
453
831
0
-27
80
-108
7
344
903
187
440
5
185
311
297
314
75
804
278
2,302
237
313
510
42
-390
-294
18
246
0
240
1,533
-28
0
132
-561
552
26
0
6,909
5,307
7,250
4,479
94,781
7,235
18,083
3,531
22,914
16,559
5,117
2,445
28,306
13,384
5,840
5,790
8,859
7,770
2,896
13,537
33,075
7,248
15,826
4,600
7,176
1,783
3,494
3,186
1,384
28,180
5,164
54,447
19,157
1,532
27,763
5,750
6,532
26,347
3,083
5,633
1,163
10,519
40,515
4,562
1,157
15,590
14,648
4,064
12,912
1,567
0
0
1,131
0
574
0
0
0
0
498
0
74
7,951
-54
-6
0
197
106
86
347
0
1,455
0
0
723
-1
33
110
4
735
38
0
0
865
0
-33
0
3,160
-81
0
-15
431
-407
190
71
0
652
0
642
0
6,981
5,307
8,376
4,479
90,012
7,373
18,083
4,069
24,487
18,195
5,095
2,519
36,710
14,161
5,834
5,763
9,136
7,768
2,990
14,228
33,978
8,891
16,265
4,605
8,084
2,092
3,824
3,609
1,462
29,718
5,480
56,749
19,394
2,710
28,274
5,759
6,142
29,213
3,021
5,879
1,148
11,189
41,641
4,724
1,228
15,723
14,739
4,616
13,580
1,567
7,356
6,075
8,372
4,479
91,480
6,921
17,845
3,271
24,054
17,064
4,969
2,384
25,933
13,050
5,283
5,727
8,789
7,731
2,873
13,238
32,078
8,630
15,540
4,528
7,705
1,747
3,322
3,337
1,302
29,025
5,203
55,373
18,503
1,651
27,429
5,417
6,107
28,321
2,959
5,167
1,148
10,508
41,149
4,710
1,162
15,458
14,823
3,772
13,565
1,562
-414
17
0
0
-262
0
0
0
0
0
0
66
9,806
-12
69
0
57
50
98
0
0
0
0
0
0
5
0
47
125
0
0
0
307
62
0
249
0
-182
-3
0
0
310
-608
14
66
0
0
51
-70
0
38
-785
3
0
-1,206
451
238
798
433
1,131
126
69
971
1,124
482
36
290
-13
19
990
1,901
260
725
76
379
340
502
225
36
693
277
1,376
584
997
845
93
35
1,073
65
712
0
372
1,100
0
0
265
-84
793
86
5
0
11,065
0
0
-1,976
157
0
186
279
445
10
0
276
57
437
0
0
647
72
624
1,379
2
9
176
247
0
313
0
9
0
235
1,206
296
386
0
249
16
0
130
0
107
284
5,041
204
54
299
0
659
0
572
0
$8,344
8,134
$649,047
1,016
9,150
$676,868
9,150
$648,095
0
0
$18,925
0
$24,154
Beginning
Balance
Revenues
NOTES: NA Indicates data are not available. *In these states, the ending balance includes the balance in the budget stabilization fund. **See Notes to Table 4.
SOURCE: National Association of State Budget Officers.
THE FISCAL SURVEY
OF
S TAT E S
•
FALL 2011
5
TABLE 5
Fiscal 2012 State General Fund, Appropriated (Millions)
Region/State
Alabama**
Alaska**
Arizona**
Arkansas
California*
Colorado* **
Connecticut
Delaware* **
Florida
Georgia*
Hawaii
Idaho**
Illinois**
Indiana
Iowa**
Kansas
Kentucky**
Louisiana**
Maine* **
Maryland**
Massachusetts*
Michigan**
Minnesota**
Mississippi
Missouri**
Montana**
Nebraska**
Nevada**
New Hampshire* **
New Jersey*
New Mexico
New York* **
North Carolina**
North Dakota**
Ohio**
Oklahoma
Oregon**
Pennsylvania**
Rhode Island**
South Carolina
South Dakota**
Tennessee**
Texas
Utah**
Vermont**
Virginia
Washington**
West Virginia**
Wisconsin**
Wyoming**
TERRITORIES
Puerto Rico**
Total
Adjustments
Resources
Expenditures
Adjustments
38
0
-332
0
-1,206
157
0
798
433
1,131
126
0
971
1,124
0
36
133
0
19
990
1,901
260
725
7
379
340
502
225
9
693
235
1,376
583
997
845
93
35
1,073
65
712
0
372
1,100
0
0
265
-84
793
86
5
7,064
7,300
7,375
4,604
88,456
7,268
18,789
3,423
24,309
17,208
5,518
2,494
31,589
13,889
6,355
6,045
8,974
8,264
2,946
13,910
32,253
7,550
16,481
4,622
7,295
1,786
3,591
2,983
1,381
29,339
5,431
57,293
19,175
1,442
27,173
5,846
6,704
26,571
3,246
5,489
1,165
10,979
39,508
4,677
1,191
16,294
15,324
4,016
13,297
1,567
293
0
1,288
0
0
0
0
0
0
0
0
38
1,866
0
-77
0
153
0
79
249
0
900
0
0
396
0
-253
60
-11
0
0
0
124
495
0
0
-35
63
-91
0
-13
-27
4,331
123
30
0
-16
0
674
0
7,395
7,300
8,331
4,604
87,250
7,424
18,789
4,221
24,742
18,338
5,644
2,532
34,151
15,014
6,277
6,080
9,260
8,264
3,044
15,149
34,154
8,709
17,206
4,628
8,071
2,125
3,841
3,268
1,379
30,032
5,667
58,669
19,882
2,933
28,018
5,938
6,704
27,706
3,220
6,201
1,153
11,323
44,939
4,800
1,221
16,559
15,224
4,809
14,058
1,572
7,357
7,371
8,318
4,604
85,937
7,163
18,708
3,575
23,384
17,208
5,599
2,529
29,188
13,855
5,998
6,073
9,230
8,261
3,039
14,749
32,533
8,271
16,733
4,628
7,971
1,824
3,468
3,105
1,248
29,393
5,431
56,932
19,683
1,993
27,863
5,578
7,078
27,149
3,170
5,677
1,150
11,238
44,153
4,781
1,236
16,557
15,766
4,080
14,166
1,572
0
-33
0
0
0
0
0
0
0
0
0
0
4,561
0
0
0
30
0
5
0
0
427
0
0
0
0
240
0
137
0
0
0
124
0
0
0
0
140
-5
108
0
73
0
12
-15
0
0
0
-182
0
38
-38
14
0
1,313
261
81
646
1,358
1,131
45
3
402
1,159
279
8
0
3
1
400
1,622
11
473
0
100
302
132
163
-5
639
235
1,737
75
941
155
361
-375
418
55
416
3
12
786
7
0
2
-542
729
73
0
0
11,981
0
0
543
261
0
186
495
445
6
0
276
61
596
0
122
647
46
682
1,275
258
0
87
250
0
421
0
9
0
263
1,306
296
386
247
0
61
140
149
288
107
311
5,882
204
58
304
136
820
0
571
0
$18,010
8,650
$659,445
610
9,260
$687,817
9,260
$666,572
0
0
$15,624
0
$30,175
Revenues
NOTES: NA Indicates data are not available. *In these states, the ending balance includes the balance in the budget stabilization fund. **See Notes to Table 5.
SOURCE: National Association of State Budget Officers.
6
Rainy
Day Fund
Balance
Ending
Balance
Beginning
Balance
N AT I O N A L G O V E R N O R S A S S O C I AT I O N
•
N AT I O N A L A S S O C I AT I O N
OF
S TAT E B U D G E T O F F I C E R S
TABLE 6
General Fund Nominal Percentage Expenditure
Change, Fiscal 2011 and Fiscal 2012**
Region/State
Alabama
Alaska
Arizona
Arkansas
California
Colorado
Connecticut
Delaware
Florida
Georgia
Hawaii
Idaho
Illinois
Indiana
Iowa
Kansas
Kentucky
Louisiana
Maine
Maryland
Massachusetts
Michigan
Minnesota
Mississippi
Missouri
Montana
Nebraska
Nevada
New Hampshire
New Jersey
New Mexico
New York
North Carolina
North Dakota
Ohio
Oklahoma
Oregon
Pennsylvania
Rhode Island
South Carolina
South Dakota
Tennessee
Texas
Utah
Vermont
Virginia
Washington
West Virginia
Wisconsin
Wyoming
TERRITORIES
Puerto Rico
Average
Fiscal
2011
Fiscal
2012
-1.3%
-8.0
6.6
3.6
4.9
3.1
3.7
6.3
13.3
6.8
2.7
-4.9
3.1
1.3
-0.3
8.7
4.0
-11.0
0.8
-1.4
5.4
12.0
6.2
4.8
1.8
1.8
0.3
3.9
-7.3
1.9
-2.9
6.1
-0.1
4.2
9.0
5.8
-4.1
2.5
3.3
1.0
1.5
11.2
4.3
6.1
6.9
4.5
-1.4
2.6
5.8
-10.7
0.0%
21.3
-0.7
2.8
-6.1
3.5
4.8
9.3
-2.8
0.8
12.7
6.1
12.6
6.2
13.5
6.0
5.0
6.9
5.8
11.4
1.4
-4.2
7.7
2.2
3.5
4.4
4.4
-6.9
-4.2
1.3
4.4
2.8
6.4
20.7
1.6
3.0
15.9
-4.1
7.1
9.9
0.2
6.9
7.3
1.5
6.3
7.1
6.4
8.2
4.4
0.6
-10.0
4.0%
1.2
2.9%
*See Notes to Table 6. **Fiscal 2011 reflects changes from fiscal 2010 expenditures (actual) to
fiscal 2011 expenditures (preliminary actual). Fiscal 2012 reflects changes from fiscal 2011
expenditures (preliminary actual) to fiscal 2012 expenditures (appropriated).
THE FISCAL SURVEY
OF
S TAT E S
•
FALL 2011
7
Budget Cuts, Budget Gaps, and the
Recovery Act
Budget gaps are loosely defined as the difference between expected or enacted levels of spending and anticipated revenue
One of the clearest signs of state fiscal stress are mid-year
budget cuts, as they are evidence that states will not be able
to meet previously set revenue collection forecasts. Even
though 19 states made aggregate mid-year budget cuts totaling $7.4 billion in fiscal year 2011, this amount is significantly
lower than fiscal 2010, when 39 states made mid-year budget
cuts totaling $18.3 billion. In fiscal 2009, 41 states made midyear budget cuts. At the depth of the previous state fiscal crisis,
which occurred more than a year after the official end of the
national recession, 37 states in both fiscal 2002 and fiscal
2003 made mid-year budget cuts totaling nearly $14 billion
collections. Highlighting the degree to which state revenue collections fell as a result of the economic downturn is that states
have already solved nearly $230 billion in budget gaps between
fiscal year 2009 and fiscal year 2011. However, the slow recovery of the national economy and state revenues continue to result in significant gaps between spending and revenue
collections. For fiscal 2012, based on data reported to NASBO
and other state government reports, 39 states faced approximately $95 billion in budget gaps. Although not all state budget
offices have completed official forecasts, 17 states are expected to face at least $40 billion in budget gaps for fiscal 2013,
which does not begin until July 1, 2012 for most states.
and $12 billion, respectively. (See Figure 2 and Table 7)
In fiscal 2011, the program areas where many states made
mid-year general fund expenditure cuts were K-12 and higher
education, as 18 states reduced K-12 education and 19 states
cut higher education. Medicaid and corrections were other program areas that were cut by a number of those states making
mid-year cuts. Transportation spending drew the smallest num-
In order to help close these budget gaps, states engaged in a
number of actions. In fiscal 2011, the actions taken most consistently were targeted spending cuts, which were put in place
by 26 states, as well as across the board spending cuts,
which were utilized by 16 states. Additionally, 7 states addressed their budget gap by making use of their “rainy day”
fund, while 11 states imposed new user fees. In eliminating
ber of mid-year cuts from states. (See Tables 8 and 9)
fiscal 2012 budget gaps, 29 states used specific, targeted
For fiscal 2012, although state general fund spending is fore-
cuts, while 18 states employed across the board cuts. An-
cast to grow 2.9 percent, there are significant differences with
other method used by 17 states was to reduce aid to localities
certain program areas. While fiscal 2012 state enacted budgets
while 5 states made use of their “rainy day” funds and 14
show a combined $19.4 billion increase in general fund spend-
states reported that they engaged in agency reorganization.
ing for Medicaid, general fund spending on higher education
As a number of states enacted two-year biennial budgets that
was reduced by $3.2 billion. Additionally, although K-12 edu-
include both fiscal 2012 and fiscal 2013, the most common
cation saw an overall increase in funding, there were 12 states
strategy enacted for 2013 were targeted cuts, which were
which enacted reductions in K-12 general fund spending. Also,
used by 9 states along with reduction in local aid, enacted by
19 states enacted reductions in general fund spending for pub-
6 states. (See Tables 14, 15, and 16)
lic assistance. (See Tables 12 and 13)
8
N AT I O N A L G O V E R N O R S A S S O C I AT I O N
•
N AT I O N A L A S S O C I AT I O N
OF
S TAT E B U D G E T O F F I C E R S
TABLE 7
Mid-Year Budget Cuts: Fiscal 2011 and Fiscal 2012**
Region/State
FY 2011
Size of Cuts
($ in Millions)
Alabama
$414.0
Arizona
California
Colorado
Illinois*
119.3
987.7
Indiana
956.2
Kansas
Louisiana
Maine
Missouri
Montana
7.0
106.7
5.3
254.4
28.4
Nevada
293.3
New Jersey
New Mexico
737.3
150.9
Oregon
Pennsylvania
954.6
167.8
South Dakota
Texas
15.7
802.0
Washington
722.0
Programs or Expenditures
Exempted from Cuts
FY 2012
Size of Cuts
($ in Millions)
Programs or Expenditures
Exempted from Cuts
Debt Service and Federal Court
Ordered Payments
Total
647.3
$7,369.9
Had to comply with ARRA
Federally mandated and those with
revenue matching
Student Financial Aid, Public Assistance,
and Transportation
Debt Service
K-12 Foundation Formula
Exempt from reductions are payment of
interest and principal on state debt; the
legislative branch; the judicial branch; the
school BASE funding program, including
special education; salaries of elected officials
during their terms of office; and the Montana
school for the deaf and blind.
Biennial budget. Some changes to FY 11
made during FY 10 special session.
111.5
K-12 Foundation Formula
Medicaid & Developmental Disabilities
programs
Debt service and non-GF programs
After budget enactment, the Governor
does not have the authority to reduce
appropriations to the Attorney General,
Auditor General, Treasurer (which are
independently elected); the legislature
and judiciary.
The net of mid-year budget adjustments
was a decrease of $802 million.
Basic Education, Debt Service,
Retirement Contributions
—
$111.5
—
Notes: *See Notes Table 7. **Budget Cuts for Fiscal 2012 are currently ongoing. See Tables 9 & 11 for state-by-state data.
SOURCE: National Association of State Budget Officers.
THE FISCAL SURVEY
OF
S TAT E S
•
FALL 2011
9
Table 8
Fiscal 2011 Mid-Year Program Area Cuts
Region/State
Alabama
Alaska
Arizona
Arkansas
California*
Colorado
Connecticut
Delaware
Florida
Georgia*
Hawaii
Idaho
Illinois
Indiana
Iowa
Kansas
Kentucky
Louisiana
Maine
Maryland
Massachusetts
Michigan
Minnesota
Mississippi
Missouri*
Montana
Nebraska
Nevada*
New Hampshire
New Jersey
New Mexico
New York
North Carolina
North Dakota
Ohio
Oklahoma
Oregon
Pennsylvania
Rhode Island*
South Carolina
South Dakota
Tennessee
Texas
Utah
Vermont*
Virginia*
Washington
West Virginia
Wisconsin
Wyoming
TERRITORIES
Puerto Rico
Total
K-12
Education
Higher
Education
x
x
Public
Assistance
Medicaid
Transportation
Other
x
x
x
x
x
x
x
x
x
x
x
x
x
x
x
x
x
x
x
x
x
x
x
x
x
x
x
x
x
x
x
x
x
x
x
x
x
x
x
x
x
x
x
x
x
x
x
x
x
x
x
x
x
x
x
x
x
x
x
x
x
x
x
x
x
x
x
x
x
x
x
x
x
x
x
x
x
x
x
x
x
x
x
x
x
x
x
x
x
x
x
x
x
x
x
x
x
x
x
x
x
x
x
x
x
18
19
12
13
17
7
21
NOTE: *See Notes to Table 8. See Table 9 for state-by-state values
SOURCE: National Association of State Budget Officers.
10
Corrections
N AT I O N A L G O V E R N O R S A S S O C I AT I O N
•
N AT I O N A L A S S O C I AT I O N
OF
S TAT E B U D G E T O F F I C E R S
Table 9
Fiscal 2011 Mid-Year Program Area Cuts by Value
Region/State
Alabama
Alaska
Arizona
Arkansas
California
Colorado
Connecticut
Delaware
Florida
Georgia*
Hawaii
Idaho
Illinois
Indiana
Iowa
Kansas
Kentucky
Louisiana
Maine
Maryland
Massachusetts
Michigan
Minnesota
Mississippi
Missouri
Montana
Nebraska
Nevada
New Hampshire
New Jersey
New Mexico
New York
North Carolina
North Dakota
Ohio
Oklahoma
Oregon
Pennsylvania
Rhode Island*
South Carolina
South Dakota
Tennessee
Texas
Utah
Vermont
Virginia
Washington
West Virginia
Wisconsin
Wyoming
TERRITORIES
Puerto Rico
Total
K-12
Education
Higher
Education
Public
Assistance
Medicaid
Corrections
Transportation
Other
115.1
0.0
0.0
0.0
52.7
x
0.0
67.3
0.0
0.0
4.2
0.0
65.8
326.0
0.0
0.0
0.0
6.8
9.1
0.0
0.0
0.0
0.0
0.0
76.8
2.6
0.0
191.9
0.0
7.2
78.0
0.0
0.0
0.0
0.0
0.0
401.9
10.2
10.1
0.0
0.0
0.0
0.0
0.0
0.0
0.0
311.0
0.0
0.0
0.0
44.0
0.0
0.0
0.0
75.0
0.0
0.0
0.8
0.0
118.7
1.5
0.0
2.5
24.3
0.0
0.0
0.0
34.7
0.0
0.0
2.2
0.0
0.0
0.0
61.5
5.4
0.0
0.0
0.0
123.9
24.3
0.0
0.0
0.0
0.0
0.0
94.4
0.2
1.3
0.0
0.0
0.0
417.0
0.0
0.0
0.0
77.0
0.0
0.0
0.0
0.0
0.0
31.0
0.0
19.6
0.0
0.0
26.8
0.0
3.5
0.0
0.0
15.0
0.0
0.0
0.0
0.0
2.2
0.0
0.0
0.0
0.0
0.0
0.0
8.4
0.0
0.0
5.5
0.0
29.4
0.0
0.0
0.0
0.0
0.0
0.0
40.9
13.7
0.0
0.0
0.0
0.0
0.0
0.0
0.0
0.0
41.0
0.0
0.0
0.0
0.0
0.0
70.8
0.0
187.4
x
0.0
63.8
0.0
0.0
0.0
0.0
0.0
0.0
0.0
0.0
0.0
4.9
0.0
0.0
0.0
0.0
0.0
0.0
27.6
4.8
0.0
54.9
0.0
0.0
0.0
0.0
0.0
0.0
0.0
0.0
178.1
16.5
0.0
0.0
31.1
0.0
154.0
0.0
0.0
0.0
53.0
0.0
0.0
0.0
50.7
0.0
15.6
0.0
83.1
0.0
0.0
11.3
0.0
0.0
0.2
0.0
0.0
45.6
0.0
0.0
0.0
9.6
2.2
0.0
0.0
0.0
0.0
0.0
0.0
4.2
0.0
0.0
0.0
30.9
8.8
0.0
0.0
0.0
0.0
0.0
105.4
32.2
0.7
0.0
0.8
0.0
31.0
0.0
0.0
0.0
49.0
0.0
0.0
0.0
0.0
0.0
0.0
0.0
352.7
0.0
0.0
0.0
0.0
8.3
0.0
0.0
0.6
0.0
0.0
0.0
0.0
0.0
0.0
0.0
0.0
0.0
0.0
0.0
6.0
0.0
0.0
0.0
0.0
0.0
0.0
0.0
0.0
0.0
0.0
0.0
0.8
0.0
0.0
0.0
0.0
0.0
21.0
0.0
0.0
0.0
3.0
0.0
0.0
0.0
204.2
0.0
2.0
0.0
217.2
x
0.0
33.3
0.0
47.0
8.8
0.0
563.3
560.3
0.0
0.0
0.0
48.5
24.2
0.0
0.0
0.0
0.0
0.0
74.1
11.4
0.0
41.0
0.0
545.9
39.8
0.0
0.0
0.0
0.0
0.0
133.1
95.0
0.0
0.0
0.1
0.0
634.0
0.0
0.0
0.0
188.0
0.0
0.0
0.0
0.0
1,736.7
0.0
1,108.7
0.0
237.0
0.0
846.9
0.0
481.1
0.0
392.4
0.0
3,471.2
THE FISCAL SURVEY
OF
NOTE: *See Notes to Table 9. Dollar values are in millions
SOURCE: National Association of State Budget Officers.
S TAT E S
•
FALL 2011
11
Table 10
Fiscal 2012 Mid-Year Program Area Cuts
Region/State
Alabama
Alaska
Arizona
Arkansas
California
Colorado
Connecticut
Delaware
Florida
Georgia
Hawaii
Idaho
Illinois
Indiana
Iowa
Kansas
Kentucky
Louisiana
Maine
Maryland
Massachusetts
Michigan
Minnesota
Mississippi
Missouri
Montana
Nebraska
Nevada
New Hampshire
New Jersey
New Mexico
New York
North Carolina
North Dakota
Ohio
Oklahoma
Oregon
Pennsylvania
Rhode Island
South Carolina
South Dakota
Tennessee
Texas
Utah
Vermont
Virginia
Washington
West Virginia
Wisconsin
Wyoming
TERRITORIES
Puerto Rico
Total
Higher
Education
K-12
Education
Public
Assistance
Medicaid
Transportation
x
x
x
x
x
x
x
x
2
2
2
0
NOTE: *See Notes to Table 10. See Table 11 for state-by-state values
SOURCE: National Association of State Budget Officers.
12
Corrections
N AT I O N A L G O V E R N O R S A S S O C I AT I O N
•
N AT I O N A L A S S O C I AT I O N
OF
S TAT E B U D G E T O F F I C E R S
0
2
Other
0
Table 11
Fiscal 2012 Mid-Year Program Area Cuts by Value
Region/State
Alabama
Alaska
Arizona
Arkansas
California
Colorado
Connecticut
Delaware
Florida
Georgia
Hawaii
Idaho
Illinois
Indiana
Iowa
Kansas
Kentucky
Louisiana
Maine
Maryland
Massachusetts
Michigan
Minnesota
Mississippi
Missouri
Montana
Nebraska
Nevada
New Hampshire
New Jersey
New Mexico
New York
North Carolina
North Dakota
Ohio
Oklahoma
Oregon
Pennsylvania
Rhode Island
South Carolina
South Dakota
Tennessee
Texas
Utah
Vermont
Virginia
Washington
West Virginia
Wisconsin
Wyoming
TERRITORIES
Puerto Rico
Total
K-12
Education
Higher
Education
Public
Assistance
Medicaid
Corrections
Transportation
Other
0.0
0.0
0.0
0.0
0.0
x
0.0
0.0
0.0
0.0
0.0
0.0
0.0
0.0
0.0
0.0
0.0
0.0
0.0
0.0
0.0
0.0
0.0
0.0
19.8
0.0
0.0
0.0
0.0
0.0
0.0
0.0
0.0
0.0
0.0
0.0
0.0
0.0
0.0
0.0
0.0
0.0
0.0
0.0
0.0
0.0
0.0
0.0
0.0
0.0
0.0
0.0
0.0
0.0
0.0
0.0
0.0
0.0
0.0
0.0
0.0
0.0
0.0
0.0
0.0
0.0
0.0
0.0
0.0
0.0
0.0
0.0
0.0
0.0
0.0
0.0
0.0
0.0
0.0
0.0
0.0
0.0
0.0
0.0
0.0
0.0
0.0
0.0
0.0
0.0
0.0
0.0
0.0
0.0
0.0
0.0
0.0
0.0
0.0
0.0
0.0
0.0
0.0
0.0
0.0
x
0.0
0.0
0.0
0.0
0.0
0.0
0.0
0.0
0.0
0.0
0.0
0.0
0.0
0.0
0.0
0.0
0.0
0.0
13.9
0.0
0.0
0.0
0.0
0.0
0.0
0.0
0.0
0.0
0.0
0.0
0.0
0.0
0.0
0.0
0.0
0.0
0.0
0.0
0.0
0.0
0.0
0.0
0.0
0.0
0.0
0.0
0.0
0.0
0.0
x
0.0
0.0
0.0
0.0
0.0
0.0
0.0
0.0
0.0
0.0
0.0
0.0
0.0
0.0
0.0
0.0
0.0
0.0
2.0
0.0
0.0
0.0
0.0
0.0
0.0
0.0
0.0
0.0
0.0
0.0
0.0
0.0
0.0
0.0
0.0
0.0
0.0
0.0
0.0
0.0
0.0
0.0
0.0
0.0
0.0
0.0
0.0
0.0
0.0
0.0
0.0
0.0
0.0
0.0
0.0
0.0
0.0
0.0
0.0
0.0
0.0
0.0
0.0
0.0
0.0
0.0
0.0
0.0
0.0
0.0
0.0
0.0
0.0
0.0
0.0
0.0
0.0
0.0
0.0
0.0
0.0
0.0
0.0
0.0
0.0
0.0
0.0
0.0
0.0
0.0
0.0
0.0
0.0
0.0
0.0
0.0
0.0
0.0
0.0
x
0.0
0.0
0.0
0.0
0.0
0.0
0.0
0.0
0.0
0.0
0.0
0.0
0.0
0.0
0.0
0.0
0.0
0.0
73.7
0.0
0.0
0.0
0.0
0.0
0.0
0.0
0.0
0.0
0.0
0.0
0.0
0.0
0.0
0.0
0.0
0.0
0.0
0.0
0.0
0.0
0.0
0.0
0.0
0.0
0.0
0.0
0.0
0.0
0.0
0.0
0.0
0.0
0.0
0.0
0.0
0.0
0.0
0.0
0.0
0.0
0.0
0.0
0.0
0.0
0.0
0.0
0.0
0.0
0.0
0.0
0.0
0.0
0.0
0.0
0.0
0.0
0.0
0.0
0.0
0.0
0.0
0.0
0.0
0.0
0.0
0.0
0.0
0.0
0.0
0.0
0.0
0.0
0.0
0.0
0.0
19.8
0.0
0.0
0.0
13.9
0.0
2.0
0.0
0.0
0.0
73.7
0.0
0.0
NOTE: *See Notes to Table 11. Dollar values are in millions
SOURCE: National Association of State Budget Officers.
THE FISCAL SURVEY
OF
S TAT E S
•
FALL 2011
13
Table 12
Fiscal 2012 Enacted Program Area Adjustments
Region/State
Alabama
Alaska
Arizona
Arkansas
California
Colorado*
Connecticut*
Delaware
Florida
Georgia
Hawaii
Idaho
Illinois
Indiana
Iowa
Kansas
Kentucky
Louisiana
Maine
Maryland
Massachusetts*
Michigan*
Minnesota
Mississippi*
Missouri
Montana*
Nebraska
Nevada
New Hampshire
New Jersey
New Mexico
New York*
North Carolina
North Dakota
Ohio
Oklahoma
Oregon
Pennsylvania*
Rhode Island*
South Carolina
South Dakota
Tennessee
Texas
Utah
Vermont
Virginia
Washington
West Virginia
Wisconsin*
Wyoming
TERRITORIES
Puerto Rico*
Total
K-12
Education
Higher
Education
x
x
x
x
x
x
x
x
x
x
x
x
x
x
x
x
x
x
x
x
x
x
x
x
x
x
x
x
x
x
x
x
x
x
Public
Assistance
Medicaid
Corrections
x
x
x
x
x
x
x
x
x
x
x
x
x
x
x
x
x
x
x
x
x
x
x
x
x
x
x
x
x
x
x
x
x
x
x
x
x
x
x
x
x
x
x
x
x
x
x
x
x
x
x
x
x
x
x
x
x
x
x
x
x
x
x
x
x
x
x
x
x
x
x
x
x
x
x
x
x
x
x
x
x
x
x
x
x
x
x
x
x
x
x
x
x
x
x
x
x
x
x
x
x
x
x
x
x
x
x
x
x
x
x
x
x
x
x
x
x
x
x
x
x
x
x
x
x
x
x
x
x
x
x
x
x
x
x
x
x
x
x
x
x
x
x
x
x
x
x
x
x
x
x
x
x
x
x
x
x
x
x
x
x
x
x
x
x
x
x
x
x
x
x
43
x
43
x
41
x
43
22
x
42
x
x
x
x
x
x
x
x
x
x
x
x
x
x
x
x
x
x
x
x
x
27
NOTE: *See Notes to Table 12. See Table 13 for state-by-state values.
SOURCE: National Association of State Budget Officers.
14
N AT I O N A L G O V E R N O R S A S S O C I AT I O N
•
N AT I O N A L A S S O C I AT I O N
OF
S TAT E B U D G E T O F F I C E R S
Transportation
x
x
x
x
Other
x
x
x
x
x
x
x
x
x
x
x
x
x
x
x
x
x
x
x
x
x
x
x
x
x
x
x
x
x
x
x
x
Table 13
Fiscal 2012 Enacted Program Area Adjustments By Value
Region/State
Alabama
Alaska
Arizona*
Arkansas
California
Colorado*
Connecticut
Delaware
Florida
Georgia
Hawaii
Idaho
Illinois
Indiana
Iowa
Kansas
Kentucky
Louisiana
Maine
Maryland
Massachusetts*
Michigan*
Minnesota
Mississippi*
Missouri
Montana*
Nebraska
Nevada
New Hampshire
New Jersey
New Mexico
New York*
North Carolina
North Dakota
Ohio
Oklahoma
Oregon
Pennsylvania*
Rhode Island*
South Carolina
South Dakota
Tennessee
Texas
Utah
Vermont
Virginia
Washington
West Virginia
Wisconsin*
Wyoming
TERRITORIES
Puerto Rico*
Total
K-12
Education
54.6
56.0
202.9
56.1
-1,777.0
-129.9
72.2
67.3
-502.8
-20.7
112.1
9.3
1,936.0
-298.5
0.0
76.0
12.3
0.0
22.0
650.2
0.0
0.0
248.3
87.2
29.6
26.2
4.9
29.0
0.0
855.2
29.2
-1,877.0
378.9
0.0
-232.0
-97.4
256.8
-784.5
17.1
122.0
-40.4
439.1
609.0
85.6
-23.2
238.5
506.0
164.7
-408.6
0.0
0.0
134.5
1,262.3
Higher
Education
13.3
24.9
270.1
6.9
-1,241.3
-81.1
-26.1
0.8
-215.4
-179.9
25.6
-8.5
783.0
-58.4
0.0
-1.0
16.5
0.0
2.7
-8.0
0.0
-291.6
-75.4
64.2
-77.5
25.0
-4.0
-85.6
0.0
-149.9
-42.9
-44.0
-196.7
0.0
-282.0
-58.2
228.3
-268.8
4.2
-28.7
-17.1
-252.8
-559.0
30.6
0.0
-75.3
-168.0
44.9
-208.4
0.0
0.0
15.0
-3,164.6
Public
Assistance
0.0
12.1
55.8
5.9
-156.9
0.0
0.0
26.8
0.0
-3.6
5.7
0.0
-8.7
0.0
0.0
-3.0
0.0
0.0
-3.5
6.3
0.0
142.6
6.4
6.4
0.0
0.0
-8.6
1.6
0.0
-99.6
0.0
240.0
0.0
0.0
-159.0
0.0
0.0
-52.1
-2.6
0.0
0.0
1.4
-15.0
0.0
-4.1
-4.0
-61.0
-0.3
0.0
0.0
0.0
0.0
-71.0
Medicaid
298.5
62.7
611.9
0.0
2,264.0
402.4
166.0
63.8
274.0
606.6
236.4
128.0
-199.0
287.7
0.0
240.0
3.1
0.0
153.3
810.5
0.0
731.5
1,370.5
-92.2
206.9
40.6
110.5
71.6
0.0
423.9
295.0
3,166.0
590.0
0.0
1,453.0
0.0
330.2
73.7
162.7
-58.6
24.6
657.9
1,641.0
74.0
-34.8
661.3
346.0
2.4
713.6
0.0
0.0
-255.0
19,429.8
Corrections
Transportation
38.5
21.1
3.4
10.5
889.9
-23.9
5.4
11.3
-288.8
82.9
5.8
12.4
-43.0
-28.7
0.0
42.0
13.6
0.0
6.3
66.9
0.0
-43.0
-20.3
0.0
1.8
-1.0
13.5
-7.6
0.0
-24.3
-5.9
-168.0
52.5
0.0
-66.0
-2.3
162.4
0.5
4.5
0.0
2.4
-7.9
-74.0
3.9
-3.3
-3.4
47.0
6.5
-49.4
0.0
0.0
17.6
585.7
Other
0.0
11.0
0.0
0.0
0.0
0.0
0.0
0.0
0.0
38.2
0.0
0.0
-47.0
42.6
0.0
0.0
0.0
0.0
-7.0
0.0
0.0
0.0
-6.7
0.0
-6.2
-2.1
0.0
0.0
0.0
129.4
0.0
-216.0
0.0
0.0
-4.0
-8.0
-2.7
5.7
0.0
0.0
-0.1
9.3
82.0
0.0
-4.0
23.3
1.0
-1.0
-33.3
0.0
0.0
0.0
4.5
-115.0
177.8
17.7
30.4
-593.3
45.5
-700.0
33.3
63.1
57.2
115.0
3.9
687.7
-77.0
0.0
26.0
40.2
0.0
-7.8
81.1
0.0
212.4
-329.9
51.0
-72.3
-52.2
-53.1
-100.2
0.0
-787.2
-46.8
238.0
-100.6
0.0
-255.0
-52.1
-3.6
-147.2
0.0
0.0
-10.7
-93.0
1,928.0
115.5
-17.6
259.0
272.0
70.5
108.9
0.0
0.0
124.5
1,019.7
NOTE: *See Notes to Table 13. Dollar values are in millions. Value of changes are in reference to funding level of FY 2011 enacted budget
SOURCE: National Association of State Budget Officers.
THE FISCAL SURVEY
OF
S TAT E S
•
FALL 2011
15
TABLE 14
Strategies Used to Reduce or Eliminate Budget Gaps, Fiscal 2011
Region/State
Alabama
Alaska
Arizona*
Arkansas
California*
Colorado*
Connecticut*
Delaware
Florida
Georgia*
Hawaii*
Idaho*
Illinois
Indiana
Iowa
Kansas
Kentucky
Louisiana
Maine*
Maryland*
Massachusetts
Michigan
Minnesota
Mississippi
Missouri
Montana
Nebraska
Nevada
New Hampshire
New Jersey
New Mexico*
New York*
North Carolina
North Dakota
Ohio
Oklahoma
Oregon
Pennsylvania*
Rhode Island*
South Carolina
South Dakota*
Tennessee*
Texas
Utah
Vermont
Virginia
Washington
West Virginia
Wisconsin
Wyoming
TERRITORIES
Puerto Rico*
Total
User
Fees
Higher Education
Related
Fees
Court
Related
Fees
Transportation/
Motor Vehicle
Related Fees
Business
Related Fees
Furloughs
Early
Retirement
Salary
Reductions
x
x
x
x
x
x
x
x
x
x
x
x
x
x
x
x
x
x
x
x
x
x
x
x
x
x
x
x
x
x
x
x
x
x
x
x
x
x
x
x
x
x
x
x
x
x
x
x
x
x
x
x
x
x
x
x
x
x
x
x
x
x
x
x
x
x
x
x
x
x
x
x
x
x
x
x
x
11
7
7
3
NOTE: *See Notes to Table 14.
SOURCE: National Association of State Budget Officers.
16
Layoffs
N AT I O N A L G O V E R N O R S A S S O C I AT I O N
•
5
x
x
15
18
x
x
x
7
8
Table 14 continues on next page.
N AT I O N A L A S S O C I AT I O N
OF
S TAT E B U D G E T O F F I C E R S
TABLE 14 (Continued)
Strategies Used to Reduce or Eliminate Budget Gaps, Fiscal 2011
Region/State
Alabama
Alaska
Arizona*
Arkansas
California*
Colorado*
Connecticut*
Delaware
Florida
Georgia*
Hawaii*
Idaho*
Illinois
Indiana
Iowa
Kansas
Kentucky
Louisiana
Maine*
Maryland*
Massachusetts
Michigan
Minnesota
Mississippi
Missouri
Montana
Nebraska
Nevada
New Hampshire
New Jersey
New Mexico*
New York*
North Carolina
North Dakota
Ohio
Oklahoma
Oregon
Pennsylvania*
Rhode Island*
South Carolina
South Dakota*
Tennessee*
Texas
Utah
Vermont
Virginia
Washington
West Virginia
Wisconsin
Wyoming
TERRITORIES
Puerto Rico*
Total
Cuts to State
Employee
Benefits
Acrossthe-Board
Percent Cuts
Targeted
Cuts
Reduce
Local Aid
x
x
x
x
x
x
x
x
x
x
x
x
x
x
Reorganize
Agencies
Privatization
Rainy
Day
Fund
Lottery
Expansion
Gaming/
Gambling
Expansion
Other
(Specify)
x
x
x
x
x
x
x
x
x
x
x
x
x
x
x
x
x
x
x
x
x
x
x
x
x
x
x
x
x
x
x
x
x
x
x
x
x
x
x
x
x
x
x
x
x
x
x
x
x
x
x
x
x
x
x
x
x
x
x
x
x
x
x
x
x
x
x
x
x
x
x
x
x
x
x
x
x
7
16
x
x
x
26
13
x
x
6
2
x
7
2
x
15
1
NOTE: *See Notes to Table 14.
SOURCE: National Association of State Budget Officers.
THE FISCAL SURVEY
OF
S TAT E S
•
FALL 2011
17
TABLE 15
Strategies Used to Reduce or Eliminate Budget Gaps, Fiscal 2012
Region/State
Alabama
Alaska
Arizona*
Arkansas
California*
Colorado*
Connecticut*
Delaware
Florida*
Georgia
Hawaii*
Idaho*
Illinois
Indiana
Iowa
Kansas
Kentucky
Louisiana
Maine*
Maryland*
Massachusetts
Michigan*
Minnesota*
Mississippi
Missouri
Montana
Nebraska
Nevada*
New Hampshire
New Jersey
New Mexico*
New York*
North Carolina
North Dakota
Ohio
Oklahoma
Oregon
Pennsylvania
Rhode Island*
South Carolina
South Dakota*
Tennessee*
Texas
Utah
Vermont
Virginia
Washington
West Virginia*
Wisconsin
Wyoming
TERRITORIES
Puerto Rico*
Total
User
Fees
Higher Education
Related
Fees
Court
Related
Fees
Transportation/
Motor Vehicle
Related Fees
Business
Related Fees
x
x
x
x
x
x
x
x
x
x
Furloughs
Early
Retirement
x
x
x
x
Salary
Reductions
x
x
x
x
x
x
x
x
x
x
x
x
x
x
x
x
x
x
x
x
x
x
x
x
x
x
x
x
x
x
x
x
x
x
x
x
x
x
x
x
x
x
x
x
x
x
x
x
x
x
x
x
11
7
N AT I O N A L G O V E R N O R S A S S O C I AT I O N
•
x
x
5
7
NOTE: *See Notes to Table 15.
SOURCE: National Association of State Budget Officers.
18
Layoffs
5
16
x
4
5
9
Table 15 continues on next page.
N AT I O N A L A S S O C I AT I O N
OF
S TAT E B U D G E T O F F I C E R S
TABLE 15
(Continued)
Strategies Used to Reduce or Eliminate Budget Gaps, Fiscal 2012
Region/State
Alabama
Alaska
Arizona*
Arkansas
California*
Colorado*
Connecticut*
Delaware
Florida*
Georgia
Hawaii*
Idaho*
Illinois
Indiana
Iowa
Kansas
Kentucky
Louisiana
Maine*
Maryland*
Massachusetts
Michigan*
Minnesota*
Mississippi
Missouri
Montana
Nebraska
Nevada*
New Hampshire
New Jersey
New Mexico*
New York*
North Carolina
North Dakota
Ohio
Oklahoma
Oregon
Pennsylvania
Rhode Island*
South Carolina
South Dakota*
Tennessee*
Texas
Utah
Vermont
Virginia
Washington
West Virginia*
Wisconsin
Wyoming
TERRITORIES
Puerto Rico*
Total
Cuts to State
Employee
Benefits
Acrossthe-Board
Percent Cuts
x
x
Targeted
Cuts
Reduce
Local Aid
x
x
x
x
x
x
x
x
x
x
x
x
x
x
x
x
x
x
x
x
x
x
x
x
x
x
x
x
x
x
x
x
x
x
x
x
x
x
x
x
x
x
x
x
x
x
x
x
x
x
x
x
x
x
x
Lottery
Expansion
Gaming/
Gambling
Expansion
Other
(Specify)
x
x
x
x
x
x
x
Privatization
Rainy
Day
Fund
x
x
x
x
Reorganize
Agencies
x
x
x
x
x
x
x
x
x
x
x
x
x
x
x
x
x
x
x
x
x
x
x
x
x
x
x
x
x
x
x
x
x
x
x
x
x
x
x
x
x
x
x
x
x
x
x
x
x
x
x
x
x
14
16
29
18
x
14
x
x
x
5
x
5
4
x
18
1
NOTE: *See Notes to Table 15.
SOURCE: National Association of State Budget Officers.
THE FISCAL SURVEY
OF
S TAT E S
•
FALL 2011
19
TABLE 16
Strategies Used to Reduce or Eliminate Budget Gaps, Fiscal 2013
Region/State
Alabama
Alaska
Arizona
Arkansas
California
Colorado
Connecticut
Delaware
Florida
Georgia
Hawaii*
Idaho
Illinois
Indiana
Iowa
Kansas
Kentucky
Louisiana
Maine*
Maryland
Massachusetts
Michigan*
Minnesota
Mississippi
Missouri
Montana
Nebraska
Nevada*
New Hampshire
New Jersey
New Mexico
New York
North Carolina
North Dakota
Ohio
Oklahoma
Oregon
Pennsylvania
Rhode Island
South Carolina
South Dakota
Tennessee*
Texas
Utah
Vermont
Virginia
Washington
West Virginia*
Wisconsin
Wyoming
TERRITORIES
Puerto Rico
Total
User
Fees
Higher Education
Related
Fees
x
Court
Related
Fees
Transportation/
Motor Vehicle
Related Fees
Business
Related Fees
Furloughs
Early
Retirement
Salary
Reductions
x
x
x
x
x
x
x
x
x
x
x
x
x
x
x
x
x
x
x
x
x
x
x
x
x
x
5
3
N AT I O N A L G O V E R N O R S A S S O C I AT I O N
•
x
x
x
x
4
2
NOTE: *See Notes to Table 16.
SOURCE: National Association of State Budget Officers.
20
Layoffs
2
7
x
2
2
5
Table 16 continues on next page.
N AT I O N A L A S S O C I AT I O N
OF
S TAT E B U D G E T O F F I C E R S
TABLE 16 (Continued)
Strategies Used to Reduce or Eliminate Budget Gaps, Fiscal 2013
Region/State
Alabama
Alaska
Arizona
Arkansas
California
Colorado
Connecticut
Delaware
Florida
Georgia
Hawaii*
Idaho
Illinois
Indiana
Iowa
Kansas
Kentucky
Louisiana
Maine*
Maryland
Massachusetts
Michigan*
Minnesota
Mississippi
Missouri
Montana
Nebraska
Nevada*
New Hampshire
New Jersey
New Mexico
New York
North Carolina
North Dakota
Ohio
Oklahoma
Oregon
Pennsylvania
Rhode Island
South Carolina
South Dakota
Tennessee*
Texas
Utah
Vermont
Virginia
Washington
West Virginia*
Wisconsin
Wyoming
TERRITORIES
Puerto Rico
Total
Cuts to State
Employee
Benefits
Acrossthe-Board
Percent Cuts
x
x
Targeted
Cuts
Reduce
Local Aid
Reorganize
Agencies
x
x
x
Privatization
Rainy
Day
Fund
Lottery
Expansion
Gaming/
Gambling
Expansion
Other
(Specify)
x
x
x
x
x
x
x
x
x
x
x
x
x
x
x
x
x
x
x
x
x
x
x
x
x
x
x
x
x
x
x
x
x
x
x
x
6
7
9
6
x
x
x
x
x
7
1
x
2
1
x
5
1
NOTE: *See Notes to Table 16.
SOURCE: National Association of State Budget Officers.
THE FISCAL SURVEY
OF
S TAT E S
•
FALL 2011
21
Figure 2:
Budget Cuts Made After the Budget Passed, Fiscal 1990 to Fiscal 2012 ($ Millions)
50
$60,000
Recession ends
Recession ends
Recession ends
$50,000
40
$40,000
30
$30,000
20
$20,000
10
$10,000
$0
19
90
19
91
19
92
19
93
19
94
19
95
19
96
19
97
19
98
19
99
20
00
20
01
20
02
20
03
20
04
20
05
20
06
20
07
20
08
20
09
20
10
20
11
20
12
0
Number of States
Amount of Reduction
SOURCE: National Association of State Budget Officers November 2011 Fiscal Survey of States
State Employment Changes
The issue of state employee compensation has also been
Although state fiscal conditions have improved when compared
to the strained fiscal conditions that existed in fiscal 2009 and
fiscal 2010, the impact of the recession continues to have a
significant impact on state employment. This significant impact
is viewable in a number of ways. First, although the overall number of full time equivalent (FTE) positions grew slightly in fiscal
2011, 33 states actually reduced their overall number. For fiscal
2012, the number of FTE positions declined by 1.2 percent as
31 states reduced their total number. Additionally, in fiscal 2011,
widely affected by the recession and the lack of a strong economic recovery. However, as each state has been impacted differently by the economy over the past few years, there has
been wide variability in how states have made changes to their
employee compensation packages. For fiscal 2012, some
states enacted a budget which forgoes compensation increases for state employees, while other states enacted higher
pension and health insurance contributions, and still other
states enacted compensation increases. (See Table 18)
15 states employed layoffs while 18 states instituted furlough
programs as methods to help solve their budget gaps. Similarly,
in fiscal 2012, 16 states employed layoffs and four states used
furlough programs. (See Tables 14, 15, 16, and 17)
22
N AT I O N A L G O V E R N O R S A S S O C I AT I O N
•
N AT I O N A L A S S O C I AT I O N
OF
S TAT E B U D G E T O F F I C E R S
Table 17
Number of Filled Full-Time Equivalent Positions at the End of Fiscal 2010 to Fiscal 2012, in All Funds
Region/State
Alabama
Alaska
Arizona
Arkansas
California*
Colorado*
Connecticut*
Delaware
Florida
Georgia
Hawaii*
Idaho
Illinois*
Indiana
Iowa
Kansas
Kentucky
Louisiana*
Maine
Maryland
Massachusetts*
Michigan
Minnesota
Mississippi
Missouri
Montana
Nebraska*
Nevada*
New Hampshire*
New Jersey
New Mexico
New York*
North Carolina
North Dakota
Ohio*
Oklahoma
Oregon
Pennsylvania
Rhode Island
South Carolina
South Dakota
Tennessee
Texas
Utah
Vermont
Virginia
Washington
West Virginia
Wisconsin*
Wyoming
TERRITORIES
Puerto Rico
Total***
Percent
Change
2010-2011
Percent
Change
2011-2012
33,950
21,724
38,159
34,501
351,630
52,174
46,352
31,188
122,235
54,748
44,747
17,757
53,415
27,500
41,790
40,721
32,470
72,682
13,444
74,610
83,836
42,200
NA
36,714
56,508
13,488
NA
16,466
9,733
71,724
21,900
178,200
322,564
8,259
55,650
36,458
50,531
80,423
14,166
67,526
13,628
42,500
235,240
20,746
7,709
114,566
107,170
37,421
60,327
7,699
-3.48%
0.02
-1.44
0.44
3.34
1.61
2.63
0.66
-1.09
-3.06
-1.75
-2.55
0.43
-4.49
1.60
-0.41
-0.22
73.70
-4.19
-0.35
-0.92
-6.08
-0.33
-2.72
-3.40
0.17
-1.26
1.65
-3.37
-4.42
-0.59
-3.72
-3.04
-1.00
-2.96
-5.41
-0.39
-0.86
3.80
-9.90
-7.43
-2.59
2.84
-1.35
0.23
0.40
-2.25
0.84
-1.24
7.56
0.00%
0.47
2.70
8.02
-1.59
-1.30
1.35
0.52
-3.55
-8.33
-1.09
-0.65
-0.60
-2.03
-1.06
-4.71
0.00
-4.62
0.79
-1.27
-0.28
-5.77
NA
15.06
2.02
-0.57
NA
-1.11
-8.14
2.80
-8.72
-5.47
1.77
8.16
-2.87
0.20
-1.97
-1.29
-0.05
-5.83
4.02
0.05
-2.33
-2.06
0.34
0.39
-0.30
0.60
-2.26
0.00
180,788
3,019,149
-10.64
0.04%
0.34
-1.19%
Fiscal
2010
Fiscal
2011
Fiscal
2012
35,175
21,619
37,697
31,798
345,777
52,025
44,559
30,823
128,131
61,606
46,048
18,341
53,507
29,389
41,572
42,913
32,540
43,871
13,921
75,834
84,848
47,687
35,635
32,800
57,336
13,542
16,144
16,380
10,965
72,999
24,135
195,800
326,909
7,713
59,045
38,466
51,747
82,183
13,653
79,590
14,153
43,606
234,213
21,473
7,665
113,672
109,974
36,887
62,495
7,158
33,950
21,623
37,156
31,939
357,316
52,864
45,733
31,027
126,729
59,723
45,241
17,873
53,738
28,069
42,238
42,735
32,470
76,205
13,338
75,567
84,070
44,786
35,516
31,909
55,389
13,565
15,940
16,650
10,596
69,772
23,993
188,511
316,959
7,636
57,295
36,384
51,546
81,473
14,173
71,710
13,101
42,478
240,862
21,183
7,683
114,125
107,496
37,198
61,722
7,699
201,629
3,054,239
180,171
3,055,497
Includes Higher
Education
Faculty
StateAdministered
Welfare System
x
x
x
x
x
x
x
x
x
x
x
x
x
x
x
x
x
x
x
x
x
x
x
x
x
x
x
x
x
x
x
x
x
x
x
x
x
x
x
x
x
x
x
x
x
x
x
x
x
x
x
x
x
x
x
x
x
x
x
NOTE: *NA indicates data are not available. *See Notes to Table 17. **Unless otherwise noted, fiscal 2010 reflects actual figures, fiscal 2011 reflects preliminary actuals and fiscal 2012 reflects
appropriated figures. ***Totals exclude states that were not able to provide data for all three years.
THE FISCAL SURVEY
OF
S TAT E S
•
FALL 2011
23
TABLE 18
State Employee Compensation Changes, Fiscal 2012
Across-the-Board
(percent)
Merit
(percent)
Other
(percent)
Alabama
00
-5.0
-2.25
Alaska
3.0
3.5
Region/State
Arizona
2.0
Arkansas
California
-2.0 to 9.6
percent
Colorado
2.5
Connecticut
Delaware
Florida
Georgia
Hawaii
Depends on
individual eligibility
Effective January 1, 2012
5.0
Only certain bargaining units have ratified contracts; the collective
bargaining process with other units are continuing.
If agencies have the money they can give out a few merit increases for
completion of probation period or to address a salary equity issue. No
across the board increases will be approved.
2.6
Applicable bargaining unit employees receive approximately a 3.77 percent
step increase on their anniversary. The 2.6 percent ATB increase is the
effective annual increase for bargaining unit employees. It is a statistical
approximation based on the largest union employee working in the State of
Illinois.
Employee compensation package for FY 2012 has not yet been determined.
State employees received performance-based pay raises in FY 2011
averaging 1.3 percent. In addition, Governor Daniels provided a 1-time,
efficiency dividend to state employees of $1,000, $750 or $500 depending
upon their performance evaluation.
Indiana
Iowa
Kansas
Kentucky
Louisiana
Maine
Maryland
Massachusetts
Annual merit raises (5 percent) are frozen through December 31, 2011;
Employee retirement contribution rates are set to increase 2.25 percent
on October 1, 2011.
COLA 2 percent for most bargaining units. Merit/longevity approx.
3.5 percent for most employees placed within the first seven wage steps
within their range, and for approximately half of employees at a more
advanced step (increases provided every other year). Geo diff. changes +/-,
health insurance premium increases.
Approximately 70 percent of State employees were required to furlough
5 days in FY 2011. These furloughs were eliminated in FY 2012 for an
approximate increase of 1.96 percent for each affected employee.
The cost of living and merit increases for FY 2012 will be determined at
the end of the year based on available funding.
Different bargaining units negotiated different employee compensation
packages for pay and benefits. The percentages represent the reduction
to take-home pay negotiated.
SB11-076 continued the PERA retirement "swap" whereby the State GF
contribution is decreased and the employee contribution is commensurately
increased.
2.0
Idaho
Massachusetts
Illinois
Notes
4.5
2.5
0.0
0.0
No compensation packages were adopted.
0.0
$750
3.0
3.0
Collective bargaining agreements with State employees not settled
as of 9/1/2011. It is not expected that state employees will receive
any compensation adjustment.
Employees receive a one-time $750 bonus.
Three percent for unions and 3 percent merit for managers.
Table 18 continues on next page.
24
N AT I O N A L G O V E R N O R S A S S O C I AT I O N
•
N AT I O N A L A S S O C I AT I O N
OF
S TAT E B U D G E T O F F I C E R S
TABLE 18 (Continued)
State Employee Compensation Changes, Fiscal 2012
Region/State
Michigan
Across-the-Board
(percent)
Merit
(percent)
Other
(percent)
2.0
Minnesota
Missouri
Montana
Nebraska
Nevada
New Hampshire
New Jersey
New Mexico
See Note
-2.5
0.0
-2.3
1.5
Notes
The two percent across the board percent general increase is for enlisted
state police personnel; no increase for all other classified employees. Existing
classified employees pay 10 percent of annual health plan premium
amounts, and increased deductibles, prescription, and office visit co-pay
amounts. Effective 4/1/2010, newly hired state employees pay 20 percent
of annual health plan premium amounts with higher co-pays and a
co-insurance requirement, paying more for a skinnier package when
compared to existing classified employees. Some classified employees will
receive step increases; pay adjustments for satisfactory performance in the
amounts and at intervals provided for in the compensation schedule for the
employee's classification level. Other employees may be eligible for
promotion to a higher classification grade and pay level. Career employees
receive an annual longevity payment following completion of 6 years of
continuous full-time service. The amount of the longevity payment varies
depending on the number of years of full-time service and is increased in
four-year increments.
Not available. Labor contract negotiations are currently underway for the
two-year bargaining period that began July 1, 2011.
Employees will have higher out of pocket expenses related to employer
provided health care plans.
State employees will be held harmless for projected increases to the state
health care plan.
Employees covered by the NAPE/AFSCME, State Law Enforcement (SLEBC),
and State Teachers (SCATA) collective bargaining contracts agreed to a salary
freeze for the 2011-2012 fiscal year. With a few exceptions, employees of
the Judicial Branch were given no salary increase for FY 2011-2012.
Salaries of employees of the Dept. of Education were also frozen for
FY 2011-2012. Supervisory and Management (non-contract) staff of most
other agencies received a 1.5 percent salary increase for FY 2011-2012
effective 7/1/2011. Employees of the Legislative Branch received salary
increases of 1.5 percent for FY 2011-2012 effective July 1, 2011.
Reduction in "other" is a furlough of six days
Employee compensation for annual step increases, for classified employees
represented through collective bargaining, has been frozen for the period
effective September 1, 2011 through August 31, 2012. Nonrepresented,
nonclassified, and unclassified employees in the Executive Branch, those
eligible for step increases, have had that action frozen by an executive
order of the governor for the same timeframe.
The 1.5 percent increase represents increment increases. The State is
under collection bargaining negotiations with approximately 75 percent of
the workforce and no across-the-board increases are assumed in FY 2012.
Approximately 8,900 employees received a contractual 3.5 percent
across-the-board increase effective July 2012. About 2,700 employees are
under interest arbitration proceedings.
No compensation package for employees
Table 18 continues on next page.
THE FISCAL SURVEY
OF
S TAT E S
•
FALL 2011
25
TABLE 18 (Continued)
State Employee Compensation Changes, Fiscal 2012
Region/State
Across-the-Board
(percent)
Merit
(percent)
Other
(percent)
New York
North Carolina
North Dakota
3.0
Ohio
0.0
0.0
0.0
Oklahoma
Oregon
0.5
0.0
3.6
Pennsylvania
Rhode Island
3.0
0.0
0.0
South Carolina
South Dakota
Tennessee
Texas
Utah
Vermont
Notes
The State's most recent labor contracts with most of the State employee
labor unions expired at the end of FY 2011. Under existing law, unionized
employees automatically receive any performance advances and longevity
payments that they are eligible for (i.e., employees who have not reached
the job rate) at their existing salary levels. Approximately 33 percent of the
workforce is eligible to receive such increases. Pending wage and benefit
agreements being negotiated with labor unions at the time the FY 2012
Budget was enacted, Management/Confidential (M/C) employees were
administratively delayed their performance advancements and longevity
increases at the beginning of FY 2012. The FY 2012 Enacted Budget
Financial Plan included $1.5 billion in savings from State agency operations,
including $450 million in gap-closing savings from, among other things,
wage and benefit changes negotiated with State employee unions. In
August 2011, members of the State's largest union ratified a five-year labor
contract with the State. Under the five-year agreement, there will be no
general salary increases in fiscal year 2012. In addition, employees will
take a five-day unpaid deficit reduction leave during fiscal year 2012. The
State's second largest union is scheduled to vote on a contract with
comparable terms in late September 2011.
0.0
Salary increases are to be given on the basis of merit and equity and are
not to be given across-the-board.
The current collective bargaining agreement contained no increases of
any kind for state employees for the period of FY 2010-2012. However, in
FY 2012 ten cost savings days (unpaid days off) are restored, step
increases begin again, and 32 hour personal leave payout eligibility returns
for employees.
Fiscal year percentages displayed are of "Total Compensation", not just
salaries & wages. Prior year reports were for salaries & wages only.
"Across-the-board" is a 1.5 percent COLA on wages in December 2011.
"Other" includes increased costs to maintain retirement benefits of
3.67 percent of total compensation (not reported in previous surveys)
plus assumes 5 percent annual inflation in flexible benefits such as health
and life insurances. Package also includes offsets to these increases:
5 to 7 furlough days per employee and employees beginning to pay
5 percent of insurance premiums starting in December 2011.
Additional 1.45 percent COLA increase scheduled for December 2012.
Total 2011-13 biennium compensation package increase is 6 percent.
There is a pay freeze for the majority of state employees in FY 2012.
Step increases are automatic based on the date of hire for a period of
2 1/2 years. Longevity pay increases have ended for non-union employees
in FY 2012 and will end for union employees in FY 2013.
No pay raises.
1.6
Virginia
5.0
No step increases. Effective 7/1/11, employees received 3 percent cut,
then frozen for 2 years.
The 5.0 percent salary increase was offset by the increase in the
employee's contribution to the Virginia Retirement System.
Table 18 continues on next page.
26
N AT I O N A L G O V E R N O R S A S S O C I AT I O N
•
N AT I O N A L A S S O C I AT I O N
OF
S TAT E B U D G E T O F F I C E R S
TABLE 18 (Continued)
State Employee Compensation Changes, Fiscal 2012
Region/State
Washington
West Virginia
Wisconsin
Wyoming
Territories
Puerto Rico
Across-the-Board
(percent)
-3.0
Merit
(percent)
Other
(percent)
Notes
Most employees took a 3 percent pay cut, but in exchange are given
5.2 hours/month exchange time, to be used as paid time off.
2 percent for Public Employees (min. $504/Max $1200), except Troopers
got $970 and DNR Police Officers $835, additional $5,004 ATB for
MHS&T inspectors/instructors, $1,488 for Teachers ATB 2 percent
(min $500) for Service Personnel ATB, Adjutant General increase from
$92,500 to $125,000, Cabinet Level Veterans Assistance established
@ $70,000 (increase each year by $5k to $95k), Judicial Increases:
Justices (5) $121,000 to $136,000 = $15,000 increase
Circuit (70) $116,000 to $126,000 = $10,000 increase
Family (45) $82,500 to $94,500 = $12,000 increase
Magistrate (42 <8400) $43,625 to 51,125 = $7,500 increase
Magistrate (116) $50,000 to $57,500 = $7,500 increase
Employees to pay 5.8 percent of salary towards pension and 12.6 percent
of health insurance premium (up from 6 percent of premium).
Each agency must evaluate their fiscal ability to offer salary increases to
the employees. No across the board salary increases are included in
FY 2012 adopted budget.
THE FISCAL SURVEY
OF
S TAT E S
•
FALL 2011
27
Medicaid Outlook: Medicaid Spending,
Enrollment, Cost Containment Proposals,
and the Affordable Care Act
grams. Beginning in January 1, 2014, state Medicaid programs
will be expanded to cover non-pregnant, non-elderly individuals
with income up to 133 percent of the federal poverty level. The
Medicaid is a means-tested entitlement program financed by
the states and the federal government that provides comprehensive and long-term medical care for more than 60 million
low-income individuals. Medicaid is estimated to account for
about 23.6 percent of total spending in fiscal 2011, the single
cost for those newly eligible for coverage will be fully federally
funded in calendar years 2014, 2015, and 2016 with federal financing phasing down to 90 percent by 2020. States are required to apply a 5 percent income disregard when determining
Medicaid eligibility, effectively bringing the new Medicaid minimum eligibility level to 138 percent of the federal poverty level.
largest portion of total state spending.
Medicaid spending for fiscal 2011 is estimated at $398.6 billion,
an increase of 10.1 percent over fiscal 2010 according to
NASBO’s 2010 State Expenditure Report. State funds increased by an estimated 16 percent while federal funds in-
There are many challenges ahead as states move forward with
implementation of the Affordable Care Act. Some of the most
significant challenges include upgrading current Medicaid eligibility systems, accommodating the significant number of new
enrollees under Medicaid, setting up health insurance ex-
creased by 6.9 percent over fiscal 2010 amounts.
changes, and dealing with the lack of administrative resources
Medicaid enrollment increased by 7.2 percent during fiscal
and staff at the state level to carry out the implementation.
2010, by 5.5 percent in fiscal 2011 and is estimated to increase
Other challenges include the aggressive timeline for implemen-
an additional 4.1 percent in fiscal 2012. This would represent a
tation and how controlling growth in the program is difficult
17.7 percent increase in Medicaid enrollment over this three
under maintenance-of-effort requirements.
year period. Although Medicaid enrollment is decelerating for
now, the implementation of the Affordable Care Act will greatly
increase the individuals served in the Medicaid program in 2014
and thereafter. During the last economic downturn, enrollment
States are planning to make changes in the payment and delivery aspects of their health care systems to control costs, improve outcomes, and to position themselves for the significant
number of new Medicaid enrollees resulting from the Affordable
growth peaked at 9.5 percent in fiscal 2002.
Care Act. The type of changes underway and on the planning
Cost containment in Medicaid is a dominant theme. Nearly
horizon include expanding managed care and coordinated care
every state implemented at least one new Medicaid policy to
options, using health homes for those with chronic conditions,
address costs in fiscal 2011 according to the Kaiser Commis-
pursuing dual eligible initiatives to provide managed care serv-
sion on Medicaid and the Uninsured’s 2011 annual survey on
ices for those eligible for both Medicare and Medicaid.
Medicaid and state budgets. As in previous years, provider rate
restrictions were the most commonly reported cost containment strategy. Based on the Kaiser Commission survey, 39
states restricted provider rates in fiscal 2011 and 46 states plan
to do so in fiscal 2012. States continued to eliminate, restrict
or reduce Medicaid benefits in areas such as dental, therapies,
medical supplies, durable medical equipment and personal
care services. States also made substantial changes in Medicaid pharmacy programs and introduced higher co-payments
Medicaid spending, similar to health care spending is projected
to increase faster than the economy as a whole. The release of
the 2010 Actuarial Report on the Financial Outlook for Medicaid
by the Centers for Medicare & Medicaid Services (CMS) Office
of the Actuary in December 2010 underscores the challenges
ahead. As stated in the report, Medicaid costs will almost certainly continue to increase as a share of gross domestic product
(GDP) in the future and will be a serious strain on states’ budgets. Medicaid is projected to increase at an average annual in-
for beneficiaries.
crease of 8.3 percent over the next 10 years according to the
The Affordable Care Act, enacted in March 2010, has a signif-
CMS Office of the Actuary.
icant impact on states and especially on state Medicaid pro-
28
N AT I O N A L G O V E R N O R S A S S O C I AT I O N
•
N AT I O N A L A S S O C I AT I O N
OF
S TAT E B U D G E T O F F I C E R S
Temporary Assistance for Needy
Families Program
The Temporary Assistance for Needy Families (TANF) program
was reauthorized under the Deficit Reduction Act in February
2006. The TANF block grant is funded at $16.6 billion each year
and is currently authorized under a continuing resolution.
This report has information only on the changes in the cash assistance benefit levels within the program which represents approximately 41 percent of total program costs. For fiscal 2012,
forty-six states maintain the same cash assistance benefit levels
that were in effect in fiscal 2011. Three states decrease cash
assistance benefit levels, ranging from 1.8 to 8 percent, while
one state increased cash assistance benefit levels by 4.1 per-
The program includes specific definitions of work, work verifi-
cent. (see Table 19 and Notes to Table 19)
cation requirements, and penalties if states do not meet the requirements. As a result of these changes, most states have to
significantly increase work participation rates.
Since welfare reform was initially passed in 1996, states have
focused on providing supportive services for families to achieve
self-sufficiency rather than cash assistance. Since 1996, caseloads have declined significantly. The average monthly number
Table 19
Enacted Cost-of-Living Changes for
Cash Assistance Benefit Levels Under the
Temporary Assistance For Needy Families
Block Grant, Fiscal 2012
of recipients fell from 12.8 million prior to the enactment of
TANF to 4.4 million on average in 2011, a decrease of over twothirds.
Original
Fiscal 2011
State/Territory
Arizona*
California
Florida
Michigan*
Nebraska*
Nevada
Wisconsin*
-8.0%
4.1%
-1.8%
-2.9%
NOTE: See Notes to Table 19.
SOURCE: National Association of State Budget Officers.
THE FISCAL SURVEY
OF
S TAT E S
•
FALL 2011
29
Chapter 1 Notes
Notes to Table 3
Fiscal 2010 State General Fund, Actual
For all states, unless otherwise noted, transfers into budget stabilization funds are counted as expenditures, and transfers from budget
stabilization funds are counted as revenues.
Alabama
Revenue Adjustments include an increase for a transfer from the General Fund Rainy Day Account of $161.6 million. Expenditure
adjustments include a reduction due to across the board percentage cuts of $695.8 million, and a reduction of $81.9 million for
reversions and other adjustments.
Alaska
Revenue adjustments: $17.8 million reappropriation and carry forward. Expenditure adjustments: $401.6 million Constitutional
Budget Reserve savings deposit plus net of ($1,057.4) million Public Education Fund draw and $1,117.0 Public Education Fund
forward funding. Rainy Day = $9,166.1 million CBR + $1,197.5 million SBR.
Arizona
Adjustments to revenue include fund transfers, county transfer, proceeds from asset sales lease back and lottery revenue bonds.
California
Represents adjustments to the Beginning Fund Balance.
Colorado
Colorado's ending reserve statutory requirement per Section 24-75-201.1, CRS is the rainy day fund balance.
Georgia
Agency surplus returned.
Idaho
In order to help balance the FY 2010 budget there was $71 million transferred from various dedicated funds to the General
Fund. The Legislature also approved a General Fund reduction of $187.6 million that was distributed among all General Fund
agencies.
Illinois
Revenue adjustment accounted for by the sum of transfers in plus pension obligation note proceeds. Expenditure adjustment
is accounted for by the sum of the statutory transfers out plus repayment of the pension obligation notes.
Indiana
Revenue Adjustment: Transfer from Rainy Day Fund to General Fund; Expenditure Adjustments: Local Option Income Tax Distributions; PTRF Adjust for Abstracts.
Iowa
Expenditure adjustments include $48.3 million which was credited from the ending balance of the General Fund to the Senior
Living Trust Fund. This completes all funding of the Senior Living Trust Fund.
Kentucky
Revenue includes $105.5 million in Tobacco Settlement funds. Adjustment for Revenues includes $66.2 million that represents
appropriation balances carried over from the prior fiscal year, and $167.4 million from fund transfers into the General Fund. Adjustment to Expenditures represents appropriation balances forwarded to the next fiscal year.
Louisiana
Actuals—(FY 09-10) reflect the Legislative Auditors reviewed revenues and expenditures made per the fiscal status summary
presented to the Joint Legislative Committee on the Budget (JLCB) on January 21, 2011, as required by Louisiana Revised
Statue 39:75 A.(3)(a). Revenue—State General Fund (SGF) revenues estimated to be $7,173.7 million; Act 122 of 2009 allowed
the use of $86.2 million of Budget Stabilization Fund (BSF); Act 51 of 2010 used $198.4 million of BSF; Act 20 used $782.3
million of the Fiscal Year 2007-2008 surplus; Act 633 of 2010 transferred $83.4 million from various funds to the SGF; Act 226
of 2009 transferred $13.5 million from the Rapid Response Fund, $75.6 million from the Insure Louisiana Program Fund, and
$3.9 million from the Incentive Fund to the SGF; $42.8 million was carried forward from prior years SGF appropriations to FY
10-11; and Act 51 of 2010 appropriated $115 million from the Amnesty Fund.
Maine
Revenue and Expenditure adjustments reflect Legislatively authorized transfers.
Maryland
Revenue adjustments reflect a $13.0 million reimbursement from the reserve for Sustainable Community Tax Credits, $6.0 million
reimbursement from the reserve for Biotechnology Tax Credits, and transfers of $775.6 million from other special funds.
Massachusetts
Includes Budgeted Fund balances.
Michigan
Fiscal 2010 revenue adjustments include the impact of federal and state law changes ($279.3 million); revenue sharing law
changes ($528.4 million); and deposits from state restricted revenues ($401.6 million).
30
N AT I O N A L G O V E R N O R S A S S O C I AT I O N
•
N AT I O N A L A S S O C I AT I O N
OF
S TAT E B U D G E T O F F I C E R S
Minnesota
Ending balance includes cash flow account of $266 million and appropriations carried forward of $106.7 million.
Mississippi
Adjustments (Expenditures) represent net transfers resulting from budget cuts. General Fund Ending Balance and Rainy Day
Fund are before splits. Rainy Day Fund Balance not inclusive of $15 million for Ayers court settlement.
Missouri
Revenue adjustments include transfers from other funds into the general revenue fund, including $370.7 million from enhanced
FMAP authorized in the American Recovery and Reinvestment Act of 2009.
Montana
Adjustments to Revenues and Expenditures reflect prior year revenue collected, prior year expenditures made, and other minor
adjustments to tie to the CAFR.
Nebraska
Revenue adjustments are transfers between the General Fund and other funds. Among others, this includes a $112 million transfer from the General Fund to the Property Tax Credit Cash Fund as well as a $105 million transfer to the General Fund from the
Cash Reserve Fund (Rainy Day Fund).
Nevada
FY 2010 revenue adjustments included fund sweeps and capital improvement reversions. FY 2010 expenditure adjustments include appropriations transferred between years and reductions to operating appropriations ($252.5 million) approved by the
26th special session during FY 2010.
New Hampshire
Revenue Adjustments: +25 million payment from the University System/ Expenditure Adjustments +36.6 million transfer in from
the Education Trust fund/ +6.5 million transfers in from both the Highway and Liquor funds.
New Jersey
Transfers from other funds and budget vs. GAAP adjustments.
New York
Total expenditures are not adjusted for the impact of delaying the end-of-year school aid payment ($2.06 billion) from March
2010 to the statutory deadline of June 1, 2010, which was done to carry forward the FY 2010 budget shortfall into FY 2011.
The ending balance includes $1.2 billion in rainy day reserve funds, $96 million in a community projects fund, $73 million reserved
for debt reduction and $21 million reserved for litigation risks. The ending balance also includes a reserve of $905 million for deferred payments, a result of deferring more payments than were needed to carry forward the FY 2010 budget shortfall, which
was used when the deferred payments were made during the first quarter of FY 2011.
North Dakota
Revenue adjustments are a $295.0 million transfer from the permanent oil tax trust fund to the general fund.
Oklahoma
Revenue adjustment represents the difference in cash flow. $1.6 million expenditure adjustment is amount paid in interest on
funds borrowed for cash management until actions was taken by the legislature on budget shortfall.
Oregon
Rainy Day Fund balance includes normal RDF (primarily General Fund) plus an Education Stability Fund (primarily Lottery Funds).
Balances in RDF & ESF may include donations.
Pennsylvania
Revenues include $755 million transferred from the Rainy Day fund. Revenue adjustments include a $5.0 million adjustment to
the beginning balance, $150.4 million in prior year lapses, $1,776.7 million in Enhanced Federal Medical Assistance Percentage
and $921.4 million in State Fiscal Stabilization Funds.
Puerto Rico
The General Fund Budget included an allocation of $1.0 million to facilitate the orderly implementation of certain expense reduction measures adopted by the Government of Puerto Rico pursuant to Act 7 of March 8, 2009. This allocation covered the cost
of transitioning public employees to non-government sectors by proving re-training vouchers, self employment opportunities,
relocation and salary subsidies alternatives. On the other hand, the General Fund Budget also included an allocation from the
Local Stabilization Fund of $1.5 billion to cover payroll and operating expenses that were expected to be reduced through fiscal
year 2010, but whose savings will not be realized in such fiscal year. The Local Stabilization Fund is funded with proceeds from
the bonds issued by the Sales Tax Financing Corporation.
Rhode Island
Opening balance includes a deficit of $62.3 million and re-appropriations of $1.0 million from the prior year. Adjustments to revenues reflect a transfer to the Budget Stabilization Fund.
South Dakota
Adjustments in Revenues: $21.8 million was from one-time receipts.
THE FISCAL SURVEY
OF
S TAT E S
•
FALL 2011
31
Tennessee
Adjustments (Revenues): 109.0 million transfer from debt service fund unexpended appropriations; $103.4 million transfer from
Rainy Day Fund; -$17.3 million transfer to dedicated revenue reserves. Adjustments (Expenditures): $69.9 million transfer to
capital outlay projects fund. $13.1 million transfer to state office buildings and support facilities fund; $230.8 million transfer to
reserves for dedicated revenue appropriations. Ending Balance: $239.4 million reserve for appropriations 2010-2011; $0.3 million
undesignated balance.
Utah
Includes transfers from previous year balance, to/from Rainy Day Fund, and special revenue funds.
Washington
Fund transfers between General Fund and other accounts, and balancing to the final audited ending balance.
West Virginia
Fiscal Year 2010 Beginning balance includes $432.6 million in Reappropriations, Unappropriated Surplus Balance of $22.2
million, and FY 2009 13th month expenditures of $26.0 million. Expenditures include Regular, Surplus and Reappropriated funds
and $26.0 million of 31 day prior year expenditures. Revenue adjustments are prior year redeposits. Expenditure adjustment
represents the amount transferred to the Rainy Day Fund. The ending balance is mostly the historically carried forward reappropriation amounts that will remain and be reappropriated to the next fiscal year, the 13th month expenditures & unappropriated
surplus balance.
Wisconsin
Revenue adjustments include Transfers In General Fund, $418.8 million; Other Revenue, $297.7 million; Tribal Gaming, $25.1
million. Expenditure adjustments include Designation for Continuing Balances, $78.5 million; and Unreserved Designated Balance,
-$10.6 million.
Wyoming
WY budgets on a biennial basis. To arrive at annual figures assumptions and estimates were required.
Notes to Table 4
Fiscal 2011 State General Fund, Preliminary Actual
For all states, unless otherwise noted, transfers into budget stabilization funds are counted as expenditures, and transfers from budget
stabilization funds are counted as revenues.
Alabama
Expenditure Adjustments are a reduction due to across the board percentage cuts.
Alaska
Revenue adjustments: $21.4 million reappropriation and carry forward. Expenditure adjustments: Net of ($1,114.3) million Public
Education Fund draw and $1,131.0 million Public Education Fund forward funding. Rainy Day = $10,016.8 million CBR +
$1,048.6 million SBR.
Arizona
Adjustments to revenue include fund transfers, VLT shift, county transfer, and temporary 1 percent sales tax increase.
California
Represents adjustments to the Beginning Fund Balance.
Colorado
Colorado's ending reserve statutory requirement per Section 24-75-201.1, CRS is the rainy day fund balance. Note that FY
2010-2011 contains a $294.4 million transfer (per the June 2011 OSPB forecast) from the GF to the State Education Fund
($226.9 million) and Public School Fund ($67.5 million) per SB11-230 (source: footnote E and F to Table 1 on page 7 in the
OSPB September 2011 forecast).
Georgia
Agency surplus returned.
Idaho
The remainder of the rainy day fund balances were transferred to the General Fund for FY 2011, this included $30.1 million from
the Budget Stabilization Fund and $48.8 million from the Economic Recovery Reserve Fund. There was an additional $1.5 million
transferred to the General Fund from various other dedicated accounts and $1 million was transferred to the Disaster Recovery
Fund/Military Division.
32
N AT I O N A L G O V E R N O R S A S S O C I AT I O N
•
N AT I O N A L A S S O C I AT I O N
OF
S TAT E B U D G E T O F F I C E R S
Illinois
Revenue adjustment accounted for by the sum of inter-fund borrowing, short term borrowing, pension obligation note proceeds,
tobacco securitization proceeds and statutory transfers in. Expense adjustment is accounted for by the sum of repayment of
our short term borrowing, FY 2011 pension payment and statutory transfers out.
Indiana
Revenue Adjustment: Transfer from General Fund to Rainy Day Fund; Expenditure Adjustments: Local Option Income Tax Distributions, PTRF Adjust for Abstracts.
Iowa
Revenues are based upon the March 2011 REC, adjustments to revenues include $15.4 million increase due to the passage of
the Tax Relief Act of 2010, and also due to tax legislation passed during the 2011 Legislative Session. Adjustments to expenditures are due to legislative changes passed during the 2011 Legislative Session that changed appropriation levels.
Kentucky
Revenue includes $99.8 million in Tobacco Settlement funds. Adjustment for Revenues includes $72.0 million that represents
appropriation balances carried over from the prior fiscal year, and $125.1 million from fund transfers into the General Fund. Adjustment to Expenditures represents appropriation balances forwarded and to the next fiscal year and budgeted balances to be
expended in the next fiscal year.
Louisiana
Data included in Table 4 is based on response to Spring 2011 Fiscal Survey of States. Actual State General Fund collections
were less than official projections adopted by REC on June 21, 2010. Per R.S. 39:75, the Fiscal Year 2009-2010 projected
deficit was presented to JLCB on October 22, 2010. Also in accordance with R.S. 39:75, the certified deficit for Fiscal Year
2009-2010 was recognized by JLCB on January 21, 2011, as being $107,977,368. Pursuant to R.S. 39:75, the Governor issued
an Executive Order calling for an adjustment to appropriated SGF expenditures in Fiscal Year 2010-2011.
Maine
Revenue and Expenditure adjustments reflect Legislatively authorized transfers. Beginning balance differs from FY 10 ending
balance due to Controller's year end adjustments.
Maryland
Revenue adjustments reflect a $5.2 million reimbursement from the reserve for Sustainable Community Tax Credits, $8.0 million
reimbursement from the reserve for Biotechnology Tax Credits, and transfers of $333.9 million from other special funds.
Massachusetts
Includes Budgeted Fund balances.
Michigan
Fiscal 2011 revenue adjustments include the impact of federal and state law changes ($275.8 million); revenue sharing law
changes ($514.9 million); and deposits from state restricted revenues ($664.3 million).
Minnesota
Ending balance includes cash flow account of $266 million.
Mississippi
General Fund Ending Balance and Rainy Day Fund are before splits. Rainy Day Fund Balance not inclusive of $15 million for
Ayers court settlement.
Missouri
Revenue adjustments include transfers from other funds into the general revenue fund, including $572.4 million from enhanced
FMAP authorized in the American Recovery and Reinvestment Act of 2009
Montana
Adjustments to Revenues and Expenditures reflect prior year revenue collected, prior year expenditures made, and other minor
adjustments to tie to the preliminary unaudited ending fund balance for FY 2011.
Nebraska
Revenue adjustments are transfers between the General Fund and other funds. Among others, this includes a $112 million transfer from the General Fund to the Property Tax Credit Cash Fund as well as a $154 million transfer to the General Fund from the
Cash Reserve Fund (Rainy Day Fund).
Nevada
Adjustments include fund sweeps and reduction of legislatively approved appropriations approved by the 26th special session.
New Hampshire
Revenue adjustments: +1.5 million community college system payment/ Expenditure Adjustments +124.7 million transfer to the
Education trust fund.
New Jersey
Balances targeted to be lapsed.
THE FISCAL SURVEY
OF
S TAT E S
•
FALL 2011
33
New York
Total expenditures are not adjusted for the impact of delaying the end-of-year school aid payment ($2.06 billion) from March
2010 to the statutory deadline of June 1, 2010, which was done to carry forward the FY 2010 budget shortfall into FY 2011.
The ending balance includes $1.2 billion in rainy day reserve funds, $136 million in a community projects fund, $13 million
reserved for debt reduction and $21 million reserved for litigation risks.
North Dakota
Revenue adjustments are an $830.0 million transfer from the permanent oil tax trust fund and a $35.0 million transfer from the
lands and minerals trust fund to the general fund. Expenditure adjustments include a $61.4 million transfer to the budget stabilization fund and miscellaneous adjustments and transfers.
Oklahoma
Revenue adjustment represents the difference in cash flow. $249.2 million expenditure adjustment is amount deposited into the
Rainy Day fund from surplus revenues.
Pennsylvania
Revenue adjustments include a $0.25 million adjustment to the beginning balance, $93.7 million in prior year lapses, $1,756.5
million in Enhanced Federal Medical Assistance Percentage, $921.4 million in federal State Fiscal Stabilization Funds and $387.8
million in federal Education Jobs Funds. Expenditure adjustment reflects $181.5 million in current year lapses. The year-end
transfer to the Rainy Day Fund (25 percent of the ending balance) was suspended for FY 2011.
Puerto Rico
Included $1.0 billion from the Local Stabilization Fund to cover operational expenses expected to be reduced through the fiscal
year 2011.
Rhode Island
Opening balance includes a surplus of $17.7 million, re-appropriations of $3.4 million from the prior year, and prior period adjustments. Adjustments to revenues reflect a transfer to the Budget Stabilization Fund and the adjustments to expenditures are
the appropriations from FY 2010.
South Dakota
Adjustments in Revenues: $9.9 million addition to revenue is from one-time receipts; $26.1 million decrease to revenue is a onetime refund of taxes.
Tennessee
Adjustments (Revenues): 92.9 million transfer from debt service fund unexpended appropriations; $181.4 million transfer from
TennCare Reserve; -$28.1 million transfer to TennCare Trust Fund; $169.5 million transfer from Rainy Day Fund; $15.0 million
transfer from reserves for dedicated revenue appropriations. Adjustments (Expenditures): $291.7 million transfer to capital outlay
projects fund; $13.1 million transfer to state office buildings and support facilities fund; $4.7 million transfer to reserves for dedicated revenue appropriations. Ending Balance $371.3 million reserve for appropriations 20110-2012; $0.2million undesignated
balance.
Utah
Includes transfers from previous year balance, to/from Rainy Day Fund, and special revenue funds.
Vermont
Transfer to Human Services Caseload Reserve and other transactions.
Washington
Fund transfers between General Fund and other accounts.
West Virginia
Fiscal Year 2011 Beginning balance includes $418.7 million in Reappropriations, Unappropriated Surplus Balance of $102.6
million, and FY 2010 13th month expenditures of $30.6 million. Expenditures include Regular, Surplus and Reappropriated funds
and $30.6 million of 31 day prior year expenditures. Revenue adjustments are prior year redeposits. Expenditure adjustment
represents the amount transferred to the Rainy Day Fund. The ending balance is mostly the historically carried forward reappropriation amounts that will remain and be reappropriated to the next fiscal year, the 13th month expenditures & unappropriated
surplus balance.
Wisconsin
Revenue adjustments include Transfers out of General Fund, -$14.8 million; Other Revenue, $632.4 million; Tribal Gaming, $24.7
million. Expenditure adjustments include Designation for Continuing Balances, $8.2 million; and Unreserved Designated Balance,
-$78.5 million.
Wyoming
WY budgets on a biennial basis. To arrive at annual figures assumptions and estimates were required.
34
N AT I O N A L G O V E R N O R S A S S O C I AT I O N
•
N AT I O N A L A S S O C I AT I O N
OF
S TAT E B U D G E T O F F I C E R S
Notes to Table 5
Fiscal 2012 State General Fund, Appropriated
For all states, unless otherwise noted, transfers into budget stabilization funds are counted as expenditures, and transfers from budget
stabilization funds are counted as revenues.
Alabama
Revenue Adjustments include one-time revenues of $293.1 million.
Alaska
Revenue adjustments: none. Expenditure adjustments: Net of ($1,127.3) million Public Education Fund draw and $1,094.0 million
Public Education Fund forward funding. Rainy Day = $10,589.0 million CBR + $1,392.4 million SBR.
Arizona
Adjustments to revenue include fund transfers, VLT shift, county transfer, temporary 1 percent sales tax increase, and revenue
from the tax recovery program. At the time FY12 budget was enacted, the beginning balance (i.e. FY 2011 ending balance)
was estimated to be -$332 million. Thanks to much stronger-than-expected revenue performance, FY 2011 ended with a
positive balance.
Colorado
Colorado's ending reserve statutory requirement per Section 24-75-201.1, CRS is the rainy day fund balance. Current forecast
shows FY 2011-2012 slightly below the required ending balance (GF reserve) of 4 percent (by $18.3 million GF). See Table 1 line
21 in the FY 11-12 column, of the September 2011 OSPB forecast.
Delaware
Represents DEFAC June 2011 revenue estimates as adjusted by enacted revenue changes plus internal expenditure estimates.
Idaho
Transfers for FY 2012 included $38 million from various dedicated funds; house concurrent resolution 25 gave the Governor the
authority to delay the implementation of the next phase of the Grocery Tax Credit ($15 million); and it was estimated that there
would be an additional $19.7 million in revenue from the Tax Compliance Initiative. The revenue estimate was also reduced by
$91.5 million to set the budgets for FY 2012.
Illinois
Revenue adjustment accounted for by statutory transfers in. Expenditure adjustment is accounted for by statutory transfers out.
Iowa
Revenues are based upon the March 2011 REC, adjustments to revenues include $119.3 million increase due to the passage
of the Tax Relief Act of 2010, and also to legislation adjusting revenues passed during the 2011 Legislative Session. Expenditures
are based upon appropriations passed during the 2011 Legislative Session.
Kentucky
Revenue includes $102.7 million in Tobacco Settlement funds. Adjustment for Revenues includes $29.8 million that represents
appropriation balances carried over from the prior fiscal year, and $122.7 million from fund transfers into the General Fund. Adjustment to Expenditures represents appropriation balances forwarded and to the next fiscal year and budgeted balances to be
expended in the next fiscal year.
Louisiana
The recommended Executive Budget for FY 2011-2012 reflects the Official Revenue Forecast from June 21, 2010, meeting of
the Revenue Estimating Conference for State General Fund.
Maine
Revenue and Expenditure adjustments reflect Legislatively authorized transfers.
Maryland
Revenue adjustments reflect a $13.3 million reimbursement from the reserve for Sustainable Community Tax Credits, $8.0 million
reimbursement from the reserve for Biotechnology Tax Credits, and transfers of $227.7 million from other special funds.
Michigan
Fiscal 2012 revenue adjustments include the impact of federal and state law changes (-$288.3 million); revenue sharing law
changes ($622.5 million); sale of properties ($6.5 million); and deposits from state restricted revenues ($558.8 million). Also, the
fiscal 2012 enacted expenditures include $427.4 million of one-time spending financed from one-time revenues.
Minnesota
Ending balance includes cash flow account of $95 million.
Missouri
Revenue adjustments include transfers from other funds into the general revenue fund, including $68 million from enhanced
FMAP authorized in the American Recovery and Reinvestment Act of 2009 and $209.3 million from enhanced FMAP authorized
in the Education Jobs and Medicaid Assistance Act.
Montana
Revenues and Expenditures reflect amounts enacted when budget was adopted by legislature in April, 2011.
THE FISCAL SURVEY
OF
S TAT E S
•
FALL 2011
35
Nebraska
Revenue adjustments are transfers between the General Fund and other funds. Among others, this includes a $110 million transfer from the General Fund to the Property Tax Credit Cash Fund as well as a $37 million transfer to the General Fund from the
Cash Reserve Fund (Rainy Day Fund). Revenue adjustments also include a $25 million transfer from the General Fund for the
University of Nebraska Innovation Campus to jump-start significant new investment in research infrastructure. Expenditure adjustments are reappropriations ($235.3 million) of the unexpended balance of appropriations from the prior fiscal year and a
small amount ($5 million) reserved for supplemental/deficit appropriations.
Nevada
FY 2012 revenue adjustments include accessing a line of credit from the Local Government Investment fund, treasurer's interest
earnings, and anticipated reversions.
New Hampshire
Expenditure Adjustments: +136.5 to be moved to the Education Trust Fund at year end. Enacted budget for FY 2012 assumed
a Rainy Day Fund Balance of .5 million to be carried over to FY 2012 from FY 2011, not the 9.3 million estimated at this time.
New York
The ending balance includes $1.3 billion in rainy day reserve funds, $346 million reserved to cover costs of potential retroactive
labor settlements with certain unions, $51 million in a community projects fund, $13 million reserved for debt reduction and $21
million reserved for litigation risks.
North Carolina
Repair and renovation.
North Dakota
Revenue adjustments include a $295.0 million transfer from the property tax relief sustainability fund and a $200.0 million transfer
from the strategic investment and improvements fund.
Ohio
FY 2012 expenditures include a $246.9 million transfer to the Budget Stabilization Fund. FY 2012 expenditures include estimated
encumbrances for the end of FY 2012.
Oregon
Revenue adjustment transfers prior biennium ending GF balance to Rainy Day Fund (which can be up to 1 percent of total
budgeted appropriation). Oregon budgets on a biennial basis. The constitution requires the state to be balanced at the end
of each biennium (June 30, 2013), so a negative balance at the end of the first fiscal year does not necessarily translate into
a budget gap.
Pennsylvania
Revenue adjustments include $62.7 million in prior year lapses. Expenditure adjustment reflects a transfer of $139.5 million (25
percent of ending balance) to the Rainy Day Fund.
Puerto Rico
Includes $610 million from the Local Stabilization Fund to cover operational expenses.
Rhode Island
Opening balance includes a surplus of $60.8 million and re-appropriations of $4.5 million from the prior year. Adjustments
to revenues reflect a transfer to the Budget Stabilization Fund and the adjustments to expenditures are the appropriations
from FY 2011.
South Dakota
Adjustments in Revenues: $1.0 million addition to revenue is from one-time receipts; $13.6 million decrease to revenue is a budgeted one-time refund of taxes.
Tennessee
Adjustments (Revenues): -$27.4 million transfer to Rainy Day Fund. Adjustments (Expenditures): $55.4 million transfer to capital
outlay projects fund; $13.1 million transfer to state office buildings and support facilities fund; $4.6 million transfer to reserves
for dedicated revenue appropriations. Ending Balance: $11.1 million reserve for capital outlay 2012-2013. $0.5 million undesignated balance.
Utah
Includes transfers from previous year balance and special revenue funds.
Vermont
Transfer from Human Services Caseload Reserve and other transactions.
Washington
Fund transfers between General Fund and other accounts.
West Virginia
Fiscal Year 2012 Beginning balance includes $425.6 million in Reappropriations, Unappropriated Surplus Balance of $338.8
million, and FY 2011 13th month expenditures of $28.6M. Revenues are FY 12's Official General Revenue Estimate. Expenditures
include FY 12 Regular General Revenue & FY 12 Surplus Appropriations.
36
N AT I O N A L G O V E R N O R S A S S O C I AT I O N
•
N AT I O N A L A S S O C I AT I O N
OF
S TAT E B U D G E T O F F I C E R S
Wisconsin
Revenue adjustments include Other Revenue, $647.9 million; Tribal Gaming, $26.5 million. Expenditure adjustments include
Compensation Reserve, $28.8 million; Transfers to other funds, $27.5 million; Other legislation, $65.0 million; and Lapses,
-$303.0 million.
Wyoming
WY budgets on a biennial basis. To arrive at annual figures assumptions and estimates were required.
Notes to Table 7
Mid Year Budget Cuts 2011 – 2012
Illinois
When calculating the difference between FY 2011 and FY 2012, it should be noted that in FY 2011 Pension Obligation Notes
paid for the General Revenue Funds pension liability. In FY 2012, the state appropriated sufficient GRF in order to fully meet the
annual pension obligation. For comparison, if the pension liability were to be recognized in FY 2011, there would have been an
overall GRF reduction of $571 million from FY 2011 to FY 2012.
Notes to Table 8
Mid Year Program Cuts – 2011
California
For K-12 education $52.7 million was set aside in 2010-11 for potential increased costs for childcare programs. These costs
failed to materialize. For transportation, this change is not a cut, but rather a shift of expenditures from the General Fund to a
special fund for debt service costs.
Georgia
Overall budgetary changes led to increase in budget.
Missouri
Expenditure restrictions effective July 1, 2010, while $17.5 million expenditure restrictions released in K-12 Ed in Jan/Feb 2011.
Additionally, Missouri Public Assistance cuts were done through ARRA funding in place of the GR cut.
Nevada
Nevada has a biennial budget and thus some changes to FY 2011 were made during FY 2010 special session. Note that the
net cuts were smaller than the gross cuts, because higher education and corrections received more money. Gross cuts are
displayed in survey.
Rhode Island
Overall the state added $32.1 million in general funds for FY 2011 to restore funding related to Medicaid FMAP match change;
however, some departments' budgets were cut.
Vermont
There were only technical appropriation changes in the FY 2011 Budget Adjustment Act. Net effect was increase of $5.9 million
with increases offsetting decreases.
Virginia
Any adjustments to FY 2011 and FY 2012 were addressed during the regular session.
Notes to Table 9
Mid Year Program Cuts by Value – 2011
Georgia
Overall budgetary changes led to increase in budget.
Rhode Island
Overall the state added $32.1 million in general funds for FY 2011 to restore funding related to Medicaid FMAP match change;
however, some departments' budgets were cut.
THE FISCAL SURVEY
OF
S TAT E S
•
FALL 2011
37
Notes to Table 12
Enacted Program Cuts – 2012
Colorado
Medicaid changes include CHP+/all of HCPF. Other includes non-appropriated GF.
Connecticut
Transportation is non-General Fund. All other changes include bottom-line reduction of $700 million related to collective bargaining
that the Governor is required to achieve.
Massachusetts
Data is based on response to Spring 2011 Fiscal Survey
Michigan
Budget adjustments for K-12 education are included in the restricted School Aid Fund, separate from the general fund. Therefore
this survey does not reflect School Aid decreases of $525.8 million. Additionally, fiscal 2012 enacted budget adjustments do not
include shifts between general fund and restricted revenue sources of funding. Enacted general fund increases include nearly
$900 million in general fund revenues to replace one-time federal revenues not available for fiscal 2012.
Mississippi
All amounts are General Fund only, and no general fund equivalents are included.
Montana
The 2011 enacted budget for K-12 was adjusted to normalize for the Otter Creek bonus payment received in FY 2010. This
payment reduced the general fund obligation in FY 2010 and then effectively increased the appropriation in FY 2011 due to the
biennial nature of the appropriation for K-12. The reduction in the “All Other” category between FY 2011 and FY 2012 is largely
attributable to the continuation of Governor’s reductions per 17-7-140, MCA made in FY 2011, other reductions approved by
the legislature, and the discontinuation of some one-time-only funded items (attributable to ARRA) in FY 2012.
New York
Not reflected in the estimates used to calculate year-to-year spending changes is the deferral of the end-of-year school aid payment ($2.06 billion) from March 2010 to the statutory deadline of June 1, 2010, which was done to carry-forward the FY 2010
budget shortfall into FY 2011, and the phasing-out of extraordinary Federal aid from the American Recovery and Reinvestment
Act (ARRA), which will shift approximately $5 billion in Medicaid and Education costs back to the General Fund in FY 2012.
Pennsylvania
The Fiscal 2011 Budget amounts used to calculate the Appropriation Changes in the Enacted Fiscal 2012 Budget include Federal
ARRA funds appropriated from the Enhanced Medical Assistance Percentage, State Fiscal Stabilization Fund and Education
Jobs Fund.
Puerto Rico
All other includes Police, Municipalities, Electoral Activities, Health, & Justice.
Rhode Island
Medicaid and Public Assistance adjustments incorporates year-over-year caseload and FMAP fluctuations, as well as programmatic modifications.
Wisconsin
Legislative Fiscal Bureau Comparative Summary of 2011 Wisconsin Act 32, General Fund Taxes section, August 2011.
Notes to Table 13
Enacted Program Cuts by Value – 2012
Arizona
FY 2012 General Fund appropriations level is similar to FY11 level. However, it's not true to say that there's no spending cut in
FY 2012. Due to the expiration of one-time federal assistance and funding formula increases, FY12 would have an estimated
shortfall of $1.1 billion, this increase is offset by enacted spending reductions.
Colorado
Medicaid changes include CHP+/all of HCPF. Other includes non-appropriated GF.
Massachusetts
Data is based on response to Spring 2011 Fiscal Survey
38
N AT I O N A L G O V E R N O R S A S S O C I AT I O N
•
N AT I O N A L A S S O C I AT I O N
OF
S TAT E B U D G E T O F F I C E R S
Michigan
Budget adjustments for K-12 education are included in the restricted School Aid Fund, separate from the general fund. Therefore
this survey does not reflect School Aid decreases of $525.8 million. Additionally, fiscal 2012 enacted budget adjustments do not
include shifts between general fund and restricted revenue sources of funding. Enacted general fund increases include nearly
$900 million in general fund revenues to replace one-time federal revenues not available for fiscal 2012.
Mississippi
All amounts are General Fund only, and no general fund equivalents are included.
Montana
The 2011 enacted budget for K-12 was adjusted to normalize for the Otter Creek bonus payment received in FY 2010. This
payment reduced the general fund obligation in FY 2010 and then effectively increased the appropriation in FY 2011 due to the
biennial nature of the appropriation for K-12. The reduction in the “All Other” category between FY 2011 and FY 2012 is largely
attributable to the continuation of Governor’s reductions per 17-7-140, MCA made in FY 2011, other reductions approved by
the legislature, and the discontinuation of some one-time-only funded items (attributable to ARRA) in FY 2012.
New York
Not reflected in the estimates used to calculate year-to-year spending changes is the deferral of the end-of-year school aid payment ($2.06 billion) from March 2010 to the statutory deadline of June 1, 2010, which was done to carry-forward the FY 2010
budget shortfall into FY 2011, and the phasing-out of extraordinary Federal aid from the American Recovery and Reinvestment
Act (ARRA), which will shift approximately $5 billion in Medicaid and Education costs back to the General Fund in FY 2012.
Pennsylvania
The Fiscal 2011 Budget amounts used to calculate the Appropriation Changes in the Enacted Fiscal 2012 Budget include Federal
ARRA funds appropriated from the Enhanced Medical Assistance Percentage, State Fiscal Stabilization Fund and Education
Jobs Fund.
Puerto Rico
All other includes Police, Municipalities, Electoral Activities, Health, and Justice.
Rhode Island
Medicaid and Public Assistance adjustments incorporates year-over-year caseload and FMAP fluctuations, as well as programmatic modifications.
Wisconsin
Legislative Fiscal Bureau Comparative Summary of 2011 Wisconsin Act 32, General Fund Taxes section, August 2011.
Notes to Table 14
Budget Gap Strategies for FY 2011
Arizona
Other actions include temporary revenue increase, fund transfer.
California
For K-12 Education, both the 2010-11 budget included deferrals of general purpose funding for local education agencies and
targeted cuts primarily in child care and development. The 2010-11 budget also included deferrals of general purpose funding
for community college districts. Other actions include suspended Mandates, fund shift.
Colorado
Other actions include GF transfers and revenue augmentation, refinancing/other.
Connecticut
Other actions include travel ban, rescissions, hiring freeze, transfers from other funds.
Georgia
Minimum furloughs at agency level with a maximum of six days.
Hawaii
Other actions include transfer of excess balances from non-general funds.
Idaho
Other actions include transfers from other funds.
Maine
Other actions include hiring freeze, transfers in from other funds, rebidding of liquor contract.
Maryland
Other actions include fund balance transfers from special funds and public higher education institutions to the general fund.
THE FISCAL SURVEY
OF
S TAT E S
•
FALL 2011
39
New Mexico
User Fees include an increase in cigarette tax, gross receipts and compensating taxes. Cuts to State Employee Benefits include
Shift in employer pension costs of 1.75 percent to employees. Other actions include Transfer of unobligated balances in state
agency accounts to the General Fund.
New York
Early Retirement: The FY 2011 Enacted Budget included workforce savings of $250 million, expected to be achieved in part
through an optional time-limited early retirement incentive offered to employees that met certain age and service requirements,
which was subject to DOB-approved agency plans. Reduce Local Aid: The FY 2011 Enacted Budget included, in addition to
specifically allocated local assistance reductions, an FMAP Contingency Plan requiring a mid-year local assistance reduction,
uniformly allocated across all State funded local assistance appropriations (excluding constitutional exemptions), in order to
close the difference between the assumed value of the FMAP extension at the time the Budget was enacted, and the actual
benefit received upon passage by the Federal government. Other: The State benefitted from a six-month FMAP extension authorized by Congress and signed into law by the President in August 2010; additional revenue actions which included modifications to personal income taxes and a reduced dormancy period for abandoned property; the option to amortize pension
contribution costs in excess of the amortization threshold, to be paid over a ten-year period at an interest rate to be determined
by the State Comptroller; audit and overpayment recoveries; additional sweeps to available fund balances.
Pennsylvania
Other actions include $2.7 billion in Federal ARRA funds, $387.8 million in Federal Education Jobs funds and various one-time
revenues.
Puerto Rico
Other actions include alcohol, cigarettes, and temporary excise taxes.
Rhode Island
Salary reductions include four pay reduction days and a six month delay of the 3 percent cost of living increase achieved through
labor negotiations. Across the board actions include a 0.5 percent reduction was taken in personnel funding and operating expenditures. These reductions were taken in the budgets of all cabinet-level agencies, as well as, elected officials, the Judiciary
and Legislature. Local aid reductions include education Aid was cut by $28.0 million from the FY 2011 enacted budget.
South Dakota
Other actions include use of the state fiscal stabilization fund Ed Jobs Fund.
Tennessee
Other actions include one-time revenue and reserves.
Notes to Table 15
Budget Gap Strategies for FY 2012
Arizona
Other actions include temporary revenue increase, fund transfer.
California
For K-12 Education, both the 2011-2012 budget included deferrals of general purpose funding for local education agencies
and targeted cuts primarily in child care and development. The 2011-2012 budget also included deferrals of general purpose
funding for community college districts. California. Other actions include suspended Mandates, fund shift.
Colorado
Other actions include GF transfers and revenue augmentation, refinancing/other.
Connecticut
Cuts to employee benefits include a wage freeze. Other actions include a hiring freeze.
Florida
Tuition did increase for FY 2012, but does not flow through the General Revenue Fund.
Hawaii
Other actions diversion of special fund revenues to the general fund.
Idaho
Other actions include delayed grocery tax credit and transfer from other funds.
Maine
Other actions include hiring freeze, transfers in from other funds, rebidding of liquor contract. Increase in GF revenue from rebidding of Lottery contract.
Maryland
Other actions include transfer of balance and interest from special funds to the general fund.
40
N AT I O N A L G O V E R N O R S A S S O C I AT I O N
•
N AT I O N A L A S S O C I AT I O N
OF
S TAT E B U D G E T O F F I C E R S
Michigan
Other fiscal 2012 strategies include reducing university operations; shifting a portion of higher education spending from general
fund to School Aid Fund revenue; closing state facilities including two prisons, state police posts and dispatch facilities; establishing a 48-month time limit for Family Independent Program clients; competitively bidding prisoner health and mental health
services; eliminating nearly 370 jobs across state government; requiring employee contributions into defined benefit retirement
plan; refinancing debt; eliminating/reducing revenue sharing payments to local government units; establishing a health care insurance claims assessment in anticipation of federal action to phase-out the existing use tax on Medicaid health maintenance
organizations.
Minnesota
Other actions include K-12 payment shift, cash flow account, bonds secured by tobacco settlement receipts.
Nevada
Other actions include moved some services from state to counties.
New Mexico
Cuts to State Employee Benefits include Shift in employer pension costs of 1.75 percent to employees. Other actions include
Transfer of unobligated balances in state agency accounts to the General Fund.
New York
Layoffs: The FY 2012 Enacted Budget contains savings related to the Governor's initiative to redesign Agency service delivery,
which includes, but is not limited to, facility closures reflecting excess capacity conditions, operational efficiencies, and wage
and benefit changes pending negotiation with the State's employee unions. If the State is unsuccessful in negotiating changes,
significant layoffs will be necessary to achieve the State agency savings expected in the Financial Plan. Furloughs: The FY 2012
Enacted Budget included savings from the Governor's initiative to redesign Agency service delivery through several means including, but not limited to, wage changes pending negotiation with the State's employee unions. By November 2011, the State's
two largest employee unions, the Civil Service Employees Association (CSEA) and the Public Employees Federation (PEF), ratified
multi-year labor agreements with the State. Under these agreements, there are no general salary increases for three years
(FY 2012 through FY 2014). Employee compensation during FY 2012 and FY 2013 will be temporarily reduced. Employees will
receive deficit reduction leave (totaling nine days). CSEA-represented employees will receive a $1,000 lump sum payment ($775
paid in FY 2014 and $225 paid in FY 2015). Employees will receive a 2 percent increase in FY 2015 under both agreements,
and CSEA-represented employees will receive a 2 percent increase in FY 2016. Employees represented by CSEA will be repaid
the value of four days in equal consecutive installments starting at the end of the CSEA contract term and employees represented
by PEF will be repaid the value of nine days in equal consecutive installments starting in FY 2016. Salary Reductions: The FY 2012
Enacted Budget included savings from the Governor's initiative to redesign Agency service delivery through several means
including, but not limited to, wage changes pending negotiation with the State's employee unions. By November 2011, the
State's two largest employee unions, the Civil Service Employees Association (CSEA) and the Public Employees Federation
(PEF), ratified multi-year labor agreements with the State. Under these agreements, there are no general salary increases for
three years (FY 2012 through FY 2014). Employee compensation during FY 2012 and FY 2013 will be temporarily reduced.
Employees will receive deficit reduction leave (totaling nine days). CSEA-represented employees will receive a $1,000 lump sum
payment ($775 paid in FY 2014 and $225 paid in FY 2015). Employees will receive a 2 percent increase in FY 2015 under both
agreements, and CSEA-represented employees will receive a 2 percent increase in FY 2016. Employees represented by CSEA
will be repaid the value of four days in equal consecutive installments starting at the end of the CSEA contract term and employees
represented by PEF will be repaid the value of nine days in equal consecutive installments starting in FY 2016. Cuts to State
Employee Benefits: The FY 2012 Enacted Budget included savings from the Governor's initiative to redesign Agency service
delivery through several means including, but not limited to, benefit changes pending negotiation with the State's employee
unions. By November 2011, the State's two largest employee unions, the Civil Service Employees Association (CSEA) and the
Public Employees Federation (PEF), ratified multi-year labor agreements with the State. These agreements included substantial
changes to employee health care contributions. Other: Additional revenue actions including tax modernization initiatives and
improving voluntary compliance, increasing the level of resources available from abandoned property and withholding tax debts
from certain Lottery winnings; sweeping additional available fund balances from other State funds to the General Fund; other
non-recurring measures.
Puerto Rico
Other actions include alcohol, cigarettes, and temporary excise taxes.
THE FISCAL SURVEY
OF
S TAT E S
•
FALL 2011
41
Rhode Island
User Fees include increased beach parking fees, increase securities sales rep license fees, increase Federal covered advisor
fees, institute fee for background checks, and reinstitute hospital licensing fees at 5.465 percent. Transportation/Motor Vehicle
Related Fees related fees include increases to NSF Check Return fee at the DMV. Business related fees include Offsets to Income
Tax Refunds for probation and parole fees owed. Across the board cuts include a 3 percent reduction was taken in personnel
funding, impacting all cabinet-level agencies and a 2 percent reduction was taken against personnel funding for elected officials,
the Judiciary and Legislature. A 1 percent reduction was taken against operating expenditures for all agencies listed above.
Other actions include new work support strategies grant.
South Dakota
Other actions include use of the Education Jobs Fund.
Tennessee
Other actions include base budget reductions.
West Virginia
Use onetime surplus from General Revenue and Lottery Funds from previous fiscal years.
Notes to Table 16
Budget Gap Strategies for FY 2013
Hawaii
Other actions include diversion of special fund revenues to the general fund.
Maine
Other action include hiring freeze, transfers in from other funds, rebidding of liquor contract. Increase in GF revenue from rebidding
of Lottery contract.
Michigan
Other fiscal 2013 strategies include a recommended two-year budget plan with permanent fiscal 2012 solutions that generate
an ending balance sufficient to offset the projected fiscal 2013 budget gap.
Nevada
Other actions include moved some services from state to counties.
Tennessee
Other actions include base budget reductions
West Virginia
Use onetime surplus from General Revenue & Lottery Funds from previous fiscal years.
Notes to Table 17
FTE
California
FY 2012 figure includes a reduction of 98.4 personnel years related to efficiencies and state operations reductions.
Colorado
FY 09-10 appropriated (not actual); FY 10-11 appropriated (not actual); FY 11-12 appropriated.
Connecticut
Figures include General Fund and Special Transportation Fund only.
Illinois
FY 2012 appropriated headcount is equal to the managed headcount that was included in the Governor’s FY 2012 introduced
budget minus proposed layoffs of 1,938 employees. Due to the General Assembly’s reduction of personal service appropriations
below what was introduced, without appropriation authority from the General Assembly to address the resulting budgetary shortfalls, the FY 2012 headcount will have to be significantly reduced beyond the current 1,938 employee reduction.
Louisiana
In FY 2011, Higher Education and LSU Health Science Center-Healthcare Services Division positions were reestablished as Authorized Table of Organization (T.O.) positions. Prior to FY 2011, they were not part of the Authorized T.O. Position count.
Massachusetts
The FY11 number reflects actuals through September 2010 rather than appropriated.
Nebraska
Appropriations bills do not limit authorized FTE to a specific number.
42
N AT I O N A L G O V E R N O R S A S S O C I AT I O N
•
N AT I O N A L A S S O C I AT I O N
OF
S TAT E B U D G E T O F F I C E R S
Nevada
Filled position numbers do not include higher education, Legislature and their staff, Boards & Commission and Courts. They do
include Temporary, Seasonal, and Intermittent positions.
New Hampshire
FY 2012 figure is actual projection. Note: FY 2010 and 2011 includes Community College System of NH employees. Effective
FY 2012, 883 CCSNH employees are removed from the State's payroll system.
New York
Projected full-time equivalent totals for FY 2012 reflects an estimate of up to 9,700 layoffs that may be necessary in the absence
of negotiated workforce savings.
Ohio
Ohio does not count employees by full-time equivalents, but instead by actual number employed. The FY 2012 amount represents
employees as of 9/30/2012.
Wisconsin
FY 2012 appropriated number assumes 15 percent vacancy rate for non-UW and 4 percent for UW times budgeted FTE
positions.
Notes to Table 19
TANF
Arizona
Level of benefit did not change. However, the lifetime time limit was changed from 36 months to 24 months.
Michigan
The enacted fiscal 2012 budget does not include an increase or decrease for TANF cash assistance benefit levels. In addition,
an approximate $100.00 annual clothing allowance for all children from birth through age 18 is substantially reduced; remaining
funds are limited to “child only” cases, such as adopted children and those in foster care.
Nebraska
No increase in the maximum grant an individual may receive has been enacted for FY2012. Effective July 1, 2011 Nebraska is
increasing the maximum "standard of need" for TANF cash assistance from $710 to $740 per month (family of three). This increase is based on a 2.7 percent CPI increase in CY 2009 and 1.5 percent CPI increase in CY 2010.
Wisconsin
$20 decrease in maximum monthly benefit for an individual in a community service job placement.
THE FISCAL SURVEY
OF
S TAT E S
•
FALL 2011
43
State Revenue Developments
CHAPTER TWO
Overview
include revenues from sales, personal income, and corporate
State general fund revenue collections are forecast to increase
in fiscal 2012, the second consecutive annual increase. However, not all aspects of state general fund revenues are set to
rise as states are forecasting a slight drop in sales taxes. This
is primarily related to the end of temporary sales taxes in a few
states. Additionally, state finances can take many years to fully
recover from a national recession, as was the case after the
2001 recession. A combination of this lag time and the slow recovery in the national economy is expected to result in fiscal
2012 state general fund revenue collections remaining below
income taxes along with all other taxes and fees, were above,
below or on target with projections. In fiscal 2011, 32 states reported that their total collections were above forecast, while 9
states reported that such collections were on target, and only
9 states reported that total collections were below their forecast. Although we are only a few months into fiscal 2012 and
revenue collections are growing, they are below forecast in
some states, possibly due to a noticeable slowdown in economic activity earlier this year. As such, 15 states are exceeding
their forecast, while 22 states are on target and seven states
are below forecast. (See Table 20)
2008 levels by $20.8 billion.
Projected Collections in Fiscal 2012
Revenues
According to the latest report from the Rockefeller Institute of
Government1, total revenue collections have now increased in
six consecutive quarters, beginning in the first quarter of cal-
Revenue collections of sales, personal income, and corporate
income tax collections make up approximately 80 percent of
general fund revenue. In 2012, sales tax collections are projected to be $207.4 billion, a 0.3 percent decline, while per-
endar year (CY) 2010.
sonal income tax collections are projected to be $273.6 billion,
Based on states enacted budgets, general fund revenues in fis-
a 5.2 percent increase. Corporate income tax collections are
cal 2012, are expected to increase to $659.4 billion, a 1.6 per-
projected to be $43.0 billion, a decrease of 0.1 percent. (See
cent increase from the $649.0 billion collected in fiscal 2011.
Tables 22 and 23)
Additionally, fiscal 2011 collections, at $649.0 billion, are 6.4
percent above the 2010 level. However, the five consecutive
quarterly drops in 2008 and 2009, as reported by the Rockefeller Institute, were so severe, that total state general fund revenues for fiscal 2012 are forecast to be $20.8 billion below their
2008 level. (See Tables 3, 4, and 5)
Collections in Fiscal 2011
Fiscal 2011 collections of sales tax were $207.9 billion, a 4.8
percent increase over fiscal 2010, while personal income tax
collections were $259.9 billion, a 9.7 percent increase. Corporate income tax collections were $43.1 billion, an increase of
The revenue growth turnaround that occurred in fiscal 2011 is
9.4 percent. (See Tables 22 and 23)
visible when looking at whether total revenue collections, which
1
Dadayan, Lucy. State Revenue Report. The Nelson A. Rockefeller Institute of Government. September 2011. http://bit.ly/vwCVYP
44
N AT I O N A L G O V E R N O R S A S S O C I AT I O N
•
N AT I O N A L A S S O C I AT I O N
OF
S TAT E B U D G E T O F F I C E R S
Table 20
Number of States With Revenues Higher,
Lower, and On Target with Projections*
Fiscal 2011
Fiscal 2012
Lower
9
7
On Target
Higher
9
32
22
15
*Fiscal 2011 reflects whether revenues from all sources came in higher, lower, or on target
with final projections. Fiscal 2012 reflect whether Fiscal 2012 collections thus far have been
coming in higher, lower, or on target with projections.
THE FISCAL SURVEY
OF
S TAT E S
•
FALL 2011
45
TABLE 21
Fiscal 2011 Tax Collections Compared With Projections Used in Adopting Fiscal 2011 Budgets (Millions)**
Sales Tax
Region/State
Alabama
Alaska
Arizona
Arkansas
California*
Colorado*
Connecticut
Delaware
Florida
Georgia
Hawaii
Idaho
Illinois
Indiana
Iowa
Kansas
Kentucky
Louisiana
Maine
Maryland
Massachusetts
Michigan
Minnesota
Mississippi
Missouri
Montana
Nebraska
Nevada
New Hampshire
New Jersey
New Mexico
New York
North Carolina
North Dakota
Ohio
Oklahoma
Oregon
Pennsylvania
Rhode Island
South Carolina
South Dakota
Tennessee
Texas
Utah
Vermont
Virginia
Washington
West Virginia
Wisconsin
Wyoming
TERRITORIES
Puerto Rico
Total
Original
Estimate
Current
Estimate
Personal Income Tax
Original
Current
Estimate
Estimate
Corporate Income Tax
Original
Current
Estimate
Estimate
1,887
NA
3,602
2,087
27,044
1,933
3,165
NA
16,824
5,254
2,496
989
6,385
6,438
2,267
2,273
2,919
2,402
972
3,667
4,897
6,261
4,492
1,765
1,746
61
1,365
849
NA
8,353
1,740
10,775
5,691
599
7,267
1,584
NA
8,337
787
2,137
671
6,249
22,500
1,430
321
2,881
7,768
1,174
4,321
433
1,920
NA
3,467
2,056
27,140
2,044
3,342
NA
16,638
5,098
2,496
972
6,833
6,218
2,395
2,253
2,896
2,627
976
3,656
4,905
6,499
4,403
1,791
1,760
65
1,373
815
NA
8,236
1,797
10,782
5,872
782
7,578
1,668
NA
8,590
813
2,245
710
6,475
20,600
1,556
326
2,969
6,501
1,196
4,109
439
2,553
NA
2,471
2,203
47,127
4,604
6,683
849
NA
7,282
1,349
1,171
9,625
4,547
3,202
2,595
3,300
2,466
1,393
6,292
10,704
5,538
7,342
1,353
4,522
762
1,630
NA
NA
9,855
1,055
36,897
9,543
334
7,568
1,703
5,781
10,125
938
2,046
NA
186
NA
2,229
527
9,588
NA
1,586
6,432
NA
2,794
NA
2,864
2,270
50,027
4,496
7,220
997
NA
7,659
1,231
1,153
12,261
4,586
3,435
2,710
3,418
2,449
1,415
6,643
11,576
6,222
7,529
1,383
4,640
816
1,735
NA
NA
10,536
1,055
36,210
9,735
428
8,120
1,832
5,524
10,436
1,021
2,396
NA
189
NA
2,248
553
9,746
NA
1,689
6,701
NA
414
669
446
344
10,897
368
663
79
2,180
602
37
133
1,900
819
369
231
235
372
193
514
1,397
2,191
799
393
310
97
185
NA
261
2,455
220
5,714
1,018
119
132
172
331
1,847
119
120
NA
1,476
NA
217
66
793
NA
214
808
NA
333
615
560
351
9,963
394
784
168
1,875
670
51
169
1,983
705
386
225
301
283
209
571
1,951
2,060
925
448
386
119
155
NA
248
2,382
180
5,279
1,014
147
237
274
469
2,132
85
183
NA
1,518
NA
267
90
767
NA
307
853
NA
L
H
H
T
H
T
H
H
L
H
H
H
T
H
T
H
H
L
H
H
H
H
H
H
H
H
H
T
L
T
H
H
L
H
H
H
L
H
L
H
H
H
L
T
H
T
L
H
T
H
604
$209,057
555
$207,883
2,812
$247,956
2,348
$259,947
1,667
$42,919
1,566
$43,068
T
-
Revenue
Collection***
NOTES: NA indicates data are not available because, in most cases, these states do not have that type of tax. *See Notes to Table 21. **Unless otherwise noted, original estimates reflect the figures used
when the fiscal 2011 budget was adopted, and current estimates reflect preliminary actual tax collections. ***Refers to whether preliminary actual fiscal 2011 collections of Sales, Personal Income and
Corporate Taxes were higher than, lower than, or on target with original estimates. Key: L=Revenues lower than estimates. H=Revenues higher than estimates. T=Revenues on target. ****Totals include
only those states with data for both original and current estimates for fiscal 2011.
46
N AT I O N A L G O V E R N O R S A S S O C I AT I O N
•
N AT I O N A L A S S O C I AT I O N
OF
S TAT E B U D G E T O F F I C E R S
TABLE 22
Comparison of Tax Collections in Fiscal 2010, Fiscal 2011, and Enacted Fiscal 2012**
Region/State
Alabama
Alaska
Arizona*
Arkansas
California*
Colorado
Connecticut
Delaware
Florida
Georgia
Hawaii
Idaho
Illinois
Indiana
Iowa
Kansas
Kentucky
Louisiana
Maine
Maryland*
Massachusetts
Michigan
Minnesota
Mississippi
Missouri
Montana
Nebraska
Nevada
New Hampshire
New Jersey
New Mexico
New York
North Carolina
North Dakota*
Ohio
Oklahoma
Oregon
Pennsylvania
Rhode Island
South Carolina
South Dakota
Tennessee*
Texas
Utah
Vermont
Virginia
Washington
West Virginia
Wisconsin*
Wyoming
TERRITORIES
Puerto Rico
Total***
Fiscal 2010
Sales Tax
Fiscal 2011
Fiscal 2012
Personal Income Tax
Fiscal 2010
Fiscal 2011
Fiscal 2012
Corporate Income Tax
Fiscal 2010
Fiscal 2011 Fiscal 2012
1,852
NA
3,423
1,966
26,741
1,825
3,204
NA
16,015
4,865
2,316
956
6,308
5,915
2,293
1,858
2,794
2,363
954
3,523
4,612
6,177
4,177
1,781
1,732
66
1,290
784
NA
7,898
1,634
9,871
5,565
610
6,995
1,516
NA
8,029
803
2,191
652
6,158
19,600
1,403
311
3,083
6,840
1,143
3,944
413
1,920
NA
3,467
2,056
27,140
2,044
3,342
NA
16,638
5,098
2,496
972
6,833
6,218
2,395
2,253
2,896
2,627
976
3,656
4,905
6,499
4,403
1,791
1,760
65
1,373
815
NA
8,236
1,797
10,782
5,872
782
7,578
1,668
NA
8,590
813
2,245
710
6,475
20,600
1,556
326
2,969
6,501
1,196
4,109
439
2,022
NA
3,666
2,162
19,009
1,888
3,789
NA
17,436
5,333
2,590
1,044
6,586
6,518
2,470
2,386
3,031
2,672
1,013
4,164
5,095
6,646
4,647
1,817
1,823
61
1,425
833
NA
8,539
1,810
11,173
5,293
756
7,869
1,747
NA
8,788
847
2,251
720
6,658
22,200
1,522
337
3,116
7,649
1,227
4,270
455
2,586
NA
2,416
2,091
44,852
4,084
6,586
853
NA
7,016
1,528
1,062
9,430
3,876
3,236
2,418
3,155
2,212
1,298
6,178
10,110
5,532
6,531
1,340
4,434
718
1,515
NA
NA
10,323
957
34,752
9,048
302
7,479
1,655
4,943
9,969
898
2,171
NA
173
NA
2,105
498
9,088
NA
1,542
6,089
NA
2,794
NA
2,864
2,270
50,027
4,496
7,220
997
NA
7,659
1,231
1,153
12,261
4,586
3,435
2,710
3,418
2,449
1,415
6,643
11,576
6,222
7,529
1,383
4,640
816
1,735
NA
NA
10,536
1,055
36,210
9,735
428
8,120
1,832
5,524
10,436
1,021
2,396
NA
189
NA
2,248
553
9,746
NA
1,689
6,701
NA
2,785
NA
2,671
2,277
50,408
4,666
8,457
1,054
NA
7,979
1,487
1,205
16,500
4,774
3,615
2,727
3,470
2,815
1,446
6,688
11,595
6,798
7,774
1,389
4,815
809
1,758
NA
NA
11,132
1,095
39,059
9,800
266
8,147
1,830
5,839
11,000
1,010
2,323
NA
201
NA
2,394
595
10,330
NA
1,742
6,868
NA
415
528
413
362
9,115
372
667
88
1,790
685
59
97
1,649
592
389
225
238
175
175
689
1,600
1,864
664
403
288
88
154
NA
259
2,275
125
5,371
1,198
88
100
168
359
1,791
147
110
NA
1,400
NA
258
63
807
NA
237
835
NA
333
615
560
351
9,963
394
784
168
1,875
670
51
169
1,983
705
386
225
301
283
209
571
1,951
2,060
925
448
386
119
155
NA
248
2,382
180
5,279
1,014
147
237
274
469
2,132
85
183
NA
1,518
NA
267
90
767
NA
307
853
NA
321
640
687
359
9,012
403
708
138
2,112
685
51
136
2,853
687
432
226
237
255
180
623
1,850
1,065
852
432
331
115
200
NA
259
2,543
283
6,101
1,000
62
220
203
430
2,232
121
187
NA
1,548
NA
280
78
832
NA
178
881
NA
539
$198,448
555
$207,833
680
$207,351
2,575
$237,048
2,348
$259,941
2,109
$273,591
1,678
$39,373
1,566
$43,068
1,515
$43,026
NOTES: NA indicates data are not available because, in most cases, these states do not have that type of tax. *See Notes to Table 22. **Unless otherwise noted, fiscal 2010 figures reflect actual tax
collections, 2011 figures reflect preliminary actual tax collections estimates, and fiscal 2012 figures reflect the estimates used in enacted budgets. ***Totals include only those states with data for all
years.
THE FISCAL SURVEY
OF
S TAT E S
•
FALL 2011
47
TABLE 23
Percentage Changes Comparison of Tax Collections in Fiscal 2010, Fiscal 2011, and Enacted Fiscal 2012**
State
Alabama
Alaska
Arizona
Arkansas
California
Colorado
Connecticut
Delaware
Florida
Georgia
Hawaii
Idaho
Illinois
Indiana
Iowa
Kansas
Kentucky
Louisiana
Maine
Maryland
Massachusetts
Michigan
Minnesota
Mississippi
Missouri
Montana
Nebraska
Nevada
New Hampshire
New Jersey
New Mexico
New York
North Carolina
North Dakota*
Ohio
Oklahoma
Oregon
Pennsylvania
Rhode Island
South Carolina
South Dakota
Tennessee
Texas
Utah
Vermont
Virginia
Washington
West Virginia
Wisconsin
Wyoming
TERRITORIES
Puerto Rico
Total***
Fiscal 2010
Sales Tax
Fiscal 2011
Fiscal 2012
Personal Income Tax
Fiscal 2010
Fiscal 2011
Fiscal 2012
Corporate Income Tax
Fiscal 2010
Fiscal 2011 Fiscal 2012
1.6%
NA
-8.9
-5.5
12.6
-5.5
-3.5
NA
-3.1
-8.3
-4.2
-6.5
-6.9
-3.9
-1.5
-3.5
-2.2
-23.1
-2.1
-2.7
19.2
1.4
-3.8
-7.3
-4.5
15.3
-2.7
-8.7
NA
-4.4
-29.2
-3.9
19.0
-2.0
-1.7
-7.9
NA
-1.3
-0.6
-2.5
-1.0
-2.6
-6.2
-9.3
45.3
6.2
-6.7
-1.3
-3.4
-16.1
3.7%
NA
1.3
4.6
1.5
12.0
4.3
NA
3.9
4.8
7.7
1.7
8.3
5.1
4.4
21.3
3.7
11.2
2.3
3.8
6.4
5.2
5.4
0.5
1.6
-1.8
6.4
3.9
NA
4.3
9.9
9.2
5.5
28.2
8.3
10.1
NA
7.0
1.2
2.5
8.9
5.1
5.1
10.9
4.9
-3.7
-5.0
4.6
4.2
6.3
5.3%
NA
5.8
5.1
-30.0
-7.6
13.4
NA
4.8
4.6
3.8
7.4
-3.6
4.8
3.1
5.9
4.7
1.7
3.8
13.9
3.9
2.3
5.5
1.5
3.6
-5.8
3.8
2.2
NA
3.7
0.7
3.6
-9.9
-3.3
3.8
4.7
NA
2.3
4.1
0.3
1.3
2.8
7.8
-2.2
3.2
4.9
17.7
2.6
3.9
3.6
-3.6%
NA
-5.9
-6.6
3.4
-5.8
3.1
-6.3
NA
-10.2
14.1
-9.1
2.2
-10.1
-2.8
-9.8
-4.9
-25.4
4.5
-4.6
-4.5
-5.5
-6.5
-9.1
-9.1
-11.9
-5.3
NA
NA
-1.5
-0.2
-5.7
-4.5
-19.6
-2.0
-15.5
-3.4
-2.3
-4.5
-6.7
NA
-21.7
NA
-10.0
-6.1
-4.1
NA
-6.7
-2.1
NA
8.1%
NA
18.5
8.6
11.5
10.1
9.6
16.9
NA
9.2
-19.4
8.5
30.0
18.3
6.2
12.1
8.3
10.7
9.0
7.5
14.5
12.5
15.3
3.2
4.7
13.7
14.5
NA
NA
2.1
10.3
4.2
7.6
41.8
8.6
10.7
11.7
4.7
13.7
10.4
NA
9.3
NA
6.8
11.1
7.2
NA
9.5
10.0
NA
-0.3%
NA
-6.7
0.3
0.8
3.8
17.1
5.7
NA
4.2
20.8
4.5
34.6
4.1
5.2
0.6
1.5
15.0
2.2
0.7
0.2
9.3
3.3
0.5
3.8
-0.8
1.3
NA
NA
5.7
3.8
7.9
0.7
-37.8
0.3
-0.1
5.7
5.4
-1.1
-3.1
NA
6.6
NA
6.5
7.5
6.0
NA
3.2
2.5
NA
-7.3%
-13.9
-30.2
12.0
-4.4
27.2
8.3
-30.5
-2.4
-1.4
10.7
-31.2
-3.6
-29.4
-6.5
-6.4
-11.2
-78.8
22.5
25.2
3.3
-18.4
-6.3
-4.5
-19.6
-47.2
-22.3
NA
2.7
-19.0
-23.0
-3.3
43.4
-11.2
-80.8
-36.9
47.3
-9.5
40.6
-46.9
NA
2.8
NA
-4.1
-5.1
24.5
NA
-16.7%
32.6%
NA
-19.7%
16.5
35.6
-3.1
9.3
5.9
17.6
91.5
4.7
-2.1
-14.4
74.1
20.3
19.1
-0.8
0.0
26.4
61.6
19.2
-17.1
21.9
10.5
39.4
11.2
33.9
35.4
0.5
NA
-4.3
4.7
43.9
-1.7
-15.4
66.7
136.6
63.6
30.5
19.0
-42.4
66.0
NA
8.4
NA
3.5
42.8
-4.9
NA
29.6
2.2
NA
-3.6%
4.1
22.6
2.3
-9.5
2.2
-9.8
-17.9
12.7
2.2
1.4
-19.4
43.9
-2.6
11.9
0.5
-21.3
-9.7
-13.9
9.0
-5.2
-48.3
-7.8
-3.7
-14.1
-3.3
29.0
NA
4.6
6.7
57.4
15.6
-1.4
-57.9
-7.0
-26.1
-8.3
4.7
43.4
2.4
NA
2.0
NA
4.9
-12.9
8.5
NA
-42.1
3.3
NA
-39.8
-1.6%
3.0
4.8%
22.5
-0.3%
-1.5
-3.4%
-8.8
9.7%
-10.2
5.2%
23.0
-6.8%
-6.7
9.4%
-3.3
-0.1%
NOTES: NA indicates data are not available because, in most cases, these states do not have that type of tax. *See Notes to Table 23. ** Unless otherwise noted, fiscal 2010 figures reflect actual tax
collections, 2011 figures reflect preliminary actual tax collections estimates, and fiscal 2012 figures reflect the estimates used in enacted budgets. ***Totals include only those states with data for all
years.
48
N AT I O N A L G O V E R N O R S A S S O C I AT I O N
•
N AT I O N A L A S S O C I AT I O N
OF
S TAT E B U D G E T O F F I C E R S
Enacted Fiscal 2012 Revenue Changes
For fiscal 2012, states enacted a decrease of $584.2 million in
new taxes and fees along with a decrease of $2.6 billion in new
revenue measures. Revenue measures differ from taxes and
Personal Income Taxes—Three states enacted personal income tax increases in their fiscal 2012 budgets while 15 states
enacted decreases for a net increase of $571.0 million. Much
of this is due to changes in Connecticut and Michigan.
fees in that they enhance general fund revenue, but do not af-
Corporate Income Taxes—Four states enacted personal in-
fect taxpayer liability and may rely on enforcement of existing
come tax increases while 14 states enacted decreases in their
laws, additional audits and compliance efforts, and increasing
fiscal 2012 budgets for a net decrease of $1.3 billion. Much of
fines or late filings. The decrease in new net taxes and fees for
this is due to changes in Michigan.
fiscal 2012 is the first time since fiscal 2007 that states did not
enact an increase. Both fiscal 2011 and fiscal 2010 saw signif-
Cigarette and Tobacco Taxes—Three states enacted ciga-
icant tax and fee increases of $6.2 billion and $23.9 billion re-
rette and tobacco tax increases for a net increase of $58.1 mil-
spectively. Specifically, for fiscal 2012, 13 states enacted net tax
lion. Much of this is due to rate changes in Connecticut.
and fee increases while 18 state enacted net decreases. Although states enacted a decrease of $584.1 million in new taxes
and fees and a decrease of $2.6 billion in new revenue measures,
the expiration of temporary taxes that had been enacted in previous years was a primary factor in the decrease.
The largest enacted change will occur in corporate income
taxes (-$1.3 billion). Of this, -$1.1 billion is the result of the replace-
Motor Fuel Taxes—One state enacted motor fuel tax increases for a net increase of $8.7 million. This change is due
to rate changes in Connecticut.
Alcohol Taxes—Three states enacted alcohol tax increases for
a net increase of $97.1 million. Much of this is due to rate increase in Maryland.
ment of the Michigan Business Tax with a 6 percent corporate
Other Taxes—Six states enacted other tax increases while 9
income tax. Other enacted tax and fee increases include in-
states enacted decreases in their fiscal 2012 budgets for a net
creases of $571 million in personal income taxes, $511.2 million
increase of $511.2 million. Much of this is due to changes in
in other tax increases, $127.8 million in fee increases, $97.1
Connecticut.
million in alcohol tax increases, $58.1 million in cigarette tax
increases, and $8.7 million in motor fuel tax increases. Addition-
Fees—10 states enacted fee increases for a net increase of
ally, sales taxes were decreased by $690.5 million. (See Table 26)
$127.8 million. Much of this is due to changes in Oregon and
Massachusetts.
Sales Taxes—Eight states enacted sales tax increases while
5 states enacted decreases in their fiscal 2012 budgets for a
net decrease of $690.5 million. Much of this change is due to
the expiration of a temporary sales tax in North Carolina.
THE FISCAL SURVEY
OF
S TAT E S
•
FALL 2011
49
TABLE 24
Enacted State Revenue Changes,
Fiscal 1979 to Fiscal 2012
Fiscal Year
Revenue Change
(Billions)
2012
2011
2010
2009
2008
2007
2006
2005
2004
2003
2002
2001
2000
1999
1998
1997
1996
1995
1994
1993
1992
1991
1990
1989
1988
1987
1986
1985
1984
1983
1982
1981
1980
1979
-0.6
6.2
23.9
1.5
4.5
-2.1
2.5
3.5
9.6
8.3
0.3
-5.8
-5.2
-7.0
-4.6
-4.1
-3.8
-2.6
3.0
3.0
15.0
10.3
4.9
0.8
6.0
0.6
-1.1
0.9
10.1
3.5
3.8
0.4
-2.0
-2.3
SOURCES: Advisory Commission on Intergovernmental Relations, Significant Features of Fiscal
Federalism,1985-86 edition, page 77, based on data from the Tax Foundation and the National
Conference of State Legislatures. Fiscal 1988–2011 data provided by the National Association
of State Budget Officers.
50
N AT I O N A L G O V E R N O R S A S S O C I AT I O N
•
N AT I O N A L A S S O C I AT I O N
OF
S TAT E B U D G E T O F F I C E R S
Figure 3:
Enacted State Revenue Changes, Fiscal 1979 to Fiscal 2012
25
20
Billions of Dollars
15
10
5
0
-5
-10
1979
1981 1983
1980
1982
1985
1984
1987
1986
1989
1988
1991 1993 1995 1997 1999 2001 2003 2005 2007 2009 2011
1990 1992 Fiscal
1994Year1996 1998 2000 2002 2004 2006 2008 2010
SOURCE: National Association of State Budget Officers.
THE FISCAL SURVEY
OF
S TAT E S
•
FALL 2011
51
TABLE 25
Enacted Mid-Year Fiscal 2011 Revenue Actions by Type of Revenue and Net Increase or Decrease* (Millions)
State
Sales
Alabama
Alaska
Arizona
Arkansas
California
Colorado
Connecticut
Delaware
Florida
Georgia
Hawaii
Idaho
Illinois
Indiana
Iowa
Kansas
Kentucky
Louisiana
Maine
Maryland
Massachusetts
Michigan
Minnesota
Mississippi
Missouri
Montana
Nebraska
Nevada
New Hampshire
New Jersey
New Mexico
New York
North Carolina
North Dakota
Ohio
Oklahoma
Oregon
Pennsylvania
Rhode Island
South Carolina
South Dakota
Tennessee
Texas
Utah
Vermont
Virginia
Washington
West Virginia
Wisconsin
Wyoming
TERRITORIES
Puerto Rico
Total
-2.1
Personal
Income
Corporate
Income
Cigarettes/
Tobacco
Motor
Fuels
Other
Taxes
Fees
-3.7
-4.8
2,884.0
180.0
-1.7
4.7
-19.9
-9.3
-3.8
71.8
35.8
400.0
-14.9
$49.8
-414.0
$3,266.2
-91.0
$159.6
$35.8
$0.0
NOTE: *See Appendix Table A-1 for details on specific revenue changes. **See Notes to Table 25.
SOURCE: National Association of State Budget Officers.
52
Alcohol
N AT I O N A L G O V E R N O R S A S S O C I AT I O N
•
N AT I O N A L A S S O C I AT I O N
OF
S TAT E B U D G E T O F F I C E R S
$0.0
505.0
$0.0
$4.7
Total
0.0
0.0
0.0
-5.8
-4.8
0.0
0.0
0.0
0.0
0.0
0.0
0.0
3,064.0
0.0
0.0
0.0
0.0
0.0
3.0
0.0
-19.9
0.0
-13.1
0.0
0.0
0.0
0.0
0.0
0.0
0.0
107.6
0.0
0.0
0.0
400.0
0.0
0.0
0.0
0.0
0.0
0.0
0.0
0.0
0.0
0.0
-14.9
0.0
0.0
0.0
0.0
0.0
0.0
$3,516.1
TABLE 26
Enacted Fiscal 2012 Revenue Actions by Type of Revenue and Net Increase or Decrease* (Millions)
State
Alabama
Alaska
Arizona
Arkansas
California*
Colorado
Connecticut
Delaware
Florida
Georgia
Hawaii
Idaho
Illinois
Indiana
Iowa
Kansas
Kentucky
Louisiana
Maine
Maryland
Massachusetts
Michigan
Minnesota
Mississippi
Missouri
Montana
Nebraska
Nevada
New Hampshire
New Jersey
New Mexico
New York
North Carolina
North Dakota
Ohio
Oklahoma
Oregon
Pennsylvania
Rhode Island
South Carolina
South Dakota
Tennessee
Texas
Utah
Vermont
Virginia
Washington
West Virginia
Wisconsin
Wyoming
TERRITORIES
Puerto Rico
Total
Sales
Personal
Income
Corporate
Income
-20.8
-5.3
-38.0
-2.5
326.9
875.1
-6.8
39.0
-25.5
Cigarettes/
Tobacco
Motor
Fuels
Alcohol
45.3
8.8
-29.1
-1.5
-2.9
-5.6
-5.0
-1.4
18.8
-36.4
-7.5
-17.1
-1.3
2.2
559.1
-44.8
-1,094.3
8.6
-15.0
-24.3
Fees
Total
0.0
0.0
0.0
-24.0
-38.0
0.0
1,851.7
-25.9
-44.8
0.0
155.9
0.0
0.0
-2.9
-32.2
2.3
0.0
0.0
-54.9
104.9
45.9
-533.3
4.0
0.0
-39.3
-1.3
-2.0
159.9
0.0
-185.0
0.0
3.0
-1453.0
-77.0
-446.0
0.0
20.9
-66.6
21.7
0.0
0.0
107.6
0.0
0.0
13.0
7.4
0.0
-30.8
-25.3
0.0
4.6
50.5
8.7
9.8
-17.7
50.0
Other
Taxes
521.8
-19.1
-1.6
19.9
60.6
2.5
84.8
1.9
8.1
45.9
1.9
2.3
0.0
35.7
-1.3
-2.0
1.1
158.8
0.0
-23.0
-100.0
-177.0
-60.0
-446.0
-26.0
-12.5
-62.0
3.0
-1,061.0
-189.0
-4.5
-10.3
-66.6
17.2
31.2
0.8
3.7
4.0
101.8
1.8
4.6
8.4
7.4
-10.8
-$690.5
-16.1
-5.0
-9.2
-265.0
$571.0
-239.0
-$1,267.6
-15.0
$58.1
$8.7
$97.1
969.0
$511.2
465.0
-$584.1
$127.8
NOTE: *See Appendix Table A-3 for details on specific revenue changes. **See Notes to Table 26.
SOURCE: National Association of State Budget Officers.
THE FISCAL SURVEY
OF
S TAT E S
•
FALL 2011
53
Chapter 2 Notes
Notes to Table 21
Compared to Original Projections
California
Compared to projection at 2010-2012 Budget Act.
Colorado
On target relative to the basis for the final appropriation authorized by the General Assembly during the 2011 Legislative
Session.
Notes to Table 22
Dollar Value — Taxes
Arizona
FY 2011 and FY 2012 Sales Tax amounts do not include the temporary 1 cent sales tax (passed in May 2010), which generates
$835 million in FY 2011 and estimated $901 million in FY 2012.
California
It is too early to judge our 2011-2012 revenues.
Maryland
FY 2010 corporate income tax collections includes $129.0 million of extraordinary income from the sale of Constellation Energy.
North Dakota
North Dakota reduced Personal Income Tax and Corporate Income Tax rates for FY 2012.
Tennessee
Sales tax, personal income tax, and corporate income tax are shared with local governments.
Wisconsin
FY 2011 Preliminary Actuals from September 2, Legislative Fiscal Bureau memorandum to the Joint Committee on Finance;
FY 2012 estimates from LFB Comparative Summary of Act 32, Table 7.
Notes to Table 23
Dollar Value — Percentages
North Dakota
North Dakota reduced Personal Income Tax and Corporate Income Tax rates for FY 2012.
Notes to Table 26
2012 Enacted Revenue Actions
California
54
Not a Budget Act tax change but included in the Budget Act estimate.
N AT I O N A L G O V E R N O R S A S S O C I AT I O N
•
N AT I O N A L A S S O C I AT I O N
OF
S TAT E B U D G E T O F F I C E R S
Total Balances
CHAPTER THREE
Overview
Maintaining adequate balance levels helps states to mitigate
disruptions to state services during an economic downturn.
Total balances include both ending balances and the amounts
in states’ budget stabilization funds (rainy day funds) and reflect
of general fund expenditures in fiscal 2009. The slight improvement in state fiscal conditions that began in 2011 allowed
states to increase total balance levels in fiscal 2012 to $41.2
billion, 6.2 percent of expenditures. (See Figures 6, 7, and 8
along with Tables 28, 29, and 30)
the funds that states may use to respond to unforeseen cir-
Although total balance levels of $41.2 billion, representing 6.2
cumstances. Additionally, rainy day funds are needed to ensure
percent of general fund expenditures, may seem like an ade-
that budgets can be balanced when revenues do not meet ex-
quate cushion given the difficulties experienced by states over
pectations in the latter part of the fiscal year when budget cuts
the past few years, when examining balance levels a bit further,
and revenue increases do not have enough time to take effect.
a starker picture emerges. The balance levels for Texas and
Though budget experts’ views vary, an informal rule-of-thumb
Alaska, at $6.7 billion and $11.9 billion respectively, combine to
used by some states prior to the economic downturn was to
represent 45.2 percent of total balance levels. If you remove
build up total budget reserve balances to a level that equals at
these two states from total balance levels, fiscal 2012 balance
least five percent of total general fund expenditures in order to
levels represent only 3.7 percent of expenditures, well below the
provide a relatively adequate fiscal cushion. However, in the
5 percent level. Additionally, this view that total balance levels
wake of the recent financial crises, there have been calls by
across all states are inflated due to the robust levels in two states
some to increase the standard size of a state’s rainy day fund
is reinforced when looking at individual state balance levels.
above five percent. In general, state officials often try and avoid
For fiscal 2012,12 states enacted budgets with balance levels
drawing down balance levels at the beginning of a downturn,
below 1 percent, while 19 states enacted budgets with balance
and may also be prohibited from draining all rainy day funds im-
levels greater than one percent, but less than five percent. Nine-
mediately. In total, 48 states have budget stabilization funds,
teen states enacted a budget with a balance level greater than
which may be budget reserve funds, revenue-shortfall ac-
five percent. (See Table 28)
counts, or accounts used for cash flow. About three-fifths of
the states have limits on the size of their budget reserve funds,
ranging from 3 to 10 percent of appropriations. States with low
Budget Stabilization Funds
balance levels may be impeded in their ability to respond to
Budget stabilization (rainy day) funds, which do not include
events that occur during the fiscal year, including unanticipated
ending balances, also show a similar trend. Total levels fell to
budget gaps that appear towards the end of the fiscal year.
$21.0 billion, or 3.4 percent of general fund expenditures in
fiscal 2010 as a result of the recession. Additionally, when
Total Balances
Prior to the start of the recession, states built up fairly significant
you factor out the budget stabilization funds of Texas and
Alaska, the remaining 48 states had budget stabilization
funds of $3.0 billion, representing only 0.5 percent of expen-
balance levels. In fiscal 2006, total balances reached a peak at
ditures. However, these levels have improved since fiscal
$69 billion or 11.5 percent of general fund expenditures. How-
2010, with fiscal 2012 enacted budgets calling for rainy day
ever, the difficult fiscal conditions in fiscal 2009 and fiscal 2010
funds totaling $12.3 billion, which represents 2.1 percent of
resulted in balance levels falling to $30.6 billion, or 4.6 percent
general fund expenditures. (See Table 30)
THE FISCAL SURVEY
OF
S TAT E S
•
FALL 2011
55
TABLE 27
Total Year-End Balances,
Fiscal 1979 to Fiscal 2012
Fiscal
Year
Total Balance
(Billions)
Total Balance
(Percentage of
Expenditures)
2012*
$41.2
6.2
2011*
41.4
6.4
2010*
32.5
5.2
2009
30.6
4.6
2008
59.1
8.6
2007
65.9
10.1
2006
69.0
11.5
2005
46.6
8.4
2004
27.5
4.6
2003
16.4
3.2
2002
18.3
3.7
2001
44.1
9.1
2000
48.8
10.4
1999
39.3
8.4
1998
35.4
9.2
1997
30.7
7.9
1996
25.1
6.8
1995
20.6
5.8
1994
16.9
5.1
1993
13.0
4.2
1992
5.3
1.8
1991
3.1
1.1
1990
9.4
3.4
1989
12.5
4.8
1988
9.8
4.2
1987
6.7
3.1
1986
7.2
3.5
1985
9.7
5.2
1984
6.4
3.8
1983
2.3
1.5
1982
4.5
2.9
1981
6.5
4.4
1980
11.8
9.0
11.2
8.7
—
5.8%
1979
Average
NOTE: *Figures for fiscal 2010 are preliminary actual; figures for fiscal 2011 are based on
appropriated data; figures for fiscal 2012 are enacted.
SOURCE: National Association of State Budget Officers.
56
N AT I O N A L G O V E R N O R S A S S O C I AT I O N
•
N AT I O N A L A S S O C I AT I O N
OF
S TAT E B U D G E T O F F I C E R S
TABLE 28
Total Year-End Balances as a
Percentage of Expenditures,
Fiscal 2010 to Fiscal 2012
Number of States
Percentage
Fiscal 2010
(Actual)
Fiscal 2011
(Preliminary Actual)
Fiscal 2012
(Appropriated)
Less than 1.0%
12
8
12
1.0% to 4.9%
15
18
19
5.0% to 9.9%
13
13
10
10% or more
10
11
9
NOTE: The average for fiscal 2010 (actual) was 5.2 percent; the average for fiscal 2011
(preliminary actual) is 6.4 percent; and the average for fiscal 2012 (appropriated) is 6.2
percent.
SOURCE: National Association of State Budget Officers.
THE FISCAL SURVEY
OF
S TAT E S
•
FALL 2011
57
Figure 4:
Total Year-End Balances Fiscal 1979 to Fiscal 2012
$70
$60
Billions of Dollars
$50
$40
$30
$20
$10
$0
1979
1981
1983
1985
1987
1989
1991
1993
1995
1997
1999
2001
2003
2005
2007 2009
2011
Fiscal Year
SOURCE: National Association of State Budget Officers.
Figure 5:
Total Year-End Balances as a Percentage of Expenditures Fiscal 1979 to Fiscal 2012
12
Total Balance (Percent of Expenditures)
11
10
9
8
7
6
5
4
3
2
1
0
1979
1981
1983
1985
1987
1989
1991
1993
1995
1997
Fiscal Year
SOURCE: National Association of State Budget Officers.
58
N AT I O N A L G O V E R N O R S A S S O C I AT I O N
•
N AT I O N A L A S S O C I AT I O N
OF
S TAT E B U D G E T O F F I C E R S
1999
2001
2003
2005
2007
2009
2011
Changing Balance Levels 2008, 2010, 2012
Figure 6:
Total State Balance Levels 2008
Less than 1 percent (3)
Greater than 1 percent but less than 5 percent (12)
Greater than 5 percent but less than 10 percent (15)
Greater than 10 percent (20)
Figure 7:
Total State Balance Levels 2010
Less than 1 percent (11)
Greater than 1 percent but less than 5 percent (14)
Greater than 5 percent but less than 10 percent (13)
Greater than 10 percent (10)
Figure 8:
Total State Balance Levels 2012
Less than 1 percent (11)
Greater than 1 percent but less than 5 percent (19)
Greater than 5 percent but less than 10 percent (9)
Greater than 10 percent (9)
THE FISCAL SURVEY
OF
S TAT E S
•
FALL 2011
59
Table 29
Total Balances and Balances as a Percentage of Expenditures, Fiscal 2010 to Fiscal 2012
Region/State
Alabama
Alaska
Arizona
Arkansas
California***
Colorado***
Connecticut
Delaware***
Florida
Georgia***
Hawaii
Idaho***
Illinois***
Indiana
Iowa
Kansas
Kentucky
Louisiana
Maine***
Maryland
Massachusetts***
Michigan
Minnesota***
Mississippi
Missouri
Montana
Nebraska
Nevada
New Hampshire
New Jersey***
New Mexico
New York
North Carolina
North Dakota
Ohio
Oklahoma
Oregon
Pennsylvania
Rhode Island
South Carolina**
South Dakota
Tennessee
Texas
Utah
Vermont
Virginia
Washington
West Virginia
Wisconsin
Wyoming
TERRITORIES
Puerto Rico
Total**
Fiscal
2010
Total Balance ($ in Millions)**
Fiscal
2011
Fiscal
2012
Fiscal
2010
Balances as a Percent of Expenditures
Fiscal
Fiscal
2011
2012
$72
8,934
-6
0
-5,342
137
481
537
1,848
1,138
40
31
453
831
709
-27
80
536
1
956
903
189
440
262
445
311
764
314
75
804
572
2,302
387
638
510
414
-174
-294
131
245
107
693
9,226
182
57
428
-466
1,108
71
398
$38
10,281
3
0
-1,206
451
238
798
712
1,131
136
69
1,247
1,182
919
36
290
633
90
1,615
1,901
262
725
252
627
340
815
225
36
693
277
1,376
879
1,383
845
342
51
1,073
196
712
107
655
6,141
204
54
565
-84
1,452
86
577
$38
11,944
14
0
1,313
261
81
646
1,853
1,131
50
3
678
1,220
875
8
122
649
1
1,082
1,622
269
473
87
350
302
553
163
-5
639
235
1,737
371
1,327
402
361
-313
558
203
416
110
323
6,668
211
58
306
-406
1,549
73
571
1.0%
135.3
-0.1
0.0
-6.1
2.0
2.8
17.5
8.7
7.1
0.8
1.2
1.8
6.5
13.4
-0.5
0.9
6.2
0.0
7.1
3.0
2.5
3.0
6.1
5.9
18.1
23.1
9.8
5.3
2.8
10.7
4.4
2.1
40.3
2.0
8.1
-2.7
-1.1
4.6
4.8
9.5
7.3
23.4
4.1
5.3
2.9
-3.1
30.1
0.6
22.7
0.5%
169.2
0.0
0.0
-1.3
6.5
1.3
24.4
3.0
6.6
2.7
2.9
4.8
9.1
17.4
0.6
3.3
8.2
3.2
12.2
5.9
3.0
4.7
5.6
8.1
19.4
24.5
6.8
2.7
2.4
5.3
2.5
4.8
83.8
3.1
6.3
0.8
3.8
6.6
13.8
9.3
6.2
14.9
4.3
4.7
3.7
-0.6
38.5
0.6
36.9
0.5%
162.0
0.2
0.0
1.5
3.6
0.4
18.1
7.9
6.6
0.9
0.1
2.3
8.8
14.6
0.1
1.3
7.9
0.0
7.3
5.0
3.2
2.8
1.9
4.4
16.5
15.9
5.2
-0.4
2.2
4.3
3.1
1.9
66.6
1.4
6.5
-4.4
2.1
6.4
7.3
9.5
2.9
15.1
4.4
4.7
1.8
-2.6
38.0
0.5
36.3
0
$32,451
0
$41,428
0
$41,176
0.0
5.2%
0.0
6.4%
0.0
6.2%
NOTES: NA indicates data not available. *Fiscal 2010 are actual figures, fiscal 2011 are preliminary actual figures, and fiscal 2012 are appropriated figures. **Total balances include both the ending
balance and Rainy Day Funds. ***Ending Balance includes Rainy Day Fund.
60
N AT I O N A L G O V E R N O R S A S S O C I AT I O N
•
N AT I O N A L A S S O C I AT I O N
OF
S TAT E B U D G E T O F F I C E R S
TABLE 30
Total Rainy Day Fund Balances and Rainy Day Fund Balances as a Percentage of Expenditures,
Fiscal 2010 to Fiscal 2012
Region/State
Alabama
Alaska
Arizona
Arkansas
California
Colorado
Connecticut
Delaware
Florida
Georgia
Hawaii
Idaho
Illinois
Indiana
Iowa
Kansas*
Kentucky
Louisiana
Maine
Maryland
Massachusetts
Michigan
Minnesota
Mississippi
Missouri
Montana
Nebraska
Nevada
New Hampshire
New Jersey
New Mexico
New York
North Carolina
North Dakota
Ohio
Oklahoma
Oregon
Pennsylvania
Rhode Island
South Carolina
South Dakota
Tennessee
Texas
Utah
Vermont
Virginia
Washington
West Virginia
Wisconsin
Wyoming
TERRITORIES
Puerto Rico
Total**
Fiscal
2010
Total Balance ($ in Millions)**
Fiscal
2011
Fiscal
2012
Fund Balances as a Percent of Expenditures
Fiscal
Fiscal
Fiscal
2010
2011
2012
$0
10,364
0
0
-6,113
133
0
186
275
116
63
31
0
0
422
0
0
644
0
612
670
2
0
257
260
0
467
0
9
0
278
1,206
150
325
0
373
216
1
112
111
107
453
7,693
210
57
295
95
556
0
398
$0
11,065
0
0
-1,976
157
0
186
279
445
10
0
276
57
437
0
0
647
72
624
1,379
2
9
176
247
0
313
0
9
0
235
1,206
296
386
0
249
16
0
130
0
107
284
5,041
204
54
299
0
659
0
572
$0
11,981
0
0
543
261
0
186
495
445
6
0
276
61
596
0
122
647
46
682
1,275
258
0
87
250
0
421
0
9
0
263
1,306
296
386
247
0
61
140
149
288
107
311
5,882
204
58
304
136
820
0
571
0.0%
157.0
0.0
0.0
-7.0
2.0
0.0
6.1
1.3
0.7
1.3
1.2
0.0
0.0
8.0
0.0
0.0
7.4
0.0
4.6
2.2
0.0
0.0
5.9
3.4
0.0
14.1
0.0
0.7
0.0
5.2
2.3
0.8
20.5
0.0
7.3
3.4
0.0
3.9
2.2
9.5
4.8
19.5
4.7
5.3
2.0
0.6
15.1
0.0
22.7
0.0%
182.1
0.0
0.0
-2.2
2.3
0.0
5.7
1.2
2.6
0.2
0.0
1.1
0.4
8.3
0.0
0.0
8.4
2.5
4.7
4.3
0.0
0.1
3.9
3.2
0.0
9.4
0.0
0.7
0.0
4.5
2.2
1.6
23.4
0.0
4.6
0.3
0.0
4.4
0.0
9.3
2.7
12.3
4.3
4.7
1.9
0.0
17.5
0.0
36.6
0.0%
162.5
0.0
0.0
0.6
3.6
0.0
5.2
2.1
2.6
0.1
0.0
0.9
0.4
9.9
0.0
1.3
7.8
1.5
4.6
3.9
3.1
0.0
1.9
3.1
0.0
12.1
0.0
0.7
0.0
4.8
2.3
1.5
19.4
0.9
0.0
0.9
0.5
4.7
5.1
9.3
2.8
13.3
4.3
4.7
1.8
0.9
20.1
0.0
36.3
0
$21,034
0
$24,154
0
$30,175
0.0
3.4%
0.0
3.7%
0.0
4.5%
NOTES: *See Notes to Table 26. NA indicates data not available. **Fiscal 2010 are actual figures, fiscal 2011 are preliminary actual figures, and fiscal 2012 are appropriated figures.
THE FISCAL SURVEY
OF
S TAT E S
•
FALL 2011
61
Chapter 3 Notes
Notes to Table 30
Rainy Day
Kansas
62
Kansas does not have a "Rainy Day" fund. However, the balanced budget provision of the constitution requires revenues to
finance the approved budget.
N AT I O N A L G O V E R N O R S A S S O C I AT I O N
•
N AT I O N A L A S S O C I AT I O N
OF
S TAT E B U D G E T O F F I C E R S
Other State Budgeting Changes
CHAPTER Four
Enacted Changes to Budgeting and Financial
Management Practices
Enacted Changes in Aid to Local
Governments, Fiscal 2012
For fiscal 2012, a number of states enacted changes to their
A large number of states reported changes to the amount of
financial management practices ranging from the consolidation
aid that was directed to local governments. Although the man-
and reorganization of state agencies and programs to trial ef-
ner in which states reduced aid may have differed, the overall
forts with zero based budgeting. The most commonly cited
effect was largely the same; keeping funds at the state level in
change was a reorganization or consolidation of state agencies.
order to help satisfy the increasing demand for state services
Some states eliminated programs or agencies while others
in the face of slowly rising tax revenues. While a majority of
chose to take multiple agencies or programs and fold them into
states reduced such aid, there were some examples of states
each other in hopes of achieving efficiency savings. Some
increasing local aid. (See Table 32)
states made changes to their pension and health insurance
policies. Such changes almost always resulted in state employees having to pay a higher cost of their health insurance premiums or contributing a higher percentage towards their pension.
Also, a few states reported initial exercises in zero-based budgeting that are expected to impact future state budgets. (See
Table 31)
THE FISCAL SURVEY
OF
S TAT E S
•
FALL 2011
63
Table 31
Enacted Changes to Budgeting and Financial Management Practices
Connecticut
Some agencies have been consolidated, across many areas of government, including higher education, health
and human services, public safety, etc. Also, business office functions (fiscal, purchasing, capitol, human resources, etc.) for some state agencies have been absorbed centrally by the Department of Administrative Services.
Labor concessions to achieve $700 million in savings through various reductions such as wage freezes and
benefit changes. The agreement also mandates job security for all union members until June 30, 2015.
Delaware
Legislation was enacted to reform pension and health care for state employees. This legislation is expected
to generate approximately $500 million in savings over a 15 year period. A new Delaware Budget System
(DBS) was implemented by the Office of Management and Budget for use in constructing the FY 2012 budget.
Georgia
Office of Planning and Budget (OPB) will examine 10 percent of programs within each of the Governor's policy
areas for Zero Based Budgeting Analysis.
Hawaii
Act 163, SLH 2011, changed the pension benefit structure for new hires beginning July 1, 2012, including
increasing member's contribution rate, increasing the vesting period, increasing the age and service requirements and reducing the benefit multiplier of retirement benefits. Act 29, SLH 2011, established a moratorium
on enhancement of pension benefits until the funded ratio is 100 percent.
Idaho
Governor's Zero-Based Budgeting (ZBB) initiative: ZBB examines the base budgets of each area of state
government in search of efficiencies and best practices. We are currently in the fifth year of a six year cycle.
Illinois
The legislature has convened hearings to review Illinois' business tax structure and incentive programs.
In February 2011, the Governor signed into law Public Act 096-1529, which was a further expansion of an
already historic performance budgeting reform in Illinois (Public Act 096-0958). Public Act 096-1529 further
expanded on Public Act 096-0958, by requiring that the budget process begin by determining the revenue
available for the coming year, and after deducting the cost of essential government services, assigning a percentage of the remaining funds to statewide prioritized goals.
With the backing of a Senate Committee, Illinois has convened a steering committee to develop a business
plan and RFP for the purpose of implementing an ERP system.
Indiana
The Department of Toxicology was transferred from the Indiana University School of Medicine to a standalone state agency. The Indiana Tobacco Prevention and Cessation Board was abolished, and the functions
were merged into the Indiana State Department of Health. Implemented civil service reform, updating the
State Personnel Act of 1941. Civil service modernization codified much of the performance-based culture
that had been implemented administratively since 2005. The State Budget Agency is currently implementing
Hyperion, a new budgeting system that will be seamlessly integrated with the PeopleSoft financials system.
Kansas
Six state agencies were merged elsewhere.
Maine
Task Force established by Legislature to streamline and prioritize core government services that will achieve
at least $25 million in permanent savings effective with FY 2013. The administration's policy is to continue its
effort to reduce the size of the state's work force. The administration's plan is to continue its efforts to achieve
further tax reductions and reduce spending. Zero based budgeting approach to be used for developing the
2014-2015 biennial budget. This preparatory effort may result in expenditure reductions and / or revenue savings
in FY 2012 and FY 2013. Effective with the 2011-2012 budget the Bureau of the Budget changed the State's
Budget and Financial Management System by requiring departments and agencies, working in conjunction
with the Office of Information Technology, to identify and budget for all of their technology related expenditures
utilizing a new budget template for recording the technology data in the state's automated budget system.
Table 31 continues on next page.
64
N AT I O N A L G O V E R N O R S A S S O C I AT I O N
•
N AT I O N A L A S S O C I AT I O N
OF
S TAT E B U D G E T O F F I C E R S
Table 31
(Continued)
Enacted Changes to Budgeting and Financial Management Practices
Maryland
The State made numerous changes to its pension and health benefits plans including employee contribution
levels and benefits received. Additional details may be found at www.dbm.maryland.gov.
Michigan
The fiscal 2012 budget recognizes various organizational changes under Executive Order 2011-4, including
further consolidation of economic development and workforce development programs within the Michigan
Strategic Fund and creation of the Michigan Administrative Hearings System as an independent and autonomous agency within the Department of Licensing and Regulatory Affairs to centralize statewide administrative hearing functions.
Effective November 2010 through September 30, 2012, all state employees contribute 3 percent of their
compensation to the retiree health care fund (Public Act 185 of 2010). Contributions are currently in escrow
pending the outcome of litigation. Effective October 2011 and each subsequent fiscal year, $280 million is
earmarked to pay unfunded retiree health care obligations. Effective October 2011, employee concession
contingency plans are implemented to meet savings required by the fiscal 2012 budget including the elimination of 367 funded vacancies, potential employee contributions to defined benefit pension system, collectively-bargained Corrections reforms savings, and a minimum of four furlough days for represented state
employees. Effective January 2012, the state income tax of 4.35 percent is imposed on public pensions
(Public Act 38 of 2011). Implementation of the pension tax is dependent on constitutional questions pending
before the Michigan Supreme Court.
Effective for the fiscal 2012 budget, revenue forecasts are required to include 5 fiscal periods: the fiscal year
in which the revenue estimating conference is being held and the next two ensuing fiscal years, plus revenue
trend line projections for the next two ensuing fiscal years. In addition, the May revenue estimating conference
must include expenditure forecasts for Medicaid expenditures and for human services caseloads and expenditures for the fiscal year in which the conference is being held and the next two ensuing fiscal years (Public
Act 47 of 2011).
Effective with the fiscal 2012 budget, two "omnibus" budget bills are enacted; one bill includes all departmental
operations, the other bill is comprehensive to education. The enacted budget is a two-year spending plan
with fiscal 2012 appropriations and fiscal 2013 anticipated appropriations to allow for more long-term strategic
planning. Agency-specific performance measures are key to the Governor's focus on managing for results
and are transitional. A process is underway to develop detailed balanced scorecards for each agency.
Minnesota
Enacted statewide reform initiatives to improve government operations, including consolidation of executive
branch IT activities. Establishment of a sunset commission to recommend continuation, abolition or reorganization of state agencies. Authority to issue performance bonds; issuance of RFPs for services to improve
procurement, building and fleet management; mandated statewide performance appraisal system. New accounting system went online July 1, 2011.
Missouri
Targeted reviews of expenditures; Medicaid cost containment; State employee health care cost containment.
Nevada
The departments of personnel and information technology were folded into the Department of Administration.
Divisions of the Department of Cultural Affairs (Museums and History, Library and Archives, Historical Preservation, etc.) were folded into other departments.
The 2011 – 2013 Executive Budget included a Priority and Performance Budget in addition to the traditional
line item budget. Going forward, the Governor's Executive Budget was given permission to include programbased budgeting in addition to the still-required line item budgeting. The bill can be found online at
http://leg.state.nv.us/Session/76th2011/Bills/AB/AB248_EN.pdf
Changes were made to our automated budget and financial system to accommodate performance budgeting.
Table 31 continues on next page.
THE FISCAL SURVEY
OF
S TAT E S
•
FALL 2011
65
Table 31
(Continued)
Enacted Changes to Budgeting and Financial Management Practices
New Mexico
New Administration did not perform across the board cuts for departments.
North Carolina
Consolidation of three public safety departments, Crime Control and Public Safety, Correction and Juvenile
and Delinquency Prevention.
Ohio
Authority was granted to sell up to 6 state correctional facilities to private operators. Also, many economic
development activities were transferred to a newly created non-profit entity outside of state government.
Major adjustments were made to the state's public employee collective bargaining law. Changes included a
floor for percentage of health insurance costs paid by employees, prohibition against government entities
paying employee share of pension contributions, and limitation of the scope of collective bargaining to wage
issues, with the exception of fire and police who could negotiate safety equipment. The change is currently
on hold as it is subject to voter referendum in the November 2011 election.
As part of the FY 2012-13 biennial budget process the expenditures and activities of all state agencies were
closely scrutinized and significant reductions in appropriations occurred to address a projected $7.7 billion
General Revenue Fund imbalance.
Oklahoma
By the Governor's initiative, have begun the process to flatten and "right-size" government. This legislative
session brought about a major consolidation of five (5) agencies, folding other service oriented agencies into
the Office of State Finance.
Oklahoma has also taken the first steps to require that all payments to vendors be made by electronic payment
processing.
Oregon
The 2011-13 Legislatively Adopted Budget included a "supplemental ending balance" due to uncertainty regarding the state's overall economic situation. This ending balance was created by holding back 3.5 percent
of the General and Lottery Fund budgets from agency budgets. Agencies are instructed to expend 54 percent
of the budgets during the first fiscal year (essentially maintaining a regular burn rate). The supplemental ending
balance will be held until the February 2012 session following the results of a General Fund revenue forecast.
South Dakota
South Dakota enacted a 10 percent targeted general fund cut or more to the FY2012 budget to all agencies
in state government.
Texas
Texas Youth Commission and Texas Juvenile Probation Commission incorporated into Texas Juvenile Justice
Department, Department of Rural Affairs consolidated into Department of Agriculture. Legislature continued
Small Business Tax Exemption beyond FY 2011 Sunset date. Legislature continued funding Texas Enterprise
and Emerging Technology economic development programs. The Legislature adopted Senate Bill 1 during a
special called session. The bill included provisions: 1) A one-day deferral of state payments to school districts
will result in a one-time savings of $2.3 billion in fiscal year 2013; 2) Changes to the calculation of Foundation
School Program (FSP) formulas estimate savings of approximately $2.0 billion each year will be achieved in
the 2012-2013 biennium; 3) Legislature continued small business tax exemption beyond FY 2011 sunset
date; 4) Legislature continued funding Texas Enterprise and Emerging Technology economic development
programs; and 5) the Legislature adopted various tax speed ups, revenue enhancements and cost control
measures.
Vermont
Executive driven strategic planning process underway. Three percent pay cut as well as employee retirement
contribution rate increased by 1.3 percent. Also, legislative budget bill language to increase focus on performance measures. Also, executive implementation in FY 2014 of new budget system to include performance
measures.
66
N AT I O N A L G O V E R N O R S A S S O C I AT I O N
•
N AT I O N A L A S S O C I AT I O N
OF
S TAT E B U D G E T O F F I C E R S
Table 32
Enacted Changes in Aid to Local Governments, Fiscal 2012
Arizona
Require counties to transfer money to the General Funds—increases cash contribution from counties from
$34.6 million in FY 2011 to 38.6 million in FY12; $38.6 million shifting from local to state via VLT; $23.6 million
from shifting DPS funding to HURF.
California
Pursuant to the 2011 public safety realignment, Chapter 15, Statutes of 2011 (AB 109) as subsequently
amended by Chapter 35, Statutes of 2011 (AB 117), people who are sentenced or released to supervision
on or after October 1, will be the responsibility of the counties. Realignment is expected to reduce the state
prison population by 39,750 or 24.5 percent. To fund this population realignment, the state is proposing to
provide $400 million in 2011-12, $33 million of which would be provided on a one-time basis, through a redirection of tax resources to local governments.
AB 118 (Chapter 40, Statutes of 2011) sets forth allocation methods and various technical requirements for
the programs affected by the realignment plan that was enacted in the 2011 Budget Act. Pursuant to this
legislation trial court security would be realigned to county sheriffs, who under existing law are responsible for
providing court security in all but two counties. Funds will be reduced from the trial court budget and allocations will be made to sheriffs based on 2010-11 allocation amounts adjusted for inflation. The amount to be
allocated in 2011-12 is $496 million.
Due to the expiration of a variety of short-term tax increases as of June 30, 2011, the state deferred an additional $2.1 billion in payments to K-14 education agencies from FY 2012 to FY 2013, approximately 6 percent of the state's K-14 General Fund Support.
The Budget includes a major realignment of public safety programs from the state to local governments, which
totals $5.6 billion in FY 2012. The Budget funds the $5.6 billion realignment by dedicating 1.0625 cents of the
existing state sales tax rate ($5.1 billion) and by redirecting a portion of vehicle license fee revenues ($453.4 million). The realignment moves program and fiscal responsibility to the level of government that can best provide
the service, eliminating duplication of effort, generating savings, and increasing flexibility. Realigned programs
include local public safety programs, mental health, substance abuse, foster care, child welfare services, and
adult protective services. This also includes shifting lower level offenders and parole violators to local jurisdictions.
This realignment effort became effective July 1, 2011 and is intended to be permanent.
Of the $400 million allocated to local governments in 2011-2012, $33 million will be provided on a one-time
basis to provide for the training and retention of local government employees and to allow for community corrections partnership planning. A Constitutional Amendment passes by voters is necessary to provide local
governments with funding to implement the 2011 public safety realignment. The $496 million in court security
funding will be supported by sales tax revenues provided to county sheriffs. The suspended/deferred mandate
payments in FY 2011-2012 resulted in approximately $233M or 83 percent of reimbursement payments deferred to future years. As a result of the FY 2012 K-14 education deferrals, school and community college
districts will be required to borrow $2.1 billion (6 percent of General Fund support) in additional funds to support local operations or use their reserves to cover the shortfall for FY 2012.
Colorado
In FY 2011-2012 a total of $71 million is scheduled for transfer to the General Fund from Severance Tax and
Federal Mineral Lease Revenues that would otherwise have been distributed to mineral development impacted
communities via grants through the Department of Local Affairs.
Connecticut
Several taxes (sales, hotel, real estate conveyance and the rental car surcharge) were increased in calendar year
2011, with a portion of the increase dedicated to municipalities. The P.I.L.O.T. Manufacturing, Machinery and
Equipment grant program was revised, reducing grants from the program. In addition, the FY 2011 municipal
real estate conveyance tax rate was set to sunset to a lower rate July 1, 2011. The FY 2011 rate was instead
made permanent. Lastly, a fine increase for failure to register a motor vehicle is anticipated to result in additional
FY 2012 revenues for municipalities. These changes will yield an estimated $73.0 million in additional revenue for
municipalities in FY 2012.
Table 32 continues on next page.
THE FISCAL SURVEY
OF
S TAT E S
•
FALL 2011
67
Table 32
(Continued)
Enacted Changes in Aid to Local Governments, Fiscal 2012
Florida
Effective July 1, 2011, the employer contribution rates for the Florida Retirement System (FRS) were reduced
for the state Fiscal Year 2011-2012. Counties and other local government entities participating in the FRS
are expected to save $706.5 million during the fiscal year. The reduction is roughly 50 percent of the amount
of employer contributions paid by those entities during Fiscal Year 2010-2011.
Hawaii
Act 103, SLH 2011, limited the amount of transient accommodations taxes distributed to the counties to $93
million per fiscal year from FY 2012 to FY 2015.
Maine
State-Municipal Revenue Sharing. The State provides funds to municipalities to stabilize the municipal tax
burden and to aid in financing all municipal services. Revenue sharing payments were reduced by a fixed
amount that will be transferred to the General Fund as undedicated revenue. The revenue transfer amount
for FY 2012 is $40 million. The Tax & Rent Circuit Breaker program provides property tax relief to certain low
and middle residents & renters is limited to 80 percent of the amount resulting in a $10 million decrease to
benefits and expenditure reduction to the General Fund. The Homestead Reimbursement program helps
offset the effect on local property tax burdens arising from the municipal exemption of certain homestead
property of qualified residents. Funding was increased $7.4 million in FY 2012 from fiscal year 2011 levels to
account for a change in mil rates and for a projected increase in the number of exemptions. General Purpose
Aid to Local Schools- K-12 Education. Funding was decreased by -$55 million in FY 2012 which reduces the
State share funding of K-12 public education from 55 percent for essential programs and services to 46.19
percent. The Tree Growth Tax Reimbursement program helps restrain municipal property tax rates for towns
which experience a substantial tax shift due to the mandated use of (lower) current use values in place of
(higher) ad valorem values for assessing classified forest land. The funding was increased by $2.7 million over
fiscal year 2011 amounts to cover a projected increase in requests for reimbursement.
Maryland
The 2012 Budget provides for an increase in local aid of $87.1 million or 1.4 percent offset by shifting $55
million in costs to local governments. Transferred obligations include 90 percent of the cost of property valuation ($34 million), a portion of the cost to educate certain children in State custody ($4 million) and $17 million
in administrative fees for the Pension system.
Massachusetts
The fiscal 2012 budget provides $4.88 billion in state-funded local aid to municipalities. The budget includes
state funding for chapter 70 education aid of $3.99 billion, an increase over the $ 3.85 billion in state funding
for chapter 70 in fiscal 2011. Municipalities will see a reduction in total Chapter 70 funding received, as $75.3
million of federal State Fiscal Stabilization funds provided for through the American Recovery and Reinvestment
act for Chapter 70 education aid in fiscal 2011 were not available in fiscal 2012. The fiscal 2012 budget level
funded unrestricted general government aid at $898 million. The $898 million included $833 million appropriated directly for unrestricted general government aid, and an additional $65 million pursuant to a provision in
the fiscal budget which reserved and allocated $65 million of the fiscal 2011 surplus to local aid in fiscal 2012.
On July 12, 2011, Governor Patrick signed municipal health care reform legislation that will provide significant
and immediate savings to cities and towns, while preserving a meaningful role for organized labor in the
process and protecting health care quality for retirees and municipal employees. The municipal health care
reform law could help communities collectively save more than $100 million. Cities and towns now have the
choice of a new, expedited process to implement changes to existing local health care plan design or join the
state’s health insurance pool. This reform is one of the most significant measures to assist cities and towns
in the past 30 years. The bill builds on the Patrick-Murray Administration's success in reducing rising health
care costs for thousands of small businesses and working families across the Commonwealth, and is an important step in the Administration's efforts to bring health care system costs down.
Table 32 continues on next page.
68
N AT I O N A L G O V E R N O R S A S S O C I AT I O N
•
N AT I O N A L A S S O C I AT I O N
OF
S TAT E B U D G E T O F F I C E R S
Table 32
(Continued)
Enacted Changes in Aid to Local Governments, Fiscal 2012
Michigan
Effective for fiscal 2012, beginning October 1, 2011: per pupil funding for K-12 education (-$452.5 million,
-4.1 percent); discretionary/non-mandated K-12 programs (-$85.6 million, -100 percent); elimination of statutory revenue sharing, with funding to create incentive-based program (-$92 million, -32 percent); revenue
sharing payments to counties (-$51.8 million, -34 percent); community mental health non-Medicaid (-$8.5
million, -3 percent); funding to local health departments (-$1.7 million, -5 percent); various payment-in-lieuof-taxes programs (-$1.6 million, -15 percent)
Effective January 1, 2012, certain limits are imposed on the portion of employees' medical benefit plan coverage paid for by public employers such as a school district, city, county, or township. Payments are limited
to capped amounts tied to medical inflation, or split on a proportional basis with the employer paying no more
than 80 percent. A local unit may exempt itself from these requirements with a two-thirds vote of its governing
body (Public Act 152 of 2011).
Minnesota
In FY 2012 enacted changes reduced aids to local governments $242 million (23.2 percent). Reductions included cuts to general city aid, ($102 million; 19.4 percent) and general county program aid ($36 million; 18.4
percent). Additionally the market value credit program in which property owners receive property tax credits
and then the state reimburses local governments for the reduced revenue was eliminated. Due to timing of
the program, in FY 2012 property owners will still receive the credit but the state reduced its reimbursements
to local governments by $104 million (39 percent); the program is completely eliminated in FY 2013.
The legislature enacted several changes affecting local government finances. These changes include the authorization of local option sales tax of 0.5 percent for six cities, the extension of sales tax authority for a regional
center and the authorization of a sales tax increase for one city. Additionally, legislation included a reduction
to maintenance of effort obligations of current year requirements for counties as long as the reduction would
not affect federal funding or trigger an increase in state payments. This provision is effective for one year. Estimates of actual dollar impacts for these provisions are not available.
Missouri
Changes include a decrease to County Assessment Maintenance of $1.3 million or 10.8 percent.
Montana
SB 372 Lowers the property tax rate on the first $2 million in Business Equipment. This reduces the local government tax base by 1.25 percent. This loss is reimbursed by the state. This is estimated to increase transfers
to local governments by $5.8 million in TY 2012. HB 495 freezes the growth rate of entitlement share transfers
to local governments for FY 2012 and FY 2013. This reduces transfers by $5.6 million in FY 2012 (0.5 percent
of the local property tax base) and $8.4 million in FY 2013 (0.8 percent of the local property tax base).
Nebraska
State General Fund Only (All July 1, 2011 – June 30, 2012):
•
Aid to K-12 Schools: $5.1; 0.01 percent
•
Aid to Counties: -$9.67 million; -100 percent
•
Aid to Cities: -$10.96 million; -100 percent
•
Aid to Natural Resources Districts: -$1.44 million; -100 percent
•
Homestead Exemption Reimbursement: $7.3 million; 11.2 percent
Table 32 continues on next page.
THE FISCAL SURVEY
OF
S TAT E S
•
FALL 2011
69
Table 32
(Continued)
Enacted Changes in Aid to Local Governments, Fiscal 2012
New Jersey
Municipal Aid
Reduced Transitional Aid to Localities program funding by $149 million (94 percent) to $10 million. This program provides assistance to municipalities facing fiscal distress, primarily aiding the state’s large urban centers.
On July 18, 2011, Governor Christie announced his commitment to restore funding to the Transitional Aid
program through new legislation proposed by his Administration. The Administration expects the legislature
to restore $139 million; in this case, the reduction from FY 2011 would be $10 million (6 percent).
Other Local Aid
Reduced Local Transportation Project Aid by $10 million (5 percent) to $190 million. This program supports
transportation improvements on municipal and county roads. Reduced County College Aid by $3.4 million to
$204 million (2 percent). This program provides aid to the county college system, including funding for operating aid, fringe benefits, and debt service funding. Reduced Aid to County Psychiatric Hospitals by $13.1
million (9 percent) to $131.7 million. This program supports patients in county psychiatric hospitals by reimbursing allowable costs incurred by counties. Eliminated County Solid Waste Program ($16.2 million). This
program provided aid to counties’ solid waste treatment and removal systems.
P.L.2010, c.44
This law, passed in FY 2011, reduced the school district, county, and municipal property tax levy cap from 4
percent to 2 percent and permits unused school district, county, and municipal increases to be banked for
three succeeding years. However, this change did not take effect until this year, impacting local budgets corresponding to the State’s FY 2012.
P.L.2010, c.105
This law revises the arbitration procedure for police and fire contract disputes and imposes a “cap” on certain
arbitration awards. It will reduce the growth of municipal public safety employee compensation and the related
growth in municipal budgets.
P.L. 2011, c.78
This law introduces reforms that will reduce pension and health benefits costs for local governments, including
those at the school district, county, and municipal levels. The reforms include changes to benefits for new
pension system enrollees, increases in employee contribution rates for pension and health benefits for current
employees, and suspension of automatic cost-of-living adjustments for pension benefits for all current and
future retirees. The combined effect of these reforms is expected to provide immediate and long-term reduction in cost growth in the State and local pension and health benefit systems.
New York
The 2011-12 Enacted State Budget will have an estimated $1.4 billion negative impact on municipalities in
local fiscal years ending in 2012—the first full-annual local fiscal year affected by changes by the Enacted
Budget.
Major Enacted State Budget program changes include the following:
•
Reduced funding for School Districts in the 2011-12 school year ($1.3 billion).
•
Human services programs net of savings actions ($84 million).
•
Personal income tax and sales tax collection initiatives expected to generate additional revenue for local
governments ($58 million).
•
Eliminated funding for Optional General Public Health Work Services ($33 Million).
•
Reduced Aid and Incentives for Municipalities (AIM) funding for cities, towns and villages ($15 million).
Table 32 continues on next page.
70
N AT I O N A L G O V E R N O R S A S S O C I AT I O N
•
N AT I O N A L A S S O C I AT I O N
OF
S TAT E B U D G E T O F F I C E R S
Table 32
(Continued)
Enacted Changes in Aid to Local Governments, Fiscal 2012
In addition, the Enacted State Budget continues $2.4 billion in fiscal relief for counties and New York City
under the State’s cap on local Medicaid expenditures and takeover of the Family Health Plus program. Counting this assistance, the total fiscal impact on local governments in 2010 is a positive $973 million.
The 2011-2012 Enacted State Budget will have an estimated $1.4 billion negative impact on municipalities
in local fiscal years ending in 2012—the first full-annual local fiscal year affected by changes in the Executive
Budget. School districts outside of New York City will experience a $863 million negative impact in the 201112 school year driven mostly by a $844 million reduction in School Aid. School districts will also incur increased
costs related to the State shifting a portion of its cost of overseeing the room and board of students who are
placed in residential schools by a CSE ($17 million). New York City will experience a $505 million negative impact in CFY 2011-12. In addition to a $461 million reduction in school aid, the City will also be negatively impacted in other areas including: $66 million for human services programs; $14 million from discontinuing
reimbursement for certain optional public health programs; $2 million for mental health programs; and $2 million for criminal justice programs. These reductions are partially offset by $40 million in PIT and sales tax receipts due to a statewide tax modernization initiative and Early Intervention program reforms that will reduce
City spending with estimated savings of $1 million. County governments are projected to experience a $14
million negative impact, primarily due to: $20 million from eliminating reimbursement for certain optional public
health programs; $3 million in reductions for criminal justice programs; $3 million in reductions for mental
health programs; $2 million in reductions to Madison and Oneida Counties; and $3 million in reductions for
other programs. These funding reductions will be partially offset by $13 million in sales tax receipts due to a
statewide tax modernization initiative and $4 million in savings from Early Intervention program reforms. Other
cities, towns and villages will experience an overall $18 million negative impact in local fiscal years ending in
2012, mostly due to a $15 million reduction in AIM funding. The Enacted State Budget continues $2.4 billion
in fiscal relief for counties and New York City under the State’s cap on local Medicaid expenditures and
takeover of the Family Health Plus program. Counting this assistance, the total fiscal impact on local governments in 2012 is a positive $973 million.
North Dakota
For the 2011-2013 biennium, mill levy reduction grants were increased by $42.6 million, or 14.2 percent, and
state school aid grants were increased by $93.3 million, or 10.2 percent.
Ohio
Payments through the Local Government Fund (LGF) were reduced from 3.68 percent of total state GRF tax
revenue to 75 percent of the FY 2011 allocation for 2012 and 50 percent of the FY 2011 allocation in FY
2013 (estimated FY 12 savings $152 million). Payments to local libraries were limited to 95 percent of the
amounts provided in FY 2011 in both FY 2012 and 2013 (estimated FY 2012 Savings $35.0 million).
Oregon
Total state funding for K-12 schools increased by $426 million (8.6 percent) for the 2011-13 biennium compared to the previous biennium. This increase includes General Fund backfill to replace $342.6 million in ARRA
funding in 2009-2011. State support for community colleges was reduced by $7.2 million (1.7 percent). Local
community college districts will determine how the funds are expended. State funding for community corrections increased $1.7 million between 2009-11 and 2011-13, or 0.8 percent. Funding for Alcohol and Drug
Prevention was reduced $0.5 million (4.2 percent). Funding for Gambling Treatment and Prevention increased
$0.1 million (1.5 percent).
Vermont
Aid to local educational authorities reduced by $23 million, via elimination of ARRA federal education aid.
Virginia
Certain programs within the Aid to Localities FY 2012 budget was reduced by a total of $60 million dispersed
across localities.
Table 32 continues on next page.
THE FISCAL SURVEY
OF
S TAT E S
•
FALL 2011
71
Table 32
(Continued)
Enacted Changes in Aid to Local Governments, Fiscal 2012
Washington
A 4 percent reduction was made to each of the following local revenue-sharing items for both FY 2012 and
2013. The annual dollar amount of the cut follows each item: Liquor Board Profits -$1.2 million; Liquor Excise
Tax -$.9 million; County Criminal Justice Assistance -$1.2 million; City Criminal Justice Assistance -$.5 million;
Streamlined Sales Tax Mitigation -$.9 million; City-County Assistance Account -$.3 million
Wisconsin
The following changes were made in 2011 Wisconsin Act 32 to state support for school aid: (a) general equalization aid was reduced by $390.5 million (8.1 percent) in FY 2012 compared to FY 2011, although districts
may receive a minimum of 90 percent of prior year aid, rather than 85 percent; (b) across-the-board cuts of
10 percent were applied to most categorical aid programs, resulting in an overall reduction of $7.5 million;
and (c) several categorical aid programs were eliminated, resulting in a $29.9 million reduction. Parental choice
programs were expanded, affecting general school aid to two school districts. Schools outside the city of
Milwaukee may now participate in the Milwaukee parental choice program, which may increase the number
of participating pupils and decrease equalization aid to the Milwaukee school district (unknown fiscal effect).
A parental choice program was created in Racine, which will result in an estimated reduction of $618,400 in
equalization aid to the Racine Unified School District. Youth aids to counties for juvenile corrections were reduced by $9.8 million (10 percent) annually compared to FY 2011 levels. The payments for municipal services
program funding, which reimburses local governments for services provided to state property, was reduced
by $2.0 million (10 percent) compared to the FY 2011 level. From other funds, the financial
assistance for local government recycling programs, which is funded from the recycling and renewable energy
fund, was reduced by $20 million (63 percent) in FY 2012 compared to FY 2011; and from the transportation
fund, general transportation aids to counties are reduced by 9.39 percent for calendar year 2012, aids to
municipalities are reduced by 6.97 percent in calendar year 2012 and mass transit operating aids are reduced
by 10 percent for calendar year 2012 (FY 2012 impact is a $169,300 reduction for general transportation
aids and a $373,200 reduction for transit operating aids) and Local Roads Improvement Program - Discretionary program funding was increased by $5 million in FY 2012.
For purposes of calculating school district revenue limits (which limit the amount of revenue a district can
raise from a combination of property takes and state general aid), base revenues were reduced 5.5 percent
for property tax levies set in 2011. Districts with per pupil limits below $9,000 after the cut are permitted to
raise revenues up to $9,000 per pupil. A new state aid program for FY 2012 provides $6.2 million to match
amounts between $8,900 and $9,000 per pupil for districts receiving the adjustment to $9,000. Exceptions
to the limits for pupil transportation, school nurses and school safety were eliminated (these were due to be
effective in FY 2012). Exceptions to the limits for refunded an rescinded taxes and for prior year hold harmless
adjustments were created. The county and municipal levy limits reduced the minimum increase allowed from
3 percent to 0 percent and extended the limits for all future years. Other changes included repealing the maintenance of effort requirement for counties and municipalities to maintain emergency services expenditures at
or above 2009 levels, and for municipalities, the expenditure restraint program budget test was modified,
which will affect eligibility. Local government transportation mandates include: prohibiting a county from using
its own workforce to perform a highway improvement project on a highway under the jurisdiction of another
county or municipality, unless part of the project lies within the county doing the work; require local governments to require sealed competitive bids, awarding the bid to the lowest responsible bidder; prohibit local
governments from using its own workforce to perform a construction project for which a private person is financially responsible.
72
N AT I O N A L G O V E R N O R S A S S O C I AT I O N
•
N AT I O N A L A S S O C I AT I O N
OF
S TAT E B U D G E T O F F I C E R S
Appendix
TABLE A-1
Enacted Mid-Year Revenue Changes by Type of Revenue, Fiscal 2011
State
Tax Change Description
Fiscal 2011
Revenue
Changes
($ in Millions)
Effective
Date
SALES TAXES
Arkansas
Massachusetts
New Mexico
Sales tax holiday for clothing and school supplies (ACT 757)
The impact of a two-day sales tax holiday held on August 14-15, 2010
Increase state gross receipts and compensating tax rate by 0.125 percent and
eliminate compensating tax loophole
03-11
-$2.1
-19.9
07-10
71.8
Total Revenue Changes—Sales Tax
$49.8
PERSONAL INCOME TAXES
Arkansas
California
Illinois
Minnesota
Ohio
Puerto Rico
Income tax relief for certain head of household tax payers with
2 or more dependents. (ACT 736)
Conformity: Health care (exclusion or deduction for kids < age 27)
Ch. 17/2011 (4/7/11) AB 36
Two percent tax rate increase authorized by PA 096-1496
Federal Conformity
Delay in previously enacted income tax reduction for fiscal years 2010-11,
retroactively enacted late in 2009. The reduction is programmed into the
FY 2012-13 budget at an estimated value of $446 million per year.
Income Tax Credit to individual and corporate taxpayers
01-11
-$3.7
04-10
01-11
03-11
-4.8
2,884.0
-9.3
11-10
400.0
-414.0
Total Revenue Changes—Personal Income Taxes
$3,266.2
CORPORATE INCOME TAXES
Illinois
Maine
Minnesota
Puerto Rico
Virginia
2.2 percent tax rate increase authorized by PA 096-1496
Revenue loss from conformity with Federal IRS tax code
Adopts new process for calc sales apportionment factor C Corps
Federal Conformity
Income Tax Credit to individual and corporate taxpayers
Federal Tax Conformity
01-11
$180.0
-4.5
2.9
-3.8
-91.0
-14.9
03-11
11-10
01-11
Total Revenue Changes—Corporate Income Taxes
$159.6
CIGARETTE AND TOBACCO TAXES
New Mexico
Increase Cigarette Tax per $0.75 per pack
07-10
$35.8
Total Revenue Changes—Cigarette and Tobacco Taxes
$35.8
Table A-1 continues on next page.
THE FISCAL SURVEY
OF
S TAT E S
•
FALL 2011
73
TABLE A-1
(Continued)
Enacted Mid-Year Revenue Changes by Type of Revenue, Fiscal 2011
State
Tax Change Description
Effective
Date
Fiscal 2011
Revenue
Changes
($ in Millions)
01-11
$505.0
OTHER TAXES
Puerto Rico
Temporary excise tax imposed at a declining rate
(from 4 percent for 2011 to 1 percent for 2016).
Special Property Tax term reduction
Total Revenue Changes—Other Taxes
$0.0
FEES
Maine
Excludes tel-com tower with antenna from BETE program
One time hospital assessment
Total Revenue Changes—Fees
$4.7
SOURCE: National Association of State Budget Officers.
74
N AT I O N A L G O V E R N O R S A S S O C I AT I O N
$0.5
4.2
•
N AT I O N A L A S S O C I AT I O N
OF
S TAT E B U D G E T O F F I C E R S
TABLE A-2
Enacted Mid-Year Revenue Measures, Fiscal 2011
State
California
Kansas
Maine
Minnesota
Missouri
Nevada
Rhode Island
Description
Income—Enforcement: Tax Shelter Amnesty—
Ch. 14/11 (3/24/11) SB 86
Income—Use federal TANF dollars to pay for part of the state's
earned income tax credit
Other—Increase cap on milk subsidy
Other—Additional transfer from revenue sharing
Other—Establishes ceiling for transfer of GF Racino $ to DHHS
increasing amount to GF
Other—Additional transfer to Maine Milk pool
Other—Adjust Milk Handling Fee increasing GF revenue
Other—Sale of State owned buildings
Other—Additional transfer from revenue sharing
Other—Implement Mega Millions lottery game
Income—changes tax increment financing deposit date
Income Tax collection initiative
Sales—Release legislatively delayed refunds in FY 2011
Corporate Income—Release legislatively delayed refunds in FY 2011
Income—Tax Credit redemptions anticipated to be lower than originally
forecast based on economic conditions. Also, more carefully review all
tax credits before they are authorized.
Fees
Lottery—Restoration of Newport Grand's Marketing Funds
Other Taxes—DOH: Influenza Hospitalization Surveillance Project
Other Taxes—DOH: Grant Cancer Registration Research
Fees—Bond Proceeds from State Police Headquarters Project
Effective
Date
Fiscal 2011
Recommended
Changes
($ in Millions)
08-11
$270.0
01-11
3.4
-0.6
2.9
03-11
03-11
0.9
-4.0
0.8
1.5
10.0
1.5
0.7
9.5
-133.9
-72.0
07-10
07-10
07-11
07-11
07-11
07-11
47.0
73.6
-0.2
0.1
0.0
2.3
Total
$211.2
THE FISCAL SURVEY
OF
S TAT E S
•
FALL 2011
75
TABLE A-3
Enacted Revenue Changes by Type of Revenue, Fiscal 2012
State
Tax Change Description
Effective
Date
Fiscal 2012
Revenue
Changes
($ in Millions)
07-11
-$20.8
07-11
08-11
07-11
07-11
326.9
-25.5
50.0
8.8
SALES TAXES
Arkansas
Connecticut
Florida
Hawaii
Kansas
Maine
Maryland
Minnesota
Nevada
North Carolina
Rhode Island
Tennessee
West Virginia
Reduction on sales and use tax for food from 1.875 percent to
1.375 percent (ACT755)
Increase sales tax rate to 6.35 percent, Tax clothing and footwear under $50,
Base expansion, Rate changes
3 day back to school sales tax holiday
Temporarily suspends some exemptions from sales tax
Several exemptions were repealed
Exempts from the sales tax certain meals provided to residents of full-service
retirement facilities and applies the exemption retroactively to tax periods
beginning on or after January 1, 2010.
Permanently extends a cap on the amount that vendors may receive for
collecting and remitting the State Sales Tax at $500 regardless of the number
of returns filed.
Miscellaneous exemption changes
Expiration of temporary sales tax
Impose 7.0 percent Tax on Sightseeing Package Tours
Impose 7.0 percent Tax on Over the Counter Drugs, includes medical marijuana
Impose 7.0 percent Tax on digital downloads
Sales Tax Modernization Proposal: No Insurance Proceeds for Totaled or
Stolen Motor Vehicle as Trade-In Value
Eliminate two sales and use tax exemptions administered by the Rhode Island
Industrial Facilities Corporation and the Rhode Island Economic Development
Corporation for the sales and use tax on eligible materials/equipment used in
the construction or rehabilitation of a building.
Several adjustments
Reduction is sales tax rate on food from 3 percent to 2 percent
Total Revenue Changes—Sales Tax
-1.4
06-11
07-11
07-11
07-11
10-11
10-11
10-11
18.8
2.2
1.1
-1,061.0
1.1
8.6
6.7
07-11
0.8
07-11
07-11
01-12
0.1
4.0
-10.8
-$690.5
Table A-3 continues on next page.
76
N AT I O N A L G O V E R N O R S A S S O C I AT I O N
•
N AT I O N A L A S S O C I AT I O N
OF
S TAT E B U D G E T O F F I C E R S
TABLE A-3 (Continued)
Enacted Revenue Changes by Type of Revenue, Fiscal 2012
State
Fiscal 2012
Revenue
Changes
($ in Millions)
Effective
Date
Tax Change Description
PERSONAL INCOME TAXES
Arkansas
California
Connecticut
Delaware
Hawaii
Iowa
Kansas
Maine
Maryland
Michigan
Minnesota
Missouri
Nebraska
New Jersey
North Carolina
North Dakota
Ohio
Puerto Rico
Wisconsin
Reduction of sales tax rate on manufacturers' utilities from 3.25 percent to
2.75 percent (ACT 754)
Conformity: Health care (exclusion or deduction for kids < age 27)
Ch. 17/2011 (4/7/11) AB 36.
Rate changes, Reduce property tax credit, Earned income tax credit—refundable—
25 percent, Lower rate benefit capture
Reduces from 6.95 percent to 6.75 percent the personal income tax rate on
taxable income in excess of $60,000.
Repeals deduction for state income taxes and caps itemized deductions for
high-income taxpayers
Update of tax law for Internal Revenue Code changes
Various deduction increases
Rural opportunity zone tax credits
Provides new minimum taxability thresholds for non residents to permit
greater income earning activity by non residents in the State before
Maine income tax liability is triggered. It also excludes from the determination
of taxability in the State up to 24 days of personal services related to certain
training, management functions, equipment upgrades and new investment.
Conforms to Federal Standard deduction & eliminates tax additions starting
January 2012. It establishes new income tax rate schedules that contain a
6.5 percent rate bracket and reduces the 8.5 percent rate bracket to
7.95 percent for tax years beginning on or after January 1, 2013.
Provides a credit equal to 10 percent of the federal bonus depreciation on property
placed in service in Maine during tax years beginning 2011 and 2012, excluding
certain utility and telecommunications property.
Repeals the income tax additions modifications related to the federal section
179 business expensing thresholds for tax years beginning on or after
January 1, 2011.
Conforms to the US Internal Revenue Code contained in Maine revised Statutes
A tax credit for qualified costs of film and television production
Eliminate or reduce many credits, exemptions, & deductions, and delay scheduled
tax cut.
Federal Conformity
Deduction for businesses that create new jobs.
Angel Investment Tax Credit
50 percent Phase-In Business Income/Loss Netting and Loss Carry-Forward Relief
Expiration of temporary income tax surtax
Reduced individual income tax rates.
Final installment of delayed income tax reduction. This was delayed for FY 2010-2011.
Income Tax Credit to individual and corporate taxpayers
Defer capital gains taxes if taxpayer reinvests proceeds in qualified Wisconsin
business within 180 days of the original sale.
07-11
-$5.3
07-11
-38.0
01-11
875.1
-6.8
01-11
45.3
-13.0
-16.1
-1.5
07-11
-3.1
-9.8
-9.1
-6.1
-8.3
-7.5
07-11
01-12
various
01-11
01-12
01-11
01-11
01-11
11-10
559.1
-44.8
-15.0
-2.0
-23.0
-177.0
-60.0
-446.0
-265.0
01-11
-16.1
Total Revenue Changes—Personal Income Taxes
$571.0
Table A-3 continues on next page.
THE FISCAL SURVEY
OF
S TAT E S
•
FALL 2011
77
TABLE A-3 (Continued)
Enacted Revenue Changes by Type of Revenue, Fiscal 2012
State
Effective
Date
Tax Change Description
Fiscal 2012
Revenue
Changes
($ in Millions)
CORPORATE INCOME TAXES
Arkansas
Connecticut
Florida
Indiana
Iowa
Kansas
Maine
Maryland
Michigan
Minnesota
Missouri
New Jersey
North Carolina
North Dakota
Puerto Rico
Rhode Island
Virginia
West Virginia
Wisconsin
Exemption from sales tax for used vehicles sold below $4,000 (previous level $2,500)
(ACT 753)
Impose 20 percent surcharge for IY 2012 and IY 2013 (01/12),
Credit Changes (01/11)
increase in exemption from $5,000 to $25,000 additional tax credits for R&D and
rehabilitation of contaminated sites
Phased-in reduction of corporate income tax rate from 8.5 percent to 6.5 percent over
4 years. Internal revenue code update
Update of tax law for Internal Revenue Code changes
Various deduction updates
Expensing deduction for capital investment
Extended HPIP investment tax credits
Provides a credit equal to 10 percent of the federal bonus depreciation on property
placed in service in Maine during tax years beginning 2011 and 2012, excluding
certain utility and telecommunications property.
Repeals the income tax additions modifications related to the federal section 179 business
expensing thresholds for tax years beginning on or after January 1, 2011.
A tax credit to locate businesses in an economically distressed county. Some credits
may be claimed against the personal income tax
Replace Michigan Business Tax with a 6 percent corporate income tax
Federal Conformity
Cap on Corporate Franchise Tax at Tax Year 2010 level; First year of five-year phase-out.
Three-Year Phase-In Single Sales Factor
Reduce S Corporation Minimum Tax 25 percent
Increase R&D Credit to 100 percent
Allow the Technology Business Tax Certificate Transfer Program to be allocated
$60 million instead of the FY 2011 amount of $30 million
Expiration of temporary income tax surtax
Reduced individual income tax rates.
Income Tax Credit to individual and corporate taxpayers
Subject LPs and LLPs to $500.00 minimum tax.
Federal Tax Conformity
Reduction in Corporation Net Income Tax Rate from 8.5 percent to 7.75 percent
Authorize combined groups to share net business loss carry-forwards that were
incurred by group members before January 1, 2009 (when combined reporting
became effective in Wisconsin).
Total Revenue Changes—Corporate Income Taxes
01-12
01-12,
01-11
-$2.5
01-12
-17.7
07-12
-2.9
-5.0
-0.6
-4.5
-0.5
01-11
01-11
39.0
-15.6
-1.5
07-11
01-12
various
01-12
01-12
01-12
-1.3
-1,094.3
8.6
-24.3
-24.0
-13.0
-33.0
01-12
01-11
01-11
11-10
07-11
01-11
01-12
-30.0
-26.0
-12.5
-239.0
0.8
7.4
-$5.0
01-12
-9.2
-$1,267.6
Table A-3 continues on next page.
78
N AT I O N A L G O V E R N O R S A S S O C I AT I O N
•
N AT I O N A L A S S O C I AT I O N
OF
S TAT E B U D G E T O F F I C E R S
TABLE A-3 (Continued)
Enacted Revenue Changes by Type of Revenue, Fiscal 2012
State
Tax Change Description
Fiscal 2012
Revenue
Changes
($ in Millions)
Effective
Date
CIGARETTE AND TOBACCO TAXES
Connecticut
New Hampshire
New York
Vermont
Rate changes
Ten cent per pack of cigarettes reduction ($1.78 per to $1.68 per)
became effective 7/1/11. Impact on revenues is expected to be zero, as
decline in revenue is expected to be offset by increased cigarette sales.
Repeals the graduated annual retail registration fee of between
$1,000 and $5,000 annually and replaced it with a flat $300 annual fee.
38 cent per pack increase
07-11
$50.5
07-11
0.0
09-11
07-11
3.0
4.6
Total Revenue Changes—Cigarette and Tobacco Taxes
$58.1
MOTOR FUELS TAXES
Connecticut
Rate changes
07-11
$8.7
Total Revenue Changes—Motor Fuel Taxes
$8.7
ALCOHOLIC BEVERAGES
Connecticut
Iowa
Maryland
Rate changes
Allows convenience stores to sell liquor without a walled off area.
Increases the sales tax on alcoholic beverages from 6 percent to 9 percent
07-11
07-11
07-11
$9.8
2.5
84.8
Total Revenue Changes—Alcoholic Beverages
$97.1
Table A-3 continues on next page.
THE FISCAL SURVEY
OF
S TAT E S
•
FALL 2011
79
TABLE A-3 (Continued)
Enacted Revenue Changes by Type of Revenue, Fiscal 2012
State
Tax Change Description
Effective
Date
Fiscal 2012
Revenue
Changes
($ in Millions)
07-11
$521.8
Various
-6.2
OTHER TAXES
Connecticut
Delaware
Florida
Hawaii
Maryland
Michigan
Minnesota
Montana
Nevada
New Jersey
North Carolina
North Dakota
Oregon
Pennsylvania
Puerto Rico
Tennessee
West Virginia
Inheritance and estate exemption level, Insurance companies rate changes, Electric
generation tax, Repeal admissions and dues exemptions, Health provider tax changes
Bank Tax: Increases the incentive for major financial institutions to locate their charters and
operations in Delaware by lowering the location benefit tax paid by banks that elect into
the alternative bank franchise tax. Encourages job creation and retention by creating a
10-year tax credit for banking organizations that add 200 or more jobs after 2011
Public Utility: Reduces the general public utility tax rate on electricity and gas from 5.00
percent to 4.25 percent. Also reduces the rate on electricity and gas distributed to
manufacturers, food processors and other agribusinesses from 2.35 percent to 2.00
percent. Transfers the first $5 million in proceeds generated by the public utility tax to
the new Energy Efficiency Investment Fund, which will be used to finance energy
efficiency projects that will reduce overall energy use and create jobs.
Gross Receipts: Provided gross receipts tax cut to all taxpayers by: (a) cutting rates
across-the-board by 3 percent and (b) increasing by 25 percent the monthly and
quarterly exclusion levels for all business categories. It clarifies the rate reduction
scheduled to take effect in 2014 and it restores full funding for the Hazardous
Substance Clean-up program two-years earlier than originally planned.
Insurance Premium Tax: exemption of entities providing services solely to Medicaid
recipients under a contract with Medicaid
Temporarily raises rental motor vehicle tax rate
Extends the State's current 2 percent premium tax to the Injured Worker's Insurance Fund
One percent assessment on health care insurance paid claims
Repeal 6 percent use tax on Medicaid managed care organizations
Estate tax on farm and small business property
Tax compliance
Federal offset program
SB 372 Property tax (lower tax rate on first $2 million in business equipment)
Transitional Energy Facility Assessment—Phase-out over three years
Small Business Tax Relief
Conforming to Federal Estate Tax
Reduced financial institution tax rates
Reduced and gaming tax rates
Extending various tax credits that otherwise would sunset.
Continued phase-out of the Capital Stock and Franchise Tax.
Temporary excise tax imposed at a declining rate (from 4 percent for 2011
to 1 percent for 2016). Special Property Tax term reduction
Annual hospital coverage assessment rate increase from 3.52 percent to
4.52 percent for a covered hospital's annual coverage assessment base
Surplus lines insurance premium taxes changed
Reduction of Business Franchise Tax rate from 0.34 percent to 0.27 percent
Total Revenue Changes—Other Taxes
-9.5
-3.4
07-11
07-11
06-11
01-12
04-12
01-11
07-11
07-11
07-11
07-11
01-11
01-11
01-11
01-11
07-11
01-12
-1.6
60.6
1.9
396.9
-396.9
-1.0
35.7
1.0
-1.3
158.8
-62.0
-132.0
-57.0
-1.1
-3.4
-10.3
-66.6
01-11
969.0
01-12
100.4
1.4
-15.0
$511.2
Table A-3 continues on next page.
80
N AT I O N A L G O V E R N O R S A S S O C I AT I O N
•
N AT I O N A L A S S O C I AT I O N
OF
S TAT E B U D G E T O F F I C E R S
TABLE A-3 (Continued)
Enacted Revenue Changes by Type of Revenue, Fiscal 2012
State
Tax Change Description
Fiscal 2012
Revenue
Changes
($ in Millions)
Effective
Date
FEES
Arkansas
Connecticut
Maryland
Massachusetts
Michigan
Minnesota
Oregon
Rhode Island
Tennessee
Vermont
Increased vehicle title fees (ACT 718)
DMV and DOT Rate changes, Increase cremation certificate fee
Increase fees for individuals under parole and probation supervision
Increase in fees for birth certificates
A one-year delay of the FAS 109 deductions
Solid waste management fee increase
Unclaimed property
Labor & Industry—Extension of fixed rate permit surcharge (CCF fund)
Extending a bottle surcharge that otherwise would sunset and new fee for
some new liquor license applicants.
DEM: Increase Beach Parking Fees
DOR: Increase Estate Tax Filing Fee to $50
DOR: Increase Letter of Good Standing Fee to $50
DOR: Impose 4.0 percent Surcharge on Compassion Center Net Revenues
DCYF: Institute $10 Fee for Background Clearances
DBR: Increase Federal Covered Advisor Fee to $300
DBR: Increase Securities Sales Rep License Fee to $75
Drives license revocation fee
Hospital provider assessment increase
Various miscellaneous fees
07-11
07-11
07-11
07-11
$4.6
19.9
3.2
4.9
45.9
1.9
1.1
1.2
07-11
07-11
07-11
07-11
07-11
07-11
07-11
07-11
07-11
07-11
07-11
31.2
1.5
0.1
0.1
0.7
0.1
0.0
1.2
1.8
8.0
0.4
Total Revenue Changes—Fees
$127.8
SOURCE: National Association of State Budget Officers.
THE FISCAL SURVEY
OF
S TAT E S
•
FALL 2011
81
TABLE A-4
Enacted Revenue Measures, Fiscal 2012
State
Tax Change Description
California
Connecticut
Delaware
Florida
Hawaii
Iowa
Kentucky
Maine
Maryland
Sales—Use Tax Table on IT form
Sales—Nexus for Internet out-of-state retailers
Sales—Shift from General Fund to Special Fund Realignment
Personal Income—Tax Shelter Amnesty
Personal Income—Financial Institution Record Match
Personal Income—Repeal refundability of Child & Dependent Care Credit
Fees—California Community Colleges were increased from $26 per unit
to $36 per unit, commencing with the fall 2011 term.
Other—Transfers, DRS-Risk Based Scoring Decision, Federal Grant
Reimbursements and Changes
Abandoned Property—Increase earmarking to Transportation Trust Fund
from $24.0 million to $40.0 million
Abandoned Property—For FY 2012, earmark $115.0 million to “Building
Delaware’s Future Now Fund”, which will be targeted toward investments
that promote economic growth and job creation in Delaware
Other—Special Disability Trust Fund: change in assessment calculation
from fiscal to calendar year basis
Delays 10 percent increase slated for standard deduction and personal
exemption
Alters allocation of the transient accommodations tax to the General Fund
Cigarette—The first $106 million of cigarette and tobacco tax is to be
deposited into the Health Care Trust Fund instead of the General Fund.
Fees—Provides for fees collected by various Commerce divisions and gaming
enforcement and regulation to be deposited into separate funds instead of
the General Fund
Corporate—Declaration requirement for non-resident business income
Other—Combination of tax expenditure limits and small business tax credit.
Other—Amends the Tax and Rent "Circuitbreaker" program to limit the amount
of the benefit to 80% of the amount that would otherwise be available in
FY 2012 and FY 2013.
Other—Provides for a continued fixed amount to be credited as revenue to
the General Fund in lieu of paying these funds out as revenue sharing to
municipalities.
Sales—Diverts a portion of revenue from the Chesapeake Bay
2011 Fund to the General Fund
Personal Income—Tax Clearance—Requires payment of unpaid taxes to
renew a driver's license or vehicle registration. Some revenue may be
collected from other sources.
Motor Fuel—Diverts a portion of revenue from the Chesapeake Bay
2011 Fund to the General Fund
Other—Credits interest earned on special funds of the State to the
general fund, some funds are exempt.
Other—Diverts a portion of the Admissions and Amusement Tax to
the General Fund.
Effective
Date
Fiscal 2012
Recommended
Changes
($ in Millions)
01-11
07-11
07-11
08-11
04-11
01-11
$6.5
200.0
-5105.7
-50.0
40.0
75.0
07-11
110.0
07-11
187.7
16.0
115
01-12
2.8
01-11
07-11
11.5
36.5
07-11
-106.0
07-11
-32.5
8.2
19.4
10.0
40.4
06-11
15.2
06-11
25.4
06-11
5.0
06-11
7.0
06-11
3.7
Table A-4 continues on next page.
82
N AT I O N A L G O V E R N O R S A S S O C I AT I O N
•
N AT I O N A L A S S O C I AT I O N
OF
S TAT E B U D G E T O F F I C E R S
TABLE A-4 (Continued)
Enacted Revenue Measures, Fiscal 2012
State
Minnesota
Montana
Nebraska
Nevada
New Mexico
New York
North Carolina
North Dakota
Ohio
Oklahoma
Oregon
Pennsylvania
Tax Change Description
Sales—Release legislatively delayed refunds in FY 2011
Corporate Income—Release legislatively delayed refunds in FY 2011
Cigarette—Reduce tax in MERC fund and increase tax in general fund
by $4.6 million for a net change of zero.
Fees—Deposit Water Management Account fees of $5 million in
Natural Resources fund instead of general fund.
Other—SB 361 Video gaming (new line of games)
Sales—Suspension of redirection of portion of utility sales tax from
General Fund to low-income home energy conservation program
Other Taxes
Fees
Other—Amended Movie Tax Credit program
Extension of Power for Jobs tax credit through 2012.
Sales—Repeal Wildlife Resources Commission sales tax earmark
Personal Income—Accounts Receivable Program
Corporate—Suspend Public School Building Capital Fund earmark
Fees—Increase Judicial Fees
Sales—Change in allocation of motor vehicle excise taxes from highway fund
to general fund.
Other Taxes—Change in allocation of oil taxes to increase state general fund share.
Sales—Redirection of existing non-auto sales tax receipts as a result of reducing
Public Library Fund allocation of these receipts. Expansion of managed care under
Medicaid which is subject to the Sales and Use tax.
Income—Redirection of existing personal income tax receipts as a result of reducing
Local Government Fund allocation of these receipts.
Other—Redirect revenues from Commercial Activities Tax and Kilowatt Hour Taxes
now deposited in other funds to the General Revenue Fund. Additional increase in
GRF Kilowatt Hour Tax receipts from reductions in Public Library Fund allocations.
Expansion of managed care under Medicaid which is subject to the domestic
insurance tax.
Sales—Create two locations for statewide tax hearings; Add sales tax audit personnel
Corporate Income—Strengthen corp/partnership audit division shorten aerospace
tax credit moratorium by 1 year
Other Taxes—Delay change in apportionment of motor vehicle late fees by 1 year
Personal Income—Increase number of tax auditors to improve collections.
Corporate Income—Increase number of tax auditors to improve collections.
Fees—Several fund sweeps some court fees transferred to GF.
Other—Transfer of special fund moving violation surcharges to the General Fund.
Other—Decrease in Film Production and Job Creation Tax Credits offset by an
increase in the Research and Development Tax Credit.
Effective
Date
Fiscal 2012
Recommended
Changes
($ in Millions)
03-11
03-11
$133.9
72.0
0.0
07-11
04-11
0.0
1.5
07-11
07-11
03-11
07-11
07-11
07-11
07-11
4.6
69.7
88.9
25.0
-6.4
23.0
13.0
72.0
62.0
07-11
07-11
22.9
221.0
07-11
$73.6
07-11
151.5
07-11
08-11
548.9
12.8
08-11
08-11
07-11
07-11
07-11
07-11
-1.5
16.4
5.5
9.2
95.0
44.0
07-11
9.1
Table A-4 continues on next page.
THE FISCAL SURVEY
OF
S TAT E S
•
FALL 2011
83
TABLE A-4 (Continued)
Enacted Revenue Measures, Fiscal 2012
State
Effective
Date
Tax Change Description
Rhode Island
Texas
West Virginia
Sales—Separate Posting of Business Tax Delinquents
Personal Income—Separate Posting of Individual Tax Delinquents
Personal Income—Offset Lottery Winnings for Taxes Owed
Personal Income—Add four full time equivalent revenue agents to Taxation.
Corporate Income—Separate Posting of Business Tax Delinquents
Other Taxes—Health Care Provider Assessment: Separate Posting of
Business Tax Delinquents
Other Taxes—Health Care Provider Assessment: Eliminate the COLA that was
due to Nursing Homes on top of additional funding
Fees—Rhode Island Resource Recovery Corporation Transfer
Fees—DHS: Reinstitute Hospital Licensing Fee at 5.430 percent on
FY 2010 Net Patient Revenues
Fees—DOC: Offset Income Tax Refunds for Probation and Parole Fees Owed
(Taxation as a Collection Agency)
Fees—DHS: Work Support Strategies Grant
Fees—DMV: NSF Check Return Fee of $25
Lottery—Increased revenues due to reduced expenditures within the
Division of Lottery
Lottery—Increase Net Terminal Income share to the Town of Lincoln for
24 Hrs operation
Lottery—Restoration of Newport Grand's Marketing Funds
Other—Transfer Land Sales to the IT Fund
Cigarette—Accelerated collection
Motor Fuel—Accelerated collection
Alcohol—Accelerated collection
Other—Small business tax exemption extension
Personal Income—Updating definition of federal adjusted gross income to
federal definitions (includes Section 179 & Bonus Depreciation Changes)
Corporate Income—Updating definition of federal taxable income to federal
definitions (includes Section 179 & Bonus Depreciation Changes)
Total
84
Fiscal 2012
Recommended
Changes
($ in Millions)
07-11
07-11
07-11
07-11
07-11
$0.6
0.8
0.1
2.0
0.1
07-11
0.3
07-11
07-11
-0.3
3.5
07-11
144.0
07-11
07-11
07-11
0.2
0.3
0.0
07-11
1.0
07-11
07-11
07-11
-0.9
-0.3
-1.0
-143.2
09-10
-9.0
09-10
-46.0
-$2,639.2
N AT I O N A L G O V E R N O R S A S S O C I AT I O N
•
N AT I O N A L A S S O C I AT I O N
OF
S TAT E B U D G E T O F F I C E R S
Founded 1945


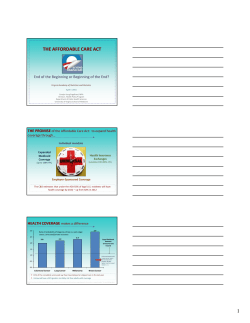


© Copyright 2026