
STATEMENT OF WHY THE UNITED STATES-AUSTRALIA FREE TRADE
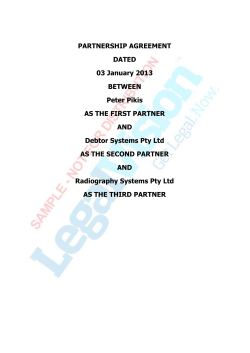
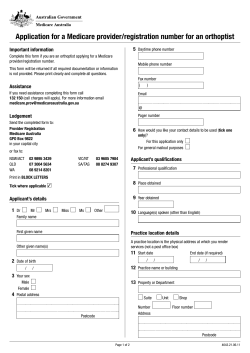
STATEMENT OF WHY THE UNITED STATES-AUSTRALIA FREE TRADE
AGREEMENT IS IN THE INTERESTS OF U.S. COMMERCE
INTRODUCTION
President Bush notified Congress of his intent to enter into the United States-Australia
Free Trade Agreement (FTA or Agreement) on February 13, 2004. Negotiations
conducted over the previous year resulted in an agreement that is clearly in the interests
of U.S. commerce.
On the day this FTA enters into effect, tariffs that currently average 4.3 percent will be
eliminated on more than 99 percent of the tariff lines for U.S. manufactured goods
exports to Australia. Exports of these goods account for 93 percent of total U.S. goods
sales to Australia’s market, and reducing these tariffs will create new export opportunities
for America’s manufacturers. With virtually all U.S. manufactured exports becoming
duty-free immediately, the National Association of Manufacturers (NAM) estimates that
the manufacturing sector could sell $2 billion more per year to Australia and that U.S.
national income could grow by nearly that much.
This is the most significant immediate reduction of industrial tariffs ever achieved in a
U.S. free trade agreement and will provide immediate benefits for America’s
manufacturing workers and companies. However, the FTA affords substantial benefits in
a broad range of other sectors as well. Markets for services such as life insurance and
express delivery will be opened; intellectual property will be better protected; and
investments will be treated in a fair and predictable manner. American firms will be
allowed to compete for Australia’s government purchases on a nondiscriminatory basis
for the first time. All U.S. farm exports—nearly $700 million in 2003—will go duty-free
to Australia, benefiting many sectors such as processed foods, fruits and vegetables, corn,
and soybeans. The FTA also makes advances in e-commerce and improved transparency
and processes in the regulation of pharmaceutical prices.
Although the United States has a goods and services trade surplus of $9 billion, the FTA
will make the Australian market even more attractive to U.S. exporters. The public
attention the FTA has drawn will act as a spur to both U.S. exporters and Australian
buyers to pursue untapped opportunities in U.S.-Australian trade.
As a developed country market with familiar business norms and a common language,
Australia is a relatively easy market for small U.S. companies to enter. U.S. small and
medium sized enterprise (SME) exports to Australia increased by nearly $1 billion, or 65
percent between 1992 and 2001. Australia’s sophistication and stable political and legal
foundations reduce the risks to SMEs. Elimination of tariff and non-tariff measures
through the FTA and additional information on market opportunities in Australia should
increase the attractiveness of this market, which appears tailor-made for SMEs entering
the broader international market.
-1-
WHY AUSTRALIA?
Australia is already a significant market – America’s 14th largest export market in 2003.
The United States exported over $13 billion worth of goods to Australia last year.
Sophisticated manufactured goods comprise most exports, supporting high-paying jobs in
the United States. Australia, like the United States, offers sophisticated and discerning
wholesale and consumer markets. Its population of 20 million is relatively small, but
Australia’s high per capita income and advanced industrial base generate substantial
purchasing power.
The FTA will strengthen links between the U.S. and Australian economies at a time when
Australia is increasing its economic ties to Asian markets. The United States-Australia
FTA will also serve as a catalyst for expanded regional trade, as both the U.S. and
Australia have completed FTAs with Singapore, and the United States is also about to
begin negotiations with Thailand. Australia has recently completed an FTA with
Thailand and entered into preliminary discussions with China and Japan.
Finally, the FTA supports the economy of a steadfast ally, further cementing the longstanding U.S.-Australia strategic relationship, while simultaneously benefiting U.S.
commerce.
BEST PROSPECTS FOR INCREASED MARKET GROWTH FOR GOODS
U.S. trade figures indicate an impressive market for high-tech goods such as aircraft and
computers. Outside of these areas, U.S. trade with Australia extends across a broad range
of goods and services. The FTA comes at a time when Australia continues to enjoy a rate
of economic growth that outpaces most other OECD countries. Tariff reductions coupled
with domestic demand will make it more worthwhile for companies manufacturing highend products, easily substitutable products, products with very thin margins, or with high
freight costs due to bulk or weight to sell products in the Australian market. In addition,
government procurement is a significant part of the Australian economy. Gaining greater
access to this market will create new opportunities across many sectors.
Industries poised to gain from the FTA include, but are not limited to: oil and gas sector
equipment; professional services; broadcasting and media and film production;
construction; telecommunications; biotechnology; mining equipment; information
technology; broadband technologies; aerospace; electric motors and generators; and
automotive parts.
As noted, the Agreement eliminates nearly all tariffs on industrial goods immediately. It
also establishes a Committee on Trade in Goods to address barriers, especially non-tariff
barriers. The following is the Administration’s analysis of trade opportunities in major
goods sectors upon implementation of the Agreement.
-2-
Civil Aircraft Equipment
Civil aircraft equipment accounted for 24 percent of total U.S. exports to Australia in
2003, totaling $3 billion. The top U.S. exports in this sector were airplanes, radar
equipment and aircraft parts including engines. Australia’s tariffs range between zero
and 15 percent with an average of 5.2 percent in 2003. Australia will eliminate all tariffs
on civil aircraft equipment covered by the Agreement, providing a significant stimulus
for U.S. exports in a sector where U.S. firms already have enjoyed success, but
continually face European competition.
U.S. tariffs in this sector are already at zero.
Capital Goods
Capital goods accounted for 14 percent of total U.S. exports to Australia in 2003, totaling
$1.8 billion. The top U.S. exports in this sector are engines, compressors, and railway
equipment. Australia’s tariffs range between zero and 15 percent with an average of 3.2
percent in 2003. Australia will eliminate all tariffs immediately, benefiting
manufacturers of these equipment items as well as exporters of oil and gas sector
equipment.
Prospects are good for increased exports in this sector. The Association of Equipment
Manufacturers stated in testimony before the U.S. International Trade Commission that
the U.S. equipment manufacturing sector will derive significant benefits from the
Agreement due to lower costs to consumers, a level playing field with Australian
competitors, and a cost advantage vis-à-vis international competitors. The NAM also
believes U.S. manufacturers of a range of machinery products could increase their market
share against European Union and Japanese companies.
Major U.S. companies supplying the market are Caterpillar, Case, John Deere, and
Ingersoll-Rand. Japan is the main competitor for U.S. machinery suppliers, followed by
Germany and the United Kingdom.
Caterpillar has stated that elimination of duties will improve the competitiveness of its
manufacturing operations in both Australia and the United States. Also, following
elimination of tariffs on raw materials and components, Caterpillar’s factories in
Australia will have reduced costs allowing the company to better compete in the global
marketplace.
The United States applies tariffs on capital goods of 0 to 14 percent, with an average of
1.8 percent. These tariffs will be eliminated when the Agreement enters into effect.
Electronics and Instrumentation
Electronics and instrumentation goods accounted for 17 percent of total U.S. exports to
Australia in 2003, totaling $2.1 billion. The top U.S. exports in this sector are computer
equipment, telecommunications equipment and radar apparatus. Australia’s tariffs range
between zero and 15 percent with an average of 1.5 percent in 2003. Australia will
eliminate all tariffs immediately.
-3-
U.S. telecommunications products, including advanced network equipment like ATM
switches, call processing and managing equipment, modems, and routers, will become
even more competitive in Australia. U.S. manufacturers will also be able to better exploit
growth areas including wireless technologies, fiber optics, and communications and
applications software.
The United States will eliminate all tariffs immediately on electronics and
instrumentation products except reception apparatus for radiotelegraphy, radiotelephony,
radio broadcasting (HS 85279095). U.S. tariffs on these products will be removed in
equal annual stages over a four-year period.
Transportation Equipment
Transportation equipment accounted for 8.4 percent of U.S. exports to Australia in 2003,
totaling $1 billion. The top U.S. exports in this sector are auto parts including engines,
passenger motor vehicles, and machinery for assembling motor vehicles. Australia’s
tariffs range between zero and 15 percent with an average of 8.4 percent in 2003. Tariffs
on passenger vehicles will be reduced from 15 percent to 10 percent next year.
Australian exports of transportation equipment to the United States totaled $424 million
in 2003 or 7.2 percent of Australia’s total exports to the United States. Australia’s top
exports are motor vehicles, auto parts and miscellaneous auto equipment. U.S. tariffs
applied to the transportation sector range from zero to 25 percent, with an average of 2.4
percent.
The United States will immediately eliminate tariffs on all products except for taxi meters
(HS 90291040). Tariffs on taxi meters will be eliminated in equal annual stages over a
four-year period.
Australia will eliminate its tariffs in this sector using two staging categories: immediately
and by January 1, 2010. All of the products with the latter staging are used motor
vehicles. These products account for less than one percent of U.S. exports to Australia.
Chemicals
Chemicals accounted for 10.5 percent of total U.S. exports to Australia in 2003, totaling
$1.3 billion. The top U.S. exports in this sector are fertilizer, organic chemicals and
plastics. The United States will eliminate immediately all tariffs on chemical products
except aromatic pesticides (HS 29189020), which will be eliminated by January 1, 2010.
Tariffs on this product will be removed in equal annual stages from the date the
Agreement enters into force until 2010, when it will be duty free. Australia will
eliminate all tariffs immediately except on other pesticides (HS 29189000), which will be
eliminated by January 1, 2010 using the same phaseout schedule as the United States is
using for aromatic pesticides.
Consumer Goods
Consumer goods accounted for 5.3 percent of total U.S. exports to Australia in 2003,
-4-
totaling $663 million. The top U.S. exports in this sector are motorcycle engines and
parts, sporting and exercise equipment, and small personal appliances. Australia’s tariffs
range between zero and 15 percent with an average of 2.5 percent in 2003. Australia will
eliminate all tariffs on these products immediately upon entry into force of this
Agreement.
Australian tariffs ranging from 4 to 5 percent on nutritional and personal care products
currently constitute a significant barrier; thus the immediate elimination of duties under
the Agreement could result in an increase in exports of millions of dollars, according to
one company’s testimony.
U.S. tariffs on consumer goods range from zero to 109 percent, with an average of 3.6
percent.
Paper and Paper Products
Paper and paper products accounted for 2.2 percent of total U.S industrial exports to
Australia in 2003, totaling $278 million. The top U.S. exports in this sector are
periodicals, personal paper items and miscellaneous paper products. Australia’s tariffs,
which will be eliminated when the FTA enters into force, range between zero and 5
percent, with an average of 3.2 percent in 2003. The United States already applies zero
duties on these products.
Energy Products
Energy products accounted for 1.2 percent of total U.S. exports to Australia in 2003,
totaling, $149 million. The top U.S. exports in this sector are industrial machinery
generators, and various machinery parts. Australia’s tariffs range between zero and 15
percent with an average of 3.5 percent in 2003. Australia will eliminate all tariffs
immediately upon implementation of the Agreement, while the United States will stage
the reduction of tariffs on condensers for steam or other vapors (HS 8404200) over a
four-year period. U.S. tariffs on other products in this sector will be eliminated when the
FTA enters into force.
The United States applies tariffs on energy products of zero to 6.5 percent, with an
average of 1.2 percent for the sector.
Environmental Goods
Environmental goods accounted for 0.57 percent of total U.S. exports to Australia in
2003, totaling $70 million. The top U.S. exports in this sector are scientific
instrumentation, laboratory furnaces and ovens, and surveying equipment. Australia’s
tariffs on environmental goods range from zero to 15 percent, with an average of 4.5
percent in 2003.
U.S. companies face stiff competition from Japan in air pollution control, and France in
water pollution control. Germany competes with the United States in pollution
abatement equipment and waste management technologies. The Agreement will
-5-
immediately enhance the competitive position of U.S. exporters of all of these types of
equipment. Both Australia and the United States will eliminate all tariffs on
environmental goods immediately upon implementation of the Agreement.
Other Goods Sectors
U.S. companies export a broad range of other goods including building products, lumber
and wood products, non-ferrous and ferrous metals, and fish. Australian duties range
from zero to 5 percent. Immediate elimination of duties under the Agreement will both
expand the market due to lower consumer prices and provide a competitive advantage to
U.S. companies. Notably, even relatively low Australian tariffs have affected U.S.
exports of wood products significantly because of the low margins and high shipping
costs, according to an industry association.
Pharmaceuticals
Pharmaceuticals accounted for 3.7 percent in total U.S. exports to Australia, totaling $471
million in 2003. The top U.S. pharmaceutical exports are pre-measured medication,
sterile dressings and vitamins.
Australia’s tariffs range between
U.S.-Australia FTA Commitments on Pharmaceuticals
zero and 25 percent with an
•
The United States and Australia accepted a set of common
average of 1.85 percent in 2003.
Under the Agreement, the United
States and Australia affirm their
commitment to several basic
principles related to their shared
objective of facilitating high
quality healthcare and
improvements in public health.
The adjacent table describes
action taken under the Agreement.
TEXTILES AND APPAREL
principles on facilitating high quality health care and continued
improvements in public health for their citizens.
•
This statement of principles affirms the important role that
innovative pharmaceuticals play in health care, the importance of
pharmaceutical research and development and of government
support, the need for transparent and efficient procedures for
listing new pharmaceuticals, and to appropriately recognize the
value of innovative pharmaceuticals.
•
The two Parties will also establish a Medicines Working
Group that will provide for continued dialogue on emerging
health care policy issues.
•
Australia also committed to take specific steps to improve
the transparency and accountability of the Pharmaceutical
Benefits Scheme (PBS) process. Among these are: providing
companies further opportunities to consult; establishing a process
for independent review of the PBS’s listing decision; and
introducing steps to expedite the process.
The FTA contains a yarn-forward
origin rule consistent with other
U.S. FTAs. This means that most
apparel and fabric must contain
yarn spun in either Party to the
Agreement in order to qualify for preferential treatment. Also, the Parties agreed to a
safeguard mechanism applicable to textiles and apparel and customs cooperation
procedures that address fraud and transshipment concerns.
-6-
Tariffs will be phased out according to five tariff eliminations categories: Tariffs on a
select group of products, plus all products with a base rate of 3 percent or less, will be
eliminated upon entry into force of the Agreement. Tariffs on most fibers and yarns will
go to 3 percent upon entry into force, and go to zero on January 1, 2010. Tariffs on a
group of miscellaneous products will go to 5.5 percent upon entry into force, 3 percent on
January 1, 2010, and zero on January 1, 2015. Tariffs on most fabrics and floor
coverings will go to 8 percent upon entry into force, 3 percent on January 1, 2010, and
zero on January 1, 2015. Tariffs on most apparel and made-up products will go to 15.5
percent upon entry into force, 8 percent on January 1, 2010, and zero on January 1, 2015.
The best prospects for increased U.S. exports are likely to be cotton and man-made fiber
yarns and fabrics.
AGRICULTURAL MARKET ACCESS
The United States exported nearly $700 million of live animals, agriculture and food
products to Australia in 2003. Key U.S. exports have been live horses, soybean meal,
and processed foods. Currently, Australia’s average bound tariff on agricultural products
is 3.8 percent and the average applied tariff is 0.4 percent. Australia, however, maintains
tariffs as high as 30 percent on certain dairy products and tariffs of 4 to 5 percent on fresh
and processed fruits and vegetables, processed foods, some grains, oilseeds and other
products. Upon entry into force of the FTA, Australia will immediately eliminate all
tariffs on food and agricultural products and lock in applied tariffs at zero for U.S.
products.
Fruits and Nuts
While most U.S. fruits and nuts enter Australia duty-free, Australia applies a 5 percent
tariff on a number of fruit and nut products, including almonds, grapes, raisins, dried
apricots, dried apples, dried plums, citrus juices, cranberry juice, fruit jams and jellies,
and frozen strawberries. From 2001 to 2003, U.S. suppliers annually shipped on average
$50 million worth of fruit and nut products to Australia, and the U.S. share of its import
markets was 18 percent. With the FTA, Australia locks in duty-free tariff treatment for
all U.S. exports of fruits, fruit products, fruit juices and nuts. The immediate duty-free
access resulting from this agreement will serve to preserve and expand the import market
that the U.S. supplies.
Vegetables
While most U.S. vegetables enter duty-free, Australia applies a 5 percent tariff on a
number of vegetable products, including mushrooms, potatoes (fresh, dried and flakes),
sweet corn (frozen and canned), canned olives and spinach. From 2001 through 2003,
U.S. suppliers annually shipped on average $21.5 million worth of vegetable and
vegetable products to Australia, and the U.S. share of Australia’s import markets was 13
percent.
-7-
With the FTA, Australia immediately eliminates all duties on U.S. vegetable exports.
This will be particularly beneficial to U.S. exporters of processed and canned vegetables.
From 2000 through 2003, annual U.S. processed and canned vegetable exports to
Australia averaged $5.9 million, accounting for 6 percent of Australia’s total processed
and canned vegetable import market. With the elimination of the 5 percent import duty,
U.S. shippers will enjoy total duty-free access into Australia for this market segment.
Australia’s commitment to eliminate duties immediately on all U.S. vegetables will also
benefit U.S. exporters of frozen vegetables. From 2001 through 2003, annual U.S.
exports of frozen vegetable to Australia averaged $630,000, accounting for 17 percent of
Australia’s total frozen vegetable import market. With the elimination of the 5 percent
import duty, U.S. shippers will enjoy total duty-free access into Australia for this rapidly
growing market segment.
Processed Foods and Distilled Spirits
U.S. processed foods and beverages, such as breads, cakes and pastries, wines, distilled
spirits, and chocolate bars, face import tariffs of 5 percent, while soups and broths face
import tariffs of 4 percent. From 2001 through 2003, U.S. suppliers annually shipped to
Australia on average: breads, cakes, and pastries valued at $4.6 million; soups and broths
valued at $80,000; wines valued at $1.1 million; distilled spirits valued at $56 million;
and chocolate bars valued at $1.3 million. With the Agreement, Australia locks in
immediate duty-free tariff treatment for all U.S. processed foods and beverages, including
those mentioned above.
Oilseeds
Australia generally applies low tariffs on oilseed and product imports, and in the case of
soybean and peanut oils, provides lower applied tariffs than required under its World
Trade Organization (WTO) commitments. In recent years, U.S. sunflower seed entered
duty-free, while peanuts, peanut oil, and soybean oil faced an import duty of 5 percent.
From 2001 to 2003, the United States exported on average $52.2 million of soybean
meal, $24.2 million of soy flours and isolates, and $4.4 million of soybeans to Australia.
In 2003, the United States exported a total of $134.8 million in oilseeds and products to
Australia, making Australia the United States 16th leading export market for oilseeds and
products.
Under the FTA, Australia will eliminate immediately tariffs for all oilseeds and products
shipped from the United States, thereby improving the competitive position of U.S.
exporters of oilseeds and products.
Meat
Under the WTO Agreement, Australia applies zero tariffs on fresh, chilled and frozen
beef, pork, poultry, lamb and mutton and 5 percent tariffs on certain processed meat
products. Sanitary regulations generally limit Australia’s imports of uncooked meats.
-8-
From 2001 through 2003, the United States exported on average $3.1 million of these
products.
With the FTA, Australia locks in its duty-free tariff treatment for U.S. beef, pork, poultry,
lamb and mutton and eliminates immediately the tariffs on certain processed products.
With resolution of certain pork sanitary issues, Australia could be an important export
market for U.S. pork.
SPS Measures
The FTA affirms obligations under the WTO Sanitary and Phytosanitary (SPS)
Agreement. It establishes an SPS Committee to enhance cooperation on SPS matters,
including a focus on regulatory processes related to SPS measures, specific
implementation issues concerning SPS matters and other consultation procedures.
The SPS Committee could benefit U.S. wood packaging material suppliers. Australia’s
application of SPS measures to forest products imports has been a concern to U.S.
industry. Australia’s Quarantine and Inspection Service recently implemented a new
series of requirements applicable to wood packaging materials that are more restrictive
than those regulations outlined in the International Plant Protection Convention
Guidelines, according to an industry association.
The Agreement establishes a new mechanism for scientific cooperation between
U.S. and Australian authorities to resolve specific bilateral animal and plant
health matters. USDA’s Animal and Plant Health Inspection Service and
Biosecurity Australia will lead a standing technical working group to cooperate in
the development of science-based measures that affect trade between the two
countries.
In addition, the United States and Australia will continue to work to resolve SPS
barriers to agricultural trade, in particular for apples, corn, citrus, grapes, pork,
poultry and stone fruit.
-9-
SERVICES SECTORS
Services exports, at roughly $5 billion annually, account for about one-third of U.S.
exports of goods and services to Australia. Tens of thousands of American jobs are
supported by services exports to Australia. Australian subsidiaries of U.S. firms are also
major suppliers of services (roughly $15 billion annually) to the Australian market.
The major categories of service exports are passenger fares, airfreight and port services,
financial services, computer software and information services, broadcasting, and
telecommunications.
Australia will accord substantial access to U.S. services suppliers, subject to very few
exceptions. The FTA uses a “negative-list approach”, with any exceptions specifically
listed. These exceptions are outlined in the Services and Investment Annexes. Annex I
entries include existing measures that are not consistent with the Services and Investment
chapters, and Annex II entries provide the flexibility to take future nonconforming
measures in specific areas. The commitments in services cover both the cross-border
supply of services (such as services supplied through electronic means, or through the
travel of nationals) as well as the right to invest and establish a local presence.
Immigration matters are not part of the FTA.
While the United States provides market access for services at the level of its current
commitments under the General Agreement on Trade in Services (GATS), Australia
commits to providing increased market access at the Commonwealth level and provides
GATS level market access in its states and territories. Commitments on regulatory
transparency help ensure meaningful implementation of market access for services and
investment. Regulatory authorities are required to use open and transparent
administrative procedures, maintain or establish appropriate mechanisms for responding
to inquiries from interested persons regarding regulations, and provide notice of the
requirements of final regulations prior to their effective date.
As a result of the FTA, U.S. service suppliers will get broad access with few exceptions,
benefiting nearly all service suppliers. Some highlights, as reported by the Trade
Advisory Committees, include:
Advertising: The FTA provides access, for the first time in a trade agreement, for the
complete range of advertising services.
Asset Management Services: Affords national and MFN treatment with respect to the
provision of services to Australia’s civil service pension system.
Computer and Related Services: Ensures, through the negative list approach, that
FTA commitments will cover rapidly evolving computer services.
Education & Training: The education sector in Australia continues to grow due to
heightened demand both nationally and internationally. Education and training are
- 10 -
viewed as an essential aspect to the growth in Australia productivity and
competitiveness. The FTA locks in continued access for competitive U.S. higher
education and training firms.
Energy Services: Locks in an open energy services market that will provide U.S.
energy services firms with opportunities to compete for and bid on future energy
projects (including privatizations, which tend to be large projects).
Entertainment Services (includes Broadcasting & Audiovisual): The FTA contains
important and unprecedented provisions related to market access for U.S. films and
television programs in Australia over a range of media, including cable, satellite, and
the internet. The Entertainment Industry Coalition for Free Trade has noted that this
is the first trade agreement in which the United States has obtained disciplines on
cultural content quotas. The FTA places disciplines on measures that could limit
access in the broadcast and audiovisual sector.
Express Delivery Services: The Agreement includes very substantial benefits to this
sector, including recognition of express services as a unique sector and commitments
to maintain market access. The Agreement also addresses the issue of “crosssubsidization” of express delivery service suppliers through postal monopoly
revenues.
Insurance: The Agreement covers major aspects of insurance investment and cross
border products, and provides a right to sell life insurance through branches.
Professional Services (includes management consulting, accounting, architecture,
and legal services): Establishes a Professional Services Working Group that will
encourage the relevant bodies in their respective territories to develop mutually
acceptable standards and criteria for licensing and certification of professional service
suppliers and to provide recommendations on mutual recognition.
Telecommunications: The FTA includes several important new obligations for major
suppliers, including resale, provisioning of leased circuits and co-location; ensures
access for U.S. firms.
Tourism: Australia is a major source of export earnings for the U.S. travel and
tourism sector. The FTA locks in continued access for U.S. firms to compete in this
area.
INVESTMENT
U.S. investment in Australia was $36 billion in 2002. U.S. investment has been
concentrated in oil and gas extraction; electric power generation, transmission and
distribution; coal mining; metals; food processing; chemicals; banking; finance; motor
vehicles; and professional services.
- 11 -
Australian investment in the U.S. was $24.5 billion in 2002, with a focus on
broadcasting, building materials manufacture, mining, steel, and real estate. Australian
firms employ about 85,000 Americans in the United States.
The FTA provides further protection for investments and investors of both Parties. The
FTA eliminates the review of most new investments by Australia’s Foreign Investment
Review Board through use of relatively high thresholds for triggering a review. The
thresholds for acquisitions by U.S. investors in nearly all sectors are raised significantly,
from A$50 million to A$800 million. Australian officials estimate that this new
threshold would have exempted nearly 90 percent of all U.S. investment transactions
from screening over the past three years. The Parties also agreed to initiate a work
program that will limit the kinds of investment transactions (such as passive investment
transactions) that will be subject to review. U.S. exports will benefit as U.S. investors
abroad frequently have a supply line anchored in the United States.
In light of the unique circumstances of the Australian legal system, Chapter Eleven of the
Agreement does not provide a separate dispute settlement mechanism for an investor of a
Party to pursue a claim against the other Party. Australia has an open economic
environment and a legal system similar to that of the United States. U.S. investors have
confidence in the fairness and integrity of Australia’s legal system, and the United States
has a long history of close commercial relations with Australia that has flourished largely
without disputes of the type addressed by international investment provisions.
If a Party believes, however, that there has been a change in circumstances such that one
of its investors should be allowed to bring a claim against the other Party, the Party may
request consultations with the other Party with a view towards establishing arbitral or
other means of resolving disputes. Government-to-government dispute settlement
procedures remain available to resolve investment-related disputes.
- 12 -
INTELLECTUAL PROPERTY RIGHTS
Intellectual property-dependent ventures are playing an ever-larger role in the U.S.
economy. Copyright-based industries are among the fastest growing and most productive
of any sector of the U.S. economy. According to the International Intellectual Property
Alliance, employment in
copyright industries has
Highlights of New IPR Protections
been growing nearly three
Copyrights
times as fast as the annual
•
Ensures extended terms of protection (e.g., life of the author plus
employment growth rate
seventy years) for copyrighted works.
of the economy as a
•
Establishes strong anti-circumvention provisions to prohibit
whole. And copyright
tampering with technologies that are designed to prevent piracy and
industries contribute
unauthorized distribution over the Internet.
close to $90 billion to the
•
Provides rules for the liability of Internet Service Providers (ISPs)
economy through foreign
for copyright infringement, reflecting the balance struck in the U.S.
sales and exports.
Digital Millennium Copyright Act between legitimate ISP activity and
the infringement of copyrights.
Intellectual property
rights are critical in
supporting the industries
and services of the future,
such as software,
entertainment,
biotechnology, chemicals,
pharmaceuticals,
consumer goods, and
franchising. U.S.
industry is highly
competitive in these
knowledge-based
industries, but must
receive effective
protection and
enforcement of its
intellectual property
rights.
Patents
•
Provides for the extension of patent terms to compensate for
delays in granting the original patent.
•
Clarifies that test data and trade secrets submitted to a government
for the purpose of product approval will be protected against unfair
commercial use for a period of 5 years for pharmaceuticals and 10
years for agricultural chemicals.
•
Requires measures to prevent the marketing of pharmaceutical
products that infringe patents, and to provide notice when the validity
of a pharmaceutical patent is to be challenged.
Trademarks
•
Requires a system to resolve disputes about trademarks used in
Internet domain names, which is important to address trademark cyberpiracy with respect to high-value domain names.
•
Applies principle of “first-in-time, first-in-right” to trademarks and
geographical indications, so that the first person who acquires a right to
a trademark or geographical indication is the person who has the right
to use it.
Enforcement
•
Criminalizes end-user piracy, providing strong deterrence against
piracy and counterfeiting.
•
Requires both Parties to authorize the seizure, forfeiture, and
Under the U.S.-Australia
destruction of counterfeit and pirated goods and the equipment used to
Free Trade Agreement,
produce them. Ex officio action may be taken in border and criminal
U.S. producers of creative
cases, thus providing more effective enforcement.
material will benefit from
higher standards for
protecting intellectual
property rights such as copyrights, patents, trademarks, and trade secrets and enhanced
means for enforcing those rights.
- 13 -
Licensing fees and royalties from Australia totaled more than $800 million in 2002, and
will continue to grow under the Agreement.
GOVERNMENT PROCUREMENT
The FTA will significantly expand opportunities for sale of goods and services at both the
federal level and state level. As Australia is one of the few developed countries that is
not a party to the WTO Agreement on
Government Procurement, the FTA will give
U.S.-Australia FTA Commitments on
Government Procurement
U.S. bidders an advantage over suppliers from
other countries.
•
U.S. suppliers are granted rights to bid on
Opportunities abound as estimates put total
federal procurement at $43 billion annually,
and state/territory procurement at $35 billion.
The Agreement will provide U.S. suppliers
with meaningful, predictable and transparent
access to much of this market.
Central Government
Under the FTA, U.S. suppliers are granted
rights to bid on contracts to supply specified
Australian government ministries, agencies
and departments free of discrimination. The
Australian central government will eliminate
its industry development programs, under
which suppliers have had to provide various
types of offsets; e.g., local content or local
manufacturing requirements, as a condition of
their contracts.
Australia has covered all major procuring
entities such as Department of Defense,
Department of Transport and Regional
Services, Department of Communications,
Information Technology and the Arts, and
Department of Prime Minister and Cabinet.
contracts to supply specified Australian
government ministries, agencies and departments.
Covers the purchases of 80 Australian central
government entities, including key ministries and
government enterprises. Low-value contracts are
excluded.
•
These commitments are particularly significant
and commercially important, because Australia is
one of the only developed countries that is not a
party to the WTO Agreement on Government
Procurement.
•
Requires the use of tendering procedures that
will ensure that procurements are conducted in a
transparent, predictable and fair manner.
•
Australia gains non-discriminatory access to
the procurement of most U.S. federal agencies as
well as certain government enterprises.
•
Australia’s central government will eliminate
its industry development programs, under which
suppliers have had to provide various types of
offsets, e.g., local content or local manufacturing
requirements, as a condition of their contracts.
•
Both countries are also committed to
extending non-discriminatory coverage of the
agreement to state entities.
•
Disciplines Australia’s use of selective
tendering to ensure that U.S. suppliers have a fair
opportunity to compete for government contracts.
•
Confirms that bribery in government
Australia has also covered 31 administrative
procurement is specified as a criminal offense
and public bodies including important
under Australian and U.S. laws.
agencies such as the Reserve Bank of
Australia, Australian Broadcasting Authority,
and Australian Nuclear Science and Technology Organization.
- 14 -
State Entities
Both governments are also committed to extending non-discriminatory coverage of the
Agreement to entities in their respective states and territories and are working with their
respective states and territories to refine the extent of that coverage. Many states and
territories in Australia apply preference margins of up to 20 percent for Australian and
New Zealand products when those products compete with imports from other countries,
so liberalization of procurement by Australian states and territories will be increasingly
valuable. It is estimated that the states’ and territories’ procurements exceed those of the
federal level when defense items are subtracted. Importantly, Australia has offered to
cover procurement by five of its eight states/territories.
Goods
All goods other than motor vehicles will be covered by Australia, except where noted for
specific entities. Australia’s current preference program on motor vehicles favors U.S.
producers.
Services
Australia covered all services with the narrow exceptions of plasma fractionation and
government advertising. Australian states and territories have taken additional exclusions
on education services, and health and welfare services. U.S. companies offering
information technology related services are expected to benefit from the new openness, in
particular because Australia’s restrictive industry development program, specifically
targeting this sector, will be eliminated upon entry into force of the agreement.
Construction Services
All construction services are covered. Since Australia has a high GDP it is expected that
a majority of the country’s construction services will be above the threshold and thus
open to U.S. bidders. This will be especially important at the level of states/territories.
Thresholds
The United States negotiated thresholds for federal and state level procurement that
match the lowest thresholds found in the North American Free Trade Agreement and the
WTO Government Procurement Agreement. These low thresholds mean access to a
wider variety of Australian procurements for U.S. suppliers. U.S. SMEs especially will
benefit from these low thresholds.
ELECTRONIC COMMERCE
Australia is a leader in the area of electronic commerce, ranked ninth in the world in ereadiness and eighth in the world in Internet penetration. Ninety-five percent of
Australian businesses and 66 percent of households are connected to the Internet.
Additionally, Australia’s electronic commerce economy was $27.5 billion and
- 15 -
represented 6.3 percent of GDP in 2003, according to estimates from IDC, a global IT
research firm. By 2007, the Australian electronic commerce economy is projected to
reach $133.3 billion, nearly five times its current level, with a 28.9 percent share of GDP.
With most Australian SMEs in the early phase of electronic-commerce development, and
over 60 percent of products currently sold in the Australian IT market coming from
foreign producers, Australia promises to continue to be a good market for U.S. IT
hardware and services suppliers.
The FTA ensures that digital products (e.g., software, music, video, and text) will receive
non-discriminatory treatment and will not be subject to customs duties. This provision
makes permanent the moratorium on placing duties on online transactions that is now
only voluntary or temporary in the WTO. The FTA also affirms that any commitments
made related to services in this Agreement will also extend to the electronic delivery of
such services.
Additionally, under the FTA the two governments will recognize the legal validity of
electronic signatures, and will maintain a technology neutral approach to their use. Also,
the FTA sets out a willingness on the part of both Parties to undertake discussion on the
recognition of digital certificates issued by or on behalf of the other Party. This will
make it possible for government contractors of both countries to more fully participate in
the government procurement regimes of the other. Finally, the FTA recognizes the
importance of effective online consumer protection, and reiterates the commitment of
both governments to paperless trade administration. U.S. industry has indicated a strong
support for the Electronic Commerce Chapter, as it will further its goals in the WTO and
will assist in establishing a barrier-free global approach to the trade of digital products.
- 16 -
APPENDIX 1 – Interests of the U.S. States
The United States exported $13.1 billion in merchandise to Australia in 2003. Australia
was the 14th largest market for U.S goods in 2003. U.S. exports of goods to Australia
rose $1.3 billion, from $11.8 billion in 1999 to $13.1 billion in 2003. Over this period,
Australia was the eighth largest U.S. growth market in dollar terms.
U.S. exports to Australia are growing significantly faster than overall U.S. exports.
Merchandise exports to the world increased 4.5 percent, from $693 billion in 1999 to
$724 billion in 2003. Over the same period, exports to Australia expanded by more than
11 percent – the tenth largest percentage gain among the 30 largest U.S. markets.
While Australia accounted for 1.8 percent of total U.S. merchandise exports in 2003, the
Australian market was substantially more important to some states. For example, 5.8
percent of Washington’s exports of goods went to Australia in 2003. Australia is also an
important market for North Dakota (accounting for 5.5 percent of the state’s exports),
Kentucky (3.7 percent), Illinois (3.5 percent), and Iowa (2.8 percent).
Thirty states exported more than $100 million in goods to Australia in 2003. Five of
these states exported more than $500 million, and two exported merchandise worth more
than $1 billion. Washington and California were the top state exporters to Australia in
2003. Washington recorded merchandise exports of $2.0 billion to Australia, while
California recorded $1.9 billion. Together, these two states accounted for 30 percent of
total U.S. goods exported to Australia in 2003.
Other states that posted large export totals to Australia in 2003 were Illinois ($925
million), Texas ($749 million), Michigan ($524 million), Pennsylvania ($430 million),
Kentucky ($394 million), New York ($392 million), Ohio ($389 million), and Florida
($319 million).
Thirty-four – more than two-thirds – of the states increased their merchandise exports to
Australia from 1999 to 2003. Washington recorded the largest dollar growth among the
states. Exports of merchandise from Washington to Australia increased by $1.4 billion
from $602 million in 1999 to $2.0 billion in 2003.
Other states posting large increases in export value to Australia over the 1999–2003
period were Kentucky (exports up $235 million), Pennsylvania (up $167 million), South
Carolina (up $131 million), and Illinois (up $98 million).
Six states more than doubled their exports of goods to Australia from 1999 to 2003.
Nevada registered the fastest growth, rising 266 percent, from $14 million in 1999 to $52
million in 2003. Nevada was followed by Washington (exports up 227 percent),
Wyoming (up 225 percent), North Dakota (up 153 percent), Kentucky (up 148 percent),
and South Carolina (up 135 percent).
Source: Origin of Movement Series, Bureau of the Census, U.S. Department of Commerce. The Origin of Movement
(OM) series allocates exports to states based on transportation origin, i.e., the state from which goods begin their
- 17 -
journey to the port (or other point of exit) from the United States. The transportation origin of exports is not always the
same as the location where the goods were produced. Thus, conclusions about “export production” in a state should not
be made solely on the basis of the Origin of Movement state export figures.
Prepared by the Office of Trade & Economic Analysis, Trade Development, International Trade Administration, U.S.
Department of Commerce.
- 18 -
- 19 -
APPENDIX 2 – U.S. – Australia Trade
U.S.-Australia Goods Trade
14,000
12,000
Millions of $
10,000
8,000
6,000
4,000
2,000
0
1994 1995 1996 1997 1998 1999 2000 2001 2002 2003
Exports to Australia
Imports from Australia
World Trade Atlas
U.S.-Australia Goods Trade
Millions of US Dollars
1994
1995
1996
1997
1998
1999
2000
2001
2002
2003
Exports to Imports from
Australia
Australia
9,781
3,202
10,789
3,323
12,008
3,869
12,063
4,620
11,918
5,387
11,818
5,280
12,482
6,438
10,931
6,478
13,085
6,479
13,104
6,414
- 20 -
U.S. EXPORTS TO AUSTRALIA
World Trade Atlas
Top Ten U.S. Exports to Australia
Millions of US Dollars
Description
Machinery
Aircraft
Vehicles
Electrical Machinery
Optical, Medical Instruments
Pharmaceutical Products
Plastic
Organic Chemicals
Misc. Chemical Products
Live Animals
2003
2,710
2,229
1,254
1,074
906
449
360
252
221
203
Total, including all other
13,104
Source of Data: U.S. Dept. of Commerce, Bureau of Census
- 21 -
APPENDIX 3 – Australia’s Trade with the World
World Trade Atlas
Australia - Imports by Country
2003
Country
United States
Japan
China
Germany
United Kingdom
New Zealand
Rest of World
Million US$ % Share
13,376
15.76
10,602
12.49
9,343
11.01
5,193
6.12
3,551
4.18
3,274
3.86
39,544
46.58
Total
84,884
100
Source of Data: Australian Bureau of Statistics
- 22 -


© Copyright 2026