
Annual Report 2002 Hyundai M otor
Hyundai Motor Company Annual Repor t 2002
Annual Report 2002
This was a year of solid growth for Hyundai
Motor, strengthened by the people who
drove our success in markets around the
world and by the power of our brands.
www.hyundai-motor.com
2003 / 06 / M / KJ
Financial Highlights
Hyundai Motor Company Annual Report 2002
Table of Contents
Chairman’s Letter
President’s Letter
Communities
Responsibility
Products
Technology
Financial Statements
6p
8p
14p
20p
22p
24p
30p
31p
33p
38p
40p
Corporate History
Management
R&D
Production
Sales & Service
Marketing
Corporate Citizenship
44p
Chairman's Letter
Our goal is to join the top five carmakers in the world by the year 2010. The past year was a step in the
right direction, but it was only the beginning. We continue to work towards our goal, with a commitment
to sustainable growth and a plan that will keep us on track in the years to come. Our plan focuses on
four main areas of concentration: global reach, profit management, resource management and
corporate citizenship. In global reach, we will continue to implement region-specific development and
marketing, by expanding our investments in countries of high or growing demand. This expansion will be
bolstered by a worldwide focus on brand power and further strengthened by the growing number of
independent awards and critical acclaim for our products and industry firsts. In profit management, we
will concentrate our efforts on increasing profitability through a steady growth in sales and a systematic
reduction in costs. Our attention must also turn to the continuing reforms that are enhancing our
transparency at all levels of governance and standardizing accounting practices not only in our
company, but also in this country. In resource management, we must nurture those who make Hyundai
Motor successful and its future possible, from the people who build the cars to the people who buy
them. This must be a relationship that nurtures understanding and mutual growth. In corporate
citizenship, we must set a strong example by adhering to high standards in recycling, emission controls,
environmental production and the development of alternative energies. We will strengthen the bonds
that join us to the global community by supporting the works of groups and individuals that promote
positive change in the world. And the world is in difficult times: war is at the doorstep of many regions
and once thriving business markets are growing at a sluggish pace or faltering altogether. And though
this weighs heavily on our minds, we stay committed to the steps, large and small, that will take us to our
goal in 2010.
7
Chung Mong-Koo
Chairman and CEO, Hyundai Motor Company
President's Letter
We began laying the foundation for overseas production on several fronts. In the
United States, Hyundai Motor broke ground on an assembly plant that will produce
300,000 units at full capacity. In China, we opened the Hyundai Motor Beijing
Office ahead of the 2008 Olympic games to be held in that country. Hyundai's EF
Sonata has already been selected as the official car of the city of Beijing. A growing
number of people around the world are being convinced of the resiliency of the
Korean economy and of the quality of Korean-made products.
We continue to invest aggressively in core technologies as we did throughout
2002. Together with Mitsubishi and DaimlerChrysler, we formed the Global Engine
Alliance to undertake development and production of a next generation of engine
for a range of car models in the coming years.
Value to our shareholders improved in the past year, supported by IR activities
focusing on investment institutions, analysts and credit-rating institutions. Our S&P
credit rating was upward adjusted from BB in 2001 to BB+ in 2002. Moody's is
currently considering an upgrade in valuations from the current Ba2.
Today, uncertainty holds our global economy in check. Oil prices are up and the
US economy remains shaky as war in the Middle East continues. Europe's
economy is slowing, restrained partly by the passive policies of its central bank. In
South Korea, we are being faced with unprecedented competition in the domestic
automobile market. Weathering this storm will take resolve and action. Future
growth for our company relies on our ability to retain dominance in the domestic
market and to expand in other markets around the world.
The past year was proof positive of Hyundai Motor's commitment to raising
The year 2002 was a time of solid growth for us at Hyundai Motor. The numbers
shareholder value. Raising shareholder value and improving our profit structure are
tell the story: Sales surged 17 percent y-o-y to 27.1 trillion Korean won with a
priorities for our business systems as we work toward 2010, when we expect to
record-setting performance in each of our divisions. Domestic sales were 790,000
be among the top five automakers in the world. For 2003, we expect to see total
units, export sales were 920,000 units and overseas sales were 183,000 units.
sales of 2.13 million units or 30.2 trillion Korean won, with domestic sales at
That means over 1.9 million car buyers chose Hyundai cars last year - an 8.5
840,000 units, export sales at 1,000,000 units and overseas sales at 290,000
percent rise from the year previous. Hyundai Motor also recorded substantial
units. Growing amid a slow global economy will be a challenge. We accept that
improvements in profitability. Net profits rose 23.9 percent y-o-y to 1.4 trillion
challenge with determination.
Korean won and ROE rose from 13.9 percent in 2001 to 14.6 percent in 2002. Our
financial structure was strengthened as debt-to-equity dropped from 54.3 percent
Focusing on research and development is an important first step in our plan to lead
in 2001 to 31.3 percent in 2002
the market. Hyundai Motor will invest a total of 2.3 trillion Korean won in 2003 to
this end.
Driving these improvements in our profits was the market power of our products.
Cars like the Sonata and the Santa Fe received critical and public acclaim for their
The completion of our R&D center in the United States and the construction of a
value and dependability. Indeed, J.D. Power and Associates honored us with the
Chairman Award for our success over the past year.
9
center in Europe to be completed in the second half of 2003 will meet the demand
for region-specific design and technology.
Building a strong management system is another important step for us. The
development and ongoing implementation of the Sigma 6 quality improvement
campaign that began last year will improve profitability. Strict management of cash
flow will also improve profitability by creating a stable, liquid financial structure. In
environmental initiatives, Hyundai Motor is well on its way to implementing marketleading recycling and emission control programs at all levels of management and
production.
We look forward to the year to come, as we thank all those who made 2002
possible. It was truly our shareholders, our partners, our customers and our
employees who created the success that Hyundai Motor enjoyed in the past year.
Dr. Kim Dong-Jin, Ph.D.
President and CEO, Hyundai Motor Company
People
America. Hyundai Motor's investment in Montgomery represents a commitment to reach American car
buyers and to build on market-leading growth in the region over the past few years. Work on the US$1
billion Montgomery assembly plant began in 2002 and will be completed in 2005. The Alabama facility
will be able to produce 300,000 next-generation Sonata and Santa Fe models annually at full capacity,
employing over 2,000 local residents in every facet of production. For our company it means significant
improvements in cost efficiency and logistics, and in market specificity with American-made Hyundai
cars targeting American car buyers. For the community it means an enriched business environment and
the integration of large-scale industries in the area, notably in steel, auto parts and shipping.
Europe. Hyundai Motor is expanding its European headquarters in Russelsheim, Germany as part of
the company's global strategy of localization and region-specific product growth. The US$34.1 million
complex when it opens its doors in the summer of 2003 will employ more than 300 people in design,
R&D and marketing. This integrates every aspect of development prior to production and expands the
scope of the existing center. The investment represents our growing market share in the region and
correlates with other ongoing expansion projects in North America, South Korea and other countries in
Asia. Work at the new facility will build on the success of our European product line, including the
Matrix and Hyundai's newest entry in the supermini class, the Getz.
Hyundai Motor is expanding its
operations in the most competitive
markets in the world, following
industry-leading growth in sales and
brand power in recent years.
15
Corporate History
1967 Launch of Hyundai Motor
Company 1968 Signing of licensing
agreement with Ford Motor Company
1974 Launch of Korea’s first
independently designed and manufactured
automobile, the Hyundai Pony 1976 First
export of Hyundai Pony to Guatemala and El
Salvador 1980 Launch of Hyundai
Granada Launch of Hyundai Mark V
1981 Signing of technical alliance with
Mitsubishi 1982 Launch of Hyundai
Pony 2 1983 First export of Hyundai
Motor cars to Canada Launch of Hyundai
Stellar 1984 Completion of proving
ground in Ulsan, South Korea Cumulative
production of Hyundai Pony reaches 500,000
units 1985 Launch of Hyundai Excel
Establishment of Hyundai Motor America
(HMA) 1986 First export of Hyundai
Excel to the US Launch of Hyundai
Grandeur near-luxury sedan Completion of
export shipping port in South Korea
1991 Launch of Korea’s first proprietary
engine, the Alpha engine 1992 Launch of
Hyundai New Grandeur Development of
Korea’s first HCD-1 concept car
1988 Third consecutive year for Hyundai
Excel as best-selling import subcompact in
1993 Launch of Hyundai Sonata II
Completion of Hyundai Excel assembly
and production plant in Thailand
the US Launch of Hyundai’s Sonata midsize sedan 1989 Completion of V6-engine
plant 1990 Launch of Hyundai Scoupe
sports car Launch of Hyundai Elantra
1994 Launch of Hyundai Accent
subcompact Development of hydrogen fuel
cell vehicle Completion of Hyundai Excel
Left: Hyundai Motor and Alabama officials
inaugurate the site of the Hyundai Motor
Montgomery assembly plant to begin
production in 2005. Right: Chairman
Chung Mong-Koo speaks at the
groundbreaking ceremony of Hyundai
Motor’s new European headquarters to be
completed this year.
assembly and production plant in
center in Jeonju, South Korea
Zimbabwe 1995 Introduction of Hyundai
HCD-III concept car Introduction of the
Continuously Variable Transmission
1996 Introduction of AVCS (Automotive
Voice Control System) Launch of Hyundai
Coupe Launch of Hyundai Dynasty full-size
luxury sedan Completion of R&D center in
Namyang, South Korea Cumulative exports
surpass 4 million units Cumulative
production surpasses 10 million units
Launch of Hyundai Marcia near- luxury
sedan Introduction of the high-output, fuelefficient Beta engine Launch of Hyundai
Lantra Hosting of the first Korean
automotive design contest Completion of
commercial vehicle engineering & research
1997 Launch of Hyundai Dynasty
limousine Launch of New H-1
India. Hyundai Motor in 2002 became the second largest automaker in India, buoyed by strong local
marketing and result-driven quality programs. All three Hyundai passenger models available in India
increased their already dominant market share during the year: the mid-size Sonata, the subcompact
Accent and the compact Santro, the country's best-selling car. Their success follows aggressive
improvements in quality control and cost reduction at the Hyundai Motor assembly plant in the southern
city of Chennai. Annual production capacity at the plant will rise from 120,000 to 200,000 in 2003 to
meet rising demand both within the country and in export markets in Asia and Europe. A growing
middle class and the liberalization of domestic markets are expected to boost total passenger car sales
in India to 1.2 million units by 2005.
China. Hyundai Motor in 2002 became the first foreign carmaker to earn central government approval
to manufacture its passenger cars in China following the country’s admission into the WTO. Our
company has already met many of the challenges of successfully integrating local resources with global
systems. We work with the Beijing Automotive Industry Holdings Co. to implement local marketing and
management decisions at a tactical level in China's unique business environment. And we are working
with leading South Korean parts and technology providers like Hyundai Mobis to establish a
competitive supply network in the country. In step with these partnerships, Hyundai Motor's US$250
million assembly plant near the capital city will see capital investments rise to US$430 million by 2005
and US$1.1 billion by 2010, when China is expected to become the third largest automobile market in
the world.
Our ability to integrate local resources
with global business systems gives us
an advantage in growing and emerging
markets, particularly in Asia.
17
van/minibus Completion of assembly plant
in Turkey Launch of Hyundai Atos
Launch of New Hyundai Super Truck
Launch of Hyundai Accent lean-burn
model 1998 Development of aluminumblock V-6 Delta engine Launch of heavy
trucks in the US market Investment of
US$50 million by Saudi Prince Alwaleed
Launch of Hyundai Sonata Raising of
US$300 million through issue of Asset
Backed Securities Launch of Hyundai
Avante lean-burn model Development of
Hyundai Sola-II solar car Development of
European concept car Hyundai Euro-I
Completion of logistics center in
Belgium Launch of Hyundai XG
Completion of assembly plant in Chennai,
India Acquisition of Kia Motors
1999 Launch of Hyundai Centennial fullsize luxury sedan Naming of Hyundai
Motor as official sponsor of 2002 FIFA World
CupTM Completion of aero-acoustic wind
tunnel in South Korea Trajet mini van
launched 2000 Introduction of Hyundai
HCD-V concept car Introduction of Korea’s
first passenger car diesel engine Completion
of Asia’s first cyber car exhibition center
Launch of Hyundai Elantra Signing of
contract with International Fuel Cells to
develop fuel cell technology for electric
vehicle Participation in the California Fuel
Cell Partnership Launch of Hyundai Santa
Fe SUV Establishment of strategic alliance
with DaimlerChrysler Launch of Korea’s
first automobile business group
Development of Korea’s first heavy-duty
truck engine Partnership with Capstone
Turbine Corporation to develop hybrid car
Honoring of Chairman Chung Mong-Koo
with Automotive Hall of Fame’s DSC
Left: Hyundai Motor officials together with
Chairman Chung Mong-Koo make the rounds
at the Chennai assembly plant in India. Right:
Officials from Hyundai Motor and Beijing
Automotive Industry Holdings Company shake
hands at the signing ceremony for the joint
production of Hyundai cars in China.
Development of Korea’s first fuel cell
electric vehicle Relocation of Hyundai-Kia
to joint headquarters in Yangjae-dong, Seoul
2001 Launch of Hyundai H-1 Truck
Launch of Hyundai New Sonata
Domestic sales of Hyundai Porter 1-T (H100 Truck) pass 1 million units Honoring
of Chairman Chung Mong-Koo with
Automotive Hall of Fame’s DSC
Introduction of Hyundai HCD-6 roadster
concept car Launch of Hyundai Terracan
luxury SUV Launch of Hyundai H-100 1-T
dump truck First production of Hyundai
New XG in Taiwan Launch of Hyundai
New AeroTown bus Production of
Hyundai’s proprietary Beta engine tops 1
million units Introduction of prototype
Hyundai Santa Fe fuel cell vehicle
Honoring of Hyundai Motor with J.D.
Power Chairman Award Launch of
Venezuela. Hyundai Motor, together with local partner MMC Automoriz S.A, will begin
production of Hyundai's midsize Elantra model in Venezuela beginning in 2003. The CKD
(complete knockdown) facility in the South American country will receive technical support
from Hyundai Motor and will produce 10,000 Elantra cars annually. The facility already
produces the Hyundai Accent, which has a 5.6 percent share of the market and has been one
of the country's top-selling passenger cars since its introduction in 1999. The success of the
Hyundai Accent mirrors the performance of our other models, which have nearly doubled their
market share in 2001 from the year previous. Expanding our production capacity in the country
provides us with a platform for sustained growth - to expand sales networks, increase local
marketing programs, and reduce shipping and logistics costs.
Malaysia. Together with Malaysian partner Inocom, Hyundai Motor is expanding its operations
in Southeast Asia's largest passenger car market. The two will increase production volume of
the Hyundai Atos beginning in 2003 to a total of 15,000 units and through to 2005 targeting
35,000 units. Malaysian Prime Minister Mahathir Mohamad has already lauded the Hyundai
Atos for its fuel efficiency and market appeal. Early sales figures for 2003 place Hyundai
Motor above 10 percent market share for passenger cars in the country. We are laying the
groundwork for future progress in the region with our eligibility for preferential tariffs under the
auspices of AFTA, the ASEAN Free Trade Area, and by increasing yearly production of all our
models in Malaysia, Indonesia and other Southeast Asian countries.
Hyundai Motor is investing more in
capital investments and increasing its
worldwide production capacity to
meet rising demand in major markets
in Asia and the Americas.
19
Hyundai Matrix Honoring of Hyundai
Elantra with Car of the Year award in
Yugoslavia Honoring of Hyundai Santa Fe
with first place in AutoPacific satisfaction
survey Launch of Hyundai 2WD Terracan
Domestic sales of Hyundai Grandeur XG
(XG) exceed 100,000 units Cumulative
production volume in India surpasses
200,000 units Inauguration of DaimlerHyundai Truck Corporation Launch of
Hyundai Terracan SUV with 2.9-liter
common rail diesel engine Launch of new
Hyundai Coupe(GK) Monthly sales hit alltime high since 1997 economic crisis
Launch of first commercial vehicles in the
US Honoring of Hyundai Motor with the
Korea Design Management Award
2002 Breaking ground on first North
American proving ground Completion of
the Hyundai-Kia Motors Design & Technical
Center at California Completion of
Hyundai Motor America processing facility at
Port of Baltimore Breaking ground on first
US manufacturing plant in Montgomery,
Alabama Launch of Hi-touch customer
retention system at service departments
Launch of Hyundai Getz supermini
Introduction of Hyundai HCD-7 concept
car Ground breaking for new European
headquarters Hyundai Motor becomes
Left: Officials from Hyundai Motor and MMC
Automoriz S.A sign an agreement for the CKD
production of Hyundai Elantra models in
Venezuela. Right: The Hyundai Atos is
officially named the third national car of
Malaysia, as officials from that country look on.
second largest automaker in India
Motor with second place in consumer rating
Launch of joint venture between Hyundai
Motor and Beijing Automotive Industry
for reliability: tied with Honda Signing of
technical agreement between Hyundai Motor
and MMC Automoriz S.A. of Venezuela
Holding Company in China Signing of
agreement between Hyundai-Kia and United
Technologies to jointly develop fuel cell
Forming of Global Engine Alliance between
Hyundai, DaimlerChrysler and Mitsubishi
vehicles Honoring of Hyundai XG with
Most Remarkable Product award by the
Nihon Keizai Shimbun, Japan’s leading
Signing of MOU between Hyundai Motor
and Quantum Technologies WorldWide Inc.
to jointly develop and commercialize
business newspaper Honoring of Hyundai
advanced fuel systems Honoring of
Hyundai Sonata and Santa Fe with first place
in the 2002 Total Value Index conducted by
Strategic Vision Hyundai Motor Company’s
Sonata received highly favorable reviews from
J.D. Power for performance and design
Introduction of Hyundai OLV concept
vehicle
Canada. Hyundai Motor secured an 8.4 percent share of the Canadian automobile market in
2002 to become the fifth largest carmaker in the country and its third largest import carmaker.
This comes after three consecutive years of 30 percent or higher growth in a highly
competitive environment where nineteen carmakers sell over 135 models to a market that is
roughly one-eleventh the size of the American market. Hyundai Motor's steady growth in
Canada is largely attributed to the success of its sedan lineup including the Accent and the
Elantra, and the growing popularity of its small-size SUV, the Santa Fe. Strong sales follow an
intensive campaign to raise brand awareness, improve customer satisfaction and expand sales
networks.
Libya. The government of Libya in 2002 placed an order for 26,373 Accent cars from
Hyundai Motor in the largest single transaction in the history of the company. The contract
came after an international bid by leading carmakers in South Korea, Europe and Japan Hyundai Motor came out on top in product quality, corporate performance and cost
competitiveness. This follows several large-scale orders by the Libyan government over the
past few years and the second of this year, which saw 6,900 modified Accent cars for
handicap use going to various state-run organizations. These successes give Hyundai Motor a
unique market advantage as the company works to raise brand awareness and sales initiatives
in the region. Libya’s import market and indeed the import automobile market in the region is
expected to grow as the government cancels its double exchange rate system.
Significant improvements in sales and
marketing networks resulted in
record-setting overseas sales and
export totals for 2002.
21
Management
Always preparing for the future and bringing
on change, Hyundai Motor Company has
been leading the automobile industry in the
21st century with its cutting-edge technology
and superior quality as well as a management
ideology to create harmony among
shareholders, customers and automobilerelated companies to enrich the lives of all.
As a company representing the growing Asian
market, Hyundai puts customer satisfaction
first while aggressively pursuing innovation
through continuous efforts such as its Sigma
6 quality improvement campaign, to ensure
that its quality remains at top global standards.
Through its endeavors, Hyundai Motor
Company is stepping closer to realizing its
business vision to become one of the top five
global automakers by 2010.
In addition, Hyundai is actively taking part as
a corporate citizen, driving its operations to
become more environment-friendly to ‘live in
harmony with the environment’. Through the
success of the 2002 Korea/Japan FIFA World
CupTM, Hyundai established the image as the
top Korean automaker in the global market
and is currently putting all its efforts to live up
to the reputation.
In order to fulfill its management ideology and
business vision, Hyundai Motor Company
plans to focus on trust-based management,
site-intensive management and transparent
management in mid-to-long term while
pursuing the following management policies
in short term to maximize its competitive
power and swiftly respond to the everchanging business environment.
First of all, by raising the standards of every
aspect of the company to the global level,
Hyundai will secure competitive power in the
Left: Hyundai Auto Canada is expanding the
number of Hyundai Motor dealerships in the
country following years of strong sales. Right:
A fleet of Hyundai Accent cars line Hyundai
Motor’s seaport on the southern coast of
Korea in the company’s largest export order in
history.
global market while at the same time using its
overseas production plants as a foundation to
reach out into the global market. Second,
Hyundai plans to improve its management
system to ensure a continuous flow of profits
by cutting excessive costs to maximize profits
while investing in promising business areas.
Focusing on core competencies will also help
to minimize effects of the unstable business
environment on the company and enhance
competitive power going forward. Third,
through building trust with its employees
based on humanism, Hyundai Motor
Company will build a ‘Great Workplace’ to
raise the quality of its employee’s lives. Lastly,
Hyundai Motor Company will assume its
responsibilities as a corporate citizen, building
an environment-friendly management
foundation and promoting high morale
standards throughout the company. As a
FIFA World CupTM. The 2002 FIFA World CupTM Korea/Japan was truly an exciting time for
all of us at Hyundai Motor, as official sponsors of the event and as football fans. A total of 32
countries came together to play 64 matches and score 161 goals, thrilling the millions who
took to the streets in Korea's capital city and the millions more who watched on televisions
around the world in this most memorable summer. And what a summer it was for Korean
football, making it to the semi-finals for the first time in history and being voted the most
entertaining team by fans around the world. We did our part: Hyundai Motor invested
substantially in promotions and sponsorships, and donated 631 passenger cars and 422
recreational vehicles for use during the festivities. The Goodwill Ball Road Show took our
team on the road to meet with people in 32 countries to promote the World Cup and foster
goodwill on a global level. This enthusiasm carried over into the Hyundai Football World
Championships. The tournament brought together five-a-side amateur football teams from
nine regions around the world: Korea, Japan, China, Europe, North America, Central and
South America, Asia and Oceania, Africa, and the Middle East. The championships were
played in South Korea prior to the opening ceremonies of the World Cup. We now look
forward to the 2006 FIFA World CupTM in Germany, where the concept will be environmental
protection in four key areas: water, waste, energy and transportation. Together with organizers
and the German government, Hyundai Motor is working to create a World Cup that has a
neutral impact on the global climate.
Sometimes we mix business with
pleasure, by using our global resources
to sponsor some of the world’s biggest
and most watched sporting events.
23
company in the automobile industry, which is
highly responsible for the growth of the
domestic economy and improvement in
community welfare, Hyundai realizes it
importance in its home country as a company
representing Korea and promises to become a
responsible member of the society.
Through these advances in management,
Hyundai Motor Company is striving to
provide better investment opportunities to its
shareholders, increase the trust shared with its
suppliers and dealers and further enhance the
lives of all.
Research and Development
Since its founding in 1967, Hyundai Motor
Company has put extraordinary efforts into
research and development to improve its
proprietary technology.
Through consistent endeavor and investment,
Hyundai was able to attain cutting-edge
technology, which in turn secured a
$65.5million contract in royalty payments for
the next ten years with DaimlerChrysler and
Mitsubishi for its engine technology used in
middle size cars. After introducing its first
proprietary car Pony, manufactured with the
engine technology of Mitsubishi in 1976,
Hyundai has grown to export its technologies
in only 26 years. The Hyundai Kia Motor
Group has invested more than 5% of its total
sales in research and development since 1999
to achieve top tier technology and pave the
way to become the top five in the global
automobile market by 2010. In order to reach
its goals, the company’s R&D center focuses
on developing next generation environment,
safety and telecommunication technologies
while filling its product pipeline with
innovative and competitive models to secure
productivity.
To further enhance its research and
development operations, Hyundai built a
global network of research facilities around its
Left: Hyundai Motor presents some of the 631
passenger cars and 422 recreational vehicles that
were donated during the 2002 FIFA World CupTM.
Right: Soccer celebrities and fans gathered in
London to celebrate the 2002 FIFA World CupTM
festivities in England sponsored by Hyundai Motor.
R&D center in Namyang, Korea, consisting of
the R&D centers in Detroit, Los Angeles,
Tokyo and Frankfurt. In February, 2003 the
Hyundai-Kia California Design and Technical
Center as well as the 4,300 acre Proving
Ground site in the Mojave Desert opened,
completing the global R&D network. Each
research facility develops unique designs and
models to fit the tastes of their region,
improving the company’s global customer
satisfaction and competitive power. Hyundai’s
R&D efforts led to favorable reviews from
J.D.Power at the end of 2002, with the
company’s EF Sonata(Sonata) and Santa Fe
coming in second and third in quality tests
above its global competitors such as Toyota.
Never complacent with achievements,
Hyundai Motor Company will remain
committed to provide world-class automobiles
that exceed Toyota or even a Mercedes in
quality through exhaustive inspection on
product quality from preliminary
development stages.
<Continued>
Responsibility
dust. Growing investments in environmental programs focus on
Our responsibility to the environment is a priority. Hyundai Motor in 2002
On the production side, Hyundai Motor uses state-of-the-art air emission
became the first carmaker to win a gold medal at the Pacific Basin Economic
control equipment and a composite wastewater treatment complex to minimize
Council (PBEC) Environmental Awards. This supports the work we have done
pollutants at its facilities. Notably, Hyundai Motor’s Asan assembly plant uses a
over the last year and indeed over the past few years in implementing solid
zero-effluent system to process and reuse wastewater, which in turn lowers total
environmental initiatives that are result-driven and sustainable. Our efforts in
water consumption at the facility. This is complemented by consistent reductions
environmental protection and renewal begin with management and include
in waste and hazardous chemicals and in the use of energy, water and raw
every aspect of vehicle manufacturing and use, through to end-of-life vehicle
materials in all of Hyundai’s facilities. New technologies that reduce water usage
disassembly. Environmental Management is based on the development and
are the ultrasonic airtight inspection system, the primer-less sealer and non-
execution of a strong environmental policy. The seven action plans followed by
woven fabrics that replace anti-rust waxing material. Water quality is being
Hyundai Motor: to comply with all international environmental guidelines; to
improved by the CWS microorganism treatment facility that biodegrades paint
develop low-emission vehicles; to promote the reduce, reuse and recycle
and odor present in water prior to recycling. Air quality is being improved by a
campaign; to manage and reduce hazardous materials; to support international
series of programs beginning with the use of electric resistant welding to replace
environmental initiatives; to make public our environmental policy; and to train
gas brazing, the use of less harmful paints and the mechanical removal of dust
and educate employees in environmental programs. Subsequent programs are
prior to painting. Significant capital investments in energy saving are
measured against environmental targets in eight categories from pollutants to
concentrated on creating facilities that recover heat to be used again in other
noise levels. This tracks the number of programs in each category and gives a
environmentally friendly product development and direct pollution reduction.
25
processes. In our technology development, we see the diesel engine as an
success rate that can then be used to improve certain areas. Hyundai Motor sets
important first-step towards future zero-emission engines that are powered by
its corporate environmental standards for air emissions and wastewater
electricity or fuel cells. The Common Rail Direct Injection (CRDi) diesel engine
management far below the regulatory standards in each category. The company
by Hyundai Motor lowers the emission of carbon dioxide and other harmful
concentrates on three areas in waste management: treatment as in heat recovery,
gases to levels below conventional diesel engines and far below those of
reduction as in waste segregation and waste recycling as in the reuse of smelting
conventional gasoline engines. The need for diesel-powered cars in the present
and near future is clear: diesel engines produce 20 to 50 percent less carbon
joint project with the State of Hawaii -- military, public works and county
monoxide and hydrocarbons than gasoline engines, they are 20 to 50 percent
personnel are currently operating a total of 15 Santa Fe EVs in the
more fuel efficient and they produce 20 to 50 percent less carbon dioxide. The
demonstration program. Research in these alternative fuels is strengthened by
market share of diesel-powered cars in Europe already exceeds 40 percent--
innovations in environmentally friendly materials. These include: aluminum
about half of the passenger cars sold in France, Spain and Belgium are diesel
frames, aluminum parts, fuel tanks with unleaded surfaces, unleaded paints,
powered. These trends systematically lower emissions of nitrogen oxides, sulfur
extended-life transmission oil and engine coolants, environmentally friendly
oxides, volatile organic compounds, carbon monoxide, particulate matters and
embedded parts, plastic hoods, primer-less instrument panels, highly durable
carbon dioxide to sustainable levels. Hyundai Motor adheres to three major
rubber and air-purifying radiators. Hyundai Motor’s recycling program takes a
environmental pacts that outline reductions in carbon dioxide and greenhouse
long view of the subject, beginning with the development of a car on through to
gas emissions: the Rio Convention on Climate Change, the Kyoto Protocol and
production, use and disposal. At the design phase, engineers independently
the Agreement on Kyoto Protocol Implementation. Work on clean energy
assess the recyclability of new car designs through a web-based assessment
vehicles concentrates on three types: hybrid vehicles that use a combination of
program, the first of its kind in the world. The program evaluates the effect
internal combustion and electricity, fuel cell electric vehicles that generate
design decisions have on end-of-life recycling and provides a platform to
electricity from fuel cells and electric vehicles that use stored electricity. Hybrid
optimize the use of recyclable materials. Prior to production, parts are marked
Our research tours provided
us with a deeper appreciation
vehicles achieve fuel efficiency through efficient engine combination control,
according to their material to allow for effective segregation at disassembly. Once
power assistance from an electric motor, regenerative braking that recovers
at disassembly, Hyundai Motor uses one of the world’s most sophisticated
energy during deceleration and zero fuel consumption in idle. Hyundai Motor’s
dismantling systems to remove fluid, dismantle exterior attachments, dismantle
work in hybrid electric vehicles began in 1995 and includes the County hybrid
electric bus currently in operation in South Korea and the Click HEV scheduled
27
interior parts, and disassemble engine and exhaust parts. Parts-specific recycling
follows in one of three methods: material recycling, energy recovery and reuse.
to hit the market in the near future. Hyundai Motor’s work in fuel cell vehicles
centers on the Santa Fe FCEV, which stores more hydrogen than any other fuel
cell vehicle in the world and placed high at the 2002 Fuel Cell Road Rally in
California. Hyundai Motor’s electric vehicles are now on the road as part of a
Hyundai Motor in 2002 became the first
automobile company to win a gold medal at
the Pacific Basin Economic Council
environmental awards.
Brands
The editors of What Car? magazine selected the Hyundai Getz
as the Best Budget Car for 2003, citing its simple yet appealing
style, its class-leading interior space, its good road manners and its
high level of standard trim. Hyundai Motor s first supermini focuses
on European styling and functionality. The Space Wizard consists
of a 60/40 rear seat and a three-step reclining mechanism with
double-folding and full-flat capabilities. Together with a wider
wheelbase, the Getz delivers more interior space than any other
car in its class. The 42.5-degree panoramic windshield offers
excellent visibility in a small car. Safety features include de-powered
airbags for driver and passenger, side airbags with head protection
and a super-rigid chassis design.
The Hyundai Sonata has been Korea’s best-selling car for
ten of the past eleven years. Here is how others are rating the
Hyundai Sonata: high marks in the New Car Assessment
Program conducted in 2001 by the NHTSA; most appealing
midsize car in the 2002 Automotive Performance, Execution
and Layout study by J.D. Power and Associates; top honors in
its class in the Total Value Index conducted by Strategic Vision.
Standard safety features include xenon-powered HID
headlamps, ABS systems with electronic brake force
distribution, anti-intrusion side impact bars, and crumple zones
front and rear. The Hyundai Sonata is powered by a Sirius 2.0liter DOHC engine or the more powerful 2.7-liter DOHC V6
engine with an all-aluminum block.
The Hyundai Sonata(EF Sonata) was the
most appealing entry in its class in the
2002 Automotive Performance, Execution
and Layout study by J.D. Power and
Associates
The Hyundai Getz was named the
Best Budget Car of 2003 by UK’s
What Car? magazine
31
Hyundai Motor Company has continuously
focused on addressing the ever-changing needs
of its customers when developing its highvalue added products that rank high in
performance environmental standards.
The company will increase its focus on its
customers in future automobile development
to provide more safe and comfortable vehicles
based on human sensibility ergonomics and
human engineering. As environmental
concerns increase, Hyundai is also taking the
lead in developing new environment-friendly
technologies. The potential of company’s fuel
cell technology, which Hyundai is actively
pushing to standardize and commercialize,
was noted when its fuel cell Santa Fe
completed the California Road Rally in
September 2002.
The company also develops environmentfriendly technologies to re-use resources and
recycle used parts while designing models to
minimize its effects on the environment
throughout its product life up to the vehicle’s
disposal.
On the other hand, Hyundai Motor Company
is increasing the use of electronics and
software in its vehicles to offer the world’s
most advanced telematics services for cars.
At present, the company is developing
automatic digital cars that can verbally
communicate with its user and cars with
enhanced safety devices for the elderly.
Production
Consist of five plants with an annual
production capacity of 1.5 million vehicles,
Hyundai’s Ulsan complex is the world’s single
largest automobile production plant. It
produces everything from the Atos minicars to
the Centennial luxury car. The company is
currently pressing forward to boost the plant’s
productivity up to the global levels by 2005.
At its Asan factory, which boasts world-class
productivity, Hyundai produces 300,000 New
EF Sonatas(Sonata) and Grandeur XGs(XG) to
export while its Chunju plant manufactures
100,000 commercial buses, trucks and special
vehicles. The company also leads in flexible
production and productivity using its IBS
system in production plants while
manufacturing cars that use identical
platforms all in one plant and implementing
module workstations to enhance efficiency
and professionalism. In overseas production,
Safety is a priority for the Hyundai Elantra. It earned the highest
rating in its class in side-barrier collision by the National Highway
Traffic Safety Administration in 2001. Safety features include depowered airbags and passenger presence detectors that control
airbag deployment, seatbelt pretensioners and load-limiters that
optimize restraint, and ABS systems with electronic brake force
distribution. Powerplants for the Hyundai Elantra include: a 1.6-liter
Alpha MPI-DOHC engine, a 1.8-liter Beta MPI-DOHC engine and a
2.0-liter Beta MPI-DOHC engine, all three of which provide
improved fuel efficiency and power output over previous engine
models.
Hyundai Motor s first entry in the competitive compact SUV
market is the best pick in its class according to the Total Value
Index conducted by Strategic Vision in 2002. Designed by
Hyundai Motor s California design team, the Hyundai Santa Fe
is consistently voted one of the best values in its class by
independent reviewers. The Hyundai Santa Fe features a double
differential unit that ensures a 60:40 torque distribution between
front and rear axles, a limited slip differential, a steel body
construction and de-powered airbags. Macpherson strut front
suspension and double wishbone rear suspension give the
Hyundai Santa Fe a refined ride in all engine options: a 2.4-liter I-4
engine, a 2.7-liter DOHC Delta engine with an all-aluminum
cylinder block or a 2.0-liter turbocharged diesel engine in Europe.
Flexible rear seating and generous cargo space round out the
essential features of Hyundai Motor s most popular off-roader.
The Hyundai Santa Fe was at the top of its
class in the Total Value Index from Strategic
Vision in 2002
The Hyundai Elantra received top marks
in the side-barrier collision test
conducted by the NHTSA in 2001
the fully owned Indian subsidiary recorded an
annual output of 150,000 Santros, Accents and
EF Sonatas(Sonata) becoming the strategic
beachhead for exporting. In addition, the
success of the 2002 Korea/Japan FIFA World
CupTM led to an improvement in brand
recognition in Turkey, where 60,000 Starex(H1) and New Verna(Accent) are being
manufactured annually.
Hyundai Motor Company also secured a
leading position in the Chinese market, which
33
has been substantially growing in size and
demand as the government encouraged
consumption, became a member of the WTO
and worked to be selected as the host country
for the Olympics. At present, Hyundai’s
production has not been able to keep up with
the rise in orders. The company plans to
introduce the next version of its Avante XD
(Elantra) and strategic models, producing
500,000 cars per year to ensure that Hyundai
remains the most favored automaker in the
Chinese market.
On the other hand, the production plant that
is currently under construction in Alabama
will give help give the image that Hyundai cars
are made by Americans at the heart of global
automobile production while eliminating
foreign exchange risks and pressure from the
US government.
All of Hyundai’s production plants are built to
minimize its effects on the environment. The
company runs its plants based on its
environmental philosophy that the company’s
existence relies on the environment itself.
Hyundai Motor Company helped build the
domestic automobile industry from scratch
and is continuing to substantially affect the
domestic and global market through its
unique production and sales networks.
To reach 5 million cars in annual production
by 2010, Hyundai will increase its efforts
further and firmly establish its name in the
global market.
Sales and Service
In 2002, Hyundai Motor Company reached
new record high sales since its founding as
domestic sales and exports surged by 7.6% and
9.3% y-o-y to 790,004 and 929,130 cars. In
total, the company achieved an 8.5% y-o-y
growth in sales as it sold 1,719,134
automobiles.
A major part of domestic sales came from its
New EF Sonata(Sonata), Avante XD(Elantra),
Grandeur XG(XG) and Equus(Centennial)
models, which recorded an 8.0% growth at
355,136 cars sold in total.
The company showed exceptional strength in
defending its domestic market share from new
model launchings of its competitors as it
secured 58.2% and 59.8% of the small car and
middle car market, respectively. Hyundai’s
New EF Sonata(Sonata) remained the best
selling automobile in the domestic market for
four consecutive years, selling 109,156 cars in
The newest model in Hyundai Motor s HCD concept car series
made its world premiere at the 2002 Chicago Motor Show, a
product of the same design team that introduced the Hyundai
Santa Fe SUV. The HCD-7 represents the next generation of
sporty luxury sedans and could be the future of the Hyundai
XG350 model. The exterior concept borrows from an aircraft
fuselage, with its wraparound windshield and aerodynamic lines.
The interior resembles the cockpit of an executive jet plane, with
its concave side panels and an arched dashboard. The car rides
on armour-like billet aluminum wheels that are 21-inches in
diameter and 10-inches wide, fitted with 245/45R-21 Michelin
tires. The powerplant of the HCD-7 is an all-aluminum DOHC 32valve V-8 engine that generates 270 horsepower at 5,500 RPM.
The newest evolution in Hyundai Motor s high-end sedan class
was unveiled at the 73rd Geneva Motor Show, behind strong
growth for the company in upscale markets in North America and
Europe. The Hyundai XG was already lauded by the Nihon
Keizai Shimbun newspaper in Japan as the most remarkable
product among new car models in 2001. The newest Hyundai
XG350 comes equipped with a sporty 2.5-liter V-6 engine or the
larger 3.0- and 3.5-liter versions for exceptional power, and an
advanced automatic transmission that allows for both automatic
shifting and clutchless manual-style shifting. Anti-lock brakes on
the XG350 are enhanced by traction control systems that
simultaneously adjust brake and throttle to prevent wheel
slippage. The square-type subframe in the front chassis provides
enhanced protection in a frontal collision.
The Hyundai HCD-7 concept car
was unveiled at the 2002
Chicago Motor Show
Japan’s Nihon Keizai Shimbun
newspaper picked the Hyundai XG
as the most remarkable new car
model for 2001
35
2002 alone.
The company’s RV sector also recorded a
12.7% y-o-y growth at 175,579 cars with the
help of bullish sales of Santa Fe and Terracan
models while commercial car sales also
increased by 5.9% to 247,411 cars, mainly
from the company’s Starex(H-1), Porter(H100 Truck) and mid-to-large trucks.
As its market share in the domestic market
continues to increase with the help of
strategically located dealers and sophisticated
logistic systems, Hyundai has introduced
various programs to increase customer
satisfaction. With a goal to secure the top in
brand loyalty by reducing complaints received
from sales and after-sales service to zero, the
company has implemented a customercentered service system with employees
specially educated in customer satisfaction.
As a result, Hyundai has remained at the top
in customer satisfaction in the domestic
market for nine consecutive years. Hyundai
Motor Company will continue to enhance
customer satisfaction by providing speedy,
accurate and courteous service from dedicated
and well-trained service personnel.
From production to shipping, Hyundai has
poured in extraordinary efforts to maximize
customer satisfaction. In order to provide easy
access to after-sales service whenever and
wherever needed, the company has formed an
after-sales service network that encompasses
more than 1,200 outlets in Korea. At the
company’s High-tech Centers, excellent
technology and equipment are used to
guarantee perfect service for its products.
In order to ensure high quality service,
Hyundai operates two personnel education
centers, Chon An and Nambu on top of
providing up-to-date internet and satellite
instruction courses.
In 2002, Hyundai’s exports surged by 10.8% yo-y, also reaching a new record high since the
founding of the company at 1,053,994 cars
The Hyundai Accent World Rally Car 3 (WRC3) builds on
the current generation of Accent cars in engine specifications,
suspension, steering and cooling. Here are some of the
improvements: a newly designed damper improves traction and
overall grip; a revised geometry fine-tunes the suspension
package; and a modified internal valve design of the steering
pump delivers enhanced turning capabilities. The redesigned
bumper and bonnet improve cooling efficiency by allowing more
airflow via reshaped air ducts. The powerplant for the WRC3 is a
DOHC, four-cylinder, turbo-charged, 2.0-liter, 16-valve engine.
Hyundai Motor s Outdoor Lifestyle Vehicle (OLV) made its world
debut at the 2003 North American International Auto Show in
Detroit. The OLV concept was developed simultaneously at
design centers in South Korea and the US, with most of the
design work coming from the Korean team and exterior details
coming from their partners in the US. The Hyundai OLV, not
patterned on any existing models, is a radically new concept car
that pushes the boundaries of present-day SUVs. The car is
powered by a 2.0-liter four-cylinder DOHC engine equipped with
a Borg-Warner supercharger and intercooler system. A modular
roof design allows for the separate removal of three panels and
provides open-air options for driver and passenger, a feature not
available in other convertible cars with single-panel roofs. A
convertible trunk configuration expands on this flexibility, providing
both trunk and flatbed capabilities. The OLV integrates as priorities
the fuel efficiency and handling of a smaller car with the
functionality and durable construction of a sports utility truck.
The Hyundai World Rally Car 3
debuted in the Rally de France on the
Corsican tarmac in 2002
The Hyundai OLV (Outdoor Lifestyle Vehicle)
made its debut at the 2003 North American
International Auto Show in Detroit
37
(oversea production included, KD excluded)
owing to the significant improvement in brand
image through various marketing efforts. In
addition, highly favorable reviews on the
company’s EF Sonata(Sonata) and Santa Fe by
the press and consumer testing institutions
greatly pushed up exports.
Hyundai’s growth in exports has mainly
stemmed from its site-intensive management
policy. The company operates through six
major export centers, HMA in North America,
HME in Frankfurt along with the Central and
South American, Asia Pacific and Eastern
Europe centers in Miami, Dubai and Kuala
Lumpur and Warszawa. In addition, HMJ in
Tokyo has paved the way into the Japanese
market for Hyundai. Professionals have been
dispatched to analyze the market situation and
sales trends of each region and form a suitable
marketing and promotion strategy.
Hyundai will continue maintain a customers’
perspective to improve its competitive power
in the global market. Its efforts to become the
top company in customer satisfaction has
already pushed up the company’s customer
satisfaction index near Toyota’s CSI, which
ranked first in global customer satisfaction in
2002. Hyundai Motor Company plans to
surpass Toyota’s figures by 2005. Hyundai
Motor Company is able to provide prompt
service around the clock through its internet
service network. To ensure service skills are
fully up-to-date, service-training personnel are
dispatched to all major foreign markets where
they provide on-site and hands-on training
courses. The company has established training
centers in Germany, Australia, Singapore and
the United Arab Emirates.
The company has built a sophisticated logistic
system to ensure easy access to automobile
parts and after sale services in the US and
Europe. Recently, it has expanded its supply of
parts and top-quality service to all part of
China. Through its global network of regional
Alternative Energy Vehicles
The State of Hawaii and Hyundai Motor
embarked on an Electric Vehicle (EV)
program in November 2000 and now
operate 15 Hyundai Santa Fe EVs on the
island. The electric vehicles use a storage
battery that powers the motor and
peripheral systems, without emitting
pollutants. The Hyundai Click Hybrid
Electric Vehicle (HEV) is 30 to 40 percent
more fuel efficient than gasoline-powered
models. The hybrid electric vehicle relies
on both electric power and internal
combustion to operate its systems. The
electric motor assists the gasolinepowered engine during acceleration and
regains energy during braking, while using
no fuel during idle periods. The Hyundai
Santa Fe H2 Fuel Cell Vehicle (FCV) took
top honors at the Michelin Bibendum
Environmental Rally in 2001. The Santa
Fe H2 FCV won the best FCV award, a
gold medal in both emissions and noise,
and a silver medal in both fuel economy
and slalom. The fuel cell vehicle uses
hydrogen and oxygen to generate the
power it needs, and produces water as its
only emission. The Hyundai Santa Fe Fuel
Cell Electric Vehicle (FCEV) finished
among the top carmakers at the 2002
Fuel Cell Road Rally in California. The fuel
cell electric vehicle, much like an electric
hybrid vehicle, is assisted by an electric
motor. The Hyundai Santa Fe FCEV, with
its 5,000psi fuel tank, can store more
hydrogen than any other fuel cell vehicle
in the world.
Engines
Hyundai Motor's newest midsize engines,
co-developed with DaimlerChrysler and
Mitsubishi, will power select cars from the
three companies as part of the Global
Engine Alliance. Hyundai Motor has lead
responsibility in the Global Engine
Alliance development program. Hyundai
Motor's high-tech direct injection diesel
engine (HTI) generates 115ps of power
at only 93.5dBA of NVH. The direct
injection system for diesel engines is one
of the most advanced of its kind,
significantly increasing power output over
conventional diesel engines. The Hyundai
direct injection gasoline engine (HIDI)
runs in both stratified combustion and
homogenous combustion modes, and can
achieve ultra-lean burn. The system
adjusts combustion during partial load,
when less power is needed, and during
full load, when maximum power is
needed. Our patented H-matic or
continuously variable transmission (CVT)
gives no perceptible shift shock, improves
fuel efficiency and increases acceleration
by 8 to 11 percent over other automatic
Lightweight Cars
The Hyundai Tiburon sports coupe in
1997 became our first show car built with
an all-aluminum monocoque body. The
aluminum monocoque provides superior
strength and lightness, particularly useful
in performance cars, fuel cell vehicles and
other specialty vehicles that must
accommodate a large engine or heavy
components. Hyundai Motor is working
on an aluminum space frame body that
builds on the advantages of the
monocoque body by allowing more
flexibility in assembly and improved
strength in use.
transmissions. The transmission is being
installed in newer Hyundai Sonata
models.
Airbag Systems
Advanced airbags will be installed in
select Hyundai models beginning this
year and will be installed in all other
models by 2005. This safety feature
works together with passenger presence
detector to recognize the weight and
position of occupants to adjust
deployment. Hyundai Motor has
developed the world's first head-thorax
airbag that protects both the head and
the chest in the event of a side impact.
The larger airbag can also prevent
occupants from being thrown from the car
or from being injured by foreign objects.
Chassis Systems
Hyundai Motor's first-of-its-kind Active
Geometry Control Suspension (AGCS)
represents the next generation in
advanced suspension systems. The
suspension system deflects forces at an
angle, not head-on like conventional
39
1. The Hyundai Santa Fe Fuel Cell Electric Vehicle placed
well at the Environmental Rally in California. 2. The allaluminum body of the Hyundai Getz model car is lightweight
and remarkably strong, improving fuel efficiency,
performance and safety on the road. 3. Hyundai Motor
powerplants provide the right balance of fuel efficiency,
performance and cost effectiveness, through a complete
range of outputs. 4. Side airbags and advanced curtain
airbags will be introduced in some newer Hyundai models.
5. Select Hyundai Motor chassis systems incorporate front
MacPherson struts and rear dual link setup to provide
superior handling and comfort.
1
2
centers managing sales and services, Hyundai
will continue to increase its sales based on the
trust of its customers and improved brand
image as a global automobile manufacturer.
Marketing
Hyundai Motor Company announced its
plans to become one of the top five global
automobile makers by 2010, not only in terms
of quantity but also in all aspects including
3
profits, quality and brand value.
To reach this goal, Hyundai branched off its
marketing division from its sales department
in 2002 and launched the marketing
headquarters at the beginning of 2003,
merged with the marketing department of Kia
Motor. At present, the company has divided
the global market into major segments,
namely North America, Europe, Asia Pacific,
Middle East, China and India, to implement
site-intensive marketing.
4
In the North American market where
competition among global automobile
manufacturers has become exceedingly fierce,
Hyundai has received highly favorable reviews
on all of its products from the local press as
well as its customers for its improvement in
quality and continuous marketing efforts
including the highly successful campaign
offering astounding warranty periods.
In the continuously growing Middle East and
East Asian markets, Hyundai has seen a steady
5
increase in sales as it tailors its marketing
efforts on the economical and cultural
characteristics of the region. The company
will work to improve its sales as well as
customer satisfaction in those promising areas
going forward. Realizing the importance of
regional aspects, the marketing headquarters
of Hyundai Motor sent out marketing
specialists to its overseas divisions to better
understand and address the exact needs of the
specific market. The company’s devotion in
‘Glocalization’ propelled its growth to become
the seventh automobile company in the
world.
Hyundai Motor Company is also improving
its brand image to match its vision as one of
the top five global automobile companies.
Since the late 1990s, Hyundai realized the
importance of its brand image as an intangible
asset and replaced its C.I.P to give a more
futuristic impression. Through aggressive
marketing campaigns and various sports
systems. The first AGCS systems could
hit the commercial market as early as next
year. Hyundai Motor's Variable Rack
Stroke (VRS) increases turning ratios for
improved control and handling.
Soundproofing Systems
Hyundai Motor tests aerodynamics and
NVH in one of the world's largest, most
advanced wind tunnels. The US$40
million facility in South Korea can
generate wind speeds of 200kph from its
2.5megawatt, 3,400-horsepower motor.
Auxiliary facilities allow engineers to
control the humidity and temperature
within the testing area to measure the
insulation, air conditioning and heating
functions of a new car model.
Recycling Systems
Our reusable parts program introduced
this year is expected to recover 2.28
million used bumpers annually to be
resold as aftermarket parts. Other
initiatives include: instrument panels
recycled into radiator grilles, carpet
recycled into luggage trim and urethane
foam recycled into floor insulation.
Hyundai Motor's web-based Recyclability
Assessment Information System is the
first of its kind in the world. It allows
designers and engineers to accurately
measure the amount of recyclable material
present in a new car design and optimize
the use of environmentally friendly
materials. Our main research center in
South Korea is developing one of the
most advanced disassembly lines for endof-life dismantling. Waste materials and
recyclable materials are segregated or
recovered in an assembly-line process as
opposed to the conventional island-type
dismantling process.
ABS/TCS, engine EMS and transmission
TCU on a mid-size vehicle, the Hyundai
Sonata. This simplifies the logic required
to run these systems, which in turn has
paved the way for their introduction on a
much wider range of car models.
Safety Testing
The Hyundai Elantra led other cars in its
class in the National Highway Traffic
Safety Administration (NHTSA) sidebarrier collision test conducted in 2001.
The Hyundai Sonata received high marks
in the New Car Assessment Program
conducted in 2001 by the NHTSA. The
Hyundai Santa Fe led all other small-size
SUVs in tests conducted by the Insurance
Institute for Highway Safety in the US in
2001.
Brake Systems
Hyundai Motor led the market by
introducing its electronic brake
distribution (EBD) systems with ABS in
1998. The system works adjusts the force
of braking on specific wheels to prevent
skidding in brakes and turns. Hyundai
Motor again led the domestic market in
1998 with the first application of its
controller area network (CAN) to connect
Telematics
Hyundai Motor is working with IBM on
open-systems based telematics solutions
that are voice-activated, scalable and
secure, for introduction on the market this
year. Telematics connects cars and
drivers and remote service centers,
sending and receiving information used
for safety, navigation, news and
entertainment. The Hyundai Motor
telematics service center was established
in 2002 to support domestic telematics
service when it becomes available on the
mass market. The center will be able to
respond in emergencies, contact repair
services, send personalized information
and receive feedback from Hyundai car
owners.
Design Systems
Hyundai Motor uses one of the most
advanced computer-aided design facilities
in the world to assist its design teams in
Namyang, Irvine, Russelsheim and Tokyo.
The system uses projectors and three
wall-size screens to create threedimensional conceptualizations in fullscale.
41
1
marketing activities, the company was able to
substantially improve its brand recognition
and corporate image. Hyundai Motor
Company, as the official sponsor of the 2002
FIFA World CupTM, launched a variety of
marketing events that increased the
company’s visibility in the global market as
the national football team recorded
astonishing results. In addition, the
company’s rally team recently came in fourth
in the World Rally with its Accent.
2
Hyundai Motor Company will continue to
effectively manage its brand asset by forming a
global brand strategy for Hyundai and Kia
Motor in 2003. As the official sponsor of the
2006 Germany FIFA World CupTM as well as
EURO 2004, Hyundai will focus its marketing
efforts to improve its brand recognition and
firmly plant a brand image in the global
market, creating the foundation to reach its
long-term goal as one the top five global
automakers.
3
Corporate Citizenship
Automobiles have played an immense part in
improving our lives. Hyundai Motor
Company has put in even more efforts to help
develop its community through a variety of
social and cultural activities to help the
disadvantaged members of society such as
orphans and the needy.
Hyundai recognizes the environment as a core
corporate value and continues to contribute to
4
1. Hyundai Motor engineers use one of the world’s largest
and most advanced wind tunnels at Hyundai Motor’s main
research facility in South Korea. 2. Market-leading research
and strict testing make Hyundai Motor cars more responsive
to drivers and improve safety through integrated brake
systems. 3. Hyundai cars meet and often exceed industry
standards for safety in a range of crash tests, including front
impact, side impact and offset tests. 4. Hyundai Motor
telematics systems will be installed in select car models
beginning this year, providing in-car services in road safety,
navigation, entertainment and information. 5. Hyundai
Motor’s main R&D center houses one of the world’s largest
computer-aided design facilities.
5
the society through better environmental
management. In order to promote better
understanding of the environment, the
company has held environment concerts,
drawing contests, events as well as a campaign
to save Mt. Bukhan. In addition to providing
financial support for future automobile
designers, the Korea Car Design Contest
sponsored by Hyundai attracts creative minds
year after year while sparking public interest
for automobiles.
In cooperation with Seoul National University
and Ulsan University, Hyundai offers
Mechatronics education and invests in KAIST
to nurture future specialists and develop
cutting-edge technology.
Hyundai will continue to show its devotion for
its community through sponsoring and
initiating cultural events and reaching out to
children and neglected members of the society.
Full Lineup
Financial Statements:
46
48
50
51
53
56
Report of Independent Public Accountants
Consolidated Balanced Sheets
Consolidated Statements of Income
Consolidated Statements of Changes in Shareholders’ Equity
Consolidated Statements of Cash Flows
Notes to Consolidated Financial Statements
Anjin & Co
HYUNDAI MOTOR COMPANY AND SUBSIDIARIES
14th Floor, Hanwha Securities Building
23-5 Yoido-dong, Youngdeungpo-ku
Seoul 150-717, Korea
Yoido P.O.Box 537
CONSOLIDATED FINANCIAL STATEMENTS
AS OF DECEMBER 31, 2002 AND 2001
TOGETHER WITH INDEPENDENT PUBLIC
ACCOUNTANTS’ REPORT
REPORT OF INDEPENDENT PUBLIC ACCOUNTANTS
(English Translation of a Report Originally Issued in Korean)
To the Shareholders and Board of Directors of
Hyundai Motor Company:
We have audited the accompanying consolidated balance sheets of Hyundai Motor Company and subsidiaries as
of December 31, 2002 and 2001, and the related consolidated statements of income, changes in shareholders’
equity and cash flows for the years then ended, all expressed in Korean won. These financial statements are the
responsibility of the Company’s management. Our responsibility is to express an opinion on these financial
statements based on our audits. In 2002 and 2001, we did not audit the financial statements of certain
subsidiaries, which statements represent total assets of 10,105,983 million ($8,418,846 thousand) and
9,785,279 million ($8,151,682 thousand), respectively, and total revenues of 19,235,200 million ($16,023,992
thousand) and 15,819,077 million ($13,178,171 thousand), respectively. Those statements were audited by
other auditors whose reports have been furnished to us, and our opinion, insofar as it relates to the amounts
included for those entities, is based solely on the reports of other auditors.
We conducted our audits in accordance with auditing standards generally accepted in the Republic of Korea.
Those standards require that we plan and perform the audit to obtain reasonable assurance about whether the
financial statements are free of material misstatement. An audit includes examining, on a test basis, evidence
supporting the amounts and disclosures in the financial statements. An audit also includes assessing the
accounting standards used and significant estimates made by management, as well as evaluating the overall
financial statement presentation. We believe that our audits provide a reasonable basis for our opinion.
In our opinion, based on our audits and the reports of other auditors, the financial statements referred to above
present fairly, in all material respects, the financial position of Hyundai Motor Company and subsidiaries as of
December 31, 2002 and 2001, and the results of their operations and changes in the shareholders’ equity and
their cash flows for the years then ended in conformity with financial accounting standards in the Republic of
Korea (see Note 2).
The translated amounts in the accompanying financial statements have been translated into U.S. dollars, solely for
the convenience of the reader, on the basis set forth in Note 2.
As discussed in Note 1, in 2002, the Company added two domestic companies including Daimler Hyundai Truck
Co., Ltd. and ten overseas companies including Hyundai Motor Europe GmbH (HME) to its consolidated
subsidiaries. These changes in the scope of consolidation increased the Company’s consolidated assets,
shareholders’ equity and revenues by 698,043 million ($581,509 thousand), 29,926 million ($24,930
thousand) and 1,094,755 million ($911,992 thousand), respectively and decreased consolidated net income by
22,069 million ($18,385 thousand) as compared to the results using the previous scope of consolidation.
46
Tel 82(2) 6676-1000, 1114
Fax 82(2) 785-4753, 786-0267
As explained in Note 2, the Company adopted Statement of Korea Accounting Standards (SKAS) No. 3 –
Intangible Assets, SKAS No. 6 - Events Occurring after the Balance Sheet Date and SKAS No. 7 – Capitalization of
Financing Costs and changed the estimated economic useful lives for certain types of development costs. Kia
Motors Corp., a domestic subsidiary, changed its method in estimating accrued warranty for the exported vehicles
and Hyundai HYSCO, a domestic subsidiary, changed its estimated economic useful life of development cost from
twenty years to ten years. These changes of accounting principles and estimates resulted in the decrease of
consolidated net income and current liabilities by 463,420 million (US$386,055 thousand) and 301,628
million (US$251,273 thousand), respectively and the increase in minority interests by 58,549 million
(US$48,775 thousand) compared with the results based on the previous method. Also, the consolidated financial
statements as of December 31, 2001, which are presented for comparative purposes, were revised and this
revision resulted in the decrease of current liabilities by 220,179 million (US$183,421 thousand) and the increase
of retained earnings and minority interests by 215,145 million (US$179,228 thousand) and 5,035 million
(US$4,194 thousand), respectively as of December 31, 2001, compared with the results based on the previous
method.
As disclosed in Note 2, in 2002, the Company and Kia Motors Corp., one of its domestic subsidiary, recognize
accrued liabilities for the projected expenses due to an End-of-Life Vehicles (ELV) directive in European Union. In
2002, the provision for the accrual due to ELV directive amounting to 299,560 million (US$ 249,550 thousand)
was accounted for as selling expense and non-operating expense.
Accounting principles and auditing standards and their application in practice vary among countries.
The accompanying financial statements are not intended to present the financial position, results of operations and
cash flows in accordance with accounting principles and practices generally accepted in countries other than the
Republic of Korea. In addition, the procedures and practices utilized in the Republic of Korea to audit such financial
statements may differ from those generally accepted and applied in other countries. Accordingly, this report and
the accompanying financial statements are for use by those knowledgeable about Korean accounting procedures
and auditing standards and their application in practice.
Seoul, Korea
April 4, 2003
Notice to Readers
This report is effective as of April 4, 2003, the auditors’ report date. Certain subsequent events or circumstances
may have occurred between the auditors’ report date and the time the auditors' report is read. Such events or
circumstances could significantly affect the accompanying financial statements and may result in modifications to
the auditors’ report.
47
HYUNDAI MOTOR COMPANY AND SUBSIDIARIES: Financial Statements 2002
CONSOLIDATED BALANCE SHEETS AS OF DECEMBER 31, 2002 AND 2001
HYUNDAI MOTOR COMPANY AND SUBSIDIARIES: Financial Statements 2002
CONSOLIDATED BALANCE SHEETS (CONTINUED) AS OF DECEMBER 31, 2002 AND 2001
Korean won
(in millions)
ASSETS
Current assets:
Cash and cash equivalents (Note 15)
Short-term financial instruments (Note 15)
Marketable securities (Notes 4 and 15)
Trade notes and accounts receivable, less
allowance for doubtful accounts of 289,549
million in 2002 and 297,372 million in 2001
and unamortized discount of 2,820 million
in 2002 and 4,215 million in 2001
Inventories (Note 3)
Advances and other, net of allowance for
doubtful accounts of 165,122 million in 2002
and 210,420 million in 2001 and unamortized
discount of 9,639 million in 2002 and
14,540 million in 2001
Total current assets
Non-current assets:
Long-term financial instruments (Note 15)
Investment, net of unamortized discount of
23,341 million in 2002 and 25,545 million
in 2001 (Notes 4 and 15)
Property, plant and equipment, net of
accumulated depreciation of 6,415,241
million in 2002 and 5,317,325 million in
2001 (Notes 5, 6, 7 and 15)
Intangibles (Note 8)
Other assets (Note 9)
Deferred income tax assets (Note 18)
Total non-current assets
2002
2001
2,765,872
3,610,223
710,474
2,304,424
1,634,060
866,521
Translation into
U. S. dollars (Note 2)
(in thousands)
2002
2001
$
2,304,125
3,007,517
591,864
$
1,919,713
1,361,263
721,860
2,198,905
3,819,999
1,848,372
3,787,927
1,831,810
3,182,272
1,539,797
3,155,554
2,005,079
15,110,552
1,597,411
12,038,715
1,670,343
12,587,931
1,330,732
10,028,919
102,195
99,735
85,134
83,085
2,061,273
1,743,242
1,717,155
1,452,218
16,745,238
1,678,110
693,842
1,366,637
22,647,295
16,905,497
2,151,235
731,407
1,134,052
22,765,168
13,949,715
1,397,959
578,009
1,138,485
18,866,457
14,083,220
1,792,098
609,303
944,728
18,964,652
8,367,841
5,068,413
6,970,877
4,222,270
46,125,688
39,872,296
Korean won
(in millions)
LIABILITIES AND SHAREHOLDERS EQUITY
Current liabilities:
Short-term borrowings (Note 11)
Current maturities of long-term debt, net of
unamortized discount of 657 million in
2002 and 5,877 million in 2001 (Note 12)
Trade notes and accounts payable
Accrued warranties and product liabilities
Accounts payable-other
Accrued expenses
Income tax payable
Other current liabilities
Total current liabilities
Long-term liabilities:
Long-term debt, net of current maturities
(Note 12)
Accrued severance benefits, net of National
Pension payments for employees of 123,960
million in 2002 and 141,674 million in
2001 and individual severance insurance
deposits of 1,513,268 million in 2002 and
1,250,037 million in 2001 (Note 2)
Accrued loss on valuation of derivatives
(Note 2)
Accrued warranties and product liabilities
Deferred income tax liabilities (Note 18)
Other long-term liabilities
Total long-term liabilities
Other financial business liabilities
Total liabilities
Other financial business assets (Note 10)
Translation into
U. S. dollars (Note 2)
(in thousands)
2002
2001
2002
2001
7,526,948
6,748,184
3,049,849
4,695,480
901,254
2,741,462
314,674
585,447
1,016,682
20,831,796
2,768,331
3,775,059
725,040
1,488,025
621,008
415,405
1,116,014
17,657,066
2,540,694
3,911,596
750,795
2,283,790
262,141
487,710
846,952
17,354,045
2,306,174
3,144,834
603,999
1,239,607
517,334
346,055
929,702
14,709,318
8,010,263
8,259,094
6,672,995
6,880,285
955,281
752,244
795,802
626,661
17,053
2,401,220
124,295
334,966
11,843,078
62,382
1,171,058
84,891
181,433
10,511,102
14,206
2,000,350
103,545
279,045
9,865,943
51,968
975,556
70,719
151,144
8,756,333
12,732
-
10,607
-
32,687,606
28,168,168
$
27,230,595
$
23,465,651
1,476,454
5,286,061
1,476,454
5,306,332
$
1,229,968
4,403,583
$
1,229,968
4,420,470
3,677,983
(106,417)
3,104,001
13,438,082
2,473,940
(65,435)
2,512,837
11,704,128
46,125,688
39,872,296
$
6,270,367
$
5,621,613
Commitments and contingencies (Note 22)
Total assets
$
38,425,265
$
33,215,841
(continued)
Shareholders’ equity:
Capital stock (Note 13)
Capital surplus
Retained earnings
(Net income of 1,434,395 million in 2002
and 1,152,136 million in 2001)
Capital adjustments (Note 14)
Minority interests
Total shareholders’ equity
Total liabilities
and shareholders’ equity
3,063,964
(88,651)
2,585,806
11,194,670
$
38,425,265
2,060,930
(54,511)
2,093,333
9,750,190
$
33,215,841
See accompanying notes to consolidated financial statements
48
49
HYUNDAI MOTOR COMPANY AND SUBSIDIARIES: Financial Statements 2002
CONSOLIDATED STATEMENTS OF INCOME FOR THE YEARS ENDED DECEMBER 31, 2002 AND 2001
HYUNDAI MOTOR COMPANY AND SUBSIDIARIES: Financial Statements 2002
CONSOLIDATED STATEMENTS OF CHANGES IN SHAREHOLDERS’ EQUITY
FOR THE YEARS ENDED DECEMBER 31, 2002 and 2001
Translation into
U. S. dollars (Note 2)
(in thousands, except
per share amounts)
2002
2001
Korean won
(in millions, except per
share amounts)
2002
2001
Sales
48,122,919
39,851,575
Cost of sales
35,462,821
29,307,330
29,542,503
24,414,637
Gross profit
12,660,098
10,544,245
10,546,566
8,783,943
Selling and administrative expenses (Note 16)
9,529,256
7,426,130
7,938,401
6,186,380
Operating income
3,130,842
3,118,115
2,608,165
2,597,563
210,619
(132,258)
(209,587)
562,326
101,732
113,543
175,457
(110,178)
(174,598)
468,449
84,748
94,588
70,065
27,599
58,368
22,991
63,971
219,694
53,291
183,017
206,424
5,331
83,472
30,603
171,963
4,441
69,537
25,494
291,708
(37,022)
(81,206)
388,045
95
80,689
1,219,753
243,009
(30,841)
(67,650)
323,262
79
67,219
1,016,122
2,742,797
1,898,362
2,284,903
1,581,441
-
190,650
-
158,822
Other expenses, net:
Interest expense, net
Loss on foreign currency translations, net
Loss (gain) on foreign currency transaction, net
Loss on valuation of investments accounted
for using the equity method, net
Loss on disposal of investments
and other assets, net
Loss on disposal of property, plant and
equipment, net
Loss on valuation of inventory
Provision for accrued warranties and product
liabilities
Loss (gain) on redemption of debentures, net
Other, net
Ordinary income
Extraordinary items:
Other extraordinary gain, net (Note 17)
$
40,089,069
$
Korean won
(in millions)
Capital
stock
33,198,580
January 1, 2001
2,742,797
2,089,012
844,344
671,164
703,386
559,117
1,898,453
1,417,848
1,581,517
1,181,146
(464,058)
(265,712)
(386,586)
(221,353)
1,434,395
1,152,136
$
1,194,931
$
959,793
Ordinary income per ordinary common share
6,313
5,713
$
5.26
$
4.76
Earnings per ordinary common share
6,313
5,103
$
5.26
$
4.25
Ordinary income per fully diluted common share
6,290
-
$
5.24
$
-
Earnings per fully diluted common share
6,290
-
$
5.24
$
-
Income tax expense (Note 18)
Income before minority interests
Minority interests
Net income
$
2,284,903
$
1,740,263
Capital
surplus
1,476,454
Difference between additional
investment and equity of
subsidiaries
Disposal of subsidiaries’ stock
Disposal of treasury stock
Retirement of treasury stock by
retained earnings
Retirement of subsidiaries’ treasury
stock
Application of the equity
method
Effect of change in the scope of
consolidation
Effect of change in the scope of
equity method
Payment of cash dividends
Net income
Treasury stock
Discount on stock issuance
Loss on valuation of investment
equity securities
Stock options
Cumulative translation debits
Loss on transaction of derivatives
Effect of change in the minority
interest
Others
December 31, 2001
Income before income tax
Translation into
U.S. dollars
(Note 2)
(in thousands)
Retained
earnings
Capital
Minority
adjustments interest
Total
amount
5,354,390
1,708,256
(795,174)
2,417,595
-
(74,984)
(75,004)
15,380
(62,139)
-
49,264
213,342
-
-
-
(168,694)
168,694
-
68,732
-
-
-
-
(1,649)
-
(43,854)
-
Total
amount
10,161,521 $ 8,465,112
(74,984)
(87,879)
228,722
(62,466)
(73,208)
190,538
-
-
-
68,732
57,258
(2,252)
-
(3,901)
(3,250)
(486)
-
48,151
3,811
3,175
-
(33)
(165,387)
1,152,136
-
477
40,369
(573)
(2,297)
-
444
(167,684)
1,152,136
40,369
(573)
370
(139,690)
959,793
33,630
(477)
-
-
-
194,237
6,693
14,188
45,300
-
194,237
6,693
14,188
45,300
161,810
5,576
11,819
37,737
-
61,672
11,936
-
49,388
-
49,388
73,608
41,143
61,320
1,476,454
5,306,332
2,473,940
(65,435)
2,512,837
11,704,128 $ 9,750,190
(continued)
See accompanying notes to consolidated financial statements
50
51
HYUNDAI MOTOR COMPANY AND SUBSIDIARIES: Financial Statements 2002
CONSOLIDATED STATEMENTS OF CHANGES IN SHAREHOLDERS’ EQUITY (CONTINUED)
FOR THE YEARS ENDED DECEMBER 31, 2002 AND 2001
HYUNDAI MOTOR COMPANY AND SUBSIDIARIES: Financial Statements 2002
CONSOLIDATED STATEMENTS OF CASH FLOWS FOR THE YEARS ENDED DECEMBER 31, 2002 AND 2001
Korean won
(in millions)
Capital
stock
January 1, 2002
Difference between additional
investment and equity of
subsidiaries
Disposal of treasury stock
Merger between subsidiaries
Application of the equity
method
Effect of change in the scope of
consolidation
Effect of change in the scope of
equity method
Payment of cash dividends
(Note 19)
Net income
Treasury stock
Discount on stock issuance
Loss on valuation of investment
equity securities
Stock options
Cumulative translation debits
Loss on transaction of derivatives
Effect of change in the minority
interest
Others
December 31, 2002
Capital
surplus
1,476,454
Retained
earnings
5,306,332
Capital
Minority
adjustments interest
2,473,940
Korean won
(in millions)
Translation into
U.S. dollars
(Note 2)
(in thousands)
(65,435)
Total
amount
2,512,837
Total
amount
11,704,128 $ 9,750,190
-
(24,222)
(18)
-
1,785
-
-
(24,222)
(18)
1,785
(20,178)
(15)
1,487
-
-
(1,219)
-
-
(1,219)
(1,015)
-
(588)
590
1,906
52,300
54,208
45,158
-
-
-
(3,182)
-
(3,182)
(2,651)
-
1
(215,145)
1,434,395
-
(6,867)
248
(5,002)
-
(220,147)
1,434,395
(6,867)
249
(183,395)
1,194,931
(5,721)
207
-
-
-
(4,704)
(82)
(67,578)
39,277
-
(4,704)
(82)
(67,578)
39,277
(3,919)
(68)
(56,296)
32,720
-
4,556
(16,363)
-
543,866
-
543,866
(11,807)
453,071
(9,836)
1,476,454
5,286,061
3,677,983
(106,417)
3,104,001
13,438,082 $11,194,670
See accompanying notes to consolidated financial statements
Cash flows from operating activities:
Net income
Adjustments to reconcile net income to net cash
provided by operating activities:
Depreciation
Loss on foreign currency translation, net
Loss on disposal of investments, net
Loss on valuation of investments accounted
for using the equity method, net
Loss on disposal of property,
plant and equipment, net
Loss on valuation of inventories
Loss (gain) on redemption of debentures, net
Loss on impairment of investments
Loss on disposal of trade receivables
Amortization of discount on debentures
Amortization of intangibles, net
Provision for severance benefits
Provision for warranties and product liability
Provision of allowance for doubtful accounts
Other extraordinary gain, net
Minority interests
Changes in operating assets and liabilities:
Decrease (increase) in trade notes and accounts
receivable
Decrease in advances
Decrease (increase) in inventories
Decrease in other current assets
Decrease in long-term notes and
accounts receivables
Increase in deferred income tax assets
Increase in other financial subsidiaries Assets
Increase (decrease) in trade notes and
accounts payable
Increase in accounts payable-other
Increase (Decrease) in other current liabilities
Decrease in individual severance insurance deposits
Decrease in accrued warranties and accrued
product liabilities
Decrease in accrued loss on valuation of derivatives
Decrease (increase) in deferred income tax liabilities
Payment of severance benefits
Others
Translation into
U. S. dollars (Note 2)
(in thousands)
2002
2001
2002
2001
1,434,395
1,152,136
1,194,931
959,793
1,537,250
(131,965)
63,971
1,452,578
102,039
219,694
1,280,615
(109,934)
53,291
1,210,079
85,004
183,017
70,065
27,599
58,368
22,992
206,424
5,331
(37,022)
40,850
88,006
68,157
830,727
753,464
1,765,807
592,345
464,058
83,472
30,603
95
38,774
102,830
56,180
686,380
404,352
1,189,987
495,165
(190,650)
265,712
171,963
4,441
(30,841)
34,030
73,314
56,779
692,042
627,677
1,471,015
493,456
386,586
69,537
25,494
79
32,301
85,663
46,801
571,793
336,848
991,325
412,500
(158,822)
221,353
(1,076,727)
158,826
(310,670)
63,411
190,694
125,825
293,355
134,094
(896,974)
132,311
(258,805)
52,825
158,859
104,819
244,381
111,708
10,906
(32,119)
(4,114,688)
1,163
(171,309)
(3,701,979)
9,085
(26,757)
(3,427,764)
969
(142,710)
(3,083,955)
1,630,804
846,440
(239,565)
(266,017)
(1,671,744)
138,399
422,723
(226,847)
1,358,550
705,132
(199,571)
(221,607)
(1,392,656)
115,294
352,152
(188,976)
(143,349)
(38,318)
(103,728)
(308,575)
(100,756)
3,727,738
(581,266)
(83,537)
264,766
(288,906)
(104,714)
857,663
(119,418)
(31,921)
(86,411)
(257,060)
(83,935)
3,105,413
(484,227)
(69,591)
220,565
(240,675)
(87,233)
714,481
(continued)
52
53
HYUNDAI MOTOR COMPANY AND SUBSIDIARIES: Financial Statements 2002
CONSOLIDATED STATEMENTS OF CASH FLOWS (CONTINUED)
FOR THE YEARS ENDED DECEMBER 31, 2002 AND 2001
Korean won
(in millions)
Translation into
U. S. dollars (Note 2)
(in thousands)
2002
2001
2002
2001
6,487,542
8,445,545
4,442,551
307,792
280,860
4,262,003
909,238
847,911
3,700,892
256,408
233,972
3,550,485
757,446
706,357
183,709
11,702,454
395,762
14,860,459
153,040
9,748,795
329,692
12,379,589
(6,318,491)
(6,271,525)
(42,308)
(821,821)
(222,059)
(1,686,611)
(291,690)
(15,654,505)
(3,952,051)
(3,929,209)
(8,825,279)
(864,293)
(1,389,858)
(580,125)
(1,984,248)
(976,785)
(18,549,797)
(3,689,338)
(5,263,654)
(5,224,529)
(35,245)
(684,623)
(184,988)
(1,405,040)
(242,994)
(13,041,073)
(3,292,278)
(3,273,250)
(7,351,949)
(720,004)
(1,157,829)
(483,276)
(1,652,989)
(813,716)
(15,453,013)
(3,073,424)
21,315,448
4,993,859
58,761
4,931
20,647
26,393,646
13,078,341
6,604,869
150,941
232,955
240,147
20,307,253
17,756,955
4,160,162
48,951
4,108
17,200
21,987,376
10,894,986
5,502,224
125,742
194,064
200,056
16,917,072
(20,629,745)
(2,768,331)
(276,089)
(1,916,307)
(20,215)
(125,460)
(25,736,147)
(10,829,451)
(2,583,982)
(167,653)
(1,533,881)
(352,672)
(455,382)
(15,923,021)
(17,185,726)
(2,306,174)
(229,998)
(1,596,390)
(16,840)
(104,515)
(21,439,643)
(9,021,535)
(2,152,601)
(139,664)
(1,277,809)
(293,795)
(379,359)
(13,264,763)
657,499
4,384,232
$
(63)
-
$
(27,028)
16,193
(22,516)
13,490
55,353
26,169
46,112
21,800
461,448
1,594,919
384,412
1,328,656
Cash and cash equivalents, beginning of year
2,304,424
709,505
1,919,713
591,057
Cash and cash equivalents, end of year
2,765,872
2,304,424
Cash flows from operating activities:
Cash inflows from investing activities:
Proceeds from disposal of marketable securities
Reduction in short-term financial instruments
and other current assets
Proceeds from disposal of investments
Reduction in other assets
Proceeds from disposal of property, plant and
equipment
Cash outflows from investing activities:
Purchase of short-term financial instruments
Acquisition of marketable securities
Additions to other current assets
Acquisition of investments
Additions to other assets
Acquisition of property, plant and equipment
Expenditures for development costs
Cash flows from financing activities:
Cash inflows from financing activities:
Proceeds from short-term borrowings
Proceeds from long-term debt
Proceeds from issuance of stock
Proceeds from disposal of treasury stock
Others
Cash outflows from financing activities:
Repayment of short-term borrowings
Payment of current maturities of long-term debt
Payment of cash dividends
Repayment of long-term debt
Purchase of treasury stock
Others
Increase in cash due to the merger
Effect of exchange rate on cash
Effect of change in consolidated subsidiaries
Net increase in cash and cash equivalents
$
$
5,404,483
547,733
(52)
2,304,125
$
7,035,609
$
3,652,309
$
-
$
1,919,713
See accompanying notes to consolidated financial statements
54
HYUNDAI MOTOR COMPANY AND SUBSIDIARIES: Financial Statements 2002
NOTES TO CONSOLIDATED FINANCIAL STATEMENTS DECEMBER 31, 2002 and 2001
HYUNDAI MOTOR COMPANY AND SUBSIDIARIES: Financial Statements 2002
Capital stock as of December 31, 2002
1. GENERAL INFORMATION
The Company
Hyundai Motor Company (the “Company”) was incorporated in December 1967, under the laws of the Republic of Korea,
to manufacture and distribute motor vehicles and parts. The shares of the Company have been listed on the Korea Stock
Exchange since 1974.
The Company acquired 214,200 thousand shares (51 percent) of the outstanding shares of Kia Motors Corp. (Kia) and Asia
Motors Co., Inc. (Asia Motors) through a consortium, with its affiliates, at a total acquisition amount of 1,178,100 million
paid on March 29, 1999 based on a stock acquisition agreement datedDecember 1, 1998, enabling the Company to
exercise substantial control on Kia (Asia Motors merged into Kia on June 30, 1999) and its subsidiaries. In addition, as of
July 31, 1999, the Company merged the Automobile and Machine Tool divisions of Hyundai Precision and Industry Co.,
Ltd. Due to such merger and acquisition, the Company’s production and sales in domestic and foreign market have
expanded significantly.
The Company has three domestic production plants as follows:
Location
Commenced Production
Types of major products
Ulsan
December 1967
Passenger cars, Commercial vehicles (Small trucks)
Chunbuk Chunjoo
April 1995
Commercial vehicles (Bus and Trucks)
Chungnam Ahsan
November 1996
Passenger cars
Consolidated Subsidiaries
The consolidated financial statements include the accounts of the Company and its consolidated domestic and foreign
subsidiaries over which the Company has control, is the largest shareholder and owns more than thirty percent of the
voting shares. The consolidated subsidiaries as of December 31, 2002 are as follows:
Capital stock as of December 31, 2002
Business
Domestic Subsidiaries:
Kia Motors Corporation (Kia) Manufacturing
Hyundai Powertech
WIA Corporation (WIA)
Hyundai Dymos Inc. (formerly
Korea Drive Train System)
56
U.S. dollars
(Note 2)
(in thousands)
Shares (*)
ROTEM (formerly Korea
Rolling Stock Co.)
WISCO
Daimler Hyundai Truck Co.,
Ltd.
KEFICO Corporation
Hyundai HYSCO (formerly
Hyundai Pipe Co., Ltd.)
Bontek
Hyundai Capital Service Inc.
(HCS)
e-HD.com
Autoever
Cheju Dynasty Co., Ltd
As of December 31, 2002, 52.6 percent of the Company's stock (excluding preferred stock) is owned by Korean investors
and the remaining 47.4 percent is owned by foreign investors, including Daimler Chrysler (10.5 percent) and Mitsubishi of
Japan (4.5 percent), under foreign investment agreements.
Korean won
(in millions)
Business
Percentage
Indirect
Ownership (*) Ownership (*)
1,848,652
140,000
38,353
1,540,030
116,628
31,950
170,465,491
28,000,000
6,949,476
46.11
100.00
90.60
111,254
92,681
17,587,760
79.04
HCS 9.79%
Kia 50.00%
Kia 45.30%
Kia 27.07%,
WIA 5.08%
Financing
service
Information
service
Information
technology
Real estate
development
Foreign Subsidiaries:
Hyundai Motor India (HMI) Manufacturing
Hyundai Motor Manufacturing
Alabama, LLC (HMMA)
Hyundai de Mexico, S.A. de
C.V. (HYMEX)
Hyundai-Huy Hoang Pipe
Company Limited
Hyundai-Assan Otomotiv
Sanayi Ve Ticaret Anonim
Sirketi (HAOSVT)
DongFeng Yueda Kia Motor
Co., Ltd. (formerly
Hyundai-Kia-Yueda
Motor Company)
Hyundai Motor America
(HMA)
Hyundai Motor Europe GmbH
(HME)
Hyundai Motor Japan Co.
(HMJ)
Hyundai Motor Poland Sp.
Zo.O (HMP)
Hyundai Translead (HT)
Hyundai Machine Tool Europe
GmbH (HYME)
Kia Motors America Inc.
(KMA)
Kia Japan Co., Ltd. (KJC)
Kia Motors Deutschland
GmbH (KMD)
Sales
Korean won
(in millions)
U.S. dollars
(Note 2)
(in thousands)
Percentage
Indirect
Ownership (*) Ownership (*)
Shares (*)
257,200
3,000
214,262
2,499
40,306,304
301,725
78.36
50.29
100,000
33,400
83,306
27,824
10,000,000
1,670,000
50.00
50.00
447,228
5,000
355,000
372,566
4,165
295,735
44,308,868
390,000
59,813,430
49.54
39.00
84.24
20,023
16,680
2,724,770
68.04
5,000
4,165
499,000
49.90
15,500
12,912
2,790,000
90.00
203,785
169,764
8,127,785
100.00
49,216
41,000
-
100.00
HMA100.00%
119
99
9,996
99.96
HT 99.96%
3,677
3,063
-
64.64
HYSCO 64.64%
126,042
105,000
34,505,731,715
63.29
42,394
35,317
-
50.00
200,467
167,000
1,275
100.00
13,465
11,217
-
100.00
15,193
12,657
40,000
100.00
26,996
139,246
22,489
116,000
1,160,000
100.00
100.00
29,894
24,903
-
100.00
120,040
43,452
100,000
36,198
1,000,000
85,800
100.00
100.00
Kia 100.00%
Kia 100.00%
25,072
20,886
39,000
100.00
Kia 100.00%
WIA 50.29%
Kia 21.57%,
HCS 4.54%
Kia 39.00%
Kia 22.76%,
HCS 3.72%
Kia 20.00%,
HCS 4.90%
Kia 40.00%
Kia 50.00%
57
HYUNDAI MOTOR COMPANY AND SUBSIDIARIES: Financial Statements 2002
HYUNDAI MOTOR COMPANY AND SUBSIDIARIES: Financial Statements 2002
Capital stock as of December 31, 2002
Business
Kia Canada, Inc. (KCI)
Sales
Kia Motors Belgium (KMB)
Kia Motors Czech s.r.o.
(KMCZ)
Kia Motors (UK) Ltd.
(KMUK)
Kia Motors Austria GmbH
(KMAS)
Kia Motors Hungary Kft
(KMH)
Kia Motors Polska Sp.z.o.o.
(KMP)
Kia Heavy Industries U.S.A.,
Corp.
Hyundai Pipe of America, Inc.
Hyundai America Technical
Center Inc. (HATCI)
R&D
Hyundai Motor Finance
Financing
Company (HMFC)
service
Hyundai Auto Canada Captive
Insurance Incorporation
Insurance
(HACCII)
service
Real Estate
Sevenwood Property Inc.
rent
Kia Motors Europe GmbH
Holding
(KME)
company
Korean won
(in millions)
U.S. dollars
(Note 2)
(in thousands)
Shares (*)
Percentage
Indirect
Ownership (*) Ownership (*)
66,889
55,722
6,298
100.00
1,257
1,047
1,000,000
100.00
Kia82.5%,
KMA 17.5%
KME 100.00%
4,412
3,675
106,870,000
100.00
KME 100.00%
33,489
27,898
17,000,000
100.00
KME 100.00%
2,650
2,208
2,107,512
100.00
KME 100.00%
146
122
30,000,000
100.00
KME 100.00%
4,904
4,085
15,637
99.60
KMD 99.60%
720
2,401
600
2,000
1,200
250,000
100.00
100.00
WIA 100.00%
HYSCO 100%
12,004
120,040
10,000
100,000
1,000
750
100.00
100.00
HMA 100.00%
1,142
951
100
100.00
HMA 100.00%
1,399
1,165
4,088,071
100.00
HMA 100.00%
31
26
25,000
100.00
Kia 100.00%
(*) Shares and ownership are calculated by combining the shares and ownership, which the Company and its subsidiaries
hold as of December 31, 2002. Indirect ownership represents subsidiaries’ holding ownership.
Among the consolidated domestic subsidiaries, Kia and Hyundai HYSCO have been listed on the Korea Stock Exchange,
and Bontek is under composition with creditors according to the Composition Act.
In 2002, the Company added two domestic companies including Daimler Hyundai Truck Co., Ltd. and ten overseas
companies including Hyundai Motor Europe GmbH (HME) to its consolidated subsidiaries. The details of these changes in
the scope of consolidation are as follows:
(1) DongFeng Yueda Kia Motor Co., Ltd. (formerly Hyundai-Kia-Yueda Motor Company) and Daimler Hyundai Truck Co.,
Ltd. whose equity securities had been accounted for using the equity method in 2001 are included in the consolidation
mainly due to the holding and acquisition of ownership enabling the Company and its subsidiaries to exercise
substantial control.
(2) Hyundai Motor Europe GmbH (HME) and Autoever, which had not been included in the consolidation nor accounted for
using the equity method in 2001, are included in 2002 consolidation since its individual total assets at the end of the
preceding year exceeded the required level of 7,000 million ($5,831 thousand).
The inclusion of the individual accounts of the subsidiaries mentioned above in the Company’s 2002 consolidated financial
statements increased the Company’s consolidated assets, shareholders’ equity and revenues by 698,043 million
($581,509 thousand), 29,926 million ($24,930 thousand) and 1,094,755 million ($911,992 thousand), respectively and
decreased consolidated net income by 22,069 million ($18,385 thousand) [I2] as compared to the results using the
previous scope of consolidation.
In 2002, Korea Precision Co., Ltd, which was an indirect consolidated subsidiary through investment of WIA, one of the
Company’s domestic subsidiaries, was merged into Hyundai Dymos (formerly Korea Drive Train System), another
subsidiary. In accordance with financial accounting standards for consolidated financial statements in the Republic of
Korea, which state that when consolidated companies are merged together during a fiscal year, consolidated financial
statements would reflect this transaction as if the controlling company acquired additional interest rather than a merger
took place, the net income for Korea Precision Co., Ltd. as of the merger date, amounting to 4,864 million ($4,052
thousand), is reflected in the consolidated income statement.
In 2001, the Company added seven domestic companies including ROTEM (formerly Korea Rolling Stock Co.) and four
overseas companies including Hyundai-Assan Otomotiv Sanayi Ve Ticaret Anonim Sirketi to its consolidated subsidiaries.
The details of these changes in the scope of consolidation are as follows:
(1) ROTEM (formerly Korea Rolling Stock Co.), Hyundai-Assan Otomotiv Sanayi Ve Ticaret Anonim Sirketi, Hyundai Pipe of
America, Inc. and Hyundai-Huy Hoang Pipe Company Limited whose equity securities had been accounted for using
the equity method in 2000 are included in consolidation mainly due to the increase in the Company’s and its
subsidiaries’ ownership.
(2) Cheju Dynasty Co., Ltd, which had not been included in the consolidation nor accounted for using the equity method in
2000, is included in 2001 consolidation since its individual total assets at the end of the preceding year exceeded the
required level of 7,000 million ($5,831 thousand).
(3) Hyundai Powertech, WIA Corporation, WISCO, Korea Precision Co., Ltd, Bontek and Kia Heavy Industries U.S.A., Corp.
are included in the consolidation due to the new acquisition of ownership enabling the Company and its subsidiaries to
exercise substantial control.
The inclusion of the individual accounts of the subsidiaries mentioned above in the Company’s 2001 consolidated financial
statements increased the Company’s consolidated assets and revenues by 2,426,041 million ($2,021,027 thousand) and
715,047 million ($595,674 thousand), respectively and decreased consolidated net income and shareholders’ equity by
6,275 million ($5,227 thousand) and 2,464 million ($2,053 thousand), respectively, as compared to the results using
the previous scope of consolidation.
The Company excluded Hyundai Motor Europe Pars in its consolidated subsidiaries as of December 31, 2001 due to the
disposal of investments.
Goodwill and negative goodwill related to the consolidated subsidiaries computed as the difference between the
acquisition cost and the Company’s portion of the subsidiaries’ net equity at the date when the Company obtained control
over the subsidiaries is 340,288 million ($283,479 thousand) and 108,169 million ($90,111 thousand) as of December
31, 2002, respectively, and
343,704 million ($286,325 thousand) and 118,225 million ($98,488 thousand) as of
December 31, 2001, respectively, net of accumulated amortization.
In response to general unstable economic conditions, the Korean government and the private sector have been
implementing structural reforms to historical business practices. Implementation of these reforms is progressing slowly,
particularly in the areas of restructuring private enterprises and reforming the banking industry. The Korean government
continues to apply pressure to Korean companies to restructure into more efficient and profitable firms. The Company and
its subsidiaries may be either directly or indirectly affected by these general unstable economic conditions and the reform
program described above. The accompanying financial statements reflect management’s assessment of the impact to
date of the economic situation on the financial position of the Company and its subsidiaries. Actual results may differ
materially from management’s current assessment.
(3) Hyundai Motor Manufacturing Alabama, LLC (HMMA), Kia Motors Europe GmbH (KME), Kia Motors Belgium (KMB), Kia
Motors Czech s.r.o. (KMCZ), Kia Motors (UK) Ltd. (KMUK), Kia Motors Austria GmbH (KMAS), Kia Motors Hungary Kft
(KMH) and Hyundai Auto Canada Captive Insurance Incorporation (HACCII) are included in the consolidation due to the
new acquisition of ownership enabling the Company and its subsidiaries to exercise substantial control.
58
59
HYUNDAI MOTOR COMPANY AND SUBSIDIARIES: Financial Statements 2002
HYUNDAI MOTOR COMPANY AND SUBSIDIARIES: Financial Statements 2002
2. SUMMARY OF SIGNIFICANT ACCOUNTING POLICIES
Intercompany receivables and payable and revenues and expenses arising from transactions between the Company and
its subsidiaries or among subsidiaries are eliminated against each other in the consolidated financial statements. On sales
from the Company to its subsidiaries (downstream sales), the full amounts of unrealized gains or loss are eliminated in the
consolidated income and charged (credited) to the majority interest. On sales from a subsidiary to the Company (upstream
sales), unrealized gains and losses are eliminated entirely and allocated proportionately between majority and minority
interests.
Basis of Consolidated Financial Statement Presentation
The Company maintains its official accounting records in Korean won and prepares statutory consolidated financial
statements in the Korean language (Hangul) in conformity with the accounting principles generally accepted in the
Republic of Korea. Certain accounting principles applied by the Company that conform with financial accounting
standards and accounting principles in the Republic of Korea may not conform with generally accepted accounting
principles in other countries. Accordingly, these financial statements are intended for use by those who are informed about
Korean accounting principles and practices. The accompanying financial statements have been condensed, restructured,
and translated into English from the Korean language financial statements. Certain information included in the Korean
language financial statements, but not required for a fair presentation of the Company and its subsidiaries’ financial
position, results of operations or cash flows, is not presented in the accompanying financial statements.
Revenue Recognition
The U.S. dollar amounts presented in these financial statements were computed by translating the Korean won into U.S.
dollars based on the Bank of Korea Basic Rate of 1,200.40 to US$1.00 at December 31, 2002, solely for the convenience
of the reader. This convenience translation into US dollars should not be construed as a representation that the Korean
won amounts have been, could have been, or could in the future be, converted at this or any other rate of exchange.
Revenue, including long-term installment sales, is recognized upon shipment of goods. Interest income arising from longterm installment sales is recognized using the level yield method. In the case of subsidiaries in financial business, interest
revenues earned on financial assets are recognized as time passes and fees and commissions in return for services
rendered are recognized as services are provided.
The significant accounting policies followed by the Company in the preparation of its consolidated financial statements are
summarized below.
Valuation of Marketable Securities
Principles of Consolidation
Marketable securities are stated at fair value. The difference between book value and fair value is recognized in current
operations.
The consolidated financial statements include the individual accounts of the Company and its domestic and foreign
subsidiaries over which the Company has control, is the largest shareholder and owns more than 30 percent of the voting
shares, except for companies with total assets of less than 7,000 million ($5,831 thousand) at the end of the preceding
fiscal year. Investments in affiliates in which a consolidated entity is able to exercise significant influence over theoperating
and financial policies of a non-consolidated company are accounted for using the equity method. Significant influence is
deemed to exist when the investor owns more than twenty percent of the investee’s voting shares unless there is evidence
to the contrary. If the changes in the investment value due to the changes in the net assets of affiliates, whose individual
beginning balance of total assets or paid-in capital at the date of its establishment is less than 7,000 million ($5,831
thousand), are not material, investments in affiliates can be excluded from using the equity method.
Allowance for Doubtful Accounts
The investment account of the Company and corresponding equity accounts of subsidiaries are eliminated at the dates the
Company obtained control over the subsidiaries. The difference between the investment cost and the fair value of the
Company's portion of assets acquired less liabilities assumed of a subsidiary is accounted for as goodwill or negative
goodwill. Goodwill is amortized on a straight-line basis over its useful life, not exceeding twenty years. The amount of
negative goodwill not exceeding the total fair value of acquired identifiable non-monetary assets is recognized as income
on a straight-line basis over the remaining weighted average useful life of the identifiable acquired depreciable assets and
the amount of negative goodwill in excess of the total fair value of the acquired identifiable non-monetary assets is
recognized as extraordinary gain at the date of acquisition.
Valuation of Investments Securities
When the Company acquires additional interests in a subsidiary after obtaining control over the subsidiary, the difference
between incremental price paid by the Company and the amount of incremental interest in the stockholders' equity of the
subsidiary is reflected in the consolidated capital surplus. In case a subsidiary still belongs to a consolidated economic
entity after the Company disposes a portion of the stocks of subsidiaries to [I4]non-subsidiary parties , gain or loss on
disposal of the subsidiary`s stocks is accounted for as consolidated capital surplus.
When consolidated companies are merged together during a fiscal year, for purposes of consolidation, the merger is
regarded as additional acquisition of ownership. The net income for the acquiree as of the merger date is reflected in the
consolidated income statement.
60
The accounting methods adopted by the Company and its subsidiaries for similar transactions and circumstances is
generally the same. However, if the differences resulting from applying different accounting methods are not significant,
such difference methods are applied. Financial statements of a subsidiary as of the same closing date of the Company are
used in preparing the consolidation.
The Company provides an allowance for doubtful accounts based on management’s estimated loss on uncollectible
accounts.
Inventories
Inventories are stated at the lower of cost or net realizable value, cost being determined by the moving average cost
method.
Equity securities held for investment (excluding those accounted for using the equity method discussed in the next
paragraph) that are not actively traded (unlisted security) are stated at acquisition cost, as determined by the moving
average method. Actively quoted (listed) securities, including those traded over-the-counter, are stated at fair value, with
the resulting valuation gain or loss reported as a capital adjustment within shareholders’ equity. If the fair value of a listed
equity security or the net equity value of an unlisted security held for investment declines compared to acquisition cost and
is not expected to recover (impaired investment security), the carrying value of the equity security is adjusted to fair value
or net equity value, with the resulting valuation loss charged to current operations. If the net equity value or fair value
subsequently recovers, in the case of an unlisted security, the increase in value is recorded in current operations, up to the
amount of the previously recognized impairment loss, and in the case of a listed security, the increase in value is recorded
in capital adjustments.
Equity securities held for investment in companies in which the Company is able to exercise significant influence over the
operating and financial policies of the investees are accounted for using the equity method. The Company’s share in the
net income or net loss of investees is reflected in current operations. Changes in the retained earnings, capital surplus or
capital adjustments of investees are accounted for as an adjustment to consolidated retained earnings, consolidated
capital surplus or consolidated capital adjustments.
61
HYUNDAI MOTOR COMPANY AND SUBSIDIARIES: Financial Statements 2002
HYUNDAI MOTOR COMPANY AND SUBSIDIARIES: Financial Statements 2002
Debt securities held for investment are classified as either held-to-maturity investment debt securities or available for sale
investment debt securities at the time of purchase. Held-to-maturity debt securities are stated at acquisition cost, as
determined by the moving average method. When the face value of a held-to-maturity investment debt security differs
from its acquisition cost, the effective interest method is applied to amortize the difference over the remaining term of the
security. Available-for-sale investment debt securities are stated at fair value, resulting valuation gain or loss reported as a
consolidated capital adjustment within shareholder’ equity. However, if the fair value of a held-to-maturity or an availablefor-sale investment debt security declines compared to the acquisition cost and is not expected to recover (impaired
investment security), the carrying value of the debt security is adjusted to fair value, with the resulting valuation loss
charged to current operations. If the fair value of the security subsequently recovers, in the case of a held-to-maturity debt
security, the increase in value is recorded in current operations, up to the amount of the previously recognized impairment
loss, and in the case of an available-for-sale debt security, the increase in value is recorded in capital adjustments.
Amortization is computed using the straight-line method based on the estimated useful lives of the assets as follows:
The lower of the acquisition cost of investments in treasury stock funds and the fair value of treasury stock included in a
fund is accounted for as treasury stock in consolidated capital adjustments.
Property, Plant and Equipment and Related Depreciation
Property, plant and equipment are recorded at cost, except for assets revalued upward in accordance with the Asset
Revaluation Law of Korea. Routine maintenance and repairs are expensed as incurred. Expenditures that result in the
enhancement of the value or extension of the useful lives of the facilities involved are treated as additions to property, plant
and equipment.
Goodwill (Negative goodwill)
Development costs
Other
Useful lives (years)
not to exceed 20 years
3 – 10
4 – 20
If the recoverable value of intangible assets is lower than book value, book value is adjusted to the recoverable value with
impairment loss charged to current operations.
In 2002, the Company adopted Statement of Korea Accounting Standards (SKAS) No. 3 – Intangible Assets. This
Statement, effective for fiscal years subsequent to December 31, 2002 but early adoption in 2002 is permitted, provides
more clarifications of accounting method of intangible assets including definition, scope, recognition, amortization and
valuation. Also, considering the trend in the automotive market, the Company shortened the estimated economic useful
lives for certain types of development costs and reclassified the ordinary development expenses and research expenses.
This accounting change resulted in the decrease of consolidated net income by 445,990 million (US$371,534 thousand)
compared with the results based on the previous method.
In 2002, Hyundai HYSCO, a domestic subsidiary changed the estimated economic useful life of development cost from
twenty years to ten years. This accounting change resulted in the decrease of consolidated net income by 1,775 million
(US$1,479 thousand) compared with the results based on the previous method.
Depreciation is computed using the straight-line method based on the estimated useful lives of the assets as follows:
Valuation of Receivables and Payables at Present Value
Buildings and structures
Machinery and equipment
Vehicles
Dies and moulds
Tools
Other equipment
Useful lives (years)
2 – 60
4 – 50
2 – 21
2 – 12
2 – 12
2 – 12
Before 2002, the Company and Kia, one of its domestic subsidiaries, had capitalized a portion of financial cost including
interest expense and similar expenses in conformity with Financial Accounting Standards of Republic of Korea. However,
in 2002, the Company elected to adopt the accounting method of charging all financing cost to current operations in
accordance with Statement of Korea Accounting Standards (SKAS) No. 7 – Capitalization of Financing Costs. This
Statement is effective for fiscal years subsequent to December 31, 2002 but early adoption in 2002 is permitted. This
Statement provides that all financing cost must be charged to current operations but capitalization of financial cost can be
acceptable under certain conditions. In accordance with SKAS No. 7, in the first effective fiscal year, the company should
elect one of such accounting methods for financing cost as its accounting policy and consistently apply it. If the
accounting method of charging all financing cost to current operations is selected, it would result in an accounting change
and in accordance with this Statement, this change is accounted for using prospective approach. This change of
accounting method resulted in the decrease of consolidated net income and assets by 55,515 million (US$46,247
thousand), respectively, compared with the results based on the previous method. The Company and its subsidiaries
capitalized financial cost of 103,083 million (US$ 85,874 thousand) as part of the cost of constructing major facilities and
equipment in 2001.
Intangibles
Intangible assets are stated at cost, net of accumulated amortization. Subsequent expenditures on intangible assets after
their purchases or completions, which will probably enable the assets to generate future economic benefits and can be
measured and attributed to the assets reliably, are treated as additions to intangible assets.
62
Receivables and payables arising from long-term installment transactions, long-term cash loans (borrowings) and other
similar loan (borrowing) transactions are stated at present value, if the difference between nominal value and present value
is material. The present value discount is amortized using the effective interest rate method. Effective interest rate ranges
from 8.25 percent to 10.00 percent in 2002 and is 10.0 percent in 2001.
Restructuring of Receivables and Payables
If principal, interest rate or repayment period of receivables is changed unfavourably for the Company by the court
imposition such as commencement of reorganization or by mutual agreements and the difference between nominal value
and present value is material, such difference is recorded in other expense as provision for doubtful accounts. The
difference is amortized using the effective interest method, with the amortization included in interest income or interest
expense.
Discount on Debentures
Discount on debentures, which is the difference between the issued amount and the face value of debenture, is presented
as a deduction from to the face value of debentures and amortized over the redemption period of the debenture using the
effective interest rate method. Amortization of discount is recognized as interest expense on the debenture.
Accrued Severance Benefits
Employees and directors of the Company and its subsidiaries are entitled to receive a lump-sum payment upon
termination of their service based on the applicable severance plan of each company. The accrued severance benefits that
would be payable assuming all eligible employees of the Company and its domestic subsidiaries terminated their
employment amount to 2,592,509 million ($2,159,704 thousand) and 2,143,955 million ($1,786,034 thousand) as of
December 31, 2002 and 2001, respectively.
Accrued severance benefits are funded through a group severance insurance plan and individual severance insurance
plan. The group severance insurance deposits under this insurance plan are classified as other assets. Subsequent
provisions are funded at the discretion of the Company. Group severance insurance deposits may only be withdrawn for
the payment of severance benefits. Individual severance insurance deposits, of which a beneficiary is a respective
employee, are presented as deduction from accrued severance benefits. Actual payments of severance benefits amounted
to 308,575 million ($257,060 thousand) and 288,906 million ($240,675 thousand) in 2002 and 2001, respectively.
63
HYUNDAI MOTOR COMPANY AND SUBSIDIARIES: Financial Statements 2002
HYUNDAI MOTOR COMPANY AND SUBSIDIARIES: Financial Statements 2002
Accrued Warranties and Product Liabilities
Accounting for Foreign Currency Transaction and Translation
The Company and its subsidiaries generally provide a warranty to the ultimate consumer with each product and accrues
warranty expense at the time of sale based on actual claims history. Also, the Company accrues potential expenses, which
may occur due to product liabilities suits and voluntary recall campaign pending as of the balance sheet date. Actual costs
incurred are charged against the accrual when paid. Additionally, in 2002, the Company and Kia, one of its domestic
subsidiary, recognize accrued liabilities for the projected expenses due to an End-of-Life Vehicles (ELV) directive in
European Union. Under the directive, manufacturers are responsible for a portion of the cost of the dismantling and
recycling of vehicles placed in service prior to July 2002 that are expected to be still in operation up to January 2007 as
well as all vehicles placed in service after July 2002. In 2002, the provision for the accrual due to ELV directive amounting
to 299,560 million (US$ 249,550 thousand) was accounted for as selling expense and non-operating expense.
The Company and its domestic subsidiaries maintain their accounts in Korean won. Transactions in foreign currencies are
recorded in Korean won based on the prevailing rates of exchange on the transaction dates. Monetary accounts with
balances denominated in foreign currencies are recorded and reported in the accompanying consolidated financial
statements at the exchange rates prevailing at the balance sheet dates. The balances have been translated using the Bank
of Korea Basic Rate, which was 1,200.40 and 1,326.10 to US$1.00 at December 31, 2002 and 2001, respectively, and
translation gains or losses is reflected in current operations.
In 2002, Kia, one of the Company’s domestic subsidiary, changed its method in estimating accrued warranty for the
exported vehicles. Kia generally offers the warranty program that is limited to certain years or certain miles from the date of
first service, whichever comes first. Before 2002, Kia estimated the accrual based on the number of vehicles exported
within the warranty calendar periods. However, in 2002, Kia accrues warranty expenses based on the units in operation
within the warranty term considering miles in service. This change resulted an increase in net income of 39,860 million
($33,206 thousand).
Assets and liabilities of subsidiaries outside the Republic of Korea are translated at the rate of exchange in effect at the
balance sheet dates; income and expenses of subsidiaries are translated at the average rates of exchange prevailing
during the year, which was 1,251.18 and 1,291.01 to US$1.00 in 2002 and 2001, respectively. Cumulative translation
debits or credits, which occurred in the translations of financial statements of foreign subsidiaries and branch, are
recorded as capital adjustments.
Income Tax Expense
Income tax expense is determined by adding or deducting the total income tax and surtaxes to be paid for the current
period and the changes in deferred income tax debits (credits).
Stock Options
Earnings Per Share
The Company and its subsidiaries compute total compensation expense to stock options, which are granted to employees
and directors, by the fair value method using the option-pricing model. The compensation expense has been accounted
for as a charge to current operations and a credit to capital adjustment from the grant date using the straight-line method.
Derivative Instruments
All derivative instruments are accounted for at fair value with the valuation gain or loss recorded as an asset or liability. If
the derivative instrument is not part of a transaction qualifying as a hedge, the adjustment to fair value is reflected in
current operations. The accounting for derivative transactions that are part of aqualified hedge based both on the purpose
of the transaction and on meeting the specified criteria for hedge accounting differs depending on whether the transaction
is a fair value hedge or a cash flow hedge.
Fair value hedge accounting is applied to a derivative instrument designated as hedging the exposure to changes in the
fair value of an asset or a liability or a firm commitment (hedged item) that is attributable to a particular risk. The gain or
loss both on the hedging derivative instruments and on the hedged item attributable to the hedged risk is reflected in
current operations.
Cash flow hedge accounting is applied to a derivative instrument designated as hedging the exposure to variability in
expected future cash flows of an asset or a liability or a forecasted transaction that is attributable to a particular risk.
The effective portion of gain or loss on a derivative instrument designated as a cash flow hedge is recorded as a capital
adjustment and the ineffective portion is recorded in current operations. The effective portion of gain or loss recorded as a
capital adjustment is reclassified to current earnings in the same period during which the hedged forecasted transaction
affects earnings. If the hedged transaction results in the acquisition of an asset or the incurrence of a liability, the gain or
loss in capital adjustment is added to or deducted from the asset or the liability.
The Company and its domestic subsidiaries entered into derivative instrument contracts related to forward, option and
swap to hedge the exposure to changes in foreign exchange rate. The Company and its subsidiaries accounted for the
gain and loss on valuation of the effective portion of derivative instruments for cash flow hedging purpose from forecast
exports as capital adjustments, with a credit of 22,900 million ($19,077 thousand) and a debit of 16,377 million
($13,643 thousand) as of December 31, 2002 and 2001, respectively. The Company and its subsidiaries recognized loss on
valuation of the ineffective portion of such derivative instruments and the other derivative instruments in current operations.
Primary earnings per share is computed by dividing net income, after deduction for expected dividends on preferred stock,
by the weighted average number of common shares. The number of shares used in computing earnings per common
share is 218,084,933 and 215,692,671 in 2002 and 2001, respectively. Earnings per diluted share is computed by dividing
net income, after deduction for expected dividends on preferred stock and addition for the effect of expenses related to
dilutive securities on net income, by the number of the weighted average number of common shares plus the dilutive
potential common shares. The number of shares used in computing diluted earnings per diluted share is 218,863,816 and
216,110,199 in 2002 and 2001, respectively. However, there is no dilution effect in 2001.
Adoption of Statement of Korea Accounting Standards No. 6
The Company adopted Statement of Korea Accounting Standards (SKAS) No. 6 - Events Occurring after the Balance
Sheet Date. This Statement is effective for fiscal years subsequent to December 31, 2002 but early adoption in 2002 is
permitted. Previously, appropriations of retained earnings had been reflected in the balance sheet at the date ended with
the same fiscal year in accordance with Financial Accounting Standards in Republic of Korea. However, this Statement
pronounces that appropriations of retained earnings including the dividends should not be reflected in the balance sheet
until the approval at the shareholders’ meeting. In conformity with SKAS No. 6, the appropriations of retained earnings to
be approved at the stockholders meeting on March 14, 2003 are not recorded in balance sheet as of December 31, 2002
but would be accounted for in 2003. This change of accounting method resulted in the decrease of current liabilities by
301,628 million (US$251,273 thousand) and the increase of consolidated unappropriated retained earnings and minority
interests by 243,079 million (US$202,498 thousand) and
58,549million (US$48,775 thousand), respectively, as of
December 31, 2002, compared with the results based on the previous method. Also, the 2001 consolidated financial
statements, which are presented for comparative purposes, were revised in accordance with SKAS No. 6 and this revision
resulted in the decrease of current liabilities by 220,179 million (US$183,421 thousand) and the increase of consolidated
unappropriated retained earnings and minority interests by 215,145 million (US$179,228 thousand) and
5,035million
(US$4,194 thousand), respectively, as of December 31, 2001 compared with the results based on the previous method.
Deferred gain on valuation of derivative in other assets and accrued loss on valuation of derivative as of December 31,
2002 amount to 51,622 million ($43,004 thousand) and 17,053 million($14,206 thousand), respectively. Deferred gain
on valuation of derivative in other assets and accrued loss on valuation of derivative as of December 31, 2001 amount to
168 million ($140 thousand) and 62,382 million ($51,968 thousand), respectively.
64
65
HYUNDAI MOTOR COMPANY AND SUBSIDIARIES: Financial Statements 2002
HYUNDAI MOTOR COMPANY AND SUBSIDIARIES: Financial Statements 2002
Reclassifications
(3) Equity securities accounted for using the equity method as of December 31, 2002 and 2001 consist of the
following:
Book Value
Korean won
U. S. dollars(Note 2)
2002
(in millions)
(in thousands)
Percentage
Description
Ownership (*2) Historical cost
2002
2001
2002
2001
Kia Tigers Co., Ltd. (*1)
100.00
20,300
14,083
18,212 $
11,732 $
15,172
HMJ R&D (*1)
100.00
1,510
2,090
1,975
1,741
1,645
First CRV
50.00
169,560
99,240
175,512
82,673
146,211
Daimler Hyundai Truck Co., Ltd.
49,523
41,255
Hyundai-Kia-Yueda Motor
Company
259
216
Korea Space & Aircraft Co., Ltd.
33.33
129,800
84,690
72,720
70,551
60,580
PT. KIA Timor Motors
30.00
26,667
10,996
10,478
9,160
8,729
TRW Steering Co., Ltd.
29.00
8,952
8,692
8,952
7,241
7,458
Korea Economy Daily
29.57
19,973
17,568
17,633
14,635
14,689
Wuhan Grand Motor Co., Ltd.
21.40
5,468
8,018
8,359
6,680
6,964
Iljin Forging Co., Ltd.
20.00
826
11,890
11,283
9,905
9,399
Daesung Automotive Co., Ltd.
20.00
400
5,200
4,802
4,332
4,000
Beijing-Hyundai Motor
50.00
133,691
129,468
107,854
Donghui Auto Co., Ltd.
35.12
10,530
10,530
8,772
527,677
402,465
379,708 $
335,276 $
316,318
For comparative purposes, certain accounts in the consolidated subsidiaries’ financial statements were reclassified to
conform to the Company’s financial statement presentation. Such reclassifications had no effect on the net income or the
net equity reported in the consolidated subsidiaries’ financial statements. Assets and liabilities in the financial industry are
classified by method of current arrangement. When method of current arrangement is impossible, assets and liabilities are
classified to other financial assets and liabilities. In addition, certain accounts in the consolidated financial statements of
the prior period were reclassified for comparative purposes. Such reclassifications had no effect on the consolidated net
income or net equity in the accompanying financial statements of the prior period.
3. INVENTORIES
Inventories as of December 31, 2002 and 2001 consist of the following:
Accounts
Raw materials and supplies
Semi finished goods and work in process
Finished goods and merchandise
Materials in transit
Other
Korean won
(in millions)
2002
2001
499,787
548,246
459,998
395,171
2,660,531
2,285,934
176,346
529,464
23,337
29,112
3,819,999
3,787,927
$
$
U.S. dollars(Note 2)
(in thousands)
2002
2001
416,351 $
456,720
383,204
329,199
2,216,370
1,904,310
146,906
441,073
19,441
24,252
3,182,272 $
3,155,554
4. MARKETABLE SECURITIES AND INVESTMENTS
(*1) These companies are excluded in the consolidation since individual beginning balance of total assets is less than
7,000 million ($5,831 thousand).
(1) Marketable securities as of December 31, 2002 and 2001 consist of the following:
(*2) Percentage ownership is calculated by combining the ownership of the Company and its subsidiaries.
Description
Beneficiary certificates
Debt securities
Korean won
(in millions)
2002
2001
690,209
791,518
20,265
75,003
710,474
866,521
As of December 31, 2002, Kia pledged certain marketable securities of
the foreign currency forward contracts and certain borrowings.
$
$
U.S. dollars(Note 2)
(in thousands)
2002
2001
574,983 $
659,379
16,881
62,481
591,864 $
721,860
8,790 million ($ 7,323 thousand) as collateral for
(2) Investments securities as of December 31, 2002 and 2001 consist of the following:
Description
Equity securities accounted for using
the equity method
Marketable equity securities
Unlisted equity securities
Debt securities
66
Korean won
(in millions)
2002
402,465
936,108
262,543
460,157
2,061,273
U.S. dollars(Note 2)
(in thousands)
2002
2001
2001
379,708
555,583
230,281
577,670
1,743,242
$
$
335,276
779,830
218,713
383,336
1,717,155
$
$
316,318
462,832
191,837
481,231
1,452,218
Since the net asset value of Asia Motors Do Brasil SA (AMB), of which Kia holds 51 percent of ownership, has declined and
is not expected to recover, the difference between the book value and the fair value was charged to operations in 1998 as
an impairment loss of investment securities. In addition, AMB is excluded from the application of the equity method
because AMB has been under suspension of business for more than one year and net value is lower than the acquisition
cost of investment securities.
The Company and its subsidiaries amortize (reverse) goodwill (negative goodwill), which occurred in applying the equity
method, using the straight-line method. The unamortized balance of goodwill is 21,279 million ($17,727 thousand), and
5,272 million ($4,392 thousand) as of December 31, 2002 and 2001, respectively, net of accumulated amortization.
In 2002, the equity securities in Beijing-Hyundai Motor and Donghui Auto Co., Ltd. were newly accounted for using the
equity method due to acquisition of ownership. This addition of equity securities accounted for using the equity method
resulted in the decrease in the consolidated net income and shareholder’s equity by 731 million ($609 thousand) and
3,182 million ($2,651 thousand), respectively.
In 2002, among the equity securities accounted for using the equity method in 2001, DongFeng Yueda Kia Motor Co., Ltd.
(formerly Hyundai-Kia-Yueda Motor Company) and Daimler Hyundai Truck Co., Ltd. are included in the consolidation
mainly due to the holding and acquisition of ownership enabling the Company and its subsidiaries to exercise substantial
control.
In 2001, the equity securities in Kia Tigers Co., Ltd., HMJ R&D, Daimler Hyundai Truck Co., Ltd., First CRV and TRW
Steering Co., Ltd. were newly accounted for using the equity method mainly due to acquisition of ownership. This
addition of equity securities accounted for using the equity method increased the consolidated shareholders’ equity by
444 million ($370 thousand) in 2001.
67
HYUNDAI MOTOR COMPANY AND SUBSIDIARIES: Financial Statements 2002
HYUNDAI MOTOR COMPANY AND SUBSIDIARIES: Financial Statements 2002
In 2001, among the equity securities accounted for using the equity method in 2000, Beijing Hyundai Namyang Real Estate
Development Center Ltd. and Hyundai Space & Aircraft Co., Ltd were excluded from the application of equity method
mainly due to disposal of investments. ROTEM (formerly Korea Rolling Stock Co.), HAOVST, Hyundai Pipe of America, Inc.
and Hyundai-Huy Hoang Pipe Company Limited are included in the consolidation in 2001 mainly due to the increase in the
Company’s and its subsidiaries’ ownership.
Marketable investments that are excluded from the consolidation and the application of the equity method as of December
31, 2001 consist of the following:
Marketable investments that are excluded from the consolidation and the application of the equity method as of December
31, 2002 consist of the following:
Companies
Hyundai MOBIS
Korea Industrial Development Co., Ltd.
INI Steel (*1)
Saehan Media
Jin Heung Mutual Savings & Finance Co.,
Ltd.
Korea Mutual Savings Bank
Hyundai Heavy Industries Co., Ltd.
Hyundai Corporation
Hyundai Information Technology Co., Ltd.
LG Telecom.Co., Ltd.
Chohung Bank
Hyundai Merchant Marine Co., Ltd.
Kia Steel Co., Ltd.
Hyundai Engineering & Construction Co., Ltd.
Kanglim Specific Equipment Automotive
Co., Ltd.
Prochips Technology Inc.
DongYang Investment Bank
Korea Information Service. Inc.
SK Telecom
Nonhyup Trust Cash Fund
Samho Company Ltd.
Samlip General Food
Treasury Stock Funds
Stock Market Stabilization Fund
Korean won
U.S. dollars(Note 2)
(in millions)
(in thousands)
Percentage
Historical cost
Book value
Book value Ownership (*2)
83,102
343,963 $
286,540
18.51
5,091
2,614
2,178
10.54
137,175
136,584
113,782
20.03
1,607
2,418
2,014
4.93
2,181
2,846
56,924
13,626
10,000
19,851
73,545
7,329
96
13,332
2,045
2,983
41,720
2,079
1,267
16,198
28,003
1,040
169
4,280
1,704
2,485
34,755
1,732
1,055
13,494
23,328
866
141
3,565
8.66
8.13
2.88
2.99
2.21
1.28
1.10
0.55
0.52
0.55
347
905
283
1,098
837
199,839
16
14
20,737
14,754
665,535
68
80
22
1,497
5,716
315,625
1
4,489
23,247
936,108
57
67
18
1,247
4,762
262,933
1
3,740
19,366
779,830
0.38
0.27
0.02
2.21
0.03
-
$
(*1) Excluded in applying the equity method since the increase in ownership was caused mainly by investee’s stock
retirement and the Company believes the increase of ownership is temporary
(*2) Percentage ownership is calculated by combining the ownership of the Company and its subsidiaries.
68
Companies
Hyundai MOBIS
Korea Industrial Development Co., Ltd.
INI Steel
Saehan Media
Jin Heung Mutual Savings & Finance
Co., Ltd.
Comet Savings & Finance Co., Ltd.
Hyundai Heavy Industries Co., Ltd.
Hyundai Corporation
Hyundai Information Technology Co., Ltd.
LG Telecom.Co., Ltd.
Chohung Bank
Korea Investment Corporation
Hyundai Merchant Marine Co., Ltd.
Kia Steel Co., Ltd.
Hyundai Engineering & Construction
Co., Ltd
Kanglim Specific Equipment
Automotive Co., Ltd.
Prochips Technology Inc.
DongYang Investment Bank
Treasury Stock Funds
Stock Market Stabilization Fund
Korean won
U.S. dollars(Note 2)
(in millions)
(in thousands)
Percentage
Historical cost
Book value
Book value Ownership (*)
83,102
298,207 $
248,423
19.98
19,854
6,144
5,118
12.72
72,719
60,327
50,256
12.55
2,009
1,687
1,406
10.01
2,000
2,700
59,004
13,626
10,000
19,851
62,463
190
7,329
96
880
1,709
57,431
3,498
3,593
30,682
28,277
97
1,400
130
733
1,424
47,843
2,914
2,993
25,560
23,556
81
1,166
108
9.01
9.00
2.99
2.99
2.21
1.28
1.10
0.95
0.55
0.52
13,332
8,666
7,219
0.42
346
905
283
24,021
32,963
426,793
120
905
45
10,371
41,414
555,583
100
754
38
8,640
34,500
462,832
0.38
0.27
0.23
-
$
(*) Percentage ownership is calculated by combining the ownership of the Company and its subsidiaries.
Marketable investment equity securities are stated at fair value and the differences between the acquisition costs and fair
value are recorded in capital adjustments (see Note 14).
Non-listed investments that are excluded from the consolidation and the application of the equity method as of December
31, 2002 consist of the following:
Companies
Yan Ji Kia Motors A/S (*1)
Hyundai Capital Asset Management Co., Ltd.
(*1)
Hyundai Jingxian Motor Safeguard Service
Co., Ltd. (*1)
NGVTEK.com (*1)
Kia Service Philippines Co. (*1)
Eukor Car Carriers, Inc.
Mco
Dongyong Industries Co., Ltd
Hyundai RB Co.
Mobil Com.Co., Ltd.
Jinil MVC Co., Ltd.
Industri Otomotif Komersial
Korean won
U.S. dollars(Note 2)
(in millions)
(in thousands)
Percentage
Acquisition cost
Book value
Book value Ownership (*2)
1,792
1,792 $
1,493
100.00
2,000
2,000
1,666
100.00
2,019
700
185
48,912
950
241
550
1,800
180
4,439
2,019
700
185
48,912
950
241
550
1,800
180
4,439
1,682
583
154
40,747
791
201
458
1,500
150
3,698
84.88
68.29
20.00
19.99
19.99
19.23
18.64
17.61
18.00
15.00
69
HYUNDAI MOTOR COMPANY AND SUBSIDIARIES: Financial Statements 2002
Companies
Hyundai Technology Investment Co., Ltd.
Hyundai Unicorns Co., Ltd.
Hyundai Research Institute
Gyeongnam Credit Guarantee Foundation
Kihyup Finance, Inc.
SoltechIM Co., Ltd
Toba Telecom
3Gcore, Inc
Yonhap Capital Co., Ltd.
Hyundai Motor Deutschland GmbH
Hyundai Finance Corporation
Daejoo Heavy Industry Co. Ltd.
A.P. Co., Ltd.
Namyang Industrial Co., Ltd.
KOENTECH (formerly Ulsan Environmental
Development)
Internet Hankyoreh Inc.
Hyundai Oil refinery Co., ltd.
Hyundai Asan Corporation
Yonhi Information & Communication Co.,
Ltd.
Dongwon Capital Co., Ltd.
U.S Electrical Inc.
ROTIS
Q&V Korea
Daishin Factoring Co., Ltd
Korea Auto Industries Coop Association
ICOLS Inc.
KT ICOM Co., Ltd. (formerly I-COM)
Cheju International Convention Center
Kyongnam Shinmun Co., Ltd
Daewoo Commercial Vehicle
Daewoo Motor Co., Ltd.
Space Imaging LLC
Machinery Insurance Cooperative
Other
HYUNDAI MOTOR COMPANY AND SUBSIDIARIES: Financial Statements 2002
Korean won
U.S. dollars(Note 2)
(in millions)
(in thousands)
Percentage
Acquisition cost
Book value
Book value Ownership (*2)
4,490
4,490 $
3,740
14.97
5,795
5,795
4,828
14.90
1,271
1,271
1,059
14.90
2,500
2,500
2,083
13.66
3,700
3,700
3,082
12.75
157
157
131
10.47
405
405
337
10.02
225
225
187
10.90
10,500
10,500
8,747
10.49
802
802
668
10.00
9,888
9,888
8,237
9.29
650
650
541
9.29
550
9.20
200
200
167
8.00
1,550
4,800
88,857
22,500
1,550
4,800
88,857
8,861
1,291
3,999
74,023
7,382
7.75
7.41
6.33
5.00
500
3,000
2,204
1,000
400
2,000
16
160
18,000
500
20
40
2,213
5,319
8,188
15,544
281,712
500
3,000
2,204
1,000
400
16
160
18,000
500
3
2
5,319
8,188
14,832
262,543
417
2,499
1,836
833
333
13
133
14,995
417
2
2
4,431
6,821
12,356
218,713
4.90
4.62
3.80
3.76
3.70
3.33
2.06
2.50
1.00
0.59
0.28
0.05
0.02
-
$
(*1) The equity securities of these affiliates were excluded from using the equity method since the Company believes the
changes in the investment value due to the changes in the net assets of the investee, whose individual beginning
balance of total assets or paid-in capital at the date of its establishment is less than 7,000 million ($5,831 thousand),
are not material.
(*2) Percentage ownership is calculated by combining the ownership of the Company and its subsidiaries.
70
Non-listed investments that are excluded from the consolidation and the application of the equity method as of December
31, 2001 consist of the following:
Korean won
U.S. dollars(Note 2)
(in millions)
(in thousands)
Percentage
Companies
Acquisition cost
Book value
Book value Ownership (*2)
Hyundai Motor Europe GmbH (*1)
5,590
5,590 $
4,657
100.00
Yan Ji Kia Motors A/S (*1)
1,792
1,792
1,493
100.00
Hyundai Capital Asset Management Co.,
Ltd. (*1)
2,000
2,000
1,666
99.99
Hyundai Jingxian Motor Safeguard
Service Co., Ltd. (*1)
2,019
2,019
1,682
84.88
NGVTEK.com (*1)
700
700
583
68.30
Autoever Co., Ltd. (*1)
2,495
2,495
2,078
49.90
Kia Service Philippines Co. (*1)
185
185
154
20.00
Dongyong Industries Co., Ltd
240
240
200
19.23
Mobil Com.Co., Ltd.
1,800
1,800
1,500
18.07
Jinil MVC Co., Ltd.
180
180
150
18.00
Industri Otomotif Komersial
4,439
4,439
3,698
15.00
Korea Automotive Powertrain
Engineering Co.
150
150
125
15.00
Hyundai Technology Investment Co., Ltd.
4,490
4,490
3,740
14.97
Hyundai Unicorns Co., Ltd.
5,795
5,795
4,828
14.90
Hyundai Research Institute
1,271
1,271
1,059
14.90
Gyeongnam Credit Guarantee Foundation
2,500
2,500
2,083
13.66
Kihyup Finance, Inc.
3,700
3,700
3,082
12.75
Norrinet Co., Ltd
34
34
28
12.14
SoltechIM Co., Ltd
157
157
131
12.08
3Gcore, Inc
225
225
188
10.90
Yonhap Capital Co., Ltd.
10,500
10,500
8,747
10.47
Machinery Insurance Cooperative
3,070
3,070
2,558
10.38
Hyundai Motor Deutschland GmbH
802
802
668
10.00
Hyundai Finance Corporation
9,888
9,888
8,237
9.29
Daejoo Heavy Industry Co. Ltd.
650
650
541
9.29
A.P. Co., Ltd.
550
550
458
9.20
Namyang Industrial Co., Ltd.
200
200
167
8.00
KOENTECH (formerly Ulsan
Environmental Development)
1,550
1,550
1,291
7.75
Internet Hankyoreh Inc.
4,800
4,800
3,999
7.41
Hyundai Oil refinery Co., Ltd.
78,134
78,134
65,090
6.33
Hyundai Asan Corporation
22,500
22,500
18,744
5.00
Yonhi Information & Communication Co.,
Ltd.
500
500
417
4.90
Dongwon Capital Co., Ltd.
3,000
3,000
2,499
4.62
Biomecha Ltd
100
100
83
4.00
U.S Electrical Inc.
2,204
2,204
1,836
3.80
ROTIS
1,000
1,000
833
3.76
O&V Korea
400
400
333
3.70
Daishin Factoring Co., Ltd
2,000
2,000
1,666
3.33
Jeonbuk corporation
100
100
83
2.84
Korea Auto Industries Coop Association
11
11
9
2.60
ICOLS Inc.
160
160
133
2.50
Alcan Taihan Aluminum Ltd.
30,815
21,003
17,497
1.26
I-COM
18,000
18,000
14,995
1.00
Kyongnam Shinmun Co., Ltd
50
33
27
0.63
Shinsegi Telecom Co.
837
837
697
0.41
Other
8,511
8,527
7,104
240,094
230,281 $
191,837
71
HYUNDAI MOTOR COMPANY AND SUBSIDIARIES: Financial Statements 2002
HYUNDAI MOTOR COMPANY AND SUBSIDIARIES: Financial Statements 2002
(*1) The equity securities of these affiliates were excluded from using the equity method since the Company believes the
changes in the investment value due to the changes in the net assets of the investee, whose individual beginning
balance of total assets or paid-in capital at the date of its establishment is less than 7,000 million ($5,831 thousand),
are not material.
(*2) Percentage ownership is calculated by combining the ownership of the Company and its subsidiaries.
6. INSURED ASSETS
Unlisted investment equity securities are stated at cost, except where an investee’s net equity value has declined and is
not expected to recover.
As of December 31, 2002, certain property, plant and equipment are insured for 9,585,558 million ($7,985,303 thousand)
and the Company and its certain subsidiaries carry general insurance for vehicles and workers' compensation and casualty
insurance for employees. In addition, the Company and Kia carry products and completed operations liability insurance
with a maximum coverage of 182,260 million ($151,833 thousand) thousand with Hyundai Marine & Fire Insurance Co.,
Ltd..
7. PROPERTY, PLANT AND EQUIPMENT
Total net equity value of unlisted investment equity securities, which the Company and its subsidiaries hold as of
December 31, 2002 and 2001, amounts to 223,369 million ($186,079 thousand) and 208,891 million ($174,018
thousand), respectively, based on the investees’ latest individual financial statements.
Property, plant and equipment as of December 31, 2002 and 2001 consists of the following:
Korean won
(in millions)
2002
2001
5,266,364
5,007,175
8,270,212
8,103,729
142,681
111,248
3,486,128
3,277,943
948,627
794,554
18,114,012
17,294,649
(6,415,241)
(5,317,325)
11,698,771
11,977,324
3,942,288
3,848,526
1,104,179
1,079,647
16,745,238
16,905,497
Debt securities as of December 31, 2002 and 2001 consist of the following:
Book value
Securities finance bonds
Overseas debentures
Subordinated debt
Private bonds
Other
Korean won
(in millions)
Historical cost
167,293
237,450
68,110
38,845
511,698
Korean won
(in millions)
2002
163,962
210,371
49,950
35,874
460,157
2001
228,937 $
181,976
101,458
15,329
49,970
577,670 $
U.S. dollars (Note 2)
(in thousands)
2002
2001
- $
190,717
136,589
151,596
175,251
84,520
41,611
12,770
29,885
41,628
383,336 $
481,231
Investment equity securities of the Company and its domestic subsidiaries pledged as collateral for various borrowings
and payables as of December 31, 2002 are as follows:
Company
Hyundai Corporation
Machinery Insurance Cooperative
Kisan Mutual Saving’s & Finance
Kia Motors Corporation
Kia Steel Co., Ltd.
Korea Defense Industry Association
No. of shares pledged
1,514,841
150
306,160
3,970,000
175,100
1,500
Buildings and structures
Machinery and equipment
Vehicles
Tools, Dies and molds
Other equipment
Less: Accumulated depreciation
Land
Construction in progress
8. INTANGIBLES
Intangibles as of December 31, 2002 and 2001 consist of the following:
Korean won
(in millions)
2002
The Company and its subsidiaries have entered into lease agreements for certain machinery and equipment. The capital
lease obligations are included in long-term debt in the accompanying balance sheets. Annual payments on these lease
agreements as of December 31, 2002 are as follows (won in millions):
2003
2004
2005
2006
Thereafter
72
Financing leases
Interest
Portion
15,214
7,758
6,571
6,026
3,408
38,977
$
As of December 31, 2002 and 2001, the value of the land, which the Company and its subsidiaries own domestically, totals
3,097,198 million ($2,580,138thousand) and 2,901,555 million ($2,417,157 thousand), respectively, in terms of land
prices officially announced by the Korean government.
5. LEASED ASSETS
Lease
Payments
97,765
76,111
62,521
61,980
38,773
337,150
$
U.S. dollars(Note 2)
(in thousands)
2002
2001
4,387,174 $
4,171,255
6,889,547
6,750,857
118,861
92,676
2,904,139
2,730,709
790,259
661,908
15,089,980
14,407,405
(5,344,253)
(4,429,627)
9,745,727
9,977,778
3,284,145
3,206,036
919,843
899,406
13,949,715 $ 14,083,220
Lease
Obligation
82,551
68,353
55,950
55,954
35,365
298,173
Operating leases
Lease
Payments
39,963
39,436
18,260
5,379
7,488
110,526
Goodwill
Negative goodwill
Industrial property rights
Development costs
Other
Acquisition Accumulated
cost
amortization
1,070,371
210,514
(135,388)
(22,719)
30,021
10,624
2,120,507
1,174,802
109,625
27,943
3,195,136
1,401,164
2001
Accumulated
impairment
loss
115,862
115,862
U. S. dollars (Note 2)
(in thousands)
2002
2001
Book value
Book value
Book value Book value
859,857
899,278 $ 716,309 $ 749,149
(112,669)
(118,225)
(93,860)
(98,488)
19,397
19,298
16,159
16,076
829,843
1,310,142
691,305 1,091,421
81,682
40,742
68,046
33,940
1,678,110
2,151,235 $ 1,397,959 $ 1,792,098
73
HYUNDAI MOTOR COMPANY AND SUBSIDIARIES: Financial Statements 2002
HYUNDAI MOTOR COMPANY AND SUBSIDIARIES: Financial Statements 2002
The changes in intangibles in 2002 are as follows:
Beginning of the year
Addition:
Expenditures
Deduction:
Disposal
Amortization
Research
Ordinary development
Impairment loss
End of the year
Goodwill
899,278
10. OTHER FINANCIAL BUSINESS ASSETS
Korean won
(in millions)
Industrial
Negative
property
Development
goodwill
rights
costs
(118,225)
19,298
1,310,142
U. S. dollars
(Note 2)
(in thousands)
Other
40,742
Total
Total
2,151,235 $ 1,792,098
19,758
(3,440)
6,082
996,742
46,449
1,065,591
887,697
(59,179)
859,857
8,996
(112,669)
(5,983)
19,397
(16,645)
(710,723)
(308,187)
(383,157)
(58,329)
829,843
(5,509)
81,682
(16,645)
(13,866)
(772,398)
(643,451)
(308,187)
(256,737)
(383,157)
(319,191)
(58,329)
(48,591)
1,678,110 $ 1,397,959
Amortization on intangible assets except negative goodwill is recorded in selling and administrative expenses and in
manufacturing cost and amortization on negative goodwill is recorded in other expenses. In addition, the Company
accounted for ordinary development expenses, research expenses and impairment loss as manufacturing cost, selling and
administrative expenses and other expenses, respectively.
As of December 31, 2002, goodwill consists of 340,288 million ($283,479 thousand) related to investments in
subsidiaries and 519,569 million ($432,830 thousand) related to mergers with non-subsidiary companies or business
divisions. As of December 31, 2001, goodwill consists of 343,704 million ($286,325 thousand) related to investments in
subsidiaries and 555,574 million ($462,824 thousand) related to mergers with non-subsidiary companies or business
divisions.
As of December 31, 2002, negative goodwill consists of 108,169 million ($90,111 thousand) related to investments in
subsidiaries and 4,500 million ($3,749 thousand) related to mergers with non-subsidiary companies or business
divisions. As of December 31, 2001, negative goodwill is 118,225 million ($98,488 thousand) related to investments in
subsidiaries.
9. OTHER ASSETS
Other assets as of December 31, 2002 and 2001 consist of the following:
Korean won
(in millions)
2002
Long-term notes and accounts receivable, net of
allowance for doubtful accounts of 1,630
million in 2002 and nil in 2001 and
unamortized discount of 6,332 million
in 2002 and 10,486 million in 2001
Lease and rental deposits
Long-term deposits
Deferred gain on valuation of derivatives
(see Note 2)
Long-term loan, net of allowance for doubtful
accounts of 45 million in 2002 and
nil in 2001 and unamortized discount of
4,397 million in 2002 and 4,967 million
in 2001
Other
74
U.S. dollars(Note 2)
(in thousands)
2002
2001
2001
31,203
322,505
36,186
34,053
313,715
202,702
$
51,622
168
43,004
140
138,719
113,607
693,842
122,643
58,126
731,407
115,561
94,641
578,009
102,168
48,423
609,303
$
25,994
268,664
30,145
$
$
Other financial business assets as of December 31, 2002 and 2001 consist of the following:
Korean won
(in millions)
2002
2001
8,059,742
4,926,439
290,169
120,287
17,930
21,687
8,367,841
5,068,413
Finance receivables
Lease receivables
Other
$
$
U.S. dollars(Note 2)
(in thousands)
2002
2001
6,714,213 $
4,103,998
241,727
100,206
14,937
18,066
6,970,877 $
4,222,270
11. SHORT-TERM BORROWINGS
Short-term borrowings as of December 31, 2002 and 2001 amount to 7,526,948 million ($6,270,367 thousand) and
6,748,184 million ($5,621,613 thousand), respectively, and consist primarily of bank loans and export financing loans
with annual interest rates ranging from 0.48 percent to 10.50 percent.
12. LONG-TERM DEBT
Long-term debt as of December 31, 2002 and 2001 consists of the following:
Debentures
Won currency loans
Capital lease
Reorganization claims
Composition obligation
General loans
Interest rate (%)
2002
3.00 ~ 9.40
62,490
524,855
5,812
475,597
1,068,754
U.S. dollars(Note 2)
(in thousands)
2002
2001
7,706,502
6,621,156
55,241
942,547
225,396
440,881
1,664,065
52,058
437,233
4,842
396,199
890,332
46,019
785,194
187,767
367,279
1,386,259
219,621
357,876
148,611
223,563
59,786
372,241
774,099
740,473
1,415,324
11,060,112
11,027,425
Less: Current maturities
(3,049,849)
(2,768,331)
8,010,263
8,259,094
(*) 3 year non-guaranteed bond circulating earning rate on the end of every quarter
182,957
123,801
310,097
616,855
9,213,689
(2,540,694)
6,672,995
298,131
186,240
49,805
644,868
1,179,044
9,186,459
(2,306,174)
6,880,285
Foreign currency loans
Capital lease
Reorganization claims
Composition obligation
Other
8.10 ~ 14.31
(*)
0.00 ~ 5.50
1.00 ~ 14.30
Korean won
(in millions)
2002
2001
9,250,885
7,948,036
3.10 ~ 6.81
(*)
2.23 ~ 7.73
$
$
28,368
261,342
168,862
75
HYUNDAI MOTOR COMPANY AND SUBSIDIARIES: Financial Statements 2002
HYUNDAI MOTOR COMPANY AND SUBSIDIARIES: Financial Statements 2002
Debentures as of December 31, 2002 and 2001 consist of the following:
The Company acquired treasury stock after cancellation of Trust Cash Funds as of March 2, 2001 and in accordance with
the decision of the Board of Directors,retired 10,000,000 common shares in treasury and 1,000,000 preferred shares in
treasury, which had additional dividends rate of 2 percent to the rate of common stock on March 5, 2001, using retained
earnings.
Annual
Interest rate(%)
Maturity
Domestic debentures
Guaranteed debentures
Non-guaranteed
Debentures
Convertible bonds
Overseas debentures
12 Sep, 2003 ~
27 March, 2004
3 Jan, 2003 ~
23 Sep, 2007
31 Dec, 2003
9 April, 2003 ~
18 July, 2006
Korean won
(in millions)
2002
U.S. dollars(Note 2)
(in thousands)
2002
2001
2001
6.3 ~ 6.6
10,500
5.0 ~ 8.0
3.0
8,218,132
69,972
6,718,200
110,478
6,846,161
58,291
5,596,634
92,035
3.07 ~ 9.40
1,025,586
9,324,190
(73,305)
9,250,885
1,240,706
8,069,384
(121,348)
7,948,036 $
854,370
7,767,569
(61,067)
7,706,502 $
1,033,577
6,722,246
(101,090)
6,621,156
Discount on debentures
- $
8,747 $
-
The Company issued 10,000,000 Global Depositary Receipts (GDRs) representing 5,000,000 shares of preferred stock in
November 1992, 4,675,324 GDRs representing 2,337,662 shares of preferred stock in June 1995 and 7,812,500 GDRs
representing 3,906,250 shares of preferred stock in June 1996, all of which have been listed on the Luxembourg Stock
Exchange.
In the second half of 1999, the Company issued 45,788,000 Global Depositary Shares representing 22,894,000 common
shares for 601,356 million ($500,963 thousand), which include paid-in capital in excess of par value of 486,886 million
($405,603 thousand).
14. CAPITAL ADJUSTMENTS
Capital adjustments as of December 31, 2002 and 2001 consist of the following:
Convertible bonds with the carrying value of 69,972 million ($58,291 thousand) and 110,478 million ($92,034 thousand)
as of December 31, 2002 and 2001, respectively, were issued by Hyundai HYSCO, a subsidiary. In, 2002, convertible
bonds with the face value of 28 million ($24 thousand) were converted to 5,660 shares of common stock.
The maturities of long-term debt as of December 31, 2002 are as follows:
2003
2004
2005
2006
Thereafter
Debentures
2,568,075
3,979,803
1,938,176
808,136
30,000
9,324,190
Korean won
(in millions)
Won
Foreign
Currency
Currency
Loans
Loans
294,360
188,071
293,595
274,074
121,569
113,839
119,267
70,365
239,963
94,124
1,068,754
740,473
U. S. dollars
(Note 2)
(in thousands)
Total
3,050,506
4,547,472
2,173,584
997,768
364,087
11,133,417
$
Total
2,541,241
3,788,297
1,810,717
831,196
303,305
9,274,756
14,889
13,605
(70,923)
22,775
13,687
(5,251)
22,900
(106,417)
(16,377)
(65,435)
$
U.S. dollars(Note 2)
(in thousands)
2002
2001
(72,071) $
(66,351)
(311)
(518)
12,403
11,334
(59,083)
$
19,077
(88,651)
18,973
11,402
(4,374)
$
(13,643)
(54,511)
(1) Treasury stock
13. CAPITAL STOCK
The Company has shares held as treasury stock consisting of 1,005,570 common shares and 3,167,300 preferred shares
with a carrying value of 73,036 million ($60,843 thousand) as of December 31, 2002, and 992,155 common shares and
3,168,600 preferred shares with a carrying value of 71,786 million ($59,802 thousand) as of December 31, 2001,
acquired directly or indirectly through the Treasury Stock Funds and Trust Cash Funds. In addition, the Company’s
shares of subsidiaries’ stocks held by themselves, amounting to 13,478 million ($11,228 thousand) and 7,862 million
($6,549 thousand) as of December 31, 2002 and 2001, respectively, are included in the treasury stock.
Capital stock as of December 31, 2002 and 2001 consist of the following:
(2) Discounts on stock issuance
Less: Discount on
debentures
Common stock
Preferred stock
(73,305)
9,250,885
Authorized
450,000,000
150,000,000
1,068,754
Issued
219,088,702 shares
65,202,146 shares
740,473
Par value
5,000
5,000
(73,305)
11,060,112
Korean won
(in millions)
1,145,443
331,011
1,476,454
$
(61,067)
9,213,689
U.S. dollars (Note 2)
(in thousands)
$
954,218
275,750
$
1,229,968
The preferred shares are non-cumulative, non-participating and non-voting. Of the total preferred stock issued of
65,202,146 shares as of December 31, 2002, a total of 27,588,281 preferred shares (First and Third preferred shares) are
eligible to receive cash dividends, if declared, equal to that declared for common shares plus an additional 1 percent
minimum increase while the dividend rate for the remaining 37,613,865 preferred shares (Second preferred shares) is 2
percent higher than that declared for common shares.
76
Treasury stock
Discounts on stock issuance
Gain on valuation of investment
equity securities
Stock option cost
Cumulative translation adjustments
Gain (Loss) on valuation of derivatives
(see Note 2)
Korean won
(in millions)
2002
2001
(86,514)
(79,648)
(374)
(621)
Certain subsidiaries accounted for expense on issuance of new stock as discounts on stock issuance. The Company’s
share of these discounts amounting to 374 million ($312 thousand) and 621 million ($517 thousand) is accounted for
as a debit to capital adjustments as of December 31, 2002 and 2001, respectively.
(3) Gain on valuation of investment equity securities
The Company recorded a gain from valuation of marketable investment equity securities and investments on affiliates,
which were accounted for using the equity method (see Note 4), and the Company’s share of the gain on valuation of
investment equity securities reported in accounts of its subsidiaries in capital adjustments as gain on valuation of
investment equity securities within shareholders’ equity. The Company recorded gains of 14,889 million ($12,403
thousand) and 22,775 million ($18,973 thousand) in 2002 and 2001, respectively.
77
HYUNDAI MOTOR COMPANY AND SUBSIDIARIES: Financial Statements 2002
HYUNDAI MOTOR COMPANY AND SUBSIDIARIES: Financial Statements 2002
(4) Stock option cost
16. SELLING AND ADMINISTRATIVE EXPENSES
The Company granted stock options to 104 directors (grant date: March 10, 2000, beginning date for exercise: March 10,
2003, expiry date for exercise: March 9, 2008), at an exercise price of 14,900 ($12.41) as determined during the meeting
of the shareholders on March 10, 2000. These stock options require at least two-year continued service for exercise. If all
of the stock options as of December 31, 2002 and 2001 are exercised, 1,340,000 and 1,470,000 new shares or shares held
as treasury stock, respectively, will be granted according to the decision of the Board of Directors.
Selling and administrative expenses are as follows:
The Company calculates the total compensation expense using an option-pricing model. In the model, the risk-free rate
of 9.04 percent, an expected exercise period of 5.5 years and an expected variation rate of stock price of 71.1 percent are
used. Total compensation expense amounting to 12,291 million ($10,239 thousand) and 12,208 million ($10,170
thousand) in 2002 and 2001, respectively, has been accounted for as a charge to current operations and a credit to capital
adjustment over the required period of service (two years) from the grant date using the straight-line method.
In addition, Kia, a domestic subsidiary, granted stock options to 62 directors (grant date: March 17, 2000, beginning date
for exercise date: March 17, 2003, expiry date for exercise : March 18, 2008), at an exercise price of 5,500 ($4.58) as
determined during the meeting of the shareholders on March 17, 2000. If all of the stock options, which require at least
two-year continued service, are exercised, 950,000 new shares or shares held as treasury stock will be granted in
accordance with the decision of the Board of Directors. The Company calculates the total compensation expense using
an option-pricing model. In the model, the risk-free rate of 10.0 percent, an expected exercise period of 5.5 years and an
expected variation rate of stock price of 83.9 percent are used. Total compensation expense amounts to 3,735 million
($3,111 thousand) and to be accounted for as a charge to current operations and a credit to capital adjustment over the
required period of service from the grant date using the straight-line method.
Salaries
Export related expenses
Sales promotion
Sales commission
Sales warranties
Taxes and dues
Communications
Utilities
Freight and warehousing
Rent
Travel
Service charges
Supplies
Research
Depreciation
Amortization
Provision for bad debt
Other
(5) Cumulative translation adjustments
Cumulative translation debits of 70,923 million ($59,083 thousand) and 5,251 million ($4,374 thousand) as of
December 31, 2002 and 2001, respectively, which result from the translation of financial statements of overseas
subsidiaries and two branches located in the United States, is included in capital adjustments on the basis set forth in
Note 2.
(6) Gain (loss) on valuation of derivatives
The gain (loss) on valuation of the effective portion of derivative instruments for cash flow hedging purpose from
forecasted exports is included in capital adjustments on the basis set forth in Note 2. The Company recorded a gain of
22,900 million ($19,077 thousand) and a loss of 16,377 million ($13,643 thousand) as of December 31, 2002 and 2001,
respectively.
15. PLEDGED ASSETS, CHECKS AND NOTES
As of December 31, 2002, the following assets, checks and notes are pledged as collateral:
(1) The Company’s and its domestic subsidiaries' property, plant and equipment are pledged as collateral for various loans
to a maximum of 3,565 billion ($2,970 million).
Korean won
(in millions)
2002
2001
1,636,321
1,406,531
839,878
763,607
2,159,849
1,862,237
405,419
363,607
2,211,522
1,357,028
47,906
43,579
57,040
56,279
41,350
38,364
159,823
133,248
48,136
57,685
107,469
99,204
345,069
281,814
76,684
65,810
313,865
108,006
180,301
201,389
78,139
68,530
598,448
452,755
222,037
66,457
9,529,256
7,426,130
$
$
U.S. dollars(Note 2)
(in thousands)
2002
2001
1,363,146 $
1,171,719
699,665
636,127
1,799,275
1,551,347
337,737
302,905
1,842,321
1,130,480
39,909
36,304
47,517
46,884
34,447
31,959
133,141
111,003
40,100
48,055
89,528
82,643
287,462
234,767
63,882
54,823
261,467
89,975
150,201
167,768
65,094
57,089
498,540
377,170
184,969
55,362
7,938,401 $
6,186,380
17. EXTRAORDINARY GAIN ON INCOME TAX BENEFITS
In 1999, Kia, one of the Company’s subsidiaries, and its transferor company, formerly Asia Motors, asked the Korean tax
authorities to reassess the accumulated tax loss carryforward totaling 4,573,584 million ($3,810,050 thousand) for the
loss on prior period error corrections that is attributable to events occurring from 1991 to 1997 and charged to the
operations in 1998. However, the tax authorities refused to reassess the tax loss carry forward and, instead, imposed on
May 1, 2000, a corporate tax assessment of 380,668 million ($317,118 thousand) pertaining to taxable year 1998.
Kia appealed the dismissal of its request for reassessment and the imposition of corporate tax by the tax authorities and
brought the case to the National Tax Tribunal. On January 31, 2001, the National Tax Tribunal accepted the Kia’s assertion
and issued its decision for the reassessment of Kia’s prior years’ taxable income. Pursuant to the decision of the National
Tax Tribunal, the tax authorities reassessed Kia’s tax loss carry forward and determined the deductible amount for tax loss
carry forward as 640,589 million ($533,646 thousand) as of January 1, 2001, after the utilization of
98,093 million
($81,717 thousand) of tax loss carryforward during 2000. In prior years, the future tax benefits from the tax loss
carryforward were not recorded by Kia as deferred income tax assets pending the outcome of the tax litigation.
Accordingly, in 2001, Kia recognized the tax benefits from the reassessed tax loss carryforward as an extraordinary gain in
the amount of 197,301 million ($164,363 thousand). Additionally, in 2001, as a result of the determination of the
deductible amount for tax loss carryforward, the asset revaluation tax amounting to
22,044 million ($18,364 thousand)
out of
34,256 million ($ 28,537 thousand) paid and recorded as other receivables in 2000 with respect to the asset
revaluation in 1999 was refunded to Kia.
(2) The Company’s and its domestic subsidiaries’ cash and cash equivalents of 33,405 million ($27,828 thousand),
financial instruments of 143,889 million ($119,868 thousand), marketable securities and investment securities (see
Note 4) are pledged as collateral for various borrowings, debentures, payables, lease agreements, guarantees of a
customer financing system and others.
(3) Certain overseas subsidiaries’ receivables, inventories and other financial business assets are pledged as collateral for
their borrowings.
(4) 130 blank checks, 275 blank promissory notes, 3 checks amounting to 6,742 million ($5,616 thousand) and6
promissory notes amounting to 7,478 million ($6,230 thousand) are pledged as collateral to financial institutions
and others.
78
79
HYUNDAI MOTOR COMPANY AND SUBSIDIARIES: Financial Statements 2002
HYUNDAI MOTOR COMPANY AND SUBSIDIARIES: Financial Statements 2002
18. INCOME TAX EXPENSE AND DEFERRED INCOME TAX DEBITS (CREDITS)
Deferred income taxes as of December 31, 2002 are computed as follows:
Income tax expense in 2002 and 2001 consists of the following:
Description
Income tax currently payable
Changes in deferred income taxes due to:
Temporary differences
Tax loss carried forward
Tax credit carried over
Deduction of capital surplus and
retained earnings
Excess of limitation on donation to
designated organization, others
Changes in temporary differences
due to consolidating adjustments
Changes in retained earnings
due to consolidation adjustments
Income tax expense
Korean won
(in millions)
2002
2001
1,023,118
604,744
$
U.S. dollars(Note 2)
(in thousands)
2002
2001
852,314 $
503,785
(178,981)
95,899
(6,159)
(162,229)
138,866
(8,881)
(149,101)
79,889
(5,131)
(135,146)
115,683
(7,398)
(480)
96,499
(400)
80,389
607
(607)
506
(506)
(68,901)
47,036
(57,398)
39,184
(20,759)
(178,774)
844,344
(44,264)
66,420
671,164
(17,293)
(148,928)
703,386
(36,874)
55,332
559,117
Description
Accounts of the Company
Accounts of subsidiaries
Korean won
(in millions)
365,120
684,204
1,049,324
Changes due to
consolidating adjustments
Deferred income taxes
317,313
1,366,637
Debits
U.S. dollars
(in thousands)
$
304,165
569,980
874,145
$
264,340
1,138,485
Credits
U.S. dollars (Note 2)
(in thousands)
- $
78,371
65,288
78,371
65,288
Korean won
(in millions)
45,924
124,295
$
38,257
103,545
Deferred income taxes as of December 31, 2001 are computed as follows:
$
$
Description
Accounts of the Company
Accounts of subsidiaries
Korean won
(in millions)
241,570
854,793
1,096,363
Changes due to
consolidating adjustments
Deferred income taxes
37,689
1,134,052
Debits
U.S. dollars
(in thousands)
$
201,241
712,090
913,331
$
31,397
944,728
Credits
U.S. dollars (Note 2)
(in thousands)
- $
78,437
65,342
78,437
65,342
Korean won
(in millions)
6,454
84,891
$
5,377
70,719
In 2002, the changes in accumulated temporary difference due to consolidation adjustments are as follows:
Description
Elimination of unrealized profits and
losses
Reversal of accrued product liabilities
Gain on valuation of investments
(equity method)
Others
Tax rate (%)
Korean won
(in millions)
Beginning
Of the year
Changes
End
of the year
248,562
(66,700)
40,438
(29,468)
289,000
(96,168)
(63,135)
(13,559)
105,168
29.7%
31,235
111,576
109,444
231,990
29.7%
68,901
48,441
95,885
337,158
29.7%
100,136
U. S. dollars
(Note 2)
(in thousands)
End
of the year
$
$
240,753
(80,113)
40,354
79,877
280,871
29.7 %
83,419
19. DIVIDENDS
The proposed dividends for 2002 is computed as follows:
Common shares, net of treasury shares
Number of
shares
218,083,132
Dividend rate
17%
Preferred shares, net of treasury shares:
First and Third
Second
24,492,541
37,542,305
18%
19%
Description
Elimination of unrealized profits and
losses
Reversal of accrued product liabilities
Gain on valuation of investments
(equity method)
Others
Tax rate (%)
80
End
of the year
140,837
(54,569)
107,725
(12,131)
248,562
(66,700)
182,526
(14,666)
254,128
30.8%
78,271
(245,661)
1,107
(148,960)
(63,135)
(13,559)
105,168
29.7%
31,235
(47,036)
U. S. dollars
(Note 2)
(in thousands)
End
of the year
$
$
207,066
(55,565)
22,043
35,665
243,079
$
18,363
29,711
202,498
The proposed dividends for 2001 was computed as follows:
Common shares, net of treasury shares
Number of
shares
218,187,967
Dividend rate
15%
Preferred shares, net of treasury shares:
First and Third
Second
24,492,541
37,541,005
16%
17%
In 2001, the changes in accumulated temporary difference due to consolidation adjustments are as follows:
Korean won
(in millions)
Beginning
Of the year
Changes
Korean won
U.S. dollars (Note 2)
(in millions)
(in thousands)
185,371 $
154,424
Korean won
U.S. dollars (Note 2)
(in millions)
(in thousands)
163,641 $
136,322
19,594
31,910
215,145
$
16,323
26,583
179,228
The proposed dividends for 2002 and 2001 were approved by shareholders’ meeting being held on March 14, 2003 and
March 15, 2002, respectively.
(52,595)
(11,295)
87,611
29.7%
26,020
81
HYUNDAI MOTOR COMPANY AND SUBSIDIARIES: Financial Statements 2002
HYUNDAI MOTOR COMPANY AND SUBSIDIARIES: Financial Statements 2002
20. ELIMINATION OF UNREALIZED PROFITS AND LOSSES
Significant transactions in 2002 and 2001 between the consolidated subsidiaries are as follows:
Unrealized profits and losses resulting from intercompany sales are calculated based on the average gross margin rate of
selling companies and are eliminated in the consolidated financial statements. Unrealized profits related to sales of
inventories and property, plant and equipment as of December 31, 2002 are as follows:
Korean won
(in millions)
Property,
Plant and
Inventories
Equipment
3,152
1,042
280,045
-
Upstream sales
Downstream sales
Downstream sales between consolidated
subsidiaries
230,651
-
U.S. dollars(Note 2)
(in thousands)
Property,
Plant and
Inventories
Equipment
$
2,626 $
868
233,293
192,145
Kia Motors Corporation
Kia Motors Corporation
Kia Motors Corporation
Unrealized profits related to sales of inventories and property, plant and equipment as of December 31, 2001 are as
follows:
Korean won
(in millions)
Property,
Plant and
Inventories
Equipment
3,747
1,057
244,815
990
Upstream sales
Downstream sales
Downstream sales between consolidated
subsidiaries
319,570
-
U.S. dollars(Note 2)
(in thousands)
Property,
Plant and
Inventories
Equipment
$
3,121 $
881
203,945
825
266,220
Subsidiaries
Hyundai Capital Service
Inc.
Autoever Co.,Ltd
KEFICO Corporation
Hyundai Dymos
(formerly Korea Drive
Train System)
Kia Motors Corporation
Kia Motors Corporation
-
Wia Corporation
WISCO
WISCO
Hyundai Powertech
Hyundai HYSCO
Hyundai HYSCO
Hyundai Motor India
Kia Motors Corporation
Kia Motors Corporation
Kia Motors Corporation
Wia Corporation
KIA Motors
Deutschland GmbH
KIA Canada, Inc
Hyundai Powertech
KIA Motors America
Inc. and etc.
Kia Motors Corporation
Kia Motors Corporation
WIA Corporation
Kia Motors Corporation
Hyundai Motor India
Kia Motors Corporation
Kia Motors Corporation
2001
17,654 $
19,442
49,113
10,501
42,146
16,196
40,914
8,748
35,110
9,918
9,332
8,262
7,774
99,123
80,621
82,575
67,162
357,430
283,940
10,018
173,658
276,689
16,025
297,759
236,538
8,346
144,667
230,497
13,350
3,060,285
403,914
13,732
21,166
150,031
83,417
22,895
3,076,082
347,041
15,413
15,708
40,229
6,674
94,986
-
2,549,388
336,483
11,440
17,632
124,984
69,491
19,073
2,562,547
289,104
12,840
13,086
33,513
5,600
79,129
-
Korean won
(in millions)
U. S. dollars (Note 2)
(in thousands)
2002
2001
2002
2001
Company’s Company’s Company’s Company’s Company’s Company’s Company’s Company’s
receivable
payable
receivable
payable
receivable
payable
receivable
payable
Significant transactions in 2002 and 2001 between the Company and consolidated subsidiaries are as follows:
Korean won
(in millions)
U. S. dollars (Note 2)
(in thousands)
2002
2001
2002
2001
Company’s Company’s Company’s Company’s Company’s Company’s Company’s Company’s
income
expenses
income
expenses
income
expenses
income
expenses
82
Counterpart Subsidiaries
Kia Motors Corporation
U.S. dollars(Note 2)
(in thousands)
2002
2001
5,402 $
14,707
As of December 31, 2002 and 2001, significant balances related to the transactions between the Company and
consolidated subsidiaries are as follows:
21. INTERCOMPANY TRANSACTIONS
Hyundai Capital
Service Inc.
KEFICO Corporation
Hyundai Powertech
Hyundai Dymos
(formerly Korea Drive
Train System)
Kia Motors Corporation
Hyundai HYSCO
Hyundai Motor America
Hyundai America
Technical Center Inc.
Hyundai Motor India
Hyundai Motor Japan Co.
Hyundai Motor Poland
Sp. Zo. O
Hyundai Machine Tool
Europe GmbH
HAOSVT
Korean won
(in millions)
2002
6,485
18,167
19,058
15,198
297,864
86,734
54,576
12,776
-
- $
260,587
-
15,134 $
- $
15,876
248,137
12,661
72,254
101,271
870,662
4,636
6,652,505
297,940
443,576
189,809
-
71,214
809,373
3,608
5,401,377
173,748
33,182
13,937
-
113,161
17,927
18,988
24,323
-
144,742
27,642
11,610
-
94,269
14,934
15,818
20,262
-
65,652
-
32,428
-
54,692
-
27,014
-
15,053
124,339
-
18,806
22,746
595
12,540
103,581
-
15,666
18,949
496
222,603
84,364
457,928
725,310
219,062
3,862
- 5,541,907
45,465 $
10,643 217,083
-
248,201
59,325
369,523
674,253
158,121
3,006
- 4,499,648
185,441
381,480
182,491
-
Hyundai Capital
Service Inc.
ROTEM
KEFICO Corporation
Hyundai Dymos
(formerly Korea Drive
Train System
Hyundai Powertech
WIA Corporation
Kia Motors Corporation
Autoever Co., Ltd
Hyundai HYSCO
Hyundai Motor America
Hyundai Motor India
Hyundai Translead
Hyundai Motor Japan
Co.
Hyundai Motor Poland
Sp. Zo. O
HAOSVT
572
251
471
7,023
14,784
41,196
886
1,690
3,643 $
5,198
34,402
2,080
6,907
51,135
124,266
31
129
1,413,608
6,586
-
57,828
30,242
13,858
106,006
26,001
40,466
23,253
-
2,456
6,876
37,169
77,476
214
5
81,882
7,041
-
32,292
-
12,509
-
10,037
66,460
168
10
13,567
46,578
-
477 $
209
392
7,767
1,733
29,646
5,754
42,598
97,268
103,520
23,475
26
64,427
107
63,363 1,177,614
5,487
39,265
-
5,851 $
12,316
34,319
738 $ 3,035
4,330
1,408
28,659
48,174
25,913
11,544
88,309
21,660
33,710
19,371
-
2,046
5,728
30,964
64,542
178
4
68,212
5,866
-
6,470
24,697
81,030
19,556
53,671
52,785
32,710
26,901
-
10,421
-
8,361
55,365
140
8
11,302
38,802
-
83
HYUNDAI MOTOR COMPANY AND SUBSIDIARIES: Financial Statements 2002
HYUNDAI MOTOR COMPANY AND SUBSIDIARIES: Financial Statements 2002
As of December 31, 2002 and 2001, significant balances related to the transactions between the Company and
consolidated subsidiaries are as follows:
As of December 31, 2001, significant balances related to the transactions other than the consolidated subsidiaries are as
follows:
Korean won
U.S. dollars(Note 2)
(in millions)
(in thousands)
Companies
Related Party
Sales,
Purchases,
Sales,
Purchases,
Revenues
Expenses
Revenues
Expenses
Hyundai Motor Company
Hyundai Mobis
9,366
109,228 $
7,802 $
90,993
Kia Motors Corporation
Hyundai Mobis
74,557
20,789
62,110
17,318
Subsidiaries
Kia Motors Corporation
Kia Motors Corporation
Kia Motors Corporation
Kia Motors Corporation
Kia Motors Corporation
KEFICO Corporation
Hyundai Dymos
(formerly Korea Drive
Train System)
Hyundai Capital Service
Inc.
Wia Corporation
Hyundai Powertech
Hyundai HYSCO
Hyundai Translead(HT,
formerly Hyundai PreciSion America Inc.)
Hyundai Motor Finance
Company
Counterpart Subsidiaries
WIA Corporation
Hyundai Powertech
Kia Motors America
Inc. and etc.
KIA Canada, Inc
Kia Motors
Deutschland GmbH.
Kia Motors Corporation
Kia Motors Corporation
Korean won
(in millions)
2002
11,593
-
2001
- $
119,927
U.S. dollars(Note 2)
(in thousands)
2002
2001
9,658 $
99,906
636,022
100,956
1,116,256
104,021
529,842
84,102
929,903
86,655
211,704
7,606
166,049
10,077
176,361
6,336
138,328
8,395
2,413
3,042
2,010
2,534
16,047
93,340
26,902
16,788
27,128
18,929
13,368
77,757
22,411
13,985
22,599
15,769
30,245
-
25,196
-
-
10,609
-
8,838
23. COMMITMENTS AND CONTINGENCIES
(1) The Company and its consolidated subsidiaries are contingently liable for guarantees of indebtedness of other
companies including subsidiaries as of December 31, 2002 as follows:
Company providing
guarantee of indebtedness
Hyundai Motor Company
Hyundai Powertech
Kia Motors Corporation
Kia Motors Corporation
Kia Motors Corporation
HAOSVT
HAOSVT
Company provided
guarantee of indebtedness
Hyundai Merchant Marine
Hyundai Motor Finance
Company
Hyundai Translead
Hyundai Motor India
HAOSVT
Hyundai Motor Japan Co.
Hyundai Motor Amerida
Hyundai Motor Poland Sp.Zo.O
Hyundai Motor Europe GmbH
Other overseas
Other domestic
22. RELATED PARTY TRANSACTIONS
In 2002, significant transactions with related parties other than the consolidated subsidiaries are as follows :
Companies
Related Party
Hyundai Motor Company
Kia Motors Corporation
Hyundai Mobis
Hyundai Mobis
Korean won
U.S. dollars(Note 2)
(in millions)
(in thousands)
Sales,
Purchases,
Sales,
Purchases,
Revenues
Expenses
Revenues
Expenses
304,130
864,982 $
253,357 $
720,578
861,712
1,101,049
717,854
917,235
In 2001, significant transactions with related parties other than the consolidated subsidiaries are as follows :
Companies
Related Party
Hyundai Motor Company
Kia Motors Corporation
Hyundai Mobis
Hyundai Mobis
Korean won
U.S. dollars(Note 2)
(in millions)
(in thousands)
Sales,
Purchases,
Sales,
Purchases,
Revenues
Expenses
Revenues
Expenses
229,478
636,316 $
191,168 $
530,087
97,792
159,367
81,466
132,762
As of December 31, 2002, significant balances related to the transactions other than the consolidated subsidiaries are as
follows:
Companies
Hyundai Motor Company
Kia Motors Corporation
84
Related Party
Hyundai Mobis
Hyundai Mobis
Korean won
U.S. dollars(Note 2)
(in millions)
(in thousands)
Receivables
Payables
Receivables
Payables
26,497
96,838 $
22,073 $
80,671
111,345
137,978
92,757
114,943
Company providing
guarantee of indebtedness
Kia Motors Corporation
Hyundai Dymos (formerly
Korea Drive Train System)
WIA Corporation
Hyundai HYSCO
Company provided
guarantee of indebtedness
Kisan Corporation
Wia Corporation
Hyundai Dymos (formerly Korea
Drive Train System)
Hyundai Pipe of America, Inc.
Hyundai-Huy Hoang Pipe
Company Limited
Korean won
(in millions)
411,444
204,068
176,459
117,835
86,742
15,193
132,706
10,687
56,581
2,258
2,401
1,216,374
Korean won
(in millions)
2
U.S. dollars(Note 2)
(in thousands)
$
342,756
$
170,000
147,000
98,163
72,261
12,657
110,551
8,903
47,135
1,881
2,000
1,013,307
U.S. dollars(Note 2)
(in thousands)
2
112,003
93,305
7,831
6,002
6,524
5,000
1,751
7,753
$
1,459
6,459
(2) As of December 31, 2002, the outstanding balance of accounts receivable discounted with recourse and transferred by
the Company and its consolidated subsidiaries amounts to 38,051 million ($31,699 thousand) except for short-term
borrowings of 2,479,563 million ($2,065,614 thousand) resulting from elimination of significant balances related to the
transactions between the consolidated subsidiaries.
(3) The Company and its consolidated subsidiaries have used a customer financing system related to a longterminstallment sales system and have provided guarantees to related banks amounting to 375,891 million ($313,138
thousand) as of December 31, 2002. These guarantees are all covered by insurance contracts, which specify the
customer and the Company and its subsidiaries as contractor and beneficiary, respectively.
(4) The Company accrues estimated product liabilities expenses and carries the products and completed operations
liability insurance (see Note 6) in order to cover the potential loss, which may occur due to the lawsuits related to its
operation such as product liabilities. The Company expects that the resolution of cases pending against the Company
as of December 31, 2002 will not have any material effect on its financial position.
85
HYUNDAI MOTOR COMPANY AND SUBSIDIARIES: Financial Statements 2002
HYUNDAI MOTOR COMPANY AND SUBSIDIARIES: Financial Statements 2002
Kia, a domestic subsidiary, is a defendant pertaining to its claim in the in-court reorganization proceeding, the lawsuits
related to its operation such as product liabilities, lawsuits for compensation of losses or damages. Kia also has a
pending lawsuit pertaining to the disputes with the Brazilian Government and the Brazilian shareholders of Asia Motors Do
Brasil S.A. (AMB), which was established as a joint venture by Asia Motors with a Brazilian investor, in Brazilian court.
Also, in 2002, Kia brought the case to the International Court of Arbitration to settle the disputes. Kia, a stockholder of
AMB, had already written off its investment of 14,057 million ($11,710 thousand) and estimates that the above matter
does not and will not affect its financial statements at this time. The outcome of the creditors’ claims in relation to Kia’s
denial of their claims in the in-court reorganization proceedings is not currently determinable.
24. SEGMENT INFORMATION
(1) Consolidated financial statements by industry
The consolidated balance sheets as of December 31, 2002 and 2001, and consolidated statements of income for the
years then ended, by industry under which the Company and its subsidiaries’ business are classified, are as follows:
Consolidated Balance Sheet As Of December 31, 2002
Korean won
(in millions)
Non-financial
Financial
industry
industry
U.S. dollars(Note 2)
(in thousands)
Non-financial
Financial
industry
industry
ASSETS
Current assets:
Non-current assets:
Investments, net of
unamortized present value discount
Property, plant and equipment, net of
accumulated depreciation
Intangibles, net of amortization
Other financial business assets
14,445,860
665,305
$
12,034,205
$
U.S. dollars(Note 2)
(in thousands)
Non-financial
Financial
industry
industry
ASSETS
Current assets:
Non-current assets:
Investments, net of
unamortized present value discount
Property, plant and equipment, net of
accumulated depreciation
Intangibles, net of amortization
Other financial business assets
11,357,794
771,925
$
9,461,674
$
643,056
3,491,920
922,684
2,908,964
768,647
16,802,095
2,145,994
-
104,392
3,777
5,073,975
13,997,080
1,787,732
-
86,964
3,146
4,226,904
Total non-current assets
22,440,009
6,104,828
18,693,776
5,085,661
Total assets
33,797,803
6,876,753
$
28,155,450
$
5,728,717
13,479,051
8,954,165
4,438,112
1,834,985
$
11,228,799
7,459,318
$
3,697,194
1,528,645
Total liabilities
22,433,216
6,273,097
18,688,117
5,225,839
Shareholders’ equity:
Capital stock
Capital surplus
Retained earnings
Capital adjustments
Minority interests
1,476,454
5,339,484
2,193,068
(95,031)
2,450,612
399,458
33,152
158,691
12,355
-
1,229,968
4,448,087
1,826,948
(79,166)
2,041,496
332,771
27,618
132,198
10,292
-
Total shareholders’ equity
11,364,587
603,656
9,467,333
502,879
Total liabilities and shareholders’ equity
33,797,803
6,876,753
554,236
Current liabilities
Other long-term liabilities
1,352,270
2,865,245
1,126,516
16,636,969
1,670,883
-
108,269
5,849
8,386,928
13,859,521
1,391,939
-
90,194
4,873
6,986,778
Total non-current assets
21,747,292
9,853,316
18,116,705
8,208,361
Total assets
36,193,152
10,518,621
$
30,150,910
$
8,762,597
LIABILITIES AND
SHAREHOLDERS’ EQUITY
86
Korean won
(in millions)
Non-financial
Financial
industry
industry
LIABILITIES AND
SHAREHOLDERS’ EQUITY
3,439,440
Current liabilities
Non-current liabilities
Other financial business liabilities
Consolidated Balance Sheet As Of December 31, 2001
14,719,420
8,211,003
-
6,140,458
3,566,741
12,732
$
Total liabilities
22,930,423
9,719,931
19,102,318
8,097,244
Shareholders’ equity:
Capital stock
Capital surplus
Retained earnings
Capital adjustments
Minority interests
1,475,312
5,287,270
3,561,797
(81,940)
3,020,290
476,182
43,721
286,405
(7,618)
-
1,229,017
4,404,590
2,967,176
(68,261)
2,516,070
396,686
36,422
238,591
(6,346)
-
Total shareholders’ equity
13,262,729
798,690
11,048,592
665,353
Total liabilities and shareholders’ equity
36,193,152
10,518,621
$
12,262,096
6,840,222
-
30,150,910
$
$
5,115,344
2,971,293
10,607
8,762,597
$
28,155,450
$
5,728,718
Consolidated Statement of Income for the Year Ended December 31, 2002
Korean won
(in millions)
Non-financial
Financial
industry
industry
Sales
Cost of sales
Selling and administrative expenses
Operating income
Other expenses, net
Ordinary income
Extraordinary items, net
Income before income tax
Income tax expense
Income before minority interests
Minority interests
Net income
46,461,645
34,937,000
8,605,494
2,919,151
284,157
2,634,994
2,634,994
796,065
1,838,929
456,792
1,382,137
1,678,629
1,089,731
380,996
207,902
20,784
187,118
187,118
57,413
129,705
129,705
U.S. dollars(Note 2)
(in thousands)
Non-financial
Financial
industry
industry
$
$
38,705,135
29,104,465
7,168,855
2,431,815
236,719
2,195,096
2,195,096
663,166
1,531,930
380,533
1,151,397
$
$
1,398,392
907,807
317,391
173,194
17,314
155,880
155,880
47,828
108,052
108,052
87
HYUNDAI MOTOR COMPANY AND SUBSIDIARIES: Financial Statements 2002
HYUNDAI MOTOR COMPANY AND SUBSIDIARIES: Financial Statements 2002
Consolidated Statement of Income for the Year Ended December 31, 2001
(3) Effective December 31, 2002, KIA Motors Deutschland GmbH (KMD) sold its Euro Part division, which had been
engaged in selling and distribution of motor parts to agents in Europe excluding Germany, to Hyundai Motor Europe
Parts N.V.-Deutschland (HMEP-D). As part of the consideration for the disposal of the division, KMD will purchase
parts from HMEP-D at 12 percent discounted price of ordinary price during a ten-year period starting in 2003, which is
payable every year during the said period.
Korean won
(in millions)
Non-financial
Financial
industry
industry
Sales
Cost of sales
Selling and administrative expenses
Operating income
Other expenses, net
Ordinary income
Extraordinary items, net
Income before income tax
Income tax expense
Income before minority interests
Minority interests
Net income
38,966,732
29,037,671
7,051,424
2,877,637
1,058,709
1,818,928
190,650
2,009,578
635,451
1,374,127
260,940
1,113,187
913,170
288,551
430,660
193,959
59,709
134,250
134,250
43,588
90,662
90,662
U.S. dollars(Note 2)
(in thousands)
Non-financial
Financial
industry
industry
$
$
32,461,456
24,189,995
5,874,229
2,397,232
881,964
1,515,268
158,822
1,674,090
529,366
1,144,724
217,378
927,346
$
$
760,721
240,379
358,763
161,579
49,741
111,838
111,838
36,311
75,527
75,527
The above figures are not tally with the consolidated balance sheets and statements of income because the transactions
between non-financial and financial companies were not eliminated.
(2) Regional Results of Operations
Results of operations, by region where the Company and its subsidiaries in 2002 are located, are as follows:
Total sales
Intercompany sales
Net sales
Operating income
Total assets
North
America
8,786,610
(663,818)
8,122,792
261,068
3,556,458
Asia
846,618
(23,856)
822,762
34,612
609,081
Europe
888,230
888,230
7,647
366,032
Consolidation
adjustment
(11,055,126)
11,056,126
35,887
(5,069,042)
Consolidated
amounts
48,122,919
48,122,919
3,128,435
46,125,688
Results of operations, by region where the Company and its subsidiaries in 2001 are located, are as follows:
Korean won
(in millions)
Total sales
Intercompany sales
Net sales
Operating income
Total assets
Domestic
39,258,617
(7,740,826)
31,517,791
2,840,267
40,182,546
North
America
7,241,581
(14,970)
7,226,611
270,576
2,993,154
Asia
1,030,909
(24,323)
1,006,586
24,742
810,640
Europe
100,587
100,587
856
49,707
Consolidation
adjustment
(7,780,119)
7,780,119
(18,326)
(4,163,751)
Hyundai Capital Service Inc. and Hyundai Motor Finance Company dispose their finance receivable assets to special
purpose companies or financial intermediaries for the purpose of funding its operating capital. Hyundai Capital Service Inc.
disposed such assets of 5,358,818 million ($4,464,194 thousand) and of 3,872,280 million ($3,225,825 thousand) in
2002 and 2001, respectively, with a resultant gain of 4,927 million ($4,104 thousand) and nil in 2002 and 2001,
respectively. The gain on disposal of finance receivables assets were accounted for as operating income and included in
sales in the consolidated financial statements.
27. TERMINATION OF THE COMPOSITIONS FOR SUBSIDIARIES
In 2002, the compositions for WIA Corporation and WISCO were terminated by approval of the managerial committee of
the court and the favourable decision of creditors’ conferences. In relation to the termination, WIA made an early
redemption of composition obligation amounting to 287,596 million ($239,583 thousand) and recorded gain on
redemption of 44,027 million ($36,677 thousand) and loss on redemption of 630 million ($525 thousand).
28. THE STOCK RETIREMENT OF KIA
Korean won
(in millions)
Domestic
48,656,587
(10,367,452)
38,289,135
2,789,221
46,663,159
26. DISPOSAL OF RECEIVABLES IN FINANCIAL SUBSIDIARIES
Consolidated
amounts
39,851,575
39,851,575
3,118,115
39,872,296
During the shareholders’ meeting on November 4, 2000, the shareholders of Kia approved the retirement by December 31,
2002 of 80 million shares, or 17.8 percent of total common stock issued as of December 31, 2001 in accordance with the
provisions of the Korean Commercial Code and the stock retirement of 80 million shares was executed by the consensus
in 2001. This stock retirement resulted in the increase of the Company’s and its subsidiaries’ ownership. Due to this
increase of ownership in 2001, the Company and its subsidiaries’ additional share to Kia amounting to 68,732 million
($57,258 thousand) is accounted for as capital surplus.
29. SIGNIFICANT EVENT AFTER BALANCE SHEET DATE
(1) The Company is scheduled to split its Commercial Vehicle division by May 2003 and establish a joint venture for
commercial vehicle business in accordance with the agreement with Daimler Chrysler Aktiengesellschaft. The
procedures to split the division are in progress at the date of independent public accountants’ report.
(2) Hyundai Capital Service Inc. is scheduled to dispose their financial receivables amounting to 578,854 million
($482,218 thousand) to special purpose companies in 2003. On January 3, 2003, Hyundai Capital Service Inc. acquired
additional shares (17 percent) of First CRV at the cost of 64,424 million ($53,669 thousand).
(3) During the shareholders’ meeting on March 15, 2003, the shareholders of Hyundai HYSCO approved the purchase of
treasury stock of 22,228 million ($18,517 thousand) for the purpose of stock retirement.
25. MERGER AND SALES OF BUSINESS DIVISION BETWEEN SUBSIDIARIES
(1) As of December 1, 2002, Hyundai Dymos (formerly Korea Drive Train System) merged Korea Precision Co., Ltd. with
assets 91,844 million ($76,511 thousand) and liabilities of 82,063 million ($68,363 thousand) by issuing new
common stock.
(2) Effective January 1, 2002, ROTEM acquired Heavy Equipment and Plant division with assets and liabilities of
million ($245,317 thousand) and 187,138 million ($155,896 thousand), respectively, from Hyundai MOBIS.
This acquisition resulted in negative goodwill of 5,000 million ($4,165 thousand).
88
294,478
89
Domestic Facilities
Head Office
231,Yangjae-dong, Seocho-gu,
Seoul, Korea
Tel: 82-2-3464-1114
Ulsan Plant
700 Yangjong-dong, Buk-gu,
Ulsan, Korea
Tel: 82-52-280-2114
Ulsan Plant Data
A total plant site of 6,017,220m2,
building site of 2,310,000m2
No.1 Plant : Verna(Accent),
Click(Getz)
No.2 Plant : Equus(Centennial),
Dynasty, Santa Fe, Atos
No.3 Plant : Avante XD(Elantra),
Tuscani(Coupe), Lavita(Matrix)
No.4 Plant : Trajet XG(Trajet),
Starex(H-1), Libero(H-1 Truck),
Porter(H-100 Truck)
No.5 Plant : Terracan, Galloper,
Lavita(Matrix), Sonata(for Taxi)
Cheonju Plant
800 Yongam-ri, Bongdong-eup,
Wanju-gun, Junrabuk-do, Korea
Tel: 82-63-260-5114
Cheonju Plant Data
A total plant site of 990,000m2,
building site of 323,400m2
Medium and large size buses,
medium and large size trucks,
special duty cars
Asan Plant
123 Kumsong-ri, inju-myun, Asan-si,
Chungchungnam-do, Korea
Tel: 82-41-530-5114
Asan Plant Data
A total plant site of 1,815,000m2,
building site of 429,000m2
New EF sonata(Sonata),
New Grandeur XG(XG)
Namyang R&D Center
772-1, Changduk-dong, Hwasung-si,
Kyunggi-do, Korea
Tel: 82-31-369-5114
Registered Capital
1.4765 trillion(Korean Won)
Number of Employees
50,000 Persons
Overseas Facilities
Hyundai Motor America
10550 Talbert Avenue Fountain
Valley, CA 92728-0850 USA
T.1-714-965-3000
F.1-714-965-3001
Hyundai Auto Canada Inc.
75 Frontenac Drive, Markham,
Ontario, L3R 6H2, Canada
T.1-905-948-6707
F.1-905-477-5268
Hyundai Motor Europe GmbH
(Head Office)
Haupt Strasse 185, #65760
Eschborn, Germany
T.49-221-500-8810
F.49-221-500-8820
Hyundai Motor Poland GmbH
Natpoll Buldg A #30 4 Migdalowa
Street 02-796 Warsaw Poland
T.48-22-645-1700
F.48-22-645-1552
Hyundai Motor Japan
18F Shin-Kasumigaseki BLD. 3-3-2
Kasumigaseki Chiyoda-ku Tokyo,
Japan
T.81-3-3504-8961
F.81-3-3504-8839
Hyundai Assan Otomotiv Sanari
Ve Ticaret AS
E-5 Karayolu 32KM 81700 Tuzla
Istanbul, Turkey
T.90-216-581-0000
F.90-216-581-0099
Hyundai Motor India Ltd.
Irrungattukittai NH-4, Sriperumbudur
Taluk Kancheepuram Dist. TamilNadu 602105 India
T.91-4111-56111
F.91-4111-56290
Beijing Hyundai Motor Co.
Wulicang Shunyi District Beijing
BHMC
T.86-10-8949-8113
F.86-10-8949-8152
Africa & Middle East HQ.
Office #402 API WORLD TOWER
PO Box 34406 Sheikh Zayed RD.
Dubai, UAE
T.971-7-332-6667
F.971-7-332-6566
Latin America & Caribbean HQ.
7950 North West 53rd ST. #203
Miami Florida 33166, U.S.A.
T.1-305-477-8985
F.1-305-470-9778
Asia & Pacific HQ.
Level 5 Wisma Hone Leong 18,
Jalan Perak 5040 Kualar Lumpur,
MALAYSIA
T.60-3-2713-8383
F.60-3-2713-1818
HMC Representative Office
in Poland
NATPOLL BLD. A#304 Migdalowa
ST. 02-796 Warsaw, POLAND
T.48-22-645-1622
F.48-22-645-1553
Hyundai Motor Company Beijing
Office
Room 701 MILLENNIUM TOWER
NO.38 Xiaoyun RD. Chaoyang
District Beijing, China
T.86-10-6590-0384
F.86-10-6590-0039
Hyundai Motor Company
Shanghai Office
Far East International Plaza NO.319
Xianxia RD. Shanghai, China
T.86-21-6235-0033
F.86-21-6235-0055
Hyundai America Technical
Center Inc.
5075 Venture Drive, Ann Arbor,
MI 48108 USA
T.1-734-747-6600
F.1-734-747-6699
Hyundai Kia Motor Europe
Engineering Center
Hauptstrasse 185, D-65760
Eschborn, Germany
T.49-6196-5092-101
F.49-6196-5092-100
Hyundai Motor Japan R&D
Center
3-2-2 Nishinohara, Inzai City,
Chiba, Japan # 270-1334
T.81-476-47-4411
F.81-476-47-6340
Printed by: Sewha Printing Co. Seoul, Korea Written by: Steven Kim Created by: Mecayours


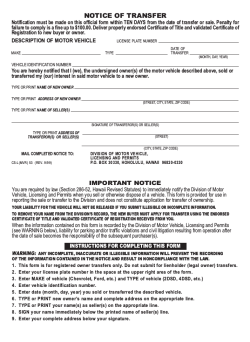


© Copyright 2026