
Same-Sex Couple Households American Community Survey Briefs INTRODUCTION
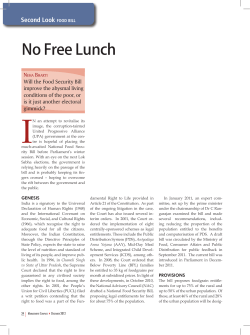
Same-Sex Couple Households
Issued September 2011
American Community Survey Briefs
ACSBR/10-03
INTRODUCTION
Living arrangements are rapidly changing
in America, especially when it comes to
both same-sex couple households and
the recognition of same-sex marriages
by individual states. A description of
these households is not complete without
identifying the presence of children in
these households by their relation to the
householder—whether they are biological children, stepchildren, or adopted
children. This report addresses these
topics by presenting data from the 2010
American Community Survey (ACS) on
same-sex couple households at national
and state levels. The data in this report
are for households, not individuals.
This report is one of a series produced
to highlight results from the 2010 ACS.
The ACS provides detailed estimates
of demographic, social, economic, and
housing characteristics for congressional districts, counties, places, and other
localities every year. A description of the
ACS is provided in the text box “What
Is the American Community Survey?”
SAME-SEX COUPLE HOUSEHOLDS
BY STATE
Approximately 594,000 same-sex couple
households lived in the United States
in 2010, not statistically different from
the 581,000 households reported in the
2009 ACS.1 Nationally, about 1 percent
of all couple households were same-sex
1
The 2009 ACS number of same-sex couples can
be found at <www.census.gov/population/www
/socdemo/files/ssex-tables-2009.xls>.
Same-sex couple households:
These households are identified using both the relationship
to householder and sex items.
Total couple households: The
total of those households where
the householder reports having a spouse or unmarried partner in the household. Includes
opposite-sex and same-sex married and unmarried couples.
Unmarried partner: A person
reported as an “unmarried partner” of the householder and who
shares a close personal relationship with the reference person.
Reported as spouse: Those
in same-sex couple households
who were originally reported as a
spouse of the householder. Samesex spouses were edited during
processing to “unmarried partner.”
Own child: A never married
child under 18 years old who is a
son or daughter by birth, marriage (stepchild), or adoption.
couples. The percentage of same-sex
couple households for the 50 states and
the District of Columbia ranged from
0.29 percent for Wyoming and 4.01
percent for the District of Columbia
(see map). Seventeen states and
the District of Columbia had higher
U.S. Department of Commerce
Economics and Statistics Administration
U.S. CENSUS BUREAU
By
Daphne Lofquist
Same-Sex Couple Households as a Percent
of Total Couple Households by State: 2010
AK
WA
MT
VT
ND
NH
ME
MN
OR
ID
MI
NV
IL
WV
KS
AZ
MO
OK
NM
TX
VA
KY
DC
TN
SC
AL
DE
MD
NC
AR
MS
RI
NJ
OH
IN
CO
CA
CT
PA
IA
NE
UT
MA
NY
WI
SD
WY
GA
Percent of Same-Sex
Couple Households
1.76–4.01
0.96–1.75
LA
0.67–0.95
FL
0.29–0.66
United States = 0.95 percent
HI
Source: U.S. Census Bureau, 2010 American Community Survey.
percentages of same-sex couple
households than the nation.
The legal recognition of same-sex
couple households vary by state.
In 2010, 42,000 of these households were in states that performed
same-sex marriages, while 169,000
were in states that had either
registered domestic partnerships
or civil unions (Table 1). Over half
(90,000) of same-sex couple households either registered domestic partnerships or civil unions
resided in the state of California.
Overall, 25.7 percent of all samesex couple households in 2010
reported that they were spouses
(152,000). Administrative records
indicate less than 50,000 same-sex
marriages were performed in the
United States between 2004 (when
U.S. Census Bureau
same-sex marriages were first
legalized in Massachusetts) and
2010.2 In states where samesex marriages were performed,
42.4 percent of same-sex couple
households were reported as
spouses compared with 28.2
percent for states with domestic
partnerships or civil unions and
22.7 percent for all other states.
SAME-SEX COUPLE
HOUSEHOLDS WITH
CHILDREN
Out of the 594,000 same-sex couple households, 115,000 reported
having children. Eighty-four percent
2
Renna, Cathy., “The Williams Institute
Experts Comment on Department of Justice
DOMA Decision,” February 24, 2011, press
release prepared by the Williams Institute,
UCLA School of Law.
of these households contained own
children of the householder (Table
2). In comparison, 94 percent of
opposite-sex married couple households with children reported living
with their own children. Samesex couple households may have
reported higher proportions of nonrelated children because they may
have been children of the partner
of the householder. This is clearly
seen in Table 2 where same-sex
couples are shown by whether they
reported as spouse or unmarried
partner. While 94 percent of married opposite-sex couples were living with own children in 2010, 89
percent of same-sex spousal households with children reported having
own children of the householder
present. In comparison, 81 percent
of same-sex unmarried partner
2
Table 1.
Distribution of Same-Sex Couple Households by States Grouped by Legal Recognition of
Same-Sex Couple Marriages and Unions: 2010
(In percent. For information on confidentiality protection, sampling error, nonsampling error, and definitions, see
www.census.gov/acs/www)
Total
Legal recognition
Reported as spouse
Estimate
Margin of
error (±)1
593,324
42,195
169,205
90,023
381,924
11,395
3,055
6,133
4,569
8,804
Total same-sex couple households . . .
States performing same-sex marriages2 . . . . . . . .
Domestic partnership/Civil unions3 . . . . . . . . . . . .
California3A . . . . . . . . . . . . . . . . . . . . . . . . . . . . .
All other states . . . . . . . . . . . . . . . . . . . . . . . . . . . .
Unmarried partner
Percent
Margin of
error (±)1
Percent
Margin of
error (±)1
25 .7
42 .4
28 .2
32 .1
22 .7
0 .8
3 .7
1 .4
2 .4
0 .9
74 .3
57 .6
71 .8
67 .9
77 .3
0 .8
3 .7
1 .4
2 .4
0 .9
1
Data are based on a sample and are subject to sampling variability . A margin of error is a measure of an estimate’s variability . The larger the margin of error
in relation to the size of the estimate, the less reliable the estimate . When added to and subtracted from the estimate, the margin of error forms the 90 percent
confidence interval .
2
This includes Connecticut, Iowa, Massachusetts, New Hampshire, Vermont, and the District of Columbia .
3
This includes California, Colorado, Delaware, Hawaii, Maine, Nevada, New Jersey, Oregon, Washington, and Wisconsin .
3A
California performed same-sex marriages from June to November 2008 .
Source: U .S . Census Bureau, 2010 American Community Survey .
household with children contained
children of the householder.
The second panel of Table 2
shows more detailed categories of
own children living in a household—whether they are biological,
adopted, or stepchildren. In 2010,
about 9 out of 10 married oppositesex couple households with own
children contained only the biological children of the householder. Of
all same-sex couple households
with own children present, 73
percent had only biological children, while 21 percent had either
stepchildren only or adopted only.
In same-sex unmarried partner
households with own children,
only 67 percent had only biological
children compared with 80 percent
Table 2.
Couple Households With Children: 2010
(In percent. For information on confidentiality protection, sampling error, nonsampling error, and definitions, see
www.census.gov/acs/www)
Characteristic
Married
opposite-sex
couples
Margin
of
Percent error (±)1
Unmarried
opposite-sex
couples
Margin
of
Percent error (±)1
Total
same-sex
couples
Same-sex couples by reporting status
Same-sex
spouse
Same-sex
unmarried partner
Margin
Margin
Margin
of
of
of
Percent error (±)1 Percent error (±)1 Percent error (±)1
Households with children
(number) . . . . . . . . . . . . . . 24,443,599
Own children present2 . . . . . . . . . . . . .
93 .8
No own children present3 . . . . . . . . . . .
6 .2
83,848 2,684,978
0 .05
88 .5
0 .05
11 .5
23,359 115,064
0 .20
84 .1
0 .20
15 .9
5,516
0 .93
0 .93
43,933
89 .0
11 .0
2,901
1 .43
1 .43
71,131
81 .1
18 .9
4,381
1 .48
1 .48
Households with own
children only . . . . . . . . . . . 22,872,151
Biological only4 . . . . . . . . . . . . . . . . . .
90 .8
Step only or adopted only5 . . . . . . . . . .
4 .4
Combination of own children only6 . . .
4 .8
86,426 2,267,016
0 .10
88 .0
0 .07
5 .2
0 .07
6 .8
20,771
0 .41
0 .30
0 .30
5,026
2 .71
2 .26
1 .51
38,778
80 .4
13 .1
6 .4
2,738
3 .11
2 .83
1 .84
55,849
67 .4
26 .8
5 .7
4,077
3 .81
3 .36
1 .81
94,627
72 .8
21 .2
6 .0
1
Data are based on a sample and are subject to sampling variability . A margin of error is a measure of an estimate’s variability . The larger the margin of error
in relation to the size of the estimate, the less reliable the estimate . When added to and subtracted from the estimate, the margin of error forms the 90 percent
confidence interval .
2
Households with at least one own child present under the age of 18 years . Can contain not own children as well .
3
Households that contain grandchildren, other relatives, or other nonrelatives under the age of 18 years .
4
Households with biological children only .
5
Households with either stepchild only or adopted child only .
6
Combination of two or more of the three own children types .
Source: U .S . Census Bureau, 2010 American Community Survey .
U.S. Census Bureau
3
in spouse households. Among both
same-sex spousal and unmarried
partner households, family units
consisting of children of the partner
or through adoption are common.
Statistics on same-sex couples from
the 2010 Census are also available
for comparison purposes with the
2010 ACS. Detailed tables on the
estimates of same-sex couples living with children for the nation and
individual states and a technical
evaluation of these estimates from
both data sources can be found by
accessing the Web page “American
Community Survey Data on Same
Sex Couples” <www.census.gov
/hhes/samesex/data/acs.html>.
What Is the American Community Survey?
The American Community Survey (ACS) is a nationwide survey designed to provide communities with reliable and timely
demographic, social, economic, and housing data for the nation,
states, congressional districts, counties, places, and other localities every year. It has an annual sample size of about 3 million
addresses across the United States and Puerto Rico and includes
both housing units and group quarters (e.g., nursing facilities
and prisons). The ACS is conducted in every county throughout
the nation and every municipio in Puerto Rico, where it is called
the Puerto Rico Community Survey. Beginning in 2006, ACS data
for 2005 were released for geographic areas with populations
of 65,000 and greater. For more information on the ACS sample
design and other topics, visit <www.census.gov/acs/www>.
SOURCE AND ACCURACY
Data presented in this report are
based on people and households
that responded to the ACS in 2010.
The resulting estimates are representative of the entire population.
All comparisons presented in this
report have taken sampling error
into account and are significant
at the 90 percent confidence level
unless otherwise noted. Due to
rounding, some details may not
sum to totals. For information on
sampling and estimation methods,
confidentiality protection, and
sampling and nonsampling errors,
please see the “2010 ACS Accuracy
of the Data” document located at
<www.census.gov/acs/www
/Downloads/data_documentation
/Accuracy/ACS_Accuracy_of
_Data_2010.pdf>.
U.S. Census Bureau
4


© Copyright 2026