
EUROPEAN UNION STRUCTURAL FUNDS 2000 – 2006
EUROPEAN UNION STRUCTURAL FUNDS 2000 – 2006 ERDF FINAL REPORT ON IMPLEMENTATION VERSION 3 THE NORTHERN IRELAND PROGRAMME FOR BUILDING SUSTAINABLE PROSPERITY (BSP - ERDF) A TRANSITIONAL OBJECTIVE 1 PROGRAMME CCI NO 1999 GB 161 PO 007 1 BUILDING SUSTAINABLE PROSPERITY PROGRAMME VERSION 3 INDEX OF ABBREVIATIONS USED IN THE REPORT Government Departments DARD Department of Agriculture and Rural Development DCAL Department for Culture, Arts and Leisure DE Department of Education DEL Department for Employment and Learning DETI Department of Enterprise Trade and Investment DFP Department of Finance and Personnel DHSSPS Department of Health and Social Services and Public Safety DoE Department of the Environment DRD Department for Regional Development DSD Department for Social Development DTI Department of Trade and Industry OFMDFM Office of the First Minister and deputy First Minister Others IDB Industrial Development Board (now part of Invest NI) IRTU Industrial Research and Technology Unit (now part of Invest NI) NITB Northern Ireland Tourist Board LEDU Local Economic Development Unit (now part of Invest NI) NILGA Northern Ireland Local Government Association NISRA Northern Ireland Statistics and Research Agency PPP Public / Private Partnership 2 BUILDING SUSTAINABLE PROSPERITY PROGRAMME VERSION 3 INDEX Chapter Page LEGISLATIVE FRAMEWORK ………………………………………….. Commission Decisions …………………………………………………… Council and Commission Regulations ………………………………...... [7] FOREWARD – REPORT OUTLINE …………………………………….. [8] 1. 1.1 1.2 1.3 1.4 1.5 1.6 1.7 1.8 1.9 1.10 1.11 NORTHERN IRELAND CONTEXT ……………………………………… Northern Ireland as a Region …………………………………………….. New Institutional Arrangements ………………………………………….. Devolving Power …………………………………………………………… Northern Ireland Assembly ……………………………………………….. Executive Committee ……………………………………………………… The Civic Forum …………………………………………………...………. Local Government in Northern Ireland ………………………………...... Berlin Council Outcome – A Region in Transition ……………………… Programme for Government .……………………………….…………….. Lisbon Strategy …………………………………………………………….. Economic Growth and Competitiveness Programming ………………… 2. 2.1 2.2 2.3 2.4 2.5 2.7 2.8 2.9 2.10 2.11 2.12 2.13 2.14 2.15 2.16 PROGRAMME RATIONALE …………………………………………….. [43-51] Background …………………………………………………………………. Ex-ante evaluation …………………………………………………………. Consultation on the Draft Plan (Jan 1999-Nov 1999) ………………….. Link with Northern Ireland CSF Priorities ……………………………….. Structure of the Northern Ireland Programme for Building …………….. Sustainable Prosperity 2000-2006 ……………………………………….. Overall Aim of the Northern Ireland Programme for Building …………. Sustainable Prosperity …………………………………………………….. Accountability ………………………………………………………………. Balanced Intervention/Equal Opportunities ……………………………… New Targeting Social Need ……………………………………………….. Economic and Social Sustainability ………………………………………. Operationalisation ………………………………………………………….. Partnership ………………………………………………………………….. Locally Based Decision Making Delivery Mechanisms ……………….. Publicity/Transparency ……………………………………………………. Co-ordination ……………………………………………………………….. Environmental Sustainability ………………………………………..……. 3. OPERATIONAL FRAMEWORK …………………………………………. 3.1 3.2 3.3 3.4 Background ………………………………………………………………… The Programme Monitoring Committee ………………………………… Managing Authority ……………………………………………………….. Paying Authority …………………………………………………………… 2.6 3 [9-42] [52-71] BUILDING SUSTAINABLE PROSPERITY PROGRAMME VERSION 3 Chapter 3.5 3.6 3.7 3.8 3.9 Page 3.10 3.11 3.12 3.13 3.14 3.15 Information and Publicity………………………………………..……… Working Groups …………………. …………………………..………... Monitoring of Environmental Sustainability ………………………….. Annual Implementation Reporting and Annual Review Meeting ….. Summary of significant difficulties in Implementation of the Programme …………………………………………………………… Monitoring Indicators …………………………………………………... Mid-term Evaluation ……………………………………………………. The Performance Reserve ……………………………………………. Electronic Data Exchange …………………………………….………. Ex-post Evaluation …………………………………………………….. Major Projects and Global Grants …………………………………… 4. FINANCIAL IMPLEMENTATION AND CONTROL …………….… 5. OVERVIEW OF PRIORITIES ………………………………..……….. 6. 6.1 6.2 6.3 6.4 6.5 PRIORITY 1 ……………………………………………………………. [104-204] Introduction ………………………………………………..……………. Implementation ……………………………………….…..…………….. State Aid Schemes ………………………………………..…………… Measure details for Measure 1.1 – Business Support………….….. Measure details for Measure 1.2 – Research & Technology Development & Technology Transfer.…………………………..….. Measure details for Measure 1.3 – Tourism..………………………... Measure details for Measure 1.4 – Local Economic Development .. Measure details for Measure 1.5 – Information Society..…………… Measure details for Measure 1.6 – Roads & Transport..…………… Measure details for Measure 1.7 - Telecommunications…………… Measure details for Measure 1.8 – Energy…………………………… 6.6 6.7 6.8 6.9 6.10 6.11 [72-90] [91-103] 7. 7.1 7.2 PRIORITY 2 ……………………………………………………………… [205-217] Introduction ……………………………………………………………… Measure details for Measure 2.5 – Energy & Training ICT & Information Support. …………………………………………………. 8. 8.1 8.2 8.3 8.4 8.5 8.6 PRIORITY 3 …………………………………………………………….. [218-252] Introduction ……………………………………………………………… Implementation …………………………………………………………. Measure details for Measure 3.1 – Urban Revitalisation ….……….. Measure details for Measure 3.2 – Advice & Information Services .. Measure details for Measure 3.3 – Community Sustainability .…….. Measure details for Measure 3.4 – Investing in Early Learning ……. 9. 9.1 9.2 PRIORITY 5 ……………………………………………………………… [253-268] Introduction ………………………………………………………………. Measure Details for Measure 5.1 – Sustainability Management of the Environment and Promotion of the Natural and Built Heritage 4 BUILDING SUSTAINABLE PROSPERITY PROGRAMME VERSION 3 Chapter 10. 10.1 10.2 Page PRIORITY 6 …………………………………………………………….. [269-283] Introduction ………………………………………………………………. Measure Details for Measure 6.1 – Technical Assistance ………….. 5 BUILDING SUSTAINABLE PROSPERITY PROGRAMME VERSION 3 ANNEXES Annex 1 Programme Financial Tables (Original and Final) Annex 2 Programme Complement Financial Table changes Annex 3 Detail of expenditure declared by year and by Measure Annex 4 Indicator Tables - Achievements V Targets Annex 5 List of project applications by Measure Annex 6 Major Projects Annex 7 Monitoring Committee Meeting minutes Annex 8 BSP Annual Implementation Reports Annex 9 Article 4 Guidance and checklist (original and updated) Annex 10 Article 10 Guidance and checklist Annex 11 Paying Authority Record of on-the-spot check Annex 12 Internal Audit Annex 13 Commission Audit findings Systems Audit 24 -28 September 2001 Systems Audit 20 -24 June 2005 Project Audit 3 -7 April 2006 Project Audit 17-21 September 2007 (follow up) Annex 14 Irregularities Guidance Note Annex 15 Reported Irregularities – details as reported to UK authorities Annex 16 Recorded Irregularities Annex 17 Equality Guide Annex 18 General Publicity/Newsletters 6 BUILDING SUSTAINABLE PROSPERITY PROGRAMME VERSION 3 LEGISLATIVE FRAMEWORK CCI No 1999GB161PO007 Transitional Objective 1 Programme for Building Sustainable Prosperity Northern Ireland UK Member State Programming Years 2000 – 2006 Multi Fund (ERDF 2000 – 2005) Managing Authority: Department of Finance and Personnel (DFP) Paying Authority: ERDF - Department of Finance and Personnel (DFP) COMMISSION DECISIONS IN RESPECT OF 1999GB161 PO 007 ORIGINAL COMMISSION DECISION No C (2001) 637 22.03.2001 Revised Commission Decision C (2004) 5871 issued 30.12.2004 Revised Commission Decision C (2005) 2700 issued 07.07.2005 Revised Commission Decision C (2006) 7159 issued 21.12.2006 Revised Commission Decision C (2006) 3424 issued 01.08.2006 Applicable Regulations: Council Regulation (EC) No 1260/1999 – General Regulation Council Regulation (EC) No 1783/1999 – ERDF Regulation Commission Regulation (EC) No 643/2000 – Use of the Euro Commission Regulation (EC) No 1159/2000 – Information and Publicity Commission Regulation (EC) No 1685/2000 – Eligibility (as amended by Commission Regulation (EC) No 448/2004) Commission Regulation (EC) No 438/2001 – Management and Control Systems (as amended by Commission regulation (EC) No 2355/2002) Commission Regulation (EC) No 448/2001 – Financial Corrections Commission Regulation (EC) No 1681/1994 – Irregularities and Recoveries (as amended by Commission Regulation (EC) No 2035/2005) Applicable State Aid Schemes are detailed in the Priority 1 summary. 7 BUILDING SUSTAINABLE PROSPERITY PROGRAMME VERSION 3 REPORT OUTLINE This is the closure report on ERDF activities that took place within the 2000-06 NI Building Sustainable Prosperity (BSP) Programme. This report has been produced by the European Division of the Department of Finance and Personnel acting as Managing Authority for the Programme. This ERDF closure report on implementation is one of three documents required by the Commission to formally close the ERDF element of the programme. The other two documents are the certified statement of final expenditure, including a final payment application and a declaration on the winding-up of the assistance by the audit bodies for the programme. The Programme for Building Sustainability Prosperity (BSP) is a multi-funded operational programme with contributions from the European Regional Development Fund (ERDF), the European Social Fund (ESF), the European Agricultural Guidance and Guarantee Fund (EAGGF)and the Financial Instrument for Fisheries Guidance (FIFG and is structured in such a way that the final eligibility date for the ERDF element was 31 December 2007 with the exception of Measures with notified State Aids Schemes – these had a final eligibility date of 30 April 2008. The remaining Funds closed on 31 December 2008. This report addresses only the ERDF assistance delivered under the BSP Programme and has been structured to read as a stand alone report particularly with regard to Priority and Measure progress but has in parts covered general updates in relation to social economic review of the NI Economy which will form part of the overall final report. This report was approved by the permanent members of the BSP Monitoring Committee through written procedure on 15 July 2009. 8 BUILDING SUSTAINABLE PROSPERITY PROGRAMME VERSION 3 CHAPTER 1: NORTHERN IRELAND CONTEXT 1.1 Northern Ireland as a Region Northern Ireland is one of four territories of the United Kingdom. It is bounded by the Atlantic Ocean on the North, the Irish Sea on the East and sharing a land border with Ireland to West and South. It has a population of some 1.7 million (approximately 2½% of the UK total) living in an area of 13576km2. Approximately half of the total population is situated on the eastern seaboard with two thirds living within a 50km radius of the capital, Belfast. 1.2 New Institutional Arrangements Northern Ireland had its own Parliament from 1921 to 1973. The Unionists – mainly representing the majority community – held a permanent majority and formed the regional government. Consequently, Nationalists – representing the minority community – did not play a significant role in the Government and public life during this period. The Government had full responsibility for local affairs, with the exception of defence, foreign and trade policies, taxation and customs. A civil rights movement came to the fore in the late sixties seeking social and economic reforms. Major rallies were opposed by many Unionists and civil unrest and street violence ensued. The deteriorating situation caused the British Government to assume direct responsibility for Northern Ireland affairs and security in 1972. Since then, successive British Governments have tried to establish, through negotiations with the Northern Ireland political parties, a locally accountable Northern Ireland administration commanding widespread support from the Unionist and Nationalist communities. Despite many political initiatives, it was not until the Belfast Agreement was concluded in April 1998 that arrangements for devolved administration in 9 BUILDING SUSTAINABLE PROSPERITY PROGRAMME VERSION 3 Northern Ireland were agreed. The elements of the Agreement reflected the three strands of relationship identified in previous negotiations in 1990/91. Namely the relationship between the communities in Northern Ireland, the relationship between the North of Ireland and the remainder of Ireland and between the London and Dublin governments. Following the Agreement and its overwhelming endorsement by the people of Northern Ireland and Ireland, elections to a shadow Assembly took place in June 1998. Under the Westminster legislation which underpinned the Belfast Agreement, it was the responsibility of the Secretary of State to lay a devolution order to enable powers to be transferred to the new Assembly. On the provision that the Secretary of State was satisfied that sufficient progress had been made and in December 1999 the Devolution Order was signed. 1.3 Devolving Power to the People of Northern Ireland On the same date, power was devolved to the Northern Ireland Assembly, its Executive Committee of Ministers, the North/South Ministerial Council, North/South Implementation Bodies, British-Irish Council and British-Irish Intergovernmental Conference became fully functioning institutions. A Civic Forum was also established to advise on social, economic and cultural issues. In June 1998, 108 Members were elected to the New Northern Ireland Assembly, with the functions of the 11 Departments agreed by the Assembly in February 1999. 1.4 Northern Ireland Assembly The Assembly is the prime source of authority for all devolved responsibilities. It has full legislative and executive authority - the power to make laws and take decisions on all the functions of the Northern Ireland Departments. 10 BUILDING SUSTAINABLE PROSPERITY PROGRAMME VERSION 3 1.5 Executive Committee The Assembly elected, on a cross-community basis, a First Minister, a Deputy First Minister and ten Ministers with responsibility for the Northern Ireland Departments. Its purpose is to discuss and agree on issues which cut across the responsibilities of two or more Ministers, prioritising executive business and recommending a common position as necessary. The Executive seeks to agree each year and review as necessary, a programme of government with an agreed budget. This is subject to approval by the Assembly after scrutiny in Assembly Committees on a cross-community basis. 1.6 The Civic Forum The Civic Forum consists of 60 members made up of representatives from business, trade union, voluntary and other sectors of the Northern Ireland community. The Chairperson is appointed by the First Minister and Deputy First Minister. The Civic Forum acts as a consultative mechanism on social, economic and cultural matters. More detailed information on the Civil Forum is available on www.ofmdfmni.gov.uk/civic_forum. 1.7 Local Government in Northern Ireland The system of local government has been in operation in its current form since 1973 consisting of a single tier of 26 District Councils based on the main population centres. The Districts vary considerably in area and resources with populations ranging from 15,400 to 283,600 persons. There are 582 councillors in the 26 Districts and Councillors are elected for a 4year term of office under proportional representation, using the single transferable vote system. 11 BUILDING SUSTAINABLE PROSPERITY PROGRAMME VERSION 3 All District Councils have the same range of functions though a different emphasis may be placed on them in some areas (e.g. tourist functions in the coastal areas). Their functions can be divided into 3 groups – direct; representative; and consultative. Direct functions give Councils the responsibility for a wide range of local services. These include the provision and management of recreational, social, community and cultural facilities; environmental health; refuse collection and disposal; street cleansing; the provision and management of tourist development facilities; promotion of economic development; consumer protection; the enforcement of building regulations; litter prevention; management of cemeteries and crematoria; miscellaneous licensing registration provisions and dog control. Representative functions permit councils to nominate representatives to sit as members of various statutory bodies established to administer regional services such as education and library services, health and social services, drainage services and fire protection. Consultative functions allow councils to represent the views of their population on the way in which regional services are operated throughout each District. This consultative role covers functions such as planning, roads, water and conservation, which are centrally administered and where there is an obligation, either by statute or by voluntary agreement to consult District Councils about proposals affecting their district area. Councils employ some 8,500 people and are responsible for substantial public funds – in 1998/99 £406m. 12 BUILDING SUSTAINABLE PROSPERITY PROGRAMME VERSION 3 1.8 Berlin Council Outcome – A Region in Transition At the Berlin Council in March 1999 the Heads of State and Government decided to allocate 260 billion Euros1 to structural measures in the European Union for the period 2000-2006. The Northern Ireland Programme for Building Sustainable Prosperity was a Transitional Objective 1 Operational programme and was part of the practical procedure to direct the spend of EU Structural Funds. It follows on from the strategic aims and objectives of the Northern Ireland Region agreed between the Northern Ireland Authorities and the European Commission as set out in the Community Support Framework (CSF) for Northern Ireland. The CSF was formally adopted by the Commission in December 2000 and represented the convergence of the Regional strategic aims and spending priority embodies in the draft Programme for Government and the socio-economic priorities of the European Union. 1.9 Programme for Government In early 2001, the First and Deputy First Ministers issued on behalf of the Executive Committee the draft Programme for Government. This set out their vision, as recorded in the Belfast Agreement, of a “peaceful, inclusive, prosperous, stable and fair society” together with their proposed strategic aims and priorities to be pursued, working with and for all the people of Northern Ireland. The Northern Ireland Programme for Building Sustainable Prosperity represents the convergence of the Executive Committee’s strategic objectives and those of the European Union supported by Structural Funds. The Executive Committee of the Assembly retains a close interest in the allocation and management of the Structural Funds in Northern Ireland. The Minister of Finance and Personnel chairs the Community Support Framework (CSF) Monitoring Committee, which is tasked with overseeing all of the Structural 1 The amount allocated at the Berlin Council has been indexed at a flat rate of 2% over the period. 13 BUILDING SUSTAINABLE PROSPERITY PROGRAMME VERSION 3 Funds including The Northern Ireland Programme for Building Sustainable Prosperity, PEACE II and the Community Initiatives. His deputies are the two Junior Ministers representing the office of the First and Deputy First Ministers. (The following sections 1.10 and 1.11 relate to the overall BSP Programme) 1.10 Lisbon Strategy In March 2000, at the Lisbon European Council, the leaders of Europe committed themselves to a ten-year programme of economic reform designed to advance a new strategic goal for the European Union. This would enable the EU to become “the most competitive and dynamic knowledge-based economy in the world, capable of sustainable economic growth with more and better jobs and greater social cohesion”. The Lisbon Strategy is underpinned by a series of targets, agreed at the Lisbon European Council and in Stockholm, Gothenburg and Barcelona. The Lisbon Strategy involves a number of targets under a range of key themes. Examples of some of the areas that inform the key themes are as follows: • Employment – More and Better Jobs. • Innovation and Research. • Economic Reform. • Social Cohesion. • Sustainable Development. • Environment. A mid-term Review of the Lisbon Strategy was conducted in 2005 to assess the progress by Member States and the impact of the strategy. In February 2005 the European Commission presented a revised strategy for the EU to create more growth and jobs. New integrated Guidelines were endorsed by the European Council in June 2005. Detailed below are a number of indicators that assess 14 BUILDING SUSTAINABLE PROSPERITY PROGRAMME VERSION 3 Northern Ireland’s progress with regard to the Lisbon Strategy targets and within the context of the BSP Programme. The Lisbon Strategy places importance on sustainable economic growth and in general terms the economic outlook for Northern Ireland has been positive. For example, Northern Ireland Gross Value Added per head has shown a growth consistent with that of the UK over the period 1999 to 2007 64.0% in Northern Ireland and 61.4% across the UK. Total GVA for Northern Ireland increased by 72.7% in nominal terms over the period 1997 to 2007. In terms of productivity, NI’s GVA per hour worked is at 83.9% of the UK average for 2006. Manufacturing productivity has also made a recovery in recent years whilst tourism revenue has continued to grow since 2001. Employment levels experienced a period of growth between 1999 and 2006 recording an increase of 9.5% in the working age population in employment. The number of people registered as unemployed in Northern Ireland has dramatically decreased since the late 1990s. The unemployment rate has improved from 7.4% in 1999 to 4.5% in 2006. In Innovation and Research, Expenditure on R&D accounted for 0.62% of GVA for Northern Ireland in 2007. This compares to 1.29% for the UK as a whole. Northern Ireland businesses would have needed to invest some £190 million more in R&D in 2007 to reach the UK average. The target set by the Lisbon Strategy for expenditure on R&D is 3% of GVA by 2010. The BSP Programme has a target to support 286 R&D projects throughout Northern Ireland and support has already been given to 762 projects. This support will help Northern Ireland towards increasing its R&D expenditure. Regarding innovation activities, 11% of NI firms have co-operation arrangements on technological innovation activities with other enterprises or institutions compared with 8.2% across the UK as a whole. In addition, 3% of turnover amongst NI businesses is attributable to new or improved products compared to the UK average of 8.6%. In the three-year period 2002-2004, 57% of enterprises in Northern Ireland were innovative active, comparing to the equivalent UK figure of 63.6%. The proportion of firms in Northern Ireland engaging in innovation activity has increased from 46% in 1998-2000 to 63% in 15 BUILDING SUSTAINABLE PROSPERITY PROGRAMME VERSION 3 2002-04. Under Priority 1 of the BSP Programme there are measures to support the development of Small, Medium Enterprises (SME) through innovating practices, improved products and enhanced ICT and competitiveness. In terms of entrepreneurial activity, the Global Enterprise Monitor UK Survey shows that in 2008, 4.8% of the adult population in Northern Ireland were involved in such activity compared with 5.8% for the UK. Northern Ireland has surpassed Wales and Scotland in terms of VAT registrations with 32 per 10,000 populations in 2007, although this is still considerably short of the UK average of 42. Exports were estimated to be worth £5.46 billion in 2008, which represents an increase of 8.6% over the year, and an increase of 56% over the nine year period 1999 to 2008. Under the employment theme, there are a number of measures under Priority 2 that aim to bring about high levels of employment and develop a skilled, adaptable and entrepreneurial workforce and also to promote access to the labour market for all and foster social inclusion. This is entirely consistent with the Lisbon Strategy. The latest progress under the ESF policy fields show that there have been around 190,000 annual participants of training funded by the BSP Programme. The employment rate in Northern Ireland stands at 68.8% (Oct-Dec 2008) of the working age population (ages 15 to 59/64). This is significantly below the UK rate of 74.1% and Northern Ireland is the lowest of the UK regions. Northern Ireland has an employment rate of 66.4% for people aged from 15 to 64. This is higher than the rate for the EU27, which currently stands at 65.9% but is currently below both the Lisbon target of 70% and just reaches the Stockholm intermediate target of 67%. The need for training measure in Northern Ireland is justified by the fact that only 83.2% of economically active adults in NI are qualified in NVQ level 1 or above. The UK figure is higher at 91.3%. At NVQ level 4 or above, the figures are 31.6% for Northern Ireland and 32.9% for the UK. For 16-19 year olds, 56.1% are qualified to NVQ level 2 or above in Northern Ireland compared to 63.6% in the UK as a whole, whereas for NVQ level 3 or above the figures are 21.4% for 16 BUILDING SUSTAINABLE PROSPERITY PROGRAMME VERSION 3 Northern Ireland and 23.9% for the UK. For those within employment, 9.1% of employees received job-related training within the last 4 weeks compared to 14.3% across the UK as a whole. This information demonstrates the positive role that the BSP Programme plays in helping to achieve a better skilled workforce and increase levels of employment and economic activity. The environment also plays a key role in the Lisbon Strategy. Within the BSP Programme, Measure 5.1 aims to understand and manage the growing pressures on the environment and also develop a proper awareness and understanding of the environment. The Measure itself has supported the completion of 4 water treatment plants and 2 sewage treatment plants. This helps Northern Ireland meet the EU Directives on the drinking water as well as sewage and purification. In addition to treatment plants, Measure 5.1 has supported a waste awareness campaign and an air quality project which will help towards complying with the Air Quality strategy. These activities are consistent with the aim of the Lisbon Strategy with regard to the environment. 1.11 Economic Growth and Competitiveness Programming Socio Economic Review Although the global economy has weakened considerably since mid-2008, the Northern Ireland economy at the macro level had improved over the 2000 -2006 period, boasting record high levels of employment and solid rates of economic growth. The UK’s strong macro economic fundamentals and strong growth in public expenditure have contributed towards Northern Ireland’s positive performance up to 2008. Improvement had been made across most industry sectors, particularly in the Service sector. However in Q4 2008, The UK’s economy entered official recession with two consecutive quarters of GDP contraction. This translates into a change in the socio-economic conditions with a decrease in employment, a rise in unemployment and contraction in the Construction and Services sectors. However, these changes happened after the ERDF element of the BSP Programme had been completed. Therefore, throughout the 2000-2006 period there were no changes to the socio-economic conditions that required a change to the ERDF strategy. 17 BUILDING SUSTAINABLE PROSPERITY PROGRAMME VERSION 3 During the life of the BSP Programme and until the change in Global economic conditions, Northern Ireland had experienced a sustained period of growth. In addition, the unemployment rate had moved from being the highest amongst UK regions to a much more favourable position below the UK average (joint second lowest). At the macro level the economy gives a generally positive impression however, a number of areas at the micro level still require further attention. In the labour market, economic activity rates have shown little sign of improvement from 2001 to 2008 and the inactivity rate remains the highest amongst the UK regions. The main contributor to the production industries, namely manufacturing, has experienced heavy job losses since 1999 even though output growth within the industry has been positive. Indeed, Gross Value Added (GVA) estimates released in December 2008 indicate that whilst there has been steady year-on-year growth for Northern Ireland, impact has been minimal in relation to the overall UK position post-1999. Whilst improving upon the UK average, by April 2008, median gross weekly earnings for full-time employees across the UK regions were reported lowest for workers in Northern Ireland. Main Changes since the Implementation of the Programme In 2007, elections led to a restoration of the Northern Ireland Assembly in May. This new found stability created a positive and optimistic environment to help enable Northern Ireland to move forward. The new Northern Ireland Executive’s aim is to ‘build a peaceful, fair and prosperous society in Northern Ireland, with respect for the rule of law and where everyone can enjoy a better quality of life now and in years to come’. This is to be achieved through the new Programme for Government. The key priorities for the Programme for Government are as follows: • Growing a dynamic, innovative economy; • Promote tolerance, inclusion and health and well-being; • Protect and enhance our environment and natural resources; • Invest to build our infrastructure; and 18 BUILDING SUSTAINABLE PROSPERITY PROGRAMME VERSION 3 • Deliver modern high quality and efficient public services; Although there have been changes in socio-economic conditions, most of these reflect ongoing trends that were evident at the outset of the Programme. However, it must be noted that while there are areas that have seen positive change since 1999, there are others that continue to be problematic. For example, the size and spending power of the public sector continues to largely influence economic growth irrespective of private sector achievement. Unemployment rates have continued to decline but longer-term unemployment is still a major problem, which is proving difficult to address. Nevertheless, employment in Northern Ireland remains at record high levels with total employee jobs totalling 717,070 as at September 2007 and this upward trend has been evident since 1993. The agricultural sector has continued to struggle and is expected to continue to face challenges following the most recent CAP reforms as well as the cost and practical problems involved in the delivery of a range of EU environmental directives. The recent downturn in the global economy occurred after the ERDF element of the BSP Programme had been completed. Relative impact of socio-economic developments The new Programme for Government continues to focus on infrastructure investment and on reform and modernisation of public services across its priorities. This focus has been further enhanced by the publication of an ‘Investment Strategy for Northern Ireland’ announced in March 2006 by the Strategic Investment Board. The Strategy contains blueprint for transforming Northern Ireland into a successful, competitive, regional economy with high quality public services. As noted by the Secretary of State, “we are clearly signalling Government’s strong commitment to taking forward major programmes of work including education, health and transport and, of course, those areas that fall within EU compliance”. 19 BUILDING SUSTAINABLE PROSPERITY PROGRAMME VERSION 3 The Northern Ireland Sustainable Development Strategy announced in May 2006 set out a commitment to build sustainable communities founded on economic growth and a high quality environment. It recognised that prosperity and sustainable development are inextricably linked and that the concept of sustainable development should underpin all aspects of policy-making and decisions. Furthermore the Review of Public Administration, announced in November 2005, detailed large-scale re-structuring of local government, health and education authorities. In addition, the ‘Economic Vision for Northern Ireland’ set out a strategic vision which ‘aims to ensure that Northern Ireland benefits from the Government’s long-term focus on faster economic growth and improving living standards across the United Kingdom’. This is further support for the former Executive’s key priorities and is in line with UK policy. There have been a number of positives regarding the economic conditions within Northern Ireland where growth in the economy has continued throughout 2008, although several challenges remain, particularly in the traditional and low value added sectors. In fact, the focus of the BSP Programme is entirely consistent with the government’s strategy on improving productivity, through innovation, entrepreneurship, skills and investment. One current challenge to continued growth in the economy is the increasingly global nature of the marketplace. As a small open economy Northern Ireland cannot insulate itself from global economic developments. Not only is Northern Ireland facing increased competition from new competitors such as China, India and the EU Accession countries, but also the business cost base is rising. However, globalization also presents a number of opportunities for firms to become more outward looking and to take advantage of new markets. This is the challenge facing businesses in not only Northern Ireland but across all EU regions over the next few years and the importance being placed on 20 BUILDING SUSTAINABLE PROSPERITY PROGRAMME VERSION 3 competitiveness in the marketplace is consistent with the Lisbon Strategy. The current state of the global economy has also exacerbated the challenge facing businesses in not just Northern Ireland but across Europe and the rest of the World. Expenditure on Research and Development (R&D) is a key area in developing the economy. Northern Ireland continues to have relatively low levels of expenditure on R&D in comparison with the rest of the UK. Recent years has seen R&D expenditure growing at a faster rate than the UK. In particular, Higher Education in Northern Ireland is above the UK average and is an area which has been and will continue to be concentrated on. This improvement can be attributed directly to the funding received through the BSP Programme. Improvements have also been made in the manufacturing sector as Northern Ireland gradually moves to higher value added sectors (as noted in the CSF exante in 1999). However, there is still much to do for improvements to continue both in R&D expenditure and in the manufacturing sector and help close the gap in economic performance with the UK and other EU regions - a key priority of the Lisbon Strategy. It has become apparent that the general socio-economic conditions that underpin the strategy for the BSP Programme did not change significantly within the Programme period to warrant a change in policy. The subsequent downturn in the World Economy will have repercussions for the 2007-2013 Programming period. GDP/GVA Gross Value Added (GVA) is used globally as a measure of economic performance. The latest available data (2007) shows that in Northern Ireland GVA per capita increased by 64.0%, in nominal terms, between 1997 and 2007 compared to the overall average UK growth rate of 61.4%. 21 BUILDING SUSTAINABLE PROSPERITY PROGRAMME VERSION 3 GVA per head 1997 - 2007 23 000 21 000 19 000 17 000 15 000 £ United Kingdom Northern Ireland 13 000 11 000 9 000 7 000 5 000 1997 1998 1999 2000 2001 2002 2003 2004 2005 2006 20074 Year In the early 1990s Northern Ireland experienced much greater growth in GVA compared to the UK. The relatively higher growth rates during this time can be attributed to the fact that Northern Ireland was spared many of the detrimental effects of the UK recession of the early 1990s. However, in the latter half of the period, Northern Ireland’s growth rates are much more in line with the UK. Growth in GVA 1990-2007 10.0 9.0 % growth from previous year's GVA 8.0 7.0 6.0 United Kingdom 5.0 Northern Ireland 4.0 3.0 2.0 1.0 0.0 1990 1991 1992 1993 1994 1995 1996 1997 1998 1999 2000 2001 2002 2003 2004 2005 2006 2007 Year 22 BUILDING SUSTAINABLE PROSPERITY PROGRAMME VERSION 3 As a percentage of UK GVA per capita, the Northern Ireland position has risen slightly from 80% in 1997 to 81% in 2007. Generally, Northern Ireland has remained around 80% of the UK GVA per capita average over the 1997-2007 period. 2008 GVA Figures for UK and its regions will not be available until December 2009. However, UK Gross Domestic Product (GDP) contracted by 0.6 per cent in the second quarter of 2009. UK GDP is 5.5 per cent lower than the second quarter figure for 2008. The UK has experienced negative growth in GDP for the past 5 quarters (Negative growth appearing first in Q2 2008). This negative growth is likely to impact on the future estimates of UK and NI GVA. This is evident in the total employee jobs figure of 709,040 (June 2009) which represents a decrease of 5,470 over the quarter and a decrease of 25,450 (3%) over the year. Output Whilst output measures have shown downward trends since 2008 there was an upward trend in output throughout much of the 2000 – 2006 period which is evidenced in the various Annual Implementation Reports (AIRs) for the BSP Programme. Therefore, the socio-economic conditions presented in the AIRs demonstrated that there was no need for a change to the strategy of the Programme. The Index of Production is a quarterly survey of almost 600 companies and is designed to provide a general measure of changes in the output of the Manufacturing, Electricity, Gas and Water, and Mining and Quarrying industries. Results from the Northern Ireland Index of Production for the first quarter of 2009 show that output levels fell over the quarter in real terms (-3.4%). This is the fourth consecutive quarter in which output has fallen after peaking in Q1 2008. Revisions to the Index have shifted the peak from that previously reported (Q2 2008). Over the year NI Production levels fell by 9.0%. Output from all the production industries fell by 9% over the year to Q1 of 2009 in Northern Ireland, with the manufacturing component of this increasing by 3.5%. 23 BUILDING SUSTAINABLE PROSPERITY PROGRAMME VERSION 3 In contrast, the UK figures for all production industries decreased by 2.6% over the same period. Manufacturing is typically the main determinant of change in the production sector and continues to maintain an important position within the Northern Ireland economy. Within Northern Ireland, the manufacturing sub- section that showed the greatest increase over the year to Q3 2008 was Food, Drink and Tobacco (11.5%), while the sub-section showing the greatest decrease in output was Non-metallic Mineral Products (-20.9%). Output of the Production Industries Production Industries Index 2001=100 140 130 Mining & Quarrying 120 110 Manufacturing 100 90 Electricity, Gas & Water 80 Q1 2001 Q1 2002 Q1 2003 Q1 2004 Q1 2005 Year Q1 2006 Q1 2007 Q1 2008 Q1 2009 As a result of increasing demand for better performance of the service sector in Northern Ireland, the Department for Enterprise, Trade and Investment has developed a new experimental quarterly inquiry into the Distribution and Services sector. The survey is designed to provide a general measure of changes in output of the private service sector industries. The Index of Services for the Q3 of 2008 show that output levels decreased by an estimated 0.3% over the quarter and by 3.5% compared to the same quarter one year earlier. This is the fifth consecutive quarterly fall in the overall services index for NI. Northern Ireland’s decrease over the quarter (-0.3%) is less than that for the UK as a whole which decreased by an estimated 0.5%. In historical terms, Northern Ireland Services have increased by 24.3% from Q1 of 2001 to Q3 of 2008, similar to an estimated increase of 23.8% for the UK as a whole over the same period. 24 BUILDING SUSTAINABLE PROSPERITY PROGRAMME VERSION 3 Northern Ireland Index of Services 135 All Services 130 Distribution Wholesale and Retail Hotels & Restaurants Index 2001=100 125 120 115 110 Transport, Storage and Communication Business Services & Finance Other Services 105 100 95 90 Q3 2001 Q3 2002 Q3 2003 Q3 2004 Q3 2005 Q3 2006 Q3 2007 Q3 2008 Year The Index of Construction (indexed to 2000) provides a Q3 2008 figure of 94.8, down 3.6 points on the corresponding quarter of 2007. This continues the overall downward trend in output, since the second quarter of 2007. The main drivers behind the overall decrease in construction output are the decreases in the output of new work in general and housing. With specific regard to output, the estimated seasonally adjusted value (at 2000 prices) was £525 million in Q3 of 2008, a decrease of 4.8% on the previous quarter (£546 million) and a decrease of 6.1% on the corresponding quarter in 2007 (£557 million). Productivity Economic growth in Northern Ireland is largely driven by productivity growth, which can be measured as output per hour worked. GVA per hour worked in Northern Ireland as a proportion of the UK decreased from 87.2% in 1999 to 83.9% in 2006. Productivity levels in Northern Ireland are considerably lower than the UK average, with Northern Ireland being the least productive region within the UK. Differences between Northern Ireland and UK productivity rates partly reflect higher growth rates in hours worked and employee jobs, as well as differences in the composition of the local economy compared to other UK regions. Northern Ireland continues to work longer hours on average and the gap between Northern Ireland and the UK is widening. Despite the increased growth in total hours worked in Northern Ireland, its productivity relative to the UK continues to fall, indicating that GVA in Northern Ireland has not grown in 25 BUILDING SUSTAINABLE PROSPERITY PROGRAMME VERSION 3 proportion to the rise in the total workforce hours worked in the region. This suggests that the recent employment growth has been primarily in low value added sectors. GVA per hour worked 1999 - 2006 Indexed to UK average (UK = 100) 105 100 1999 2000 2001 2002 2003 2004 2005 2006 United Kingdom 95 North East Wales England 90 Scotland Northern Ireland 85 80 Year The four key drivers of productivity, identified in the Economic Vision for Northern Ireland as a means to achieving regionally balanced growth are Innovation, Enterprise, Skills and Investment. In summary, Northern Ireland exhibits relatively low levels of productivity because: Northern Ireland businesses invest less in innovation activity; entrepreneurial activity is well below the UK average; there are poor skills levels in the existing Northern Ireland workforce; and investment in infrastructure has been historically lower compared to UK. Innovation The resource devoted R&D within a region is an indicator of the degree of innovation. R&D activity is therefore an essential component in the drive towards a competitive economy that can develop new products/processes in response to changing demands and market conditions. Total expenditure on Research and Development (R&D) in Northern Ireland was £351.1 million in 2007, representing a rise of 6.2% in cash terms (3.1% real 26 BUILDING SUSTAINABLE PROSPERITY PROGRAMME VERSION 3 terms) from the 2006 figure. For the last three years Northern Ireland Business has accounted for a greater share of total R&D expenditure than the Higher Education sector (52.7% compared with 43.1% in 2007, 50.5% compared with 45.4% in 2006 and 49.1% compared with 46.5 in 2005). Higher Education expenditure fell in real terms by £3.2 million (-2.1%) while Government expenditure increased by £0.6 million over the year. Business R&D expenditure rose by £13.3 million (7.7%) in real terms on the previous year. Human resources are another innovation performance indicator. The number of science and technology graduates in Northern Ireland compare favourably to the other EU member states and the EU27 average. However, at present Northern Ireland has fewer science and technology graduates per 1,000 persons than the UK. More generally, despite Northern Ireland continuing to have high rates of participation in Higher Education, student migration away from Northern Ireland continues to persist with nearly 30% of Northern Ireland students moving away to study for their degree and not returning. The proportion of school leavers continuing on to Higher Education has increased by 4.4 percentage points from 32.9% in 2000/01 to 38.5% in 2006/07, whereas the proportion continuing on to Institutions of Further Education increased by 0.2% from 27.2% in 2000/01 to 27.4% in 2005/06. The proportion of pupils unemployed after leaving school decreased between 2000/01 and 2006/07 from 4.2% to 3.3%. Enterprise Enterprise heightens competition within the market and provides an entry point for innovative techniques and technology. The Global Entrepreneurship Monitor (GEM) provides a measure of entrepreneurial activity within a global context. Despite entrepreneurial activity increasing on the 2002 figure (3.7%), to 4.8% of the population in 2008, Northern Ireland remains with Scotland, Yorkshire and the Humber, and the North East, as the UK regions which have the lowest level of entrepreneurial activity. In 2008, Northern Ireland’s entrepreneurial activity was 87% of the UK (5.5%). In addition, Northern Ireland had the highest fear of failure rates in the UK. Within an international context, comparisons with the participating countries from the EU highlight that entrepreneurial activity in 27 BUILDING SUSTAINABLE PROSPERITY PROGRAMME VERSION 3 Northern Ireland is higher than Belgium, Demark, Germany and Italy. The level of female entrepreneurship in Northern Ireland in 2008 is the lowest of all the UK regions at 2.3%. The gap between male and female entrepreneurship is the lowest in the UK regions but this may simply be due to the male TEA being the lowest in the UK, 2.8% below the UK average male TEA. For the first time since 2002 young adults (25-34 year olds) in Northern Ireland have above UK average levels of entrepreneurial activity (7.9%). While graduates are more likely to be entrepreneurs than any other qualification group in Northern Ireland, graduates are less likely than all but two UK regions (Scotland and the North West) to be entrepreneurs. Northern Ireland’s entrepreneurial activity (as measured by VAT registrations per 10,000 adult population) was below the UK average. However in 2007, analysis of the Inter-Departmental Business Register (IDBR) revealed that there were 58,135 businesses in Northern Ireland registered for VAT, this represented an increase of 2.6% over the year with a higher rate of growth compared to the UK (1.7%). The largest increase over the year in the number of VAT registered businesses occurred within the Property and Business services sector. Northern Ireland has much higher business survival rates compared to the rest of the UK. Approximately 78.5% of NI Businesses were still trading three years after registering for VAT (2002), compared to UK rate of 71.3%. However, convergence from 1997 survival rates may reflect increasing competition in the Northern Ireland economy. In other words, it is likely that a decreasing percentage of firms will survive for more than three years as the market becomes more competitive. The information on business survival rates comes from DETI’s edition 10 of the “facts and figures from the IDBR” report which was published in June 2008. Skills Across the UK, substantial variations in educational achievement at school and university exist, in most cases a strong performance at 16 is carried through to the percentage of the population with a degree or equivalent. While education 28 BUILDING SUSTAINABLE PROSPERITY PROGRAMME VERSION 3 attainment has been high in Northern Ireland relative to the UK, this has not always translated into the labour market. Even though Northern Ireland compares reasonably in terms of the proportion of the working age adults with a high level of qualifications at levels 2 and 3, Northern Ireland has a disproportionately high level of working age persons with no qualifications. The most recent Skills Monitoring Survey (2005) identifies various data relating to skills gaps in Northern Ireland. The same proportion of employers (13%) in both the private sector and the public sector reported a skills gap among some of their existing staff. This perception varied between employers of different sizes as well as across various locations. For example, only 11% of smaller employers (those with 1-4 employees) reported a skills gap compared to 22% of larger employers (50+ employees). Reasons cited by employers for the lack of full proficiency among staff included: lack of experience (42%); the introduction of new technology (28%); and new skills needed for the development of new products (27%). The skills monitoring survey is the most recent publication from DEL’s Skills Unit. Fieldwork for the next skills monitoring survey has been completed and a report is being drafted, however there is no set publication date. Investment In terms of technological infrastructure, Northern Ireland has benefited to a significant extent from different EU Programmes, including the BSP Programme. In particular Northern Ireland has achieved 100% broadband availability, which is unique to Europe. Every household, business, school and library in Northern Ireland now has the opportunity to access broadband regardless of location. Northern Ireland has a broadband penetration rate of 51%, below the UK average of 57% but significantly above the EU27 and ROI rates (42% and 31% respectively). The Northern Ireland Business Monitor 2006/07 reports that 72% of businesses surveyed had internet access with three industry sectors (manufacturing, construction and professional services) having a penetration rate for internet access well above 80%. 29 BUILDING SUSTAINABLE PROSPERITY PROGRAMME VERSION 3 Transport 76.7 million tonnes of freight were transported by road in Northern Ireland by vehicles weighing over 3.5 tonnes in 2007. [This is the most up to date information NI transport Statistics 2007/08]. Crude minerals were the greatest single commodity transported within Northern Ireland at 40.6% of all tonnes moved. Of the 8,464 tonnes transported on international outward journeys, the single largest commodity was building materials (38%). There were 1,008,289 vehicles licensed in Northern Ireland by 31 December 2007, 83% of which were Private Light Goods Vehicles. Over the six-year period from 1999 to 2007, the NI licensed vehicle stock increased by 39.5% compared with 25.7% in Wales, 24.3% in Scotland and 18.8% in England. During 2007-08, 806,483 tonnes of petroleum were delivered for use in Northern Ireland, 6.2% more than the 2006-07 figures. During 2007-08 there were 9.5 million rail passenger journeys made, an increase of 12% from 2006-07. This generated passenger receipts of approximately £25.1 million, a rise of 11% from the previous period. Between 2000 and 2006, the number of terminal passengers, using both Belfast International Airport and Belfast City Airport, increased by 61.2%. There were approximately 69.9 million bus passenger journeys in Northern Ireland in 2007-08 accounting for £106.2 million in passenger receipts. This represents a rise in passenger journeys by 2.4 million from a 2006-07 figure of 67.5 million and an increase in passenger receipts of 3.8% from just below £102.3 million in 2006-07. Employment Employment experienced a period of growth between the late 1999 and 2006, recording an increase of 9.5% in the working age population in employment between Spring 1999 and Spring 2006. 30 BUILDING SUSTAINABLE PROSPERITY PROGRAMME VERSION 3 Working Age Employment 760 740 (,000s) of persons 720 700 680 Working Age Employment 660 640 620 600 1999 2000 2001 2002 2003 2004 2005 2006 The number of persons in employment in the period October–December 2008 was 774,000. This represents a decrease of 14,000 over the quarter and 9,000 over the year. The working age employment rate is estimated at 68.8%, down 1.2% over the same quarter and 1.0% from a year earlier. Northern Ireland’s working age employment rate remained well below the UK average (74.1%) and was the lowest among the UK regions. Within an international context, latest figures indicate that Northern Ireland compares favourably with the EU27. Using harmonised employment rates, based on a population aged between 15-64 years for both males and females for EU countries, Northern Ireland’s employment rate is currently 66.7%. This is below the UK employment rate of 71.3% and the Republic of Ireland’s rate of 69.1% but 1.4% higher than the average EU27 employment rate (65.3%). Northern Ireland’s employment rate is currently above the Lisbon target of an employment rate of 65% by 2005 but is currently below the Lisbon target of a 70% employment rate by 2010. Northern Ireland has experienced a period of sustained growth in terms of employee jobs. From March 1998 to March 2008, employee jobs in Northern Ireland have increased by 18.8%. Much of this growth is reflective of a growth in the services and construction sectors for Northern Ireland. 31 BUILDING SUSTAINABLE PROSPERITY PROGRAMME VERSION 3 Growth in employee jobs within the services sector has more than compensated for the reduction in employee jobs experienced within Northern Ireland’s manufacturing sectors. From September 1998 to September 2008, manufacturing jobs fell by 18.7%. NI employee jobs Full-time Part-time All employees 130 125 Index 1999=100 120 115 110 105 100 95 90 1999 2000 2001 2002 2003 2004 2005 2006 2007 2008 Year The seasonally adjusted number of economically inactive persons in the period October – December 2008 was estimated at 559,000, up 9,000 over the quarter and up 15,000 over the year. The working age economic inactivity rate for Northern Ireland is 27.4%. This is significantly higher than the UK average rate (20.8%) and is the highest of the 12 UK regions. Two labour market weaknesses in Northern Ireland are high inactivity rates and low female participation compared to the UK. Northern Ireland has a higher proportion of those who identify sickness or disability as the main reason for not seeking employment (33%) compared to the UK (29%). Northern Ireland also has a higher percentage of students that do not want a job (30%) compared to the UK (27%). 32 BUILDING SUSTAINABLE PROSPERITY PROGRAMME VERSION 3 Unemployment The number of people registered as unemployed in Northern Ireland has fallen dramatically since the early 1990’s. To set in the context of the Programming period, the Spring 2006 figure (36,000) was 19,000 less than it was six years previous in Spring 1999 (55,000). This translates into a fall in the unemployment rate from 7.4% to 4.5% over the programming period. Northern Ireland had moved from being historically the region with the highest unemployment rate to a favourable position, amongst the UK regions with lowest unemployment rate. Using the October-December 2008 figures (42,000) for comparison purposes, it is clear how far Northern Ireland has moved from being historically the region with the highest unemployment to a rate of 5.1% which compares favourably to the UK average of 6.3%. During October- December 2008, Northern Ireland was joint third lowest of the unemployment rates amongst the UK regions. Northern Ireland’s unemployment rate is also below the EU27 average of 7.2%, (and Ireland’s rate of 7.9%). In 2007, Eurostat estimate the unemployment rate for those aged 15-24 years old to be 15.6% in EU27, 14.4% in UK and 9.4% in NI. There is also a falling number of unemployed who come under the category of long-term unemployed. The long-term unemployment rate fell from 47.6% in October-December 1998 to 33.6% in October-December 2008. Although this has been a significant reduction, a similar trend has been experienced across the UK regions and as a result Northern Ireland’s relative position has altered little over the last decade and remains the region with the highest long term unemployment followed by the North West at 30.7%. For comparison purposes, latest available figures from Eurostat show that in 2007, the long-term unemployment rate in Northern Ireland was 36.6%, which was much higher than that of the UK average at 23.9%, but less than EU27 average of 43.3%. 33 BUILDING SUSTAINABLE PROSPERITY PROGRAMME VERSION 3 % of Total Unemployed Long-term Unemployment 50 45 40 35 30 25 20 15 10 5 0 EU27 UK NI ROI Long-term Unemployment Rate 90 80 70 unemployed longtermunemployedasa%of all 100 EU27 60 ROI 50 UK 40 NI 30 20 10 0 1999 2000 2001 2002 2003 2004 2005 2006 2007 year Priority 2 influenced this area through the ESF policy fields. Under the Active Labour Markets Measure there has been 49,503 (of which 33% are female) annual participants, 7,539 qualifications gained, and 10,021 unemployed have now entered employment. In fact 13,657 are now deemed to have achieved a positive outcome under this Measure. Under the Equal Opportunities for All in Accessing the Labour Market Measure there has been 43,128 (of which 39% are female) annual participants, leading to 4,322 unemployed entering employment to end 2008. Adaptability and Entrepreneurship field records 52,765 (27% female) annual participants, 27,112 qualifications gained and 1,570 people achieving positive outcomes. 34 BUILDING SUSTAINABLE PROSPERITY PROGRAMME VERSION 3 Income and Earnings The median gross weekly earnings, taken from the Annual Survey of Hours and Earnings (ASHE), for all employees in Northern Ireland 2008 were £346.50, representing growth of 5.1% over the year. Northern Ireland continues to experience lower average earnings relative to the UK equivalent earnings of £388.40. Comparable figures for the other UK regions indicate that Northern Ireland had the lowest ranking median gross weekly earnings. Over the period 2007-2008 the gender pay gap has been relatively unchanged in Northern Ireland. As at April 2008 female full-time median hourly earnings excluding overtime, were slightly less than male earnings (97.4%) in NI, this is in comparison to 87.2% in the UK. In 2008, public sector earnings (£498.80) were 32.3% higher than private sector earnings (£377.10). In the UK, average weekly public sector earnings (£522.60) were 13.6% higher than private sector earnings (£460.00). NI Median Gross Weekly Earnings as % of UK Men Women All 100 95 % 90 85 80 75 1999 2000 2001 2002 2003 2004 2005 2006 2007 2008 Year Median gross weekly pay of full-time employees by industry shows that in April 2008, those employed in education were the highest earners (£628.50). This compares to employees in hotels and restaurants where median gross weekly pay was the lowest (£267.70). Average gross weekly earnings increased in 2008 in all areas of Northern Ireland. However, average gross weekly earnings of people in rural areas are consistently below those of people living in urban areas 35 BUILDING SUSTAINABLE PROSPERITY PROGRAMME VERSION 3 over the years from 2003 to 2008. During most of this period the evidence suggested that the gap between rural and urban weekly earnings was widening. However, this trend appears to be reversed in 2008 when the gap reduced. Average gross weekly earnings per person 500 450 400 350 £ 300 Urban Accessible Rural 250 Rural 200 150 100 50 0 2003 2004 2005 2006 2007 2008 year UK regional estimates of Gross Disposable Household Income (GDHI) show that over the past ten years the Northern Ireland position has remained steady relative to the other regions. Along with the North East of England, Northern Ireland has consistently had the lowest GDHI per head in the UK. In 2008, the lowest household income per head was in the North East, £12,216, followed by Northern Ireland at £12,472. The composition of household income differs substantially between Northern Ireland and the rest of the UK. Specifically, a greater proportion of household income is derived from social security benefits. In 2006/2007, 64% (most up-todate figure) of Northern Ireland’s weekly household income was derived to wages and salaries. The comparable figure for the UK was 65%. 10% of weekly household income in Northern Ireland was in the form of social security compared to 7% for the UK as a whole. Specifically, the proportion of people in receipt of disability living allowance is two times higher than in the UK as a whole. Over the three years to 2004/05, Northern Ireland households have 36 BUILDING SUSTAINABLE PROSPERITY PROGRAMME VERSION 3 consistently relied much more on benefits than their GB counterparts. However, it should be noted that Northern Ireland has proportionately more households with children under 16 than GB. This means that there are proportionately more households in receipt of Child Benefit and Tax Credits than in GB and explains some of the difference between reliance on benefits. In May 2008, Northern Ireland had the highest proportion of income support claimants of the UK regions and countries at 9.2% of 16-59 year olds; this is in comparison to 8.2% in the North East and 8.3% in the North West. The UK’s Department for Business Enterprise and Regulatory Reform (BERR) use the proportion of Income Support claimants within a region as a measure of social deprivation. Agriculture In 2008, provisional figures show that Total Income From Farming (TIFF), which measures the return to farmers and all members of their families working on farms decreased by 1.3% to £233 million, a fall of 5.5% from the 2007 figure after allowing for inflation. This followed a 12% increase in 2006 and a 40% increase in 2007 in real terms. Following this slight decrease in 2008, TIFF is 0.5% above the average for the last 20 years, after allowing for inflation. Over the same period, the number of people gaining a living from farming has declined steadily. Growth of 13% in Gross Output to £1.40 billion is the main driver behind TIFF for 2008. Across the various sub-sectors, the major change in output was in beef, poultry and milk sectors. The number of net VAT registrations disaggregated by area over the 10 year period from 1998-2008 indicates that rural areas both accessible and less accessible have demonstrated the strongest growth in net registrations by accounting form 71% of total net registrations over this period. The total agricultural labour force remained unchanged in 2008 to around 49,000 persons. This includes approximately 31,000 full and part-time farmers, with a 37 BUILDING SUSTAINABLE PROSPERITY PROGRAMME VERSION 3 number of full-time farmers declining by 1.5% and the number of part-time farmers increasing by 1.0%. Figures for the United Kingdom indicate that UK Total Income from Farming increased by 42% in 2008 to £3.46 billion, a rise of 36% in real terms. The decrease in Northern Ireland compared to the increase in the UK is due largely to a 66% or 1.27 Billion increase in gross output of cereals in the UK as a whole, as a result of an increase in production and higher average cereal prices in 2008 than in 2007. The cereals sector is relatively small in Northern Ireland accounting for only 2.5% of output. Another factor contributing to the differing position for NI compared with the UK as a whole is that the GB milk price remained relatively high throughout 2008, probably because GB producers are much less dependent on export markets. In Northern Ireland milk prices have weakened during the latter half of 2008 in line with global markets. In 2008, gross output in the UK dairy sector rose by 22% compared with 4 % in Northern Ireland. NI Total Income From Farming TIFF 250 £ million 200 150 100 50 0 2003 2004 2005 2006 2007 Year Priority 4 in the BSP Programme has supported projects and programmes for local regeneration, sectoral development, fleet modernization and food/fish processing. The number of supported projects was 653 at the end of 2007 with the gross full time equivalent jobs created reaching 134.5 under this priority. 38 BUILDING SUSTAINABLE PROSPERITY PROGRAMME VERSION 3 Tourism Tourism is an important economic sector for Northern Ireland, both in terms of the employment opportunities it provides and the revenue it generates as well as the social and cultural benefits it offers. Visitor Tourism Performance, as reported by the Northern Ireland Tourist Board, estimates 2,097,000 visits to Northern Ireland in 2008 (this represents less than a 1% change in total visits between 2007 and 2008). The total number of nights spent by visitors in Northern Ireland has increased by 7% to 11,214,000, translating into a total tourism revenue of £403 million for 2008, a 7% increase on the 2007 figure (£376 million). The results from the third instalment of the Tourism Barometer of 2008 indicate that as a result of challenges facing the tourism industry and the impact of the recession, respondents claimed that they were identifying proactive actions to be taken. Principal actions taken were special offers/packages (50%), discounted prices (27%), and revised market activities (22%). Significantly one in five of the 437 respondent enterprises had taken steps to reduce their workforce while 17% had revised their targets for the coming year. Priority 1 of the BSP Programme sought to support 15 marketing initiatives per annum across key markets and in addition create 1,400 additional jobs in the sector. To date continued support has been provided for the Regional Tourism Organisations and an average of 11 marketing initiatives per annum have been supported since 2000. Environment The sustainable development of the Northern Ireland Economy has been assisted by the provision of additional water and sewage treatment schemes since 1999. In particular, activity under Priority 5 of the BSP Programme has supported the completion of 4 new water treatment schemes and 2 sewage treatment schemes to the end of 2006. The provision of these additional schemes will facilitate the continued expansion of the Northern Ireland industrial and business economy without further environmental deterioration and neglect. 39 BUILDING SUSTAINABLE PROSPERITY PROGRAMME VERSION 3 Northern Ireland’s air quality has shown substantial improvement in recent years, with most measures well within the national air quality objectives. In particular, levels of pollutants associated with coal and oil combustion have reduced over the past decade. Nitrogen dioxide is monitored using automatic techniques at 15 urban sites across Northern Ireland. The annual mean background concentration of NO2 for Northern Ireland has been below 25µg/m3 since the year 2000. This average is well within the National Air Quality objective for NO2 of 40µg/m3. The annual average concentrations of NO2 in urban areas have been generally declining over the long term. This is due primarily to the increased use of catalytic converters in cars and a move from domestic coal burning to gas heating. In the last 10 years, the background level of NO2 in urban areas has remained relatively stable but the roadside levels, which have been monitored since 2002, have been more variable. Particulate matter in the atmosphere with a diameter of less than or equal to 10 microns (PM10) arises from both man-made and natural sources. Road transport and fossil fuel combustion produce the majority of particulate matter found in urban locations. All the readings in the last 10 years have been well below the 40µg/m3 level that has been set out as the UK Air Quality objective for the protection of human health for PM10. The average number of days of moderate or worse air quality in 2007 was 2.8 days across all sites and 13 days at the Lough Navar rural background site. The average number of days of moderate or worse air quality across all sites in Northern Ireland has decreased in the last ten years from 9 days in 1998 to 2.8 days in 2007. In general, there has been a long term decline in the average number of air pollution days in Northern Ireland. This is largely because of a reduction in emissions of particles and sulphur dioxide but deviations from this trend may be seen in certain years, for example in 2003, due to particular weather characteristics. Ozone is monitored using automatic sites at Belfast, Londonderry and Lough Navar. The National Air Quality Strategy sets an objective for a daily maximum eight hour running mean of 100µg/m3 ozone not to be exceeded more than 10 times per year. Unlike some other pollutants, levels of ozone in Northern Ireland do not appear to be decreasing, but remain variable from year to year, depending on weather conditions. Therefore, ozone 40 BUILDING SUSTAINABLE PROSPERITY PROGRAMME VERSION 3 exceedences remain a possibility. The objective has not been exceeded in Belfast or Lough Navar in the last ten years but has been exceeded in Derry in four of the last ten years. Greenhouse gas emissions for England, Scotland, Wales and Northern Ireland are published annually, detailing estimates of greenhouse gas emissions since 1990. The estimates are consistent with the United Nations Framework Convention on Climate Change reporting guidelines. In 2006, Northern Ireland’s total greenhouse gas emissions were 22,461 ktCO2 equivalent, which accounted for 3.4% of the UK total. Since 1990, Northern Ireland’s total greenhouse gas emissions have decreased by 5.8%. This is less than the reduction seen for the UK as a whole, which has seen a decrease of 15.7% on 1990 levels. There are over 15,000km of rivers and streams in Northern Ireland, of which approximately one third is monitored annually. Monitoring is carried out routinely against national standards for the General Quality Assessment (GQA) classification scheme. The majority of monitored river length is of at least a good standard (Class B and above), both chemically (75% in 2005-07) and biologically (59% in 2007). Lakes are a significant source of drinking water supplies. Lough Neagh and Upper and Lower Lough Erne make up over 90% of the total hectarage of lakes greater than 50 hectares in Northern Ireland. Excess levels of phosphorus are considered to be the main nutrient contributing to eutrophication on lakes across Europe and there is evidence to suggest that the number of Northern Ireland’s lakes that are excessively nutrient enriched is increasing. Based on a methodology adopted following the update of the Ex-ante environmental impact assessment projects should be assigned a development path. This reflects their anticipated environmental impact and will enable monitoring through the central database. Conclusion The preceding text demonstrates the state of socio-economic conditions in Northern Ireland in over the period from 1999 to 2008 making reference to 41 BUILDING SUSTAINABLE PROSPERITY PROGRAMME VERSION 3 changes that have occurred during the course of the programming period. Whilst the recent downturn in the global economy from mid-2008 has changed the socio-economic conditions in Northern Ireland, these changes happened after the ERDF element of the BSP Programme was completed and therefore is more serious concern for the 2007-2013 Programming period. For the 2000-2006 Programming period it can be seen that progress has been made in Northern Ireland at the macro level with continued growth in GVA and a growing labour force pool of working age population. It is also clear that in addition to the deterioration of the world & UK economy in 2008, a number of problems persist: • inactivity rates; • relatively high long-term unemployment; and • high proportion of workers with no qualifications. However, it is also clear that the ERDF element of the BSP Programme has provided benefit to the socio-economic conditions, particularly through R&D, business and regeneration activities, within Northern Ireland through funded activities and initiatives and has contributed to a more positive outlook for the region especially given the recent downturn in the global economy. 42 BUILDING SUSTAINABLE PROSPERITY PROGRAMME VERSION 3 CHAPTER 2. PROGRAMME RATIONALE 2.1 Background Northern Ireland has faced unique opportunities and challenges over the period 2000-2006. The European Union has shown its support & commitment to helping Northern Ireland to meet these challenges which involve making significant transitions in the economic, social and political fields. The European Council, meeting in Berlin in March 1999, decided that for the period 2000-2006 Northern Ireland would receive support as an Objective 1 in Transition Region. The Northern Ireland Programme for Building Sustainable Prosperity operated under the authority of the Northern Ireland Community Support Framework. A Structural Funds Plan was developed setting out proposals for the Northern Ireland Community Support Framework (CSF) and for the Northern Ireland Programme for Building Sustainable Prosperity. The Structural Funds Plan (‘the Plan’) was prepared after careful analysis of Northern Ireland’s needs based on an independent ex-ante evaluation, a widespread consultation process and consideration of the possible responses to the needs of the region. It included a Chapter on ‘Co-operation with Ireland’ which was agreed jointly and followed on from the ‘Common Chapter’ which appeared in the Northern Ireland Structural Funds Plan 1994-1999 and the comparable document prepared by the Irish Government. Taken together with a new emphasis on East–West co-operation reflecting the terms of the Belfast Agreement of April 1998, the Plan placed a strong emphasis on the much greater involvement of Northern Ireland in European and international networks. 43 BUILDING SUSTAINABLE PROSPERITY PROGRAMME VERSION 3 2.2 Ex-ante Evaluation A full and independent ex-ante evaluation was carried out to identify the strengths and weaknesses of Northern Ireland as a region and available sources of potential growth and development. This ex-ante evaluation included a careful analysis of the environmental position of the region, equality between men and women and the regional labour market. The ex-ante evaluation also drew upon experience of the operation and evaluation of the 1994-1999 round of Structural Funds support to Northern Ireland. The ex-ante evaluation found that: • evaluation results were mainly available only in relation to Mid-Term assessments of 1994-1999 Programmes and the conclusions of those assessments were, by their nature, interim and unable to take account of subsequent developments, including the benefits of implementing changes recommended in Mid-Term reviews; • the Structural Funds had made a significant contribution to social and economic cohesion in Northern Ireland overall but the effects of ERDF Programmes tended to be more obvious and longer term; • procedural weaknesses and lack of integration in some Programmes reduced their impact; • evaluators have consistently recommended rationalisation of local delivery mechanisms for the Structural Funds in Northern Ireland to avoid overlapping objectives and procedures; • significant advances had been made in the administrative arrangements for Structural Funds Programmes in Northern Ireland; and • arrangements for future evaluation required that indicators used in Structural Funds Programmes should be both quantifiable and meaningful. 44 BUILDING SUSTAINABLE PROSPERITY PROGRAMME VERSION 3 Increased expenditure took place on security and prison services as measures on health, education and housing intended to ameliorate community divisions. While this additional public expenditure helped to sustain household incomes, it did not contribute to developing the economy and its capacity for self-sustaining growth. The diversion of funds to social and security expenditure and away from public investment in areas such as economic infrastructure further undermined the development of the supply-side of the regional economy. These effects and the very low of level of development of the tourism industry, community divisions, degraded urban environments and a sense of political instability leading to a lack of business confidence have all created a context minimal to economic development. The “troubles” have produced additional employment in the police and security sectors and in other public sector occupations. However, these non-market related jobs are ultimately unsustainable and the diversion of human resources into these sectors further reduced the economy’s productive potential. Community conflict has also fostered labour market inflexibility and made it more difficult to match job opportunities and job seekers, a factor, which contributed to the very high rates of unemployment in particular communities. 2.3 Consultation on the Draft Plan (Jan 1999–Nov 1999) The Northern Ireland CSF was developed through a process of extensive and inclusive consultation. The Northern Ireland political parties, regional sectoral interest organisations and the general public were all invited to make written submissions whilst two consultative conferences were organised, - in May and September 1999. These brought together several hundred delegates from a wide range of local interest groups. Members of the Northern Ireland Assembly provided input to the development of the Plan, notably in the course of briefing seminars organised in May 1999 and September 1999. Following the May Consultation Conference, it was decided to establish a "Core Consultative Group" to act as a conduit for more regular consultation with key 45 BUILDING SUSTAINABLE PROSPERITY PROGRAMME VERSION 3 economic and social partners in order to provide ongoing advice. The "EU Programmes Development Committee" was established bringing together in one forum the Assembly Parties, representatives of the Local Authorities and the key economic and social partners. A further round of consultation was undertaken in February 2000. At the same time the Northern Ireland Programme for Building Sustainable Prosperity was revised in the light of comments received from the European Commission and was resubmitted in March 2000 to Brussels. Copies of the revised Programme Document were subsequently issued by DFP to all those involved in the February consultation process including political representatives, District Councils and the economic and social partners in April 2000. The Executive Committee considered and endorsed the outcome of this further round of written consultation, which included the establishment of an Interim CSF Monitoring Committee (CSFMC). The Executive and Committee held its first meeting following the restoration of devolution in May 2000. In order to continue the consultation process, an "interim” CSFMC was established and its inaugural meeting was held in April 2000. This “interim” CSFMC enabled regional and local interests to be kept informed of the negotiations on the new CSF in monthly meetings from April to July 2000. The membership of this consultative body included the Departments involved in the spending proposals, the main Northern Ireland Assembly Parties, District Councils, social and economic partners and other relevant local interested parties (Equality Commission, etc) and representatives from the Commission in an advisory capacity. Once the CSF entered into force with its approval by the Commission, the “interim” CSFMC’s work ended and was replaced by the formal CSF Monitoring Committee. 46 BUILDING SUSTAINABLE PROSPERITY PROGRAMME VERSION 3 A Monitoring Committee for the Northern Ireland Programme for Building Sustainable Prosperity Operational Programme was established, initially in shadow form, to provide the appropriate mechanism for consultation on and input to the individual Programme Complements. 2.4 Link with Northern Ireland CSF Priorities The overall structure and main priorities of the CSF were derived from the Structural Funds Plan, the Ex-ante Evaluation the consultation process and, through negotiations with the Commission. The needs and opportunities were distilled into the CSF Priorities, which set the context for the Operational Programmes as follows:• Peace and Reconciliation. • Economic Growth and Renewal. • Employment, Human Resource Development and Social Inclusion. • Balanced Regional, Urban and Rural Development. • North South and Wider Co-operation. The CSF Priorities are underpinned by the Horizontal Principles of: • Accountability. • Balanced Intervention/Equal Opportunity. • New Targeting Social Needs. • Economic and Social sustainability. • Partnership. • Locally based decision making. • Transparency/Publicity. • Co-ordination. • Environmental sustainability. 47 BUILDING SUSTAINABLE PROSPERITY PROGRAMME VERSION 3 The Northern Ireland Programme for Building Sustainable Prosperity addressed development priorities, which were commonplace throughout the less prosperous regions of the European Community. As it contained almost 2/3 of the total EU Structural funds allocation under the Community Support Framework (CSF) and must carry the main weight of the transition process, the Northern Ireland Programme for Building Sustainable Prosperity played the key role in achieving the overall CSF objective of a transition to “a more peaceful, stable, prosperous, fair and outward looking society, sustained by a better physical environment.” The Programme addressed a wide range of development needs, including improvements to infrastructure and increasing the skills of the workforce to improve the region’s competitiveness. 2.5 Structure of the Northern Ireland Programme for Building Sustainable Prosperity 2000-2006 Northern Ireland Programme for Building Sustainable Prosperity was implemented through 5 Priorities which addressed: • Economic Growth & Competitiveness. • Employment. • Urban & Social Revitalisation. • Agriculture, Rural Development, Forestry & Fisheries. • The Environment. The Programme was the main instrument for the realisation of the economic and social transition identified in the CSF and it built on the experience in the successful delivery of the 1994-99 Northern Ireland Single Programme. 2.6 Overall Aim of the Northern Ireland Programme for Building Sustainable Prosperity The overall objective of the Programme was to move Northern Ireland to a state of sustainable prosperity in a competitive modern economy by focusing on the restructuring of its businesses and the key skills development of its people while maintaining a quality environment. 48 BUILDING SUSTAINABLE PROSPERITY PROGRAMME VERSION 3 The horizontal principles were embedded in and delivered through the 5 main Priorities and included: • Project selection criteria. • Implementation arrangements. • Targets and indicators. 2.7 Accountability Accountability and the safeguarding of public funds (whether EU or matching) was a primary concern. Financial management and control arrangements were established to ensure that all funds were managed in accordance with the principles of the proper treatment of public funds, all applicable Community rules and the principles of sound financial management. Further details are contained in the Operational Framework chapter. 2.8 Balanced Intervention/Equal Opportunities In order to ensure coherence between the actions supported and the aims and objectives of the Programme, relevant groups, sectors, areas or projects were identified and encouraged to make applications. All eligible applicants for support were afforded equal opportunities to access funding. In accordance with the Structural Funds regulation and consistent with section 75 of the Northern Ireland Act 1998, operations part-financed by the Structural Funds must comply with and where appropriate, contribute to Community policy and legislation on equal opportunities for men and women. They shall also have due regard to the need to promote equality of opportunity:• between persons of different religious belief, political opinion, racial group, age, marital status or sexual orientation; • between men and women generally; • between persons with a disability and persons without; and 49 BUILDING SUSTAINABLE PROSPERITY PROGRAMME VERSION 3 • between persons with dependants and persons without. Have due consideration and regard to the desirability of promoting good relations between persons of different religious belief, political opinion or racial group. Equality of participation in the Programme Monitoring Committee, working groups or selection panels was encouraged in accordance with the provisions of the Structural Funds Regulation. Every effort was made and every assistance given to ensure (within the parameters of the Programme) that all sectors of the population participated fully in the Programme. 2.9 New Targeting Social Need Relevant aspects of the BSP Operational Programme conformed to the principles of the New Targeting Social Need (New TSN) policy; and involved targeting of resources and efforts on people, groups and areas objectively shown to be most socially disadvantaged. This policy included special focus on the problems of unemployed people and on improving their chances of finding employment. 2.10 Economic and Social Sustainability An assessment of sustainability for all projects, which required public funding in order to continue was of critical importance. In assessing projects, all funding bodies bore in mind that all operations funded should, by the end of the relevant programming period, have developed an appropriate exit strategy. 2.11 Operationalisation The Mid-term Evaluation recommended a more co-ordinated and strategic approach to the related issues of mainstreaming and sustainability in respect of third-party projects. 2.12 Partnership In accordance with the principles of partnership, the BSP Monitoring Committee comprised of regional and local authorities, other competent public authorities, the economic and social partners and other relevant competent bodies. 50 BUILDING SUSTAINABLE PROSPERITY PROGRAMME VERSION 3 2.13 Locally Based Decision Making Delivery Mechanisms Bodies and organisations selected as delivery mechanisms were those which were best placed to deliver the objectives of the Programme by virtue of their scale, expertise or the nature of their activities. 2.14 Publicity/Transparency All bodies involved in the delivery of the Northern Ireland Programme for Building Sustainable Prosperity committed to a high degree of transparency. The link with EU intervention was always clearly specified according to publicity requirements defined at Operational Programme level. 2.15 In Co-ordination conjunction with the principles of transparency and accountability, mechanisms were put in place to ensure that funding from Structural Funds and other sources private and public were applied in a co-ordinated and complementary manner. Co-operation among the various delivery mechanisms was encouraged especially in the sharing of information and of best practice. 2.16 Environmental Sustainability The UK Government outlined four principles in its strategy for sustainable development: • High and sustainable levels of growth and employment; • social progress which meets the needs of everyone; • effective protection of the environment; and • prudent use of natural resources. Many forms of economic development have environmental costs; they use natural resources, can damage or destroy natural habitats; wildlife, and generate by-products causing pollution and waste, which can be harmful to health. The horizontal principle of environmental sustainability set out to ensure that the Programme supported only economic activity which was at least environmentally neutral and included all that seeks to protect and enhance the environment. 51 BUILDING SUSTAINABLE PROSPERITY PROGRAMME VERSION 3 CHAPTER 3: OPERATIONAL FRAMEWORK 3.1 Background In accordance with the requirement of Article 18.2(d)2 this Chapter sets out the implementing provisions for the Northern Ireland Programme for Building Sustainable Prosperity for Northern Ireland. This has taken into account the requirements of the Council Regulation referred to above and the Commission Regulations on the euro, information and publicity, eligibility of expenditure and financial corrections. The Operational Framework deals with the arrangements for managing the Northern Ireland Programme for Building Sustainable Prosperity. As defined in Article 9(m), the Programme Complement implements the programme strategy and priorities and contained detailed elements at measure level. It was drawn up by the Managing Authority after agreement by the Monitoring Committee and contains the information requested by Article 18.3 and was forwarded to the Commission within the three months stipulated by the Commission when giving its decision to approve the Programme. 3.2 The Programme Monitoring Committee In accordance with Article 35, the Programme was supervised by a Programme Monitoring Committee which also was set up within the 3 months timescale. The Monitoring Committee included members from Northern Ireland Assembly, business, trade unions, the agriculture/rural development/fisheries sector, the community and voluntary sector, district councils and those representing environmental and equal opportunities interests. Particular effort was made to maintain this balance and equal gender participation. The Commission participated in an advisory capacity. 2 All Articles referred to in this Chapter relate to Council Regulation (EC) No 1260/99 of 21 June 1999 52 BUILDING SUSTAINABLE PROSPERITY PROGRAMME VERSION 3 The role of the Programme Monitoring Committee was to review progress, monitor and report on the effectiveness and the quality of the implementation of the Programme. To this end: • it shall periodically review progress made towards achieving the specific objective of the Programme; • it shall examine the results of implementation, particularly the achievement of the targets set for the different Measures and the mid-term evaluation. • it shall consider and approve the annual and final implementation reports before they are sent to the Commission; • it shall consider and approve proposals to amend the contents of the approved Programme; and • it may propose to the Managing Authority adjustments or review of the Programme and Programme Complement in order to help attain the Programme objectives or to improve the management of the Programme, including financial management. Non-Permanent Members from the Member State or other relevant organisations may be invited by the Programme Monitoring Committee to attend Monitoring Committee meetings in response to specific agenda items. The Monitoring Committee met twice each year in Spring and Autumn. Minutes of these meetings can be found in Annex 7. 3.3 Managing Authority Day-to-day responsibility for the programme was carried out by the Managing Authority under the supervision of the Programme Monitoring Committee and included assessment of progress towards: • achievement of the financial, physical and impact indicators; • organisation and co-ordination of data relating to financial, physical and impact indicators; and • qualitative aspects of implementation 53 BUILDING SUSTAINABLE PROSPERITY PROGRAMME VERSION 3 The Managing Authority in accordance with Article 34 was responsible for the efficiency and correctness of management and implementation. The Northern Ireland Department of Finance and Personnel was the Managing Authority for the Northern Ireland Programme for Building Sustainable Prosperity and worked in close liaison with other Northern Ireland Departments accountable for relevant expenditure. The Managing Authority agreed the management arrangements for the Programme taking into account the advice of the Programme Monitoring Committee. The Managing Authority remained responsible at all times for the management of the Programme and during the lifetime of the Programme provided effective delivery of priorities and measures and their outputs and targets through guidance, support and effective dissemination of good practice. Compliance with Community Policies The Managing Authority has taken all appropriate measures within the framework of the assistance to ensure conformity with Community policies including the rules of competition, the award of public contracts, environmental protection and improvement, the elimination of inequalities and promotion of equality between men and women and, as far as rural development is concerned, the Common Agricultural Policy. 3.4 Paying Authority The Paying Authority was responsible for drawing up and submitting certified payment applications and receiving payments from the Commission in accordance with the requirements of Article 9(0). The Paying Authority for the ERDF element of the BSP Programme was the Department of Finance and Personnel and it has fulfilled all relevant functions in accordance with Article 32. In the carrying out of the task of Paying Authority, 54 BUILDING SUSTAINABLE PROSPERITY PROGRAMME VERSION 3 there was a clear separation of duties between the Managing and Paying Authority although staff engaged in both were located in the same building. The Paying Authority put in place procedures for receiving copies of various information documents to provide assurances before submitting payment applications. These include: • Implementing Bodies provide a signed certificate for each payment application confirming compliance with the relevant Commission Regulations and a signed declaration is obtained from Departmental Finance branches to confirm that payments included in the application have been effected through the Departmental accounting system; • the Managing Authority provides a signed certificate confirming: the date of adoption of the latest Programme Complement; submission of the latest Annual Implementation Report; submission of the mid-term evaluation; implementation of recommendations made by the Commission including action on requests for corrective measures; documents containing original signatures are held by the Managing Authority; and any issues arising from verification checks (Article 10) have been – or are being addressed; • copies of all Article 10 visit reports detailing amounts examined and results of checks are provided by the Verification Teams; • copies of the annual control reports (Article 13) detailing audit activity and findings and providing audit assurances signed by the Departmental Heads of Internal Audit are provided; • copies of Internal Audit reports following inspections by Department of Finance and Personnel audit staff on activities of the Managing and Paying Authorities’ systems are provided; 55 BUILDING SUSTAINABLE PROSPERITY PROGRAMME VERSION 3 • copies of the detailed findings following visits by Commission auditors, the European Court of Auditors and OLAF auditors – together with responses to any issues raised are provided; and • copies of ‘best practice’ documents produced by the Commission and other UK regions are provided. In addition, the Paying Authority has reserved the right to conduct its own on-thespot checks to confirm the regularity of any information provided for use in payment applications to the Commission. One such visit was carried out in respect of information provided by the Department for Regional Development to verify compliance with the requirements for a complete audit trail. A copy of the findings can be found in Annex 11. 3.5 Information and Publicity EC Regulation 1159/2000 sets down the EC requirements for publicity. It states that information and publicity is to be provided “to increase public awareness, assist transparency and create a coherent picture of the assistance”. Communications and Information Action Plan In compliance with Article 18(3) (d), the Department of Finance & Personnel (DFP) European Division developed a Communications and Information Action Plan to detail measures intended to publicise the BSP Operational Programme. The aim was to promote a positive image of European Structural Fund programmes in Northern Ireland. The objectives of the Action Plan were to: • To promote funding opportunities offered by the European Union by providing clear information about the Programmes in Northern Ireland and the European Structural Funds and by disseminating best practice. • To aid transparency of the operation of the Programmes. 56 BUILDING SUSTAINABLE PROSPERITY PROGRAMME VERSION 3 To assist Accountable Departments and Implementing Bodies the Managing Authority issued a Guidance Note suggesting ways on how to meet the regulatory requirements together with a pro-forma to monitor details of publicity activities at measure level. This information is collated into reports which are used by the Structural Funds Monitoring Committee to monitor the effectiveness of Publicity Measures undertaken and also provide the Management Authority with assurance that there is compliance with EC Regulation 1159/2000. Publicity activities have also been reported in the BSP Annual Implementation Reports. Regulatory Article 4 verification checks also examine the publicity activities of projects to ensure adherence to the EC Regulation. The Managing Authority has also undertaken a variety of activities to promote the BSP Programme to citizens in Northern Ireland which include: • A Website to disseminate information relating to the BSP Operational Programme (including all EU Structural Funding to NI). The website, www.europe-dfpni.go.uk, was designed to provide access to all parts of the Community and has taken significant steps to meet its equality obligations under Section 75 of the Northern Ireland Act 1998. website provides access to material ranging from The programme documentation, the Structural Funds manual, to minutes of Monitoring Committee meetings and logos. Guidance to Implementing Bodies on publicity requirements is available on http://www.dfpni.gov.uk/publicityguidelines.pdf ; • issue of two guides – Guide 1 ‘An Introduction to Structural Funds in Northern Ireland’ which provides information on structural funds, their purpose and aims, how the money will be used, managed and how to access it. Guide 2 ‘Building Sustainable Prosperity in Northern Ireland through European Union Structural Funds’ provides more information on the BSP Programme which would be of interest to those seeking general information on the programme. The booklet also explains how the BSP Programme fits into the wider picture of European Funding in Northern 57 BUILDING SUSTAINABLE PROSPERITY PROGRAMME VERSION 3 Ireland (front page examples below. Original copies included with hard copy version of report); 58 BUILDING SUSTAINABLE PROSPERITY PROGRAMME VERSION 3 • production of a BSP Newsletter issued in Spring and Autumn which showcases a wide range of projects from the Programme (front page example below. Original copy included with hard copy version of report); • a selection of BSP promotional materials was distributed to project promoters via the Implementing Bodies. The promotional materials included mugs, pens, key-rings, pens, pencils, mouse mats, all with full colour BSP logo; • 2004 and 2005 calendars with photographs of various projects were produced and distributed to projects and key contacts; • an advertising campaign was run for six months using buses in main towns throughout Northern Ireland. This coincided with a four week advertising campaign at bus stops; 59 BUILDING SUSTAINABLE PROSPERITY PROGRAMME VERSION 3 • European Division in its role as CSF Managing Authority produced a CSF leaflet highlighting projects. 220,000 copies were issued in the 4 main newspapers in Northern Ireland (front page example below. Original copy included with hard copy version of report); 60 BUILDING SUSTAINABLE PROSPERITY PROGRAMME VERSION 3 Implementation of the Information and Communication Action Plan Set out below is an indication of how the BSP Programme MA met the requirements of the Action Plan: Requirement Mechanisms A mechanism is in place for The Structural Funds Central collecting and reporting Database system has been fully information relating to plans, operational since 2002. execution and delivery of programmes. Communications are taking place The Structural Funds Database both within and external to the has provided information on the Implementing Bodies on quality quality of ongoing work. and quantity of ongoing work. Bi-lateral meetings and Article 4 and Article 10 checks have provided information on the quality of ongoing work. A dedicated publicity officer has provided advice and guidance to Departments and IBs. Baseline information has been identified and measured against which progress can be compared. Progress towards goals can and measured A full set of indicators – targets, outputs and impacts – have been developed in conjunction with the Northern Ireland Statistics and Research Agency (NISRA). programme The Managing Authority has are being monitored progress on an ongoing basis using the Central Database. There have been regular bilateral meetings with Departmental Implementing Bodies. Implementing Bodies have been required to provide information on progress on a quarterly basis. Guidelines have been published and updated by the MA. The aims of communication and On a 6 monthly basis, publicity are being met. Implementing Bodies have been required to provide information on publicity actions taken in relation to the Measures they administer. 61 BUILDING SUSTAINABLE PROSPERITY PROGRAMME VERSION 3 Other actions specified in the plan have been implemented as follows: Requirement Mechanisms Publicity and information activity will be targeted at individual sectors of the target audience, sectoral groupings or the entire audience. The nature of the message will determine the publicity and information measure and communication channel to be used to reach the audience. In order to ensure compliance with Section 75 of the Northern Ireland Action 1998, access to BSP information has been made available to all sectors of the Community e.g. disabled, ethnic minorities. Implementing Bodies have targeted potential beneficiaries of specific sectors. The MA has targeted beneficiaries more generally and also the wider public. The Operational Programme – summary document, is available in the following languages and formats: • Urdu; • Cantonese; • Irish; • Ulster Scots; • Braille; and • Audio All documents are available electronically and as hard copies. The above translations and formats are also available upon request, from the Department of Finance & Personnel (DFP) European Division. Internet access for information Internet access has been relating to Structural Funds. implemented fully as laid out in the Action Plan. A newsletter was used to inform the target audience of the latest Programme news; promote Programme events and other useful sources of information; and provide contact points for the interests of the target audience segments. Newsletters featuring successful BSP projects and providing information on the Programme have been produced and circulated widely on a 6 monthly basis throughout the Programme. BSP articles also contributed to specialised newsletters e.g. NI Seafood Newsletter, Training for The newsletter was published on Women Network newsletter, a six-monthly basis. The format British Council newsletter. included full colour A4 featuring 62 BUILDING SUSTAINABLE PROSPERITY PROGRAMME VERSION 3 photographs Articles where possible. A “Simple Guide” will be The Operational Programme available for potential applicants Documents summary was and a wider public audience. published to the standards mentioned above. Other publications appropriate to the needs of potential beneficiaries have been published by Implementing Bodies. Posters provide a cost effective A poster campaign at bus shelters way for projects to promote the on prominent routes throughout contribution from the European the province was carried out for a Union. This action has worked 2 week period in June 2005. A 3 particularly well for ESF projects month long bus advertising across Europe. A series of campaign was carried out through posters for all Funds will be Northern Ireland in 2005 to raise designed for distribution. awareness of the public of the BSP Programme. This was followed by a further 2 week campaign. Stickers will be developed to help projects promote the contribution from Europe. Colour logos in 2 sizes will be printed on transparent stickers for projects to use on stationery, trainee application forms, certificates etc. A variety of promotional stickers and other items was disseminated to Departments, beneficiaries and the general public. Implementing Bodies have also provided promotional items to beneficiaries. An Information Officer was appointed to provide guidance and encouragement to Accountable Departments and Implementing Bodies. He also liaised with the Departmental Press Office in issuing press releases in targeted A dedicated Information Officer newspapers and maximising photo will co-ordinate a proactive media opportunities. campaign that maximises ministerial visits, launches and photo opportunities. The Information Officer will assist Implementing Bodies to develop a press campaign including drafting and issuing press releases, placing features and editorial in targeted newspapers and journals, dealing with media A press campaign is the main measure for targeting the general public. It is also an effective method of reaching potential beneficiaries and the business community/private sector. 63 BUILDING SUSTAINABLE PROSPERITY PROGRAMME VERSION 3 enquiries and also TV/radio interviews. arranging A series of seminars, workshops and conferences should be held throughout the Programme period (2000-2006) by Implementing Bodies to both publicise the Programmes and enhance understanding of the new mechanisms for implementation. General publicity of events will also help raise the profile of BSP with the general public. It will be necessary to ensure that events and held throughout Northern Ireland and that the audience are targeted carefully according to the nature of the event. The Managing Authority held a communications conference in June 2002 in Hilton Hotel in Templepatrick. The audience included Members of the Social Partner organisations, programme deliverers and members of the Managing Authorities from all the programmes. The Managing Authority has also organised a stall at the Europe Day events organised by the City Council to provide details of the European Funding available, the application process and publicity requirements for the 2000-2006 Programmes. 3.6 Working Groups A number of cross cutting themes were established by the overarching Community Support Framework (CSF) Monitoring Committee – working groups were established to report on all Programmes within the CSF. The Working Groups were: • Communications and Information Working Group (CIWG). The aim of the CIWG was to ensure that processes of communication and publicity were in place and effective. • Mainstreaming Equality Working Group (MEWG). The aim of the MEWG was as a cross cutting sub-committee. • Environmental Working Group (EWG) was established as a cross cutting sub-committee to make recommendations and give technical advice on environmental issues to the Monitoring Committee. • Information Society Working Group (ISWG). Its role was to monitor information society activity within BSP. 64 BUILDING SUSTAINABLE PROSPERITY PROGRAMME VERSION 3 • Human Resource Development Working Group (HRDWG). The aim of the HRDWG was to oversee, co-ordinate and inform on the implementation of the ESF co-funded interventions to the Monitoring Committee. • Fisheries Working Group (FWG). The aim of the FWG was to monitor the financial performance and effectiveness of the fisheries measures and to recommend any necessary changes in financial profiles, to the BSP Monitoring Committee. 3.7 Monitoring of Environmental Sustainability Development Path Analysis (DPA) was used to assess the environmental impact of any given project. Each project was allocated a development path ranging from 1 to 6, which was then recorded on the central applications database. Analysis of the database has shown that of the 1,253 BSP projects approved before 31 December 2007, 100% had a DPA score, representing 100% of total funding awarded. Analysis of the DPA data showed that a majority of 958 of projects were classified as Path 1, i.e. ‘business as usual’. 86.5% of all funding. These projects accounted for Path 5 (improving eco-efficiency) was allocated to 99 of approved projects, representing 2% of funding. Path 6 (encouraging new types of economic activity which use less environmental wastage) was allocated to 52 of approved projects and 4.1% of funding. Projects under Path 2, which aimed to clean up the mess from past activities and projects under Path 3 projects, putting environmental infrastructure in place, denote 66 and 74 respectively of all approved projects. They represent 3% and 4.2% of all funding respectively. The lowest proportion of projects (under 0.2% of funding) were allocated to Path 4 (helping existing firms meet increasing environmental standards). 3.8 Annual Implementation Reporting and Annual Review Meeting In accordance with Article 37, the Managing Authority submitted to the Commission within six months of the end of each full calendar year of 65 BUILDING SUSTAINABLE PROSPERITY PROGRAMME VERSION 3 implementation an Annual Implementation Report (AIR) on activities across the Programme. Each report was examined and approved by the Programme Monitoring Committee before it was sent to the Commission. Links to each AIR can be found at Annex 8. The annual report included the following information: • Any change in general conditions which was of relevance to the implementation of the Programmes, in particular the main socioeconomic trends, changes in national, regional or sectoral policies or in the frame of reference, the implications for the mutual consistency of assistance from the different Funds and consistency between Fund assistance and that from other financial instruments; • the progress in implementation of priorities and measures in relation to their specific targets, with a quantification, wherever and whenever they lend themselves to quantification, of the physical indicators and indicators of results and impact; • the financial implementation of the Programme; • the steps taken by the Managing Authority and the Monitoring Committee to ensure the quality and effectiveness of implementation, in particular monitoring, financial control and evaluation measures, including data collection arrangements, significant problems encountered and the action taken and corrective measures; • the use made of Technical Assistance; • the measures taken to ensure publicity for the BSP Programme; • reporting on the compatibility with Community policies and coordination of all the Community Structural Assistance; and • a section on the progress and financing of major projects and global grants. All reported submitted were deemed acceptable and satisfactory by the Commission. In accordance with Article 34(2) following submission of the 66 BUILDING SUSTAINABLE PROSPERITY PROGRAMME VERSION 3 Annual Implementation Report the Commission and the Managing Authority met to review progress. 3.9 Summary of significant Difficulties in Implementation of the Programme • In 2001 the most significant problem encountered in the implementation of the Building Sustainable Prosperity Operational Programme was the fact that the Commission Decision approving the Programme was not taken until March 2001 and the Programme Complement not approved by the Monitoring Committee until June 2001. During 2001, the Programme Complement had still to be formally accepted by the European Commission. This meant that implementation of the Programme was slower than anticipated with calls for projects only beginning in the Autumn of 2001. • Also during 2001, the severe downturn in the Telecommunications sector, due to a general lack of confidence in the stock markets, had a marked effect on Measure 1.7. The implementation of the Tourism Measure, 1.3 in Priority 1, to the end of 2001 was affected by the uncertainty created by the foot and mouth disease and the events of September 11. However, the target number of marketing initiatives supported in key markets was achieved in 2001. • During 2002 the Closure of 1994-1999 Programmes lead to a diversion of resources from implementation of the Programme, thus reflecting in the slower progress of some Measures and other areas such as Publicity activities, input to database etc. By the end of 2002, the design phase of the central database had been completed but the work of populating it with data had only just begun. Implementing Bodies found that the task of inputting data was more resource intensive than expected and this coupled with existing staffing difficulties resulted in significant delays in populating monitoring data during 2002. 67 BUILDING SUSTAINABLE PROSPERITY PROGRAMME VERSION 3 • During 2003 work on the closure of the 1994-1999 Programmes continued to be a drain on audit resources which meant that the Article 4 and Article 10 checks were slow to get underway and a backlog built up, which could only be addressed by bringing in additional assistance. This Managing Authority therefore made Technical Assistance Funding available to Implementing Bodies to employ outside expertise to carry out Article 10 checks up to 31 December 2002. • There were also difficulties in collecting monitoring data in relation to the Equal Opportunities and Sustainable Development horizontal principles. In June 2003, the Managing Authority introduced a new system for collecting anonymous Section 75 data. The Environment Working Group also commissioned research into use of the Development Path Analysis (DPA). • In 2004 monitoring n+2 targets was a major concern due to the fact that relevant spend was recorded by Departments on the Central Database infrequently. The Managing Authority took steps to encourage the Departmental Implementing Bodies to make future declarations of spend regularly throughout the year to ensure that n+2 targets could be monitored constantly in 2005. Under Priority 1, the delay in obtaining approval for the major project application for the gas pipeline put pressure on the Department of Enterprise, Trade and Investment (DETI) in meeting its portion of the ERDF target. • Difficulties in collecting data in relation to the Sustainable Development horizontal principle continued in 2004. The research into the use of the Development Path Analysis (DPA) methodology commissioned by the Environment Working Group resulted in a retraining and data conversion exercise. The collection of non-financial monitoring data in general was a major concern for the Managing Authority during the year. It put procedures in place requiring Departmental Implementing Bodies to update the Central Database quarterly. The emphasis for 2005 was to ensure that the improvements made in 2004 in relation to recording financial monitoring data was replicated for non-financial monitoring data. 68 BUILDING SUSTAINABLE PROSPERITY PROGRAMME VERSION 3 • During 2005 DETI and the Managing Authority agreed the approval of a restricted gas pipeline project with the European Commission and were able to agree the transfer of the balance of ERDF to measures 1.6 and 1.7 at the Autumn Monitoring Committee. • During 2006, following recommendations by European Commission Auditors, it was agreed that the Classroom 2000 project approved under measure 2.5 should be subject to the major project approval procedure, which involved the Managing Authority and DE, the Implementing Department, in intensive work during the autumn to prepare and lodge the application and subsequently dealing with points of clarification. In addition, DE had to identify contingency expenditure in the event that the project failed to win approval. A Commission Decision approving a reduced sum for this project was received by the end of the year. • The Commission Decision approving Classroom 2000 (C2K) as a major project was made in December 2006 and received by the Managing Authority during January 2007. The categorisation of eligible expenditure within the decision required DE to re-examine and correct expenditure declarations already made for the project and to bring further eligible expenditure to complete their share of the measure expenditure. They identified the required adjustments to the expenditure declared under this project and alternative expenditure to replace items now considered ineligible. • During 2007, an audit exercise in relation to Measure 3.3 was carried out by DSD internal Audit. As a result of this audit, expenditure from a number of projects was withdrawn from the Programme. In response to this, DSD brought forward a proposal to move up to €4.3 ERDF from Measure 3.3 to Measure 3.1 to alleviate any potential loss to the Programme. This was agreed by the Programme Monitoring Committee in October. 69 BUILDING SUSTAINABLE PROSPERITY PROGRAMME VERSION 3 • The 2007 AIR identified the issue of ineligible spend in respect of “Trigger Points” or funds paid out on the achievement of results and not on expenditure incurred. Auditors from DG REGIO raised a number of issues in September 2007, in relation to payments to projects using trigger points. After discussion with the DG REGIO auditors, DETI’s Internal Audit provided assurance to the Commission on the eligibility of expenditure claimed to date. 3.10 Monitoring Indicators In accordance with Article 36 of Council regulation (EC) No 1260/1999, the Managing Authority and the Monitoring Committee carried out monitoring by reference to the physical and financial indicators to the specific character of the Programme, its objectives and the socio-economic, structural and environmental situation of Northern Ireland and included the findings in the Annual Implementation Report each year. 3.11 Mid-term Evaluation In accordance with Article 42 of Council regulation (EC) No 1260/1999, the midterm evaluation was carried out under responsibility of the Managing Authority in co-operation with the Commission. The mid-term evaluation examined the initial results of the Programme and was carried out by an independent assessor, submitted to the Programme Monitoring Committee and sent to the Commission prior to 31 December 2003. The Commission reviewed this evaluation, made appropriate recommendations all of which were taken on board by the Managing Authority and implemented. Further details can be obtained through the following links: BSP mid Term Evaluation 2002 , BSP mid Term Evaluation Report Update 2005 3.12 The Performance Reserve Article 44 of the general Structural Funds Regulation makes provision for a ‘Performance Reserve’ and sets out the mechanisms for determining the distribution of that reserve. This was linked to the findings of the mid-term evaluation – details of which are available through the above link. 70 BUILDING SUSTAINABLE PROSPERITY PROGRAMME VERSION 3 3.13 Electronic Data Exchange The Managing Authority set up and operates a computerised system gathering reliable data required for the management, monitoring and evaluation of the Community assistance. The guidelines and recommendations provided by the Commission were used in the development of this system to ensure compatibility with the Electronic Data Exchange requirements. Information was collected and codified at project level for the Operational Programme. The system was designed to support programming, financial and physical monitoring and the making and monitoring of payments through a central database. All financial and physical progress information, appropriately codified, is relayed electronically to the Commission by the Managing and Paying Authorities. The frequency of electronic transmission conforms to the management requirements as agreed between the Commission and the Managing Authority. This system became operational at the end of 2001. 3.14 Ex-post Evaluation In accordance with Article 43 of Council regulation (EC) No 1260/1999, the expost evaluation will be the responsibility of the European Commission, in collaboration with the UK with and the Managing Authority. It will cover the utilisation of resources and the effectiveness and efficiency of the Programme and its impact and will draw conclusions regarding policy on economic and social cohesion, the success or failure of implementation, achievements and results, including their sustainability. 3.15 Major Projects and Global Grants There were 2 major projects: 1. Gas Pipeline. 2. Classroom 2000 Full details of these projects are available in Annex 6. 71 BUILDING SUSTAINABLE PROSPERITY PROGRAMME VERSION 3 CHAPTER 4: FINANCIAL CONTROL Paying Authority The Department of Finance and Personnel was designated as the ERDF Paying Authority and was responsible for drawing up and submitting certified payment applications and receiving payments from the Commission in accordance with the requirements of Article 9(0) of Council Regulation (EC) No 1260/1999. It has fulfilled all relevant functions in accordance with Article 32 and in the carrying out of the task of Paying Authority there was a clear separation of duties between the Managing and Paying Authority although staff engaged in both were located in the same building. In the early years of the programming period (up to 2003) a spreadsheet-based system was used to collate expenditure information from Implementing Bodies for inclusion in claims. This was then summarised by year and Measure and transcribed on to the Commission’s SFC Database. During the systems audit visit, DG Regio auditors recommended that all payment application information should be extracted from a fully computerised system, since spreadsheets were regarded as a manual system. Over a period of months in early 2004 a computer system was then developed to gather reliable financial and statistical information on implementation. Records were kept electronically and common information provided for all projects. The system was used as the basis for all payment applications submitted to the Commission since November 2004. In accordance with Article 32(1), the Paying Authority ensured that Final Beneficiaries received payment in full. In compliance with of Article 32(3,4) of the General Regulation on Structural Funds, the ERDF Paying Authority drew up and certified the interim and final payment applications at the level of each Measure by year. 72 Payment BUILDING SUSTAINABLE PROSPERITY PROGRAMME VERSION 3 applications were converted from sterling to euro in compliance with Commission Regulation (EC) No. 643/2000 and detailed records were maintained by the Paying Authority for each payment application. Electronic Data Exchange Following discussion with Commission auditors regarding a computerised system for generating payment applications, the Paying Authority undertook a major exercise in conjunction with the provider of the Central Database to establish a system for extracting financial data for use in claims. After a number of months spent in reconciling existing claim information and populating the newly created drawdown area of the Database, the system for generating payment applications became operational from November 2004 and has been used for all claims submitted since that date. Article 10 verifications database A further enhancement of the electronic system was commissioned by the Paying Authority in 2005 to enable the extraction of data in respect of verification visits carried out under Article 10 of Commission Regulation (EC) No 438/2001. Details of expenditure declared and the value of expenditure examined and verified – together with a summary of findings – are held on the system and used by the Paying Authority as one of the sources towards providing assurance on the regularity of expenditure being used for claims. This became operational in April 2006. Full details of the financial controls applied to the Programme are provided in the Chapter covering the Operational Context. N+2 discipline Council Regulation (EC) No 1260/1999 Article 31 (2) requires that claims from the Commission must be made within 2 years of the year of the commitment. Known as the N+2 rule (N = year of commitment, +2 = end of the second year 73 BUILDING SUSTAINABLE PROSPERITY PROGRAMME VERSION 3 following the year of commitment). The late approval of the BSP Operational Programme in March 2001 meant that N+2 did not come into operation until end December 2003. During the life of the Programme no decommitments were made by the Commission under the n+2 rule. Eligible expenditure declared Table 1 below provides a summary of the overall expenditure declared to the Commission in claims against the allocations for ERDF for the period 2000 2006. Table 1 All amounts shown in € Allocation in Programme Complement Expenditure Declared in claims to the Commission EU Amount Public Amount Private Total 537,129,400.00 250,818,000.00 300,000.00 788,247,400.00 531,674,745.99 252,814,933.07 378,942.72 784,868,621.78 Expenditure declared as % of available EU Allocation Table 2 on the following page provides a further breakdown of expenditure declared against allocations by year is shown in the table below – it should be noted that, while ERDF Funding was allocated until 2005 only, expenditure has been declared for the full period of the Programme – hence later years where there is no allocation against the declared expenditure and corrections made in 2008 and 2009. 74 99.57 BUILDING SUSTAINABLE PROSPERITY PROGRAMME VERSION 3 Breakdown of expenditure by year. Table 2 Breakdown of expenditure declared by year against financing plan Overall Total Allocation in Programme Complement Expenditure Declared in claims to the Commission Expenditure declared as % of available EU Allocation EU Amount Public Amount Private Total 537,129,400.00 250,818,000.00 300,000.00 788,247,400.00 531,674,745.99 252,814,933.07 378,942.72 784,868,621.78 99.57 EU Amount Public Amount Private Total Expenditure declared as % of available EU Allocation 116,293,000.00 57,243,000.00 72,500.00 173,608,500.00 30,432,785.49 10,929,888.83 0.00 41,362,674.32 26.17 Total Expenditure declared as % of available EU Allocation By Year 2000 Allocation in Programme Complement Expenditure Declared in claims to the Commission EU Amount 2001 Allocation in Programme Complement Expenditure Declared in claims to the Commission Public Amount Private 106,152,000.00 51,365,000.00 65,700.00 157,582,700.00 54,969,577.89 21,098,143.30 0.00 76,067,721.19 51.78 Total Expenditure declared as % of available EU Allocation EU Amount 2002 Allocation in Programme Complement Expenditure Declared in claims to the Commission Public Amount Private 96,654,000.00 47,075,000.00 57,300.00 143,786,300.00 68,760,937.04 34,245,413.99 0.00 103,006,351.03 71.14 Total Expenditure declared as % of available EU Allocation EU Amount 2003 Allocation in Programme Complement 89,669,000.00 Public Amount Private 43,620,000.00 52,900.00 75 133,341,900.00 BUILDING SUSTAINABLE PROSPERITY PROGRAMME VERSION 3 Expenditure Declared in claims to the Commission 87,789,430.02 EU Amount 2004 Allocation in Programme Complement Expenditure Declared in claims to the Commission Total Expenditure declared as % of available EU Allocation 32,400,500.00 33,500.00 109,590,200.00 123,994,310.17 59,403,443.32 21,691.88 183,419,445.37 160.71 Total Expenditure declared as % of available EU Allocation Public Amount Private 51,205,200.00 19,114,500.00 18,100.00 70,337,800.00 87,121,227.61 38,929,212.01 16,647.75 126,067,087.37 170.14 Public Amount Private Total Expenditure declared as % of available EU Allocation 0.00 0.00 0.00 57,131,626.89 26,115,949.94 213,333.91 Public Amount Private 0.00 0.00 0.00 21,608,494.25 14,178,075.54 123,879.85 EU Amount 2008 Allocation in Programme Complement Expenditure Declared in claims to the Commission 97.90 77,156,200.00 EU Amount 2007 Allocation in Programme Complement Expenditure Declared in claims to the Commission 135,718,234.90 Private EU Amount 2006 Allocation in Programme Complement Expenditure Declared in claims to the Commission -16,806.48 Public Amount EU Amount 2005 Allocation in Programme Complement Expenditure Declared in claims to the Commission 47,945,611.36 Public Amount Private 0.00 0.00 0.00 -99,667.35 -16,248.37 20,195.81 76 0.00 83,460,910.74 Total Expenditure declared as % of available EU Allocation 0.00 35,910,449.64 Total 0.00 -95,719.91 Expenditure declared as % of available EU Allocation BUILDING SUSTAINABLE PROSPERITY PROGRAMME VERSION 3 EU Amount 2009 Allocation in Programme Complement Expenditure Declared in claims to the Commission Public Amount Private Total 0.00 0.00 0.00 0.00 -33,976.02 -14,556.85 0.00 -48,532.87 Expenditure declared as % of available EU Allocation The above Table demonstrates that the ERDF element of the Programme achieved expenditure of 99.57% of the available allocation leaving a small (0.43%) underspend at closure. Note: “Expenditure Declared in claims to the Commission” in the Table above refers to interim payment applications submitted to the Commission by the ERDF Paying Authority The expenditure declared is further broken down by Field of Intervention in the following table where minor differences are attributable to rounding: Table 3 All figures shown in Meuro (€m) Priority / Measure Total Measure Value 1 Total Eligible Actually Paid & Certified Expenditure 2 % of Eligible Cost Field of Intervention 3+2/1 PRIORITY 1 Measure 1.1 Measure 1.2 Measure 1.3 Measure 1.4 Measure 1.5 110.587 85.253 62.600 80.000 15.667 105.563 86.916 62.084 72.530 14.570 95.46% 101.95% 99.18% 90.66% 93.00% Measure 1.6 Measure 1.7 113.767 38.973 115.631 40.291 101.64% 103.38% Measure 1.8 PRIORITY 2 Measure 2.5 PRIORITY 3 Measure 3.1 Measure 3.2 Measure 3.3 22.173 22.268 100.43% 161 (11%), 163 (71%),164 (18%) 181 (20%), 182 (80%) 171 (41%), 172 (14%), 173 (45%) 163 (25%), 164 (75%) 153 (30%), 163 (30%), 324 (40%) 311 (6%), 312 (69%), 317 (19%), 318 (6%) 312 (75%), 322 (25%) 331 (95%), 332 (2.5%), 333 (2.5%) 122.028 124.350 101.90% 23 (100%) 50.156 2.830 6.574 49.716 2.678 7.147 99.12% 94.63% 108.72% 35 (100%) 36 (100%) 36 (100%) 77 BUILDING SUSTAINABLE PROSPERITY PROGRAMME VERSION 3 Measure 3.4 PRIORITY 5 11.340 11.359 100.17% 22 (100%) Measure 5.1 TECHNICAL ASSISTANCE 62.149 65.588 105.53% 181 (1%), 343 (1%), 344 (55%), 345 (37%), 1306 (2%), 1312 (4%) 4.150 788.247 788.247 4.179 784.870 784.870 100.70% 99.57% 99.57% Measure 6.1 TOTAL ERDF RELATED Priority 1 Regions receiving Transitional Support Priority 2 Regions receiving Transitional Support Priority 3 Regions receiving Transitional Support Priority 5 Regions receiving Transitional Support Priority 6 Regions receiving Transitional Support 529.020 519.853 98.27% 122.028 124.350 101.90% 70.900 70.900 100.00% 62.149 65.588 105.53% 4.150 4.179 100.70% TOTAL 788.247 784.870 99.57% 411 (34%), 412 (13%), 413 (13%), 414 (13%), 415 (27%) Payments from European Commission Payments received from the European Commission total 510,272,929 euros which represents the 95% limit for payments prior to settlement of the final claim. Details of receipts are set out in the following table: Table 4 DATE PAYMENT AMOUNT CUMULATIVE TOTAL 23.07.2001 35,245,630.00 35,245,630.00 24.10.2002 183,465.00 35,429,095.00 08.01.2003 77,579,319.00 113,008,414.00 26.02.2003 26,814,864.00 139,823,278.00 16.04.2003 9,092,362.00 148,915,640.00 24.10.2003 14,113,996.00 163,029,636.00 10.02.2004 66,564,259.00 229,593,895.00 28.12.2004 11,519,892.00 241,113,787.00 18.03.2005 80,011,547.00 321,125,334.00 07.06.2005 5,492,446.00 326,617,780.00 78 BUILDING SUSTAINABLE PROSPERITY PROGRAMME VERSION 3 16.11.2005 11,457,731.00 338,075,511.00 16.12.2005 47,158,111.00 385,233,622.00 10.02.2006 43,226,522.00 428,460,144.00 10.05.2006 10,292,587.00 438,752,731.00 16.05.2006 5,359,167.00 444,111,898.00 16.01.2007 47,427,710.00 491,539,608.00 16.04.2007 7,587,627.00 499,127,235.00 10.07.2007 5,812,016.00 504,939,251.00 18.09.2007 5,333,678.00 510,272,929.00 The payment dated 23.07.2001 represents the 7% advance payment from the Commission. Due to the operation of the Government banking arrangements no interest was earned on this advance. Income and Revenue None of the ERDF activities earned income or revenue, therefore no reduction was necessary in compliance with Rule 2 of the Annex to Commission Regulation (EC) No 1685/2000 as amended by Commission Regulation (EC) No 448/2004. Unfinished Projects At closure no projects were unfinished and none were suspended due to legal action, therefore no projects funded under the 2000 – 2006 round will be carried forward for further funding under the 2007 – 2013 funding period. Financial Controls applied to the Programme In the UK, the treatment of Structural Funds expenditure is based on the principle that receipts from the Commission should be managed, disbursed and monitored in exactly the same way and using the same systems as the UK’s own public expenditure. The basic principles of the UK Government Accounting apply to these receipts which are:- 79 BUILDING SUSTAINABLE PROSPERITY PROGRAMME VERSION 3 • Parliamentary scrutiny and accountability; • the identification of an Accounting Officer responsible for the funds under his or her control; and • a statutory basis for all expenditure, whether from National or EC source. A feature of the UK public sector financial management and control is the obligatory requirement to submit all public expenditure operations to periodic audits. This covers both the financial systems in operation and an annual audit of specific payments made by the Member State. Financial control is further maintained through the separation of duties between those responsible for the certifying and authorising of payment claims, to safeguard against the possibility of personal involvement in a project or fraud. Treatment of receipts Payments from the Commission in respect of operations part-financed by the Structural Funds are received in a Treasury Account at the Bank of England, where they are converted into sterling and subsequently transferred via the Northern Ireland Office to DFP’s PMG Account, where each fund is separately identified. In order to facilitate the verification of expenditure by Community and National control authorities, the Member State ensured that all bodies involved in the management and implementation of Structural Fund operations maintained either a separate accounting system or an adequate accounting codification capable of providing detailed and complete summaries of all transactions involving Community Assistance. Control Arrangements All monies from the European Union are treated in the same way as national funding for the purposes of financial management and control, as well as being subject to EU Regulations. In line with the DFP’s handbook on Government 80 BUILDING SUSTAINABLE PROSPERITY PROGRAMME VERSION 3 Accounting in Northern Ireland (GANI), European Division produced a Structural Funds Manual which set out the main aspects of NI Structural Funds administration so there was a consistency of treatment both within and between Departments and other Implementing Bodies. Banking Arrangements Nominated Departments and nominated delegated authorities issued offers of their respective Structural Funds grants and received payment claims from the Final Beneficiaries to which they had issued offers. All payment claims were checked and backed up by invoices or other accounts documents against the offer of grant and the project papers and ensured consistency with the performance targets set and eligibility. If satisfactory, they were authorised and paid out on the basis of actual eligible expenditure incurred. Use of Euro and Conversion Rates In accordance with Article 33, all statements of expenditure and payment applications submitted to the Commission were made in euros. Since the United Kingdom does not have the euro as its national currency, amounts of expenditure incurred in sterling were converted into Euros by applying the rate in force on the last but one working day at the Commission in the month preceding the month during which the expenditure was recorded in the accounts of the Paying Authority. Control Activities Within Northern Ireland, the Department of Finance and Personnel (DFP), in accordance with Article 38(1)(a) and 38(1)(c), established financial management and control arrangements for BSP in such a way as to ensure that ERDF Programme funds are used efficiently and correctly and assistance is managed in accordance with all the applicable Community rules and in accordance with the principles of sound financial management. The detailed requirements set out in Commission Regulations (EC) No 438/2001, (EC) No 448/2001 have been applied throughout the life of the Programme. 81 BUILDING SUSTAINABLE PROSPERITY PROGRAMME VERSION 3 Article 5 Statement The document outlining the management and control systems for Northern Ireland (Article 5 description) was submitted to the Commission in 2001, a copy of which can be found in the DFP website, http://www.dfpni.gov.uk. Financial Control activities were developed and enhanced as detailed below during the life of the Programme in liaison with all Fund Paying Authorities, Article 10 Teams, Heads of Internal Audit and subject to the direction of the Managing Authority. Guidance notes were issued as detailed in the following paragraphs. Article 4 - Management checks Management checks in compliance with Article 4 of EC Regulation 438/2001 were carried out on all projects across the Programme. These comprised desk checks of claims and on-the-spot visits. A formal checklist was developed for onthe-spot visits to ensure consistency of approach across the Programme. A copy of the checklist can be found in Annex 4. The Managing Authority reviewed progress in this area at its bi-annual meetings with Implementing Departments. Early detection of issues through this control mechanism provided an opportunity to refine and clarify processes/letter of offers in order to avoid more serious issues occurring in the latter stages of the projects. Further information on the implementation of these checks is included in relevant measure reports. During 2007, the Managing Authority in response to issues highlighted during the ERDF follow up audit, by DGREGIO auditors, reviewed and enhanced the Article 4 Guidance and Checklist to move away from a “tick box” exercise to the more qualitative evidence/comments based approach. Revised guidance was issued across the programme in September 2007. A copy of the updated checklist can be found in Annex 2. 82 BUILDING SUSTAINABLE PROSPERITY PROGRAMME VERSION 3 The outcome of work from all Article 4 checks was shared with Article 10 Verification Teams in order to inform their process of selection of projects and reported in the annual control report (Article 13). Article 10 - Verification Checks The Managing Authority was responsible for establishing appropriate arrangements ensuring that the 5% verification checks were undertaken on total eligible expenditure across the BSP Programme in accordance with Article 10 of Commission Regulation (EC) No 438/2001. In determining these arrangements, appropriate separation of tasks were put in place to demonstrate the independence of these checks, i.e. those carrying out the checks were separate from those implementing the actions under the Programme and from those involved in payment procedures. The actions of the bodies carrying out the verification checks were subject to scrutiny by independent Departmental Internal Audit Units. Guidance Notes were issued together with a detailed checklist outlining the minimum coverage required to meet the regulations and Verification Teams were instructed to extend checking as necessary – based on their findings. A copy of the Guidance Note and checklist can be found in Annex 3. In meeting these local arrangements the overall percentage of declared expenditure, for ERDF Measures checked under Article 10 requirements was 11.98% at the end of 2008. The latest position of 15.32% (as at August 2009) is significantly above the 5% required by the Regulation. From this control work the error rate across ERDF related measures is calculated to be 26.53% as explained at the end of Table 5. Detailed Measure information is included in the relevant implementation section. Findings from Article 10 checks indicated that, while some enhancement of existing controls was necessary only a small number of potentially systemic weaknesses have been reported. This is covered in more detail in the relevant implementation section. 83 BUILDING SUSTAINABLE PROSPERITY PROGRAMME VERSION 3 Copies of all completed Article 10 reports were made available to the respective Fund Paying Authorities, the relevant Implementing Body, Heads of Internal Audit and the Managing Authority. A computerised system to record details of Article 10 activity, provide a summary of findings and recommendations and maintain details of the percentage of eligible expenditure examined and verified was developed as an additional area on the Central Database, and became operational in 2006 (with data from previous reports uploaded). It has proved to be a valuable tool in the follow up of recommendations made and general monitoring of Article 10 reporting. It has also assisted in ensuring that Interim Payment applications were based on effective financial control systems and also facilitated the Closure process. For ease of reference, details of expenditure declared and examined under Article 10 are shown in the following table: Table 5 1.1 1.2 1.3 1.4 1.5 1.6 1.7 1.8 Priority 1 2.5 3.1 3.2 3.3 3.4 Priority 3 5.1 6.1 Amount Examined (£) 6,495,277.19 5,789,930.83 5,571,380.96 3,764,067.17 687,729.87 15,359,708.73 4,039,572.62 6,343,853.46 48,051,520.83 21,871,471.94 2,728,166.81 148,056.46 390,969.61 1,494,797.60 4,761,990.78 6,932,392.58 706,515.62 Amount Declared (£) 69,339,212.38 58,851,396.82 41,471,020.28 50,565,153.56 9,913,770.60 79,438,165.28 27,773,436.94 15,237,593.35 352,589,749.21 89,753,338.41 35,622,428.00 1,818,932.28 4,958,999.69 7,818,639.00 50,218,998.97 43,286,350.68 2,838,284.99 % Examined 9.37 9.84 13.43 7.44 6.94 19.34 14.54 41.63 13.63 24.37 7.66 8.14 7.88 19.12 9.48 16.02 24.89 Amount Vouched (£) 6,070,395.62 5,225,253.95 5,329,122.36 3,670,832.41 534,788.97 15,359,708.73 3,989,572.62 6,339,489.35 46,519,164.01 21,101,192.10 2,728,166.81 145,791.20 388,182.81 1,494,710.65 4,756,851.47 6,932,392.58 706,515.62 Overall 82,323,891.75 538,686,722.26 15.28 80,016,115.78 Measure Error Rate 6.54 9.75 4.35 2.48 22.24 0.00 1.24 0.07 3.19 3.52 0.00 1.53 0.71 0.01 0.11 0.00 0.00 Information verified as at 5.3.2010 “Amount declared” in the Table above is the Sterling value of interim payment applications submitted to the Commission by the ERDF Paying Authority 84 2.80 BUILDING SUSTAINABLE PROSPERITY PROGRAMME VERSION 3 In relation to Measure 2.5 there is an artificially high error rate shown (92.06%) because verification work was incomplete at time of preparation of this Report. Work is ongoing by the Verification team in Department of Education in respect of Measures 2.5 and 3.4 and further updates will be provided when available. Internal Audit Arrangements The Head of the Departmental Internal Audit Branch of DFP is responsible for the declaration referred to in Article 15 of Commission Regulation 438/2001 which summarises the conclusions of the checks and gives an assessment of the validity of the application for payment of the final balance and the legality and regularity of the transactions covered by the final certificate of expenditure. The Internal Audit Units of DETI, DEL, DE, DFP, DRD and DSD act as coordinators for the subsidiary declarations from their respective Departments with regard to the provision of the assurance for ERDF. The individual Departmental Internal Audit Units act in a joint way to maximise effectiveness and consistency eliminate duplication and develop best practice. Meetings, chaired by DFP, were held on average twice each year with the Departmental Heads of Internal Audit to ensure consistency of approach to EU audit issues and more recently to agree and implement the closure process. All Internal Audit activities resulted in unqualified opinions and further details are shown – broken down by Measure – in Annex 12 attached to this Report. External Audit activity A number of ERDF audit visits were conducted by DG REGIO auditors in the period 2001–2007 including an initial systems audit (covering BSP and Peace II) in September 2001 with a follow-up visit in 2003. Findings from this visit led to the development of the formal Article 4 Guidance and the commencement of work on the electronic drawdown processes using data from the Central database. (Annex 2). There were further ERDF audits carried out on the BSP Programme in June 2005 and again in September 2007 to follow up on findings from the original 85 BUILDING SUSTAINABLE PROSPERITY PROGRAMME VERSION 3 ERDF systems audit. The initial findings from the June 2005 visit were reported in February 2006. These included issues around the ‘trigger points’ in DETI projects, designation of ‘Classroom 2000’ expenditure as a major project and the fires at NITB offices causing loss of some original documentation. In addition DGREGIO auditors carried out an individual project audit visit in 2006 where issues around KTP and Business Start funding and transparency of expenditure were raised. The findings of these audits are not yet formally complete and updates will be provided as this happens. In response to the ‘trigger points’ issue, it was agreed that DETI’s Internal Audit would carry out sample exercises on the eligibility of expenditure claimed to date to provide reassurance to the Commission. Terms of Reference specific to this exercise were agreed with DGREGIO auditors and the outcome of the work shared with them to bring the issue to conclusion. The Managing Authority excluded expenditure under these Measures from drawdowns until the audit issues were satisfied. This additional verification work in agreement with DG REGIO auditors was reported to the Commission. A copy of the details of all audit findings can be found in Annex 6. Audit recommendations to have Classroom 2000 (C2k), in Measure 2.5, designated a ‘major project’ were taken through the application process during 2006 resulting in a Commission Decision in December 2006. Categorisation of eligible expenditure within the decision required a re-examination and correction of expenditure declarations already made for the project and the bringing forward of further eligible expenditure to complete measure expenditure. DE identified the required adjustments to the expenditure declared under this project and alternative expenditure to replace items now considered ineligible. The Managing Authority and the Implementing Body worked on this issue to ensure that the remaining expenditure from this Measure was included in the expenditure certification process in a timely manner. The Managing Authority provided a formal response to the 2007 follow up audit on 10th October 2007 and further responses were provided – the latest submitted in March 2009. There were 19 outstanding findings, it is hoped with the 86 BUILDING SUSTAINABLE PROSPERITY PROGRAMME VERSION 3 additional information supplied by the Managing Authority, these will be reduced however final formal feedback from the Commission is unlikely to be received before the Regulatory deadlines for closure and this matter will be updated as part of the final BSP Programme report due in 2010. No formal Programme audits were carried out by the Northern Ireland Audit Office, the European Court of Auditors or OLAF auditors on ERDF expenditure in the BSP Programme. Article 13 - Annual Control Reports Co-ordinated reports under Article 13 of Commission Regulation (EC) No 438/2001 on financial control were prepared and submitted within the required deadline of 30th June each year. Separate reports for each of the four Structural Funds were provided. The reports were made widely available on the EUD website following clearance procedures with the Commission. This link will take you to published reports - Article 13 Reports. Irregularity Reporting Implementing Departments were also responsible for investigating and drawing up reports on any irregularities declared. Details were forwarded to DFP, which were responsible for notifying irregularities to the Department of Trade and Industry now (BERR) in compliance with the requirements of Commission Regulation (EC) No 1681/1994 as amended by Regulation No 2035/2005 on Structural Funds. Annex 10 provides details of irregularities reported up to the date of this report. In addition to providing guidance on the treatment and reporting of irregularities, DFP organised two information seminars for Implementing Body staff to explain the requirements and share best practice. At the Commission’s request, the audit authorities within Member States carried out a review of irregularity reporting systems and the system operated by DFP was examined by the Northern Ireland Audit Office (NIAO) as part of the UK Member State report. Their findings were positive and highlighted many good practices employed by DFP. These were subsequently published as a good practice guide by NIAO and circulated widely in Northern Ireland. 87 BUILDING SUSTAINABLE PROSPERITY PROGRAMME VERSION 3 Initially the threshold for reporting irregularities was set at €4000 this increased, with the new Regulation, in 2006 to €10,000 (EU element). Annex 15 summarises 234 ERDF cases reported during the Programme period which have all been closed. Before the introduction of the new irregularity Regulation all information was recorded in national currency, therefore the total value of irregularities and recoveries was reported in £ Sterling. A notional Euro value has been calculated based on the date the irregularities were reported to OLAF. Table 6 below provides further details. Included in these cases were irregularities discovered before payment was made or raised as part of closure pending further investigation and reported for information as ‘amount at risk’ with no recovery necessary. Total EU element of irregular expenditure for the period 2003 – 2009 was €122,308,729.55 (including amounts ‘at risk’) and was reported to OLAF. In total 6,102 cases which fell below the reporting threshold or were due to an administrative error were recorded and therefore were not included in any claim to the Commission. The ERDF involved in recorded cases amounted to £118,884,338.55 with a 100% recovery rate. 88 BUILDING SUSTAINABLE PROSPERITY PROGRAMME VERSION 3 Table 6 2000 – 2005 (20 cases – all closed with full amount recovered) € Euro EU Amount Total Amount Reported 736,619.00 1,089,956.51 Recovered 736,619.00 1,089,956.51 0.00 0.00 To be recovered Note: For 2000 – 2005 irregularities were reported in £ Sterling as required by the Commission Regulations – a Euro value has been calculated based on the date reported 2006 – 2009 (214 cases – all closed with full amount recovered or withdrawn) € Euro EU Amount Total Amount Reported 121,572,110.55 230,594,090.44 Recovered/ 121,572,110.55 ---- 0.00 ---- withdrawn To be recovered Closure Following the issue of the Commission Closure guidance in August 2006, the UK issued Operational Closure guidance to all Regions. Following on from this in October 2007, DFP/EUD issued a Northern Ireland version of this operational closure guidance, covering BSP, PEACE II and the Community Initiatives. The complete closure guidance pack comprising the operational guidance and audit methodology for closure was issued to Implementing Departments and copied to Heads of Audit and was copied to DGREGIO Auditors for information. The guidance outlined the requirements and timescales for closure documentation, with subsequent amendments and updates issued as and when required. DFP/EUD met regularly during the closure process with staff from the operational side of Implementing Departments as part of an operational working group, to 89 BUILDING SUSTAINABLE PROSPERITY PROGRAMME VERSION 3 review progress towards gathering the required information. Separate meetings were held with Departmental Heads of Internal Audit in their role as Article 15 body, providing audit assurance on expenditure declared in the ERDF. In addition DFP/EUD monitored the Central database to ensure all expenditure was recorded for use in claims, Article 4 checks were carried out and the targets for Article 10 checking were being met. 90 BUILDING SUSTAINABLE PROSPERITY PROGRAMME VERSION 3 CHAPTER 5: OVERVIEW OF PRIORITIES Overview of Priorities The Building Sustainable Prosperity (BSP) Programme is Northern Ireland’s largest single European programme, in financial terms, for the funding period 2000-2006 – the ERDF element is worth close to €800million. The overarching aim of BSP is to move Northern Ireland to a state of sustainable prosperity in a competitive modern economy by focusing on the restructuring of its businesses and the key skills development of its people while maintaining a quality environment. The focus of the ERDF element in Priority 1 of the Programme is economic growth and competitiveness. This priority has funded over 3,000 SMEs (Target 3,600) whilst creating close to 18,095 gross jobs (Target - 8,400) in the process. In addition, the Local Economic Development measure (M1.4) developed 26 district council action plans which resulted in 926 businesses being created as well as 4,072 jobs. In addition, 250,000 square feet of workspace has been created. The R&D element of this Priority has been a very successful measure and should ensure that Northern Ireland goes some way to raising its level of R&D. The Tourism element of the priority has for the most part surpassed its targets resulting in increased visitors and visitor spend. Information technology and telecommunications targets have been met or surpassed ensuring that Northern Ireland will be able to compete in the world marketplace. An element of Priority 2 delivered ICT services to schools ensuring that children are skilled in ICT and computer usage for when they reach the workplace. The energy infrastructure element has met its target for the North/West gas pipeline as well as those for energy efficiency projects. 91 BUILDING SUSTAINABLE PROSPERITY PROGRAMME VERSION 3 The transport element of Priority 1 has met or exceeded the majority of its targets which should result in improved transport infrastructure and increased passenger services. It is important that Northern Ireland has the necessary transport networks to ensure it can be competitive in modern Europe. The ERDF element of the Programme also funded regeneration activities as well as community and voluntary organisations to help improve the social and economic conditions of deprived areas in Northern Ireland. This has been successful with employment opportunities increasing by 28% (before the economic downturn of mid-2008). Funding was also provided to enable almost 2,000 children to take up full-time and part-time nursery places, especially in deprived areas. The final aspect of the ERDF element of the BSP Programme is the environment. The programme funded 4 water treatment facilities and 2 waste treatment facilities which will ensure that Northern Ireland’s infrastructure is capable of dealing with an expanding economy. In addition a number of projects have been funded to increase awareness of the environment as well as ensuring that Northern Ireland takes a step forward in protecting and enhancing the environment for the future. In conclusion, it is obvious that the ERDF element of the BSP Programme has gone some way to creating a state of sustainable prosperity in a competitive modern economy by supporting businesses while supporting and maintaining a quality environment. In addition, the ERDF element has been complemented by the ESF, EAGGF and FIFG elements of the BSP Programme which has ensured that a joined up approach has been taken in the delivery of EU Structural Funds throughout 2000-06. 92 BUILDING SUSTAINABLE PROSPERITY PROGRAMME VERSION 3 Priority 1 – Economic Growth and Competitiveness The main targets for Priority 1 focus on assistance to SMEs, creation of jobs, R & D and tourism. Almost one quarter of the total value of this Priority can be attributed to activities assisting SMEs and directly creating jobs. Around 85% of the target set for SMEs supported has been met whilst the achievement against the target for gross jobs created has been more than doubled (Achievement – 18,095; Target – 8,400). There has been some doubt over the reliability of performance reported for Measure 1.1 previously but Invest NI put systems in place to accurately record outcomes. The R&D element of this Priority has progressed well with achievement against the target for projects being surpassed by 166% (Achievement – 762; Target – 286). The latest position for projects completing successfully, at 86%, is above its target of 80%. This has been a very successful measure and should ensure that Northern Ireland goes some way to raising its level of R&D. The Local Economic Development measure (M1.4) developed 26 district council action plans which resulted in 926 businesses being created as well as 4,072 jobs. In addition, 250,000 square feet of workspace has been created. Regarding the tourism aspect of this Priority, the 2001 foot and mouth outbreak and the events of September 11th had a significant impact on tourism activity in 2001 and 2002. However, the target number of marketing initiatives supported in key markets has continued to be achieved up to the end of the programme. The Tourism sector has also benefited from the creation of 5,920 gross additional jobs from the beginning of the programme until June 2006 whilst tourism pure visitor numbers have increased by almost 46% from the 2000 baseline. This demonstrates significant advancement for the tourism sector following the events of 2001. It is obviously not possible to attribute these achievements solely to the marketing initiatives funded by BSP and the ERDF. However, it is also obvious 93 BUILDING SUSTAINABLE PROSPERITY PROGRAMME VERSION 3 that marketing plays a key role in promoting Northern Ireland as a holiday destination and also in providing material for that purpose. Therefore, the BSP Programme has had an impact on this outcome. Additional indicator information at Measure level (Measure 1.3B) shows that under the accommodation element 664 bedrooms (750 programme target) have been developed from the 47 accommodation units supported. The units supported indicator has achieved just below its target of 50 but the new bedrooms achievement has fallen some way short. This reflects the final position in relation to physical achievements. The shortfall is explained by a different product-mix of the accommodation units actually supported than initially envisaged. When the targets were set, it was on the basis of supporting more hotels than happened. More of the accommodation units than expected, therefore, were supported within the B&B and guesthouse sector. As the cost of bed provision in this sector is higher per space created than in the hotel sector, fewer bed spaces could be provided overall with the available money. In addition to the tourism activities mentioned above, 15 visitor attractions have been enhanced or re-themed. This exceeds the target of 10 and is, again, a final position for this indicator. Whilst actual visitor numbers to these attractions have increased on average by 78%. Other elements of this Priority have also performed strongly. In Measure 1.5, Information Society, the targets regarding business awareness and business take-up of ICT technologies have largely been met. The targets for broadband coverage under Measure 1.7 Telecommunications have been met. In Measure 1.8 Energy Infrastructure and Energy Efficiency, only the North / West element received funding. The targets related to the North / South activity will not, therefore, be met for BSP. The second sub-Measure under 1.8, which provides support for energy efficiency activities, is also completed and has met its objectives. 94 BUILDING SUSTAINABLE PROSPERITY PROGRAMME VERSION 3 Under the roads and transport element of the Priority, three road by-pass schemes had been completed accounting for 12.4 km of new carriageway. The bypass schemes are located at Newtownstewart, Limavady and Comber. In addition, funding has been provided to strengthen the Foyle Bridge whilst a throughpass at Omagh was also completed. Under the transport infrastructure element of the Priority, work has been completed on 3 urban public transport projects, as well as one new rural bus station. Priority 1 Indicators Indicator Target Progress to end December 2008 Output Support to SMEs SMEs supported 3,600 Result Gross jobs created 8,400 Impact Net jobs created by new start up 2,940 within sectors) Impact Net jobs created by existing businesses 1,260 Not to be reported until end of programme Research and development projects supported 286 762 Result % of supported projects completing successfully 80% Impact Increase in Business Expenditure in R&D 15% 85.96% Not to be reported on until the end of the Programme 3,067 18,095 (10% new Not to be reported until end of programme Research and Development Output Tourism Output Result Impact Impact Marketing Initiatives supported per annum across key markets Over the period of the programme to create gross additional jobs in tourism Over the period of the programme to create 1,000 net additional jobs in tourism Visitor numbers to Northern Ireland as a holiday destination 15 1,400 1,000 Increase from 2000 baseline 23 marketing initiatives have been supported since 2000, with an average of 11 per annum 5,920 Not to be reported on until the end of the programme 480,000 visitors for the year (preliminary forecast) Source: DETI; EU Structural Funds Central Database 95 BUILDING SUSTAINABLE PROSPERITY PROGRAMME VERSION 3 Indicator Output Target Progress to end December 2007 Result Roads By-pass schemes Km of new carriageway 3 12.1 km Output Output Through-pass scheme Link Road Scheme 1 1 All 3 Bypasses completed 12.4km of new carriageway completed Complete Activity is not to be funded Output Bridge-strengthening scheme Strengthen structure to increase capacity to carry the maximum 40 tonne HGV vehicles. Also repainting and resurfacing the bridge. Reduced peak journey times 1 Complete Bridge capable of extra carrying capacity to meet future demand, which will see numbers of HGVs increasing from 2,700 per day to 3,200 per day over the next 10 years. Painting will provide required protection for next 20 years Rural Transport Infrastructure Increased Capacity Output Result Rural bus station project New passenger and staff facilities 1 1 rural station Impact Improvement in accessibility, social inclusion and more sustainable movement of people No target Output Result Impact Strengthening is complete. Painting is complete and Resurfacing is complete by an average of 35% for each scheme Newtownstewart Bypass = 47% Limavady Bypass = 32% Comber Bypass = 44.5% Bridge now has the capacity to deal with 40 tonne HGV vehicles and the expected future demand Lisburn Station was officially opened on 8 September 2008. 96 bus Lisburn Station was officially opened on 8 September 2008. Lisburn Station was officially opened on 8 September 2008. BUILDING SUSTAINABLE PROSPERITY PROGRAMME VERSION 3 Indicator Urban Infrastructure Target Progress to end December 2007 Transport 3 projects complete are now Urban bus depot projects Compliance with H&S standards and upgrade of urban bus depots More efficient movement of people and improved urban public transport system Enhancement of Services 3 3 3 3 Urban bus depots now complete and H&S compliant Introduction of Customer Information Service Innovative schemes to complement high-level strategies No target Project withdrawn 4 The accounting system has now gone live and is complete. No further schemes will be funded during this programme. Enhance and modernise the operation of integrated transport across Northern Ireland Source: DETI & DRD No target 8 trains purchased and associated infrastructure completed March 06. Output Result Impact Output Result Impact Projects are now compliant with H&S standards 97 BUILDING SUSTAINABLE PROSPERITY PROGRAMME VERSION 3 Priority 2 – Employment Under the ERDF element of this Priority, all targets have been met. All post primary and special schools now have new PCs and local area networks installed and are linked to a wide area network and system integrator providing a managed ICT service. This represents significant progress. This Measure is funded through ERDF and is worth some €122million. Priority 2 Indicators Result Impact Indicator Target All secondary schools (233) and special schools (48) to have new PC’s at a ratio of at least 1 PC to 9 pupils and local area networks installed and to be linked to a wide area network and system integrator providing a managed ICT service at a cost of £115.2m All schools to be utilizing the managed service providing curricular resources and internet access with broadband connectivity All pupils (155,000) will experience the use of ICT across all areas of the curriculum, including a range of applications and media and will spend, on average, 10% of the weekly timetable using ICT facilities to support learning across the curriculum 233 secondary schools and 48 special schools Progress to end December 2008 277 schools All schools 277 schools 155,000 pupils All pupils using ICT across all areas of the curriculum (161,000 pupils).10% of weekly timetable using ICT supported learning. Source: DE; EU Structural Funds Central Database 98 BUILDING SUSTAINABLE PROSPERITY PROGRAMME VERSION 3 Priority 3 – Urban and Social Revitalisation There were 7 Projects supported under Measure 3.1 accounting for all the funding. The first 5 projects dealt with the regeneration of an extensive inner city area within Belfast. The remaining two projects have impacted across 5 areas of Belfast, as well as in 18 other towns and cities across Northern Ireland through support for Jobs and Benefits Offices. Under the 2 projects relating to the Jobs and Benefits Offices, indicator information within Measure 3.1 shows that there have been significant achievements on the ground. The number of job / training enquiries / referrals has increased by 76% in the 23 supported offices from 2000 to 2004 when funding was completed. Over the same period the number of gross employment opportunities has increased by 28% in the supported offices whilst the number of people sent for training opportunities increased by 8%. In addition, there has been a reduction in the number of long-term unemployed in the 23 offices of 28% whilst the overall number of unemployed has dropped by 24% between 2000 and 2004. It is important to note that these changes cannot be entirely attributed to the supported Jobs and Benefits offices as other Government programmes, such as New Deal, and the general improvement in the Northern Ireland economy have also played a key role. Measure 3.1 has also funded a number of regeneration activities including the enhancement of 1,370 square metres of space at Cathedral Close in Belfast to create a versatile public performance area which caters for up to 1,000 people. The Old Bank Building in Royal Avenue, Belfast was refurbished to accommodate artists, crafts people and community organisations in flexible, high quality buildings. In addition, dredging activity for the River Lagan in Belfast was supported to improve the river environment and quality. Other activities for this Priority have seen funding allocated to organisations delivering services at a local. Under Measure 3.4, 55 nursery units (including Nursery Schools) have been constructed, resulting in the provision of some 99 BUILDING SUSTAINABLE PROSPERITY PROGRAMME VERSION 3 1,928 additional full time nursery places and up to 146 additional posts for teachers and classroom assistants have been created. Priority 3 Indicators Indicator Target Urban & Social Revitalisation Output Number of projects / organisations / schemes funded/assisted Increase in employment in local area No target Impact Evidence of a positive impact in the local area attributed to assisted projects / organisations / schemes No target Output Community organisations assisted 100 Result Number of support hours delivered over the life of the programme 2,000 Result No target 100 Progress to end December 2008 4 groups funded to March 2007. 3 further groups funded to September 2007. There was no activity in 2008 There are no statistics readily available on increase in employment arising from improved delivery of advice services – to be reported on for closure Post project evaluations show evidence of improved accessibility to advice services, particularly those with special needs. 17 sub-regional groups supported up to end of March 2007. The target for community organisations assisted has been significantly exceeded. This target has been significantly exceeded with over 20,000 direct support hours delivered from the start of the programme to March 2007. there was no activity in 2008 BUILDING SUSTAINABLE PROSPERITY PROGRAMME VERSION 3 Indicator Impact Evidence of sustainability in the community organisations assisted Target No target Source: DSD; EU Structural Funds Central Database 101 Progress to end December 2008 In addition to the sub regional support groups gaining sustainable funding from the Neighbourhood Renewal Programme and Regional Infrastructure Funding, 17 groups have secured sustainable mainstream funding from the Community Investment Fund. BUILDING SUSTAINABLE PROSPERITY PROGRAMME VERSION 3 Priority 5 – The Environment Progress in this Priority has been good under the infrastructure element with 4 water treatment schemes and 2 sewerage treatment schemes completed. The targets have been achieved/surpassed for all the output and result indicators under this element. The targets for average increase in the capacity of water treatment and sewerage treatment have also been met. The objectives under this element of the Measure will be met. Achievement under the sustainable environment projects element of this Priority has been good after a slow start. The projects funded cover a range of activities including waste management (5 projects including 1 for the 26 District Councils), biodiversity conservation (4 projects), built heritage conservation (1 project), environmental education and countryside access. These projects have resulted in a number of research papers and conclusions being disseminated, improved waste management (recycling rates have increased from 18.2% in 2004/05 to 28.8% in 2007/08), enhanced understanding of the Mourne environment, as well as the publication of information on the built heritage of Northern Ireland. Priority 5 Indicators Indicator Output Result Target Progress to end December 2008 Infrastructure Water treatment schemes % increase in capacity 3 4 Water Treatment Works complete. Average 30% Average 30% Impact Water Quality Improvement (variable up to 100%) No Target Water quality complies with EC Directive standards Output Sewerage treatment schemes % increase in capacity Effluent quality improvement (variable up to 100%) 2 2 Average 275% No Target Average 275% Effluent quality complies with EC Directive standards Result Impact Source: DRD; EU Structural Funds Central Database 102 BUILDING SUSTAINABLE PROSPERITY PROGRAMME VERSION 3 Indicator Output Result Result Impact Target Progress to end December 2008 Air quality project for the 26 District Councils in Northern Ireland Capital infrastructure projects to enable District Councils to measure, monitor and improve air quality 1 1 No Target Staff resource projects to enable District Councils in the carrying out of all appropriate air quality activities Contribute towards the achievement of national and EU air quality standards and objectives No Target 3 applications for relocation of existing equipment have been received. Other applications included requests for QA/QC and maintenance contracts for air quality monitoring data and equipment. All 26 district councils who applied requested staff costs for year 3 of the scheme. District councils are responsible for managing local air quality. This includes the identification of areas not likely to meet air quality objectives and the preparation of plans in pursuit of their achievement. BSP part funding is contributing towards enabling councils to achieve the requisite standards and objectives Source: DOE; EU Structural Funds Central Database 103 BUILDING SUSTAINABLE PROSPERITY PROGRAMME VERSION 3 CHAPTER 6: PRIORITY 1 6.1 Introduction Aims & Objectives The overarching aim of Priority 1 was “to produce a fast-growing, competitive, innovative knowledge-based economy where there are plentiful opportunities and a population equipped to grasp them”. To achieve this, the Priority was divided into 2 sub-Priorities aimed at (a) supporting business competitiveness comprising Measures 1–5 and (b) creating the conditions for regional competitiveness Measures 6-8. The diagram ‘Structure of Priority 1 showing sub-priorities’ overleaf illustrates this. Measures 1–5, 7 and 8 were implemented by the Department of Enterprise, Trade and Investment (DETI) through Invest NI (which brought together the functions of the former the Local Economic Development Unit (LEDU) the Industrial Development Board (IDB) and the Industrial Research and Technology Unit (IRTU)) and the Northern Ireland Tourist Board (NITB). Measure 6 was implemented by the Department for Regional Development was responsible for delivery of the Roads and Transport activity. Ten State Aids schemes were approved by the Commission in respect of activities assisted under Measures 1–3 of this Priority and these are detailed in paragraph 6.3. Details of the objectives and activities carried out under all of the Measures are found throughout this chapter. 104 BUILDING SUSTAINABLE PROSPERITY PROGRAMME VERSION 3 6.2 Implementation The following table shows the allocation and expenditure declared for Priority 1 with a summary by Measure. Priority 1 Allocations and expenditure declared – all amounts shown in Euro (€) EU Amount Public Amount Private Total Allocation 376,765,000.00 152,255,000.00 0.00 529,020,000.00 Expenditure Declared 370,210,530.63 149,641,797.10 0.00 519,852,377.73 Expenditure declared as % of available Allocation 98.26 Expenditure declared by Measure 1.1 79,171,769.83 26,390,840.14 0.00 105,562,609.97 1.2 65,186,439.67 21,729,075.56 0.00 86,915,515.23 1.3 46,500, 561.86 15,583,809.08 0.00 62,084,370.94 1.4 36,264,916.59 36,264,916.59 0.00 72,529,833.18 1.5 10,927,848.62 3,642,616.51 0.00 14,570,465.13 1.6 85,312,668.99 30,317,855.47 0.00 115,630,524.46 1.7 30,218,181.37 10,073,288.06 0.00 40,291,470.03 1.8 16,628,173.70 5,639,395.09 0.00 22,267,568.79 A total of 206 applications were approved under this Priority. 6.3 State Aid Schemes In conformity with its duties under Article 34(1)g of Council Regulation No 1260/1999, the Managing Authority, has kept the State Aid table below, updated and informed the Commission of any modifications. 105 BUILDING SUSTAINABLE PROSPERITY PROGRAMME VERSION 3 STATE AID SCHEMES IN ERDF MEASURES Priority and Measure No Title of the State Aid Scheme or Ad Hoc State Aid State Aid Number Approval Letter Reference Scheme Duration Selective Financial Assistance (LEDU/IDB) Provision of Sites and Standard Advance Factories N567/92 SG (94) D/3118 SG (94) D/3118 Ongoing Property Development Scheme (LEDU) Property Development Agreement (IDB) Shortfall Guarantee Scheme (IDB) N567/92 SG (94) D/3118 SG (94) D/3118 SG (97) D/2254 SG (91) D/2382 Ongoing SG (92) D/9899 C(2003) 2624 Ongoing Valid until March 2007 Ongoing Priority 1 Measure 1 Measure 1 Measure 1 Measure 1 Measure 1 N567/92 N567/92 NN58/92 Measure 1 Local Enterprise Agencies NN 80/89 (operating in Northern Ireland as Local Enterprise Development Unit (LEDU) Local Enterprise Programme (LEP) Measure 2 Science and Technology Programme (START) Product and Processes Development (COMPETE) Programme NN54/92 Measure 2 Small Firms Mentoring Awards for Research & Technology (SMART)* N280/99 SG (99) D/50888 Measure 3 Tourism Development Scheme in Northern Ireland N444/90 SG (90) D/28204 Measure 2 NN 92/95 106 Ongoing Ongoing Ongoing Redundant 2003-2008 BUILDING SUSTAINABLE PROSPERITY PROGRAMME VERSION 3 Structure of Priority 1 showing sub-Priorities Business Support Research and Development & Technology Transfer Supporting Business Tourism Competitiveness Sub-Priority 1(a) Local Economic Development Economic Growth and Information Society Competitiveness Priority Road & Transport Creating the Telecoms conditions for Regional Energy Competitiveness Sub-Priority 1(b) 107 BUILDING SUSTAINABLE PROSPERITY PROGRAMME VERSION 3 6.4 Measure details for Measure 1.1 - Business Support Background The aim of Measure 1.1 was to increase the size and competitiveness of Northern Ireland’s internationally competitive small business sector by means of targeted support to key business sectors and processes and development of regional business support networks, thereby increasing Northern Ireland’s export trade and the Northern Ireland GDP and to stimulate and promote the benefits of an enterprise culture and encouraging entrepreneurial activity. Implementation The overall value of this Measure was €110,586,667 which included an ERDF allocation of €82,940,000. Under this Measure 19 projects were approved: ¾ Measure 1.1(a) 10 ¾ Measure 1.1(b) 5 ¾ Measure 1.1(c) 4 Further details at the level of the sub-Measures can be found within the respective reports. A list of all projects for Measure 1.1 which incurred expenditure and the EU element can be found in Annex 5. Examples of Publicity Sample 2.pdf Sample 8.pdf Sample 3.pdf Sample 5.pdf Sample 1.pdf 108 Sample 6.pdf Sample 7.pdf BUILDING SUSTAINABLE PROSPERITY PROGRAMME VERSION 3 Assessment and summary of Achievements v Targets Details are available within the sub-Measure reports for 1.1(a), 1.1(b) and 1.1(c): Expenditure and Financial Control Total Expenditure declared for Measure 1.1 All amounts shown in € Allocation in Programme Complement Expenditure Declared in claims to the Commission EU Amount Public Amount Private Total 82,940,000.00 27,646,667.00 0.00 110,586,667.00 79,171,769.83 26,390,840.14 0.00 105,562,609.97 Expenditure declared as % of available Allocation 95.46 Article 4 Activity All projects were subject of at least one Article 4 check. Summary of Findings as a result of Article 4 Activity KPMG Consultants were engaged by DETI European Programmes Branch in 2006 to undertake an Article 4 check on Measures 1.1 to 1.3 using the standard checklist template. The key initial findings were: • Poor file maintenance. • Missing project files. • Article 4 checks outstanding/Incomplete Article 4 checklists. • Letter of Offer clauses. • Deficiencies in document storage arrangements. • Lack of EU Publicity. • Deficiencies in identification and reporting of irregularities. • Projects to complete Equality & Environmental Impact templates. 109 BUILDING SUSTAINABLE PROSPERITY PROGRAMME VERSION 3 As a result of these findings Invest NI formed an EU Compliance Team and a major exercise of remedial work was undertaken that fully addressed the issues identified. The report detailing this work has since been provided to and accepted by DG REGIO auditors. Article 4 checks were carried out retrospectively by Invest NI as part of the EU Compliance Exercise which began in February 2007. A standard checklist was used throughout, and the Client Executive signed off each individual checklist which was placed on the relevant project file. There were no control weaknesses identified. The findings of the KPMG review in 2006 highlighted that visits were incomplete and also that administrative issues needed to be addressed as a result. Action was then taken to ensure that all visits and checklists were completed. In addition to the Article 4 checks all Invest NI project claims had been subject to standard grant inspection procedures and controls as a matter of routine financial control. Article 10 Activity 9.37% of declared expenditure was examined under Article 10 revealing an error rate of 6.54%. Spread of Article 10 – 5% checks % checked 2000 2001 2002 2003 2004 3.88 8.01 5.39 24.37 5.69 2005 2006 2007** 2008 14.21 15.04 -1.34 0 ** see footnote on page 112 Summary of Findings as a result of Article 10 Monitoring This Measure is made up of three sub-Measures, M1.1(a), M1.1(b) and M1.1(c). Projects within sub-Measures 1.1(a) and 1.1(b) were affected by the payments by output rather than invoice, known as the “Trigger Point”, issue. Vouching had been postponed whilst a solution was being sought and in 110 BUILDING SUSTAINABLE PROSPERITY PROGRAMME VERSION 3 November 2006 a pilot exercise was carried out on a small representative sample of projects to investigate the issue, seek a solution and re-establish vouching. An initial sample of 10 projects was selected from the 451 projects identified. The selection was made using interval sampling and as expenditure after 2003 was under-represented in the initial selection, a further project was selected giving a total of 11 projects for the scoping exercise. Two of the selected projects, were not detailed on the database and were not declared for drawdown purposes. After this work and further discussions with the DGREGIO auditors during follow up audit agreement was reached in 2008 on how the necessary assurances on declared expenditure would be provided. As a result, the “Trigger-Point” related expenditure in the Pilot projects was disregarded and only the “non-Trigger Point” related expenditure that had been vouched to “actuals”, was deemed to count towards the final percentage. Following agreement with the DGREGIO auditors, the Verification Unit used the same sampling to select a further sample of projects. Twenty of these were subjected to a joint visit with the Invest NI Claims Inspector. During these checks, the actual expenditure that could be vouched to original documentation was subjected to a full Article 10 Inspection and this expenditure was counted towards the 5% target. A further two projects were selected in 2009 in order to satisfy the requirements to examine the main beneficiaries of the funding. Projects assisted under sub-Measure 1.1(c) related to the promotional work carried out on behalf of Invest NI. This included two Advertising campaigns the “Believe” and the “Go for it” campaigns. These projects were both selected for Article 10 Inspections and interval sampling was used to select the payments to be vouched from the claims submitted. 111 BUILDING SUSTAINABLE PROSPERITY PROGRAMME VERSION 3 Audit Activity Details of internal audit activity can be found in Annex 12 and details of Commission Audit findings are provided in Annex 13. Irregularities detected through Article 10 Checks Organisation / Project M1.1b EPS T/A Sam Evans UK Case No M1.1b Four Dee M1.1b Weld Tech M1.1b Moypark M1.1b Glanbia Cheese M1.1c Promotions Trigger Points Total irregularity £’s EU Element £’s Nature of irregularity (code) Date identified Date reported to EC Date cleared N/A 1,000.00 750.00 Recordable only 11/12/06 N/A N/A N/A 2,500.00 1,875.00 11/12/06 N/A N/A N/A 1,156.88 867.66 11/12/06 N/A N/A 27/06/09 302,115.78 226,586.84 Recordable only Recordable only 121 &210 31/12/07 07/05/09 Open 27/07/09 109,558.83 82,169.12 121 & 210 31/12/07 07/05/09 Open 18/05/09 7,595.43 5,696.57 121 & 325 31/12/07 07/05/09 Open 18/06/09 57,325.59 42,994.19 121 & 325 31/12/07 07/05/09 Open Irregularities A total of 43 irregularities were reported for this Measure all of which were cleared. Irregularities that were below the reporting threshold were recorded and details are in Annex 16. There were no projects were suspended due to legal or administrative proceedings. ** Footnote to 2007 Article 10 negative amount on page 110 The most recent adjustment takes account of irregularities such as VAT and output related payments. Irregularities in 2007 total £4,484,685 against eligible expenditure of £381,257, therefore, final expenditure in 2007 is stated as ─£4,103,428.08. This in turn implies a negative verification percentage, however as £54,899 total eligible expenditure was vouched in 2007, when calculated against 2007 payments, 14.4% was in fact vouched. 112 BUILDING SUSTAINABLE PROSPERITY PROGRAMME VERSION 3 Sub- Measure: - 1.1(a) – Business Support – Enterprise Aims and Objectives Traditionally there is a lack of enterprise culture within the Northern Ireland economy as evidenced by low start-up and economic activity rates. Northern Ireland also had the lowest VAT registration rate in the UK. At international level, entrepreneurial activity is positively correlated with economic growth, so by enhancing entrepreneurial activity, it was hoped that economic growth would follow. The objectives set for this Measure were: • to increase start-up activity with a specific focus on groups previously not well represented in self-employment or business ownership (e.g. women and people in the age groups of 45+) in sectors able to exploit global markets; • to stimulate and promote the benefits of an enterprise culture particularly the need to celebrate entrepreneurship and the success of local small businesses; • to provide a physical and support infrastructure to encourage entrepreneurial activity; and • to ensure that the skills and capabilities needed to start and develop a business are on the education “menu”. To meet these objectives, Invest NI deployed the following activities: i. develop a strategy for the creation of more sustainable business start-ups particularly those with the potential for high growth; ii. increase entrepreneurship awareness and start-up activity, particularly among under represented groups; www.bwnni.com being one example. The BWNNI Programme was funded under BSP ESF, however, Invest NI assisted in its promotion through the “Go for it” campaign which was ERDF funded. 113 BUILDING SUSTAINABLE PROSPERITY PROGRAMME VERSION 3 iii. identify gaps in the enterprise support network and engage in partnership initiatives to address these gaps, both in terms of infrastructure and in capacity building; iv. work with other Government Departments and relevant Organisations to raise awareness of the importance of business and entrepreneurship within the education system; v. pursue closer links with Universities, Science Parks, Centres of Excellence and other research based Organisations to accelerate the development of knowledge based businesses; and vi. ensure the provision of a range of financial support options (both public and private) to meet the needs of new business starts. Invest NI Schemes funded under this Measure were as follows: • Business Start Programme (renamed Start A Business Programme) • EMIS. • Pre Start Incentive. • Home Start, Accelerated Start. • Third Party Start. • Growth Start Up. • Regional Activities and Export Start. • Promotions. Implementation Ten applications were approved under this Sub-Measure. For 3 of the schemes – Business Start up, Third Party Support and Promotions expenditure was deemed irregular due to a lack of an audit trail. Expenditure in respect of these schemes has been removed from the database. All schemes progressed satisfactorily during the period of the Programme. Examples of strengths identified include the setting up of the Start a Business Programme and the good working relationships between Invest NI and their 114 BUILDING SUSTAINABLE PROSPERITY PROGRAMME VERSION 3 clients. There were no major difficulties encountered in the implementation of this Measure at Scheme or Project level. The Business Start Programme, subsequently renamed as Start a Business Programme (SABP) was set up to provide a package of mentoring assistance to potential entrepreneurs, targeting the local market place. It was the introduction of this Programme that contributed to this Measure meeting its target indicators in terms of business start-ups. Examples of Projects - Measure 1.1(a) Pumps and Fuel Installations Limited – This company is involved in the supply, installation and maintenance of fuel handling equipment from bulk storage facilities through to retain petrol forecourts. A major investment in 2006 enabled this firm to increase its capability and take advantage of growing export market opportunities by relocating to a purpose built factory at Invest NI’s Whiterock Business Park. Belfast Aircraft Stress Engineers – This Company based in Dundonald won the First Time Exporter of the Year Award 2005 hosted by Invest NI. The Company specialises in expert consultancy providing stress analysis and other services to the global aerospace industry and has worked on projects for the majority of the main aerospace companies including Boeing, Airbus and Bombardier. The success of this Company has showed that a smaller business can do very well with innovative products in a world class environment. 115 BUILDING SUSTAINABLE PROSPERITY PROGRAMME VERSION 3 Summary of Achievements V Targets for Measure 1.1(a) Original Indicator Position at Mid Term Evaluation Output 100 high growth potential businesses 242 created (of which 60 in high tech sectors) (1a) *3000 locally focused businesses created Result *700 Gross jobs (100 gross jobs) Revised Indicators Final Position *100 high growth potential businesses created (of which 60 in high tech sectors) 546(1) *3000 locally focused businesses created 14,332(2) 882 963 (52) *700 Gross jobs * (100 in high tech sectors) *6000 Gross jobs Impact 400 Net jobs (50 net jobs) 1323 *6000 Gross jobs * 550 (26) 400 Net jobs (50 in high tech sectors) 4,302 net employed (3) 2500 Net jobs 551 2500 Net jobs 18,630 net employed (4) 90% survival rate in assisted businesses after year 1 End of prog (5) End of prog (5) 70% survival rate in See note below assisted businesses after 3 years * Invest NI have been unable to obtain gross job figures at the end of this Programme. Invest NI only has one figure for job creation for each of the targets i.e. the number of jobs in these start up companies at 2007 – so it is a net change figure. 116 BUILDING SUSTAINABLE PROSPERITY PROGRAMME VERSION 3 The 2001 AIR, highlighted that for this measure, over 90% of the high growth potential businesses created target, had already been achieved (Target - 100 Position at the end of 2001- 91). By the end of 2003, and mid term evaluation, this target had been exceeded at 253 as highlighted in the AIR of that year. This figure continued to grow and by the end of 2007 (and the BSP Programme), 546 high growth businesses had been created; the target at the outset of the programme had been exceeded by over 300%. (1) Only includes start up projects within the following parameters – in receipt of SFA assistance totalling £25k or more to a client employing less than 250. (1a) The table also demonstrates that the original target of 3000 locally focused businesses created, had been exceeded by the end of 2007. This figure stood at 14,332 locally focused businesses created. (2) (3) Invest NI have been unable to obtain gross job figures at the end of this programme. Invest NI only has one figure for job creation for each of the targets i.e. the number of jobs in these start up companies at 2007 - so it is a net change figure. The impact of the number of high growth businesses created on the number of Net Jobs created was determined as 4,302 at the end of the BSP programme Again, the resulting gross jobs created cannot be determined, however the number of net jobs created in relation to locally focused businesses created was 18,630. (4) The 2001 AIR, highlighted that for this measure, over 90% of the high growth potential businesses created target, had already been achieved (Target - 100 Position at the end of 2001= 91). By the end of 2003, and mid term evaluation, this target had been exceeded at 253 as highlighted in the AIR of that year. This figure continued to grow and by the end of 2007 (and the BSP Programme), 546 high growth businesses had been created; the target at the outset of the programme had been exceeded by over 300%. (5) INVEST NI NOTE: 78% of businesses assisted through Start A Business Programme survived at least 3 years. 117 BUILDING SUSTAINABLE PROSPERITY PROGRAMME VERSION 3 Control Activity Article 4 Ten projects in Measure 1.1(a) were subjected to an Article 4 check. Summary of findings as a result of Article 4 Activity KPMG Consultants were engaged by DETI in 2006 to undertake an Article 4 check on Measure 1.1 using the standard checklist template. The key findings are included in the Measure 1.1 summary. Article 10 Details of Article 10 activity are included in the Measure 1.1 summary. Audit Activity Details of internal audit activity can be found in Annex 12 and details of Commission audit findings are provided in Annex 13. The 2007 AIR identified the issue of ineligible spend in respect of “Trigger Points” or funds paid out on the achievement of results and not on expenditure incurred. Auditors from DG REGIO raised a number of issues in September 2007, in relation to payments to projects using trigger points. After discussion with the DG REGIO auditors DETI’s Internal Audit provided assurance to the Commission on the eligibility of expenditure claimed to date. Irregularities Details of irregularities are provided at Measure 1.1 summary level in Annexes 15 and 16. 118 BUILDING SUSTAINABLE PROSPERITY PROGRAMME VERSION 3 Sub- Measure: - 1.1(b) – Business Support – Competitiveness Excellence Support Aims and Objectives The rationale for Measure 1.1(b) was that there remained a low level of business competitiveness in Northern Ireland as was evidenced by business reliance on a small local marketplace, with the exporting activity of small firms was minimal with innovation and R&D poorly developed with ICT usage lagging well behind other regions. Through increasing business competitiveness and encouraging SMEs to compete in foreign markets, it was seen that economic growth would ensue. The main objective to be met under each of the schemes funded under this Measure was to accelerate the competitiveness and growth rates of businesses. Invest NI did this by deploying the following activities: i. provision of a holistic approach to the analysis and identification of business growth constraints in agreement with client companies. This was achieved through the application of the Competitiveness Excellence Process and currently forms a basic tool for situational analysis and a range of benchmarking techniques; and ii. interventions which were measurable in response to needs identified as part of the above process, through selective financial assistance and trade development activities. Implementation Five applications were approved under this Measure. funded under this Measure were as follows: • Growth Major • Growth Minor • Growth Incentive • Sectoral Studies • Single Development 119 The Invest NI Schemes BUILDING SUSTAINABLE PROSPERITY PROGRAMME VERSION 3 Of these 5 applications, 2 schemes the Single Development and Sectoral Studies/Initiatives incurred spend before being deemed irregular due to the lack of an audit trail. Expenditure in respect of these schemes has been removed from the database. The remaining schemes were deemed eligible. Examples of Projects within Measure 1.1(b) McMullen Architectural Systems Ltd – In 2006, this Company won a highly prestigious £13 million contract as part of the redevelopment of The Arsenal’s Highbury Stadium in London. The new development was a collection of studios, apartments and penthouses set within the Art Deco surroundings of the former stadium. The Company which designs, manufacturers and installs architectural aluminium curtain walling and window frames was selected as a sub-contractor for Sir Robert Alpine. McMullen’s Architectural System’s success followed a three year investment programme by the Company worth over £2 million. It has therefore secured significant new business in England, where it now carries out the majority of its work. In 2006 it increased its number of employees from 110 to 175 and employs in excess of 200 workers. Adamsez – is the only manufacturer of acrylic baths in Ireland and the designorientated market place. The Company received ERDF assistance towards the high marketing costs required to gain market share and the costs associated with launching and marketing the new range of shower enclosures. Adamsez is a small niche player operating in a market, which is dominated by larger household names such as Jacuzzi, Shires and Villeroy & Borsch. Adamsez’s strength lies in innovative design and product quality, however these attributes alone are not sufficient to ensure market profile. The focus of the current marketing strategy is to launch a number of new innovative products in the GB market and at the same time elevate the Adamsez brand. 120 BUILDING SUSTAINABLE PROSPERITY PROGRAMME VERSION 3 Summary of Achievements V Targets for Measure 1.1(b) Original Indicator Output *500 SMEs supported by LEDU Position at Mid Term Evaluation Revised Indicators Final Position 623 *500 SMEs supported by INVEST NI per annum 1714 (6) 1856 *1700 jobs (gross) 37,152 (7) 7% growth in sales (net) per annum over the six years of the programme (as compared with 5% in 1999/2000) 10.2% increase in sales over the period. (8) 20 companies assisted by IDB Result *1700 jobs (gross) To maintain turnover and profit levels at 1998/0999 levels Impact 8% growth in sales (net) per annum Figures unavailable at MTE 8% growth in export performance (net) per annum Figures unavailable at MTE 8% growth in export performance (net) per 15.6% increase in exports. (9) annum over the six years of the programme (as compared with 6% in 1999/2000) 5% increase in net jobs creation per annum (1300 jobs) Figures unavailable at MTE 1300 net jobs at the end of the programme Improved productivity within the companies Figures unavailable at MTE 121 1918 net jobs. BUILDING SUSTAINABLE PROSPERITY PROGRAMME VERSION 3 (6) By the end of 2007, 1,714 SMEs had been supported (relates to locally-owned SME’s offered £25,000 or more) 2002/03 to 2007/08 employment has increased from 33,611 to 37,152 representing a growth rate of 10.5% over the period and 2.0% annually. (8) Sales grew from £3.1 billion to £5.3 billion resulting in a 62.7% increase over the period and 10.2% per annum. (9) Exports grew from £889m to £1.8 billion resulting in an 106.5% increase over the period and 15.6% annually. (7) From Invest NI Response: In relation to the achievement of 10 Regional initiatives focusing on SME development against a target of 5 (200% success rate), Invest NI's has 5 local offices developing a plan to encourage for example export starts, developing an innovative approach or working with local stakeholders and these have been delivered on the ground by the local office personnel. This amounts to each regional office having two such initiatives rather than one in the time period. Given changing economic priorities and reacting to the needs of clients it would sometimes be necessary to do this. 122 BUILDING SUSTAINABLE PROSPERITY PROGRAMME VERSION 3 Control Activity Article 4 All projects in this Measure were subjected to an Article 4 check. Summary of findings as a result of Article 4 activity KPMG Consultants were engaged by DETI in 2006 to undertake an Article 4 check on Measure 1.1 using the standard checklist template. The key findings are included in the Measure 1.1 summary. Article 10 Details of Article 10 activity are included in the Measure 1.1 summary. Audit Activity Details of internal audit activity can be found in Annex 12 and details of Commission audit findings are provided in Annex 13. The 2007 AIR identified the issue of ineligible spend to “Trigger Points” or funds paid out on the achievement of results and not on expenditure incurred. Auditors from DG REGIO in September 2007 raised a number of issues in relation to payments to projects using “Trigger Points”. After discussion with the DG REGIO auditors DETI’s Internal Audit provided assurance to the Commission on the eligibility of expenditure claimed to date. Irregularities Details of irregularities are provided at Measure 1.1 summary level in Annexes 15 and 16. 123 BUILDING SUSTAINABLE PROSPERITY PROGRAMME VERSION 3 Sub- Measure: - 1.1(c) - Business Support – Small Business Support Network Aims and Objectives There was strong evidence to suggest that links existed between the high levels of entrepreneurship and economic growth. The key to maximising entrepreneurship was seen as a more coherent and co-ordinated approach to the delivery of support to small businesses and to a small firm development policy. This Measure sought to encourage individuals to consider establishing a business and so began to address Northern Ireland’s low business start-up rate. The main objectives to be met through schemes funded under this Measure were: • develop a framework for integrated small business support; and • ensure that all small businesses have access to appropriate levels of support to develop their business. To meet these objectives, Invest NI undertook to: i. work in partnership with all those who had an interest in small business development (e.g. Local Authorities, Community Groups and other Government Departments). Develop integrated strategies to address development needs of small businesses and implement plans in a coordinated way; ii. establish a resource dedicated to the sourcing, analysis and interpretation of market intelligence to inform the development of plans and assist with the evaluation of small business support services; iii. establish a “gateway” service to facilitate single point of access information and ‘problem-solving’ advice for the NI small business base; and iv. work with other providers of support to build capacity and capability in the area of small business development. 124 BUILDING SUSTAINABLE PROSPERITY PROGRAMME VERSION 3 Implementation Four projects were approved under this part of the Measure. The Invest NI Schemes funded under this Measure were: • Scheme Development; • Business Counsellors; • Third Party Support; and • Promotions. Example of Projects within Measure 1.1(c) “Go For It” Campaign - Since 2001, Invest NI’s Start a Business Programme (SABp) has been the main volume intervention in Northern Ireland to raise the level and quality of business start-ups. Between 2002 and 2008, 18,817 locally-owned businesses and individuals have been supported to start a business through Invest NI’s appointed third sector organisation, Enterprise NI and its network of 32 Local Enterprise Agencies (LEA’s). The primary communications channel for promoting the SABp has been the “Go For It” advertising campaign and up until 2007, the campaign has played a vital role in encouraging potential entrepreneurs to start their own business. Since Financial Year 2003-04, the campaign has delivered a total of 63,720 enquiries to the LEA’s network and the 0808 helpline number. These have resulted in 48,271 SABp Lead in Assessments and 19,998 SABp Letters of Offer. 125 BUILDING SUSTAINABLE PROSPERITY PROGRAMME VERSION 3 Summary of Achievements V Targets for Measure 1.1(c) Original Indicator Output 26 integrated plans 5 Regional Action plans Result 10strategic alliances formed 10 regional initiatives focusing on SME development Impact Positive change in business base Positive change in business performance Position at Mid Term Evaluation Revised Indicators Final Position 26 2 5 regional action plans 5 0 0 10 regional initiatives focusing on SME development 10 Not available Positive change in business base Positive change in business performance No target (10) No target (10) Under this measure, there were indicators as opposed to targets to aim towards, such as a positive change in business base and also a positive change in business performance. The objectives of the measure were documented as continuing to be successful on the whole although this impact could not be evaluated in terms of figures. (10) Invest NI Response: In relation to the achievement of 10 Regional initiatives focusing on SME development against a target of 5 (200% success rate), Invest NI's has 5 local offices developing a plan to encourage for example export starts, developing an innovative approach or working with local stakeholders and these have been delivered on the ground by the local office personnel. 126 BUILDING SUSTAINABLE PROSPERITY PROGRAMME VERSION 3 This amounts to each regional office having two such initiatives rather than one in the time period. Given changing economic priorities and reacting to the needs of clients it would sometimes be necessary to do this. 127 BUILDING SUSTAINABLE PROSPERITY PROGRAMME VERSION 3 Control Activity Article 4 All projects in this Measure were subjected to an Article 4 check. Summary of findings as a result of Article 4 activity KPMG Consultants were engaged by European Programmes in 2006 to undertake an Article 4 check on the Measure using the standard checklist template. The key findings are included in the Measure 1.1 summary. As a result of the KPMG review of this measure and of other BSP Measures Invest NI formed an EU Compliance Team and a major exercise of remedial work was undertaken to address the issues identified. The report detailing this work has since been copied to DG REGIO auditors. A further Implementing Body Article 4 check was carried out by the DETI Article 4 Team in February 2008. The main recommendations related to Invest NI providing documentation in relation to ‘I Believe’ advertising campaign, ie tendering process, appointment of contractors, Ministerial approval, Development Path Analysis. Article 4 Checks carried out by Invest NI Article 4 checks carried out by Invest NI were completed retrospectively as part of the EU Compliance Exercise which began in February 2007. A standard checklist was used throughout and when signed off by the Client Executive, was placed on the relevant project file. All Article 4 checks were completed by DETI by programme closure deadline of 31st December 2007. There were no control weaknesses identified by Invest NI. The findings of the KPMG review in 2006 highlighted the extent to which visits were incomplete and also the administrative issues that needed to be addressed as a result. Action was then taken to ensure that all visits and checklists were completed. 128 BUILDING SUSTAINABLE PROSPERITY PROGRAMME VERSION 3 In addition to the Article 4 checks all Invest NI project claims were subject to standard grant inspection procedures and controls. Article 10 Details of Article 10 activity are included in the Measure 1.1 summary. Audit Activity Details of internal audit activity can be found in Annex 12 and details of Commission audit findings are provided in Annex 13. Irregularities Details of irregularities are provided at Measure 1.1 summary level in Annexes 15 and 16. 129 BUILDING SUSTAINABLE PROSPERITY PROGRAMME VERSION 3 6.5 Measure Details for Measure 1.2 – Research & Technology Development & Technology Transfer Aims and Objectives The rationale for this Measure was to raise industry R&D to promote innovation and encourage greater links between indigenous SME’s and inward investors while developing linkages between the business and education sectors. This was identified as a priority action and subsequently firms were encouraged to undertake technology transfer. The availability and accessibility of knowledge based research infrastructure, supporting and facilitating local SMEs in their development of innovative products and processes, was seen as critical to Northern Ireland’s technological advancement. The main objectives of this Measure were to: • support and strengthen Northern Ireland’s industrially driven research base (COMPETE and START); • encourage and enhance the design and development of environmentally friendly innovative products and processes (SMART, Awareness Programme, Innovation Audit and Environmental Audit Support Schemes); and • provide the opportunity for university graduates to develop their capabilities both technically and managerially by undertaking key projects through work placements (TCS). To meet these objectives, Invest NI deployed the activities through the following six schemes: i. COMPETE Programme – encourage and enhance innovative market led product and process development 130 in Northern Ireland BUILDING SUSTAINABLE PROSPERITY PROGRAMME VERSION 3 companies. Projects that demonstrate a strong environmental element will be encouraged; ii. START Programme – provide a strong R&D capability in Northern Ireland companies and universities through participation in technology based industrially relevant pre-competitive research and development projects. iii. SMART – Support for individuals and small firms to improve competitiveness through innovative ideas for products and processes. iv. Green awareness Programme – Seminars, Workshops and Conferences to promote R&D, technology transfer, green issues and best practice in industry and commerce; v. Knowledge Transfer Programme (KTP) – Provide the opportunity for University graduates to develop their capabilities both technically and managerially by undertaking key projects through work placements. vi. Environmental Audit Support Scheme (EASS) – Encourage and enhance the design and development of environmentally friendly innovative products and processes. Implementation The value of this Measure was €85,253,334 which included an ERDF allocation of €63,940,000. A list of all projects for Measure 1.2 which incurred expenditure and the EU element can be found in Annex 5. The Measure progressed smoothly over the course of the Programme, however, as reported in the 2005 Annual Implementation Report the participation levels in the COMPETE were slightly lower than levels previously recorded for the Programme prior to 2000. A survey of COMPETE was carried out in an attempt to identify the causes of falling participation. It revealed that participants were of the opinion that Invest NI’s processing times were too long. This resulted in a re-examination of Invest NI’s assessment process for individual COMPETE proposals and a more user friendly and significantly simplified process was piloted. The pilot ‘Streamlined COMPETE” involves the preparation of the necessary and appropriate casework jointly by the Invest NI Client Executive and the Technology Executive and process 131 BUILDING SUSTAINABLE PROSPERITY PROGRAMME VERSION 3 contains all necessary checks and controls as required. The aim was that the higher level of support and faster response times would significantly increase the participation level. This new ‘COMPETE’ has been designated under Priority 1 in the new Sustainable Competitiveness Programme 2007 -2013 as COMPETE. Some of the strengths that were identified included the shifting focus on R&D projects by companies, the expected increase in Business Expenditure on Research and Development (BERD) and the establishment of good working relationship between Invest NI and their clients. Examples of Projects within Measure 1.2 The Envirowise Programme, under the Environmental Awareness Programme (EASS Scheme) helped Northern Ireland based companies achieve savings through the prevention of waste. A series of waste minimisation seminars and workshops for businesses were held to communicate best practice which were of considerable benefit and ‘Fast Track’ Waste Auditing of local companies continues to help business identify low cost opportunities to minimise waste and achieve savings. 132 BUILDING SUSTAINABLE PROSPERITY PROGRAMME VERSION 3 Summary of Achievements V Targets for Measure 1.2 Original Indicator Position at Mid Term Evaluation Revised Indicators Final Position Output No of R&D projects supported 220 142 No of Environmental & Innovative audits Initiated 180 No of graduate placements 256 47 286 R&D projects supported (broken down by type of research orientation 871 (11) 350 Environmental & Innovative audits Initiated 393 150 graduate placements 204 Result 80% of supported projects completing successfully 87% 80% of supported projects completing successfully 86% 90% of businesses undertake an audit 86% 90% of businesses undertake an audit 100% Not reported on as ‘result’ 130 projects involving graduates 161 64% 80% of graduates successfully completing placement No of projects involving graduates 256 80% of graduates successfully completing placement 133 95% BUILDING SUSTAINABLE PROSPERITY PROGRAMME VERSION 3 Impact 15% increase in Business Expenditure on R&D 45% 15% increase in Business Expenditure on R&D 50% increase in expenditure on R&D from £123m in 1999 to £185m in 2007. 60% of businesses adopt audit recommendations Not available 60% of businesses adopt audit recommendations 100% 60% of graduates retained by host firm 62% 60% of graduates retained by host Not available (11) The 2001 AIR highlighted that there had been 98 R& D projects supported against a target of 220 for the programme. This target was surpassed by the end of 2004, with 263 projects supported. This figure reached 715 by the end of 2006 and 871 by the end of 2007 with approximately 86% of supported projects successfully completed against a target of 80%. Invest NI Response: Demand for programmes under this measure was much higher than initial reviews suggested. . 134 BUILDING SUSTAINABLE PROSPERITY PROGRAMME VERSION 3 Expenditure and Financial Control Total Expenditure Declared for Measure 1.2 All amounts shown in € Allocation in Programme Complement Expenditure Declared in claims to the Commission EU Amount Public Amount Private Total 63,940,000.00 21,313,334.00 0.00 85,253,334.00 65,186,439.67 21,729,075.56 0.00 86,915,515.23 Expenditure declared as % of available Allocation 101.95 Article 4 Activity All schemes in this Measure were subjected to an Article 4 check. The Innovation Audit Scheme element was deemed irregular due to a lack of an audit trail. Expenditure in respect of this scheme has been removed from expenditure declarations to the Commission. Summary of findings as a result of Article 4 Activity KPMG Consultants were engaged by DETI in 2006 to undertake an Article 4 check on the Measure using the standard checklist template. A summary of the findings can be found under Measure 1.1. As a result of the KPMG checks on this and other BSP Measures managed by Invest NI, the organisation formed an EU Compliance Team and a major exercise of remedial work was undertaken to address the issues identified. The report detailing this work has since been copied to DG REGIO auditors. Article 4 checks carried out by Invest NI were completed retrospectively as part of the EU Compliance Exercise which began in February 2007. A standard checklist was used throughout and the Client Executive signed off each individual checklist, which was then placed on the relevant project file. An Article 4 check was not carried out on the Knowledge Transfer Partnership (KTP) Scheme which was managed by the Department of Trade and Industry 135 BUILDING SUSTAINABLE PROSPERITY PROGRAMME VERSION 3 (DTI) based in London. This scheme was reviewed by the DGREGIO auditors during their 2006 visit and it was subsequently agreed that the DETI Verification team would carry out an Article 10 check. There were no control weaknesses identified on a project basis. The findings of the KPMG review in 2006 highlighted the extent to which visits were incomplete and also the administrative issues that needed to be addressed as a result. Action was then taken to ensure that all visits and checklists were completed. In addition to the Article 4 checks all Invest NI project claims were subject to their normal grant inspection procedures and controls. Article 10 Activity 9.84% of declared expenditure was examined under Article 10 revealing an error rate of 9.75%. Spread of Article 10 – 5% checks 2000 % checked 2001 2002 2003 21.13 22.14 30.04 3.46 2004 2005 2006 2007 2008 10.91 5.87 5.42 27.66 0 Summary of Findings as a result of Article 10 Monitoring The ‘COMPETE’ and ‘START’ programmes were selected for verification using a risk analysis approach which considered the allocation and percentage (%) spend to date. Within each programme a number of companies were selected, to give a representative spread of type and size of projects towards meeting the annual 5% requirement. This methodology ensured that a good mix of different types and sizes of projects were visited including the largest grant recipient. Following an Article 10 Verification exercise in March 2005 on the Measure, no significant weaknesses were discovered. A number of recommendations were made regarding missing clauses in the original letters of offer and the need for Invest NI to complete Environmental Impact Assessments, Article 4 136 BUILDING SUSTAINABLE PROSPERITY PROGRAMME VERSION 3 management checks and the need to implement a formal mechanism to record irregularities. Invest NI confirmed that remedial action was taken for each of these recommendations and follow-up action was completed to ensure that these actions were satisfactory. As a result of a DGREGIO auditors visit in 2006 the Verification Team was requested to carry out an Article 10 sample check of the KTP scheme. This is a DTI run scheme and regional sponsors - of which Invest NI is one – are invoiced by DTI for 50% of the running costs of the KTP scheme. Invest NI listed all companies involved in funded ‘Knowledge Base Partnerships’ and all payments made by DTI to the Education partner in relation to each of these Partnerships. Expenditure for the region is then declared by Invest NI to DETI European Programmes for the purpose of drawing down EU grant. The Verification Unit concluded that Invest NI were in fact the final recipients of the ERDF funding and that the claims from DTI should have been the eligible costs claimed against this Measure. An irregularity was subsequently raised for the over-declared amount. A follow-up Article 10 exercise was completed in April 2009 to verify further expenditure under the Measure in later years. It was determined that overall the management systems and controls were found to be operating well. Any recommendations made have been followed up. Irregularities detected through Article 10 Checks Org/ Project UK Case No Total irregularity £’s EU Element £’s Nature of irregularity (code) TCS/KTP n/a 3,036,980.75 423,157.28 325 COMPETE – McGeary Compost I COMPETE – W D Irwin Thales air Defence n/a 409.13 306.85 Recordable only n/a 463.50 347.63 N/a 8.62 6.47 Recordable only Recordable only 137 Date identified March 2007 March 2005 March 2005 Sept 08 Date report ed to DFP June 2008 n/a n/a N/a Date cleared June 2008 Feb 2007 Feb 2007 May 09 BUILDING SUSTAINABLE PROSPERITY PROGRAMME VERSION 3 Audit Activity All internal audit activity in respect of Measure 1.2 is detailed in Annex 12 and details of Commission audit findings are provided in Annex 13. Reported Irregularities A total of 43 irregularities were reported for this part of the Measure all of which were resolved. A detailed list of all reported irregularities for Measure 1.2 can be found in Annex 15. Irregularities that were below the reporting threshold were recorded and are detailed in Annex 16. 138 BUILDING SUSTAINABLE PROSPERITY PROGRAMME VERSION 3 6.6 Measure Details for Measure 1.3 - Tourism Aims and Objectives To realise the potential of the tourism industry this Measure aims to ‘grow’ tourism to Northern Ireland, effect a better regional spread of benefits and increase employment in the sector in a manner that is environmentally sustainable and recognises the needs and requirements of the indigenous population. More specifically the objectives were to:• grow discretionary visitors as a proportion of all visitors; • increase the contribution discretionary visitors make to tourism revenue by attracting a higher spending visitor, increasing their length of stay and providing opportunities to spend more; and • enhance the competitiveness of Northern Ireland tourism through product development which is based on the Northern Ireland offer. Implementation The overall value of this Measure was €62,600,003 of which the ERDF allocation was €46,950,002 and this Measure was divided into sub-Measures (a) Tourism – strategic marketing and (b) enhancing the business of tourism. Two schemes administered by the Northern Ireland Tourist Board and Invest NI on behalf of the Department of Enterprise Trade and Investment (DETI) were approved and these provided funding to some 75 projects. Details of the activities at sub-Measure level can be found under each section report. A list of all projects for Measure 1.3 which incurred expenditure and the ERDF element can be found in Annex 5. 139 BUILDING SUSTAINABLE PROSPERITY PROGRAMME VERSION 3 Examples of Publicity Links to some examples of the publicity undertaken promoting the Tourism Measure of the Programme are shown below. NITB - Irelands Christian Heritage http://www.discovernorthernireland.com/downloads/Christian_Heritage.pdf NITB - Walk Northern Ireland Brochure http://www.discovernorthernireland.com/downloads/WalkNI.pdf NITB – The View brochure http://www.nitb.com/ContentCache/Files/d7a38f9e-264d-43d7-a56ef7144ed2b137/2.0.20080307165231000/Comm%20View%202006-05.pdf NITB – Marketing Plan, Best International Prospects – your steps to success in 2007 http://www.nitb.com/DocumentPage.aspx?path=b3448d14-e182-4420-8cd6e77e8f976728,30238ee9-2b49-4394-a3f2-751f6d0b5544,e5d9e2bc-602f4983-86ba-026cd274d7d9 Assessment and Summary of Achievements v Targets Details are available within the sub-measure reports for 1.3(a) and 1.3(b). Expenditure and Financial Control Total Expenditure Declared for Measure 1.3 All amounts shown in € Allocation in Programme Complement Expenditure Declared in claims to the Commission EU Amount Public Amount Private Total 46,950,002.00 15,650,001.00 0.00 62,600,003.00 46,500,561.86 15,583,809.08 0.00 62,084,370.94 Article 4 Each scheme was subject to at least one Article 4 check. 140 Expenditure declared as % of available Allocation 99.18 BUILDING SUSTAINABLE PROSPERITY PROGRAMME VERSION 3 Summary of findings as a result of Article 4 Activity KPMG Consultants were engaged by DETI’s European Programmes Branch in 2006 to undertake an Article 4 check on the Measure using the standard checklist template. There was a further Article 4 check under taken by the DETI Article 4 Team in June 2007. The main recommendations were: • ensure that all projects have completed Equality Questionnaire & Development Path Analysis; and • publish details of projects supported acknowledging EU support. Both issues were addressed satisfactorily. Article 10 13.43% of declared expenditure was examined under Article 10 revealing an error rate of 4.35%. Spread of Article 10 – 5% checks 2000 % checked 2001 19.50 7.78 2002 2003 2004 2005 2006 2007 2008 37.64 9.20 9.12 9.04 6.62 6.52 9.12 Summary of findings as a result of Article 10 monitoring Sub-Measure 1.3(a) As this is a co-financing Measure, sampling was done using the two tier approach, by first obtaining a list of payments from the BSP Database for each scheme funded under this sub-Measure and then from within the various schemes, selecting projects on a random basis for a more detailed examination. As some schemes had expenditure only in certain years, this dictated which schemes were selected for checking, based on the target of a minimum of 5% per annum. Within these selected schemes, all expenditure was checked for the selected years. Two separate verification exercises were carried out on this sub- 141 BUILDING SUSTAINABLE PROSPERITY PROGRAMME VERSION 3 Measure, the first in December 2005 and then a follow up exercise in February 2009. The first Verification exercise on this sub-Measure had to be deferred due to the NITB not being able to provide a full breakdown of costs in support of the amounts claimed. A follow-up exercise in 2005 found that this had now been done and the verification exercise was able to proceed. During this exercise, it was noted that the NITB had included ineligible VAT in this sub-Measure and NITB undertook a full review of the costs in order to remove this ineligible expenditure. An irregularity was subsequently reported for the amount of £85k and these cost removed from the drawdown. A further issue was noted where a number of payments were included as Sterling which should have been converted from Euro’s and again the NITB were requested to carry out a full review, to determine the extent of the over claim. An acceptable level of assurance was given. Documents relating to expenditure for the first year of the Programme and the first quarter of 2001 could not be obtained for Verification purposes due to their destruction in a fire in an NITB store. A special report was commissioned by the DGREGIO auditors and using a sampling strategy agreed with the auditors and the reconstruction of the selected documentation from the original suppliers, a high level of assurance (78% by value) was obtained. The formal DGREGIO audit response to this exercise was not available at the time this report was prepared – updates will be provided. Sub-Measure 1.3(b) This sub-Measure related to NITB and Invest NI activity regarding “Enhancing the Business of Tourism”. During the two verification checks of this sub-Measure a number of issues were found. The main issue related to Consultants fees which should not have been charged to this Measure. Other minor irregularities were noted and reported in respect of projects which were no longer in business or had come under new management and where the new owner did not want to go ahead 142 BUILDING SUSTAINABLE PROSPERITY PROGRAMME VERSION 3 with the project. The Implementing Body was required to carry out further work to establish the extent of the problem. The Verification Unit also increased the level of checking on this sub-Measure. 143 BUILDING SUSTAINABLE PROSPERITY PROGRAMME VERSION 3 Irregularities detected through Article 10 Checks Org/ Project Landmark Hotel UK Case No Total irregularity EU Element Nature of irregularity (code) Date identified Date reported to EC Date Cleared €236,257.68 €236,257.53 325 1.9.06 1.9.06 14.1.09 Golfkeel SC €72,729.58 €72,729.58 325 1.9.06 1.9.06 14.1.09 Largy SC €61,656.53 €61,656.53 325 1.9.06 1.9.06 14.1.09 €1,234,275.51 €1,234,275.51 Admin error 1.3.06 Recordable only 14.1.09 Killykevlin Hotel €172,586.06 €129,439.55 Other - 999 1.3.06 1.3.06 14.1.09 Silverbirch Hotel €14,396.38 €14,396.38 325 1.3.06 31/3/07 14.1.09 Fermanagh Lakeland Lodges €41,426.63 €41,426.63 999 Feb 07 Feb 07 28.2.07 Belle Isle Estate €11,470.99 €11,470.99 999 Mar 07 Mar 07 22.3.07 Retention payment projects 144 BUILDING SUSTAINABLE PROSPERITY PROGRAMME VERSION 3 Audit Activity Details of internal audit activity can be found in Annex 12 with details of Commission Audit findings provided in Annex 13. Irregularities A total of 10 irregularities were reported for this Measure all of which were resolved. A detailed list of all reported irregularities can be found in Annex 15. Irregularities that were below the reporting threshold were recorded and are listed in Annex 16. 145 BUILDING SUSTAINABLE PROSPERITY PROGRAMME VERSION 3 Sub- Measure: - 1.3(a) Tourism Strategic Marketing Aims and Objectives Under Measure 1.3(a) the Northern Ireland Tourist Board (NITB) undertook to increase the contribution that discretionary visitors make to tourism revenue through marketing and promotion that attracts a higher spending discretionary visitor to Northern Ireland. This was carried out by: • investing in marketing activity which communicates the Northern Ireland offer within each of our key markets; • investing in tactical and specialist marketing activity which differentiates the uniqueness of Northern Ireland assets within the all Ireland brand; • tactical marketing activity which profiles the natural and cultural resources to those sectors of the markets which are most likely to respond; • developing processes as a key element of the activity of the Northern Ireland Tourist Board which provide ways of communicating with the industry in Northern Ireland that are participative, yet focused on agreeing opportunities for growth market-by-market and sector-bysector; and • engaging in partnership marketing with Board Failte Eireann and British Tourist Authorities to maximise opportunities for the strategic marketing of Northern Ireland through all Ireland and all UK marketing mix. Implementation One application was approved under this part of the Measure and a complete list of projects for Measure 1.3(a) which details expenditure and the ERDF element is available in Annex 5. 146 BUILDING SUSTAINABLE PROSPERITY PROGRAMME VERSION 3 The Measure allocation was increased to €32,380 million with agreement from the Monitoring Committee in December 2007. A total of 25 ‘Projects’ were administered by a number of different business units within the Northern Ireland Tourist Board throughout the period of the Programme. The NITB was successful in utilising its original allocation and benefitted from additional allocation as detailed above for use on marketing and promoting Northern Ireland as a tourist destination. Examples of Projects within Measure 1.3(a) Publications B&BS and Guesthouses Guide 2008 - covered print production of 45,000 copies, distributed via NI based Tourist Information Centres and 19,515 copies distributed via Tourism Ireland market offices. Northern Ireland Visitor Guide 2008 – covered print production of 115,000 copies, distributed via NI based Tourist Information Centres and 52,025 copies distributed via Tourism Ireland market offices. Annual Report and Accounts 2005-2006 – covered print production of 600 copies, distributed as reference materials for DETI and Holt Jackson Book Company plus misc. contacts within Press / Communications unit. A copy is available on www.nitb.com/documentpage.aspx. October 2005 – publication of NITB 2005/2006 Northern Ireland short breaks campaign. C.S Lewis Publication and publicity around the Irish premiere of ‘The Lion, The Witch and The Wardrobe’ in December 2005. DVD – publicised in Headlines and Signature Project updates. Further information on Headlines is available on www.nitb.com 147 BUILDING SUSTAINABLE PROSPERITY PROGRAMME VERSION 3 Campaigns - The purpose of the Destination Marketing unit is to promote Northern Ireland as a short breaks destination within NI and the Republic through fully integrated marketing campaigns. Visit www.nitb.com for more information. • Also, launch of Gateway RoI Campaign in Spring of 2007. • Launch of Spring Short Breaks Campaign in January 2007 consisting of press ads, TV and radio. • Advertisements at tourist gateways including airport and train stations, wrapped taxi and buses and others. Oct 2005 launch of spring short breaks campaign. • The promotion ‘Be a Tourist at Home’ ran during September 2005 and included Industry Workshops, publications and outdoor publicity (posters). NITB also ran regional workshops to recruit and promote industry participation in the event. Examples of publications are available at www.visitballymoney.com, www.sionmills.org. • The Ryder Cup Golf Promotion, Jan-March 2006. Masterclasses - The NITB continued its drive to achieve excellence in tourism, during 2006, by holding a second series of three Masterclasses themed ‘Making a Difference’. Tourism representatives from across Northern Ireland benefited from highly motivating presentations from Jeff Dziak, Executive Manager in The Ritz Carlton Hotel Company USA , Jane Sunley, Managing Director of Learnpurple and Chris Daffy who is widely recognized as one of the UK’s leading experts on customer experience and management. Press coverage was obtained before each Masterclass in newspapers and on the day via radio. Visit www.starkeventsuk.com and www.nitb.com for further information Signature Projects - Have been identified for their potential to deliver worldclass excellence, drawing visitors from home and overseas. These projects continue to be developed and attract media attention. The Walled City Signature Project along with the Titanic, Mournes, Causeway Coastal Route 148 BUILDING SUSTAINABLE PROSPERITY PROGRAMME VERSION 3 and St Patricks Trail will all have a significant impact on Northern Irelands tourism. For further details visit NITB – Titanic Signature Project. http://www.nitb.com/CategoryPage.aspx?path=aedbda88-d741-4bec-b32436204c735653,2d95614c-f2b9-4096-8fa8-8ceabab3894f,aefebc4e-df7440d2-bb3e-c368d9424751 PRide Awards - NITB picked up a Gold Award for the best in-house PR campaign for the C. S. Lewis - ‘Unlock Your Imagination’, at the Chartered Institute of Public Relations (CIPR) PRide Awards. Visit www.nitb.com for further details. The PRide Awards is the only Awards scheme showcasing the best PR work being carried out across the UK regions and nations. The NITB campaign was aimed at promoting Northern Ireland as the birthplace of C.S. Lewis and to highlight that the Northern Ireland landscape was the inspiration for the “World of Narnia”. 149 BUILDING SUSTAINABLE PROSPERITY PROGRAMME VERSION 3 Summary of Achievements V Targets for Measure 1.3(a) Original Indicator Output 15 marketing initiatives supported per annum across key markets Result Increase acceptability of Northern Ireland as a holiday destination from 2000 baseline Increased intention to visit Northern Ireland from 2000 baseline Impact Over the period of the programme to generate on an additional £100m Over the period of the programme to create 1300 additional jobs in tourism Position at Mid Term Evaluation Revised Indicators Final Position 22.5 15 marketing initiatives supported per annum across key markets 23 Increased acceptability Increase visitor numbers to Northern Ireland as a holiday destination by 7% annually by end 2006 (from 2000 baseline) (2007 - prelim forecast 174000 increase from 2000 baseline – 56.9% increase and 6.6% on year increase) (12) not available Over the period of the programme to create 1400 additional jobs in tourism 5920 (13) not available Increase visitor spend by 5% annually by end 2006 (from 2000 baseline) Preliminary forecast of 115,000 increase from 2000 baseline representing a 45.8% increase and 5.5% year on year increase Statistics on intentions but not reported relative to baseline (12,13) Over the period of the programme Northern Ireland has experienced significant growth in tourism, both in terms of visitor numbers and revenue generation. This growth is a direct result of the investments the Northern Ireland Tourist Board has made in developing the tourism market and enhancing Northern Ireland’s tourism product which has been co-financed by the ERDF through the BSP Programme. 150 BUILDING SUSTAINABLE PROSPERITY PROGRAMME VERSION 3 Control Activity Article 4 NITB have their own financial procedures manual and all expenditure is subject to management checks. During the period of the programme, periodic internal compliance checks were undertaken by NITB to ensure that the systems of internal control established by management, in relation to contract management, the payment of invoices to suppliers & consultants etc, complied with the NITB Financial Procedures Manual and corporate governance in general. Regular awareness sessions took place to ensure staff were aware of their responsibilities in relation to financial procedures, corporate governance and EU payments etc. Summary of findings as a result of Article 4 activity Responsibility for carrying out an Article 4 check on Measure 1.3(a) fell to DETI European Programmes. KPMG Consultants were engaged by DETI European Programmes in 2006 to undertake an Article 4 check on the measure using the standard checklist template. There was a further Article 4 check under taken by the DETI Article 4 Team in June 2007. The Key findings of the KPMG report can be found in the Measure 1.1 summary. An agreed action plan was put in place between the DETI Article 4 Team and NITB and all issues raised in the report were fully addressed. Article 10 Details of Article 10 activity are provided at Measure 1.3 summary level. Audit Activity Internal audit activity is detailed in Annex 12 and a summary of Commission audit findings is included in Annex 13. 151 BUILDING SUSTAINABLE PROSPERITY PROGRAMME VERSION 3 Irregularities Details of irregularities are provided at Measure 1.3 summary level in Annexes 15 and 16. 152 BUILDING SUSTAINABLE PROSPERITY PROGRAMME VERSION 3 Sub-Measure: - 1.3(b) Tourism– Enhancing the Business of Tourism Aims and Objectives The purpose of this element of the Measure in conjunction with 1.3(a) (Tourism Strategic Marketing) was to enhance the competitiveness of the Northern Ireland tourism industry to achieve a balanced, innovative, knowledge based and fast growing tourism economy. In April 2002, the Capital Investment Programme for accommodation development moved from the Northern Ireland Tourist Board (NITB) to Invest NI. Invest NI had responsibility for allocation of resources accommodation infrastructure projects through the Tourism Development Scheme. The NITB retained responsibility for investment in visitor attractions, visitor amenities and visitor servicing. The main objective under this sub-Measure was: • To sustain the tourism product already available and to develop product initiatives based on the Northern Ireland offer To meet this objective, Invest NI/NITB undertook the following activities: i. the sustained development of the tourism infrastructure to secure a high quality tourism product which will enable Northern Ireland to compete in the global market place, providing where appropriate support for the provision of accommodation and the development of tourism facilities and amenities. ii. the development of innovative products which are based on Northern Ireland’s values and attributes as a destination including those which capitalise on the unique qualities of the natural and creative resources of the region. iii. the provision of relevant feasibility studies. 153 BUILDING SUSTAINABLE PROSPERITY PROGRAMME VERSION 3 Implementation One application was approved under this part of the Measure and details of the allocation are included in Annex 5. Examples of Projects within Measure 1.3(b) Dunsilly Hotel - The Hotel had its official opening on 11 May 2005 with the creation of 40 bedrooms. Corick House - This venue underwent an extension of a successful licensed Guest house which resulted in a total of 40 bed spaces. Belle Isle Cookery School - Information on this project can be found on www.irish-cookery-school.com. Belle Isle Cookery School is located in the 470 acre Belle Isle Estate in Co Fermanagh. The estate comprises 8 islands on the northern end of Upper Lough Erne and is reached by a private bridge across the Lough. The estate already boasts a very successful high quality self-catering development which has been complemented by the opening Cookery School. This is a first for Northern Ireland. The Cookery School is run by Elizabeth Moore who is fast developing a high reputation as an up and coming chef. Previous clients include the Prince of Wales and Tony Ryan of Ryan Air. Liz is assisted by 4 part-time staff. Since the Cookery School opened in November 2003, bookings have steadily increased with nearly 600 bookings in 2006. A copy of their promotional leaflet is attached. Sample 4.pdf Armada Exhibition - The Armada in Ireland exhibition has been housed in the refurbished Tower Museum and provides a home for the numerous objects recovered from the ship La Trinidad Valencera in 1971. This particular project 154 BUILDING SUSTAINABLE PROSPERITY PROGRAMME VERSION 3 forms just one element of a wider Walled City of Derry Project and is in line with the Walled City of Derry being designated a Signature Project in its Strategic Framework for Action. The exhibition tells stories of the Spanish Armada, life onboard a 16th century ship, the Armada and Ireland and the tragic fate of La Trinidad’s crew along with a range of interactive displays explaining a range of things from buoyancy and tidal movement to underwater archaeological techniques. Promotional material for The Armada Shipwreck and The Activity Trail is available in the attached document below. Sample 9.pdf 155 BUILDING SUSTAINABLE PROSPERITY PROGRAMME VERSION 3 Summary of Achievements V Targets for Measure 1.3(b) Original Indicator Output Accommodation projects assisted Position at Mid Term Evaluation 28 Revised Indicators Final Position 50 Accommodation projects assisted 47 Assisted cultural and natural resource programmes 0 visitor attractions assisted to enhanced or re-themed Result 750 new bedrooms 8 10 visitor attractions enhanced or rethemed 15 489 750 new bedrooms 664 Premises with new bedrooms to show an occupancy rate higher than relevant regional and sectoral averages Not available (reported on as ‘Impact’) !0% increase in visitor numbers to the attractions by the end of the programme (from 2000 baseline) 5 programmes developed 0 10 visitor attractions enhances/rethemed Not reported on as ‘result’ increase visitor numbers to enhanced or re-themed attractions Increases ranging from 2% to 59% at 8 attractions Visitor numbers to those attractions assisted by the programme increased on average by 78% (based on figures provided by those attractions that made returns to NITB between 2000 and 2007) Overall across all visitor attractions in Northern Ireland numbers have increased by 23% between 2000 and 2007 156 BUILDING SUSTAINABLE PROSPERITY PROGRAMME VERSION 3 Summary of Achievements V Targets for Measure 1.3(b) (contd) Impact 350 direct jobs created by the end of the programme 336 350 net jobs created by the end of the programme 428 50 (direct and indirect) jobs created by the end of programme not available Increase room occupancy by 2% above the regional average 2 years after opening Jobs sustained in enhanced/rethemed attractions not available Currently difficult to assess. It is questioned whether this is a reasonable measure in that increased volume will normally lead to a reduction in occupancy. Of the 15 enhanced – 14 are still in existence (93%) 70% of visitor attractions still existence by the end of programme 157 BUILDING SUSTAINABLE PROSPERITY PROGRAMME VERSION 3 Control Activity Article 4 This project underwent three Article 4 checks during the life of this Programme. Summary of findings as a result of Article 4 Activity KPMG Consultants were engaged by European Programmes to undertake an Article 4 check on the Measure using the standard checklist template. The checks took place in December 2006 (Invest NI element) and January 2007 (NITB element). The key findings of the KPMG report can be found in Measure 1.1 summary. As a result of the KPMG checks, the organisation formed an EU Compliance Team and a major exercise of remedial work was undertaken to address the issues identified. The report detailing this work has since been copied to DG REGIO auditors. The issues identified by KPMG in relation to NITB were followed up by the European Programmes’ Article 4 Team. All recommendations have been satisfactorily implemented. European Programmes’ Article 4 Team undertook an Article 4 check on the NITB element of Measure 1.3(b) in June 2007 using the standard Implementing Body checklist. The main recommendations were: • ensure that all projects have completed Equality Questionnaire & Development Path Analysis; and • publish details of projects supported acknowledging EU support. Both issues were addressed satisfactorily. Article 4 Checks undertaken by Invest NI/NITB Article 4 checks carried out by Invest NI were completed retrospectively as part of the EU Compliance Exercise which began in February 2007. A standard checklist 158 BUILDING SUSTAINABLE PROSPERITY PROGRAMME VERSION 3 was used throughout and when signed off by the Client Executive, was placed on the relevant project file. All NITB Article 4 checks were carried out using the standard checklist. Thirteen of the checks were carried out after the project had completed and incurred all eligible expenditure; the remaining 2 were carried out during project implementation. Article 10 Details of Article 10 activity are provided at Measure 1.3 summary level. Audit Activity Internal Audit activity is detailed in Annex 12 and a summary of Commission Audit findings included in Annex 13. Irregularities Details of irregularities are provided at Measure 1.3 summary level in Annexes 15 and 16. 159 BUILDING SUSTAINABLE PROSPERITY PROGRAMME VERSION 3 6.7 Measure Details for Measure 1.4 – Local Economic Development (LED) Aims and Objectives The aim of Measure 1.4 was to assist Northern Ireland’s 26 District Councils, through match-funding, to implement key schemes identified in their Local Economic Development Action Plans. The aim of the Action Plans was to: • help drive forward economic change and stimulate sustainable economic development; • contribute to greatly improved infrastructure leading to economic growth and competitiveness; and/or • enhance long-term economic prospects for the area. Examples of Action Plans can be found at: Banbridge DC – Rathfriland Town Centre Development Plan http://www.banbridge.com/uploads/docs/RathfrilandTCDPlan.pdf North Down DC – Local Economic Strategy http://www.northdown.gov.uk/uploads/docs/LedStrategyFeb05.pdf Implementation A total of 156 applications were approved under this Priority. A list of all projects for Measure 1.4 which incurred expenditure and the EU element can be found in Annex 5. The objective of this Measure was delivered through a broad range of themes across Northern Ireland by the 26 District Councils as follows: 160 BUILDING SUSTAINABLE PROSPERITY PROGRAMME VERSION 3 • Business Development – to increase the competitiveness of local businesses through advice, mentoring and awareness raising, the opportunity for IIP accreditation and developing linkages. This scheme included sectoral development initiatives, focussing on developing the Craft industries. The objective was to develop the skills and capability of local businesses and to foster business growth and job creation. • Business Start – delivered by Invest NI since 2005, the Start a Business Programme which has, since 2005, provided support, advice and financial assistance to individuals to enable them to start their own business. Its remit was to promote and support the development of small businesses with a view to addressing local need. • Environment & Business Infrastructure – this theme targeted projects which ranged from the creation of work, office space and refurbishment of existing workspace to feasibility studies on potential regeneration projects. The overall objective of this theme was to improve physical infrastructure to foster business growth and job creation. • Tourism Development – Geared towards projects whose aim was: increasing the number of available bed spaces, visitors and average visitor spend in Northern Ireland. Projects included those who specifically develop tourist attractions and visitor centres, the provision of infrastructure (for example improvements to accommodation) and the provision of information to facilitate tourism (for example the production of a local tourist guide or the introduction of website facilities in B&Bs). The objective was to ensure that tourism contributes to the creation of a dynamic, competitive local economy. • Town Centre Development & Urban Regeneration – focused on activities such as reducing derelict sites, physically regenerating streets, buildings and erecting signage. At a strategic level, many District Councils developed town centre/city strategies and Action Plans, appointed a Town Centre Manager specifically for promoting local towns as engines for economic growth. The overall objective being to improve the physical aspect of the region’s towns’ and cities’ to heighten their profile and to attract tourists and employers. 161 BUILDING SUSTAINABLE PROSPERITY PROGRAMME VERSION 3 • Rural Regeneration – projects included: development of co-ordinating bodies (such as rural development partnerships), development of strategies (including the commissioning of feasibility studies for regeneration and/or infrastructure programmes); and village action projects. Their objective was to improve the physical aspect and infrastructure of rural regions to create opportunities for business growth and development networks. • ICT Development – a number of District Councils identified the importance of new technologies in the promotion of economic development. Information Communication Technology (ICT) projects included the provision of physical infrastructure (for example supply of computer hardware and software). Others embarked on capital build projects for Science Parks and Incubation Units. ICT’s objective was to raise the adoption of ICT in order to raise business competitiveness. • Inter-Regional Co-operation – to develop working relationships with other counties to collaborate on projects and learn from one another. • Inward Investment – inward/outward trade missions, hosting of US/EU conferences, meetings, the establishment and consolidation of civic/commercial relationships with other countries, all came under the umbrella of Inward Investment. Other activities included the compilation of trade directories, property registers and business databases. The objective being to attract investment to Northern Ireland, learn from global experience for job and economy creation. • Other - some Projects did that do not fit naturally within the 9 themes described above, however, were considered strategic to the BSP Programme and included marketing programmes and graduate placements/employment acceleration initiatives; and Programme Management – acted as the structure by which District Council Action Plans were implemented, monitored and managed effectively and efficiently. This was monitored monthly by DETI through reports and meetings. The overall objective of this theme was to deliver Action Plans effectively, efficiently and cost effectively. 162 BUILDING SUSTAINABLE PROSPERITY PROGRAMME VERSION 3 Examples of Projects within Measure 1.4 Ards Business Centre (8 high specification business units) Belfast Business Centre (Business Incubation Units) Belfast Business Start Programme (914 businesses created employing 1,508 jobs) Castlereagh Harwood Enterprise Centre (8,000 sq ft of workspace units) Craigavon High Tech Incubation Units (12,000 sq ft of incubation space) Derry Former Fire Station (high tech business units for the creative media sector) Derry Business Start (610 businesses creating 1,007 jobs) Lisburn 30,000 sq ft of additional workspace. Lisburn Business Start Programme (434 businesses creating 716 jobs) Newry & Mourne Bagenals Castle Tourism Facility (Tourism Information Centre) Strabane High tech modern tourism information and business. 163 BUILDING SUSTAINABLE PROSPERITY PROGRAMME VERSION 3 Summary of Achievements V Targets for Measure 1.4 Original Indicator Output 26 district council action plans Result List of Programmes detailing costs and implementation details, including number and types of action envisaged Impact Increase in employment levels. Position at Mid Term Evaluation Revised Indicators 26 26 district council action plans 153 List of Programmes detailing costs and implementation details, including number and types of action envisaged DN: these are the indicators reported on: New businesses created (target 150) New jobs created (target 1700) Sq ft of workspace created (target no target) Not available Increase in employment levels. Number of new business formations as a result of council participation not available Number of new business formations as a result of council participation Improved co-ordination of local economic development actions at sub-regional and local level. not available Improved co-ordination of local economic development actions at sub-regional and local level. DN: these are the indicators reported on: New businesses still in existence at end of programme (target 120) Jobs still in existence at end of prog (target 1360) Evidence of improved infrastructure and co-ordination at local council level 164 Final Position 26 926 (14) 4072 (15) 250,000sq ft (16) 926 (17) 4072 (18) Post project evaluation on 1.4 completed and endorses this impact BUILDING SUSTAINABLE PROSPERITY PROGRAMME VERSION 3 (14,15,16,17,18) The explanation for the variance is that when the original targets were set they did not envisage or in incorporate the Business Start Programme. 165 BUILDING SUSTAINABLE PROSPERITY PROGRAMME VERSION 3 Examples of Publicity within Measure 1.4 Larne Community Development Project (DSD) http://www.newtownabbeytcm.com/aboutus.cfm Cookstown DC – Town Centre Regeneration Strategy http://www.cookstown.gov.uk/media/COOKSTOWN%20TOWN%20CENTRE %20REGENERATION%20STRATEGY.pdf Lisburn City Council – Economic Development Annual Progress Report 20067 http://www.lisburncity.gov.uk/filestore/documents/economic_development/Fina l_PDF_of_0607_Progress_Report Expenditure and Financial Control Total Expenditure Declared for Measure 1.4 All amounts shown in € Allocation in Programme Complement Expenditure Declared in claims to the Commission EU Amount Public Amount Private Total 39,999,998.00 39,999,996.00 0.00 79,999,994.00 36,264,916.59 36,264,926.59 0.00 72,529,843.18 Expenditure declared as % of available Allocation Article 4 Activity All projects in this Measure received an Article 4 check. In total there were 200 Article 4 checks carried out. Summary of findings as a result of Article 4 Activity Article 4 checks on District Councils under Measure 1.4 (Local Economic Development) were carried out by DETI European Programmes Branch, Article 4 Team. This team carried out a risk analysis exercise prior to the commencement of visits to prioritise which Councils/Projects should be visited first. All projects listed on the EU database have had at least one on-site check, leading to follow-up visits and 4 received a second Article 4 check. Main findings of Article 4’s on District Councils highlighted the lack of Article 4 checks carried out by District Councils on 3rd party projects. DETI’s Article 4 166 90.66 BUILDING SUSTAINABLE PROSPERITY PROGRAMME VERSION 3 team took appropriate action to rectify this in subsequent follow-up checks. In addition to the individual Project Article 4 checks, District Councils were subject to close monitoring by the Finance and Project Development Section within DETI European Programmes Branch. District Councils were required to submit quarterly physical progress reports and financial claims, which under went rigorous checks and controls. They included desk checks, on site visits, inspection of original documentation and regular meetings at individual Council/Regional level. Article 10 Activity 7.44% of declared expenditure was examined under Article 10, revealing an error rate of 2.48%. Spread of Article 10 – 5% checks % checked 2000 2001 2002 2003 2004 2005 2006 2007 2008 0 0 4.09 20.22 8.69 5.42 5.69 8.09 6.68 Summary of findings as a result of Article 10 Monitoring The sampling methodology used for this Measure was based on a detailed risk analysis which ranked each Council according to their allocation; spend to date and any previous Article 4 history that was available. A similar risk analysis was used within each of the chosen District Councils to select the Schemes to be checked. Within each Scheme, a number of projects were chosen, to give a representative spread of type and size of projects towards meeting the annual 5% requirement. This methodology ensured that a good mix of different types and sizes of projects were visited including the largest Implementing Body. Out of the 26 Councils funded under this Measure 46% (12) were subjected to an Article 10 check. In addition, a special exercise was carried out at the request of the DGREGIO auditors which examined the “Start a Business Programme” which was funded by all the Councils and would have been the largest single final beneficiary funded under this Measure. 167 BUILDING SUSTAINABLE PROSPERITY PROGRAMME VERSION 3 It should be noted that the 5% target was not achieved in 2002 (4.09%) but was exceeded by a large margin in 2003 (20.22%). This is due to retrospective adjustments being made to the Central Database after the Verification work was completed. The Verification Unit are content that the verification work carried out, represents an even spread over the Programme period. No significant weaknesses were found during the Article 10 Inspections of this Measure. Following the first Verification check in 2005, a number of minor recommendations were made regarding missing clauses in the 3rd Party Letters of Offer. The Council subsequently revised the 3rd party Letters of Offer, so that they reflected all of the clauses in their own direct Letters of Offer from European Programmes Branch. An amount paid to the Belfast City Council that was deemed to be ineligible but was found to be a “one off” error where the Council were later in receipt of 50% of funding from another source for this item of expenditure. In addition a number of payments were made to a Consultant (Sian Henry) under the Start A Business Programme (SABp) which exceeded the amount agreed under the original contract. This amount was deemed ineligible and an irregularity was reported. No adjustment was required to be made to the Database as the overpayment was offset against the revised costs. As these irregularities were deemed to be “one off” in nature, no further additional vouching was required over and above the amount already checked (7.44%). Following a request from the DGREGIO auditors, the DETI Verification Unit carried out a detailed review of SABp. No major issues were found, although some minor weaknesses were pointed out in the Special Report 03/2007 issued on 27 March 2007. The DGREGIO auditors had requested an examination of 30 items relating to the Belfast City Council. However due to the way the SABp was run on a Northern Ireland-wide basis and administrated jointly between the Councils, the Steering Committee and the Central Administration Unit in Invest NI, it was not possible to isolate the costs 168 BUILDING SUSTAINABLE PROSPERITY PROGRAMME VERSION 3 relating to Belfast City Council. A full review of the SABp was carried out by the DETI Verification Unit to establish the total cost of running the Programme and to establish how many cases had been funded by each Council. A number of recommendations were made to DETI European Programmes and a revised Letter of Offer was issued to each Council - detailing the final total number of cases which were supported and approved. After all the adjustments were carried out, no adjustment to the database was required, as the amount of the irregularity was covered by the additional eligible cases identified. Irregularities Detected through Article 10 Checks Organisation/ Project UK Case No Belfast City Council Total irregularity £’s EU Element £’s Nature of irregularity (code) Date identified 66,879 33,439.50 325 March 05 Ards Borough Council N/a 194.63 97.31 Recordable only Dec 04 Ards Borough Council N/a 1,120.00 560.00 Recordable only Dec 04 SABp Consultancy Date reported to DFP QE Sept 2005 Sept 2005 Under reportable limit Under reportable limit Dec 2004 15,594.80 7,797.40 325 Dec 06 QE Mar 2007 QE Mar 2007 SABp C’Avon & N Down N/A 4,091.00 3,068.25 Recordable only Dec 06 Armagh District Council N/a 1,506.82 753.41 Recordable only May 08 Armagh District Council N/a 3,848.50 1,924.25 Recordable only May 08 Date cleared Under reportable limit Under reportable limit Dec 2004 No recovery necessary. Cost per case recalculate d. Recovered Currently being recovered Currently being recovered Audit Activity Details of Internal Audit activity can be found in Annex 12 and details of Commission Audit findings can be found in Annex 13. Irregularities A total of 38 irregularities were reported for this part of the Measure. Of these all were resolved before closure. A detailed list of all reported irregularities for 169 BUILDING SUSTAINABLE PROSPERITY PROGRAMME VERSION 3 Measure 1.4 can be found in Annex 15. Irregularities that were below the reporting threshold were recorded and details can be found in Annex 16. 170 BUILDING SUSTAINABLE PROSPERITY PROGRAMME VERSION 3 6.8 Measure Details for Measure 1.5 – Information Society Aims and Objectives The key aims were to ensure access to and application of new technologies by as wide a population as possible; and the rapid growth of the sector in NI developing the new technologies – through the channels of business start-up, indigenous company growth and inward investment. Along with this was the need to accelerate progress towards a highly attractive, dynamic and supportive knowledge-based economy. To achieve this, three key objectives were identified: • to encourage Northern Ireland companies and organisations to exploit e-commerce opportunities and address the threats; • to develop existing and attract new foreign direct investment ebusiness opportunities to Northern Ireland; and • to develop within the Department of Enterprise, Trade and Investment, an Information Age Unit to promote the benefits of ebusiness. To meet these objectives, Invest NI undertook the following activities: i. stimulate economic development by providing assistance towards the development of innovative e-business ideas; ii. improve access to and utilisation of e-commerce by SMEs and larger businesses; 171 BUILDING SUSTAINABLE PROSPERITY PROGRAMME VERSION 3 iii. promote new business start-ups and enhancing existing knowledge based industries; iv. increase business ICT use, establishing activities to enhance the abilities of organisations in Northern Ireland to use the new technologies and improve the way they conduct business; v. develop new sectors in the economy, thriving on the rapid developments in technology and promoting greater quality jobs therein; vi. establish North-South business links and local cross-border linkages to promote e-commerce opportunities; vii. develop and increase benchmarking abilities to measure progress, assess gaps, if any; and viii. ensure that appropriate infrastructural, promotional, legal and policy frameworks are in place for organisations within Northern Ireland to fully embrace the growth opportunities offered by the new technologies. Implementation Seven schemes were funded under this Measure: • E- Process; • E Solutions; • ICT Advisors; and • MIS; • Information Age Projects • ENI E Commerce Project; and • Tourism Industry Extranet. A list of all projects for Measure 1.5 which incurred expenditure and the ERDF element can be found in Annex 5. Examples of Projects within Measure 1.5 ICT Advisory Service incorporated Frylite Ltd and E-Business Roadshows. 172 BUILDING SUSTAINABLE PROSPERITY PROGRAMME VERSION 3 Frylite Ltd installed systems which enabled them to employ the latest technology, enhancing more effective running of their day-to-day business and enabling the firm to link their Strabane, Dublin and Galway sites together. E-Business Roadshows. These roadshows as highlighted in the 2006 Annual Implementation Report were located in Londonderry, Cookstown, Antrim and Banbridge, all strategically located for accessibility across the Province. They were very well received and perceived by businesses to increase awareness of ICT Practices. A reference to the e-Roadshows is available in www.nicva.org . Wilsons Country Ltd availed of the technical expertise and guidance of Invest NI’s ICT Advisory Team with the outcome of a streamlined approach to processes in the business, resulting in substantive efficiency savings when preparing and dispatching orders. 173 BUILDING SUSTAINABLE PROSPERITY PROGRAMME VERSION 3 Summary of Achievements V Targets for Measure 1.5 Original Indicator Position at Mid Term Evaluation Output Outputs are based upon progressing NI companies along the Connectivity Chain as follows: Revised Indicators Final Position Outputs are based upon progressing NI business relating to the DTI International Benchmarking Study report on ICT making business aware of the benefits of ICT 2 At least 2 programmes aimed at making business aware of the benefits of ICT 3 facilitating business access to ICT 1 At least 2 programmes aimed at facilitating business access to ICT 2 assisting business in the development of internet presence 1 1 programme aimed at assisting business in the development of e-business strategies 1 Working with business to develop websites for on-line trading Result Assist 4,600 SMEs by 2005 Not reported on 4,500 engagements with SMEs by 2005 10,224 (19) Assist 1300 SMEs by 2005 Not reported on 700 engagements with SMEs by 2005 1,251 (20) Assist 70 SMEs by 2005 Not reported on Assist 80 SMEs by 2005 Not reported on 70 engagements with SMEs by 2005 99 2175 174 BUILDING SUSTAINABLE PROSPERITY PROGRAMME VERSION 3 As a result of the Awareness Programme, there was a reported total of 1,122 SMES assisted by the end of 2001. This represented 23% of the overall measure target of 4,870. By the end of 2003, and mid term evaluation, this figure had risen to 4,449. At the end of 2007, this figure stood at unchanged at 10,224 SMEs assisted. (19) (20) The original target encouraging 700 companies to gain access to ICT was exceeded and stood at 1251. Invest NI update: Demand for ICT awareness and engagement increased slightly above expectations but considering the duration of the programmes and the economic and technological changes (eg. Broadband) that happened during the life time of the projects it is not surprising there is some differences against targets. On the whole Invest NI feel the programmes have over exceeded and that is to benefit of businesses and down to the delivery of the efficient delivery of the programmes. 175 BUILDING SUSTAINABLE PROSPERITY PROGRAMME VERSION 3 Summary of Achievements V Targets for Measure 1.5 (contd) Impact Achieve an increase in the number of bases businesses using trading ‘ecommerce’ website technology from 24% in 2000/01 to 40% by 2005 Achieve an increase in the number of recognised ‘e-business’ businesses in Northern Ireland from 10% in 2000/01 to 15% by 2005 NB. These impacts are based on the cumulative effect of all the outputs. Not available Not available Impacts will be accessed by measurement of the progress of NI business by the DTI International Benchmarking Study report on ICT. The key targets are: Achieve an increase in the measurement of Northern Ireland 28% in 2004 DTI based businesses towards sophistication in International ICT the use of ICTs from 15% to 30% Benchmarking Report NB. These impacts are based on the cumulative effect of all the outputs. 176 BUILDING SUSTAINABLE PROSPERITY PROGRAMME VERSION 3 Expenditure and Financial Control Total Expenditure Declared for Measure 1.5 All amounts shown in € Allocation in Programme Complement Expenditure Declared in claims to the Commission EU Amount Public Amount Private Total 11,750,000.00 3,916,667.00 0.00 15,666,667.00 10,927,848.62 3,642,616.51 0.00 14,570,465.13 Expenditure declared as % of available Allocation 93.00 Article 4 Activity All projects were subject to Article 4 checks. Summary of findings as a result of Article 4 Activity ICT Advisory Service and the E-Solutions ICT Demonstration Centre European Programmes’ Article 4 Team carried out an Article 4 check in July 2007 on two schemes under Measure 1.5 - ICT Advisory Service and the ESolutions ICT Demonstration Centre. The main findings common to both ICT Advisory Service and E-Solutions were: (i) Invest NI not having background papers on LoO/MoU from DETI; (ii) No evidence of EU logo on website; and (iii) No Development Path Analysis completed. E-Solutions had a further recommendation: (i) Original invoices to be endorsed with cheque/BACS run number. Invest NI has since rectified all matters referred to above. Information Age Projects - European Programmes’ Article 4 Team carried out an Article 4 check on Information Age projects in August 2008. The main finding concerned an amount of recoverable VAT which was claimed under 177 BUILDING SUSTAINABLE PROSPERITY PROGRAMME VERSION 3 the Tourism Extranet project. An irregularity has been declared and the relevant amount deducted on the EU database – irregularity closed. ENI – E Commerce Project - European Programmes’ Article 4 Team carried out an Article 4 check on ENI E Commerce project in February 2009. Article 4 completed. No major issues identified. Article 10 Activity 6.94% of declared expenditure was examined under Article 10, resulting an error rate of 22.24%. Spread of Article 10 – 5% checks % checked 2000 2001 2002 2003 2004 2005 2006 2007 2008 4.85 19.37 5.46 5.39 5.06 7.10 6.09 0 0 Summary of Findings as a Result of Article 10 Monitoring The two largest schemes and one of the smaller ones were selected from this Measure for Verification checks. Payments, representing at least 5% of the annual total expenditure, were selected from the lower level (Co-financing) database payment records, for the relevant scheme for each year using interval sampling methodology. In addition, further selections were made to ensure that the main beneficiaries of each scheme were also included. In total the sample checks carried out on this Measure amounted to 7%. On the ENI e-commerce scheme, two reportable irregularities were found. These related to an amount of £16,000 where documentation could not be traced and £125,046 where project expenditure had been over-declared. However these were deemed to be one-off irregularities and were not of a systemic nature and therefore no additional checks were carried out. 178 BUILDING SUSTAINABLE PROSPERITY PROGRAMME VERSION 3 Irregularities detected through Article 10 Checks Organisation/ Project MIS Scheme Navital MIS Scheme Impro Printing MIS Scheme McMullan Arch. MIS Scheme Capedale MIS Scheme Bullivant Taranto MIS Scheme BHP Alarms MIS Scheme Stewart Digital ENI E Commerce LEDU Pilot ENI E Commerce DETI Grant P’ment UK Case No N/A Total irregularity £’s 4,550.00 EU Element £’s 3,412.50 Nature of irregularity (code) Recordable only Recordable only Recordable only Date identifie d Jan 2008 Date reported to EC N/A N/A 3,066.90 2,300.18 Jan 2008 N/A N/A N/A 767.84 575.88 Jan 2008 N/A N/A N/A 357.44 268.08 Recordable only Recordable only Jan 2008 N/A N/A N/A 1,962.00 1,471.50 Jan 2008 N/A N/A N/A 175.00 131.25 Recordable only Recordable only Jan 2008 N/A N/A N/A 179.00 134.25 Jan 2008 N/A N/A 16,836.22 12,627.17 Vat Irregularity Jan 2008 30.6.09 Open 125,046.50 93,784.88 Vat Irregularity Jan 2008 30.6.09 Open Audit Activity Details of Internal Audit activity can be found in Annex 12 and details of Commission audit findings can be found in Annex 13. Irregularities A total of 6 irregularities were reported for this Measure all of which were resolved. Details of these are available on Annex 15. Irregularities that were below the reporting threshold were recorded and can be found in Annex 16. 179 Date cleared N/A BUILDING SUSTAINABLE PROSPERITY PROGRAMME VERSION 3 6.9 Measure Details for Measure 1.6 – Roads and Transport Aims and Objectives The three main aims in this Measure are to:• facilitate travel by enhancing public transport services through the introduction of dedicated buses and quality bus corridors within the Belfast urban area; • further the concept of integrated public transport by introducing integrated ticketing throughout the public transport network; and • improve peak hour journey times by an average of 35% through the provision of several road bypasses. Implementation The value of this Measure was €113,766,667 including an ERDF allocation of €85,325,000. Eleven projects were assisted under this Measure. The Measure was divided into sub-Measures (a) Roads and (b) Transport, details of which are provided at sub-Measure level. A list of all projects for Measure 1.6 which incurred expenditure and the EU element can be found in Annex 5. Assessment and Summary of Achievement v Targets Details can be found within the sub-Measure reports for 1.6(a) and 1.6(b). Publicity One of the projects under Measure 1.6(a) was the Newtownstewart By-pass. 180 BUILDING SUSTAINABLE PROSPERITY PROGRAMME VERSION 3 Under Measure 1.6(b) Lisburn Bus centre was upgraded. Further information on both of theses projects can be found in Annex 18. Expenditure and Financial Control Total Expenditure Declared for Measure 1.6 All amounts shown in € Allocation in Programme Complement Expenditure Declared in claims to the Commission EU Amount Public Amount Private Total 85,325,000.00 28,441,667.00 0.00 113,766,667.00 85,312,668.99 30,317,855.47 0.00 115,630,524.46 Expenditure declared as % of available Allocation 101.64 Article 4 Activity A total of 11 projects were assisted under this Measure and all subject to Article 4 checks. Summary of Findings as a result of Article 4 Activity. The findings for sub-Measure 1.6(a) and sub-Measure 1.6(b) are detailed in the respective reports. Article 10 Activity 19.34% of declared expenditure was examined under Article 10 covering both parts of the Measure, with an error rate of 0%. 181 BUILDING SUSTAINABLE PROSPERITY PROGRAMME VERSION 3 182 BUILDING SUSTAINABLE PROSPERITY PROGRAMME VERSION 3 Spread of Article 10 – 5% checks % checked 2000 2001 2002 2003 2004 2005 0 6 7 9 18.9 2006 2007 2008 22.14 28.65 54.71 0 Summary of findings as a result of Article 10 activity There were a total of 11 projects funded under the Measure and 7 projects have been examined over the review period. There were 5 schemes funded under this Measure; 1 bridge strengthening and 4 roads schemes. Management and control systems operated effectively and adequate documentation exists to support Programme expenditure declarations. No financial errors were identified during the course of Article 10 work and where recommendations were made they have been addressed by management. No irregularities were detected through Article 10 Verification process. Audit Activity This Measure was implemented by two different parts of the Department for Regional Development details of internal audit activity for each sub-Measure are provided in Annex 12 and details of DGREGIO audit findings are provided in Annex 13. Irregularities There were no irregularities reported for this part of Measure 1.6. 183 BUILDING SUSTAINABLE PROSPERITY PROGRAMME VERSION 3 Sub-Measure Details 1.6(a) - Roads Aims and Objectives As Northern Ireland faced new economic challenges and opportunities, need was identified for further development of its infrastructure. A key challenge was to provide road improvements that supported sustainable economic development, widened opportunities for work, leisure, holidays and choice of where to live. This Measure addressed this need and aimed to sustain and develop social progress, economic growth and sustainable development opportunities through promoting integrated rural and urban development and reducing peak journey times. The projects carried out were in line with a number of high level transportation strategies including the Regional Development Strategy, Regional Transportation Strategy and Sub-Regional Transport Plan. Key objectives were to: • Improve peak journey times through the provision of several road bypasses; and • support economic growth and sustainable development, equality of opportunity in access to employment, training and education and sustainable urban and social development by investments in infrastructure projects. Implementation Five projects were approved under this Measure. incurred and the EU element can be found in Annex 5. 184 Details of expenditure BUILDING SUSTAINABLE PROSPERITY PROGRAMME VERSION 3 Summary of Achievements V Targets for Measure 1.6(a) Original Indicator Output 4 by-pass schemes Position at Mid Term Evaluation Revised Indicators 2 3 by-pass schemes 1 Through-pass scheme 1 Link Road Final Position 3 Complete Not funded through this measure Complete 1 Bridge strengthening scheme Result 14km of new carriageway 12.4km 12.1 km of new carriageway Strengthen structure to increase capacity to Complete carry the maximum 40 tonne HGV vehicles Repainting and resurfacing the bridge 6.2km Impact Reduced peak journey times by an Not available average of 35% for each scheme measured through surveys held in advance of the project and after completion of the project. Reduced peak journey times by an average of Newtownstewart bypass = 47% 35%. Limavady bypass = 32% Comber bypass = 44.5% Bridge now has Bridge capable of extra carrying capacity to capacity to deal meet future demand, which will see the with 40 tonne numbers of HGVs increasing from 2700 per HGVs and the day to 3200 per day over the next 10 years. expected future Painting will provide required protection for demand next 20 years. 185 BUILDING SUSTAINABLE PROSPERITY PROGRAMME VERSION 3 Control Activity Details of expenditure declared are provided in the Measure summary. Article 4 All 5 projects in this Measure were subject to Article 4 checks. Summary of findings as a result of Article 4 activity • Newtownstewart Bypass – no weaknesses found • Limavady Bypass – no weaknesses found • Foyle Bridge strengthening – no weaknesses found • Comber Bypass – no weaknesses found • Omagh Throughpass – no weaknesses found Article 10 Details of Article 10 verification activity are provided in the Measure level summary. Audit Activity Internal Audit activity can be found in Annex 12 and details of Commission audit findings can be found in Annex 13. 186 BUILDING SUSTAINABLE PROSPERITY PROGRAMME VERSION 3 Sub- Measure 1.6(b) Details – Transport Aims and Objectives An effective transport network is critical to improving the competitiveness of the Northern Ireland economy, to encourage labour market access and mobility and promote equality of opportunity across Northern Ireland. This Measure aimed to address this gap by improving access to Public Transport and thus opportunity for those in peripheral rural and deprived urban areas. The delivery of a modern, integrated and sustainable transport system will have a major effect at local level on the basis of access to education, training, employment and recreational opportunities, improve travel choice and assist greatly in changing the travel culture in Northern Ireland so that people can adopt more sustainable and healthier travel habits and it will further enhance the development of the TEN-T Network. Key objectives: • facilitate travel by enhancing public transport services through the development of improved bus services along key transport corridors and enhancement of bus provision in rural and isolated communities; • improve the safety of the rail network and enhance the overall provision for the transport of goods and passengers by rail on the TEN-T network; and • support economic growth and sustainable development, equality of opportunity in access to employment, training and education and sustainable urban and social development by investments in infrastructure projects. Implementation Six projects were approved under this Measure. • New Rolling Stock - The aim of this project was to enhance and modernise the operation of integrated transport across Northern Ireland through the purchase of a number of the new CAF Trains for Northern Ireland Railways, which first came into service in November 2004. Eight trains were purchased and associated infrastructure completed. The introduction of the new trains greatly 187 BUILDING SUSTAINABLE PROSPERITY PROGRAMME VERSION 3 contributed towards the annual 11% increase in rail passenger journeys since 2005. • Refurbishment of Falls Road Running Repair Depot Stage 1 - This project contributed to an overall objective of upgrading urban bus depot projects and ensuring compliance with health & safety standards. The projected impact was an improved urban public transport system and more efficient movement of people. The project is now compliant with health & safety standards. • Translink Accounting System - The aim of this project was to replace the old system with a new fully integrated accounting system which would provide better management capabilities and information. The 1st phase Sales and Cash went ‘live’ on 27 June 2005 and approximately 150 users were trained. The Requisitioners and Stores Planning Phase went 'live' in November 2005 and the entire new Accounting System has now gone live and is complete. • Falls Road Mechanical & Electrical System - This project followed on from the Refurbishment of the Falls Road Running Repair Depot Stage I. This project contributed to an overall objective of upgrading urban bus depot projects and ensuring compliance with health & safety standards. The projected impact was an improved urban public transport system and more efficient movement of people. The project is now compliant with Health & Safety standards. • Short Strand Bus Depot - This project contributed to an overall objective of upgrading urban bus depot projects and ensuring compliance with health & safety standards. The provision of this facility achieved its main objective of providing a modern facility for Translink’s passengers and staff. The project is now compliant with health & safety standards. • Lisburn Bus Station - The aim of this project was to provide a new rural bus station with improved passenger and staff facilities which would improve accessibility and social inclusion as well as contributing towards more sustainable movement of people. The ERDF funding related to preliminary works which are now complete. 188 BUILDING SUSTAINABLE PROSPERITY PROGRAMME VERSION 3 Summary of Achievements V Targets for Measure 1.6(b) Original Indicator Output Urban/rural public transport infrasctucture projects including Ballymena Bus and Rail Station and other projects serving rural Communities. Introduction of passenger Information/Long Line Public Address system and Global positioning Satellite system Position at Mid Term Evaluation 4 Revised Indicators Final Position 1 new rural bus station 3 Urban bus depot projects Introduction of Customers Information, replacement of management systems and 2 other transport related schemes 1 3 Project withdrawn Passenger information system/longline public address system – project withdrawn Refurbishment of Falls Rd running repair shop complete Replacement of the mechanical and electrical system at the Short Strand bus depot Not reported on 189 BUILDING SUSTAINABLE PROSPERITY PROGRAMME VERSION 3 Summary of Achievements V Targets for Measure 1.6(b) (contd) Result New urban/rural bus and rail projects 0 and enhanced services in isolated communities. Increased patronage on bus system in key transport corridors, reduced journey times and improved reliability Innovative schemes to complement high-level strategies to interface with RTS and the introduction of the integrated ticketing scheme New passenger and staff facilities at 1 rural bus station Compliance with H&S standards and upgrade of 3 urban bus depots 4 innovative schemes to complement high level management strategies Complete Complete Translink accounting system complete 0 Complete (reported on original indicator -completed 2006) Impact Improvement in accessibility, social Not available inclusion and more sustainable movement of people. Improvement in accessibility, social inclusion Compliance with DDA. The and more sustainable movement of people. purchase of the More efficient movement of people and new trains provides a more sustainable improved urban transport systems. movement of people by Enhance and modernise the operation of facilitating the improved integrated transport across Northern Ireland timetabling of services. More efficient movement of people and Not available improved urban transport systems. Enhance and modernise the operation of integrated transport across Northern Ireland Complete 190 BUILDING SUSTAINABLE PROSPERITY PROGRAMME VERSION 3 Control Activity Details of expenditure declared are provided in the Measure summary. Article 4 All 6 projects in this Measure were the subject of Article 4 checks. Summary of findings as a result of Article 4 activity • Translink Accounting System: EU emblem to be placed on training manual and plaque to be erected at Milewater Road Office. • Lisburn Bus Station: Plaque to be erected at Station. • New Rolling Stock: Plaques to be erected on new Trains financed by BSP. All of the above recommendations were implemented. Article 10 Details of Article 10 activity are provided in the Measure level summary. Audit Activity for Measure 1.6(b) Internal Audit activity can be found in Annex 12 and details of DGREGIO audit findings can be found in Annex 13. Irregularities Details of irregularities are provided at Measure 1.6 summary level in Annexes 15 and Annex 16. 191 BUILDING SUSTAINABLE PROSPERITY PROGRAMME VERSION 3 6.10 Measure Details for Measure 1.7 - Telecommunications Aims and Objectives The Measure aims to stimulate investment in, and accelerate the development of, costcompetitive broadband communications infrastructure and services with the objective of supporting balanced regional development. Stimulating demand for advanced communications and electronic commerce infrastructure and services will facilitate and encourage competition and investment in peripheral, remote and less developed areas. Implementation Two projects were approved and funded under this Measure and details of expenditure incurred and the EU element can be found in Annex 5. The total value of this Measure was €38,973,334 including an ERDF allocation of €29,230,000. Measure 1.7 Telecommunications is split into two main elements, ie the DETI element and the C2K project for which the Department of Education was responsible. The most significant change has been the increase in the number of households with broadband access. It is now estimated that 350,000 premises have a broadband service. There has, however, been little significant change in the business use of broadband. The biggest change in the market has been the general increase in broadband speeds available. This is now becoming a focus of attention for regulators, the telecommunications industry and government. Northern Ireland has achieved 100% broadband availability, meaning every household, business, library or school has the opportunity to access broadband regardless of location. As broadband penetration in homes, businesses, schools and libraries increases, the risk of “digital exclusion” decreases. 192 BUILDING SUSTAINABLE PROSPERITY PROGRAMME VERSION 3 Examples of Projects for Measure 1.7 The following three examples all come under scheme Tele/M7 (006723). Broadband Fund In October 2001 - DETI secured a share of the DTI’s UK Broadband Fund for Northern Ireland. The Department issued 3 calls for proposals seeking feasibility studies and pilot projects to explore innovative ways of extending broadband technologies. DETI received 110 applications for funding and went on to support of 42 projects. A subsequent DTI evaluation of the Fund (Hyder Consulting 2005) highlighted the quality of the DETI decision-making process in the use of the Fund and commended the NI projects for adherence to best practice. Flagship - The aim of the Broadband Flagship initiative was to attract proposals for the development of leading edge broadband applications and services that will showcase broadband design and innovation in Northern Ireland. A project from Derry City Council and the University of Ulster was chosen for the Northern Ireland Flagship initiative and explored the benefits of broadband networks for the delivery of e-tourism, e-learning and e-government in the City. The project had a number of strands including a leading edge wireless network within the City’s walls, providing specific services for tourists such as historic information, eating guides and shopping opportunities to wireless devices such as PDAs or laptop computers. http://www.wirelessderry.com/index.htm 100% Broadband - On 29 March 2004, following a competitive tendering process. DETI awarded BT a contract for the provision of broadband services across Northern Ireland. The purpose was to ensure there was 100% availability of broadband services to all business and households by the end of December 2005. This was achieved ahead of schedule on 9 December 2005. Northern Ireland is therefore the first region in the UK (outside London) to have its telecommunications network upgraded so that all exchanges are broadband enabled. Some 99.15% of the population now has access to broadband of at least 512kbps through enabled exchanges. The remaining homes and businesses have access to broadband 193 BUILDING SUSTAINABLE PROSPERITY PROGRAMME VERSION 3 through either wireless or satellite technology. Broadband services are now available to every household and business in Northern Ireland. Visit Internet World Stats for further information on Broadband. Classroom 2000 (C2K) Project- www.c2kni.org.uk - C2K on behalf of the five education and library boards is responsible for the provision of an information and communications technology (ICT) managed service to all schools in Northern Ireland. C2k was supported by the Department of Education for Northern Ireland and delivered to schools high quality, sustainable infrastructure, connectivity and resources to meet strategic targets. Grant-aided schools received a core entitlement, based on pupil numbers, which included: • an infrastructure with desktops and laptops connected to the Internet and linked to legacy systems; • access to a wide range of content and services to support the Northern Ireland Curriculum and the professional development of teachers; • an integrated suite of services for school administration and management; connection of schools' networks into a single education network across Northern Ireland, with tools to facilitate the development of on-line teaching and learning; • full service support through a central help desk; • a flexible online learning environment called LearningNI; • a library of digital resources in LearningNI licensed from educational publishers; and • a secure online communications environment for all schools in Northern Ireland. 194 BUILDING SUSTAINABLE PROSPERITY PROGRAMME VERSION 3 Summary of Achievements V Targets for Measure 1.7 Original Indicator Output Percentage of exchanges capable of providing enhanced telecommunications services, rising from 10% to 70% Result The percentage of NI geographical area with access to advanced telecommunications rising from 11% to 60%. Impact An increase in the use of enhanced telecommunications facilities by business. Jobs created as a by-product of the measure Position at Mid Term Evaluation Revised Indicators Final Position 5% Percentage of exchanges capable of 100% providing enhanced telecommunications services, rising from 10% baseline in 2000 to 100%by end December 2005. 40% The percentage of NI geographical area with access to advanced telecommunications rising from 11% baseline in 2000, to 100% by end December 2005. 100% Not available 10 new telecoms-intensive firms to be established 13 Not available An increase in the use of enhanced telecommunications, in particular basic broadband services, from a baseline figure of 1% in 2000 rising to 12% of household take up, and 20% of business take up by the end of 2005 49% NI households. 76% have internet access 65% of business use broadband (December 2007 survey) 195 BUILDING SUSTAINABLE PROSPERITY PROGRAMME VERSION 3 Expenditure and Financial Control Total Expenditure Declared for Measure 1.7 All amounts shown in € Allocation in Programme Complement Expenditure Declared in Claims to the Commission EU Amount Public Amount Private Total 29,230,000.00 9,743,334.00 0.00 38,973,334.00 30,218,181.37 10,073,288.66 0.00 40,291,470.03 Expenditure declared as % of available Allocation 103.38 Article 4 Activity All projects in this Measure were subject to an Article 4 check. Summary of findings as a result of Article 4 activity Article 4 checks were carried out by the Article 4 Team in European Programmes on Telecoms Policy Unit in their role as a BSP Implementing Body. The standard Implementing Body checklist was used and the check was completed in the latter part of the Programme period when the Measure was well underway. Key Findings • Letters of Offer to lower level projects did not contain all standard clauses; • Article 4 checks at project level were not carried out on a risk analysis basis; • no appeals process available for rejected projects; and • no procurement procedures applied in relation to certain projects. European Programmes Article 4 Team followed up with Telecoms Policy Unit to ensure that all recommendations in the agreed action plan were carried out. As part of the management of this Measure, Telecoms Policy Unit had in place a range of management and control procedures and undertook Article 4 checks on each lower level project co-financed under their Measure. 196 BUILDING SUSTAINABLE PROSPERITY PROGRAMME VERSION 3 Article 10 Activity 14.54% of declared expenditure was examined under Article 10, revealing an error rate of 1.24%. Spread of Article 10 – 5% checks % checked 2000 2001 2002 2003 2004 2005 2006 2007 0 0 36.86 21.46 36.49 13.21 5.73 19.45 2008 Summary of Findings as a Result of Article 10 Activity Due to the nature of the expenditure in this measure and the need to achieve an annual sample of at least 5%, a number of different methodologies were used. Examples below: Telecommunications projects 2000–2004. A printout from the BSP Central Database showing all payments made to projects under Measure 1.7 for the period January 2000 to December 2004 was obtained. Within these years, individual projects were then selected using the following rationale:Only two projects had expenditure in 2002:- Western Connect and Fermanagh District Council. As Western Connect had several other projects with expenditure in 2003, Fermanagh District Council was selected for 2002. Projects with expenditure in 2003 were selected using an interval sampling technique by taking the first and last project and every third one in between. Payments to the large BT contract began in 2004 and as this was the largest project it was selected to cover the 5% target for 2004. During the Article 10 check, issues were uncovered in connection with the Western Connect projects and therefore the sample was extended to include an additional project – Dungannon and South Tyrone District Council. 197 BUILDING SUSTAINABLE PROSPERITY PROGRAMME VERSION 3 In addition, as mentioned above, a file review of all projects in this Measure was carried out to enable us to quantify the amount of expenditure which had been paid out on the basis of notional Labour costs. Telecommunications projects 2000–2004. A number of weaknesses were found during the Verification of the Telecoms projects for the 2000–2004 years. The branch was responsible for maintaining their local co-financing database which recorded details of payments, letters of offer etc. at project level. A number of inaccuracies were found in the data that had been entered. In addition it was found that a number of projects had been paid Grant on the basis of Notional Labour hourly rates and not actuals. A full review was carried out by the Verification Unit to establish the level of database errors and to quantify the amount of ineligible Grant that had been paid out in respect of Notional Labour costs. Following the review the Database errors were corrected by the branch and 16 irregularities were reported along with corresponding adjustments to the expenditure. Telecommunications Infrastructure Support for First Level Education 2005 – 2007. This was treated as a separate exercise and two out of the five Education and Library Boards were selected for the Verification checks. The Western Education & Library Board was the Implementing agent and took the lead on this project on behalf of the other Boards. The Verification Team therefore selected this Board for the Verification inspection and in addition, the Belfast Education & Library Board which was the only Board that had drawn down expenditure during the 2007 calendar year. No issues were found during the Verification of the above expenditure for the years 2005 2007. The Management and control systems were found to be functioning effectively; comprehensive Article 4 checks had been carried out by Telecoms branch and as a result of the level of Grant expenditure checked for this period (10.24%) a high level of assurance can be given. A revised Allocation letter was issued on 4 October 2007 increasing the allocation to £13.27m. 198 BUILDING SUSTAINABLE PROSPERITY PROGRAMME VERSION 3 Irregularities detected through Article 10 Checks Organisation/ Project UK Total Case irregularity No £’s EU Element Nature of Date irregularity reported (code) to EC BBF 001/02 39,881.00 29,910.75 325 June 06 BBF 002/02 6,773.00 5,079.75 325 June 06 BBF 039/02 16,400.00 12,300.00 325 June 06 BBF 101/03 39,716.34 29,787.26 325 June 06 BBF 102/03 20,735.00 15,551.25 325 Oct 05 2,630.00 1,972.50 Recordable June 06 BBF 105/03 only BBF 106/03 50,500.00 37,875.00 325 June 06 BBF 109/03 41,840.00 31,380.00 325 June 06 BBF 111/03 0,820.40 8,115.30 325 June 06 BBF 113/03 17,251.26 12,938.45 325 June 06 BBF 121/03 35,884.28 26,913.21 325 June 06 BBF 122/03 21,755.52 16,316.64 325 June 06 BBF 130/03 17,733.65 13,300.24 325 June 06 BBF 131/03 7,785.31 5,838.98 325 Oct 05 BBF 204/04 4,000.00 3,000.00 325 June 06 BBF 025/02 50,000.00 37,500.00 325 June 06 Audit Activity Internal Audit activity can be found in Annex 12 and details of Commission audit findings can be found in Annex 13. Irregularities A total of 13 irregularities were reported for this Measure all of which were cleared. A detailed list of all reported irregularities for Measure 1.7 can be found in Annex 15. Irregularities that were below the reporting threshold were recorded and can be found in Annex 16. 199 BUILDING SUSTAINABLE PROSPERITY PROGRAMME VERSION 3 6.11 Measure Details for Measure 1.8 - Energy Aims and Objectives This Measure aims to provide an energy infrastructure that meets the standards required by the Northern Ireland economy through:• promoting the strategic development of an efficient, economic and environmentally sustainable electricity industry in Northern Ireland; • promoting the development and maintenance of an efficient, economic and coordinated gas industry in Northern Ireland; • promoting the development of new and renewable forms of energy where it is economically attractive and environmentally acceptable; and • promoting energy efficiency in the context of the development of overall energy policy. Implementation A total of 5 projects were approved under this Measure, however, three remained nonoperational at closure. A list of all projects for Measure 1.8 which incurred expenditure and the EU element can be found in Annex 5. The Measure was split into sub-Measures (a) Energy Infrastructure and (b) Energy Efficiency with 1 project approved in each sub-Measure. The total value of the Measure was €22,173,334 including an ERDF element of €16,630,000. Details of activities undertaken for each element are found in the sub-measure reports. Examples of Publicity Plaques were placed at the Carrickefergus and Coolkeeragh power stations on completion of the North-West Gas pipeline. Document.pdf Document.pdf 200 BUILDING SUSTAINABLE PROSPERITY PROGRAMME VERSION 3 Expenditure and Financial Control Total Expenditure Declared for Measure 1.8 All amounts shown in € Expenditure declared as % of available Allocation EU Amount Public Amount Private Total Allocation 16,630,000.00 5,543,334.00 0.00 22,173,334.00 Expenditure Declared 16,628,173.70 5,639,395.09 0.00 22,267,568.79 100.42 Article 4 Article 4 checks were carried out on both projects in this Measure. Details of Article 4 findings for sub-Measure 1.8(a) and sub-Measure 1.8(b) can be found under each report. Article 10 41.63% of declared expenditure was examined under Article 10, revealing an error rate of 0.07%. Spread of Article 10 – 5% checks % checked 2000 2001 2002 2003 2004 2005 0 0 21.46 39.76 41.98 100 2006 2007 2008 0 100 0 Summary of findings as a result of Article 10 activity This was a relatively small scheme with 18 projects supported. Two verification exercises were carried out on this sub-Measure during the lifetime of the BSP Programme. The first exercise in 2004 selected 3 projects (1 large, 1 medium & 1 small) supported during the years 2002-2004, to give a representative spread of type and size of projects towards meeting the annual 5% requirement. The second Verification exercise carried out in March 2009 selected the two projects with expenditure in 2005 and 2007. These were the only projects with expenditure drawn down in these years and therefore expenditure for these two years has been vouched 100%. No expenditure was drawn down in respect of 2006. The total amount vouched for this sub-Measure is 23.32%. 201 BUILDING SUSTAINABLE PROSPERITY PROGRAMME VERSION 3 No common problems or significant weaknesses were uncovered during the verification of this sub-Measure. During the early years of the Programme, it was found that the Letters of Offer lacked some of the required standard paragraphs relating to publicity and tendering. However, in all but one case inspected, the projects had erected plaques acknowledging EU funding. Tendering was subsequently not found to be an issue as these were relatively small projects which were funded by small private companies and sole traders. Following the first verification exercise to the branch, a number of minor recommendations regarding Letters of Offer, Article 4 checks and the recording of irregularities were made. These were followed up at the time of the second Verification exercise in 2009 and were found to have all been satisfactorily addressed. A post-project evaluation of all the projects funded under the EDS scheme, has now been completed by independent consultants and is available from Energy Branch and is detailed below. Renewable Energy PPE Detailed Findings No Irregularities were detected through Article 10 Checking. Audit Activity Internal Audit activity can be found in Annex 12 for sub-Measure 1.8 (a) and sub-Measure 1.8(b). Details of Commission audit findings can be found in Annex 13. Irregularities There were no reported irregularities for Measure 1.8 and any recorded irregularities can be found in Annex 16. 202 BUILDING SUSTAINABLE PROSPERITY PROGRAMME VERSION 3 Sub- Measure Details 1.8(a) – Energy Infrastructure Aims and Objectives The purpose of this element of the Measure was: • the development of the natural gas industry outside the Greater Belfast area and in particular to the SE and North/North West of Northern Ireland and • further North/South interconnection in line with the opening up of the electricity market under the provisions of the EU Electricity Directive. Implementation One project was approved in this sub-Measure. The sole project funded under Measure 1.8(a) is the Northern Ireland North West Gas Pipeline Project. This project was approved by the European Commission as a major project. Commission Decision C (2005) 2700 dated 7 July 2005 (Reference 2002GB161PR005) awarded the project ERDF of €16.24m. The North-West pipeline was completed in October 2004 by Bord Gáis Eireann (BGE) and is supplying the power station at Coolkeeragh outside Londonderry. The pipeline brings natural gas to 5 urban areas in the North West - Ballymena, Ballymoney, Coleraine, Limavady and Londonderry. It was laid between Carrickfergus and Londonderry. 203 BUILDING SUSTAINABLE PROSPERITY PROGRAMME VERSION 3 Summary of Achievements V Targets for Measure 1.8(a) Original Indicator Output KM of gas pipeline laid: North/West – 116km South/North – 140km Position at Mid Term Evaluation KM of gas pipeline laid: North/West – 116km 0 0 Increase level of physical electricity interconnection between NIE and ESB systems Result Numbers of customers connected: North/West – 9,000 South/North – 4,500 0 Increased security of supply 0 Revised Indicators Final Position 116km (South/North not funded through this measure) 0 0 Numbers of customers connected: North/West – 9,000 1,949(includes power station) Reductions in CO2: North/West – 16,800t 499,671 tonnes CO2 (includes power station) Increased opportunity for crossborder trading of electricity Impact Reductions in CO2: North/West – 16,800t South/North – 9,600t Not available Not available Fewer interruptions to power supply Not available Evolution of larger electricity market leading to reduced prices Not available 204 BUILDING SUSTAINABLE PROSPERITY PROGRAMME VERSION 3 Control Activity Article 4 During the life of this project there were 2 Article 4 checks carried out. Summary of findings as a result of Article 4 Activity Energy Division project Article 4 check March 2004. Information was comprehensive and showed a clear audit trail. Expense claims were closely monitored and 100% of invoices were checked which equates to 100% of total eligible expenditure. Administrative systems operate effectively and operations are up-todate and complete. The project had several vouching exercises carried out in the majority of categories of invoice. Therefore one Article 4 visit was deemed satisfactory as strict monitoring and audit controls were in place. Standard DETI checklist was used. European Programmes Implementing Body Article 4 check May 2007. This was an Article 4 check carried out by the Article 4 Team in DETI on Energy Division in their role as a BSP Implementing Body. Key Findings • Application & appraisal process where in line with DETI policy. • Letter of Offer issued Feb 03 – at which time no EU funding was involved (remedial action has since been taken by Energy Division). Under publicity, the LoO makes reference to publicising financial contribution in the event of funding. • No official Article 4 proformas completed (remedial action has since been taken by Energy Division). • Financial procedures established operated effectively and 100% checks on all claims verify eligibility of claims. • Administration systems operated by Energy are sufficient to monitor and evaluate the project. • Procedures in place to effectively deal with irregularities. • Project & final payments have been completed. • Appropriate logos have been used where possible. 205 BUILDING SUSTAINABLE PROSPERITY PROGRAMME VERSION 3 Article 10 Details of Article 10 activity are included in the Measure summary. Audit Activity Internal Audit activity can be found in Annex 12 for Measure 1.8(a). Details of Commission audit findings can be found in Annex 13. In addition, the Northern Ireland Audit Office (NIAO) conducted an audit of the project in 2004 and raised no issues of concern. Irregularities Details of irregularities are provided at Measure 1.8 summary level in Annex 15 and Annex 16. 206 BUILDING SUSTAINABLE PROSPERITY PROGRAMME VERSION 3 Sub- Measure Details 1.8(b) – Energy Efficiency Aims and Objectives • to improve energy efficiency and the uptake of renewable energies; • to remove barriers to increasing energy efficiency; • to reduce dependency on fossil fuels; • to promote a cleaner environment; and • to stimulate investment in energy efficiency, renewable energies and combined heat and power. Implementation One project was approved under this Measure. Two projects remained non-operational at closure. Within this project, organisations were funded to install various renewable energy technologies under the Energy Demonstration Scheme with a grant allocation of £355,881.00. Details of expenditure incurred and the ERDF element can be found in Annex 5. A post-project evaluation was performed for each project under the Energy Demonstration Scheme. The projects which installed biomass boilers, eg Rural Generation, were very successful in terms of energy savings and value for money. Wind turbine installations were not as successful and a few projects encountered problems with installations and did not achieve the energy savings expected at time of application. Most projects, except Craigavon Industrial Development Organisation, Share Holiday Village, Mulsanne Casinos, Brian Henry Wind Development demonstration, Wingrove Farm wind turbine and Robert Richmond wind development demonstration were successful in achievement of objectives. The main reason for reduced success was failure of technology and lack of knowledge in the industry. It is important to note, however, that these technologies were still fairly new to the Northern Ireland market and required this Measure to assess and monitor the technologies and demonstrate their benefits or otherwise to both the public and government. To this end the Measure has been very successful in raising awareness of the technologies and therefore assisting Government in meeting its energy targets. Even those projects which were not 207 BUILDING SUSTAINABLE PROSPERITY PROGRAMME VERSION 3 as successful succeeded in drawing attention to areas requiring investment and increased training, thus helping to develop the renewable energy market in Northern Ireland. 208 BUILDING SUSTAINABLE PROSPERITY PROGRAMME VERSION 3 Summary of Achievements V Targets for Measure 1.8(b) Original Indicator Output Information requests from prospective projects Result Projects supported Impact 20% reduction in number of tonnes of CO2 consumed per project 10% reduction in energy cost and consumption in assisted projects Position at Mid Term Evaluation Revised Indicators Final Position 7 (Demonstration projects) 20 demonstration projects supported over the lifetime of the programme 18 22 (Information requests per project) At least 150 information packs issued in response to requests over the lifetime of the programme 200 Not available Specific positive environmental impacts directly attributable to the projects including 1,200 tonnes of CO2 emissions savings over the lifetime of the programme End of Prog (21) Some of the projects had difficulty measuring energy or fuel usage, and in particular reductions in CO2. Some the technologies involved were developing or not suited to Northern Ireland weather, and in cases broke down. Therefore some figures are not available. From the figures measured and supplied, there were a total of £9,500 savings in energy costs and 2.3 million litres reduction in CO2 emissions. (21) 209 BUILDING SUSTAINABLE PROSPERITY PROGRAMME VERSION 3 Control Activity Article 4 The Scheme was subjected to an Article 4 check. Summary of findings as a result of Article 4 activity An Article 4 check carried out by the Article 4 Team in European Programmes on Energy Division in their role as BSP Implementing Body. Measure 1.8(b) covers one co-financed project i.e. Energy Demonstration Scheme. The standard Implementing Body checklist was used and the check was completed in the latter part of the Programme period when the Energy Demonstration Scheme was well underway. Key Findings • Letters of Offer to lower level projects did not contain all standard clauses; • no Article 4 reports issued to project promoters; • no acknowledgement of BSP funding by some projects; and • deficiencies in selection panel documentation. DETI Article 4 Team followed up with Energy Division to ensure that all recommendations in the agreed action plan were carried out. As part of the management of this Measure, Energy Division undertook Article 4 checks on each lower level project co-financed under the Energy Demonstration Scheme. Article 10 Details of Article 10 activity are included in the Measure summary. Audit Activity Internal Audit activity can be found in Annex 12 and details of Commission audit findings can be found in Annex 13. Irregularities Details of irregularities are provided at Measure 1.8 summary level in Annex 15 and Annex 16. 210 BUILDING SUSTAINABLE PROSPERITY PROGRAMME VERSION 3 CHAPTER 7: PRIORITY 2 7.1 Introduction While the majority of activity in this Priority was related to the ESF Fund, Measure 2.5 received assistance from ERDF and details of activities under that Measure can be found in the following pages. Aims and Objectives The principal objective of the Employment Priority was to tackle specific labour market needs of those in education who are about to enter the labour market, for those who are unemployed and those who are in employment. Actions undertaken were in synergy with the other Priorities within the BSP Programme, in particular the Economic Growth and Competitiveness Priority. Literacy and numeracy skills levels as well as ICT skills remain low for a large proportion of the unemployed and employed population. Lifelong learning is only slowly expanding in the education and training sectors. In the schools sector, while the most academically gifted continue to do well, there remain significant problems relating to educational underachievement and low attendance and a high proportion of young people leave school at the end of compulsory education. Investment in human resource development in companies remains low, as are the levels of selfemployment. Indeed levels of self-employment and the development of the social economy are lagging behind UK averages. The European Employment Strategy has recognised the very significant role that Information and Communications Technology (ICT) will play in terms of job creation. It is essential therefore that those about to enter the labour force should be equipped with the appropriate knowledge and skills for the emerging information age. 211 BUILDING SUSTAINABLE PROSPERITY PROGRAMME VERSION 3 7.2 Measure Details for Measure 2.5 - Education and Training ICT and Infrastructure Support The main focus, therefore, under this Measure was support for the strategic development of ICT within Northern Ireland’s secondary education system by providing a significant level of infrastructure support for ICT teaching and learning at the secondary level. Through the provision of an ICT infrastructure of high quality resources, those in secondary level education preparing to enter the labour market will develop the skills to use ICT and the effectiveness and the standards of their learning will be improved. This Measure also provided assistance towards the cost of general infrastructure support to cover sufficient access to the required network of equipment, learning, resources and accommodation in order to deliver the other Measures in this Priority. The main objective was to ensure the provision of adequate support infrastructure in order to enable organisations to meet the education/training needs of the target groups. Implementation The Measure was delivered by DE and DEL with the majority (98%) of the expenditure being declared by DE. A total of 67 applications were approved under this Measure. A list of all projects assisted under this Measure can be found in Annex 5. The Department of Education element of this Measure covers three main strands. These were: • C2k (post primary and special schools); www.c2kni.org.uk • the Major Project Application for C2k; and • improvements to the infrastructure for post primary and special schools. 212 BUILDING SUSTAINABLE PROSPERITY PROGRAMME VERSION 3 C2k (post primary and special schools) - The Mission of C2k was to provide, for Northern Ireland’s schools, a world class Learning Technology service and optimise its use throughout the Community. C2k is a regional scheme operating under the auspices of the Education Technology Strategy Management Group of the Department of Education. It was funded by the Department, through the Western Education and Library Board, as part of its Education Technology Strategy, to deliver to schools high quality, sustainable infrastructure, connectivity and resources. The Strategy set out to ensure that young people were prepared for their life and work in the information economy of the 21st century and that ICT is used to raise educational standards. The C2k element of the Measure contained numerous components that included: • Passive infrastructure to support C2k activities; • an infrastructure of approximately 23,000 networked computers connected to the Internet and linked to legacy systems; • access to a wide range of content and services to support the Northern Ireland Curriculum and the professional development of teachers; • connection of schools' networks onto a single education network across Northern Ireland, with tools to facilitate the development of on-line teaching and learning; and • full service support through a central help desk. The requirement to submit a Major Project Application under Article 25 of EU Regulation 1260/99 arose from the recommendations of a DGREGIO audit in April 2006. Consequently an application was made for confirmation of support in October 2006. EU commission approval was confirmed, at the end of December 2006, for support to a total project value of €84m. Total EU assistance for this project of €42m was to part fund the C2k infrastructure, for post primary and special schools, which comprised: • The passive infrastructure (cabling and socketry for the LAN and mains supply); • provision of ICT local hardware (PCs, printer, network hubs etc); 213 BUILDING SUSTAINABLE PROSPERITY PROGRAMME VERSION 3 • provision of remote hardware and software for central help desk and WAN services (such as Internet access); and • provision of curricular content and software. C2k was split into 3 component parts. • the provision of adequate LAN and mains cabling and socketry. This element was to enable effective utilisation of the services provided by C2k. Each Education and Library Board engaged contractors, by way of competitive tender, from a framework agreement to carry out the work in each school. • to provide the local ICT infrastructure to support curricular activities such as provision of hardware (PCs, printers etc) and software (system, personal productivity and curriculum software and packages). SX3, latterly Northgate systems was contacted under OJEC 2001/s 98-067814, to provide the service. • to provide-wide area connectivity and integration of services. This component was also contracted under OJEC 2001/s 98-067814 and provided, originally by COMPAQ and latterly the merged company under Hewlett Packard. Improvements to the infrastructure for post primary and special schools - This element of the Measure comprised of 6 projects that extended and refurbished post primary schools providing accommodation to meet pupils’ educational needs. The facilities, in the schools approved for funding were judged substandard. Temporary classrooms, used widely for lessons, varied in age but many were over 30 years old. In some cases they fell short of Health and Safety requirements. The classrooms were also spread out throughout the site. This added to the time taken for pupils to move between lessons. Environmental conditions were also substandard. The new classrooms are now equipped with adequate power, cabling and data/voice outlets to facilitate the use of ICT in lesson delivery, providing pupils and teachers with modern, high quality learning environments. The attainment of ICT competence is recognised as essential for the future employability of students and the success of the Northern Ireland economy as a whole. This project removes a major barrier to ICT competence and educational achievement. 214 BUILDING SUSTAINABLE PROSPERITY PROGRAMME VERSION 3 As the Measure delivered a government Programme, a formal call for applications did not take place. However, in order to ensure transparency formal applications were made by the PPP unit (for C2k activities) and the Department of Education’s Building Branch (for infrastructure activities). Eight applications were submitted to the Programme. The Programme covered 285 schools under C2k (including the passive infrastructure) and 6 schools under the improvements to the infrastructure element. Examples of Projects within Measure 2.5 Under the DE element of the Measure there were eight successful projects under Measure 2.5. Initially there were 2 successful projects. These were: • C2k for post primary and special schools. • Passive Infrastructure for post primary and special schools. The issues raised as a result of the Major Project Application necessitated some realigning of the targets. Six projects were added to the original quota. These were: • Dominican College. • Royal School Dungannon. • St. Brigid’s High School. • St. Paul’s High School. • St. Pius X College. • Rathmore Grammar School. C2k - Internet in Schools www.c2kni.org.uk. C2k has been awarded full accreditation by BECTA (British Educational Communications and Technology Agency), for the quality of its schools’ internet service provision. The BECTA Internet Service Provider (ISP) accreditation means that all pupils and teachers in the Province's 284 post primary and special schools can be assured that the internet services provided by C2k meet the required guidelines. C2k’s internet 215 BUILDING SUSTAINABLE PROSPERITY PROGRAMME VERSION 3 service is constantly monitored to ensure that children and teachers in Northern Ireland are protected against offensive emails and web site content. The C2k Integration Director, said, “The safety of the C2k online user community is paramount for C2k and our managed service provider HP. We employ the most up-todate online security technology to protect both our users and the integrity of the online service. Schools have a statutory responsibility for child safety and C2k’s BECTA ISP accreditation can assure schools that the Northern Ireland schools’ internet service is one of the safest in the world.” C2k not only successfully met all their accreditation requirement, but exceeded them in 75% of the tests, such as email and web filtering and user support. School internet services are provided by global technology company HP which provide the vital infrastructure joining all the online services together and includes Internet filtering, web hosting and a managed data centre that holds e-learning resources for schools. Ensuring the safety of the C2k internet service is a considerable task. For instance, on a monthly basis, an average of 7 terabytes of data can be downloaded by schools. The centre can also process over 11 million emails. The accreditation also included the service provided to Primary Schools. St Pius X College - www.stpiusxcollege.org - The school has invested heavily in computer hardware and software over recent years. The C2k allocation added considerably to this base in order to provide further access to the technology for pupils and staff. Plans have been made to make best use of this provision. Every teacher in the school now has a PC on their desk, all of which have C2k MIS installed. This ensures a high usage of MIS modules by staff. For example all staff use Assessment Manager to record KS3 and KS4 results and Heads of Year use MIS to maintain a behavioural log and monitor attendance. In addition, all school documentation is stored in a central folder, using Whirlpool 1. For teachers this makes more accessible, schemes of work in all subjects, school and departmental policies 216 BUILDING SUSTAINABLE PROSPERITY PROGRAMME VERSION 3 and the minutes of school meetings, Application forms for internal appointments are also posted in this area and are completed online. Pupils are also supported by the new provision and every pupil in the school has been given an email address and their own work folder within the network. All Key Stage 3 pupils have timetabled ICT and they all participate in the CCEA ICT Accreditation Scheme. More than half of the teachers in the school and most subject areas contribute towards ICT accreditation at KS3. The school boosts a 100% pass rate at levels 5, 6 and 7 in this scheme. The school has involved itself in innovative work using ICT. They are participating in a number of pilots with CLASS (the administrative element of C2k) involving Requisitions for Heads of Department and also in piloting the new Attendance and FMS modules. Video conferencing has also been used innovatively and the school has been involved in a collaborative e-learning pilot at GCSE level in a Virtual Learning Environment in partnership with a number of other schools in the North Eastern Education & Library Board. St Pius X High School has taken full advantage of the restorative building programme, supported by the Measure that has enhanced the school’s infrastructure. One consequence of the improvements enabled them to extend their provision of ICT to all pupils and to all teachers in the school. However, it is not only this which made a difference. It was the wholehearted commitment of teachers in embracing the new technology, recognising what it can achieve and incorporating it into classroom teaching and administration, that has had made most impact. This has been encouraged by effective leadership and vision within the school. 217 BUILDING SUSTAINABLE PROSPERITY PROGRAMME VERSION 3 Summary of Achievements V Targets for Measure 2.5 Original Indicator Position at Mid Term Evaluation Output All secondary schools (240) to have 0 new PCs at a ratio of at least 1 PC to 9 pupils and local area networks installed and to be linked to a wide area network and system integrator providing a managed ICT service at a cost of £115.2m. All successful ESF funded nongovernment projects to have an adequate level of infrastructural support as is required to make the project viable Result All schools to be utilising the managed service providing curricular resources and internet access with broadband connectivity Revised Indicators Final Position All secondary schools (233) and special 277 schools (48) to have new PCs at a ratio of at least 1 PC to 9 pupils and local area networks installed and to be linked to a wide area network and system integrator providing a managed ICT service at a cost of £115.2m. ESF All successful ESF funded nongovernment projects to have an adequate level of infrastructural support as is required to make the project viable Met Upgrading of school accommodation to enable use of ICT equipment and managed service 0 All schools to be utilising the managed service providing curricular resources and internet access with broadband connectivity Post Primary and special schools using the managed service 218 277 Met BUILDING SUSTAINABLE PROSPERITY PROGRAMME VERSION 3 Summary of Achievements V Targets for Measure 2.5 (contd) Impact All pupils (155,000) will experience the use of ICT across all areas of the curriculum, including a range of applications and media and will spend, on average, 10% of the weekly timetable using ICT facilities to support learning across the curriculum 0 All pupils (155,000) will experience the use of ICT across all areas of the curriculum, including a range of applications and media and will spend, on average, 10% of the weekly timetable using ICT facilities to support learning across the curriculum Pupils will enjoy the benefits of a modern ICT enriched curriculum taught in highspecification facilities. Electrical infrastructure will enable the full use of ICT equipment and managed service provided by C2k programme. 219 All pupils using ICT across all areas of the curriculum (161,000 pupils). Over 10% of weekly timetable using ICT supported learning Met BUILDING SUSTAINABLE PROSPERITY PROGRAMME VERSION 3 Under the DEL element of the Measure 59 projects received funding. Full details of allocations can be found in Annex 5. A range of projects was funded by the Department of Employment and learning (DEL) under this Measure. These complimented projects funded through ESF Measure 2.3. Examples of the projects within Measure 2.5 The Orchardville Society – Edgecumbe Catering Project. The main objective was to create a modern street front coffee shop which would be compliant with all Health and Safety Regulations which provided best practice training opportunities for people with learning disabilities. This contributed to the main Programme in a number of ways: • Providing a modern and visible training environment for people with learning disabilities Enabling increases in: • the number of beneficiaries taking up this form of vocational training; • the number of accredited qualifications achieved; • the number of beneficiaries accessing external work placements; and • the level of income generation and ability of the overall project to move towards longer term sustainability. Shankill Open Learning Centre – Skills Training for Employment Progression. The objective was to fully equip the organisations training facility with equipment to specifically meet the training needs of individuals and included in this was the purchase of a specialist auditing and tracking software package for use with the BSP Projects beneficiaries who were of particular disadvantage. It complimented the ESF Project which sought to develop and deliver a range of tailored training and development programmes for 60 people with disabilities 220 BUILDING SUSTAINABLE PROSPERITY PROGRAMME VERSION 3 employed within the Ulster Sheltered Employment Limited’s (USEL) segregated employment environment. Workers Education Association – Essential Skills for Disadvantaged Groups. The project focused on essential skills provision for adult returners with a specific emphasis on the needs of those with learning difficulties. To facilitate the learning of the groups specified the equipment in the centre required updating to provide access to the computer based learning programmes that came on stream. Expenditure and Financial Control Total Expenditure Declared for Measure 2.5 All amounts shown in € Allocation in Programme Complement Expenditure Declared in Claims to the Commission EU Amount Public Amount Private Total 61,014,000.00 61,014,000.00 0.00 122,028,000.00 62,174,794.54 62174,795.30 0.00 124,349,589.84 Expenditure declared as % of available Allocation 101.90 Total expenditure declared includes the amount approved by the Commission as a result of a major project application for C2k in addition to the 6 projects selected for improving the schools infrastructure and expenditure for the projects supported by DEL. Article 4 Activity All projects in this Measure were subject to an Article 4 check. Summary of findings as a result of Article 4 activity (i) The standard checklist issued by the Managing Authority was used for all formal Article 4 visits; (ii) Visits were carried out to all projects; (iii) In addition to the formal Article 4 visits, 82 spot checks (consisting of vouching visits) were carried out. 221 BUILDING SUSTAINABLE PROSPERITY PROGRAMME VERSION 3 Article 4 checks found that projects were managed effectively and consistently with EU requirements. Financial systems and record-keeping were sufficiently sound to ensure effective financial management of the projects. Expenditure samples were successfully reconciled with records held by projects. The projects’ obligations in such areas as Equality of Opportunity, environmental impact, and publicising the EU contribution, were being met. Appropriate mechanisms were in place to collate data on project performance against Letter of Offer targets, and return this information to the Implementing Body. Article 10 Activity 24.37% of declared expenditure is under examination by the Article 10 team with an error rate of 3.52%. Spread of Article 10 – 5% checks % checked 2000 2001 2002 2003 2004 2005 2006 2007 2008 23.2 11 9.6 6.5 63.1 22.8 1.43 9.19 17.9 Summary of Findings as a result of Article 10 Monitoring The FAST Team, in DEL, completes its risk analysis of projects at the beginning of the year when its annual programme is being determined. The sample is selected in line with DFP-EU Guidance Note 02/2005 in order to give a representative sample of project by size, type and location. No problems or errors were identified during Article 10 visits. assurance was given by the FAST Team in all cases. Eight irregularities were detected through Article 10 Checks 222 A satisfactory BUILDING SUSTAINABLE PROSPERITY PROGRAMME VERSION 3 Audit Activity A record of all internal audits carried out for Measure 2.5 is available in Annex 12. Details of Commission audit findings are shown in Annex 13. Irregularities A total of 23 irregularities were reported for this part of the Measure all of which have been cleared. Details of these can be found in Annex 15. Irregularities that were below the reporting threshold were recorded and can be found in Annex 16. 223 BUILDING SUSTAINABLE PROSPERITY PROGRAMME VERSION 3 CHAPTER 8: PRIORITY 3 8.1 Introduction Aims and Objectives This Priority flows from Priority 3 of the CSF – Balanced Regional Urban and Rural Development and has as its objective the reduction of the socio-economic gap between disadvantaged urban areas and the wider society by improving the physical infrastructure of urban areas and thereby enabling community participation in sustainable economic development. The ERDF funding supported actions for on-going priorities including infrastructure improvement and skills enhancement to improve the competitiveness of urban areas. 8.2 Implementation Four Measures were funded under this Priority: Measure 3.1 Urban Revitalisation 7 Projects Measure 3.2 Advice and Information Services 8 Projects Measure 3.3 Community Sustainability 43 Projects Measure 3.4 Investing in Early Learning 1 Project A list of all projects for Priority 3 which incurred expenditure and the ERDF element can be found in Annex 5. Publicity North Antrim Community Network - Ballycastle Community Directory (DSD) http://www.moyle.mmcsolutions.biz/uploads/publications/Ballycastle%20Directory %20Final%20Copy.pdf Fermanagh Trust (DSD) http://www.fermanaghtrust.org/cms/uploads/1/FCEF_Report.pdf Assessment of Achievements v Targets Details can be found within each Measure. 224 BUILDING SUSTAINABLE PROSPERITY PROGRAMME VERSION 3 Expenditure and Financial Control Total Expenditure Declared for Priority 3 All amounts shown in € Allocation EU Amount Public Amount Private Total 50,000,000.00 20,900,000.00 0.00 70,900,000.00 21,476,202.41 0.00 70,899,503.52 Expenditure 49,423,301.11 Declared Expenditure declared by Measure 3.1 34,529,693.44 15,185,897.20 0.00 49,715,590.44 3.2 1,869,169.21 797,880.07 0.00 2,667,049.28 3.3 4,725,407.53 2,024,457.56 0.00 6,749,865.09 3.4 8,013,582.57 3,345,632.26 0.00 11,359,214.83 Expenditure declared as % of available Allocation 100.00 Article 4 Activity An Article 4 was carried out on all projects Article 10 Activity Details of Article 10 Activity can be found within each Measure. Summary of findings as a result of Article 10 Activity EUVU extract information from the EU Central Database on declared expenditure and total award amounts for all of the measures, within the programme/fund, subject to examination. Based on this information a risk assessment is completed taking account of the following factors: • Value of eligible expenditure To address the need to sample expenditure on an annual basis the figure used is the amount of declared eligible expenditure, as recorded on the EU Central Database, incurred by a Measure up to the time of sampling. Level of expenditure is considered to be the major risk factor. 225 BUILDING SUSTAINABLE PROSPERITY PROGRAMME VERSION 3 • Volume of projects The number of approved projects within a Measure is considered significant as a higher volume raises the opportunities for errors and widens the likely impact of systemic errors. The volume of approved projects within a Measure was taken as the cumulative number of approved projects at the time of selection. The risk is perceived as being medium. • Type of project It is concluded that the main issues are the amount of transactions generated and the associated supporting documentation to be retained. It is felt that to avoid becoming too diverse, projects could readily be rated in three main types which reflect the main issues, namely Capital Build the spend pattern of which is a limited number of sizeable payments and Revenue Assistance which generates numerous small and frequent transactions and a combination of both Capital Build and Revenue Assistance. The significance of the perceived differential between these types is reflected in the respective ratings. The significance of project type is considered medium. • Project provider The providers engaged in the implementation of the Measures within the Department’s remit could readily be rated in three types i.e. Government (Department for Social Development), Non-Government (Intermediate Funding Body) and a combination of both Government and NonGovernment. These types are accepted as being sufficient to reflect the relative level of risk involved. Projects being delivered directly by the Department and by a combination of Department and IFB will be subject to the various controls applied under Government Accounting procedures and internal management checks. Whilst projects delivered by IFBs will have an additional tier of delivery outside of direct Departmental controls. The significance of this factor is considered medium to low. 226 BUILDING SUSTAINABLE PROSPERITY PROGRAMME VERSION 3 • Complexity of funds Taking account of the respective regulations the complexity factor is attributable to the two funds being administered. ESF Rules and Regulations are generally regarded to be more prescriptive than ERDF thus receiving a greater rating. This category is considered a medium factor. • Error rates Management take account of the results of previous checks including the level of error identified when selecting operations to be sampled and build this into the risk assessment process. These factors were then assessed using an agreed weighting formula. On the basis of this a priority listing of measures is derived within each programme/fund. The Verification work plan was then worked out taking account of available resources. At this stage a full project list for each Measure was obtained from the EU Central Database based on award amount and the projects within the Measure were stratified, based on the amount awarded, into three categories high, medium and low. Having carried out the risk assessment and obtained project lists within each of the three strands for each of the measures, a selection was made up to the prescribed number of visits, taking account of projects which had been visited previously and also based on information supplied by the relevant Implementing Body(ies). Details of Article 4 checks carried out by DSD European Unit and other national controls were examined, no significant findings were obtained. The selection of projects took account of obtaining a mix of types and sizes of operations to be checked. Two projects from the Measure total of 7 were examined. 227 BUILDING SUSTAINABLE PROSPERITY PROGRAMME VERSION 3 Once this had been achieved, detailed project expenditure reports were obtained from the EU Central Database to enable a selection of expenditure declarations be examined which equated to at least 5% of declared expenditure for that particular year. The Main Implementing Body was checked at least once before closure the verification check on each project encompassed a compliance check on the Implementing Body. Irregularities detected through Article 10 checks are detailed under the following measure level reports. Audit Activity Details are available within Annex 12. 228 BUILDING SUSTAINABLE PROSPERITY PROGRAMME VERSION 3 8.3 Measure Details for Measure 3.1 – Urban Revitalisation Aims and Objectives The aim of this Measure was to promote individual and community well-being by creating the physical, social and economic environment conducive to encouraging additional employment, education and other opportunities in towns and cities, particularly targeting disadvantage or socially excluded communities. To provide safe and neutral space for all sections of the community and to offer support to local community stakeholders engaged in the renewal of urban city areas. Implementation Seven projects were approved under this Measure. A list of all projects for Measure 3.1 which incurred expenditure and the EU element can be found on Annex 5. Building Sustainable Prosperity Measure 3.1 was slow in getting off the ground but when up and running became a very successful Measure, expending its total budget – both original and revised. There were two main beneficiaries - Laganside Corporation and the Social Security Agency (SSA)/Department for Employment and Learning (DEL). The original intention had been to target a larger number of small projects but lack of evidence/accounting issues around these highlighted difficulties which may have had an adverse effect on the Measure and these projects were not awarded funding. However applications made by the two larger organisations proved successful with 7 projects receiving funding. The Measure allocation was increased and indicators were revised mid-way through the Programme, approved by the Monitoring Committee and the impacts/results of both the original and revised indicators are reflected below. 229 BUILDING SUSTAINABLE PROSPERITY PROGRAMME VERSION 3 The issue of an initial lack of publicity was addressed by the provision of EU plaques in each public area in all 23 Jobs and Benefits Offices - 93 plaques in all were erected. Examples of Projects including Targets achieved Laganside Corporation received funding of £4.65m for 5 successful Projects. Four of these were capital build schemes adding to the regeneration of Belfast, in particular the Cathedral Quarter. The fifth, an environmental scheme involved the dredging of the River Lagan. There were no problems highlighted with the implementation of these Projects. All were successful, both in the redevelopment of the area around the Lagan and in contributing to the increase in tourists visiting the area. Jobs were also created both in the completion of the capital projects and latterly, for example, 10 jobs were created in units within the Royal Avenue Managed Workspace where initially 350 visitors were attracted. A total of 187,000 square metres of area were enhanced within the Laganside Projects and a daily footfall of 837 was recorded for the area around Lanyon Place Public Realm. One example of one Laganside Projects was - Open Space at Cathedral Close. Previously this area of open space in front of St Anne’s Cathedral was regarded as unattractive and unsafe. It provided a gathering place for those engaged in antisocial behaviour i.e. glue sniffing and vandalism. The redevelopment of Cathedral Close has revitalised one of Belfast’s oldest areas and linked it to the already successful waterfront developments. The enhancement of an area of 1,370 square metres has provided an attractive setting for St Anne’s Cathedral - a prominent landmark and tourist destination in the City Centre. The new versatile outdoor performance space known as Writers’ Square is now capable of accommodating up to one thousand people and attracts groups of performing and visual artists to the area. The Cathedral Quarter is now more accessible with residents and those working in the area have been encouraged to enjoy the benefits of a unique urban renaissance. 230 BUILDING SUSTAINABLE PROSPERITY PROGRAMME VERSION 3 Jobs and Benefits - Two applications from SSA/DEL involved improvements to 23 Jobs and Benefits Offices throughout Northern Ireland. Initially a total of £26m was spent on these 2 Projects resulting in the budget for the Measure 3.1 being exhausted. However due to a shortfall in Measure 3.3 spend the Monitoring Committee approved a transfer of surplus funds into BSP Measure 3.1 and the Department was then able to increase funding to SSA/DEL up to the amount of the original 2 applications. The aims and objectives of both of the applications were the same – the establishment of a network of Jobs and Benefits Offices providing a high standard of accommodation to meet the joint needs of the SSA/DEL. Twenty three of the total 35 Jobs and Benefits Offices located throughout Northern Ireland were supported providing a range of customer services with improved service delivery in a safer, more user friendly environment for customers and staff. This has led to a seamless customer focused service with the introduction of an enhanced Work Focused service. Ten Offices were funded in the original application and 13 in the latter application. A total area of 21,419 sq metres was enhanced in the completion of Project Jobs and Benefits Offices and 25,219 sq metres in Jobs and Benefits Offices (2). As a result of the joint working of SSA and DEL the long term unemployment register was reduced by 27.6%. 231 BUILDING SUSTAINABLE PROSPERITY PROGRAMME VERSION 3 Summary of Achievements V Targets for Measure 3.1 Original Indicator Position at Mid-Term Evaluation Revised Indicators Final Position Output Number of schemes funded – 20 Initial progress was slow on BSP 3.1 with no spend Number of jobs/training enquiries/referrals incurred by the date of the mid term evaluation. Number of organizations supported – However retrospective 40 projects were identified and funded by the end of 2004. Number of projects assisted Number of projects assisted - 40 Result Square metres of No spend or results by the commercial/industrial community date of mid term evaluation space enhanced but in retrospective projects completed by 2004 a total of 233,638 sq metres were enhanced Private sector financial leverage None Increase in gross employment 232 None Reduction in number of long term unemployed, women, 16-17 year olds, disabled persons and single parents registering as unemployed. Increased numbers of people, particularly women, single parents, disabled, referred for employment/training. Increase in gross employment opportunities Increase of 76% from 2000-04 7 projects comprising 5 Laganside and 2 Jobs and Benefits Schemes covering 23 Jobs and Benefits offices administrative barriers meant larger projects were targeted instead of smaller more cumbersome ones. 27.6% reduction from 2000-04 8% increase from 2000-04 27.7%increase from 2000-2004 BUILDING SUSTAINABLE PROSPERITY PROGRAMME VERSION 3 Summary of Achievements V Targets for Measure 3.1 (cont’d) Impact Increase in Net employment. Reduction in unemployment Reduction in crime and vandalism Increase in commercial space available Evidence of positive impact attributable to schemes eg increase in visitor numbers and increase in residents satisfaction levels Initial progress was slow Increase in Net employment. on BSP 3.1 with no spend incurred by the date of the mid term evaluation Reduction in unemployment 233 Not available in this format 24.3% reduction from 2000-04- all projects completed by the end of 2004 BUILDING SUSTAINABLE PROSPERITY PROGRAMME VERSION 3 Expenditure and Financial Control Total Expenditure Declared for Measure 3.1 All amounts shown in € Allocation in Programme Complement Expenditure Declared in claims to the Commission Expenditure declared as % of available Allocation EU Amount Public Amount Private Total 35,306,153.00 14,850,000.00 0.00 50,156,153.00 34,529,693.44 15,185,897.20 0.00 49,715,590.64 99.12 Article 4 Activity All projects in this Measure have received an Article 4 check. Summary of findings as a result of Article 4 activity • Most project operators had good policy documents in place. Of those that did not, the main areas of weakness were a lack of policy documents in the areas of document retention and publicity; This was addressed by the production of draft policy documents which were supplied to project operators, who were advised to tailor the content to their organisation. The Article 4 Monitoring team carried out follow-up action to validate compliance. Article 10 7.66% of declared expenditure was examined under Article 10, with an error rate of zero. Spread of Article 10 – 5% checks % checked 2000 2001 2002 2003 2004 2005 0% 0% 8.30% 7.23% 9.68% 0% 2006 2007 2008 0% 0% 0% In Measure 3.1 no common problems, significant weaknesses or systemic errors were identified by the Article 10 activity. Only 1 recommendation was made and it 234 BUILDING SUSTAINABLE PROSPERITY PROGRAMME VERSION 3 was in relation to the required document retention period. The measure consisted of seven projects which had a total grant awarded of £35,622,428.00. Of this approximately 87% was spent on 2 SSA sponsored Jobs & Benefits projects with the remaining 13% being spent on 5 Laganside Corporation sponsored projects. One project from each of the groups was visited for Article 10 inspections covering the years 2002–2004. Coverage achieved against this Measure was well above the Commission target of 5% at 7.66% overall. Control work concentrated when most expenditure occurred. Control work focused on main Implementing Bodies (2 bodies). The same systems were used for all payments. The fact that the projects within the Measure were entirely delivered directly by a constituent part of the Department or a Departmental sponsored body and were subject to the various controls applied under Government Accounting procedures and internal management checks explains the absence of error, financial or otherwise and confirm the effectiveness of the management and control systems in place. No irregularities were detected through Article 10 Checking Audit Activity Details so Internal Audit activity can be found in Annex 12. Irregularities There were no reported irregularities for Measure 3.1 and any recorded irregularities can be found in Annex 16. 235 BUILDING SUSTAINABLE PROSPERITY PROGRAMME VERSION 3 8.4 Measure Details for Measure 3.2 – Advice and Information Services Aims and Objectives High long-term unemployment rates and a quarter of the adult population at the lowest levels of literacy, hindered Northern Ireland in its transition to a stable, prosperous, fair and outward looking society. This Measure was aimed at: • Improving local advice services by developing and implementing a strategy. • Working in partnership with the statutory sector, local government, social partners and the independent sector examining the quality of and access to services in areas of social need. • Stimulate new provision in areas where none existed and achieve a more coherent approach to advice provision in areas where there were indications of duplication. Implementation The Measure improved local advice services by developing and implementing a strategy to stimulate new provision in areas where there is none and to achieve a more coherent approach to advice and support in the case of duplication of provision. 8 projects were initially funded. 1 project ended in 2005 and the remaining 7 projects were funded to March 2007, with 3 of those having funding extended to September 2007. A list of all projects for Measure 3.2 which incurred expenditure and the EU element can be found on Annex 5. The objectives of the projects were to improve access to advice and information for disadvantaged groups, improve the quality of advice through the development of 236 BUILDING SUSTAINABLE PROSPERITY PROGRAMME VERSION 3 staff and (in the case of the Citizens Advice Bureau and the Association of Independent Advice Services), to introduce and provide support for new standardised electronic statistical recording and information systems for their networks. The projects targeting the disadvantaged groups, though not exclusively, included those providing:• access to housing; • advice for immigrants; • improved access for the deaf and hard of hearing; and • the development of an information strategy for those affected by domestic violence. Independent post-project evaluations were carried out on all projects. The findings, both qualitatively and quantitatively were that all projects exceeded targets. Overall the findings showed that accessibility to advice services have improved during the lifetime of the Programme, particularly for those with special needs. A significant positive outcome from the Measure is that much of the work carried out under it will feed in to the new DSD Advice Services Strategy. Measure Indicators all were achieved or exceeded. They did not change during the period of the Programme although the specific numeric targets were added for the purposes of clarification in later reports. 237 BUILDING SUSTAINABLE PROSPERITY PROGRAMME VERSION 3 Summary of Achievements V Targets for Measure 3.2 Original Indicator Output Reviews and Assessments completed Position at Mid Term Evaluation 258 Revised Indicators 2 Reviews and Assessments of existing services completed Not reported New common recording Support for rationalization of recording system Support given to 2 organisations to provide and promote a common statistical system Support given to 4 organisations to provide advice and information Result Develop strategy 80% of IAS and CABs operating a 20% common statistical system Not reported Increase by 50 hours per week provision of advice and information in areas of greatest need Not reported 7 post project evaluations completed with recommendations about future delivery of service. 2 7 Implementation of the recommendations Some from the reviews/assessments recommendations implemented. Work to be taken forward within DSD’s Advice 25 IAS and CAB operating a common strategy. statistical system All independent CAB affiliated advice organizations now using 1 of 2 Increase of 40 hours per week in the accredited systems. provision of advice and information in 312 in year 2007 areas of greatest need with total of 3046 since start of the programme 90% of DSD funding committed on Not reported basis of strategy Effective comparisons and monitoring possible Final Position 238 BUILDING SUSTAINABLE PROSPERITY PROGRAMME VERSION 3 Summary of Achievements V Targets for Measure 3.2 (contd) Impact Improved provision Improved awareness Cohesive and cost effective provision of services Not available Improved utilization of available funds Improved service and distribution of funding Better informed community and improved access to services 239 3 pilot schemes undertaken 3 Evidence of improved accountability for, and delivery of, advice services Post project evaluations show evidence of more integrated delivery of advice services BUILDING SUSTAINABLE PROSPERITY PROGRAMME VERSION 3 Examples of Projects within Measure 3.2 Community Housing Advice Project (CHAP) - The Department for Social Development supported this project which was delivered by the Housing Rights Service, an independent charity working to protect and promote the rights of people in housing need in Northern Ireland. This project was developed against a backdrop of escalating homelessness and rising consumer debt levels and in recognition of the need for housing advice, advocacy and representation to help prevent homelessness and alleviate poor housing conditions. A partnership approach was adopted involving Housing Rights Service, Citizens Advice and Advice NI with the aim of increasing the capacity of frontline advice agencies throughout Northern Ireland. Other funding was secured from the NI Housing Executive and the Community Fund. The key objectives of the CHAP project were to: • Prevent homelessness by enabling people to sustain existing accommodation through debt counselling services and dealing with issues threatening their security of tenure; • assist people to access suitable accommodation by exploring the full range of options available including social housing, low cost home ownership and the private rented sector; • provide advice on issues associated with affordability; and • assist clients to challenge adverse housing decisions. The project was delivered through 24 frontline voluntary advice agencies who were able to deliver a dedicated advice and support on housing issues, a wide range of information materials, free training and bursaries for accredited training. Housing Rights Service received a prestigious National Training Award in recognition of its training services provided through this project. Support was given to 2 organisations (AIAC and CAB) to provide and promote a common statistical system. This output target related also to the work on improving 240 BUILDING SUSTAINABLE PROSPERITY PROGRAMME VERSION 3 advice provision through better use of IT. This was achieved with the independent advice services and local citizens’ advice bureaux, who now operate new age statistical systems. In relation to improved accountability, the new IT systems used by the groups allows for tracking of advice given and development of historical information on clients. This has also enabled managers to print off relevant information to clients and ensure that all information and advice given is trackable, particularly for quality assurance. Another benefit shown in the CAB report is that the improved information systems has helped to strengthen discussions with Government and rising media interest through the provision of specific examples and the rapid identification of patterns and collation of examples – good examples include the problems with housing benefit, problems and issues regarding tax credits and overpayments. Managers embraced the whole planning and implementation of the system, with work being carried out with their involvement and agreement at all stages and that changes requested by them were carried out when it was cost effective to do so. They were also positive that the systems provided one standardised way of providing information and advice and that this ensured they could operate and monitor a more efficient office network. Expenditure and Financial Control Total Expenditure Declared for Measure 3.2 All amounts shown in € EU Amount Public Amount Private Total Allocation 2,000,000.00 830,000.00 0.00 2,830,000.00 Expenditure Declared 1,876,934.47 801,208.06 0.00 2,678,142.53 Expenditure declared as % of available Allocation 94.63 Article 4 Activity All projects in this Measure have received an Article 4 check. Summary of findings as a result of Article 4 activity • An Article 4 inspection was carried out on all projects during their lifetime with one project visited twice. 241 BUILDING SUSTAINABLE PROSPERITY PROGRAMME VERSION 3 • Most project operators had good policy documents in place. However, some did not – most notably in the areas of financial procedures document retention and publicity. Recommendations asked projects to draft policy/procedures documents and templates were provided to project operators to adapt. • Follow-up action was undertaken by the Article 4 Monitoring team to validate compliance in liaison with Voluntary and Community Unit to verify this work had been undertaken and all issues were now resolved. Article 10 Activity 8.14% of declared expenditure was examined under Article 10, revealing an error rate 1.53%. Spread of Article 10 – 5% checks % checked 2000 2001 2002 2003 2004 2005 2006 2007 2008 Nil Nil 8.72% 7.16% 7.87% 9.24% 8.28% 7.67% Nil Summary of findings as a result of Article 10 Activity From a review of findings of the Article 10 inspections carried out by the DSD EU Verification Unit where examination of areas of control weakness and the necessary remedial action were carried out, it was concluded that this Measure of the programme had been implemented satisfactorily and that the management and control systems are adequate. Although 28 recommendations to strengthen and improve management and control systems were made, no significant weaknesses were identified. None of the issues raised in the Article 10 inspections were considered systemic. Of the 7 projects examined, 5 gave rise to potential ineligible expenditure below the de mimimis level and were treated in accordance with set down procedures. 242 BUILDING SUSTAINABLE PROSPERITY PROGRAMME VERSION 3 Irregularities Detected through Article 10 Checks Organisation/ Project Assoc of Independent Advice Centres Chinese Welfare Association Action Mental Health NI Association of Citizens Advice Bureaux Foyle Women’s Aid UK Case No 002251 Total irregularity £’s 14.39 EU Element £’s 10.07 Nature of irregularity (code) 325 Date identifie d 17/12/04 Date reported to EC Below de minimis 002741 627.91 439.54 210 03/08/07 Below de minimis 31/10/08 003527 150.00 105.00 325 01/08/06 28/12/07 003736 127.96 89.57 325 02/07/07 Below de minimis Below de minimis 004244 1,345.00 941.50 210 29/11/07 Below de minimis 20/10/08 Total Date cleared 22/10/08 24/10/08 2265.26 Irregular funding amounts (as above) were identified and all issues raised during the checks have now been resolved and recovery / clawback actioned as appropriate, none of the irregularities identified in the table are included in the eligible expenditure details on the database and therefore any amounts being claimed from the Commission are eligible. The irregularities have been classified within the database as “ Clawback / Recovery to enable DFP European Unit to identify and action to ensure any irregular funding has been removed from the Programme Final Statement of Expenditure Audit Activity Support was given to 2 organisations (AIAC and CAB) to provide and promote a common statistical system. This output target related also to the work on improving advice provision through better use of IT. This was achieved with the independent advice services and local citizens’ advice bureaux, who now operate new age statistical systems. In relation to improved accountability, the new IT systems used by the groups allows for tracking of advice given and development of historical information on clients. This has also enabled managers to print off relevant information to clients and ensure that all information and advice given is trackable, particularly for quality assurance. Another benefit shown in the CAB report is that the improved information systems has helped to strengthen discussions with Government and rising media interest through the provision of specific examples and the rapid identification of patterns and collation of examples – good examples include the problems with housing benefit, problems and issues regarding tax credits and overpayments. Managers 243 BUILDING SUSTAINABLE PROSPERITY PROGRAMME VERSION 3 embraced the whole planning and implementation of the system, with work being carried out with their involvement and agreement at all stages and that changes requested by them were carried out when it was cost effective to do so. They were also positive that the systems provided one standardised way of providing information and advice and that this ensured they could operate and monitor a more efficient office network. An audit review in the early stages of the Measure (2004-2005) identified systemic weaknesses which led to an irregularity being raised for the whole Measure. However a follow-up audit in 2005-2006 showed all systemic weaknesses had been addressed and a substantive assurance was given. After that the Measure encountered no major difficulties. The table detailing key internal audit recommendations and subsequent actions is available in Annex 12. Irregularities Nine irregularities were reported for this Measure, all of which were resolved. A detailed list of all reported irregularities for Measure 3.2 can be found on Annex 15. Irregularities below the reporting threshold were recorded, details of these can be found in Annex 16. 244 BUILDING SUSTAINABLE PROSPERITY PROGRAMME VERSION 3 8.5 Measure Details for Measure 3.3 – Community Sustainability Aims and Objectives The objectives of BSP Measure 3.3 were to consolidate strategically placed support agencies and structures relevant to meeting local needs and the interests of socially excluded groups and to pioneer new opportunities for interagency and inter-sectoral alliances and mergers where appropriate. Funding under the Measure successfully supported 30 sub-regional support organizations to develop and support smaller community organizations in their area where community infrastructure was weak. They did this by providing quality support services including assistance in identifying funding opportunities, accessing technical knowledge, skills and problem solving in financial management, planning, policy influence, staff management and support for management committees. Project objectives under this Measure included providing advice, newsletters and training as well as assisting in bringing new and emerging community Groups in to contact with funders. Implementation A total of 43 projects were approved under this Measure. However, 13 were terminated with 30 going on to complete successfully. A list of all projects for Measure 3.3 which incurred expenditure and the EU element can be found in Annex 5. Independent evaluations were carried out on all projects and all objectives were achieved and in many cases exceeded. In addition, 17 of the projects succeeded in gaining longer term strategic funding under the DSD’s Community Investment Fund to continue providing infrastructure support. Given the nature of this Measure in providing support to smaller grass roots Groups, all publicity was generated by the Groups themselves in developing and informing 245 BUILDING SUSTAINABLE PROSPERITY PROGRAMME VERSION 3 the networks of events and services. Empowerment Programme. One example was the South Tyrone All projects funded under this Measure provided a similar range of services with an element of targeting at the particular needs of their area. Given that 13 of the projects initially funded under this Measure were withdrawn, there was a significant amount of support provided to the community sector in Northern Ireland which was prompted by European funding support but no longer forms part of the implementation review. http://www.stepni.org/ The number of Groups supported under this Measure declined during the period as they were withdrawn from the Measure due to an Internal Audit exercise. This had an affect on the outputs. However, one of the targets appears to have been substantially underestimated irrespective of withdrawals from the Measure. The number of direct support hours of 2,000 for the Measure was significantly below what was achieved (approximately 20,000). It is difficult to determine whether this was an misinterpretation of the information used to make the projections and assessment of need or whether there was an increase in community activity in the changing social and political climate in Northern Ireland where people at a local level were coming together to form community groups needing greater levels of support from the established sub-regional groups funded under the Measure. Regarding the Measure Indicators, as stated above, there was a reduction in the number of organisations assisted due to an Internal Audit review. However, consultations with statutory agencies were significantly exceeded as most of the funded Groups formed partnership working relationships with statutory agencies on an ongoing basis. The project evaluations refer to the relationships and the policy work rather than the actual number of hours. For example, the North West Community Network’s lobbying has been their participation in the NW Stakeholder Alliance - an informal grouping of senior figures from public and private sector bodies and departments (OFMDFM, DSD, UU, Local Councils etc.) tasked with overseeing the implementation of the Regional Development Strategy in the NorthWest. Another example is the Fermanagh Trust’s role in supporting the local voluntary cross community pre-school play group sector to lobby for their rights to, and allocation of, the Pre School Expansion Programme (PEAG) places. In 2002, the Department of Education wanted to introduce more free pre-school places in 246 BUILDING SUSTAINABLE PROSPERITY PROGRAMME VERSION 3 primary schools. There was widespread concern that this would undermine the extensive cross-community play group provision in Fermanagh, by re-segregating children in mostly single identity schools. A successful campaign was made to the Department by many of the county's cross community play groups, facilitated by the Fermanagh Trust. The project evaluation reports provide a wide range of evidence of the sustainability of the community organizations assisted and improved inter-agency working and policy development in areas of need. In addition to the examples above, the North West Community Network significantly increased the number of paying members from 17 to 98 – an increase of 476%. The Fermanagh Trust was able to increase their links with other groups, such as Fermanagh Development Forum, Fermanagh Local Strategy Partnership and Enniskillen Neighbourhood Renewal Partnership through the Networking Centre. Improved links with organisations such as those, will provide increased knowledge of the sector and allow the Trust to put in place better structures and to represent the community and voluntary sector at both strategic and grass roots level. The South Tyrone Empowerment Programme (STEP) is used below to show the types of activities and services delivered to the smaller community groups, is also provides a good example of improved inter-agency working. STEP’s examples of consultations include Pathways for Change (2004), the Review of Public Administration (2005), A Shared Future (2005), and Promoting Good Relations (2007). In response to the closure of services at the local Dungannon and South Tyrone Hospital, STEP facilitated consultation with a range of local community organisations which led to the funding of a pilot Health Action Zone for the Armagh and Dungannon area. Statutory Agencies that STEP has worked with include Southern Health and Social Services Trust, Children and Young Peoples Committee, Southern Health and Social Services Board Community Development Panel, DSD, The Health Action Zone, DEL Migrant Worker Forum, OFMDFM Race Equality Forum, DCAL Language Forum. The management of the Measure was reviewed by DSD Internal Audit. As a result of the findings of this exercise DSD were forecasting a significant underspend in this 247 BUILDING SUSTAINABLE PROSPERITY PROGRAMME VERSION 3 Measure due to 13 of the initial 43 projects being withdrawn from the Measure as well as the withdrawal of part of the costs for some of the remaining projects due to unresolved irregularities caused by significant weaknesses in processes and control systems. It was agreed by the Programme Monitoring Committee in December 2007 to transfer the surplus funds to Measure 3.1. As a result of this action there was be no loss to the voluntary and community sector as the weakness was identified in the management controls. 248 BUILDING SUSTAINABLE PROSPERITY PROGRAMME VERSION 3 Examples of Projects within Measure 3.3 Project Project Name EU Funding Match Funding Total Expend 002115 Armagh Confederation of Voluntary Groups £159,615.96 £68,406.90 £228,022.86 002125 North Down Community Council £173,335.65 £74,286.85 £247,622.50 002149 East Belfast Community Development Agency £138,744.22 £59,461.71 £198,205.93 002169 Lower North Belfast Community Council £104,215.12 £44,625.04 £148,750.16 002177 Bogside and Brandywell Initiative £145,134.14 £62,200.39 £207,334.53 002212 Falls Community Council £275,778.35 £118,190.81 £393,969.16 002230 South Tyrone Empowerment Programme £146,481.54 £62,777.93 £209,259.47 002384 Developing Networks – Building Community £141,042.43 £60,446.80 £201,489.23 002303 Coleraine Rural and Urban Network £199,311.41 £85,419.32 £284,730.73 002445 Community Finance Training and Advice £22,303.38 £9,558.51 £31,861.89 002545 Ards Development Bureau and Community Network £218,281.15 £93,549.17 £311,830.21 002654 FOCUS £150,204.04 £64,373.20 £214,577.24 003183 Larne Community Development Project £95,597.38 £40,970.43 £136,567.81 003210 Women in Action £77,414.01 £33,177.47 £110,591.48 003360 Women’s Resource and Development Agency £55,071.64 £23,602.20 £78,673.84 003440 North West Community Networks Core Projects £187,345.45 £80,291.08 £267,636.53 003445 Community Connections £73,897.01 £31,670.20 £105,567.21 004079 Banbridge District Community Partnership £107,591.36 £46,110.58 £153,701.94 004242 Research and Policy Information Unit £83,823.84 £35,924.53 £119,748.37 249 BUILDING SUSTAINABLE PROSPERITY PROGRAMME VERSION 3 Project Project Name EU Funding Match Funding Total Expend 004301 Building Sustainable Communities £88,729.10 £38,026.83 £126,755.93 015951 Moyle District Networking Programme £71,226.15 £30,525.57 £101,751.72 016577 Down District Networking Programme £83,649.31 £35,849.80 £119,499.11 017002 Oakleaf Rural Community Network £74,889.62 £32,095.70 £106,985.32 023548 Ballymoney Community Network £49,171.82 £21,073.69 £70,245.51 023769 Core Carrickergus £57,136.19 £24,487.02 £81,623.21 023840 Lisburn Partnership £75,598.47 £32,399.45 £107,997.92 023843 BCDA Core Support and Strategy Fusion Project £117,240.39 £50,245.98 £167,486.37 023912 Building Community Sustainabilty in South Belfast £106,319.49 £45,565.56 £151,885.05 023993 Newtownabbey Community Voice £119,607.05 £51,260.21 £170,867.36 024064 Castlereagh Sustainable Community Network £72,445.97 £31,048.32 £103,494.29 250 BUILDING SUSTAINABLE PROSPERITY PROGRAMME VERSION 3 Summary of Achievements V Targets for Measure 3.3 Original Indicator Output No of organizations assisted – 40 Result Increase support hours delivered by 2500 hours Position at Mid Term Evaluation Revised Indicators 177 Support given to 35 organisations 17 assisted up to March 2007 508 2000 direct support hours delivered 20,500 to March 2007 100 consultations with statutory agencies Impact Enhanced support structures and increased sustainability Final Position Not available 251 107 consultations with Councils, Housing Executive, H&SSTs. Education Boards and Government Depts Evidence of sustainability in the community organisations assisted In addition to the subregional support Groups gaining sustainable funding from the Neighbourhood Renewal Programme and Regional infrastructure funding. 17 Groups have secured sustainable mainstream funding form the Community Investment Fund. Evidence of improved interagency working and policy development in areas of need Post project evaluations show evidence of increased voluntary / statutory sector partnerships working BUILDING SUSTAINABLE PROSPERITY PROGRAMME VERSION 3 Expenditure and Financial Control Total Expenditure Declared for Measure 3.3 All amounts shown in € Allocation in Programme Complement Expenditure Declared in claims to the Commission EU Amount Public Amount Private Total 4,693,847.00 1,880,000.00 0.00 6,573,847.00 5,003,090.63 2,143,464.89 0.00 7,146,555.52 Expenditure declared as % of available Allocation 108.71 Article 4 All completed projects in this Measure have received an Article 4 check. Summary of findings as a result of Article 4 activity • Most project operators had good policy documents in place. Of those that did not – the main areas of weakness were lack of policy documents in the areas of document retention and publicity. This was addressed through the production of policy documents which were supplied to project operators, with guidance on how to adapt same to fit their organisation and follow-up action was undertaken by the Article 4 Monitoring team to validate compliance. Article 10 Activity 7.88% of declared expenditure was examined under Article 10, revealing an error rate of 0.71%. Spread of Article 10 – 5% checks 2000 2001 2002 % checked 0% 0% 2003 2004 2005 2006 2007 2008 6.88% 10.69% 10.19% 6.1% 5.57% 10.98% 0% Summary of findings as a result of Article 10 Activity Article 10 selections were made from 43 Projects awarded Grant within this Measure. Departmental checks external to the Article 10 process resulted in all expenditure for 252 BUILDING SUSTAINABLE PROSPERITY PROGRAMME VERSION 3 all projects within the Measure being classified as “at risk” pending further investigation of potential systemic issues. After full investigation 13 projects were removed from the Measure which left 30 funded projects. Although 85 recommendations to strengthen and improve management and control systems were made across 19 of the 23 projects inspected no significant weaknesses were identified. Of the total of 23 projects examined 6 projects gave rise to potential ineligible expenditure below the de minimis level and were treated in accordance with set procedures. Irregularities detected through Article 10 Checks Organisation/ Project Ballymena Community Forum Ards Development Bureau & Community Forum Roe Valley Women’s Network Ballymoney Community Resource Centre Newtownabbey Community Voice Total 002384 114.03 79.82 325 28.03.07 Date reported to EC Below de minimis 002545 94.60 66.22 325 02.02.04 Below de minimis 16.12.04 003210 2,418.38 1,692.87 325 22.03.05 Below de minimis 01.08.08 023548 124.41 87.09 325 22.03.07 Below de minimis 17.10.08 023993 35.68 24.98 499 5.04.08 Below de minimis 15.09.08 UK Case No Total irregularity £’s EU Element £’s Nature of irregularity (code) Date identified Date cleared 12.06.08 2787.10 Irregular funding amounts (as above) were identified and all issues raised during the checks have now been resolved and recovery/clawback actioned as appropriate, none of the irregularities identified in the table are included in the eligible expenditure details on the database and therefore any amounts being claimed from the Commission are eligible. The irregularities have been classified within the database as “ Clawback / Recovery to enable DFP European Unit to identify and action to ensure any irregular funding has been removed from the Programme Final Statement of Expenditure 253 BUILDING SUSTAINABLE PROSPERITY PROGRAMME VERSION 3 Audit Activity Details of audit activity can be found in Annex 12 Irregularities 44 irregularities were reported for this Measure, all of which have been cleared. A detailed list of all reported irregularities for Measure 3.3 can be found on Annex 15. Irregularities below the reporting threshold were recorded, details of these can be found in Annex 16. 254 BUILDING SUSTAINABLE PROSPERITY PROGRAMME VERSION 3 8.6 Measure Details for Measure 3.4 – Investing in Early Learning Aims and Objectives The aim of this Measure was to support the progressive expansion and development of the infrastructure necessary to provide a year of pre-school education for all children in Northern Ireland, with the initial focus on providing places for the oldest children in areas of greatest social need. The Pre-School Education Expansion Programme (PSEEP) was developed with the objective that in the longer term all children throughout Northern Ireland would have access to pre-school education. Implementation One project was funded under this Measure – the Pre-School Education Expansion Programme (PSEEP). The EU-funded component of the programme has enabled the creation of a significant number of pre-school places and posts for teachers and classroom assistants. This complements a number of initiatives which, as a whole, have enabled every four-year-old child in Northern Ireland to avail of a year’s nursery education. Pre-school education has a beneficial effect on children’s future prospects, especially the socio-economically disadvantaged. In addition to the direct benefits for the children themselves, associated benefits were derived from the creation of additional employment (e.g. for teaching staff) and by enabling parents to take up employment, education and training opportunities. There have been no significant difficulties in implementing the project and various checks found no major failures of management or control systems. A small number of units listed in the Letter of Offer were not actually constructed but the introduction of additional units to the Measure enabled the target to be exceeded. 255 BUILDING SUSTAINABLE PROSPERITY PROGRAMME VERSION 3 Summary of Achievements V Targets for Measure 3.4 Original Indicator Output 48 Capital schemes across all the ELBs in controlled, maintained, integrated and Irish medium sectors Result 1768 additional places made available for children in their immediate pre-school year, especially the socially disadvantaged and 4 year olds. Position at Mid Term Evaluation Revised Indicators Final Position 36 85 Capital schemes across all the ELBs (Revised to 51 – original target was based on additional expenditure in the performance reserve) 1400 2,200 additional places made available for 1928 full time and children in their immediate pre-school part time places year, especially the socially disadvantaged and 4 year olds. Consequential opportunities for the parents of the above children to take up employment, education or training 0 Up to 136 additional posts for teachers and classroom assistants created. 130 Up to 220 additional posts for teachers and classroom assistants created. (Revised to 130 – original target was based on additional expenditure in the performance reserve) 256 55 51 Nursery units complete at end 2004) 62 teachers and 84 classroom assistants BUILDING SUSTAINABLE PROSPERITY PROGRAMME VERSION 3 Summary of Achievements V Targets for Measure 3.4 (contd) Impact Taken together with other initiatives, this measure will enable all parents who wish to have access to a funded place for their children in their immediate pre-school year. Research shows that children who have had pre-school education are better prepared to take up the advantages of education and hence their prospects of employment are increased. Pre-school education can be particularly beneficial for the socially disadvantaged. Not available Taken together with other initiatives, this Data not measure will enable all parents who wish available to have access to a funded place for their children in their immediate pre-school year. Research shows that children who have had pre-school education are better prepared to take up the advantages of education and hence their prospects of employment are increased. Pre-school education can be particularly beneficial for the socially disadvantaged. 257 BUILDING SUSTAINABLE PROSPERITY PROGRAMME VERSION 3 Expenditure and Financial Control Total Expenditure Declared for Measure 3.4 All amounts shown in € Allocation in Programme Complement Expenditure Declared in Claims to the Commission EU Amount Public Amount Private Total 8,000,000.00 3,340,000.00 0.00 11,340,000.00 8,013,582.57 3,345,632.26 0.00 11,359,214.83 Expenditure declared as % of available Allocation 100.17 Article 4 Activity During the life of this Measure, all projects received an Article 4 check. Summary of findings as a result of Article 4 activity (i) The then current edition of the standard checklist issued by the Managing Authority was used for all formal Article 4 visits; (ii) Visits were carried out to the project approximately one year after acceptance of Letter of Offer; (iii) In addition to the seven formal Article 4 visits stated above, 80 spot checks (consisting of vouching visits) were carried out. Article 4 checks found that the project was being administered effectively and that management and control systems were sound. Financial systems, procedures and record-keeping were adequate. A sample of expenditure in each Education and Library Board was reconciled successfully with project records. The project was found to be performing satisfactorily against Letter of Offer targets, and arrangements were in place to gather performance data. Required standards in areas such as publicity, equality of opportunity, and environmental impact were being met. 258 BUILDING SUSTAINABLE PROSPERITY PROGRAMME VERSION 3 Article 10 Activity 19.12% of declared expenditure is under examination by the Article 10 with an error rate of 0.01%. Spread of Article 10 – 5% checks % checked 2000 2001 2002 2003 2004 77.7 16.2 14.0 35.9 44.1 2005 2006 2007 2008 One Irregularity has been detected through Article 10 Checks Audit Activity Details of Internal Audit activity can be found in Annex 12. Irregularities Six irregularities were reported for this Measure all of which were cleared. A detailed list of all reported irregularities for Measure 3.4 can be found on Annex 15. Irregularities below the reporting threshold were recorded, details can be found in Annex 16. 259 BUILDING SUSTAINABLE PROSPERITY PROGRAMME VERSION 3 CHAPTER 9: PRIORITY 5 9.1 Introduction Aims & Objectives This Priority consisted of one Measure – Measure 5.1 Sustainable Management of the Environment and Promotion of the Natural and Built Heritage. Respect for the environment is a key emphasis both of EU Structural Funds and of UK Government policies, which seek to place the environment at the heart of decisionmaking. Environmental sustainability has been identified in the CSF as a cross-cutting theme applying to all Measures of both Operational Programmes. In recognition of this, the Northern Ireland Programme for Building Sustainable Prosperity contained actions intended to promote balanced and equitable development. Implementation This Measure was administered through two government departments: Department for Regional Development - (DRD) - (DOE) through the Water Service; and Department of the Environment through Environment and Heritage Service Each of these Departments played a key role in the implementation of the Lisbon Strategy through Priority 5, Measure 5.1 by addressing the growing pressures on the environment and aimed to develop a proper awareness and understanding of the environment. Included in the implementation of this Measure were the completion of 4 water treatment plants, 2 sewage treatment plants, a waste awareness campaign and an air quality project which have assisted Northern Ireland meet the EU Directives on the drinking water, sewerage and purification and the Air Quality strategy. The air quality project referred to in the impact indicator is only one aspect of a number of projects that have been supported. The projects funded covered a range of 260 BUILDING SUSTAINABLE PROSPERITY PROGRAMME VERSION 3 activities including environmental quality research, contaminated land recovery, waste management, biodiversity conservation, built heritage conservation, environmental education and countryside access. Whilst not directly reflected in the current impact indicator, these activities will in the long term make an important positive impact on the environment. Publicity Examples of publicity are available in Annex 18. 261 BUILDING SUSTAINABLE PROSPERITY PROGRAMME VERSION 3 9.2 Measure Details for Measure 5.1 - Sustainable Management of the Environment and Promotion of the Natural and Built Heritage Aims and Objectives • To focus on those themes which supported activities aimed at raising the quality of water supply and waste-water treatment in Northern Ireland to current standards. • To develop sustainable development within Northern Ireland, protecting and managing environmental resources and the maintenance of healthy living environments. The strategy for the environment sought to support proper stewardship of the Region’s environmental resources, its good quality air and water, its natural vegetation and wildlife, its relatively unspoilt countryside and its built heritage. • Through the funding of appropriate projects, to support the promotion of better water management by the implementation of water quality strategies including that to control eutrophication. Implementation A total of 23 project applications were approved under this Priority, 6 were approved by DRD and 17 were approved by DOE. A list of all projects for Measure 5.1 which incurred expenditure and the ERDF element can be found in Annex 5. Examples of Projects within Measure 5.1 funded by DRD • Newry WWTW – The objective of this project was to increase capacity of the Sewerage Treatment works by on average 275%. This target has been met with effluent quality now complying with EC Directive standards. 262 BUILDING SUSTAINABLE PROSPERITY PROGRAMME VERSION 3 • Kilkeel WWTW – The objective of this project was to increase capacity of the Sewerage Treatment works by on average 275%. This target has been met with effluent quality now complying with EC Directive standards. • Lough Fea WTW – The objective of this project was to increase capacity of the Water Treatment works by on average 30%. This target was met with Water Quality now compliant with EC Directive standards. • Lough Bradan WTW – The objective of this project was to increase capacity of the Water Treatment works by on average 30%. This target was met with Water Quality now compliant with EC Directive standards. • Lough Macrory WTW – The objective of this project was to increase capacity of the Water Treatment works by on average 30%. The treatment works is now producing drinking water to EU standards to meet demand in the supply zone. • Carran Hill WTW - The objective of this project was to increase capacity of the Water Treatment works by on average 30%. The treatment works is now producing drinking water to EU standards to meet demand in the supply zone. Examples of Projects funded by DOE Refinement of a novel method for measuring re-aeration in surface waters - The project relates to the capability of rivers to recover from oxygen-depleting pollutants, such as wastewater discharges and agricultural runoff. It involves the refinement of a practical and “environmentally friendly” method to measure the rate of re-aeration, the natural process which determines whether receiving waters will return to their normal state. The work is required to evaluate the precision of the novel technique, which as proven as viable in preliminary field trials on the River Lagan in 2000/01. The outcome of the work was valuable in river quality management and in particular, the assessment of applications for consent to discharge. The project helped by providing a reliable technique to ensure that rivers will not become oxygen-starved – a problem that can lead to incomplete degradation of 263 BUILDING SUSTAINABLE PROSPERITY PROGRAMME VERSION 3 discharged wastewater (with the associated health risks and foul odours, both of which discourage recreational use of waterways) and the loss of drinking water resources. Enhanced natural attenuation of hydrocarbon contaminated land - The aim of the project was to develop a novel cost-effective low technology to deal with domestic and small scale oil spills using an environmentally friendly approach, leading to initiation and acceleration of natural attenuation through the addition of the rate limiting nutrients and alteration of conditions to enhance the bio-availability and degradation of oil pollutants in soil utilising existing naturally occurring micro-organisms in the soil. The project resulted in outlining such a technology though a series of publications mainly utilising thermophilic soil microbial communities and though amendments with limiting nutrients and temperature elevation. The project also led to exposure of the project and team on the National and International arena through publications and conference presentations. Ultimately research and exposure in this area has helped the group at Ulster University secure funding from other resources in similar areas of research to further benefit studies into reduction of water pollution. Local Air Quality Grant Scheme - The LAQMG scheme was intended to support positive initiatives under Article 18 of the Environment Order 2002 which aimed to lead to improvements of air quality. These initiatives included; • Air quality review and assessments; • Preparing and implementing air quality action plans; and • Management of local air quality The scheme enabled improvement in ambient air quality through the identification of areas subject to poor air quality and the development of plans to reduce emissions from domestic, industrial and road traffic sources. This was achieved through the 264 BUILDING SUSTAINABLE PROSPERITY PROGRAMME VERSION 3 promotion of actions and activities such as the use of smoke control, transportation measures and cleaner fuels. The LAQMG scheme assisted District Councils in reviewing and assessing local air quality. From this review and assessment, health based air quality objectives and targets unlikely to be met were pinpointed. A variety of tools to aid this process such as monitoring equipment and modelling contracts were availed of through the scheme. As a result, air quality action plans were prepared and implemented by the council in partnership with relevant authorities in order to attain the targets within specific timescales. This ultimately improved the quality of air and public health in areas where a problem was identified. Nine District Councils have now declared Air Quality management areas (AQMAs). Those councils with AQMAs are developing action plans; two final plans and three draft plans have been received and appraised by the Department. BSP part funding is contributing towards enabling councils to achieve the EU and UK standards and objectives. Waste Management for refrigerated products - The object of the project was to set up a processing plant and storage facility to recycle all types of refrigerated/electrical waste and associated products. This equipment would have the capacity to handle the recycling required for all of Ireland. The proposal aimed to assist with the increasing amounts of old waste refrigeration equipment. Fridges and freezers manufactured before a certain date contain damaging gases, in particular CFCs which are harmful if released into the atmosphere. New EU legislation (the Waste Electrical, Electronic Equipment Regulations) required that all Member States ensure the safe removal of gases, foams containing gases and the recycling of fridge/freezer component parts. 265 BUILDING SUSTAINABLE PROSPERITY PROGRAMME VERSION 3 There were no such recycling facilities available and therefore this project was seen to be worthwhile on a number of counts; as a demonstration project, to provide employment in a less advantaged area and to ensure the waste was recycled and Northern Ireland met EU requirements. The project has been successful and met all of these objectives. Most importantly, it remains the only plant of its kind on the whole island of Ireland. Waste Management Grant Scheme for District Councils - The introduction of a system of environmental regulation and legislation – The Waste Framework Directive 75/442/EEC, the Waste and Contaminated Land (Northern Ireland) Order 1997 (aka WCLO) and the Landfill Directive 1999/31/EC – prompted the DOE to issue a Northern Ireland Waste Management Strategy. As part of this strategy, a Waste Management Grant Scheme for District Councils was devised. The Environment Protection Department had proposed the provision of grant aid for District Councils to aid them in the implementation of their Waste Management Plans (WMPs). The Waste Management Grant Scheme to District Councils was set up and the respective councils incurred both staff/revenue and capital expenditure. The project resulted in Northern Ireland remaining on target to achieve EU targets of a decrease in amount of waste sent to landfill. The councils are also on target to reach targets set out in IAP’s for the increase in levels of waste being recycled. Finally the councils are on target in the attempt to raise awareness of the need to increase levels of recycled materials and decrease in tonnage of waste to landfill. Conservation of genetics of NI seagrass bed - The aim of the project was to elucidate levels and patterns of genetic diversity in Northern Ireland Seagrass Beds and to use this information as the basis for a rational, sustainable conservation plan. The project contributed to a better understanding of the effective management of this threatened habitat with special reference to the protection of Strangford Lough as both 266 BUILDING SUSTAINABLE PROSPERITY PROGRAMME VERSION 3 a tourist facility as well as a living ecological attribute of International Standing. Sea grass is the stable over-wintering diet of Pale-bellied Brent Geese. The project contributed further to our understanding of species migratory pathways and hence to the knowledge of invasive/non-native species. This knowledge will contribute to a better understanding of the protection measures needed to sustain rare and threatened species. Conservation genetics of NI peat bogs - This project looked at peat bog ecosystems, many of which are considered to be under threat from habitat fragmentation due to peat cutting and agricultural practices and are subject to conservation measures under the EU Habitats Directive and Northern Ireland habitat action plans. Genetic difference had been detected in bog plants and this could be caused by habitat fragmentation. Information on the impacts of habitat fragmentation on the genetic variability of plant species could have an important influence on how peatland habitats – which occupy 17% of Northern Ireland – are managed. The study planned to look at other plants and analyse in more detail the levels and patterns of genetic diversity in both intact and fragmented populations to determine the effects of fragmentation. Heather Calluna vulgaris was the plant selected for detail examination. Significant genetic variation was expected but only limited genetic variation was found highlighting the difference in response of different taxonomic groups to the effects of fragmentation. 267 BUILDING SUSTAINABLE PROSPERITY PROGRAMME VERSION 3 Summary of Achievements V Targets for Measure 5.1 Original Indicator Output Water Treatment schemes Sewage Treatment schemes Environmental Quality Research Projects Contaminated land recovery project Waste Management Projects Biodiversity conservation projects Scheduled monument conservation projects Access / tourism/ environmental education projects Projects to entail partnership Project per county Result Average 30% increase in capacity and Water quality improvement (variable up to 100%) Average 275% increase in capacity, with effluent quality improvement (variable up to 100%) Position at Mid Term Evaluation Revised Indicators 2 2 0 3 Water Treatment schemes 2 Sewage Treatment schemes Environmental Quality Research Projects –1 Biodiversity conservation projects - 10 Access / tourism projects - 4 Waste Management Projects – 5 1 Air Quality project for the 26 District Councils 0 0 268 Final Position 4 2 0 4 1 4 1 Built Heritage conservation projects – 2 1 Waste Management project for the 26 District Councils 1 Average 30% increase in capacity 30% Average 275% increase in capacity 275% Publication and appropriate dissemination of research conclusions - The availability of at least 6 pieces of research information to environmentalists and 7505 - Quercus Project, 7734 – Direct measurements of BUILDING SUSTAINABLE PROSPERITY PROGRAMME VERSION 3 scientists by the end of the Programme. 269 aeration using noble gas tracers in the River Lagan NI, Water & Environment Journal Vol 21 issue 3 Sept 07 7501 – 1. QUERCUS Report; Conservation Genetics of Northern Ireland seagrass beds 0406; 2. Peer reviewed scientific paper in Conservation Genetics,accepted 23 April 2007. 7784 – 1.QUERCUS Project; Molecular basis for a Species Action Plan for the Red Alga Ahnfeltiopsis sp.; 2. Draft scientific paper currently being circulated for publication in BUILDING SUSTAINABLE PROSPERITY PROGRAMME VERSION 3 peer reviewed scientific publication. Production of recycling, research and waste information 4959 – monitoring data in relation to fridges recycled and glass collected. 7473 – 3 to 4 items. 7938 – Drama production for children. 30793 – indicator met. Capital infrastructure projects to enable District Councils to measure, monitor and improve air quality The scheme has enabled improvement in ambient air quality through the identification of areas subject to poor air quality and the development of plans to reduce emissions from domestic industrial and road traffic sources. Staff resource projects to enable District Councils in the carrying out of all appropriate air quality activities Development of 2 databases – industrial heritage sites and stone masonry 270 BUILDING SUSTAINABLE PROSPERITY PROGRAMME VERSION 3 buildings 1 database developed Capital infrastructure projects to support the recovery of recyclable waste 28 Capital projects were approved. Examples include; the provision of Recycling Bins, Civic Authority Site provision, Collection Vehicles, and various smaller projects, eg.Bin Tagging/ Composters. Staff resource projects to support waste management activities 271 25 councils claimed for Revenue Projects. For example; expenditure incurred in support of Regional Waste Groups, Promotional and Educational Awareness Activities, Site Leasing, Recycling Bin delivery and BUILDING SUSTAINABLE PROSPERITY PROGRAMME VERSION 3 Waste Collection/ Processing Impact Improved understanding of sustainable environmental management Correction of an environmental problem Improved environmental management Improved environmental management Correction of environmental problems through conserving monuments at risk Developing environmental awareness and understanding Community involvement Not available Water quality improvement (variable up to 100%) Water quality complies with EC directive standards. Effluent quality improvement (variable up to 100%) Effluent quality complies with EC directive standards. Improved and enhanced access to the natural heritage. Good geographical spread of support Evidence of enhanced environmental awareness 272 Enhanced educational understanding of the Mourne environment and production and distribution of interpretative publications. 4959 – large quantity of fridges recycled and CFC gases captured. BUILDING SUSTAINABLE PROSPERITY PROGRAMME VERSION 3 7473 – research of assistance to academics. 7838 – To encourage the appreciation of sustainable environment principles by children across NI. 30793 – Recycling rates have increased from 18.2% in 2004/05 to 28.8% as a result of initiatives by District Councils which received BSP funding. Contribute towards the objectives of the Air Quality Strategy 273 The scheme has assisted Councils to assess local air quality and to submit the various reports that are required under air quality policy framework. In addition it is more likely that air BUILDING SUSTAINABLE PROSPERITY PROGRAMME VERSION 3 quality objectives and EC limit values will be achieved by the relevant dates. Enhanced information leading to improved management of the built heritage Contribute towards the objectives of the NI Waste Management Strategy 274 Seminars conducted in Belfast and Edinburgh. Book on stone identification and all Ireland geological map produced. Recycling and waste information produced Municipal Waste Management Reports for 2005/06 and 2006/07, and the NILAS Reports for 2005/06 and 2006/07. All viewable on the EHS Website. The District Councils’ contribution BUILDING SUSTAINABLE PROSPERITY PROGRAMME VERSION 3 towards the objectives of the NI Waste Management Strategy is ongoing. Statistics indicate positive reduction in waste to landfill and increased levels of recycling. Recycling rates has increased from 18.2% in 2004/05 to 28.8 % in 2007/08 as a result of initiatives by District Councils which received BSP funding 275 BUILDING SUSTAINABLE PROSPERITY PROGRAMME VERSION 3 276 BUILDING SUSTAINABLE PROSPERITY PROGRAMME VERSION 3 Expenditure and Financial Control Total Expenditure Declared for Measure 5.1 All amounts shown in € Allocation in Programme Complement Expenditure Declared in Claims to the Commission Expenditure declared as % of available Allocation EU Amount Public Amount Private Total 46,350,400.00 15,499,000.00 300,000.00 62,149,400.00 46,845,173.47 18,364,127.20 378,942.72 65,588,243.39 105.53 Article 4 All projects were subjected to an Article 4 check. The Article 4 checks were carried out on the Promoter after payments of claims had been made. Desk checks were carried out on each claim made and followed up with a verification visit when the original documentation had not been included or if further clarification was needed. Summary of findings as a result of Article 4 activity In all but one visit, a standardised template was used. Prior notice was given to the projects so that appropriate staff and documentation would be available at the time of the visit. All projects complied with Article 4 requirements. After the visit, feedback was given to the project, highlighting good practice or areas for further action or missing information. Issues that were not resolved at the Article 4 visit were resolved either through a follow-up visit or explanatory correspondence. A number of projects did not have asset registers completed at the time of the visits but these were pursued so that, compliance was achieved. Some projects did not open dedicated bank accounts for reception of the grants but opted to successfully use cost centres for the same purpose. Where full publicity requirements were not met at the time of visit, additional publicity 277 BUILDING SUSTAINABLE PROSPERITY PROGRAMME VERSION 3 materials (plaques, stickers and logos) were supplied and erected at sites and premises and placed on websites. Article 10 16.02% of declared expenditure was examined under Article 10 with all of the expenditure fully verified. Spread of Article 10 - 5% Checks % checked 2000 2001 2002 2003 2004 2005 2006 2007 14 14 12 58.97 20.44 27.48 15.93 17 2008 0 Summary of Findings as a Result of Article 10 Activity Systems in operation within projects were working effectively and any weaknesses identified were addressed and followed up to ensure compliance. No irregularities were detected through Article 10 Checking. Audit Activity Details of internal audit work are available in Annex 12. Commission audit findings are detailed in Annex 13. Irregularities No irregularities were reported for this Measure. Irregularities below the reporting threshold were recorded, details can be found in Annex 16. 278 BUILDING SUSTAINABLE PROSPERITY PROGRAMME VERSION 3 CHAPTER 10: PRIORITY 6 – TECHNICAL ASSISTANCE 10.1 Introduction Under the Structural Funds Regulations, the impact of Operational Programmes must be evaluated, publicised effectively and studies undertaken into specific aspects of the Programmes. The Operational Programme provides Technical Assistance to cover costs of management and monitoring, control, information and publicity as well as the mid-term Evaluation of the Operational Programme. The Technical Assistance Measure provides the resources required for these requirements to be met. 279 BUILDING SUSTAINABLE PROSPERITY PROGRAMME VERSION 3 10.2 Measure Details for Measure 6.1 – Technical Assistance The Technical Assistance Sub-measures were intended for the use of the Managing Authority, (DFP), in implementing and publicising the BSP Programme. It was therefore not open for general application by outside organisations. However, DFP commissioned applications for Technical Assistance based upon management and publicity needs of the Programme and ensured that, normal Procurement Service rules regarding competitive tendering procedures were observed Implementation For administrative purposes this Measure was split into (a) Programme administration and support and (b) publicity actions. European Division, Department of Finance and Personnel (DFP,) as the Managing Authority, was responsible for implementing this Measure. Sixteen projects were assisted and full details of activities carried out are detailed on the following pages. A list of all projects for Measure 6.1 which incurred expenditure and the EU element can be found on Annex 5. Assessment and Summary of Achievement v Targets Details can be found within the sub-measure reports. Publicity Details of publicity can be found in Annex 18. 280 BUILDING SUSTAINABLE PROSPERITY PROGRAMME VERSION 3 Expenditure and Financial Control Total Expenditure Declared for Technical Assistance All amounts shown in € Allocation in Programme Complement Expenditure Declared in Claims to the Commission EU Amount Public Amount Private Total 3,000,000.00 1,150,000.00 0.00 4,150,000.00 3,020,916.24 1,158,011.00 0.00 4,178,927.24 Expenditure declared as % of available Allocation 100.70 Article 4 Activity Details of Article 4 activity can be found within each sub-Measure. Article 10 Activity 24.89% of declared expenditure was examined under Article 10, with a zero error rate. Spread of Article 10 – 5% checks 2000 % checked 2001 24.65 6.99 2002 2003 68.68 8.83 2004 2005 21.60 6.60 2006 2007 2008 10.72 16.19 0 Summary of findings as a result of Article 10 Activity No irregularities were detected through Article 10 Checks In a number of cases the Implementing Body’s (IB) financial procedures were not being fully complied with in terms of the recording of authorisation codes and the full signing and countersigning of authorisation forms etc. This was raised with the IB Management who accepted the relevant recommendations and highlighted the use of the new Accounts NI system and the new authorisation procedures which were introduced subsequent to the payments identified. These more robust procedures were accepted as addressing the issues raised. 281 BUILDING SUSTAINABLE PROSPERITY PROGRAMME VERSION 3 It was initially found that some supporting documentation could not be viewed and this resulted in further checks being carried out. On the basis of these further checks the EU Verification Unit was satisfied with the level and quality of supporting documentation for the selected claims. Further checks were also carried out due to a weakness found in the IB’s document storage facility. This was raised with the IB who took measures to separate the EU documentation from the mainstream financial documentation and this was acceptable to the Verification Unit. Audit Activity Details of Internal Audit activity is available in Annex 12. Irregularities No irregularities were reported for this Measure. Irregularities below the reporting threshold were recorded, details can be found in Annex 16. 282 BUILDING SUSTAINABLE PROSPERITY PROGRAMME VERSION 3 Sub-Measure Details – 6.1(a) Administration and Support Aims and Objectives To support the effective management and implementation of Programme structures and achievement of Programme aims. Implementation As Implementing Body, European Division, Department of Finance and Personnel worked in association with other Government Departments, social partners and District Councils, Universities, Community and Voluntary organisations and private firms. European Division was also responsible for co-ordinating the establishment of the 2007-2013 Structural Funds Programmes in Northern Ireland and the administration systems to manage them. Systems 2007 is a PRINCE II project established to procure suitable systems for the Managing Authorities of the 2007-2013 programmes. Funding was provided for the specification stage where an external consultant was appointed in October 2006 to establish user requirements and produce a report which may serve as a basis for inviting tenders. A total of 16 applications were approved under this Measure. A list of all projects for Measure 6.1(a) which incurred expenditure and the EU element can be found on Annex 5. Examples of Activity Funded under sub-Measure 6.1(a) Technical Assistance Monitoring Committee and Working Group administration: Technical Assistance was used to fund the costs of holding BSP and CSF Monitoring Committees and Working Groups and the travel claims of members attending meetings. The grant awarded for the BSP Monitoring Committee was 283 BUILDING SUSTAINABLE PROSPERITY PROGRAMME VERSION 3 £25,135, the CSF Monitoring Committee received £18,169.57 and the Working Groups £104,414. Evaluations and Studies (including mid-term evaluation): The mid-term evaluation of the 2000-06 Building Sustainable Prosperity (BSP) Operational Programme as required by Article 42 of Council Regulation (EC) No 1260/99. The mid-term evaluation (MTE) established how well the Programme was delivering what it set out to deliver; test the continued relevance of the strategy and recommend any action necessary to improve quality and performance. Other evaluations funded from Technical Assistance included the Equality Impact assessment of the programme complement, the Ex-ante evaluation of the programme complement and ESF Participant Leavers’ Surveys. The total grant awarded to Evaluations and Studies was £111,358. Procurement of computer systems for programme administration: To meet the Commission’s data requirements for the 2000-2006 round, DFP commissioned a website based applications system, which was later expanded into a complete applications and projects monitoring system and coverage extended from the BSP and PEACE programmes to cover the four Community Initiatives as well. A ‘Successful Projects’ public website was subsequently developed to display details of EU Funded projects. The grant awarded to this project was £852,560. Economic appraisals and verifications: The current rules state that Economic Appraisals of projects must be undertaken or commissioned and paid for by Implementing Bodies and not by the project promoters. These costs qualify as eligible expenditure under Technical Assistance and was awarded assistance of £1,131,955. Development Path Analysis review and training: The research project commissioned on behalf of the Environmental Working Group and carried out by consultants, recommended a number of key actions be taken to improve 284 BUILDING SUSTAINABLE PROSPERITY PROGRAMME VERSION 3 the understanding of the use of DPA. New Guidance was circulated to Implementing Bodies (IBs) and training was given to officers applying DPA. After the training, an analysis of the Database showed that of the 1,009 projects under BSP approved on or before 31 December 2005, 100% had a DPA score, representing 100% of total funding awarded. Funding for this research was provided by the Working Group project. Support to social partners participating in Monitoring Committees: Following Northern Ireland Local Government Association: (NILGA) successful application, supported under this Measure, the European Officer in her role in assisting local government representatives on the monitoring committees has enjoyed a productive year. She has met with Councils, Councillors and stakeholders throughout the year and attended events in Brussels and the UK on current EU issues which are of interest to local government. Her support of the local government representatives’ is evident as attendance at monitoring committee meetings has greatly improved. Assistance of £115,010 was awarded. In the autumn of 2006, the Social Partnership organisation Concordia applied for technical assistance support to help fund a European Officer to support Concordia members on the Monitoring Committee and this application was approved in December 2006 with assistance of £54,080. Programme preparation and consultation 2000-2006 round: Technical Assistance funded consultation on the development of the NI Structural Funds Plan, the Community Support Framework and the Building Sustainable Prosperity programme as well as expenses incurred in consultation and negotiation. Programme preparations 2007-2013 round: In January 2007 a consultant was appointed to carry out the Strategic Environmental Assessment of the Competitiveness Programme. The report was issued for public consultation in April. Only one response was received, comments from which were considered and the Programme amended accordingly. 285 BUILDING SUSTAINABLE PROSPERITY PROGRAMME VERSION 3 The Consultative Partnership Group, set up to facilitate discussions with Social Partners on issues in developing the Programmes 2007-13, held their final meeting in April, after the end of the Programme consultation, at which responses were discussed. Assistance in the preparation of the 2007-13 round of funding was £103,342. 286 BUILDING SUSTAINABLE PROSPERITY PROGRAMME VERSION 3 Assessment and Summary of Achievements v Targets for Measure 6.1(a) Original Indicator Output 30 Technical Assistance projects to be funded Result 75% of recommendations of studies to be accepted Impact 50% of Technical Assistance studies judged to have improved implementation of CSF or OP Position at Mid Term Evaluation Revised Indicators Final Position 7 30 Technical Assistance projects to be funded 14 projects funded 0 75% of recommendations of studies to be accepted Part funding for 4 studies under the NICSF (1) evaluation of Information Society activity (2) research on use of Development Path Analysis (3) impact of EU programmes on Section 75 groups (4) good practice in delivery of ESF –financed operations in BSP and Peace II programmes. All were reported to and accepted by the CSF Monitoring Committee Not available 50% of Technical Assistance studies judged to have improved implementation of CSF or OP No survey of the effects of the studies on implementation has yet been carried out 287 BUILDING SUSTAINABLE PROSPERITY PROGRAMME VERSION 3 Expenditure and Financial Control Article 4 The checklist issued by DFP – EU Finance Guidance Note 01/2005 was used in all Article 4 checks to ensure that all relevant areas were addressed. Checks were made after receipt of the first claim or later. All projects in this Measure were subjected to an Article 4 check. Summary of findings as a result of Article 4 Activity NILGA • No time sheets were kept for officers recording time spent on the project. Officers asked to keep time sheets to enable match funding to be verified. • Computerised purchasing system was not password protected. Project advised to introduce security passwords into the system to maintain a proper segregation of duties and prevent possible fraud. • BSP Logo not on project officer’s stationery. Logo was requested to be added to all stationery used by the project officer. • No mention of BSP funding of European Officer in NILGA annual report – to be included in following year’s report. • Quarterly update reports not signed – to be done so. Agri-rural • BSP logo not used – to be put on all material associated with project. • Time sheets show no distinction between administrative duties and expert advice – these roles have different daily rates. Project advised to keep separate time sheets for Admin and expert advice. • Invoices not date stamped – to be stamped and matched with the order. • No purchase forms were used and there was a non-compliance with public procurement rules. Advised to ensure that all purchase orders for products/services are properly recorded to facilitate the matching of the invoice on receipt and public procurement rules should be complied with. 288 BUILDING SUSTAINABLE PROSPERITY PROGRAMME VERSION 3 Concordia • Not all invoices were date stamped. Advised to stamp all invoices. • Time sheets not present for supporting staff. Recommended to keep time sheets to be signed and to accompany claims. • BSP logo not on website – to be added. • Claims signed by project officer instead of finance officer – all claims to be signed by finance officer • Invoices submitted for claim not authorised nor paid therefore claim could not be processed. Advised to submit claims for expenditure paid. Article 10 Details of Article 10 activity are included in the Measure Summary. Audit Activity Details of Internal Audit activity can be found in the Measure in Annex 12. Irregularities Details of recorded irregularities can be found in the Measure Summary. There were no reportable irregularities. 289 BUILDING SUSTAINABLE PROSPERITY PROGRAMME VERSION 3 Sub-Measure Details – 6.1(b) Programme Information and Publicity Aims and Objectives The aim of this sub-measure was to publicise the contribution of the Programme in reinforcing progress of Northern Ireland towards a state of sustainable prosperity in a competitive modern economy. DFP commissioned applications for Technical Assistance based upon management and publicity needs of the Programme and ensured that normal Procurement Service rules regarding competitive tendering procedures were observed. Implementation Two projects were approved under this Measure. A list of the projects for Measure 6.1(b) which incurred expenditure and the ERDF element can be found on Annex 5. Examples of Projects within Sub-Measure 6.1(b) Information & Publicity activities - Technical Assistance (grant awarded £234,197) was used: • to support the production of promotional goods, news.letters, guides and leaflets; • for a Translink Bus Wrap campaign and Bus shelter advertisements; • for the production of a publicity insert in the main newspapers; • for the production of twice-yearly newsletters publicising the achievements of the programme; • to support the Launch Event for the programme in 2001 and the printing of copies of the programme; and • to produce a Guide to Funding from Europe 290 BUILDING SUSTAINABLE PROSPERITY PROGRAMME VERSION 3 Agri-rural Forum The Technical Assistance support to the Agri-Rural Forum (£36,443) was to establish a communications programme for their work in relation to the EU programmes. The AgriRural Forum brought together all the stakeholders to provide a central communications and information channel for the agri-rural sector in relation to EU programmes. 291 BUILDING SUSTAINABLE PROSPERITY PROGRAMME VERSION 3 Summary of Achievements V Targets for Measure 6.1(b) Original Indicator Output Quarterly report on media coverage Number of publicity and information enquiries Number of website visits Number of promotional events held Result Access to information on the Programme and an understanding of the benefits to the region Impact Increased awareness of the EU support and the overall aim of funding Position at Mid Term Evaluation Not available 56 13775 Not reported on Revised Indicators Final Position Quarterly report on media coverage Number of publicity and information enquiries Number of website visits Number of promotional events held Visits to the Managing Authority website rose from 1,125 in 2001 to a maximum of 30,343 in 2005. total number of visits in the period 2001 – 2007 was 118,527 Not available Access to information on the Programme and an understanding of the benefits to the region Not available Increased awareness of the EU support and the overall aim of funding 292 Annual Implementation Reports included details of information and publicity. Specific questions were included in the Northern Ireland Omnibus survey to measure public awareness of EU support and benefits BUILDING SUSTAINABLE PROSPERITY PROGRAMME VERSION 3 Expenditure and Financial Control Article 4 Two Article 4 checks were undertaken on this project. Summary of Findings as a result of Article 4 Activity Agri-rural • All invoices and time sheets for both Agri-rural projects are in one file making it difficult to follow audit trails for each project. At the late stage of the check it was inappropriate to carry out any action, however it was recommended that a separate file be kept for any future projects. Article 10 Details of Article 10 activity are included in the Measure Summary. Audit Activity Details of Internal Audit activity can be found in Annex 12. Irregularities Details of recorded irregularities can be found in the Measure Summary. There were no reportable irregularities. 293 BUILDING SUSTAINABLE PROSPERITY PROGRAMME VERSION 3 Annex 1 Programme Financial Tables (Original and Final) Original Approved Amended Financial Financial Ta... Table for BS... 294 BUILDING SUSTAINABLE PROSPERITY PROGRAMME VERSION 3 Annex 2 Programme Complement Financial Table amendments Version 1.1.pdf (48 KB) Version 1.2.pdf (48 Version 1.2 (Difference betwee.. KB) Version 2.1.pdf (48 Version 2.1 (Difference betwee.. KB) Version 2.2.pdf (48 Version 2.2 (Difference betwee.. KB) Version 2.3.pdf (48 Version 2.3 (Difference betwee.. KB) Version 2.4.pdf (49 Version 2.4 (Difference betwee.. KB) Version 2.5.pdf (49 Version 2.5 KB) (Difference betwee.. Version 2.6.pdf (49 Version 2.6 (Difference betwee.. KB) Version 2.7.pdf (49 Version 2.7 (Difference betwee.. KB) Version 2.8.pdf (49 Version 2.8 (Difference betwee.. KB) 295 BUILDING SUSTAINABLE PROSPERITY PROGRAMME VERSION 3 ANNEX 3 Detail of expenditure declared by year and by Measure Final Claim Proposed on SFC.... 296 BUILDING SUSTAINABLE PROSPERITY PROGRAMME VERSION 3 ANNEX 4 Summary of Achievements V Targets for Measure 1.1(a) Original Indicator Position at Mid Term Evaluation Output 100 high growth potential businesses 242 created (of which 60 in high tech sectors) (1a) *3000 locally focused businesses created Result *700 Gross jobs (100 gross jobs) Revised Indicators Final Position *100 high growth potential businesses created (of which 60 in high tech sectors) 546(1) *3000 locally focused businesses created 14,332(2) 882 963 (52) *700 Gross jobs * (100 in high tech sectors) *6000 Gross jobs Impact 400 Net jobs (50 net jobs) 1323 *6000 Gross jobs * 550 (26) 400 Net jobs (50 in high tech sectors) 4,302 net employed (3) 2500 Net jobs 551 2500 Net jobs 18,630 net employed (4) 90% survival rate in assisted businesses after year 1 End of prog (5) End of prog (5) 70% survival rate in See note below assisted businesses after 3 years * Invest NI have been unable to obtain gross job figures at the end of this Programme. Invest NI only has one figure for job creation for each of the targets i.e. the number of jobs in these start up companies at 2007 – so it is a net change figure. 297 BUILDING SUSTAINABLE PROSPERITY PROGRAMME VERSION 3 The 2001 AIR, highlighted that for this measure, over 90% of the high growth potential businesses created target, had already been achieved (Target - 100 Position at the end of 2001- 91). By the end of 2003, and mid term evaluation, this target had been exceeded at 253 as highlighted in the AIR of that year. This figure continued to grow and by the end of 2007 (and the BSP Programme), 546 high growth businesses had been created; the target at the outset of the programme had been exceeded by over 300%. (1) Only includes start up projects within the following parameters – in receipt of SFA assistance totalling £25k or more to a client employing less than 250. (1a) The table also demonstrates that the original target of 3000 locally focused businesses created, had been exceeded by the end of 2007. This figure stood at 14,332 locally focused businesses created. (2) Invest NI have been unable to obtain gross job figures at the end of this programme. Invest NI only has one figure for job creation for each of the targets i.e. the number of jobs in these start up companies at 2007 - so it is a net change figure. The impact of the number of high growth businesses created on the number of Net Jobs created was determined as 4,302 at the end of the BSP programme (3) Again, the resulting gross jobs created cannot be determined, however the number of net jobs created in relation to locally focused businesses created was 18,630. (4) The 2001 AIR, highlighted that for this measure, over 90% of the high growth potential businesses created target, had already been achieved (Target - 100 Position at the end of 2001= 91). By the end of 2003, and mid term evaluation, this target had been exceeded at 253 as highlighted in the AIR of that year. This figure continued to grow and by the end of 2007 (and the BSP Programme), 546 high growth businesses had been created; the target at the outset of the programme had been exceeded by over 300%. (5) INVEST NI NOTE: 78% of businesses assisted through Start A Business Programme survived at least 3 years. 298 BUILDING SUSTAINABLE PROSPERITY PROGRAMME VERSION 3 Summary of Achievements V Targets for Measure 1.1(b) Original Indicator Position at Mid Term Evaluation Output *500 SMEs supported by LEDU 623 20 companies assisted by IDB ? Result *1700 jobs (gross) 1856 To maintain turnover and profit levels at 1998/0999 levels Impact 8% growth in sales (net) per annum Figures unavailable at MTE Revised Indicators Final Position *500 SMEs supported by INVEST NI per annum 1714 (6) *1700 jobs (gross) 37,152 (7) 7% growth in sales (net) per annum over the six years of the programme (as compared with 5% in 1999/2000) 10.2% increase in sales over the period. (8) 8% growth in export performance (net) per annum Figures unavailable at MTE 8% growth in export performance (net) per 15.6% increase in exports. (9) annum over the six years of the programme (as compared with 6% in 1999/2000) 5% increase in net jobs creation per annum (1300 jobs) Figures unavailable at MTE 1300 net jobs at the end of the programme Improved productivity within the companies Figures unavailable at MTE (6) By 1918 net jobs. the end of 2007, 1,714 SMEs had been supported (relates to locally-owned SME’s offered £25,000 or more) 2002/03 to 2007/08 employment has increased from 33,611 to 37,152 representing a growth rate of 10.5% over the period and 2.0% annually. (8) Sales grew from £3.1 billion to £5.3 billion resulting in a 62.7% increase over the period and 10.2% per annum. (9) Exports grew from £889m to £1.8 billion resulting in an 106.5% increase over the period and 15.6% annually. (7) From 299 BUILDING SUSTAINABLE PROSPERITY PROGRAMME VERSION 3 Invest NI Response: In relation to the achievement of 10 Regional initiatives focusing on SME development against a target of 5 (200% success rate), Invest NI's has 5 local offices developing a plan to encourage for example export starts, developing an innovative approach or working with local stakeholders and these have been delivered on the ground by the local office personnel. This amounts to each regional office having two such initiatives rather than one in the time period. Given changing economic priorities and reacting to the needs of clients it would sometimes be necessary to do this. 300 BUILDING SUSTAINABLE PROSPERITY PROGRAMME VERSION 3 Summary of Achievements V Targets for Measure 1.1(c) Original Indicator Output 26 integrated plans 5 Regional Action plans Result 10strategic alliances formed 10 regional initiatives focusing on SME development Impact Positive change in business base Positive change in business performance Position at Mid Term Evaluation Revised Indicators Final Position 26 2 5 regional action plans 5 0 0 10 regional initiatives focusing on SME development 10 Not available Positive change in business base Positive change in business performance No target (10) No target (10) Under this measure, there were indicators as opposed to targets to aim towards, such as a positive change in business base and also a positive change in business performance. The objectives of the measure were documented as continuing to be successful on the whole although this impact could not be evaluated in terms of figures. (10) Invest NI Response: In relation to the achievement of 10 Regional initiatives focusing on SME development against a target of 5 (200% success rate), Invest NI's has 5 local offices developing a plan to encourage for example export starts, developing an innovative approach or working with local stakeholders and these have been delivered on the ground by the local office personnel. This amounts to each regional office having two such initiatives rather than one in the time period. Given changing economic priorities and reacting to the needs of clients it would sometimes be necessary to do this. 301 BUILDING SUSTAINABLE PROSPERITY PROGRAMME VERSION 3 Summary of Achievements V Targets for Measure 1.2 Original Indicator Position at Mid Term Evaluation Revised Indicators Final Position Output No of R&D projects supported 220 142 No of Environmental & Innovative audits Initiated 180 No of graduate placements 256 47 286 R&D projects supported (broken down by type of research orientation 871 (11) 350 Environmental & Innovative audits Initiated 393 150 graduate placements 204 Result 80% of supported projects completing successfully 87% 80% of supported projects completing successfully 86% 90% of businesses undertake an audit 86% 90% of businesses undertake an audit 100% Not reported on as ‘result’ 130 projects involving graduates 161 64% 80% of graduates successfully completing placement No of projects involving graduates 256 80% of graduates successfully completing placement 302 95% BUILDING SUSTAINABLE PROSPERITY PROGRAMME VERSION 3 Impact 15% increase in Business Expenditure on R&D 45% 15% increase in Business Expenditure on R&D 50% increase in expenditure on R&D from £123m in 1999 to £185m in 2007. 60% of businesses adopt audit recommendations Not available 60% of businesses adopt audit recommendations 100% 60% of graduates retained by host firm 62% 60% of graduates retained by host Not available (11) The 2001 AIR highlighted that there had been 98 R& D projects supported against a target of 220 for the programme. This target was surpassed by the end of 2004, with 263 projects supported. This figure reached 715 by the end of 2006 and 871 by the end of 2007 with approximately 86% of supported projects successfully completed against a target of 80%. Invest NI Response: Demand for programmes under this measure was much higher than initial reviews suggested. 303 BUILDING SUSTAINABLE PROSPERITY PROGRAMME VERSION 3 Summary of Achievements V Targets for Measure 1.3(a) Original Indicator Output 15 marketing initiatives supported per annum across key markets Result Increase acceptability of Northern Ireland as a holiday destination from 2000 baseline Increased intention to visit Northern Ireland from 2000 baseline Impact Over the period of the programme to generate on an additional £100m Over the period of the programme to create 1300 additional jobs in tourism Position at Mid Term Evaluation Revised Indicators Final Position 22.5 15 marketing initiatives supported per annum across key markets 23 Increased acceptability Increase visitor numbers to Northern Ireland as a holiday destination by 7% annually by end 2006 (from 2000 baseline) (2007 - prelim forecast 174000 increase from 2000 baseline – 56.9% increase and 6.6% on year increase) (12) not available Over the period of the programme to create 1400 additional jobs in tourism 5920 (13) not available Increase visitor spend by 5% annually by end 2006 (from 2000 baseline) Preliminary forecast of 115,000 increase from 2000 baseline representing a 45.8% increase and 5.5% year on year increase Statistics on intentions but not reported relative to baseline (12,13) Over the period of the programme Northern Ireland has experienced significant growth in tourism, both in terms of visitor numbers and revenue generation. This growth is a direct result of the investments the Northern Ireland Tourist Board has made in developing the tourism market and enhancing Northern Ireland’s tourism product which has been co-financed by the ERDF through the BSP Programme. 304 BUILDING SUSTAINABLE PROSPERITY PROGRAMME VERSION 3 Summary of Achievements V Targets for Measure 1.3(b) Original Indicator Output Accommodation projects assisted Position at Mid Term Evaluation 28 Revised Indicators Final Position 50 Accommodation projects assisted 47 Assisted cultural and natural resource programmes 0 visitor attractions assisted to enhanced or re-themed Result 750 new bedrooms 8 10 visitor attractions enhanced or rethemed 15 489 750 new bedrooms 664 Premises with new bedrooms to show an occupancy rate higher than relevant regional and sectoral averages Not available (reported on as ‘Impact’) !0% increase in visitor numbers to the attractions by the end of the programme (from 2000 baseline) 5 programmes developed 0 10 visitor attractions enhances/rethemed Not reported on as ‘result’ increase visitor numbers to enhanced or re-themed attractions Increases ranging from 2% to 59% at 8 attractions Visitor numbers to those attractions assisted by the programme increased on average by 78% (based on figures provided by those attractions that made returns to NITB between 2000 and 2007) Overall across all visitor attractions in Northern Ireland numbers have increased by 23% between 2000 and 2007 305 BUILDING SUSTAINABLE PROSPERITY PROGRAMME VERSION 3 Summary of Achievements V Targets for Measure 1.3(b) (contd) Impact 350 direct jobs created by the end of the programme 336 350 net jobs created by the end of the programme 428 50 (direct and indirect) jobs created by the end of programme not available Increase room occupancy by 2% above the regional average 2 years after opening Jobs sustained in enhanced/rethemed attractions not available Currently difficult to assess. It is questioned whether this is a reasonable measure in that increased volume will normally lead to a reduction in occupancy. Of the 15 enhanced – 14 are still in existence (93%) 70% of visitor attractions still existence by the end of programme 306 BUILDING SUSTAINABLE PROSPERITY PROGRAMME VERSION 3 Summary of Achievements V Targets for Measure 1.4 Original Indicator Output 26 district council action plans Result List of Programmes detailing costs and implementation details, including number and types of action envisaged Impact Increase in employment levels. Position at Mid Term Evaluation Revised Indicators 26 26 district council action plans 153 List of Programmes detailing costs and implementation details, including number and types of action envisaged DN: these are the indicators reported on: New businesses created (target 150) New jobs created (target 1700) Sq ft of workspace created (target no target) Not available Increase in employment levels. Number of new business formations as a result of council participation not available Number of new business formations as a result of council participation Improved co-ordination of local economic development actions at sub-regional and local level. not available Improved co-ordination of local economic development actions at sub-regional and local level. DN: these are the indicators reported on: New businesses still in existence at end of programme (target 120) Jobs still in existence at end of prog (target 1360) Evidence of improved infrastructure and co-ordination at local council level (14,15,16,17,18) Final Position 26 926 (14) 4072 (15) 250,000sq ft (16) 926 (17) 4072 (18) Post project evaluation on 1.4 completed and endorses this impact The explanation for the variance is that when the original targets were set they did not envisage or in incorporate the Business Start Programme. 307 BUILDING SUSTAINABLE PROSPERITY PROGRAMME VERSION 3 Summary of Achievements V Targets for Measure 1.5 Original Indicator Position at Mid Term Evaluation Output Outputs are based upon progressing NI companies along the Connectivity Chain as follows: Revised Indicators Final Position Outputs are based upon progressing NI business relating to the DTI International Benchmarking Study report on ICT making business aware of the benefits of ICT 2 At least 2 programmes aimed at making business aware of the benefits of ICT 3 facilitating business access to ICT 1 At least 2 programmes aimed at facilitating business access to ICT 2 assisting business in the development of internet presence 1 1 programme aimed at assisting business in the development of e-business strategies 1 Working with business to develop websites for on-line trading Result Assist 4,600 SMEs by 2005 Not reported on 4,500 engagements with SMEs by 2005 10,224 (19) Assist 1300 SMEs by 2005 Not reported on 700 engagements with SMEs by 2005 1,251 (20) 70 engagements with SMEs by 2005 99 2175 Assist 70 SMEs by 2005 Not reported on Assist 80 SMEs by 2005 Not reported on As a result of the Awareness Programme, there was a reported total of 1,122 SMES assisted by the end of 2001. This represented 23% of the overall measure target of 4,870. By the end of 2003, and mid term evaluation, this figure had risen to 4,449. At the end of 2007, this figure stood at unchanged at 10,224 SMEs assisted. (19) (20) The original target encouraging 700 companies to gain access to ICT was exceeded and stood at 1251. Invest NI update: Demand for ICT awareness and engagement increased slightly above expectations but considering the duration of the programmes and the economic and technological changes (eg. Broadband) that happened during the life 308 BUILDING SUSTAINABLE PROSPERITY PROGRAMME VERSION 3 time of the projects it is not surprising there is some differences against targets. On the whole Invest NI feel the programmes have over exceeded and that is to benefit of businesses and down to the delivery of the efficient delivery of the programmes. 309 BUILDING SUSTAINABLE PROSPERITY PROGRAMME VERSION 3 Summary of Achievements V Targets for Measure 1.5 (contd) Impact Achieve an increase in the number of bases businesses using trading ‘ecommerce’ website technology from 24% in 2000/01 to 40% by 2005 Achieve an increase in the number of recognised ‘e-business’ businesses in Northern Ireland from 10% in 2000/01 to 15% by 2005 NB. These impacts are based on the cumulative effect of all the outputs. Not available Not available Impacts will be accessed by measurement of the progress of NI business by the DTI International Benchmarking Study report on ICT. The key targets are: Achieve an increase in the measurement of Northern Ireland 28% in 2004 DTI based businesses towards sophistication in International ICT the use of ICTs from 15% to 30% Benchmarking Report NB. These impacts are based on the cumulative effect of all the outputs. 310 BUILDING SUSTAINABLE PROSPERITY PROGRAMME VERSION 3 Summary of Achievements V Targets for Measure 1.6(a) Original Indicator Position at Mid Term Evaluation Revised Indicators Final Position Output 4 by-pass schemes Result 14km of new carriageway 2 6.2km 3 by-pass schemes 1 Through-pass scheme 1 Link Road 3 Complete Not funded through this measure 1 Bridge strengthening scheme Complete 12.1 km of new carriageway 12.4km Strengthen structure to increase capacity Complete to carry the maximum 40 tonne HGV vehicles Repainting and resurfacing the bridge Impact Reduced peak journey times by an Not available average of 35% for each scheme measured through surveys held in advance of the project and after completion of the project. Reduced peak journey times by an Newtownstewart average of 35%. bypass = 47% Limavady bypass = 32% Comber bypass = 44.5% Bridge capable of extra carrying capacity Bridge now has to meet future demand, which will see the capacity to deal numbers of HGVs increasing from 2700 with 40 tonne per day to 3200 per day over the next 10 HGVs and the years. Painting will provide required expected future protection for next 20 years. demand 311 BUILDING SUSTAINABLE PROSPERITY PROGRAMME VERSION 3 Summary of Achievements V Targets for Measure 1.6(b) Original Indicator Position at Mid Term Evaluation Revised Indicators Final Position Output Urban/rural public transport infrasctucture projects including Ballymena Bus and Rail Station and other projects serving rural Communities. 4 Introduction of passenger Information/Long Line Public Address system and Global positioning Satellite system Not reported on 1 new rural bus station 3 Urban bus depot projects Introduction of Customers Information, replacement of management systems and 2 other transport related schemes 1 3 Project withdrawn Passenger information system/longline public address system – project withdrawn Refurbishment of Falls Rd running repair shop complete Replacement of the mechanical and electrical system at the Short Strand bus depot 312 BUILDING SUSTAINABLE PROSPERITY PROGRAMME VERSION 3 Summary of Achievements V Targets for Measure 1.6(b) (contd) Result New urban/rural bus and rail projects 0 and enhanced services in isolated communities. Increased patronage on bus system in key transport corridors, reduced journey times and improved reliability Innovative schemes to complement high-level strategies to interface with RTS and the introduction of the integrated ticketing scheme New passenger and staff facilities at 1 rural bus station Compliance with H&S standards and upgrade of 3 urban bus depots 4 innovative schemes to complement high level management strategies Complete Complete Translink accounting system complete 0 Complete (reported on original indicator completed 2006) Impact Improvement in accessibility, social Not available inclusion and more sustainable movement of people. Improvement in accessibility, social Compliance with inclusion and more sustainable movement DDA. The of people. purchase of the new trains More efficient movement of people and provides a more improved urban transport systems. sustainable movement of people by Enhance and modernise the operation of facilitating the integrated transport across Northern improved Ireland timetabling of services. More efficient movement of people Not available and improved urban transport systems. Enhance and modernise the operation of integrated transport across Northern Ireland Complete 313 BUILDING SUSTAINABLE PROSPERITY PROGRAMME VERSION 3 Summary of Achievements V Targets for Measure 1.7 Original Indicator Output Percentage of exchanges capable of providing enhanced telecommunications services, rising from 10% to 70% Result The percentage of NI geographical area with access to advanced telecommunications rising from 11% to 60%. Impact An increase in the use of enhanced telecommunications facilities by business. Jobs created as a by-product of the measure Position at Mid Term Evaluation Revised Indicators Final Position 5% Percentage of exchanges capable of 100% providing enhanced telecommunications services, rising from 10% baseline in 2000 to 100%by end December 2005. 40% The percentage of NI geographical area with access to advanced telecommunications rising from 11% baseline in 2000, to 100% by end December 2005. 100% Not available 10 new telecoms-intensive firms to be established 13 Not available An increase in the use of enhanced telecommunications, in particular basic broadband services, from a baseline figure of 1% in 2000 rising to 12% of household take up, and 20% of business take up by the end of 2005 49% NI households. 76% have internet access 65% of business use broadband (December 2007 survey) 314 BUILDING SUSTAINABLE PROSPERITY PROGRAMME VERSION 3 Summary of Achievements V Targets for Measure 1.8(a) Original Indicator Output KM of gas pipeline laid: North/West – 116km South/North – 140km Position at Mid Term Evaluation KM of gas pipeline laid: North/West – 116km 0 0 Increase level of physical electricity interconnection between NIE and ESB systems Result Numbers of customers connected: North/West – 9,000 South/North – 4,500 0 Increased security of supply 0 Revised Indicators Final Position 116km (South/North not funded through this measure) 0 0 Numbers of customers connected: North/West – 9,000 1,949(includes power station) Reductions in CO2: North/West – 16,800t 499,671 tonnes CO2 (includes power station) Increased opportunity for crossborder trading of electricity Impact Reductions in CO2: North/West – 16,800t South/North – 9,600t Not available Not available Fewer interruptions to power supply Not available Evolution of larger electricity market leading to reduced prices Not available 315 BUILDING SUSTAINABLE PROSPERITY PROGRAMME VERSION 3 Summary of Achievements V Targets for Measure 1.8(b) Original Indicator Output Information requests from prospective projects Result Projects supported Impact 20% reduction in number of tonnes of CO2 consumed per project 10% reduction in energy cost and consumption in assisted projects Position at Mid Term Evaluation Revised Indicators Final Position 7 (Demonstration projects) 20 demonstration projects supported over the lifetime of the programme 18 22 (Information requests per project) At least 150 information packs issued in response to requests over the lifetime of the programme 200 Not available Specific positive environmental impacts directly attributable to the projects including 1,200 tonnes of CO2 emissions savings over the lifetime of the programme End of Prog (21) Some of the projects had difficulty measuring energy or fuel usage, and in particular reductions in CO2. Some the technologies involved were developing or not suited to Northern Ireland weather, and in cases broke down. Therefore some figures are not available. From the figures measured and supplied, there were a total of £9,500 savings in energy costs and 2.3 million litres reduction in CO2 emissions. (21) 316 BUILDING SUSTAINABLE PROSPERITY PROGRAMME VERSION 3 Summary of Achievements V Targets for Measure 2.5 Original Indicator Position at Mid Term Evaluation Output All secondary schools (240) to have 0 new PCs at a ratio of at least 1 PC to 9 pupils and local area networks installed and to be linked to a wide area network and system integrator providing a managed ICT service at a cost of £115.2m. All successful ESF funded nongovernment projects to have an adequate level of infrastructural support as is required to make the project viable Result All schools to be utilising the managed service providing curricular resources and internet access with broadband connectivity Revised Indicators Final Position All secondary schools (233) and special 277 schools (48) to have new PCs at a ratio of at least 1 PC to 9 pupils and local area networks installed and to be linked to a wide area network and system integrator providing a managed ICT service at a cost of £115.2m. ESF All successful ESF funded nongovernment projects to have an adequate level of infrastructural support as is required to make the project viable Met Upgrading of school accommodation to enable use of ICT equipment and managed service 0 All schools to be utilising the managed service providing curricular resources and internet access with broadband connectivity Post Primary and special schools using the managed service 317 277 Met BUILDING SUSTAINABLE PROSPERITY PROGRAMME VERSION 3 Summary of Achievements V Targets for Measure 2.5 (contd) Impact All pupils (155,000) will experience the use of ICT across all areas of the curriculum, including a range of applications and media and will spend, on average, 10% of the weekly timetable using ICT facilities to support learning across the curriculum 0 All pupils (155,000) will experience the use of ICT across all areas of the curriculum, including a range of applications and media and will spend, on average, 10% of the weekly timetable using ICT facilities to support learning across the curriculum Pupils will enjoy the benefits of a modern ICT enriched curriculum taught in highspecification facilities. Electrical infrastructure will ebale the full use of ICT equipment and managed service provided by C2k programme. 318 All pupils using ICT across all areas of the curriculum (161,000 pupils). Over 10% of weekly timetable using ICT supported learning Met BUILDING SUSTAINABLE PROSPERITY PROGRAMME VERSION 3 Summary of Achievements V Targets for Measure 3.1 Original Indicator Position at Mid-Term Evaluation Revised Indicators Final Position Output Number of schemes funded – 20 Initial progress was slow on BSP 3.1 with no spend Number of jobs/training enquiries/referrals incurred by the date of the mid term evaluation. Number of organizations supported – However retrospective 40 projects were identified and funded by the end of 2004. Number of projects assisted Number of projects assisted - 40 Result Square metres of No spend or results by the commercial/industrial community date of mid term evaluation space enhanced but in retrospective projects completed by 2004 a total of 233,638 sq metres were enhanced Private sector financial leverage None Increase in gross employment 319 None Reduction in number of long term unemployed, women, 16-17 year olds, disabled persons and single parents registering as unemployed. Increased numbers of people, particularly women, single parents, disabled, referred for employment/training. Increase in gross employment opportunities Increase of 76% from 2000-04 7 projects comprising 5 Laganside and 2 Jobs and Benefits Schemes covering 23 Jobs and Benefits offices administrative barriers meant larger projects were targeted instead of smaller more cumbersome ones. 27.6% reduction from 2000-04 8% increase from 2000-04 27.7%increase from 2000-2004 BUILDING SUSTAINABLE PROSPERITY PROGRAMME VERSION 3 Summary of Achievements V Targets for Measure 3.1 (cont’d) Impact Increase in Net employment. Reduction in unemployment Reduction in crime and vandalism Increase in commercial space available Evidence of positive impact attributable to schemes eg increase in visitor numbers and increase in residents satisfaction levels Initial progress was slow Increase in Net employment. on BSP 3.1 with no spend incurred by the date of the mid term evaluation Reduction in unemployment 320 Not available in this format 24.3% reduction from 2000-04- all projects completed by the end of 2004 BUILDING SUSTAINABLE PROSPERITY PROGRAMME VERSION 3 Summary of Achievements V Targets for Measure 3.2 Original Indicator Output Reviews and Assessments completed Position at Mid Term Evaluation 258 Revised Indicators 2 Reviews and Assessments of existing services completed Not reported New common recording Support for rationalization of recording system Support given to 2 organisations to provide and promote a common statistical system Support given to 4 organisations to provide advice and information Result Develop strategy 80% of IAS and CABs operating a 20% common statistical system Not reported Increase by 50 hours per week provision of advice and information in areas of greatest need Not reported 7 post project evaluations completed with recommendations about future delivery of service. 2 7 Implementation of the recommendations Some from the reviews/assessments recommendations implemented. Work to be taken forward within DSD’s Advice 25 IAS and CAB operating a common strategy. statistical system All independent CAB affiliated advice organizations now using 1 of 2 Increase of 40 hours per week in the accredited systems. provision of advice and information in 312 in year 2007 areas of greatest need with total of 3046 since start of the programme 90% of DSD funding committed on Not reported basis of strategy Effective comparisons and monitoring possible Final Position 321 BUILDING SUSTAINABLE PROSPERITY PROGRAMME VERSION 3 Summary of Achievements V Targets for Measure 3.2 (contd) Impact Improved provision Improved awareness Cohesive and cost effective provision of services Not available Improved utilization of available funds Improved service and distribution of funding Better informed community and improved access to services 322 3 pilot schemes undertaken 3 Evidence of improved accountability for, and delivery of, advice services Post project evaluations show evidence of more integrated delivery of advice services BUILDING SUSTAINABLE PROSPERITY PROGRAMME VERSION 3 Summary of Achievements V Targets for Measure 3.3 Original Indicator Output No of organizations assisted – 40 Result Increase support hours delivered by 2500 hours Position at Mid Term Evaluation Revised Indicators 177 Support given to 35 organisations 17 assisted up to March 2007 508 2000 direct support hours delivered 20,500 to March 2007 100 consultations with statutory agencies Impact Enhanced support structures and increased sustainability Final Position Not available 323 107 consultations with Councils, Housing Executive, H&SSTs. Education Boards and Government Depts Evidence of sustainability in the community organisations assisted In addition to the subregional support Groups gaining sustainable funding from the Neighbourhood Renewal Programme and Regional infrastructure funding. 17 Groups have secured sustainable mainstream funding form the Community Investment Fund. Evidence of improved interagency working and policy development in areas of need Post project evaluations show evidence of increased voluntary / statutory sector partnerships working BUILDING SUSTAINABLE PROSPERITY PROGRAMME VERSION 3 Summary of Achievements V Targets for Measure 3.4 Original Indicator Output 48 Capital schemes across all the ELBs in controlled, maintained, integrated and Irish medium sectors Result 1768 additional places made available for children in their immediate pre-school year, especially the socially disadvantaged and 4 year olds. Position at Mid Term Evaluation Revised Indicators Final Position 36 85 Capital schemes across all the ELBs (Revised to 51 – original target was based on additional expenditure in the performance reserve) 1400 2,200 additional places made available for 1928 full time and children in their immediate pre-school part time places year, especially the socially disadvantaged and 4 year olds. Consequential opportunities for the parents of the above children to take up employment, education or training 0 Up to 136 additional posts for teachers and classroom assistants created. 130 Up to 220 additional posts for teachers and classroom assistants created. (Revised to 130 – original target was based on additional expenditure in the performance reserve) 324 55 51 Nursery units complete at end 2004) 62 teachers and 84 classroom assistants BUILDING SUSTAINABLE PROSPERITY PROGRAMME VERSION 3 Summary of Achievements V Targets for Measure 3.4 (contd) Impact Taken together with other initiatives, this measure will enable all parents who wish to have access to a funded place for their children in their immediate pre-school year. Research shows that children who have had pre-school education are better prepared to take up the advantages of education and hence their prospects of employment are increased. Pre-school education can be particularly beneficial for the socially disadvantaged. Not available Taken together with other initiatives, this Data not measure will enable all parents who wish available to have access to a funded place for their children in their immediate pre-school year. Research shows that children who have had pre-school education are better prepared to take up the advantages of education and hence their prospects of employment are increased. Pre-school education can be particularly beneficial for the socially disadvantaged. 325 BUILDING SUSTAINABLE PROSPERITY PROGRAMME VERSION 3 Summary of Achievements V Targets for Measure 5.1 Original Indicator Output Water Treatment schemes Sewage Treatment schemes Environmental Quality Research Projects Contaminated land recovery project Waste Management Projects Biodiversity conservation projects Scheduled monument conservation projects Access / tourism/ environmental education projects Projects to entail partnership Project per county Result Average 30% increase in capacity and Water quality improvement (variable up to 100%) Average 275% increase in capacity, with effluent quality improvement (variable up to 100%) Position at Mid Term Evaluation Revised Indicators 2 2 0 3 Water Treatment schemes 2 Sewage Treatment schemes Environmental Quality Research Projects –1 Biodiversity conservation projects - 10 Access / tourism projects - 4 Waste Management Projects – 5 1 Air Quality project for the 26 District Councils 0 0 326 Final Position 4 2 0 4 1 4 1 Built Heritage conservation projects – 2 1 Waste Management project for the 26 District Councils 1 Average 30% increase in capacity 30% Average 275% increase in capacity 275% Publication and appropriate dissemination of research conclusions - The availability of at least 6 pieces of research 7505 - Quercus Project, 7734 – Direct BUILDING SUSTAINABLE PROSPERITY PROGRAMME VERSION 3 information to environmentalists and scientists by the end of the Programme. 327 measurements of aeration using noble gas tracers in the River Lagan NI, Water & Environment Journal Vol 21 issue 3 Sept 07 7501 – 1. QUERCUS Report; Conservation Genetics of Northern Ireland seagrass beds 0406; 2. Peer reviewed scientific paper in Conservation Genetics,accepted 23 April 2007. 7784 – 1.QUERCUS Project; Molecular basis for a Species Action Plan for the Red Alga Ahnfeltiopsis sp.; 2. Draft scientific paper currently being circulated for publication in BUILDING SUSTAINABLE PROSPERITY PROGRAMME VERSION 3 peer reviewed scientific publication. Production of recycling, research and waste information 4959 – monitoring data in relation to fridges recycled and glass collected. 7473 – 3 to 4 items. 7938 – Drama production for children. 30793 – indicator met. Capital infrastructure projects to enable District Councils to measure, monitor and improve air quality The scheme has enabled improvement in ambient air quality through the identification of areas subject to poor air quality and the development of plans to reduce emissions from domestic industrial and road traffic sources. Staff resource projects to enable District Councils in the carrying out of all appropriate air quality activities Development of 2 databases – industrial heritage sites and stone masonry buildings. 328 1 database BUILDING SUSTAINABLE PROSPERITY PROGRAMME VERSION 3 developed Capital infrastructure projects to support the recovery of recyclable waste Staff resource projects to support waste management activities 329 28 Capital projects were approved. Examples include; the provision of Recycling Bins, Civic Authority Site provision, Collection Vehicles, and various smaller projects, eg.Bin Tagging/ Composters. 25 councils claimed for Revenue Projects. For example; expenditure incurred in support of Regional Waste Groups, Promotional and Educational Awareness Activities, Site Leasing, Recycling Bin delivery and Waste Collection/ Processing BUILDING SUSTAINABLE PROSPERITY PROGRAMME VERSION 3 Impact Improved understanding of sustainable environmental management Correction of an environmental problem Improved environmental management Improved environmental management Correction of environmental problems through conserving monuments at risk Developing environmental awareness and understanding Community involvement Not available Good geographical spread of support 330 Water quality improvement (variable up to 100%) Water quality complies with EC directive standards. Effluent quality improvement (variable up to 100%) Effluent quality complies with EC directive standards. Improved and enhanced access to the natural heritage. Enhanced educational understanding of the Mourne environment and production and distribution of interpretative publications. Evidence of enhanced environmental awareness 4959 – large quantity of fridges recycled and CFC gases captured. 7473 – research of assistance to academics. 7838 – To encourage the appreciation of sustainable environment BUILDING SUSTAINABLE PROSPERITY PROGRAMME VERSION 3 principles by children across NI. 30793 – Recycling rates have increased from 18.2% in 2004/05 to 28.8% as a result of initiatives by District Councils which received BSP funding. Contribute towards the objectives of the Air Quality Strategy 331 The scheme has assisted Councils to assess local air quality and to submit the various reports that are required under air quality policy framework. In addition it is more likely that air quality objectives and EC limit values will be achieved by the relevant dates. BUILDING SUSTAINABLE PROSPERITY PROGRAMME VERSION 3 Seminars Enhanced information leading to improved conducted in Belfast and management of the built heritage Edinburgh. Book on stone identification and all Ireland geological map produced. Contribute towards the objectives of the NI Waste Management Strategy 332 Recycling and waste information produced Municipal Waste Management Reports for 2005/06 and 2006/07, and the NILAS Reports for 2005/06 and 2006/07. All viewable on the EHS Website. The District Councils’ contribution towards the objectives of the NI Waste Management Strategy is ongoing. Statistics indicate positive BUILDING SUSTAINABLE PROSPERITY PROGRAMME VERSION 3 reduction in waste to landfill and increased levels of recycling. Recycling rates has increased from 18.2% in 2004/05 to 28.8 % in 2007/08 as a result of initiatives by District Councils which received BSP funding 333 BUILDING SUSTAINABLE PROSPERITY PROGRAMME VERSION 3 Summary of Achievements V Targets for Measure 6.1(a) Original Indicator Output 30 Technical Assistance projects to be funded Result 75% of recommendations of studies to be accepted Position at Mid Term Evaluation Revised Indicators Final Position 7 30 Technical Assistance projects to be funded 14 projects funded 0 75% of recommendations of studies to be accepted Part funding for 4 studies under the NICSF (1) evaluation of Information Society activity (2) research on use of Development Path Analysis (3) impact of EU programmes on Section 75 groups (4) good practice in delivery of ESF – financed operations in BSP and Peace II programmes. All were reported to and accepted by the CSF Monitoring Committee 334 BUILDING SUSTAINABLE PROSPERITY PROGRAMME VERSION 3 Impact 50% of Technical Assistance studies judged to have improved implementation of CSF or OP Not available 50% of Technical Assistance studies judged to have improved implementation of CSF or OP 335 No survey of the effects of the studies on implementation has yet been carried out BUILDING SUSTAINABLE PROSPERITY PROGRAMME VERSION 3 Summary of Achievements V Targets for Measure 6.1(b) Original Indicator Output Quarterly report on media coverage Number of publicity and information enquiries Number of website visits Number of promotional events held Result Access to information on the Programme and an understanding of the benefits to the region Impact Increased awareness of the EU support and the overall aim of funding Position at Mid Term Evaluation Not available 56 Revised Indicators Quarterly report on media coverage Number of publicity and information enquiries Number of website visits Number of promotional events held 13775 Not reported on Final Position Visits to the Managing Authority website rose from 1,125 in 2001 to a maximum of 30,343 in 2005. total number of visits in the period 2001 – 2007 was 118,527 Not available Access to information on the Programme and an understanding of the benefits to the region Not available Increased awareness of the EU support Annual and the overall aim of funding Implementation Reports included details of information and publicity. Specific questions were included in the Northern Ireland Omnibus survey to measure public awareness of EU support and benefits 336 BUILDING SUSTAINABLE PROSPERITY PROGRAMME VERSION 3 ANNEX 5 List of project applications by Measure Annex 5 - All BSP ERDF Projects (includ All BSP ERDF Projects (including DETI lower level projects) 337 BUILDING SUSTAINABLE PROSPERITY PROGRAMME VERSION 3 ANNEX 6 MAJOR PROJECT – GAS PIPELINE Background Natural gas has been available in Northern Ireland since 1996. It was initially used to fuel the electricity industry but it has also been made available to industrial, commercial and domestic consumers in the Greater Belfast area. Throughout the late 1990s there was a continuous lobby for natural gas to be available to other areas of Northern Ireland and in 1999 the gas regulator invited applications for new gas licences in an attempt to have gas made more widely available. Following their internal studies into the feasibility of the Northern Ireland gas market, Bord Gais Eireanne (BGE), the Republic of Ireland Gas Company submitted proposals for a two phase development of a transmission gas pipeline which will take gas to the North West of Northern Ireland and also to construct a South North pipeline which will connect the Northern Ireland and Republic of Ireland gas networks. This was known as the Northern Ireland Gas Pipeline project. In 1999 the Northern Ireland Executive in its Programme for Government identified “securing a competitive economy” as one of its five key priorities. The creation of an appropriate energy infrastructure was acknowledged as a vital element in achieving this. In September 2001 the Executive approved the Northern Ireland Gas Pipeline project. Aims and Objectives The key deliverables from this project were: • create an interconnected European gas market providing an alternative source of gas supply to Northern Ireland thereby influencing the resilience of the gas network; • enhance opportunities for inward investment, especially in areas of high unemployment 338 BUILDING SUSTAINABLE PROSPERITY PROGRAMME VERSION 3 • make natural gas available to the main towns along the route of the pipeline, potentially supplying a further 20% of Northern Ireland’s population. • Enable advancement of a major power station project, with consequent benefit in terms of potential new support businesses and employment opportunities. • Introduce competition through fuel choice and price, and via the power station project, in electricity prices; • Extend the use of a relatively clean fuel with attendant health and environmental benefits; • Provide security of supply for the Northern Ireland gas network through its links with the Republic of Ireland system. The development of the gas industry outside the Greater Belfast area and the improvement of the security of supply situation for Northern Ireland were the main objectives for this project. The construction of the pipelines was intended to facilitate the development of gas distribution networks in the towns along the pipelines route and the South/North pipeline would remove the current dependence on a single undersea pipeline from Scotland to Northern Ireland. The North West pipeline also had the subsidiary objective of providing gas to the new Combined Cycle Gas Turbine power station at Coolkeeragh outside Londonderry and improving business competitiveness in a peripheral area. The Economic Growth and Competitiveness Priority of the Building Sustainable Prosperity Programme clearly states that the general policies regulating the NI approach to energy are security and diversity of supply; progressive liberalisation and increased competition in the pursuit of lower prices. One of the purposes of Measure 1.8 is the development of the natural gas industry outside the Greater Belfast area and in particular to the South East and North/North West of Northern Ireland. The construction of these gas pipelines will facilitate the achievement of these objectives and contribute to the reduction of the structural weaknesses in Northern Ireland created by regional isolation, peripherality and diseconomies of small market size. 339 BUILDING SUSTAINABLE PROSPERITY PROGRAMME VERSION 3 In September 2002 the Department of Enterprise Trade and Investment submitted a major project application to the European Commission for this project. An Environmental Impact Assessment was completed by Bord Gais which formed an integral part of the planning application. The Assessment was also copied to the Commission. State Aid approval was granted in July 2002. In February 2004 the European Commission informed the Managing Authority that there were issues which required clarification before they could proceed to examine the project. As a result the Managing Authority submitted a revised application in April and June 2004. The Commission responded by indicating that it had decided to request that the European Investment Bank (EIB) undertake an in-depth evaluation of the project. A list of additional information requested by the EIB was forwarded in September 2004 and a telephone conference held in October 2004 after which a further tranche of information was supplied in November 2004. The issue was discussed extensively at the Annual Review meeting on 2 December 2004 when the Managing Authority outlined the potential implications for the N+2 expenditure targets. However it was not possible to reach a decision before the end of 2004 due to queries arising about the evaluation of the environmental impact of the project and the calculation of the financing gap and the rate of assistance. Due to difficulties in completing the planning process and obtaining Natura 2000 certificates, the Managing Authority withdrew the South/North element of the project as it was placing the funding of the entire project at risk. Accordingly the Managing Authority wrote to the European Commission on 21 April 2005 to request that for technical reasons the request for approval of this major project application was taken forward only on the basis of the North West pipeline. 340 BUILDING SUSTAINABLE PROSPERITY PROGRAMME VERSION 3 Following this letter a Commission Decision C(2005) 2700 was issued on 7 June 2005 which fixed the ERDF contribution at €16,240,000 corresponding to 17.12% of the total eligible costs of the North West pipeline from Carrickfergus to Londonderry, which was €94,700,000. On completion of the project €16.240m ERDF was claimed. The balance was funded by national payments. The first industrial customer, Michelin at Ballymena, was connected to gas from the North-West pipeline in December 2005, and the first domestic consumer connected at Strathfoyle outside Londonderry in March 2006. At the end of 2008 1,949 customers were connected to the pipeline. This figure includes the power station at Coolkeeragh. Full details of achievement of the objectives can be found in Chapter 5. MAJOR PROJECT – CLASSROOM 2000 (C2K) Background The European Employment Strategy has recognised the very significant role that Information and Communications Technology (ICT) plays in terms of job creation. It was essential therefore that those about to enter the labour force should be equipped with the appropriate knowledge and skills for the emerging information age. Within Northern Ireland’s secondary education system a significant level of infrastructure support for ICT teaching and learning at the secondary level was needed. Through the provision of this ICT infrastructure of high quality resources, those in secondary level education preparing to enter the labour market would have the opportunity to develop the skills to use ICT and the effectiveness and standards of learning would be improved. Aims and objectives The aim of C2k was to provide, for Northern Ireland’s schools, a world class Learning Technology service and optimise its use throughout the Community. 341 BUILDING SUSTAINABLE PROSPERITY PROGRAMME VERSION 3 It was a regional scheme operating under the auspices of the Education Technology Strategy Management Group of the Department of Education. It was funded by the Department, through the Western Education and Library Board, as part of its Education Technology Strategy, to deliver to schools high quality, sustainable infrastructure, connectivity and resources. The Strategy set out to ensure that young people were well prepared for their life and work in the information economy of the 21st century, and that ICT was used to raise educational standards. The principal objective of the Employment Priority was to tackle specific labour market needs of those in education who are about to enter the labour market, for those who are unemployed and those who are in employment. At the time of approval of the C2k project, the Department of Education (DE) and the Managing Authority considered whether this project should be considered a ‘major project’ within the provisions of Article 25 of EC Regulation 1260/1999 and subjected to the particular requirements that would follow. The view at the time was that the project did not fulfil the criteria set out in Article 25. During a visit by DG REGIO auditors in April 2006 questions were raised concerning the expenditure certified under C2K. The auditors took the view that the project should have been subject to Major Project Approval by the European Commission. Following discussion, in order to safeguard the eligibility of the expenditure from challenge, DE drew up a major project application which the Managing Authority then presented to the Commission on 1 November 2006. DE subsequently provided further information and clarification to the Commission. On 21 December 2006 the Commission adopted Decision No. C(2006)7159, approving a contribution from ERDF to C2K of €42m, 50% of the total eligible expenditure of €84m. On completion of the project €39,753,711 ERDF was claimed with total expenditure of €79,507,423. 342 BUILDING SUSTAINABLE PROSPERITY PROGRAMME VERSION 3 During 2007, the Managing Authority, the ERDF Paying Authority and the Department of Education (DE) worked together to complete an exercise to reexamine the expenditure which had already been declared for this project and re-submit only eligible expenditure that ensured compliance with the Commission Decision. The C2k project has delivered a world-class ICT-based learning environment which has been internationally recognised and has been awarded full accreditation by BECTA (British Educational Communications and Technology Agency), for the quality of its schools’ internet service provision. The BECTA Internet Service Provider (ISP) accreditation means that all pupils and teachers in the Province's 284 post primary and special schools can be assured that the internet services provided by C2k meet the required guidelines. C2k’s internet service has been constantly monitored to ensure that children and teachers in Northern Ireland are protected against offensive emails and web site content. The C2k Integration Director, said, “The safety of the C2k online user community is paramount for C2k and our managed service provider HP. We employ the most up-to-date online security technology to protect both our users and the integrity of the online service. Schools have a statutory responsibility for child safety and C2k’s BECTA ISP accreditation can assure schools that the Northern Ireland schools’ internet service is one of the safest in the world.” C2k not only successfully met their entire accreditation requirement, but exceeded them in 75% of the tests, such as email and web filtering and user support. Full details of the achievement of measure targets can be found in Chapter 5 of this report. 343 BUILDING SUSTAINABLE PROSPERITY PROGRAMME VERSION 3 ANNEX 7 Monitoring Committee Meeting minutes BSP Monitoring Committee Minutes 344 BUILDING SUSTAINABLE PROSPERITY PROGRAMME VERSION 3 ANNEX 8 BSP Annual Implementation Reports Below are Links to the DFP EUD website where the BSP Annual Implementation Reports are available for download. BSP Annual Implementation Report 2001 BSP Annual Implementation Report 2002 BSP Annual Implementation Report 2003 BSP Annual Implementation Report 2004 BSP Annual Implementation Report 2005 BSP AIR 2005 Annexes BSP Annual Implementation Report 2006 BSP AIR 2006 Annexes BSP Annual Implementation Report 2007 BSP AIR 2007 Information Complement 345 BUILDING SUSTAINABLE PROSPERITY PROGRAMME VERSION 3 ANNEX 9 Article 4 Guidance and checklist (original and updated) Original Guidance DFP – EU FINANCE GUIDANCE NOTE 01/2004 COMPLIANCE WITH EC REGULATION 438/2001 MANAGEMENT AND CONTROL SYSTEMS/AUDIT TRAIL MONITORING VISITS 5% INSPECTIONS Introduction This Guidance Note sets out the action that must be taken to ensure compliance with the requirements for Management and Control Systems, Audit Trail, Monitoring Visits and 5% Inspections laid down in EC Regulation 438/2001. EC Regulation 438/2001 sets out detailed rules for the implementation of EC Regulation 1260/1999. This requires Member States to take a number of measures to ensure that Community Funds are used efficiently and correctly and in accordance with the principles of sound financial management. The guidance is set out in three sections: Section 1: Management and Control Systems/Audit Trail (Articles 2, 3, 7, 8, 9) Section 2: Monitoring Visits (Article 4) Section 3: 5% Inspections (Articles 10-14) 346 BUILDING SUSTAINABLE PROSPERITY PROGRAMME VERSION 3 Plus four Annexes: 1. Sample checklist for Article 4 Monitoring visits 2. Audit testing strategy - Project selection 3. Sample Article 10 checklist 4. Article 10 - 5% inspections. Progress report 347 BUILDING SUSTAINABLE PROSPERITY PROGRAMME VERSION 3 SECTION 1: MANAGEMENT AND CONTROL SYSTEMS/AUDIT TRAIL Provision of Guidance 1. EC Regulation 438/2001 defines ‘Intermediate bodies’ as all public or private bodies or services acting under the responsibility of Managing or Paying Authorities or performing tasks on their behalf in relation to final recipients. ‘Intermediate Bodies’ include Government Departments and their agents, Intermediary Funding Bodies, Local Strategy Partnerships and District Councils. 2. In order to comply with Article 2 there must be adequate guidance for Managing and Paying Authorities and Accountable Departments/Implementing Bodies on the systems required to ensure sound financial management of the Structural Funds and to provide assurance of the correctness, regularity and eligibility of claims on Community assistance. 3. Guidance that has issued to Intermediate Bodies and which they must comply with includes the EU Structural Funds manual and related Guidance Notes issued by European Division, DFP for the BSP Programme and in the case of PEACE II and the Community Initiatives similar and related Guidance issued by SEUPB Separation of Functions and Performance 4. In order to comply with Article 3 the management and control systems must ensure that there is an adequate separation of functions within and between both the Managing and Paying Authorities and Intermediate Bodies by ensuring that: a. There is a clear separation of roles between project development, appraisal and approval. Those who develop a project, or will be responsible for its implementation, should never be solely responsible for appraising the project. 348 BUILDING SUSTAINABLE PROSPERITY PROGRAMME VERSION 3 b. Officers authorising payments to a project must be different from those who approved the grant and ideally be different from those involved in any of the earlier stages of work. c. Claims should be checked by one officer and payments authorised by another. d. Officers carrying out Article 10 Inspection work must: i. be functionally and operationally independent from those carrying out implementation and payment functions; ii. not have been part of the appraisal team for the project being inspected; iii. be separate from those carrying out routine monitoring visits under Article 4; iv. if Article 4 and Article 10 checks are subcontracted to private audit firms, there should be separate contracts made with separate principals in the subcontracting organisation; v. functions are performed in a satisfactory manner. This is outlined in the Structural Funds manual and the Article 5 Description for each programme e. Intermediate Bodies report on the performance of their tasks and must ensure that: 349 BUILDING SUSTAINABLE PROSPERITY PROGRAMME VERSION 3 i. Grant offer letters set out reporting and monitoring requirements for individual projects. ii. Each project must agree a detailed plan setting out intended outputs, results and impacts and a profile of expenditure. These plans, including on-site verification must be monitored by Intermediate Bodies. Audit Trail 5. In order to comply with Article 7 (as amended by Regulation 2355/2002) management and control systems must provide a sufficient audit trail. An audit trail is considered sufficient where it permits: • Reconciliation of the summary amounts certified to the Commission with individual expenditure records and supporting documents (see paragraph 8 below) held at the various administrative levels and by final beneficiaries including, where the latter are not the final recipients of funding, the bodies or firms carrying out operations; and • Verification of the allocation and the transfers of the available Commission and national funds. 6. Intermediate Bodies must ensure that the following supporting documents are retained by them for each of the projects being supported: Claim forms and supporting documentation Details of expenditure withheld or clawed back Methods of allocating expenditure between EU Funded projects and other projects Technical specifications and financial plan of the project Progress reports 350 BUILDING SUSTAINABLE PROSPERITY PROGRAMME VERSION 3 Grant applications Offer letters Records of Article 4 visits Records of Article 10 verification inspections Final Recipients (Projects) Original documentation supporting its claims to Intermediate Body e.g. Invoices/Timesheets etc Calculations demonstrating use of methods of allocating expenditure between EU Funded operations and other operations Original documentation supporting measurement of outputs Bank records 7. Where there is more than one Intermediate Body between the final recipient and the Paying Authority, it is the responsibility of each Body to ensure that it keeps all the supporting documentation for its own accounting records. This will enable it to provide at least a summary of the expenditure on each individual operation to the Body above it. 8. All accounting records should show the date they were created, the amount of each item of expenditure, the nature of the supporting documents and the date and method of payment. 9. Documents must be held either as originals or on commonly accepted data carriers. Commonly accepted data carriers include: • Photocopies of original documents; • Microfiches of original documents; • Electronic versions of original documents on optical data carriers (such as CD-ROM, hard disk or magnetic disk); • Documents existing in electronic version only. 351 BUILDING SUSTAINABLE PROSPERITY PROGRAMME VERSION 3 10. Copied documents, invoices/microfiches etc must be certified true copies by an independent auditing body (or independent accountant). 11. Intermediate Bodies should ensure that information kept on commonly accepted data carriers are kept secure and can be relied upon for audit purposes. Where documents exist in electronic version only, the underlying computer system on which the electronic versions are held must meet accepted security standards, which ensure that, the documents held meet with national legal requirements and can be relied upon for audit purposes. Guidance on the evaluation of electronic systems is being prepared and will be issued by DFP European Division in due course as part of its EU Finance Guidance series. Irregular Payments 12. Records must be kept of the recovery of irregular payments and these must be reported to the Commission (Article 8). Guidance on dealing with irregularities is given in DFP EU Finance Guidance Note 01/2003. Certification of Expenditure 13. Certificates of statements of interim and final expenditure must be drawn up in a prescribed format (Article 9). Guidance on the drawdown of receipts from the EC is being prepared and will be issued by European Division, DFP as part of its EU Finance Guidance Series. 352 BUILDING SUSTAINABLE PROSPERITY PROGRAMME VERSION 3 SECTION 2: MONITORING VISITS – ARTICLE 4 1. Programme management and control systems must include procedures: - to verify the delivery of products and services funded by EU Funded (i.e. projects and schemes). - to verify the eligibility of expenditure (projects should provide lists of the transactions that make up a claim in enough detail to verify that what is being claimed is eligible expenditure). - to ensure compliance with the terms of Article 28 of EC Regulation 1260/99. - to ensure compliance with applicable community rules, in particular, eligibility of expenditure under assistance concerned, public procurement, state aid, protection of environment and equality of opportunity. 2. The procedures must include the review of individual operations on the spot. The records must state the results of the visits and the measures taken in respect of discrepancies. 3. All projects should be visited at least once in their lifetime by their respective Intermediate Body. Initial visits should be used to assess the level and reliability of the processes proposed. Further visits may be necessary to validate and assure Intermediate Bodies of the robustness of the processes – this will be for individual Intermediate Bodies to determine depending on the nature of the project. 4. The following information, outlines the purpose of a monitoring visit, the format such visits will take and the requirements for projects being monitored. 353 BUILDING SUSTAINABLE PROSPERITY PROGRAMME VERSION 3 Purpose of Monitoring Visits 5. The aims of the on-site monitoring visits are: • To ensure that the project conforms to the work plan and content as agreed in the application/ offer letter and is progressing as stated in the last claim • To identify possible problems as early on as possible and make suggestions for improvement measures • To identify successful elements of the project for possible use in the common publicity efforts and to share best practice • To encourage greater understanding between the Project officer and applicant on the nature of each others work The best time to monitor a project 6. Projects receiving EU assistance must be visited at least once during its lifetime. The first visit should not be too early in the start of the project as it may not be possible to form an opinion on the systems in place conversely it should not be at too late a stage that if records are poor there is insufficient time to put things right. Visits should be prioritised taking into account the projects grant allocation, progress reports and claim history. Increases in the frequency of visits will be at the discretion of the Intermediate Body and will depend on the level of financial control and/or number of discrepancies found. Projects that are complete 7. Where projects have closed, Project Officers should examine the records of the project – these have to be kept by the applicant for at least 3 years after the final payment on the programme has been received from the European Commission (current advice is to retain documents to at least 2013). 354 BUILDING SUSTAINABLE PROSPERITY PROGRAMME VERSION 3 Format of Monitoring Visits 8. The information provided on the approved application form and claims statement will form the basis for the on-site visit. In addition to checking the physical existence of the project, the visits can also be used to collect more detailed data than is available from the applicant’s claims reports, to provide a thorough check of progress against targets and to check that the applicant is providing accurate information. It should be remembered, however, that the onus is on the applicant to provide basic monitoring information and that visits should not be seen as the primary method of obtaining data that would more sensibly be included in their regular claim reports. 9. In order to have successful visits, it is vital that key members of staff involved in the project are available during the monitoring visit. Any visit should be arranged at least two weeks in advance to ensure that this is the case, and in order that the organisation has time to prepare for the visit. The date and timing must be confirmed in writing. The letter must detail the documentation and personnel that need to be available. If possible try to meet some of the recipient/beneficiaries. Sometimes the project may involve several locations or the records may be kept at a location other than the project site; in this case visit the project site. 10. The sample checklist at Annex 1 should be seen as the minimum requirement for the monitoring visit. Intermediate Bodies may however add additional items for inspection if it is deemed necessary. The checklist can, however, also be used as a guide for applicants to aid them in the preparation of the information, which will be required during the monitoring visit. 355 BUILDING SUSTAINABLE PROSPERITY PROGRAMME VERSION 3 SECTION 3: 5% INSPECTION VISITS - ARTICLE 10 5% Sample 1. A minimum of 5% of eligible expenditure of programmes and Community Initiatives must be examined (Article 10) so as to: - “verify the effectiveness of the management and control systems in place; - verify selectively on the basis of risk analysis, expenditure declarations made at the various levels concerned.” 2. The minimum 5% sample must take into account the need to examine an appropriate mix of types and sizes of projects; any risk factors; and the concentration of projects under certain Intermediate Bodies. The 5% checks must cover each year in which that expenditure takes place. The Commission has recently emphasised the importance of the sample being representative, covering all types and sizes of projects. These factors should be built into the Article 10 work Programme for EU Structural Funds projects. 3. The objective of risk analysis is to direct audit resources to high-risk areas and projects whilst also ensuring adequate coverage of lower risk areas. Risk should considered in two categories: - Inherent risk – the risk related to the nature of the activities and management structures that errors will occur; and - Control risk – the risk that internal controls will fail to prevent, detect and correct errors that do occur 4. Different approaches to risk analysis should be used depending on the sophistication of the information system available. Where detailed information on risks associated with individual operations is not available, a more global approach to risk analysis can be used. This may involve identifying risks 356 BUILDING SUSTAINABLE PROSPERITY PROGRAMME VERSION 3 associated with the main Intermediate Bodies and final recipients, the complexity of the rules and structure of a particular measure, and the overall level of Community assistance. The high-risk priorities or measures having been distinguished, sampling should then be carried out on the basis of the assessed level of risk but taking account of the requirement for the sample to be representative. 5. In more sophisticated computerised systems which have an integrated risk register, with risk factors recorded at individual operation level, it should be possible to combine the risk analysis function and the sampling of projects to ensure that the sample gives adequate consideration of risk and representivity 6. It is essential that sampling be done by or under the supervision of the designated Article 10 Team, not by the Intermediate Body. 7. In assessing risk, the track record of the applicant, the nature of the project and the amount of grant/total project value are all factors that should be taken into account. A simple risk assessment proforma is attached to this guidance note as Annex 2. The EC audit manual, which gives further guidance, on how risk can be assessed and reflected in the selection of projects to be visited, which has already been circulated to Departmental Heads of Internal Audit, should also be considered. 8. Those reviewing programmes with large numbers of projects may chose to approach risk assessment by focusing initially on the project applicant. This is acceptable as long as it does not obscure the risk posed by individual projects which by their nature are high risk even though they may be managed by an otherwise ‘low risk’ applicant. 9. It is vital that whatever system for assessing risk is used provision is made for those Intermediate Bodies staff with knowledge of the applicant and/or project to feed in their views to those doing the assessment of risk. Examples include: a low risk rating generally applied to District Council applicants may not be appropriate where it is known a specific project has lost experienced staff or is having other difficulties in its administration or Intermediate Body programme staff may have information about a project which conflicts with its reputation among audit colleagues for submitting well documented and accurate grant 357 BUILDING SUSTAINABLE PROSPERITY PROGRAMME VERSION 3 claims. In both cases the additional information provided might prompt a higher risk rating. 10. The 5% checks must be carried out on the original documentation wherever that is held in a project. If the project applicant does not hold the original documents, the checks must be extended to a reasonable sample of grant recipients. 11. In order not to be too prescriptive the Article 10 checklist and supporting document checklist at Annex 3 provides an outline of areas to be covered and from this Article 10 Team can plan their visits which will be further refined in light of their own circumstances and agree with their relevant departmental Head of Internal Audit. A common and consistent reporting system has been developed for all Article 10 Teams which will be subject to review in September 2004. 12. As well as examining documents, inspection visits must also include examination of how the project is being managed as a whole and in particular for compliance with all the conditions of grant set out in the offer letter including any attachments or subsequent amendments to it. The visits should cover: - for an adequate number of expenditure items, that the nature and timing of the relevant expenditure comply with Community provisions and correspond to the including on-site verification. - practical application and effectiveness of the management and control systems - for an adequate number of accounting records, the comparison of those records with supporting documents held by intermediate bodies against those held by the final recipients. - the presence of a sufficient audit trail. - approved specification of the operation and the works actually executed. - that the project consistent with the use described in the application for EU funding and its subsequent offer of grant. 358 BUILDING SUSTAINABLE PROSPERITY PROGRAMME VERSION 3 - that the EU financial contributions are within the limits provided for in Article 29 of Regulation 1260/99 and any other applicable Community provisions and are paid to final recipients without any unjustified reductions or delay. - that the appropriate national match funding has in fact been made available; and - that the EU funded projects have been implemented in accordance with Community rules and policies, including the rules on competition, on award of public contracts, on environmental protection and improvement and the promotion of equality of opportunity. Calculating the 5% sample 13. The 5% should be applied to the total eligible expenditure for “each form of assistance” (i.e. measure or that part of a Community Initiative for which the Intermediate Body is responsible). Only expenditure declared up to the date of the audit can potentially be counted, not later expenditure for the same project. Audits by the Commission or the European Court of Auditors cannot be counted. In planning the implementation of the inspection strategy the total for eligible expenditure should be taken from the most recent financing plan that has been agreed with the Commission. This is intended to take account of indexation. 14. However, the Commission stipulates that sampling should be spread evenly over the lifetime of the programmes and Community Initiatives concerned, but in proportion to the amounts actually paid. The simplest way to achieve this is to ensure that a minimum 5% sample is drawn from expenditure declared, by the relevant Paying Authority, for each year of the Programme or Community Initiative. 15. There is no requirement to check 5% of eligible expenditure in each measure within a programme although sampling should aim to take at least some samples from each over the lifetime of the programme concerned. 16. The purpose of checking is to verify the effectiveness of the systems in use in the project and to verify expenditure declarations that have been made. Verification of systems points toward spreading the sample of checks at random over a 359 BUILDING SUSTAINABLE PROSPERITY PROGRAMME VERSION 3 number of claims. Verifying expenditure declarations implies that all the transactions making up an individual claim must be checked back to primary documentation. 17. Once a project has been selected for monitoring by the application of risk based criteria set out in the monitoring strategy, a detailed examination of all transactions within a single selected claim (or claims) made by that project will be the most effective way of meeting both monitoring objectives. Supporting documents should as a rule be checked 100%. However, where there are large numbers of similar and repetitive supporting documents such as invoices or proofs of payment it is accepted audit practice to check a random sample of adequate size (say 25%) rather than 100%. The sampling method and confidence level attained should be recorded in the audit report in such cases. However, if the check reveals errors the sample should be widened to establish how widespread these are. 18. The amounts of expenditure counted toward the 5% total may include all the expenditure making up a claim for which a satisfactory sample of primary documentation has been examined (i.e. not just the expenditure actually included in the sample). Such checking should be done ‘on the spot’ (i.e. at the project concerned) as part of an inspection visit. This is not intended to prevent documentation being checked, exceptionally, ‘offsite’ where there is no other practical option available. Monitoring progress towards 5% sample 19. Delivery of the 5% sample is a key control in Regulation 438/2001 and failure to meet it could result in the Departmental Internal Audit Services providing the Commission with qualified Programme/Community Initiative closure statements. This could result in the Commission disallowing expenditure and the UK incurring a direct additional cost. It is therefore necessary for Intermediate Bodies, the Article 10 Teams, Internal Audit Services and European Division, DFP to monitor progress toward achieving the sample. The proforma at Annex 4 is intended to provide the data necessary to do this. 20. Article 10 Teams should complete the proforma at Annex 4 (or their own equivalent), covering each six month period i.e. end June and end December, of 360 BUILDING SUSTAINABLE PROSPERITY PROGRAMME VERSION 3 each calendar year, by the 21st of the month following the end of each six month period. The returns should be sent to Philip McCartney, EU Division, DFP and copied to the relevant departmental Head of Internal Audit. 21. When carrying out 5% inspection visits the Article 10 Team should: - check a sample of grant claims and verify the eligible expenditure against original primary documentation (see paragraph below) recording sufficient detail to enable the amounts of expenditure actually checked to be readily identified and the relationship to specific claims to be clearly discernible. - complete the attached proforma (Annex 4). This will enable detail of progress toward completing the 5% sample to be reported, to help provide an audit trail and to calculate error rates. 22. Primary documentation is the documentation held by the project that supports the amount of eligible expenditure claimed in enough detail to provide a clear audit trail (paragraphs). In summary the project must be able to show that the eligibility of all expenditure used to calculate the grant claimed can be shown clearly from the documentation it has to hand. Usually this will mean original invoices for work done or purchases made, set out in enough detail to confirm the eligibility of the items listed; time sheets for the calculation of staff costs and details of any inkind contributions. Documentation that does not make the eligibility of expenditure clear should be questioned. 23. For capital projects involving building and construction, as a general rule, expenditure should be checked against certificates provided by an appropriately qualified Quantity Surveyor. Architects’ certificates are not usually detailed enough to provide an adequate check. 24. The Regulation requires the sample to be a minimum of 5% of expenditure that has been declared i.e. declared to be eligible. It is therefore clear that if expenditure is found to be ineligible as a result of substantive checking this does not prevent the amount checked to be counted toward the 5% sample total. 25. However, where expenditure is found to be ineligible checking should be extended to widen the sample to test for further ineligible expenditure and to 361 BUILDING SUSTAINABLE PROSPERITY PROGRAMME VERSION 3 further test the relevant systems. The extended checks should include further claims at project level and further projects undertaken by the same final recipient. Any further ineligible expenditure found in such extended testing should not be included in the 5% total because of the risk of biasing the sample as a whole. 362 BUILDING SUSTAINABLE PROSPERITY PROGRAMME VERSION 3 Records of checks 26. In addition to completion of the proforma described in paragraph 17 above it is vital that details of the documentation checked in on-site visits be recorded by the Article 10 Team in such a way as to provide an audit trail. Each item (invoice, time sheet etc) should be listed along with a brief description and the amount of expenditure to which it relates. It is not sufficient to just record the total value of the invoices etc checked. This is particularly important since such records will be needed to demonstrate to Commission auditors that the requirements of the Financial Control Regulations have been met. 27. The completed checklist and record of transactions should form the basis of a report on the visit which should include; an explanation of how the examination of the project was conducted; the reason the project was selected; a description of the project and how it is managed, the findings of the visit and details of any irregularity uncovered; the agreed action for correcting these including the amount of any ineligible expenditure. The report should conclude with recommendations for action and arrangements for follow-up, if any. 28. The checks should establish whether any problems encountered are of a systemic character, entailing a risk for other or all projects carried out by the same Intermediate Body/final recipient or in the Member State as a whole. They should identify the causes of such situations, any further examination, which may be required, and the necessary corrective and preventative action. Remedial measures must be recorded and actioned to correct systemic deficiencies. 29. The findings of the visit, the report recommendations and details of the follow-up required should all be made known to the final recipient and the visit report should be made available to those managing the project, the departmental Head of Internal Audit and the relevant Fund Paying Authority. Articles 15-17: Declaration at Winding-up of Assistance 30. Detailed guidance on the closure of the EU Funded elements of the 2000-06 main Objective Programmes and Community Initiatives will be provided by European Division, DFP on receipt of same from the European Commission. 363 BUILDING SUSTAINABLE PROSPERITY PROGRAMME VERSION 3 Article 18: Form and Content of Accounting Information 31. Article 18 stipulates that the accounting records referred to in the audit trail requirements at Section 1 paragraph 11 should be held in computerised form as far as possible and should be made available to the Commission on request. The scope of the information that may be requested by the Commission and the preferred technical specifications for the transfer of computer files to the Commission are indicated in Annexes IV and V of the Regulations. The EU database has been set up in accordance with the requirements of Annex IV of the Regulations. 364 BUILDING SUSTAINABLE PROSPERITY PROGRAMME VERSION 3 ANNEX 1 ARTICLE 4 CHECKLIST Programme: Measure: Organisation named in Letter of Offer: Project Title/Reference No: Contact Person: Period of Grant Aid: Date of Issue of Letter of Offer: Date of Acceptance: Visiting Officer(s) Name(s) Signature(s) 1)……………………………………… 1)…………………………………………… 2)……………………………………… 2)…………………………………………… 3)……………………………………… 3)…………………………………………… Date of Visit: Approved Expenditure - Letter of Offer details Eligible Expenditure EU Grant Match Funding Expenditure Declared Revenue Capital Total Has the Project formally accepted the Offer of Grant and is the signed Acceptance on file? YES/NO 365 BUILDING SUSTAINABLE PROSPERITY PROGRAMME VERSION 3 PROJECT OBJECTIVES/MONITORING AS DETAILED ON GRANT APPLICATION FORM Please provide brief description of the project Objectives Brief Outline of Project Management Structure Is there evidence to show that this management structure is in operation? YES/NO 366 BUILDING SUSTAINABLE PROSPERITY PROGRAMME VERSION 3 A (1) (2) (3) (4) Project Management and Administration YES Are the project's aims consistent with those of the parent organisation? Is the project performing against objectives/targets agreed with the funder? Obtain evidence and record details of any significant deviations. Are procedures in place to ensure retention of all documentation until 31 December 2013? Is the project aware its obligations in relation to European and National statutory requirements on: a) b) c) Equal Opportunities Fair employment Health & Safety (5) In establishing the legitimacy of the operation, has the project insurance in respect of: a) Employer's liability? b) Public Liability? c) Buildings and Contents Insurance? d) Employees' fraud and dishonesty Insurance (not obligatory)? B Financial Management (1) Are the project’s financial procedures documented? a) Are they adequate? b) Is a proper segregation of duties maintained? c) Are there appropriate authorisations for bank accounts and delegated actions? d) What processes are in place to ensure appropriate cash management of the project e.g. account reconciliation, petty cash, filing of documentation etc? (2) Does the project have a separate bank account for the grant/project or are codified arrangements in place? Record details. (3) Do accounting records maintained allow for easy identification of project/grant income and expenditure to the project? (4) Is petty cash operated in accordance with the project’s policy? (As appropriate) (5) Is the project or parent organisation registered for VAT? Provide VAT registration details or reason why not registered 367 NO COMMENTS BUILDING SUSTAINABLE PROSPERITY PROGRAMME VERSION 3 (6) Are there procedures in place to ensure that any costs that are required to be apportioned are carried out correctly? Detail processes C Physical Progress & Indicators (1) Have arrangements been put in place to ensure the project is monitored and runs to time and costs, i.e. what method does the project management use to monitor: a) Progress on the project, i.e. review performance against indicators? b) Outputs and results, i.e. assessment of achievements against targets? c) Budgetary information, i.e. is expenditure in line with projection? [Record details as to nature, accuracy and timeliness of reports produced] D Partnership (1) Are there any partners in this project? What role will each partner play in the implementation of this project? Provide details of the partner and whether the support is direct funding or indirect support and what form it takes E (1) Linkages Has the project any links to other publicly funded projects? How will this benefit the project and are any other linkages planned? F (1) Publicity Is the project promoter ensuring that the obligations with regard to publicity (EC No 1159/2000) are being complied with? Has the project a policy about the delivery of the publicity requirements for the project? G Horizontal Principles (1) Are there management systems in place to report on the horizontal principles of the Programme? a) b) c) d) Balanced Intervention/Equal Opportunity New TSN Transparency/Publicity Environmental Stability 368 BUILDING SUSTAINABLE PROSPERITY PROGRAMME VERSION 3 (2) Has the project agreed a set of horizontal principle outputs and results? Has the project the necessary systems in place and are they recording them in the right way? (3) Does the project have an impact on the environment? Is it: a) b) Positive Neutral Developmental Path Assigned 1 2 3 4 5 Circle as appropriate. Projects with a negative environmental impact should not be assisted. (4) Does the project have an exit strategy? Provide details H Public Procurement (1) Is the project management aware or the need to adhere to public procurement policies? What processes are in place to ensure compliance? NB: The foregoing areas are deemed to be the minimum required to satisfy the requirements of Article 4 of Regulation (EC) No 438/2001, however, if considered appropriate, during the visit a more detailed check may be conducted on any of the areas highlighted. 369 BUILDING SUSTAINABLE PROSPERITY PROGRAMME VERSION 3 ANNEX 2 ARTICLE 10 CHECKLIST Department / IFB Implementing Body details Name Address Contact Name Tel No Fax No E-mail Project details Name Address Contact Name Tel No Fax No E-mail Operational Programme / Community Initiative Name Priority No Measure No Project Ref No Total Project Cost EU Contribution Public Contribution Private Contribution Revenue Brief Project Description 370 BUILDING SUSTAINABLE PROSPERITY PROGRAMME VERSION 3 Name of Visiting Officer Date of Visit Signature of Visiting Officer…………………………………………………………. COVERAGE OF ARTICLE 10 CHECKS Calendar year Period covered by expenditure claim (tick as appropriate) Amount of eligible expenditure claimed 2000 2001 2002 2003 2004 2005 2006 Total 371 % of total eligible expenditure checked BUILDING SUSTAINABLE PROSPERITY PROGRAMME VERSION 3 PRE-VISIT CHECKS ON IMPLEMENTING BODY FILES 1. Project Application / Letter of Y Offer (a) Has the Application form been properly completed? (b) Are Parts ‘A’and ‘B’ on file? (c) Has the Application been acknowledged / date stamped / time received recorded? (d) Is there a documented project specification with clear targets? (e) Does the project meet all of the Structural Funds’ selection criteria? (f) Is there a copy of the Weighting / Scoring matrix on file? (g) Is there a signed Letter of Offer on file – with a date prior to the start of the project? (if signed later than start date – state reason(s)) (h) Is there a Letter of Offer Acceptance on file – signed by the identified person or persons responsible for this project? (i) Is there evidence of receipt & analysis of business case / economic appraisal (if appropriate)? (j) Were other sources of Funding declared in the application? [If so, give details] (k) Was an Article 4 check carried out? [If so, is a copy available?] (l) Are there procedures in place to report ineligible expenditure, financial irregularities and/or suspected fraud? (m) Is there a nominated member of staff within the Implementing Body designated to authorise payments to this project? (n) Has the project provided copies of the relevant Insurance Certificates? (if appropriate) (o) Has the project provided copies of relevant Building / Planning permission documentation? (if appropriate) (p) Has project data been input to the Monitoring Database? 372 N Comments BUILDING SUSTAINABLE PROSPERITY PROGRAMME VERSION 3 CHECKS ON PROJECT – 1. ORGANISATION STRUCTURE / POLICIES 1.1 Organisational structure and Y policies (a) Is there an organisation structure showing staff employed on this project? (b) Is there a project plan with financial and monitoring targets as in the application? (If so, how is progress monitored?) (c) Is there a written policy for retention of documents? (until December 2013) (d) Is there a written policy on Equal Opportunities? (e) Is there a written policy on Health and Safety? (f) Is there a written policy for meeting EC Regulations on publicity? * (g) Is there a written policy on procurement / tendering? (h) Is there a written policy on data protection? (i) Is there a clear separation of functions between staff involved in the EU project and any other activities of the organisation? (j) Have there been any changes to the project from the original application? (k) Have these been as a result of monitoring / evaluation by the project managers? (l) Was the written approval of the Implementing Body obtained before changes were made? (m) Is there a record of all monitoring activity carried out? * N Comments There must be a clear recognition of EU funding in all documentation and participants must be aware of EU assistance to the project. 373 BUILDING SUSTAINABLE PROSPERITY PROGRAMME VERSION 3 CHECKS ON PROJECT – 2. FINANCIAL INFORMATION 2.1 General and capital costs Y (a) Does the project have an expenditure profile / budget? (b) Is there regular monitoring of actual costs against profiled expenditure? (c) Is there a separate Bank account (or identifiable coding) for this project? (d) Is there a clear basis for apportionment of EU expenditure in respect of overheads, etc? (e) Where this expenditure has been apportioned, is there evidence of payment from other sources for the balance? (f) Is there supporting documentation for all expenditure claimed? (g) Are there original invoices for all expenditure charged to the EU project? (h) Where there are non-invoiced costs are they supported by relevant official documentation? (i) Is there an up to date Bank Statement? (j) Is there evidence of a regular reconciliation between invoices, receipts, cheques and Bank records? (k) Is there written authorisation for staff to sign cheques? (specify name / and the financial limit for each person) (l) Have all the cheques been signed by the authorised signatories? (m) Are any cheques pre-signed? (n) Is there a written policy on the use of petty cash? (o) Have petty cash payments been made in line with this written policy? (p) Is the organisation registered for VAT? (q) Does all expenditure claimed exclude VAT? (r) Does the project generate revenue? 374 N Comments BUILDING SUSTAINABLE PROSPERITY PROGRAMME VERSION 3 (s) (t) (u) (v) (w) (x) (y) Is there evidence of receipts in respect of income and has it been offset against this project? Is there an assets register for all capital items purchased? Are all capital purchases claimed identifiable in the register? Is there a record of the Serial No of each item of capital equipment? Is there any capital item not purchased new? Has the project complied with the eligibility Regulations regarding the purchase of second hand equipment (as detailed in Regulation 1685/2000 amended by Regulation 1145/2003)? Is the purchase price reasonably consistent with the overall age / condition of the asset? CHECKS ON PROJECT – 2. FINANCIAL INFORMATION 2.2 Staff costs and expenses (a) Where staff costs are charged is there evidence that they were calculated as outlined in the Letter of Offer? Is there evidence that they are employed exclusively on this project? If costs for staff time are apportioned, is the basis for this identifiable? (If so, provide details) Is there a signed weekly / monthly timesheet for staff, with clearly identified time spent on this project? Is there a P11 (manual / computerised) for each member of staff? Is there a written policy detailing travel & subsistence allowance rates for the EU project? (b) (c) (d) (e) (f) (g) (h) Y Is there a written policy regarding hospitality? (limits and approval procedures) Have all staff expenses included 375 N Comments BUILDING SUSTAINABLE PROSPERITY PROGRAMME VERSION 3 (i) (j) in the claim(s) been submitted in accordance with these policies? Is there documentation to verify that all staff travel / subsistence claims have been paid? Do the amounts paid agree with the amounts claimed? CHECKS ON PROJECT – 2. FINANCIAL INFORMATION 2.3 Expenditure claims by projects (a) Has the person who signed the claim been authorised to do so by the organisation? Does the same person sign all expenditure claims? Is a checklist used for claim information before it is declared? Can all match funding be clearly identified on each claim? Can all claim information be verified from the project’s accounting records? Are all original invoices endorsed with cheque / payment details when paid? Has an arithmetical check been carried out on all expenditure included in the claim? Was this check carried out by a person or persons independent of the person who signed the claim? Has all, or a sample of expenditure declared in this claim been incurred and paid within the eligible dates for the project? Does the project produce certified and audited annual accounts? (if so, are these submitted to the Implementing Body?) (b) (c) (d) (e) (f) (g) (h) (i) (j) Y 376 N Comments BUILDING SUSTAINABLE PROSPERITY PROGRAMME VERSION 3 CHECKS ON PROJECT – 3. GENERAL 3.1 Tenders for works or services (a) Where a project is required to tender work or services, is this in line with procurement policy? Were tenders recorded and evaluated against set criteria? Are decisions to award / refuse clearly documented and held on file? (b) (c) Y N Y N Comments ESF ONLY – 1. FINANCIAL CONTROL 1. (a) (b) (c) (d) (e) (f) (g) (h) Monitoring & verification (beneficiaries / participants) Is there a signed application form for each participant? Does each participant meet the criteria for the project? (age, length of time unemployed, etc) Is there a timesheet for each participant – signed by the participant and a member of staff? Do the starting and finishing dates for training agree with the period claimed? Is there a training needs analysis for each participant? (if so, note the date it was carried out) Is there a record of the outcome of the training activities carried out? (certificate, etc) Is there a weekly / monthly reconciliation of payments against signed timesheets submitted? Is there a record of payments made? (cheques, BACS transfers, etc) 377 Comments BUILDING SUSTAINABLE PROSPERITY PROGRAMME VERSION 3 ANNEX 3 AUDIT TESTING STRATEGY: PROJECT SELECTION RISK FACTORS Category Risk Description Score (a) Project eligible Low Less than £100k 1 Medium Greater than £100k but less than 2 spend See Note 1. £500k (b) Type of provider High Greater than £500k 3 Low Local authority/business link 1 Medium FE/HE Institutions 2 High Other e.g. private companies, 3 Good e.g. claims accurate and 1 voluntary sector, etc (c) Track record Low prompt, no problems identified by monitoring visits, etc. Medium Adequate e.g. most claims accurate and prompt, minor 2 problems identified by monitoring visits, etc High Poor e.g. claims inaccurate and/or 3 consistently late, major problems identified by monitoring visits, etc. (d) Overall Risk Low 3-4 Medium 5-6 High 7-9 Example 378 BUILDING SUSTAINABLE PROSPERITY PROGRAMME VERSION 3 A project with total expenditure eligible for EU support of £1m is managed by a District Council. A recent visit by the monitoring team found a number of major problems, including claims based on estimates rather than defrayed expenditure and the inclusion of ineligible items. The project was assessed as ' high risk' as follows: - (a) Project eligible spend 3 (b) Type of provider 1 (c) Track record 3 (d) Overall Risk 7 HIGH Notes: The values may need to be varied to reflect the circumstances of individual projects. For example, a project with an eligible spend of £100k may be relatively large in one of the smaller programmes. 379 BUILDING SUSTAINABLE PROSPERITY PROGRAMME VERSION 2 ANNEX 4 ERDF REGULATION 438/2001 – ARTICLE 10 – 5% SAMPLE – PROGRESS RECORD Date: IAS- Department: Programme/ Total Eligible Amount Community Expenditure 5% Initiative Per Year Column 2 of Eligible (2) of column 2 Expenditure checked (1) of Column 4 as % to date (3) (5) (4) Year 1 Year 2 Year 3 etc Year 1 Year 2 Year 3 etc Year 1 Year 2 Year 3 etc Column 1 - name of each programme /Community Initiative covered by regulation 438/2001 and for which a 5% sample is required. In summary this is all programmes/CIs that require completion of a closure statement. Column 2 - total eligible expenditure planned to be spent over the lifetime of each programme/CI included in Column 1 – broken down for each year where expenditure is planned. BUILDING SUSTAINABLE PROSPERITY PROGRAMME VERSION 3 Column 3 - 5% of the total planned eligible expenditure per year – in effect this is the target figure for each programme/CI we should be aiming to deliver. Column 4 – total eligible expenditure per year included in the substantive checking described above. Data in this column will always be cumulative from the start of the programme/CI to the end of the reporting quarter. Column 5 – Column 4 as a percentage of Column 2, which gives the progress, made toward the target figure for each year. 381 BUILDING SUSTAINABLE PROSPERITY PROGRAMME VERSION 3 UPDATED GUIDANCE DFP – EU FINANCE GUIDANCE NOTE 01/2006 COMPLIANCE WITH EC REGULATION 438/2001 MONITORING VISITS (Article 4) Introduction 1. This Guidance Note replaces the guidance provided in Document EU Finance Guidance Note 1/2005 on the action that must be taken to ensure compliance with the requirements for Monitoring Visits laid down in Article 4 of EC Regulation 438/2001. and the attached Annex provides a model checklist designed to ensure that all relevant areas are addressed. 2. Guidance that has issued to Intermediate Bodies and which they must comply with includes the EU Structural Funds manual and related Guidance Notes issued by European Division, DFP for the BSP Programme and in the case of PEACE II and the Community Initiatives similar and related Guidance issued by SEUPB (Websites: www.europe-dfpni.gov.uk www.seupb.org ) 3. EC Regulation 438/2001 sets out detailed rules for the implementation of EC Regulation 1260/1999. This requires Member States to take a number of measures to ensure that Community Funds are used efficiently and correctly and in accordance with the principles of sound financial management. 382 BUILDING SUSTAINABLE PROSPERITY PROGRAMME VERSION 3 Article 4 of Regulation 438/2001 states: “Management and control systems shall include procedures to verify the delivery of the products and services co-financed and the reality of expenditure claimed and to ensure compliance with the terms of the relevant Commission decision under Article 28 of Regulation (EC) No 1260/1999 and with the applicable national and Community rules on, in particular, the eligibility of expenditure for support from the Structural Funds under the assistance concerned, public procurement, State aid (including the rules on the cumulations of aid), protection of the environment and equality of opportunity. The procedures shall require the recording of verifications of individual operations on the spot. The records shall state the work done, the results of the verification and the measures taken in respect of discrepancies. Where any physical or administrative verifications are not exhaustive, but performed on a sample of operations, the records shall identify the operations selected and describe the sampling method.” Coverage of Visits 4. The procedures must include the review of individual operations on the spot. The records must state the results of the visits and the measures taken in respect of discrepancies. 5. All projects should be visited at least once in their lifetime by their respective Intermediate Body. Initial visits should be used to assess the level and reliability of the processes proposed. Further visits may be necessary to validate and assure Intermediate Bodies of the robustness of the processes – this will be for individual Intermediate Bodies to determine depending on the nature of the project. 6. Visits carried out before the issue of the Guidance Note and sample checklist, that comply with the requirements of the Regulation, need not be re-performed 383 BUILDING SUSTAINABLE PROSPERITY PROGRAMME VERSION 3 Purpose of Monitoring Visits 7. The aims of the on-site monitoring visits are: • To ensure that the project conforms to the work plan and content as agreed in the application/ offer letter and is progressing as stated in the last claim – if a claim has been submitted • To identify possible problems as early as possible and make suggestions for improvement measures • To identify successful elements of the project for possible use in the common publicity efforts and to share best practice • To encourage greater understanding between the Intermediate Body and project on the nature of each others work The best time to monitor a project 8. A project receiving EU assistance must be visited at least once during its lifetime. The first visit should not be too near the start of the project as it may not be possible to form an opinion on the systems in place conversely it should not be at too late a stage that if records are poor there is insufficient time to put things right. Visits should be prioritised taking into account the project’s grant allocation, progress reports and claim history. Increases in the frequency of visits will be at the discretion of the Intermediate Body and will depend on the type of project and level of financial control and/or number of discrepancies found. Projects that are complete 9 Where projects have closed, the Article 4 check should still be carried out on the records of the project – these records have to be kept by the applicant for at least 3 years after the final payment on the programme has been received from the European Commission (current advice is to retain documents to at least December 2013). 384 BUILDING SUSTAINABLE PROSPERITY PROGRAMME VERSION 3 Format of Monitoring Visits 10. The information provided on the approved application form and any claims statement will form the basis for the on-site visit. In addition to checking the physical existence of the project, the visit can also be used to collect more detailed data than is available from the project’s claims reports, to provide a thorough check of progress against targets and to check that the project is providing accurate information. It should be remembered, however, that the onus is on the project to provide basic monitoring information and that visits should not be seen as the primary method of obtaining data that would more sensibly be included in their regular claim reports. 11. In order to have successful visits, it is vital that key members of staff involved in the project are available during the monitoring visit. Any visit should be arranged in advance in conjunction with the project to ensure that this is the case, and in order that the organisation has time to prepare for the visit. The date and timing should where possible be confirmed in writing detailing the documentation and personnel that need to be available. recipients/beneficiaries should be met. Where possible some of the Sometimes the project may involve several locations or the records may be kept at a location other than the project site; in this case visit the project site or utilise existing expertise to verify delivery of services. Model Checklist 12. The model checklist attached at Annex 1 should be seen as the minimum requirement for the monitoring visit. Intermediate Bodies may however add additional items for inspection if it is deemed necessary and, depending on the nature of the project, some of the questions may not be applicable. Copies of alternative Checklists should be provided to European Division, DFP. The checklist can, however, also be used as a guide for project promoters to aid them in the preparation of the information, which will be required during the monitoring visit. 385 BUILDING SUSTAINABLE PROSPERITY PROGRAMME VERSION 3 13. Where a monitoring visit is being carried out on a Government Department acting as an Implementing Body, consideration should also be given to existing assurances from Departmental Internal Audit Branches and the Northern Ireland Office where these include an inspection of EU-related activities. 14. Article 4 reports should be copied to the Article 10 Teams for information 386 BUILDING SUSTAINABLE PROSPERITY PROGRAMME VERSION 3 ANNEX 1 ARTICLE 4 MODEL CHECKLIST Programme: Measure: Organisation named in Letter of Offer: Project Title/Reference No: Contact Person: Period of Grant Aid: Date of Issue of Letter of Offer: Date of Acceptance: Visiting Officer(s) Name(s) Signature(s) 1)……………………………………… 1)…………………………………………… 2)……………………………………… 2)…………………………………………… 3)……………………………………… 3)…………………………………………… Date of Visit: Approved Expenditure - Letter of Offer details Eligible Expenditure EU Grant Match Funding Expenditure Declared Revenue Capital Total Has the Project formally accepted the Offer of Grant and is the signed Acceptance on file? YES/NO 387 BUILDING SUSTAINABLE PROSPERITY PROGRAMME VERSION 3 PROJECT OBJECTIVES/MONITORING AS DETAILED ON GRANT APPLICATION FORM Please provide brief description of the project Objectives Brief Outline of Project Management Structure Is there evidence to show that this management structure is in operation? YES/NO 388 BUILDING SUSTAINABLE PROSPERITY PROGRAMME VERSION 3 A Project Management and Administration YES NO COMMENTS / EVIDENCE (1) Are the project's aims consistent with those of the parent organisation? (If appropriate) Mission statement for parent organisation (2) Is the project performing against objectives/targets agreed with the funder? Compare with Application / Letter of Offer (3) Are procedures in place to ensure retention of all documentation until 31 December 2013? What type of storage (disc, microfiche, etc) is being used (4) Is the project aware its obligations in relation to European and National statutory requirements on: a) Data Protection b) Equal Opportunities c) Fair employment d) Health & Safety Written policy documents (5) How will these be addressed? In establishing the legitimacy of the operation, has the project insurance in respect of: a) Employer's liability? b) Public Liability? c) Buildings and Contents Insurance? d) Employees' fraud and dishonesty Insurance (not obligatory)? B Financial Management (1) Are the project’s financial procedures documented? Is there evidence of valid certificates Expiry date(s) Flow chart of financial procedures Sample signatures and authorisation limits e) Are they adequate? f) Is a proper segregation of duties maintained? g) Are there appropriate authorisations for bank accounts and delegated actions? h) What processes are in place to ensure appropriate cash management of the project e.g. account reconciliation, petty cash, filing of documentation etc? Record Details of Bank A/c etc (2) Does the project have a separate bank account for the grant/project or are codified arrangements in place? (3) Do accounting records maintained allow for easy identification of project/grant income and expenditure to the project? (4) Is petty cash operated in accordance with the project’s policy? (As appropriate) Evidence of signatures / authorisation limits and procedures (5) Is the project or parent organisation registered for VAT? Provide VAT registration details or reason why not registered 389 BUILDING SUSTAINABLE PROSPERITY PROGRAMME VERSION 3 (6) (3) C (1) (4) Are there procedures in place to ensure that any Does that the project have an impact on the are carried costs are required to be apportioned environment? out correctly? Is it: Detail processes a) Positive b) Neutral Physical Progress & Indicators Evidence of calculation method. Detail processes Developmental Path been Assigned Have arrangements put in place to ensure the 1 2 is3monitored 4 5 and 6 runs to time and costs, i.e. project Circle as appropriate. what method does the project management use to monitor: Projects with a negative environmental impact should not be assisted. a} Progress on the project, i.e. review performance against indicators? Does the project have an exit strategy? Flow charts of management procedures Details of corrective action – if any – and timescales b) H Provide details Outputs and results, i.e. assessment of achievements against targets? Public Procurement (1) c) Budgetary information, i.e. is expenditure in line with projection? Is the project management aware or the need to adhere to public procurement policies? D Partnership What processes are in place to ensure compliance? (1) Are there any partners in this project? Evidence of compliance and understanding Provide details of the partner and whether the support is direct funding or indirect support and what form it takes What role will each partner play in the implementation of this project? E Linkages (1) Has the project any links to other publicly funded projects? Evidence of linkage and context How will this benefit the project and are any other linkages planned? F (1) Publicity Is the project promoter ensuring that the obligations with regard to publicity (EC No 1159/2000) are being complied with? Evidence of publicity material Has the project a policy about the delivery of the publicity requirements for the project? G Horizontal Principles (1) Are there management systems in place to report on the horizontal principles of the Programme? a) b) c) Balanced Intervention/Equal Opportunity Transparency/Publicity Environmental Stability Details of Reporting system in place For example, is the equality questionnaire issued to final beneficiaries? How is any publicity action taken by the project ? NOTE TO IMPLEMENTING BODY Following the Article 10 visit the correct postcode for each project must be input to the database. 390 BUILDING SUSTAINABLE PROSPERITY PROGRAMME VERSION 3 NB: The foregoing areas are deemed to be the minimum required to satisfy the requirements of Article 4 of Regulation (EC) No 438/2001, however, if considered appropriate, during the visit a more detailed check may be conducted on any of the areas highlighted. An Example of an Implementing Body checklist on next page 391 BUILDING SUSTAINABLE PROSPERITY PROGRAMME VERSION 3 ARTICLE 4 CHECKLIST: FINANCIAL CONTROL VISIT Project Ref No: Date of Visits: Promoter(s): Project Title: Project Principle/Contact: Total Grant (Per LoO) LoO Date: Project - Start Date: End Date: Date LoO Accepted: Copy of signed acceptance on File: IA Officer: BRIEF DESCRIPTION OF PROJECT: DESCRIPTION OF OTHER PROJECTS MANAGED BY THIS ORGANISATION PROJECT TITLE LoO Details - Approved Expenditure MAIN GRANT FUNDER Eligible Total 392 MAIN GRANT PROGRAMME MEASURE AMOUNT AWARDED EU Grant Match Expenditure Declared BUILDING SUSTAINABLE PROSPERITY PROGRAMME VERSION 3 393 BUILDING SUSTAINABLE PROSPERITY PROGRAMME VERSION 3 MANAGEMENT AND SYSTEMS REVIEW A.0 BUDGETS A.1 Does the promoter fully agree with the budgets details as set out in annex 2 of the LoO? A.2 Has the match funding for the project been confirmed? YES NO COMMENTS (provide detail) A.3 Is the promoter conversant with the grant drawdown procedures? (a) eligibility of expenditure (b) regular claims (Quarterly) (c) invoices to be claimed within 6 month period (d) annual budgets / N+2 (e) audited claims A.4 If relevant, is the promoter conversant with the advance payments system? A.5 Has the promoter been provided with copies of the relevant grant claim forms? A.6 In its monitoring of budgets does the promoter take cognisance of expenditure deemed ineligible or unvouched from previous grant claims? 394 TYPE OF EVIDENCE BUILDING SUSTAINABLE PROSPERITY PROGRAMME VERSION 3 B.0 FINANCIAL PROCEDURES B.1 Does the promoter have clearly defined procedures for (a) opening/closing accounts (b) monitoring budgets (c) authorising expenditure (d) issuing payments (e) reconciling bank statements? YES NO COMMENTS assess their adequacy B.2 Is there a defined list of authorised cheques signatories? provide details B.3 Does the project have a separate bank account for the grant/project or are codified arrangements in place? record details B.4 Does the promoter have clearly defined ordering and contract procedures? assess their adequacy B.5 Is the promoter aware of the need to provide quotations for all services/ expenditure over €1,450 (£1,000) as per LoO guidance (Annex 3)? B.6 If relevant, has the promoter documented apportionment policies? (a) Is the policy reasonable and transparent? (b) Has it been correctly formulated? (c) Is it being correctly applied? assess each such policy B.7 Evidence of Match Funding, see LoO details 395 TYPE OF EVIDENCE BUILDING SUSTAINABLE PROSPERITY PROGRAMME VERSION 3 C.0 PAYMENTS C.1 How will monies paid from the INTERREG IIIA programme be recorded in the accounting records, e.g. the cashbook? C.2 How often does the promoter reconcile their accounts? e.g. receipts v payments C.3 Are details of all cheques issued (including cancelled cheques) recorded in a cheques journal? C.4 Have the defined ordering and payment authorisation policies been implemented? Select a sample of 3 payments and trace them through the system. C.5 Are all payments supported by relevant certified documentation? e.g. invoices, payroll calculations, etc. C.6 Is all such supporting documentation marked paid and filed appropriately? C.7 Is the practice of pre-signed blank cheques prohibited? C.8 Are all payments (except minor expenses paid from petty cash) made via the cheque or credit transfer system? YES NO COMMENTS YES NO COMMENTS TYPE OF EVIDENCE list any exceptions D.0 PETTY CASH D.1 What is the maximum balance retained? D.2 Do petty cash payments require authorisation? D.3 Who has access to petty cash? D.4 Are the invoices/receipts for petty cash expenditure retained? D.5 Does the petty cash system operate effectively, i.e. are IOUs and the cashing of personal cheques prohibited? 396 TYPE OF EVIDENCE BUILDING SUSTAINABLE PROSPERITY PROGRAMME VERSION 3 E.0 RECORD KEEPING E.1 Is the promoter aware of the need to retain all records relating to the project until, at least, 31 December 2013? E.2 Has the promoter established monitoring systems to facilitate review of the project’s progress? Assess their adequacy. E.3 Are the minutes of all meetings of the board, sub-groups and committees, retained satisfactorily? E.4 Are variance reports, i.e. budget v actual, presented to the board / project management team? E.5 Do the accounting records facilitate easy identification of grant & project income and project expenditure? F.0 PERSONNEL ISSUES F.1 Is the promoter aware of and implementing its obligations in respect of: Equal opportunities Fair employment Health & safety Child protection Publicity see I.5; and Other relevant national regulations? F.2 Is there a policy i.r.o contract of employment/conditions and service? F.3 How will the payroll system operate? F.4 Are there appropriate guidelines relating to travel and other related expenses? YES NO COMMENTS TYPE OF EVIDENCE YES NO COMMENTS TYPE OF EVIDENCE 397 BUILDING SUSTAINABLE PROSPERITY PROGRAMME VERSION 3 G.0 ADVISORS/CONSULTANTS G.1 What are the selection and appointment procedures i.r.o. advisors/consultants? G.2 Do these comply with the public procurement guidelines set out at Annex 3 in the LoO? H.0 CROSS-BORDER ELEMENT H.1 Is there evidence of regular liaison between the project promoters? H.2 Are all partners involved in the management of the project? H.3 Does the promoter’s monitoring system support ongoing review of the cross-border impact of the project? I.0 GENERAL I.1 Is the project performing against objectives /targets agreed by the funder and/ or Implementing Agent (IA) I.2 Is the group registered as an employer with the Inland Revenue / Revenue Commissioners? I.3 Is the group registered for VAT? If so has VAT been correctly dealt with in the cheques journal and grant claims? YES NO COMMENTS TYPE OF EVIDENCE COMMENTS TYPE OF EVIDENCE COMMENTS TYPE OF EVIDENCE provide VAT registration details or reason why not registered 398 BUILDING SUSTAINABLE PROSPERITY PROGRAMME VERSION 3 I.0 GENERAL YES I.4 Does the group have appropriate insurance policies, i.e. Employer’s liability Public liability Buildings & contents Employees’ fraud & dishonesty (not obligatory) ? I.5 Has the group been made aware of the publicity requirements of the programme? Regulation 1159/2000 Is there evidence that the publicity requirements have been implemented? I.6 NO COMMENTS Is the project management aware of the need to adhere to public procurement policies? What processes are in place to ensure compliance? Does the asset register provide a: I.7 full description of the item? serial number? purchase price? date of purchase? estimated lifespan or date of write - off I.8 Are EU funded assets listed separately and is the promoter aware of the conditions relating to their disposal, etc? I.9 Is the group able to comply with the conditions stated in the LoO? 399 TYPE OF EVIDENCE BUILDING SUSTAINABLE PROSPERITY PROGRAMME VERSION 3 I.0 I.10 GENERAL YES NO COMMENTS TYPE OF EVIDENCE Does the project have an impact on the environment? Is it: a) b) Positive Neutral Development Path Assigned 6 Projects with a negative environmental impact should not be assisted. I.11 Does the project have an exit strategy? provide details YES NO DO THE PROJECT MANAGEMENT & CONTROL SYSTEMS APPEAR ADEQUATE? COMMENTS Financial procedures are strong. No problems noted from sample testing. No formal project management procedures in place, but this is consistent with the scale and nature of the project. Segregation of duties evidenced between ordering, payroll, payments systems. YES WERE ANY PROBLEMS DISCOVERED DURING THE VISIT? 400 NO BUILDING SUSTAINABLE PROSPERITY PROGRAMME VERSION 3 COMMENTS WHAT ARE THE CAUSES OF THE PROBLEMS? YES NO WILL THE PROMOTER RESOLVE THESE PROBLEMS? COMMENTS YES ARE THE PROBLEMS OF A SYSTEMATIC NATURE? (Yes for archiving issue only) DO THEY CARRY A RISK FOR THIS PROJECT? DO THEY CARRY A RISK FOR OTHER PROJECTS MANAGED BY THE PROMOTER? (Yes for archiving issue only) 401 NO BUILDING SUSTAINABLE PROSPERITY PROGRAMME VERSION 3 REVIEWER’s COMMENTS COMPLETED BY: SIGNATURE: POSITION: DATE: REVIEWED BY: SIGNATURE : POSITION: DATE: 402 BUILDING SUSTAINABLE PROSPERITY PROGRAMME VERSION 3 ANNEX 10 Article 10 Guidance and checklist Article 10 Guidance and Checklist 403 BUILDING SUSTAINABLE PROSPERITY PROGRAMME VERSION 3 ANNEX 11 Paying Authority Record of on-the-spot check Part 1 – Managing Authority request and Certificate covering the Claim Yes / No 1. Is there a request from the Managing Authority to submit a claim? 2. Has the Managing Authority provided a covering Certificate? 3. Is the Certificate signed and dated? 4. Does the Certificate provide details of compliance with the following requirements? (a) adoption of Programme Complement; (b) latest Annual report Submitted; (c) mid-term evaluation submitted; (d) decisions of MA and Monitoring Committee; (e) recommendations made by the Commission acted upon; and (f) requests for corrective Measures acted upon 5. Is there a Measure level breakdown of expenditure? Comments / details Yes Request dated 1.11.2007 Yes Certificate dated 1.11.2007 Yes Signed by Lynsey Moore 1.11.2007 Yes Yes Yes Signed by Lynsey Moore 1.11.2007 Yes Yes Yes Yes Shown as Drawdown No 175 404 BUILDING SUSTAINABLE PROSPERITY PROGRAMME VERSION 3 General observations………………………………………………………………… …………………………………………………………………………………………. …………………………………………………………………………………………. Signed…Philip McCartney………………………. Position…ERDF PA (S.O.) Date……16/11/2007 405 BUILDING SUSTAINABLE PROSPERITY PROGRAMME VERSION 3 Part 2 – Certificate and Statement of Expenditure (provided by IBs) Yes/ No 1. Does the Certificate from the Implementing Body / Accountable Department have an original signature? 2. Is the Certificate dated? 3. Is there a list of project payments in support of the Certificate? 4. Are the payments in £ Sterling? 5. Do the project payments distinguish between EU and national Funding sources? 3. Is there any Private funding / income included? 5. Is the intervention rate consistent with that for the Measure from the latest Programme Complement? Comments / details Yes Signed by Errol Gunning Yes 15.10.2007 Yes Payments in Oct, Nov, Dec 06 and Jul, Sept 2007 Yes Yes No Yes Programme Complement (Oct ’05) shows 0.749999997 Payments shown at same – or lower - rate General observations…Selected measure 1.6 because (a) previous problem in 2003 with amount certified for Roads element and (b) the current value is 51.9% of the total value of declared expenditure in current claim (DD 175) …………………………………………………………………………………………. …………………………………………………………………………………………. 406 BUILDING SUSTAINABLE PROSPERITY PROGRAMME VERSION 3 Signed…Philip McCartney……………………. Position…ERDF PA (S.O.) Date……19/11/2007 407 BUILDING SUSTAINABLE PROSPERITY PROGRAMME VERSION 3 Part 3 – For selected project payment records (held by IBs) Project Details 1. Is there a distinct Project file? 2. Does it show Bank details for the project? 3. Does it contain a signed and dated Letter of Offer (LoO) showing start and finish dates? 4. Is there a signed and dated acceptance for the Letter of Offer? 5. Is the start date in the LoO before the date of the first payment? 6. Were all payments made for expenditure incurred between the start and finish dates shown in the LoO? Yes / No Yes Yes Yes Yes Comments / details Start date Dec 2000 LoO revised in Nov 2005 to include EU Funding. Finish date Dec 2006 Dated Nov 2005 following revision Yes Yes All details on file agree with dates shown in printout from database for DD 175 Documentation 1. Is there an original invoice to reconcile to the payment(s) made? 2. Is there evidence of pre-payment checks having been carried out? 3. Is there confirmation of receipt of payment (Bank records / statements, etc) Detailed schedule attached to invoice / claim Yes Yes No Detailed list of items checked before preparation of payment PP&T Branch operates on ‘exception report’ basis where payments no made in 30 days are highlighted Article 4 checks 4. Has an Article 4 visit been carried Yes Visit carried out 7.3.2006 – report dated 408 BUILDING SUSTAINABLE PROSPERITY PROGRAMME VERSION 3 out? 5. If so, have details been recorded (date, findings, recommendations, etc) ? 6. Were any weaknesses identified at that stage? 7. Is there any evidence that follow up action was carried out to ensure compliance? 21.3.2006 Yes Yes Held in line with ‘model’ checklist issued by EUD Need for adequate publicity Yes Visit carried out to confirm compliance (photographs held on file) Article 10 checks 8. Was an Article 10 verification visit carried out? 9. Have details been recorded (date, findings, value of expenditure checked, recommendations, etc)? 10. Where recommendations were made is there any evidence that follow up action was carried out to ensure compliance? No Not in current expenditure but evidence of previous visits on file Yes / Comments / details No Yes As above – related to earlier visits No Previous visits showed no recommendations needed – sufficient systems in place Irregularities 11. Have any irregularities been identified? 12. Have these been reported (>€10k / fraud) or recorded (<€10k)? 13. If appropriate, has there been any recovery action taken? 14. Has any recovered amount been No N/A N/A See 11. above See 11. above 409 BUILDING SUSTAINABLE PROSPERITY PROGRAMME VERSION 3 deducted from the Statement of Expenditure? Compliance with general Commission Regulations 1. Is there evidence of compliance with publicity requirements – Regulation 1159/2000? 2. Is there evidence of compliance with tendering and procurement requirements (if appropriate)? 3. Is there evidence of compliance with environmental requirements (if appropriate)? N/A See 11. above Yes Photographs held on file (plaques on train carriages) Yes Copies of assessments and scoring of applications Yes Reference on file to environmental impact assessment carried out General observations…Measure 1.6b expenditure selected – project 033691 for replacement rolling stock – comprising the main element of the Measure spend …………………………………………………………………………………………. Completed in respect of Claim No…DD 175 …… Dated…22/11/2007…. Programme / Community Initiative…BSP Programme ………………………………………………………………………………………... CCI No……1999GB161PO007……….. Signed…Philip McCartney…………………. Position…ERDF PA (S.O.).. Date…22/11/2007……… 410 BUILDING SUSTAINABLE PROSPERITY PROGRAMME VERSION 3 ANNEX 12 INTERNAL AUDIT ACTIVITY FOR MEASURE 1.1(a), 1.1(b) and 1.1(c) The table below provides a record of internal audits carried out for sub-Measures 1.1(a) 1.1(b) and 1.1(c) Reference Number IAS 36/05 IAS 27/07 (A) IAS 27/07 (B) Title of Audit Invest NI EU Compliance Team - SMP: Internal Audit Service Report Invest NI EC Remedial Compliance Testing Invest NI EC Remedial Compliance TestingOther Matters Arising Audit Body Date of Audit Date Report received DETI IAS 9th January 2006 10th April 2006 Date of Response 3rd May 06 DETI IAS December 2007/ January 2008 14th April 08 2nd May 08 DETI IAS December 2007/ January 2008 17th April 08 15th May 08 411 BUILDING SUSTAINABLE PROSPERITY PROGRAMME VERSION 3 Key recommendations and subsequent actions for sub-Measures 1.1(a), 1.1(b) and 1.1(c) Reference Number IAS 36/05 IAS 36/05 IAS 36/05 IAS 36/05 IAS 36/05 Recommendation Action Taken 1. Remedial Action concerning Letter of Offer (LoO) clauses. Recommendation: Management should ensure that sufficient evidence is available to demonstrate that addendums have been issued to clients and that same is associated with the original LoO for all projects in receipt of or to be used to effect future EC drawdown. 2. Remedial action concerning Article 4 requirements. Recommendation: Management should ensure that all appropriate Article 4 checks and associated checklists are fully completed, signed off and returned to the EU Compliance Team and / or associated with the project file. 3. Recording of pre-payment irregularities. Recommendation: Management should conduct an exercise to determine whether the list of irregularities recorded is accurate and complete. This exercise should be confined to those claims which have been used to attract EC drawdown In order to address the apparent discrepancies, Invest NI conducted an exercise to determine if the list of irregularities was accurate and complete 4. Accuracy and completeness of database entries. Recommendation: Management, in conjunction with RMA Systems, should take appropriate steps to identify the extent of action required to ensure that all essential database fields are adequately and accurately populated 5. Extent to which trigger point expenditure has been utilised to draw down EU funds. Recommendation: Management should provide DETI with the findings from the trigger point exercise to inform future decision making regarding this issue. Invest NI populated the database with information on project performance indicators. Staff undertook to include information on project start and end dates and total eligible project costs. In order to establish the element of grant which paid on the basis of triggers, Invest NI analysed the Letters of Offers contained in Annex B of the Report. This has been an ongoing exercise which has highlighted Irregularities. Did this lead to an irregularity If so, was it reported or recorded. Invest NI completed an exercise to ensure that all Letters of Offer, against which EU funds were drawn down, were issued with addendums. No N/A Invest NI carried out an exercise to ensure that Article 4 checks were completed for all Letters of Offer against which EU funds were drawn down. No N/A No N/A No N/A 412 Yes Reported BUILDING SUSTAINABLE PROSPERITY PROGRAMME VERSION 3 Key recommendations and subsequent actions for sub-Measures 1.1(a), 1.1(b) and 1.1(c) (cont’d) Reference Number Recommendation IAS 36/05 IAS 36/05 IAS 36/05 6. Accuracy of Invest NI internal supporting documentation used for EC Drawdown. Recommendation: Management, in conjunction with the branches responsible for the information contained in the various databases, should ensure that there are adequate controls in place to validate the accuracy of figures i.e. a supervisory check of database entries should be performed against an Oracle report prior to the database information being uploaded. 7. Uplifting of Grant Claims Recommendation: Management should establish whether this expenditure complies with EC eligibility requirements. If deemed ineligible then corrective action should be taken. 8. Walter Watson – Interest Relief Grant. Recommendation: Management should establish from DETI European Programmes whether this expenditure complies with BSP EU eligibility requirements. If deemed ineligible then corrective action should be taken for this and any other similar grants. Action Taken Invest NI carried out various remedial exercises which helped to ensure the accuracy of supporting documentation. Along with supervisory checks of database entries, there was also the Article 4 compliance exercise and the Trigger Points exercise. Claims Inspection Branch policy was to only pay grant against properly completed claims which had correct auditor's certificates, where required ( i.e. as set out in more recent offers ). This meant that during a site inspection the appropriate company representative could amend and sign the original claim to reflect any revision. This procedure could not apply to any desk or site inspection case where a revised auditor's certificate would be necessary. To avoid any doubt, a revised auditor's certificate will always be required where the original becomes obsolete because a claim has been amended, no matter how minor the amendment. We accepted that all uplifted claims should conform to this policy. Invest NI acknowledged that the amount of £140,000 was ineligible. Invest NI worked with DETI EU Programmes to resolve this issue in the next draw down. 413 Did this lead to an irregularity If so, was it reported or recorded. No N/A No N/A Yes Reported BUILDING SUSTAINABLE PROSPERITY PROGRAMME VERSION 3 Key recommendations and subsequent actions for sub-Measures 1.1(a), 1.1(b) and 1.1(c) (cont’d) Reference Recommendation Number IAS 36/05 IAS 36/05 IAS 27/07 (A) IAS 27/07 (A) IAS 27/07 (A) 9. Local Direct Limited – Advance Payment. Recommendation: Management should establish from DETI European Programmes whether this expenditure complies with BSP EU eligibility requirements. If deemed ineligible then corrective action should be taken for this and any other grants of this nature 10. General – Roles and Responsibilities. Recommendation: Management should ensure that staff have clearly defined roles and responsibilities and that adequate written operational guidelines are in place to assist staff in the performance of their duties. 11. Availability of Project Files Recommendation: Management should ensure that all project files used to effect the drawdown of EC funding are available for inspection in a timely manner. Management should also ensure that the above files which could not be provided at the time of the review are urgently pursued. Files / projects which remain unavailable should be reported as irregularities. 12. Control Sheets Recommendation: Management should ensure that Letters of Offer are available for all projects in receipt of EC Funding. The above instances should be reviewed and, if appropriate, irregularities declared. 13. Article 4 Checklists not on file / not fully completed. Recommendation: Management should ensure that all Article 4 Checklists are fully completed, and signed off and dated by the officer carrying out the check. Action Taken Invest NI acknowledged that the employment grant paid to Local Direct Limited was an advance. However, when this claim was used to draw down EC funding all expenditure had been vouched and approved. Invest NI sought advice from DETI EU Programmes regarding this matter and were satisfied that the claim was eligible. Invest NI worked closely with DETI EU Programmes to ensure compliance with all the Regulations governing EU funding. We acknowledged we must ensure that the resources are in place to manage and administer EU funding. The EU Programmes team investigated the matter (2 files for review were unavailable). There is dispute between Serco and Iron Mountain as to where the files are located. EU programmes will continue to investigate the matter. Another Three missing files under the Green Economy scheme were located and passed onto the IAS team. When investigated, All Project files examined contained a Control Sheet. The project file in question, ST249-14209 Almac Diagnostics Cancer Diagnostics Products, was only included in BSP drawdown in March 2007 and was not part of the compliance exercise. Invest NI ensured that ensure that an Article 4 check was completed in respect of this project. 414 Did this lead to an irregularity If so, was it reported or recorded. No N/A No N/A No N/A No N/A No N/A BUILDING SUSTAINABLE PROSPERITY PROGRAMME VERSION 3 Key recommendations and subsequent actions for sub-Measures 1.1(a), 1.1(b) and 1.1(c) (cont’d) Reference Recommendation Number IAS 27/07 (A) IAS 27/07 (A) IAS 27/07 (B) IAS 27/07 (B) 14. EU Addendum to Letter of Offer. Recommendation: Management should ensure that Addendums to Letters of Offer and covering letters are placed on each project file. 15. Recording of Recordable Irregularities. Recommendation: Management should ensure that irregularities are identified and correctly recorded. (Three Irregularities highlighted in the report should be recalculated) 16. Database Reconciliation - tests revealed 1 instance where IAS was unable to reconcile the number of claims and / or amount paid to the client company with entries recorded on the database. • BSP M1.1b Growth Major Moy Park Ltd – 67 claims / 75 entries on database. Recommendation: Management should investigate the above instance and take corrective action, as appropriate. 17. Expenditure Pre-Dating 1 January 2000. Tests revealed one instance where £2,880.42 of expenditure relating to Xiomateria Limited – Novel Biomimetic Biomaterials (BSP M1.2 SMART reference number SM0017P1) is ineligible as it pre dates the starting point for eligible spend i.e.1st January 2000. Recommendation: Management should review the above claims and declare an irregularity, if appropriate. Action Taken The Audit revealed 4 instances where the Addendum to the Letter of Offer was not located on the project file. However, in these instances IAS had sight of a M1.1 database mail merge which included the 4 projects. In all other instances in the sample, the addendum was either on the file examined or the original letter of offer which issued already contained all the key clauses. This finding refers to recordable irregularities which have no impact on ERDF drawdown. Invest NI took on board the recommendation and recalculated the amounts. The 8 additional claims related to a different letter of offer and were removed from database and re-entered under a different reference. Management accepted that the above amount is ineligible and will declare an irregularity. 415 Did this lead to an irregularity If so, was it reported or recorded. No N/A No N/A No N/A Yes Recorded BUILDING SUSTAINABLE PROSPERITY PROGRAMME VERSION 3 Key recommendations and subsequent actions for sub-Measures 1.1(a), 1.1(b) and 1.1(c) (cont’d) Reference Recommendation Number IAS 27/07 (B) IAS 27/07 (B) IAS 27/07 (B) 18. Redeemable Preference Shares. Tests revealed that on three occasions Invest NI has included expenditure used to purchase redeemable preference shares as part of EC draw down. Upon advice from DFP European Division. Recommendation: Management should consider what impact the advice has in relation to the projects in question. 19. Write-Offs and Waivers. Tests revealed one client company included in the database draw down reports relating to BSP M 1.2 (Compete) which had been the subject of action taken in respect of a write-off and yet an irregularity had not been declared. Recommendation: Management should review the above amount and declare an irregularity, if appropriate. 20. Comparison of EC Database Entries with Oracle Financial Records. Tests revealed 6 entries where the database record could not be matched to an Oracle record. Recommendation: Management should review the above entries on the EC Database for accuracy and take action, as appropriate. Action Taken Invest NI is aware of the issue of redeemable preference shares that has previously been raised by EC Auditors. As stated above, Invest NI is currently awaiting advice from DFP European Division and will take appropriate action as and when this advice is received. In regards to this project, the amount £5990.40 is less than the reportable EUR 10,000 threshold as stipulated in Commission Regulation (EC) No 2035/2005 which came into effect on 1st Jan 2006. Management accepts it cannot locate any records in regards to the payments detailed above. We have searched on Oracle Financials and through hard copy requisitions without success. As there are inaccuracies in relation to the above entries on the EC Database with those held on Oracle, action will be taken to rectify this and progress reported to IAS. 416 Did this lead to an irregularity If so, was it reported or recorded. No N/A No N/A No N/A BUILDING SUSTAINABLE PROSPERITY PROGRAMME VERSION 3 Key recommendations and subsequent actions for sub-Measures 1.1(a), 1.1(b) and 1.1(c) (cont’d) Reference Number IAS 27/07 (B) IAS 27/07 (B) IAS 27/07 (B) Recommendation Action Taken 21. No supporting documents to support Claim Form. IAS could not locate any Claims Inspection Team (CIT) supporting documentation to substantiate £6,000 of expenditure claimed in relation to Sysco Software NI Limited - (BSP Measure 1.2 Growth Major reference number 01/0284). Recommendation: Management should ensure that CIT documentation (Calculation Sheets, Inspection Reports etc) are retained, located and filed as appropriate. On investigation, it was discovered that the £6,000 was an advance payment (50% of £12,000) made on the recommendation of the client executive, supported by the report of the ICT adviser who had inspected work to date (on site). There was a company claim form for this payment. The expectation would have been that a final claim would be submitted, at which point all documentation would be available for inspection, however, there is no evidence on file of such a claim arriving with Claims Inspectorate – further information was sought from the Client Executive to ascertain whether the project was completed and IAS advised of progress. 22. Claim Form corrections not properly amended. IAS noted that on approximately 20 occasions, the amount of expenditure recorded as being claimed on official claim forms had been changed. However, IAS noted that none of the changes had been properly evidenced. Recommendation: Management should ensure that all changes to amounts on Official Claim Forms are initialled and dated either by Client or CIT. 23. Uplifting of Claim Amounts. IAS testing revealed that on a number of occasions the amount of expenditure recorded as being claimed on official claim forms appeared to have been uplifted by CIT. This subsequently increased the expenditure on which EC draw down was calculated. Recommendation: Even if it is clear that the client has made an arithmetic error, under no circumstances should CIT uplift amounts claimed by clients. Management will reiterate to appropriate staff the need to adhere to our procedures (detailed below) for claim form corrections. There is now a change in policy. A revised auditor's certificate will always be required where the original becomes obsolete because a claim has been amended, no matter how minor the amendment. It's accepted that all uplifted claims should conform to this policy. 417 Did this lead to an irregularity Invest NI obtained appropriate timesheets this claim. has the If so, was it reported or recorded. N/A for No N/A No N/A BUILDING SUSTAINABLE PROSPERITY PROGRAMME VERSION 3 INTERNAL AUDIT ACTIVITY FOR MEASURE 1.2 The table below provides a record of internal audits carried out for Measure 1.2 Reference Number IAS 36/05 IAS 27/07 (A) IAS 27/07 (B) Title of Audit InvestNI EU Compliance Team - SMP: Internal Audit Service Report InvestNI EC Remedial Compliance Testing InvestNI EC Remedial Compliance Testing- Other Matters Arising Date of Audit Date Report received 9th January 2006 10th April 2006 DETI IAS December 2007/ January 2008 14th April 2008 2nd May 2008 DETI IAS December 2007/ January 2008 17th April 2008 15th May 2008 Audit Body DETI IAS Date of Response 3rd May 2006 418 BUILDING SUSTAINABLE PROSPERITY PROGRAMME VERSION 3 Key recommendations and subsequent actions for Measure 1.2 Reference Number IAS 36/05 IAS 36/05 IAS 36/05 IAS 36/05 Recommendation 1. Remedial Action concerning Letter of Offer (LoO) clauses. Recommendation: Management should ensure that sufficient evidence is available to demonstrate that addendums have been issued to clients and that same is associated with the original LoO for all projects in receipt of or to be used to effect future EC drawdown. 2. Remedial action concerning Article 4 requirements. Recommendation: Management should ensure that all appropriate Article 4 checks and associated checklists are fully completed, signed off and returned to the EU Compliance Team and / or associated with the project file. 3. Recording of pre-payment irregularities. Recommendation: Management should conduct an exercise to determine whether the list of irregularities recorded is accurate and complete. This exercise should be confined to those claims which have been used to attract EC drawdown 4. Accuracy and completeness of database entries. Recommendation: Management, in conjunction with RMA Systems, should take appropriate steps to identify the extent of action required to ensure that all essential database fields are adequately and accurately populated Action Taken Invest NI completed an exercise to ensure that all Letters of Offer, against which EU funds were drawn down, were issued with addendums. Invest NI carried out an exercise to ensure that Article 4 checks were completed for all Letters of Offer against which EU funds were drawn down. In order to address the apparent discrepancies, Invest NI conducted an exercise to determine if the list of irregularities was accurate and complete Invest NI populated the database with information on project performance indicators. Staff undertook to include information on project start and end dates and total eligible project costs. 419 Did this lead to an irregularity? If so, was it reported or recorded? No N/A No N/A No N/A No N/A BUILDING SUSTAINABLE PROSPERITY PROGRAMME VERSION 3 Key recommendations and subsequent actions for Measure 1.2 (cont’d) Reference Number IAS 36/05 IAS 36/05 IAS 36/05 Recommendation Action Taken Did this lead to an irregularity? If so, was it reported or recorded? 5. Extent to which trigger point expenditure has been utilised to draw down EU funds. Recommendation: Management should provide DETI with the findings from the trigger point exercise to inform future decision making regarding this issue. 6. Accuracy of Invest NI internal supporting documentation used for EC Drawdown. Recommendation: Management, in conjunction with the branches responsible for the information contained in the various databases, should ensure that there are adequate controls in place to validate the accuracy of figures i.e. a supervisory check of database entries should be performed against an Oracle report prior to the database information being uploaded. In order to establish the element of grant which paid on the basis of triggers, Invest NI analysed the Letters of Offers contained in Annex B of the Report. This has been an ongoing exercise which has highlighted Irregularities. Yes Reported No N/A No N/A 7. Uplifting of Grant Claims. Recommendation: Management should establish whether this expenditure complies with EC eligibility requirements. If deemed ineligible then corrective action should be taken. Invest NI carried out various remedial exercises which helped to ensure the accuracy of supporting documentation. Along with supervisory checks of database entries, there was also the Article 4 compliance exercise and the Trigger Points exercise. Claims Inspection Branch policy was to only pay grant against properly completed claims which had correct auditor's certificates, where these are required ( i.e. as set out in more recent offers ). This, in practice, means that during a site inspection the appropriate company representative could amend and sign the original claim to reflect any revision. Obviously this procedure could not apply to any desk inspection case or to any site inspection case where a revised auditor's certificate would be necessary. To avoid any doubt, a revised auditor's certificate will always be required where the original becomes obsolete because a claim has been amended, no matter how minor the amendment. We accepted that all uplifted claims should conform to this policy. 420 BUILDING SUSTAINABLE PROSPERITY PROGRAMME VERSION 3 Key recommendations and subsequent actions for Measure 1.2 (cont’d) Reference Number IAS 36/05 IAS 27/07 (A) IAS 27/07 (A) Recommendation Action Taken 8. General – Roles and Responsibilities. Recommendation: Management should ensure that staff have clearly defined roles and responsibilities and that adequate written operational guidelines are in place to assist staff in the performance of their duties. 9. Availability of Project Files. Recommendation: Management should ensure that all project files used to effect the drawdown of EC funding are available for inspection in a timely manner. Management should also ensure that the above files which could not be provided at the time of the review are urgently pursued. Files / projects which remain unavailable should be reported as irregularities. Invest NI worked closely with DETI EU Programmes to ensure compliance with all the Regulations governing EU funding. We acknowledged that going forward we must ensure that the resources are in place to manage and administer EU funding. The EU Programmes team investigated the matter (2 files for review were unavailable). There is dispute between Serco and Iron Mountain as to where the files are located. EU programmes will continue to investigate the matter. Another Three missing files under the Green Economy scheme were located and passed onto the IAS team. 10. Control Sheets Recommendation: Management should ensure that Letters of Offer are available for all When investigated, All Project files examined projects in receipt of EC Funding. The above contained a Control Sheet. instances should be reviewed and, if appropriate, irregularities declared. 421 Did this lead to an irregularity? If so, was it reported or recorded? No N/A No N/A No N/A BUILDING SUSTAINABLE PROSPERITY PROGRAMME VERSION 3 Key recommendations and subsequent actions for Measure 1.2 (cont’d) Reference Number Recommendation Action Taken Did this lead to an irregularity? If so, was it reported or recorded? IAS 27/07 (A) 11. Article 4 Checklists not on file / not fully completed. Recommendation: Management should ensure that all Article 4 Checklists are fully completed, and signed off and dated by the officer carrying out the check. The project file in question, ST249-14209 Almac Diagnostics Cancer Diagnostics Products, was only included in BSP drawdown in March 2007 and was not part of the compliance exercise. Invest NI ensured that ensure that an Article 4 check was completed in respect of this project. No N/A IAS 27/07 (A) The Audit revealed 4 instances where the Addendum to the Letter of Offer was not 12. EU Addendum to Letter of Offer. located on the project file. However, in these Recommendation: Management should ensure instances IAS had sight of a M1.1 database that Addendums to Letters of Offer and mail merge which included the 4 projects. In all covering letters are placed on each project file. other instances in the sample, the addendum was either on the file examined or the original letter of offer which issued already contained all the key clauses. No N/A IAS 27/07 (A) 13. Recording of Recordable Irregularities. Recommendation: Management should ensure that irregularities are identified and correctly recorded. (Three Irregularities highlighted in the report should be recalculated) No N/A This finding refers to recordable irregularities which have no impact on ERDF drawdown. Invest NI took on board the recommendation and recalculated the amounts. 422 BUILDING SUSTAINABLE PROSPERITY PROGRAMME VERSION 3 Key recommendations and subsequent actions for Measure 1.2 (cont’d) Reference Number IAS 27/07 (B) IAS 27/07 (B) IAS 27/07 (B) Recommendation Action Taken 14. Expenditure Pre-Dating 1 January 2000. Tests revealed one instance where £2,880.42 of expenditure relating to Xiomateria Limited – Novel Biomimetic Biomaterials (BSP M1.2 SMART reference number SM0017P1) is Management accepted that the above amount ineligible as it pre dates the starting point for is ineligible and will declare an irregularity. eligible spend i.e.1st January 2000. Recommendation: Management should review the above claims and declare an irregularity, if appropriate. 15. Redeemable Preference Shares. Tests revealed that on three occasions Invest NI has included expenditure used to purchase redeemable preference shares as part of EC draw down. Recommendation: Management should consider what impact the advice has in relation to the projects in question. InvestNI is aware of the issue of redeemable preference shares that has previously been raised by EC Auditors. As stated above, InvestNI is currently awaiting advice from the Managing Authority and will take appropriate action as and when this advice is received. 16. Write-Offs and Waivers. Tests revealed one client company included in the database draw down reports relating to BSP M 1.2 (Compete) which had been the subject of action taken in respect of a write-off and yet an irregularity had not been declared. Recommendation: Management should review the above amount and declare an irregularity, if appropriate. In regards to this project, the amount £5990.40 is less than the reportable EUR 10,000 threshold as stipulated in Commission Regulation (EC) No 2035/2005 which came into effect on 1st Jan 2006. 423 Did this lead to an irregularity? If so, was it reported or recorded? Yes Recorded No N/A No N/A BUILDING SUSTAINABLE PROSPERITY PROGRAMME VERSION 3 Key recommendations and subsequent actions for Measure 1.2 (cont’d) Reference Number Recommendation Action Taken IAS 27/07 (B) 17. Comparison of EC Database Entries with Oracle Financial Records. Tests revealed 6 entries where the database record could not be matched to an Oracle record. Recommendation: Management should review the above entries on the EC Database for accuracy and take action, as appropriate. IAS 27/07 (B) 18. No supporting documents to support Claim Form. IAS could not locate any Claims Inspection Team (CIT) supporting documentation to substantiate £6,000 of expenditure claimed in relation to Sysco Software NI Limited - (BSP Measure 1.2 Growth Major reference number 01/0284). Recommendation: Management should ensure that CIT documentation (Calculation Sheets, Inspection Reports etc) are retained, located and filed as appropriate. Management accepts it cannot locate any records in regards to the payments detailed above. A search was carried out on Oracle Financials and through hard copy requisitions without success. As there are inaccuracies in relation to the above entries on the EC Database with those held on Oracle, action will be taken to rectify this and progress reported to IAS. On investigation, it was discovered that the £6,000 was an advance payment (50% of £12,000) made on the recommendation of the client executive, supported by the report of the ICT adviser who had inspected work to date (on site). There was a company claim form for this payment. The expectation would have been that a final claim would be submitted, at which point all documentation would be available for inspection, however, there is no evidence on file of such a claim arriving with Claims Inspectorate – further information was sought from the relevant Client Executive to ascertain whether the project was completed and IAS advised of progress. 424 Did this lead to an irregularity? If so, was it reported or recorded? No N/A Invest NI has obtained the appropriate timesheets for this claim. N/A BUILDING SUSTAINABLE PROSPERITY PROGRAMME VERSION 3 The table below details the key recommendations and subsequent actions for Measure 1.2 (cont’d) Reference Number IAS 27/07 (B) IAS 27/07 (B) Action Taken Did this lead to an irregularity? If so, was it reported or recorded? Management will reiterate to appropriate staff the need to adhere to our procedures (detailed below) for claim form corrections. No N/A No N/A Recommendation 19. Claim Form corrections not properly amended. IAS noted that on approximately 20 occasions, the amount of expenditure recorded as being claimed on official claim forms had been changed. However, IAS noted that none of the changes had been properly evidenced. Recommendation: Management should ensure that all changes to amounts on Official Claim Forms are initialled and dated either by the Client or CIT. 20. Uplifting of Claim Amounts. IAS testing revealed that on a number of occasions the amount of expenditure recorded as being claimed on official claim forms appeared to have been uplifted by CIT. This subsequently increased the expenditure on which EC draw down was calculated. Recommendation: Even if it is clear that the client has made an arithmetic error, under no circumstances should CIT uplift amounts claimed by clients. There is now a change in policy. A revised auditor's certificate will always be required where the original becomes obsolete because a claim has been amended, no matter how minor the amendment. It's accepted that all uplifted claims should conform to this policy. 425 BUILDING SUSTAINABLE PROSPERITY PROGRAMME VERSION 3 INTERNAL AUDIT ACTIVITY FOR MEASURE 1.3(a) The table below provides a record of internal audits carried out for sub-Measure 1.3(a) Reference Number Title of Audit Audit Body Date of Audit Date Report received Date of Response IAS 49/03 Marketing Communications DETI IAS February 2004 24 April 2004 21 January 2005 IAS 06/05 Marketing Communications DETI IAS June 2005 20 September 2005 17 November 2005 426 BUILDING SUSTAINABLE PROSPERITY PROGRAMME VERSION 3 Key recommendations and subsequent actions for Measure 1.3(a) Reference Number IAS 49/03 IAS 06/05 IAS 06/05 IAS 06/05 IAS 06/05 Recommendation 7.2 – Remedial action to be taken by NITB to reconcile payment records against details of expenditure reported by them to European Programmes. 4.6 - Memo of Understanding (MoU) should be put in place with Tourism Ireland on the organisation of Familiarisation (FAM) Trips. 4.8 - Improvement of evaluation procedures for FAM trips. 4.11- Separation of duties in payment process. 4.13 – File notes to cover departures from Finance Manual. 427 Action Taken Did this lead to an irregularity? Agreed – remedial action undertaken. No Agreed – MoU put in place. No Agreed –Put in place as part of MoU. Agreed – Process reinforced to all staff. Agreed – Process reinforced to all staff. No No No If so, was it reported or recorded? BUILDING SUSTAINABLE PROSPERITY PROGRAMME VERSION 3 INTERNAL AUDIT ACTIVITY FOR MEASURE 1.3(b) The table below provides a record of internal audits carried out for sub-Measure 1.3(b) Reference Number Title of Audit Audit Body Date of Audit Date Report received Date of Response IAS 55/03 NITB Business Development DETI IAS April 2004 28 June 2004 21 January 2005 IAS 08/05 NITB Funding & Monitoring Unit DETI IAS April 2006 9 June 2006 10 July 2006 IAS 29/06 NITB Monitoring DETI IAS March 2007 30 April 2007 12 June 2007 428 BUILDING SUSTAINABLE PROSPERITY PROGRAMME VERSION 3 Key recommendations and subsequent actions for Measure 1.3(b) Reference Number IAS 55/03 IAS 08/05 IAS 29/06 Recommendation Action Taken Article 4 visits undertaken and files and checklists completed Standard EU conditions of Revised LoO template grant to be included in Letters developed and amended of Offer LoOs issued to relevant projects Completion of Post Project Programme of PPE work Evaluations developed and implemented Completion of Article 4 checks 429 Did this lead If so, was it to an reported or irregularity? recorded? No N/A No N/A No N/A BUILDING SUSTAINABLE PROSPERITY PROGRAMME VERSION 3 INTERNAL AUDIT ACTIVITY FOR MEASURE 1.4 The table below provides a record of internal audits carried out for Measure 1.4 Reference Number IAS 7/03 IAS 41/05 VU BSP 03/07 BSP 01/2005 BSP 03/2008 Title of Audit European Programmes – Building Sustainable Prosperity European ProgrammesBuilding Sustainable Prosperity Start a Business Programme District Council Action Plans Audit Body Date of Audit Date Report received DETI IAS June/July 2003 17 October 2003 3 March 2004 DETI IAS 2005 May 2006 May 2006 2006 March 2007 March 2007 August 2004March 2005 July 2005 July 2005 2008 November 2008 February 2009 DETI Verification Unit DETI Verification Unit Local Economic DETI Development Verification Unit 430 Date of Response BUILDING SUSTAINABLE PROSPERITY PROGRAMME VERSION 3 Key recommendations and subsequent actions for Measure 1.4 Reference Number IAS 07/03 IAS 07/03 IAS 07/03 IAS 07/03 IAS 07/03 IAS 07/03 IAS 41/05 Recommendation Did this lead to an irregularity? Action Taken 4.3 – European Programmes to Agreed – establish a programme of Article 4 established. checks. Visit schedule 5.3 -5.6 – Recommendations on retention of signed Selection Committee forms; approval of Agreed – All actioned. claims checklists by supervisors; date stamping of claims; and full/valid invoice details are entered on claims forms. 5.8 – Items of expenditure should fall within period specified in claim 6.2 – European Programmes should provide clear guidance to District Councils on irregularities. 7.4 – Ensure that checks on the accuracy of data input to expenditure spreadsheets are evidenced. 7.5 – Ensure that constant values within expenditure spreadsheets are protected. 1 – Outstanding Article 4 checks on Implementing Bodies should be completed as a matter of urgency. No No Agreed – New system put in No place. Agreed – Improved systems put in place. No Agreed – Supervisory checks put No in place. Agreed – Implemented. No Agreed – Visit schedule put in place. No 431 If so, was it reported or recorded? BUILDING SUSTAINABLE PROSPERITY PROGRAMME VERSION 3 Key recommendations and subsequent actions for Measure 1.4 (cont’d) Reference Number Recommendation Action Taken Did this lead to an irregularity? Systems and procedures should be amended to ensure that payments are made on the basis actual expenditure, not achievement of targets. Specific recommendations were brought to attention of District Councils, irregularities raised and ERDF recovered as appropriate. Systemic failings relating to document retention, irregularity Yes reporting, Management Checks, Database monitoring requirements and Third Party LoO compliance were raised and followed up as appropriate. Procedures amended, monies recovered in respect of two councils. For other councils, Yes additional business start-ups were identified to cover shortfall That Councils be reminded to retain project documentation until 2013 BSP 03/08 That recovery action be instigated – Finding 3 in respect of double funding. All Councils reminded by e-mail in Feb 09 to retain documentation No until 2013. Claw back sought from Armagh Yes City Council BSP 01/05 VU BSP 03/07 BSP 03/08 – Finding 1 Systems operated by European Programmes were found to be compliant with EC Regulations. Systems operated by District Councils were not fully compliant, at both project and systemic level. 432 If so, was it reported or recorded? Recorded and reported as appropriate. Recorded Recorded BUILDING SUSTAINABLE PROSPERITY PROGRAMME VERSION 3 INTERNAL AUDIT ACTIVITY FOR MEASURE 1.5 The table below provides a record of internal audits carried out for Measure 1.5 Reference Number IAS 36/05 IAS 27/07 (A) Title of Audit Audit Body Invest NI EU DETI IAS Compliance Team – SMP:IAS Report Invest NI EC DETI IAS Remedial Compliance 433 Date Report received Date of Response 9 January 2006 10 April 2006 August 2008 December 2007/ January 2008 17 April 2008 August 2008 Date of Audit BUILDING SUSTAINABLE PROSPERITY PROGRAMME VERSION 3 Key recommendations and subsequent actions for Measure 1.5 Reference Number IAS 36/05 and IAS 27/07 (A) Recommendation Action Taken - Incomplete Article 4 checks/visits - File documentation incomplete - Lack of supporting documentation to back up claims. - Incorrect expenditure recorded on the database. Invest NI formed an EU Compliance Team and undertook a major exercise of remedial work to address issues raised during audits. This report was copied to DG REGIO. 434 Did this lead to an irregularity? If so, was it reported or recorded Yes Reported BUILDING SUSTAINABLE PROSPERITY PROGRAMME VERSION 3 INTERNAL AUDIT ACTIVITY FOR MEASURE 1.6 (a) The table below provides a record of internal audits carried out for sub-Measure 1.6(a) Reference Number Title of Audit Audit Body Date of Audit Date Report received Date of Response 2003 Period EU Article 10 DRD IAS Checks April 2005 5 April 2005 6 April 2005 2004 Period EU Article 10 DRD IAS Checks December 2005 13 December 2005 11 January 2006 2005 Period EU Article 10 DRD IAS Checks April 2007 23 April 2007 2006 Period EU Article 10 DRD IAS Checks April 2008 30 April 2007 N/A (no recommendations made) 19 May 2007 435 BUILDING SUSTAINABLE PROSPERITY PROGRAMME VERSION 3 Key recommendations and subsequent actions for Measure 1.6(a) Reference Number Recommendation 2003 Period Report Ref - 2.1.3 & 2.2.3 2004 Period Report Ref - 2.1.2 & 2.2.2 2005 Period Carry out Article 4 checks 2006 Period Report Ref - 2.1.2 & 2.2.2 Review procedures document retention Action Taken Did this lead to an irregularity? If so, was it reported or recorded? No N/A No N/A No N/A No N/A Completed Feb 2005 for Reviewed Dec 2005 No Formal Recommendations Made - satisfactory Reconfigure EU Database Completed May 2008 entries to reflect the year in which expenditure occurred 436 BUILDING SUSTAINABLE PROSPERITY PROGRAMME VERSION 3 INTERNAL AUDIT ACTIVITY FOR MEASURE 1.6 (b) The table below provides a record of internal audits carried out for sub-Measure 1.6(b) Reference Number PPT15/02/04/01 PPT15/02/04/01 PPT15/02/04/02 PPT15/02/04/04 PPT15/02/04/05 Title of Audit IA review of EU Structural Funds BSP Article 10 Verification of EU Project Expenditure 2004 Article 10 Verification of EU Project Expenditure 2005 Article 10 Verification of EU Project Expenditure 2006 Article 10 Verification of EU Project Expenditure 2007 Audit Body Date of Audit Date Report received Date of Response DRD IAS 28 October 2004 8 November 2004 19 November 2004 DRD IAS 29 November 2005 26 May 2006 31 May 2006 DRD IAS 23 January 2007 1 May 2007 8 May 2007 DRD IAS 25 September 2007 17 October 2007 19 October 2007 DRD IAS 11 January 2008 25 November 2008 22 December 2008 437 BUILDING SUSTAINABLE PROSPERITY PROGRAMME VERSION 3 Key recommendations and subsequent actions for Measure 1.6(b) Reference Number PPT15/02/04/01 PPT15/02/04/01 PPT15/02/04/02 PPT15/02/04/03 PPT15/02/04/04 Recommendation Action Taken Management to provide formal feedback on findings from Article 4 visits. Recommendation implemented To ensure that third parties are fully aware of their obligations on reporting irregularities Recommendation implemented No formal recommendations None Required were made No formal recommendations None Required were made No formal recommendations None Required were made No formal recommendations None Required were made 438 Did this lead to an irregularity? If so, was it reported or recorded? No N/A No N/A N/A N/A N/A N/A BUILDING SUSTAINABLE PROSPERITY PROGRAMME VERSION 3 INTERNAL AUDIT ACTIVITY FOR MEASURE 1.7 The table below provides a record of internal audits carried out for Measure 1.7 Reference Number Title of Audit Audit Body Date of Audit Date Report received Date of Response IAS 34/03 Telecommunications DETI IAS Policy Branch 2003 2003 March 2004 IAS 04/05 Telecommunications DETI IAS Policy Unit 2005 2005 2005 BSP02/2005 Article 10 DETI IAS May-August 2005 September 2005 BSP02/2008 Article 10 DETI IAS August- December 2007 March 2008 439 BUILDING SUSTAINABLE PROSPERITY PROGRAMME VERSION 3 Key recommendations and subsequent actions for Measure 1.7 Reference Number IAS 34/03 IAS 34/03 IAS 34/03 IAS 04/05 BSP02/2005 BSP02/2005 BSP02/2005 BSP02/2005 Action Taken Did this lead to an irregularity? Accepted – Letters of Offer amended. No Accepted – Article 4 checklist obtained. No Accepted – Procedures adopted. Accepted – Processes put in place regarding monitoring reports. Data reviewed and corrected on databases. Advice accepted and work plan in place to update monitoring data. In-house procedures updated. Training updates implemented. Discussion with DETI EU Branch. IN house procedures updated. Training updates given to relevant staff. TPU to begin process to recover expenditure. Article 4 programme for supported projects was organised and commenced based on DFP and EU Branch guidance. Training for relevant staff in undertaking Article 4 checks completed. Notification sent to projects re key clauses. No No Recommendation 4.3 All future Letters of Offer should contain all standard clauses and sufficient information on key deliverables/timetables. 6.2 Liaise with European Programmes Branch on Article 4 requirements. 6.3 Liaise with European Programmes Branch on responsibilities relating to irregularities. 4.2 Conditions of contract should be met before payments are made. BSP DATABASE: Full review and update of data held on databases. Procedures to be put in place to record performance monitoring data on a regular and timely basis. NOTIONAL LABOUR COSTS: Branch to liaise with EUPB to resolve Notional labour charges with 16 projects, this expenditure was not eligible. MANAGEMENT CHECKS: Established monitoring controls not compliant with EC Reg Article 4 and DFP guidance. Partly due to the delay in obtaining clarification on the requirements. LETTERS OF OFFER: Did not contain all the standard clauses as required in the Operating Manual for Structural Funds. To notify projects. 440 If so, was it reported or recorded? No Yes No No Yes BUILDING SUSTAINABLE PROSPERITY PROGRAMME VERSION 3 Key recommendations and subsequent actions for Measure 1.7 (cont’d) Reference Number BSP02/2005 BSP02/2005 BSP02/2005 BSP02/2005 Recommendation Action Taken No payments in relation to WC for monitoring of BS delivery have been logged on the BSP database. TPU PAYMENTS TO WESTERN CONNECT: Costs should not be drawn down against discussed with EU Branch and no programme costs and the branch should allocation available to match this discuss with EP if these costs could be expenditure under technical assistance. TPU no seeking support from EU for charged to technical assistance. technical assistance. INFORMATION ON DATABASE: The branch should liaise with EP Branch about adjusting the database to show that this direct BSP database updated. spend by telecoms and not an application for grant by BT Investigation conducted. Project was 1st project submitted for consideration and STATE AID LIMIT: BBF001/02 influenced decisions on how to support This project exceeded limit of fund and is in further projects. No state issues breech of state aid rules. Branch to discuss regarding support for this project and is with EP Branch. compatible with EU guidelines. Financial limits were set after agreeing to support this project. TENDERED SERVICE: BBF025/02 Initial proposal was made by invest NI LoO should have been issues to Invest NI for who procured the project as outlined. It a % of the eligible costs who would have then was agreed that TPU would administer funded Western Connect directly. TPU to liaise the project more efficiently and so was with EP Branch. transferred to TPU. 441 Did this lead to an irregularity? If so, was it reported or recorded? No No No Yes Yes BUILDING SUSTAINABLE PROSPERITY PROGRAMME VERSION 3 INTERNAL AUDIT ACTIVITY FOR MEASURE 1.8(a) The table below provides a record of internal audits carried out for sub-Measure 1.8(a) Reference Number Title of Audit Audit Body Date of Audit Date Report received Date of Response Gas Pipeline Project NIAO 15/07/2004 16 December 2004 Not applicable as no issues raised IAS 37/04 NI Gas Pipeline DETI IAS 2004 2004 2005 BSP 04/2007 NI Gas North West Pipeline Project DETI Verification Team 18 September 2007 See detail of issues raised below May – July 2007 442 BUILDING SUSTAINABLE PROSPERITY PROGRAMME VERSION 3 Key recommendations and subsequent actions for Measure 1.8(a) Reference Number IAS 37/04 IAS 37/04 IAS 37/04 Recommendation 4.1 Letters of Offer should detail eligible expenditure. 4.2 Confirm that there is no overlap between costs incurred on overhead charges and ‘Serviced Offices’ costs. Technical Monitoring – Provision of documentation in respect of technical fitness of pipeline. IAS 37/04 4.4 Audit Certificates should provide copies of certificates as set out in Letter of Offer. IAS 37/04 4.5 Clawback; Disposal of publicly funded assets. IAS 37/04 4.6 Eligibility of items claimed. BSP 04/2007 Grant and ERDF Percentage - An overdeclaration of £3,340,538 has occurred and an irregularity should now be declared unless further claims can be obtained and vouched Action Taken If so, was Did this it reported lead to an or irregularity? recorded? Accepted – Verified forecast of capital expenditure agreed with project. Future LoO’s will reference items of eligible expenditure. No Accepted. Agreed with project that ‘heat and light’ costs were not eligible under overheads. No Accepted – The Department’s technical advisors were satisfied with documentation from project. No No Accepted – Documentation provided. Accepted – Future Letters of Offer will take account of the revision in guidance in DAO 16/05. Accepted – Review of claims completed. Management is not content to accept this finding. The ERDF was drawn down against public expenditure as per the BSP Complement. There is sufficient public expenditure to justify the £11.1m of ERDF claimed at the agreed intervention rate of 74.66%. EU Programmes Branch advise that the ERDF rate of 17.14 % quoted was shown to the Commission for purely presentational purposes to demonstrate how small the ERDF contribution was in terms of the overall project. 443 No No No, this is no longer an issue. BUILDING SUSTAINABLE PROSPERITY PROGRAMME VERSION 3 Key recommendations and subsequent actions for Measure 1.8(a) (cont’d) Reference Number IAS 37/04 BSP 04/2007 BSP 04/2007 Recommendation 4.1 Letters of Offer should detail eligible expenditure. Action Taken Accepted – Verified forecast of capital expenditure agreed with project. Future LoO’s will reference items of eligible expenditure. ROI Contribution - Energy Branch should confirm that the calculation of the ROI contribution to the North West Pipeline as set out at Appendix 2 Section 2 is correct. If so, and if as recommended at Finding No1 additional claims are obtained and vouched, an irregularity of at least £1,223,216 will remain. Management do not accept the basis for this calculation at Appendix 2 Section 2, but more importantly, do not accept that the contribution from the Irish Republic should impact on the amount of ERDF drawdown against the project. EU Programmes advise that the EC were unable to approve the overall SN/NW pipeline because the SN pipeline went through another Member State i.e. the Irish Republic. This was the reason that the EC only approved the NW element. It would be unreasonable for NI to be penalised again by reducing the ERDF further because of the RoI contribution. This contribution was towards the overall SN/NW pipeline project and there should not simply be a pro-rata calculation between the two elements of grant paid. - The database should be adjusted to record only eligible grant at the effective grant rate of 22.9574% of final vouched expenditure. Management is not content to accept this finding. The ERDF was drawn down against public expenditure as per the BSP Complement. There is sufficient public expenditure to justify the £11.1m of ERDF claimed at the agreed intervention rate of 74.66%. EU Programmes Branch advise that the ERDF rate of 17.14 % quoted was shown to the Commission for purely presentational purposes to demonstrate how small the ERDF contribution was in terms of the overall project. 444 If so, was Did this it reported lead to an or irregularity? recorded? No DFP, as Managing Authority, is content that following communication s with the Commission that the RoI Government contribution should not be taken into consideration in calculating the grant due to NI. No – this is no longer an issue as the DETI IAS Verification Unit has now accepted the rationale BUILDING SUSTAINABLE PROSPERITY PROGRAMME VERSION 3 Key recommendations and subsequent actions for Measure 1.8(a) (cont’d) Reference Number BSP 04/2007 IAS 37/04 BSP 04/2007 BSP 04/2007 BSP 04/2007 Recommendation Did this If so, was it lead to an reported or irregularity? recorded? Action Taken Verification of Declared Expenditure The relevant grant amount of £108.35 (at an effective grant rate of 22.957%) should be recorded as an irregularity and removed from the database An amount of £108.35 will be recorded as an irregularity and removed from database. 4.1 Letters of Offer should detail eligible expenditure. Accepted – Verified forecast of capital expenditure agreed with project. Future LoO’s will reference items of eligible expenditure. No A copy invoice in pdf format for the amount of £5,708.72 based on 22.957% of €35,142.77 has been received from BGE. This will be recorded as an irregularity and removed from the database, if a certified copy invoice, is not finally received from BGE. No A certified copy invoice in pdf format for the amount of £934,990.44 based on 22.957% of £4,072,717.99 has been received from BGE No Verification of Declared Expenditure The grant amount of £5,708.72 (at an effective grant rate of 22.957%), should be reported as an irregularity and removed from the database pending receipt of the certified copy invoice Verification of Declared Expenditure The grant amount of £934,990.44 (at an effective grant rate of 22.957%), should be reported as an irregularity and removed from the database pending receipt of the certified copy invoice. Verification of Declared Expenditure The grant amount of £23.54 (at an effective grant rate of 22.957%), should be recorded as an irregularity and removed from the database An amount of £23.54 will be recorded as an irregularity and removed from database. 445 Yes Yes Recorded by EU Programmes for Energy Division Recorded by EU Programmes for Energy Division BUILDING SUSTAINABLE PROSPERITY PROGRAMME VERSION 3 INTERNAL AUDIT ACTIVITY FOR MEASURE 1.8(b) The table below provides a record of internal audits carried out for sub-Measure 1.8(b) Reference Number IAS 48/03 BSP 02/2004 Title of Audit DETI – Energy Demonstration Scheme Article 10 Check of BSP Measure 1.8b Energy Demonstration Scheme. Audit Body Date of Audit Date Report received Date of Response DETI IAS 2003 2004 DETI Verification Unit November 2004 September 2005 September 2005 446 2005 BUILDING SUSTAINABLE PROSPERITY PROGRAMME VERSION 3 Key recommendations and subsequent actions for Measure 1.8(b) Reference Number IAS 48/03 IAS 48/03 IAS 48/03 IAS 48/03 IAS 48/03 IAS 48/03 IAS 48/03 IAS 48/03 BSP 02/2004 BSP 02/2004 BSP 02/2004 Recommendation Action Taken Agreed – The Energy Demonstration Scheme has finished in its current format and DETI now seeks 4.2- Clear guidelines to be produced to to encourage the efficient demonstration of assist selection panels. renewable energy technologies on a more selective basis with major organisations. 4.3 – Selection Panel Decisions should Agreed – Appeals procedure similar to Interreg be fully documented and a formal IIIA will be introduced. appeals procedure introduced. 4.5 – Economic Appraisals – should full Agreed – All energy schemes will conform in conform with DETI Guidance future. 5.3 – Improvements to Letters of Offer. Agreed – Letters of Offer will comply with EC Structural Funds Manual 6.2,6.3 &6.4 – Improvements to claims Agreed – All recommendations on stamping procedures/forms/verification invoices, standardising claim forms and checks on second hand equipment will be implemented. 7.2 – Establish a system for Agreed- Programme of visits will be developed management checks on projects and and outcome data collate. recording outcomes. 8.2 – Ensure that all projects comply Agreed – Energy to liaise with European with EC publicity requirements Programmes. 8.3- Ensure that Article 4 and Agreed - Energy to liaise with European Irregularity requirements are met. Programmes. No evidence of Environmental Impact System put in place to ensure that all project Assessments (EIA) having been carried appraisals include an EIA. out. Some standard clauses not included in Energy Division agreed to undertake remedial Letters of Offer. work. Erne Graphics project - Ineligible Irregularity raised expenditure. 447 If so, was Did this it reported lead to an or irregularity? recorded? No No No No No No No No No No Yes Recorded BUILDING SUSTAINABLE PROSPERITY PROGRAMME VERSION 3 INTERNAL AUDIT ACTIVITY FOR MEASURE 2.5 The table below provides a record of internal audits carried out for sub-Measure 2.5 Reference Number None None Title of Audit Audit Body Internal Audit DE IAS Report on EU Structural Funds Internal Audit DE IAS Report on EFU (BSP Section) 448 Date of Audit Date Report received Date of Response April 2004 25 May 2004 8 June 2004 March-May 2008 22 May 2008 30 June 2008 BUILDING SUSTAINABLE PROSPERITY PROGRAMME VERSION 3 Key recommendations and subsequent actions for Measure 2.5 Reference Number Recommendation Action Taken DE Internal Audit Ref. 6.3 That a supervisory process should be Branch checking put in place for the database and project procedures reviewed files DE Internal Audit Ref. 6.7 That branch working practices should be A branch procedures reviewed and appropriately documented manual was developed by December 2004 That Article 4 checks should be begun as soon as possible Article 4 checks began in July 2004 That arrangements should be made to External auditors were commission Article 10 checks engaged and Article 10 work began in late 2004. That evidence is retained to demonstrate the decision-making Processes were formally process in assessing applications documented That processes and procedures for As closure continues, the programme closure should be put in branch will ensure that place appropriate processes are developed DE Internal Audit Ref. 6.10 DE Internal Audit Ref. 6.12 DE Internal Audit Ref. 6.14 DE Internal Audit on BSP 2008 Ref. 10.6 449 Did this If so, was lead to an it reported irregularity? or recorded? No N/A No N/A No N/A No N/A No N/A No N/A BUILDING SUSTAINABLE PROSPERITY PROGRAMME VERSION 3 INTERNAL AUDIT ACTIVITY FOR MEASURE 3.1 The table below provides a record of internal audits carried out for sub-Measure 3.1 Reference Number Title of Audit Audit of Measure 3.1 Audit Body Date of Audit Date Report received Date of Response BSP DSD IAS 8 April 2003 – 9 May 2003 18 November 2003 25 February 2005 Follow up Audit of BSP Measure 3.1 DSD IAS 20 May 2004 – 21 December 2004 27 February 2008 28 February 2008 SAN 5180 Article 4 Arrangements DSD IAS 2004-2005 12 November 2005 17 February 2006 Approx SAN 5180 Follow-up Article 4 arrangements DSD IAS 2006-2007 15 February 2007 28 February 2007 SAN 5160 EU Verification Unit DSD IAS 2006-2007 30 March 2007 25 May 2007 SAN 5160 Review of EU Verification Unit DSD IAS 2003-2004 28 April 2004 25 May 2004 Approx SAN 5162 EUVU Repeformance Testing EU Irregularities Process DSD IAS 2004-2005 20 January 2005 18 February 2005 Approx DSD IAS 2006-2007 15 February 2007 23 May 2007 450 BUILDING SUSTAINABLE PROSPERITY PROGRAMME VERSION 3 Key recommendations and subsequent actions for Measure 3.1 Reference Number Measure 3.1 Follow-Up to M3.1 SAN 5180 Audit Of Article 4 Arrangements Recommendation Did this If so, was lead to an it reported irregularity? or recorded? Action Taken Timeliness of Delivery (a) Management should urgently seek to progress action taken to date with regard to the identification of suitable projects. (b) Senior management support should be sought to assist with this task and consideration should be given to the establishment of formal protocols setting out targets for exchange of information, etc. Issues regarding: Accountability for Programme Spend Maintenance of Financial Records Management Information Programme Monitoring. Four of the previous recommendations were implemented and operating effectively, 2 were implemented in part, and 2 were no longer applicable. Management should review the management/supervisory checks conducted over Article 4 visits completed by the DSD Article 4 team. It is important that the checking regime in the unit provides management with assurance that Article 4 visits are being conducted in a complete and accurate manner. 451 Work continued suitable Projects to identify Issue raised with GMB and a letter sent to all Departments seeking support. No Accepted implemented 10 November 2003 Implemented Dec 2003 Implemented 17/11/2003 Cleared Of the 7 recommendations made in the Article 4 Audit, 4 have been implemented and are operating effectively, and 3 have been implemented and are not operating effectively. N/A BUILDING SUSTAINABLE PROSPERITY PROGRAMME VERSION 3 Key recommendations and subsequent actions for Measure 3.1 (cont’d) Reference Number Follow-up of Article 4 arrangements SAN 5180 Audit of EUVU Reperformance Testing (Final Report Issued 18/02/05) Recommendation Action Taken Recommendations on Article 4 Visits to External All High Risk recommendations Implementers. cleared. No High Risk Issues were found and Substantial Assurance was given. Medium Risk Issues were identified in relation to Project Inspection Record, All recommendations accepted Review and Issue of Draft Reports, Management Letter information, Monthly Work Reports, Substantive assurance Verification Process Targets, and Monitoring of 6 Month Target. Issues around: Sampling Methodology EU Verification Effectiveness of Management and Control System – Unit. Systemic Issues – IB Level (Final Report Error Rates – Analysis Issued 1/06/07) Error Rates – Analysis Extended Testing. 452 Recommendations accepted and implemented immediately or at next appropriate opportunity – substantive assurance given Did this If so, was lead to an it reported irregularity? or recorded? BUILDING SUSTAINABLE PROSPERITY PROGRAMME VERSION 3 INTERNAL AUDIT ACTIVITY FOR MEASURE 3.2 The table below provides a record of internal audits carried out for sub-Measure 3.2 Reference Number Title of Audit Audit Body Date of Audit Date Report received SAN 5102 BSP Measure 3.2 DSD IAS 2004-2005 SAN 5102 Follow-Up BSP M3.2 DSD IAS 2005-2006 SAN 5180 Article 4 Arrangements DSD IAS 2004-2005 12 November 2005 17 February 2006 Approx SAN 5160 EU Verification Unit DSD IAS 2006-2007 30 March 2007 25 May 2007 SAN 5180 Follow-up Article 4 arrangements DSD IAS 2006-2007 15 February 2007 28 February 2007 SAN 5162 EUVU Repeformance Testing Review of EU Verification Unit DSD IAS 2004-2005 20 January 2005 18 February 2005 Approx DSD IAS 2003-2004 28 February 2004 25 May 2004 Approx SAN 5160 453 16 September 2004 Date of Response 07 February 2005 Approx 21 July 2005 Approx BUILDING SUSTAINABLE PROSPERITY PROGRAMME VERSION 3 Key recommendations and subsequent actions for Measure 3.2 Reference Number Recommendation 2005-06 Main high risk area’s were in relation to Duplicate Funding, Selection Panels, evidence of SAN 5102 Measure 3.2 decisions, letters of offer, monitoring visits, approval prior to issue of CFF, and the entire measure to be raised as a systemic irregularity 2005-06 All recommendations had been implemented except that regarding the systemic error of BSP 3.2. SAN 5102 Measure 3.2 Further recommendation was raised follow-up – VCU Management (following audit of BSP 3.2) should ensure same corrective action taken in respect of BSP 3.3 Action Taken Did this lead to an irregularity? If so, was it reported or recorded? Yes- A systemic irregularity was All accepted and raised for each Reported implemented Project and sent to DFP and the Commission Implemented after being A systemic put on Outstanding irregularity was Recommendation Yes raised for each Database Project and Recommendation then cleared accepted – to be Both reported implemented as soon as Yes – on each and recorded possible after report Project irregularities raised on all BSP 3.3 Projects. 2006-07 The High Risk recommendations were in relation to Audit of EU Verification the Accuracy of the Population, the All recommendations Unit reconciliation with actual spend on the accepted and No Final Report Issued EU Central Database, the Risk implemented immediately 25/05/04 – SAN 5160 Assessment Process and documentation, and visits to the main implementing and final beneficiary before closure 454 BUILDING SUSTAINABLE PROSPERITY PROGRAMME VERSION 3 Key recommendations and subsequent actions for Measure 3.2 (cont’d) Reference Number Recommendation Action Taken Audit of EUVU – Reperformance Testing No High Risk Issues were found and All recommendations (Final Report Issued Substantial Assurance was given. accepted and 18/02/05 – SAN 5162 implemented The main High Risk Issues were in EU Verification Unit. relation to sampling Methodology, (Final Report Issued Effectiveness of Management and 1/06/07 – SAN 5160 Control Systems, the analysis of error rates, the process of de-selection of projects, and the extended testing of Article 12 Recommendations accepted and implemented immediately or at next appropriate opportunity – substantive assurance given 455 Did this lead to an irregularity? No No If so, was it reported or recorded? BUILDING SUSTAINABLE PROSPERITY PROGRAMME VERSION 3 INTERNAL AUDIT ACTIVITY FOR MEASURE 3.3 The table below provides a record of internal audits carried out for sub-Measure 3.3 Reference Number Title of Audit SAN 5103 Audit of Measure 3.3 SAN 5180 Article 4 Arrangements SAN 5160 Audit Body Date Report received Date of Response May 2007 May 2007 To confirm DSD IAS 2004-2005 12 November 2005 17 February 2006 Approx EU Verification Unit DSD IAS 2006-2007 30 March 2007 25 May 2007 SAN 5180 Follow-up Article 4 arrangements DSD IAS 2006-2007 15 February 2007 28 February 2007 SAN 5162 EUVU Repeformance Testing Review of EU Verification Unit DSD IAS 2004-2005 20 January 2005 18 February 2005 Approx DSD IAS 2003-2004 28 April 2004 25 May 2004 Approx SAN 5160 EUVU DSD IAS 2000-2001 27 March 2001 6 June 2001 Approx N/A Report to Those Charged with Governance NIAO 2006-2007 2007 SAN 5160 BSP DSD IAS Date of Audit 456 BUILDING SUSTAINABLE PROSPERITY PROGRAMME VERSION 3 Key recommendations and subsequent actions for Measure 3.3 Reference Number Recommendation Action Taken Did this lead to an irregularity? SAN 5180 Audit of Article 4 Arrangements The High Risk Recommendations were in All recommendations relation to the Completion of the Article 4 accepted and Monitoring Visits, the Article 4 visits to implemented. external Implementers, and the Article 4 workplans No Follow-up of Article 4 arrangements Accepted and All previous recommendations implemented implemented except one in relation to Article 4 visits to external implementers No SAN 5180 Audit of EU Verification Unit Final Report Issued 25/05/04) SAN 5160 The main high risk issues and recommendations revolve around Accuracy of the Population, the reconciliation with actual spend on the EU Central Database, the Risk Assessment Process and documentation, and visits to the main implementing and final beneficiary before closure Audit of EUVU – No High Risk Issues were found and Reperformance Testing Substantial Assurance was given. (Final Report Issued 18/02/05) SAN 5162 457 All recommendations accepted and implemented immediately No All recommendations accepted and implemented No If so, was it reported or recorded? BUILDING SUSTAINABLE PROSPERITY PROGRAMME VERSION 3 Key recommendations and subsequent actions for Measure 3.3 (cont’d) Reference Number Recommendation Action Taken EU Irregularities Process The High Risk recommendations were in (Final Report Issued relation to the Clearance of irregularities, 23/05/07) the reporting of irregularities, the nature of irregularities identified, succession planning, the absence of management checks over management information, the reporting of irregularities to DFP, and Article 8 – Debtors Ledger SAN 5103 Internal Audit recommended, due to systemic weaknesses identified in the management and control systems in operation over this Measure, an exercise should be undertaken to determine the scale of the weaknesses identified and to assess their impact within the Management and controls systems. 458 Recommendations accepted and implemented Management undertook an extensive exercise as outlined in the recommendation which was reviewed by Internal Audit who were satisfied that all necessary steps were taken to implement recommendations made Did this lead to an irregularity? No Yes As a result of this exercise 13 of the 43 original Projects were withdrawn in full resulting in £2.7m being decommitted. Irregularities were raised for each of the withdrawn projects. A number of smaller irregularities were detected in the remaining projects and irregularities were raised as appropriate. Any irregular expenditure was withdrawn from claims to the Commission. If so, was it reported or recorded? BUILDING SUSTAINABLE PROSPERITY PROGRAMME VERSION 3 Key recommendations and subsequent actions for Measure 3.3 (cont’d) Reference Number Recommendation Action Taken NIAO The Department’s Internal Audit work in Report to those charged URCDG highlighted significant failings in with Governance the management and control of grants made under Building Sustainable Prosperity (BSP) Measure 3.3 and considered them to be so significant that a limited assurance rating was applied to the Group as a whole. The work has been reviewed by Northern Ireland Audit Office and they agreed with the conclusions reached Did this lead to an irregularity? A review to establish the number of older As above cases in that unit where payments are still being made was undertaken to provide assurances that similar weaknesses identified in the administration of Building Sustainable Prosperity 3.3 were not prevalent in those cases. Internal Audit was asked to validate the findings of that review (see above) 459 If so, was it reported or recorded? BUILDING SUSTAINABLE PROSPERITY PROGRAMME VERSION 3 INTERNAL AUDIT ACTIVITY FOR MEASURE 3.4 The table below provides a record of internal audits carried out for sub-Measure 3.4 Reference Number None None Title of Audit Audit Body Internal Audit DE IAS Report on EU Structural Funds Internal Audit DE IAS Report on EFU (BSP Section) 460 Date Report received Date of Response April 2004 25 May 2004 8 June 2004 March-May 2008 22 May 2008 30 June 2008 Date of Audit BUILDING SUSTAINABLE PROSPERITY PROGRAMME VERSION 3 Key recommendations and subsequent actions for Measure 3.4 Reference Number Report May 2004 Ref. 6.3 Report May 2004 Ref. 6.7 Report May 2004 Ref. 6.10 Report May 2004 Ref. 6.12 Report May 2004 Ref. 6.14 Recommendation Action Taken Supervisory process should be put in place for the database and project files Branch working practices should be reviewed and appropriately documented Branch checking procedures reviewed Article 4 checks should be begun asap. Arrangements should be made to commission Article 10 checks Article 4 checks begun in July 2004 External auditors were engaged and Article 10 work began in late 2004. A Branch procedures manual was developed by December 04 Evidence is retained to demonstrate the decision-making process in Processes assessing applications documented If so, was it reported or recorded? No N/A No N/A No N/A No N/A No N/A No N/A formally Report on BSP 2008 Ref. Processes and procedures for As closure continues, the 10.6 programme closure should be put in branch will ensure that place appropriate processes are developed 461 Did this lead to an irregularity? BUILDING SUSTAINABLE PROSPERITY PROGRAMME VERSION 3 INTERNAL AUDIT ACTIVITY FOR MEASURE 5.1 The table below provides a record of internal audits carried out for sub-Measure 5.1 (Water) Reference Number Title of Audit Audit Body Administration of EU DRD IAS Structural Funds – Water Service Water Service EU DRD IAS Article 10 checks Date of Audit September/October 2004 April 2005 December 2005 December 2007 462 Date Report received Date of Response 28 February 2006 August 2008 August 2008 BUILDING SUSTAINABLE PROSPERITY PROGRAMME VERSION 3 Key recommendations and subsequent actions for Measure 5.1 DRD Reference Number Recommendation Action Taken Administration of EU Structural Funds – Water Service 2004-05 and December 05 Accounting systems and financial reporting – Recommendation ‘Reasonable Assurance’ implemented Processing of applications including project Recommendation assessment – ‘Reasonable Assurance’ implemented Project monitoring and control – ‘Reasonable Recommendation assurance’ implemented Compliance with EC publicity requirements – Recommendation ‘Reasonable Assurance’ implemented Compliance with EC Regulation 438/2001 and Recommendation 1681/1994 (management checks/verification implemented checks/irregularities) – ‘Reasonable Assurance’ Water Service EU Article 10 Ensure adequate and effective systems for compliance with Article 7 of EC Regulation 438/2001 Provide supporting documentation for Lough Macrory WTW EU Database payments Source original EU project letters of offer for Carran Hill WTW Ensure copies of irregularity reports are maintained on EU project files Ensure relevant training for staff responsible for management and co-ordination of EC Structural Funds Did this lead to an irregularity? If so, was it reported or recorded? No N/A No N/A No N/A No N/A No N/A Implemented No N/A Implemented No N/A Implemented No N/A Implemented No N/A Implemented No N/A 463 BUILDING SUSTAINABLE PROSPERITY PROGRAMME VERSION 3 INTERNAL AUDIT ACTIVITY FOR MEASURE 5.1 The table below provides a record of internal audits carried out for Measure 5.1 (DOE) Reference Number BSP Rpt 1 BSP Rpt 2 BSP Rpt 3 BSP Rpt 4 Title of Audit Audit Body Date of Audit Review of DRD IAS Administration of EU Structural Funds Follow-up Review of DRD IAS Administration of EU Structural Funds Article 10 Audit of DRD IAS BSP March-November 2005 Article 10 Audit of DRD IAS BSP June-December 2008 September 2007 January 2007-May 2007 464 Date Report received Date of Response BUILDING SUSTAINABLE PROSPERITY PROGRAMME VERSION 3 Key recommendations and subsequent actions for Measure 5.1 - DOE Reference Number Review EU Structural Funds 2005 Follow-up Review 2007 Audit of Article 10 2007 Recommendation Action Taken Targets are established for the timely Targets established. processing of claims. Feedback be given to Promoters on the findings of the Article 4 visit regards weaknesses found and follow up A proforma be developed for recording of site visits and monitoring responsibilities are documented. Did this lead to an irregularity? If so, was it reported or recorded? No N/A No N/A Feedback given to Promoters and issues followed up. Partially implemented with proforma developed but responsibilities not documented as projects substantially No completed. Management should issue a revised There is a clear audit/management trail to letter of offer which clearly stipulates show specifically the expenditure the amount of financial assistance to attributed to the Department and EU be paid under the BSP Programme. No Any subsequent changes to the grant amount element offered should be formalised with appropriate revisions to the letter of offer. 465 N/A N/A BUILDING SUSTAINABLE PROSPERITY PROGRAMME VERSION 3 INTERNAL AUDIT ACTIVITY FOR MEASURE 6.1 The table below provides a record of internal audits carried out for Measure 6.1 Reference Number IA 17/04 IA 56/05 Title of Audit Audit Body Internal Audit DFP IAS Report on Structural Funds Policy Management Team Follow up of IA DFP IAS 17/04 Date of Audit 23 August 20043 September 2004 Date Report received Date of Response Draft report 10 December 2004 Final Report 24 March 2005 6 Jan 2006 None 14 December 2004 IA 57/06 Follow up review of DFP IAS IA 56/05 30 October 2006 None IA 76/06 Internal Audit DFP IAS Report on Structural Funds Policy Management Team Draft report 23 May 2007 Final report dated 1 August 2007 23 July 2007 31 July 2007 466 BUILDING SUSTAINABLE PROSPERITY PROGRAMME VERSION 3 Key recommendations and subsequent actions for Measure 6.1 Reference Number IA 17/04 IA 17/04 IA 17/04 IA 17/04 Recommendation Management should ensure that all appraisal decisions are fully documented, evidenced and retained on file Management should liaise with Departmental Economists to obtain advice on the areas of the ‘Green Book’ that need to be addressed in these cases and indeed if they are necessary at all. EUD, as the Managing Authority, should seek to obtain, without delay, the outstanding annual reports and audited accounts in accordance with the LoO and should consider withholding further funding until these have been provided All requested changes to LoOs should also be made in writing and retained on file. Additionally, management should ensure that changes in conditions of grant are revised in the LoO and supported by evidence of the decisionmaking process Action Taken Management accept that all appraisal decisions should be fully documented, evidenced and retained on file. Management have obtained the fully completed appraisal forms and these are now on file Management has complied with existing procedures in the Structural Funds Manual but will ensure future economic appraisals focus on areas of concern, if concerns are raised by Assessment Panels Did this lead to an irregularity? No No Management at the time of the audit were fully aware of the requirement to furnish audited accounts and had requested copies on several occasions. An on the spot Article 4 check is to be carried out in the near future and the audited accounts will be a priority No This requirement is detailed in the Letter of Offer. EUD was asked to provide advance payments at a meeting held on 10 May 2004. This request was rejected by EUD, but to be helpful management agreed that claims could be made on a monthly basis. This was a management decision taking account of the branch workload. A note of the meeting when the request was made is held on file. It should be noted that since the meeting no monthly payments have been received and there has therefore been no variation to the LoO. When a claim is received the LoO will be amended No 467 If so, was it reported or recorded? BUILDING SUSTAINABLE PROSPERITY PROGRAMME VERSION 3 Key recommendations and subsequent actions for Measure 6.1 (cont’d) Reference Number IA 17/04 IA 17/04 IA 17/04 Recommendation Action Taken Did this lead to an irregularity? Management should review the applications process for “in house” Technical Assistance. Adequate separation of duties should be introduced to provide transparency for the approval process and should be extended to Adequate segregation of duties is now in place. include the authority to purchase and the authorisation of payments. Delegated limits are not an issue for SFPMU as the Finance section has now taken over the Management should ensure adherence to the authorisation of the “pinks” delegated limits allocated to each officer or consider revising the limits should this be more appropriate No Where no formal Letter of Offer (LoO) is required, management should reconsider the method of input to the database to ensure that current controls are not overridden or made redundant No As the individual responsible for the order of goods/services should not partake in further elements of the payment process, the order form for goods/services should be retained in a secure central location, and not retained by the individual placing the order. This will allow the officer receiving the goods to reconcile the forms on a timely basis. The ‘Authority To Pay’ should be clearly separated from the ‘Goods Received’ section in order to clearly separate the activities At the time of the audit review new staff were being trained on the Structural Funds Database, for future training we will endeavour to ensure that controls are not circumvented. The order form will in future be stored in a secure central location and available to the receiving officer. The order form will be redesigned 468 No If so, was it reported or recorded? BUILDING SUSTAINABLE PROSPERITY PROGRAMME VERSION 3 Key recommendations and subsequent actions for Measure 6.1 (cont’d) Reference Number Recommendation Action Taken Did this lead to an irregularity? The following refers to a Report on Structural Funds Policy Management Team 2007 IA 76/06 IA 76/06 Management should approach all relevant departments and obtain a list of signatories authorised to sign the certificates. A cross- A list of authorised signatures check should be made to the list prior to the completed and will be maintained authorisation of the drawdown Management should review the procedures and ensure they are updated in line with current practices has been No These procedures have been updated reviewing the current practices/responsibilities undertaken by SFPMT and Departments No IA 76/06 With the advent of closure it is not cost effective at present to make changes to the database to address this issue. However, a RMA has added this report to the drawdown printout of the screen page recording the list of section of the Central Database authorising officers should be obtained before submission and held with the hard copy certificates. The problem should be noted and addressed in the new round of funding, if appropriate 469 No If so, was it reported or recorded? BUILDING SUSTAINABLE PROSPERITY PROGRAMME VERSION 3 Key recommendations and subsequent actions for Measure 6.1 (cont’d) Reference Number IA 76/06 IA 76/06 Recommendation Management should remind all projects/ departments being funded of the need to provide sufficient details of expenditure to be recouped. They should assure themselves that amounts claimed are in accordance with terms and conditions of funding and explanations should be sought where required. Relevant documentation should be signed as checked/ authorised where appropriate. Where possible, outstanding documentation should be sought retrospectively to provide a transparent audit trail Action Taken Accepted. Originals are now stamped and apportioned amounts stated where applicable. 2. Accepted. All invoices for the NILGA Admin costs are now requested and details of the split are held on file. 3. The copy on file is not of good quality although the amount was legible; the original was received and passed to Finance Branch for payment. However it is accepted that all copy invoices should be of good quality. Did this lead to an irregularity ? No 4. Although supporting documentation for the payment is held and available for checking it is accepted, for completeness of the audit trail, documents should be cross referenced Accepted. Copies of signed Letters of Offer will Management should ensure that all relevant be made and filed. documentation is signed and dated by the 2. Accepted. Staff have been reminded to date appropriate officer(s) in order to provide an stamp all invoices. adequate management/audit trail 3. Accepted. A note will be held on file 470 No If so, was it reported or recorded? BUILDING SUSTAINABLE PROSPERITY PROGRAMME VERSION 3 Key recommendations and subsequent actions for Measure 6.1 (cont’d) Reference Number IA 76/06 Recommendation Management should initiate a review of files. An index system at the front of the files should be developed providing a clear indication of what documentation is required and being held. This will ensure completeness of the documentation and provide audit/management trail. Action Taken Partly accepted. Papers within the technical assistance files are held in chronological order of documents and key documents are tabbed for ease of identification. The files for internal projects contain few key documents. Management will inspect files and create an index sheet on the left-hand side of the latest volume identifying key documents, commencing with external projects, NILGA, Concordia and Agri-Rural forum, and following with internal project files. The external files should be completed by end-July and the internal projects will be indexed by end-September 471 Did this lead to an irregularity? No If so, was it reported or recorded? BUILDING SUSTAINABLE PROSPERITY PROGRAMME VERSION 3 ANNEX 13 Commission Audit findings Systems Audit 24 -28 September 2001 BSP System Audit Sept 2001 - response Systems Audit 20 -24 June 2005 BSP systems audits June 2005 and Septe Project Audit 3 -7 April 2006 BSP Project Audit April 2006 - Closure re Project Audit 17-21 September 2007 (follow up) 472 BUILDING SUSTAINABLE PROSPERITY PROGRAMME VERSION 3 BSP systems audits June 2005 and Septe 473 BUILDING SUSTAINABLE PROSPERITY PROGRAMME VERSION 3 ANNEX 14 Irregularities Guidance Note Irregularity Guidance Note - July 2008.DOC 474 BUILDING SUSTAINABLE PROSPERITY PROGRAMME VERSION 3 ANNEX 15 Reported Irregularities – details as reported to OLAF by the UK authorities REPLACEMENT Annex 15 to Closure R 475 BUILDING SUSTAINABLE PROSPERITY PROGRAMME VERSION 3 ANNEX 16 Recorded irregularities BSP Recorded Cases.xls 476 BUILDING SUSTAINABLE PROSPERITY PROGRAMME VERSION 3 ANNEX 17 Equality Guide Guide to Mainstreaming Equalit 477 BUILDING SUSTAINABLE PROSPERITY PROGRAMME VERSION 3 ANNEX 18 General Publicity/Newsletters MANAGING AUTHORITY INFORMATION AND PUBLICITY EC Regulation 1159/2000 sets down the EC requirements for publicity. It states that information and publicity is to be provided “to increase public awareness, assist transparency and create a coherent picture of the assistance”. The Managing Authority issued a Guidance Note to Implementing Bodies suggesting ways on how to meet the regulatory requirements together with a pro-forma to monitor details of publicity activities at measure level. This information is collated into reports which are used by the Structural Funds Monitoring Committee to monitor the effectiveness of Publicity Measures undertaken and also provide the Management Authority with assurance that there is compliance with EC Regulation 1159/2000. Publicity activities have also been reported in the BSP Annual Implementation Reports. Regulatory Article 4 verification checks also examine the publicity activities of projects to ensure adherence to the EC Regulation. The Managing Authority has undertaken a variety of activities to promote the BSP Programme to citizens in Northern Ireland which include: • A Website to disseminate information relating to the BSP Operational Programme (including all EU Structural Funding to NI). The website, www.europe-dfpni.go.uk, was designed to provide access to all parts of the Community and has taken significant steps to meet its equality obligations under Section 75 of the Northern Ireland Act 1998. The website provides access to material ranging from programme documentation, the Structural Funds manual, to minutes of Monitoring Committee meetings and logos. Guidance to Implementing Bodies on publicity requirements is http://www.dfpni.gov.uk/publicityguidelines.pdf ; 478 available on BUILDING SUSTAINABLE PROSPERITY PROGRAMME VERSION 3 • issue of two guides – Guide 1 ‘An Introduction to Structural Funds in Northern Ireland’ which provides information on structural funds, their purpose and aims, how the money will be used, managed and how to access it. Guide 2 ‘Building Sustainable Prosperity in Northern Ireland through European Union Structural Funds’ provides more information on the BSP Programme which would be of interest to those seeking general information on the programme. The booklet also explains how the BSP Programme fits into the wider picture of European Funding in Northern Ireland (front page examples below. Original copies included with hard copy version of report); 479 BUILDING SUSTAINABLE PROSPERITY PROGRAMME VERSION 3 • production of a BSP Newsletter issued in Spring and Autumn which showcases a wide range of projects from the Programme (front page example below. Original copy included with hard copy version of report); 480 BUILDING SUSTAINABLE PROSPERITY PROGRAMME VERSION 3 • a selection of BSP promotional materials was distributed to project promoters via the Implementing Bodies. The promotional materials included mugs, pens, key-rings, pens, pencils, mouse mats, all with full colour BSP logo; • 2004 and 2005 calendars with photographs of various projects were produced and distributed to projects and key contacts; • an advertising campaign was run for six months using buses in main towns throughout Northern Ireland. This coincided with a four week advertising campaign at bus stops; • European Division in its role as CSF Managing Authority produced a CSF leaflet highlighting projects. 220,000 copies were issued in the 4 main newspapers in Northern Ireland (front page example below. Original copy included with hard copy version of report); 481 BUILDING SUSTAINABLE PROSPERITY PROGRAMME VERSION 3 Good News stories from across the Programme Measure 1.1 - Belfast Aircraft Stress Engineers This company based in Dundonald was supported under Measure 1.1 Growth Start–Up, with a grant of £17,283. Benefiting from the strong aerospace tradition which has grown up around Belfast, the company has attracted highly trained engineers focusing on stress engineering, structural design and systems. The company is an expert consultancy providing stress analysis and other services to the global aerospace industry, has worked on projects for most of the main aerospace companies including Boeing, Airbus and Bombardier. BASE has also established strong links with the Aeronautical Engineering Department at Queen’s University Belfast, through placement of graduate and undergraduate engineers in research based initiatives. Staying at the forefront of technology and supporting new talent coming into the industry is very important to the company and BASE is committed to the continual development and promotion of the Northern Irish engineering industry. 482 BUILDING SUSTAINABLE PROSPERITY PROGRAMME VERSION 3 The success of this company showed that a smaller business could do very well with innovative products. It won the First Time Exporter of the Year Award 2005 hosted by Invest NI. Measure 1.2 - New World Developments Invest NI Helps Company Develop Doorway to Success With R&D assistance from Invest Northern Ireland, a Ballymena company has developed a composite door product that is set to make it a leader in its field and significantly boost sales. The company’s new product, called Apeer, has many advantages over a uPVC panel door as it uniquely combines the strength, look and feel of a wooden door yet its modern materials perform to the highest industry standards. New World Development’s managing director, Austin McGillian, says: “Composite doors have been identified as a growth area of the overall door market so we decided to research and develop a composite door with features not currently offered by competitors. With Invest NI’s support we were able to develop a highly technical product that has given us a very strong advantage in the marketplace. We anticipate that Apeer will generate up to £3 million in sales over next couple of years.” New World Developments benefited with support from Invest NI’s Compete programme, which helps companies develop innovative market-led products and manufacturing processes. To build the capability required to fully exploit the potential of the new product, Invest NI has also given the company support to employ a factory manager, two regional sales and marketing managers and an IT manager. Production of the Apeer composite door range is expected to create 25 new jobs in the company. The Invest NI Compete Programme is part funded by the EU Building Sustainable Prosperity Programme and provided this project with assistance of £210,284. 483 BUILDING SUSTAINABLE PROSPERITY PROGRAMME VERSION 3 Measure 1.3 - Belle Isle School of Cookery - The Ultimate destination for food lovers. Discover the delights of creating modern cuisine in a food-lovers paradise. It's a world apart, in one of the most charming and unspoilt areas of the Irish countryside. How better to enjoy the delights of Irish cooking than at the Belle Isle School of Cookery. Embark on a journey that stirs the imagination and excites the senses in one of the most beautiful settings in Ireland. You will discover the delights of cooking in a relaxed atmosphere, with expert tuition, using top quality seasonal Irish produce. The hands-on cookery courses and demonstrations will introduce you to some of Ireland’s most exciting and innovative culinary ideas. The Cookery School received funding of £44,500.84 from the BSP programme through the Northern Ireland Tourist Board. Visit their website at www.irishcookeryschool.com Measure 1.4 - Derry Old Fire Station The Old City Fire Station project is a key action within Derry City Council’s Economic Development Plan. The project cost c. £950,000 and received £475,000 through the European Union’s Building Sustainable Prosperity programme administered by DETI, with the balance of funding coming from Derry City Council. 484 BUILDING SUSTAINABLE PROSPERITY PROGRAMME VERSION 3 The economic objectives of regenerating the property are to support the growth of creative and knowledge-based industries within the historic Walled City generally and the Cathedral Quarter particularly. This is based on the current presence and continuing growth of such industries within the Cathedral Quarter vicinity and their positive impact upon the area in terms of economic/physical regeneration, their growing tourism appeal and the complementary benefits of clustering within a defined geographical area. The property is a Grade B2 listed building located on the edge of the City Centre and has recently undergone extensive restoration and renovation work, which has also included the addition of a two-storey building extending along to Fountain Street. In June 2006 the property was badly damaged by fire and was very close to being demolished due to the serious structural damage that it suffered. Derry City Council appointed a project team which managed to secure the building from demolition, through a series of efforts to ensure that it was shored up prior to the actual renovation works taking place. The regeneration of the building is now complete and provides 2,750 sq. ft of high quality office amenities/specifications accommodation including equipped telecommunications with modern infrastructure, air conditioning and full disabled access throughout including the provision of an elevator. The property has significant architectural and historical significance given that it remains the only late 19th Century Fire Station building in Northern Ireland as well as being on the edge of the Walled City immediately adjacent to the City Walls. Evidence of the building’s former use can be seen in terms of the moulded crests on the front façade of the property depicting it as a fire station. The building has a tenant and is providing employment for up to 10 people in the creative industries sector. The Minister of Environment officially opened the building on 8 May 2008. http://www.northernireland.gov.uk/news-doe-100508-foster-unveils-old 485 BUILDING SUSTAINABLE PROSPERITY PROGRAMME VERSION 3 Measure 1.5 - ICT SUPPORT STEERS LOCAL FIRM TO GREATER SUCCESS Northern Ireland continues to lag behind much of the UK in terms of both connecting to the Internet and general Information Communication Technology (ICT) usage. This trend is not restricted to small businesses; many larger companies across the region also report a shortfall of appropriate resources to implement effective e-business plans. E-business is rarely considered as a core element of business strategy in Northern Ireland so it seldom appears on business plans. However, there are a number of forward-thinking companies which have actively incorporated ICT programmes and e-business activities into their business plans and have found that their profits have increased as a result. In reality, most small businesses in Northern Ireland are limited in terms of time and resources and strategy development is often hampered by the day-to-day practicalities of running a business. Consequently, there is little time to investigate ICT fully, keep on top of the latest technologies and learn about the real business benefits of effective ICT. Local companies therefore frequently lack the confidence and sufficient know-how to make informed buying decisions on ICT technologies. 486 BUILDING SUSTAINABLE PROSPERITY PROGRAMME VERSION 3 The good news is that the Invest NI ICT Advisory Service, a team of experts with in-depth knowledge of the full range of IT technologies, is accessible to all Invest NI client companies across Northern Ireland. The team can guide you through the maze of ICT and e-business technologies and demonstrate how it can improve your company’s performance. Frylite, a leading distributor, collector and processor of vegetable oils with premises throughout the island of Ireland has been in contact with the Invest NI e-Business team on a number of occasions. Speaking from their head office in Strabane, Managing Director Eamon McCay said: “Over the past number of years, Frylite has experienced tremendous growth. As the business grew, so did the volume of paper work that needed to be processed. We invested in technology in the past but we were never satisfied with the outcomes so, determined to avoid making the same mistake twice, we called in the experts from Invest NI’s ICT team. An ICT Advisor, paid us a visit and looked at our entire business process and training needs to advise us of a suitable solution. The advice and guidance given to us was invaluable in making our decision. Based on this independent advice, we had the confidence to choose from a range of suppliers offering varied solutions. We selected a product provided by a local supplier. It not only allowed us to better manage the administration function more efficiently but actually helped us to streamline our overall process. Our drivers were able to produce delivery dockets via handheld terminals and each night we could download the fleet’s information from the handheld terminals directly into our system which meant that the invoices could be produced automatically too. The difference is very noticeable. We had enough work to be getting on with and didn’t need to be worrying day-to-day about computer issues. We have witnessed the benefits of this initial investment to our customers, staff as well as the all important bottom line.” Frylite contacted Invest NI for a second time when they moved to new premises last year. On this occasion, the company installed broadband with advice from an Invest NI Broadband Advisor. This allowed the firm to link together their three sites in Strabane, Dublin and Galway. The broadband advisory service is open to all businesses in Northern Ireland and is not restricted to Invest NI client companies. 487 BUILDING SUSTAINABLE PROSPERITY PROGRAMME VERSION 3 “From these positive experiences of ICT investment, we are now very open to learning how ICT and e-business can improve the business further and now actively seek ways of benefiting from new technologies. The key to success for us was in knowing what we wanted to achieve and having an Invest NI ICT Advisor to point us in the right direction” concluded Eamon. Unsurprisingly, demand for Invest NI’s services to date has been very encouraging with over 2,000 client companies having already contacted the team. Invest NI has put in place five ICT Advisors, split regionally across Northern Ireland, to work with client companies to improve their understanding of ICT issues and the latest range of technologies currently available. Measure 1.6a - A5 Newtownstewart By-pass The Newtownstewart Bypass project was completed in December 2002. It has been welcomed by both road users and Newtownstewart residents for the reduction of traffic congestion and the associated reduction in pollution within the town. The bypass, which extends to 2.6km of single carriageway, includes two major bridge crossings of the River Strule, an environmentally significant and important angling river with local fish farming interests. 488 BUILDING SUSTAINABLE PROSPERITY PROGRAMME VERSION 3 The strategically important A5 trunk road previously passed through the town centre on a twisting alignment exacerbated by severely restricted road widths causing considerable delay to through traffic. This resulted in traffic congestion and an unacceptable environment for pedestrians and impeded the function of the town as a service centre to a wide rural hinterland. The Scheme is a 2.5km single carriageway which crosses the floodplain of the Strule River, mainly on embankment. There are two at-grade junctions and a compact grade-separated junction and five principal structures, including two major river crossings. Scott Wilson, as advisors to Roads Service, took the Scheme from assessment of route options, through public consultation, statutory procedures and Specimen Design to the procurement and supervision of construction as a Design & Build contract. Significant measures were adopted to integrate the road into the scenic and environmentally sensitive landscape of the Strule River valley and to mitigate environmental impacts both during construction and when the road is in service. Flooding was a major design issue with the objectives both to protect the road itself and to ensure that flooding elsewhere was not exacerbated. This was ascertained by a flood modelling study of the river during the development of the Scheme. Protection of water quality in the Strule was a another significant factor given the presence of a commercial fish farm a short distance downstream and its importance as a major fishing river in its own right. An automatic water quality monitoring and alarm system was specified and implemented during construction to guard against contamination. The project received £7.5 grant assistance. 489 BUILDING SUSTAINABLE PROSPERITY PROGRAMME VERSION 3 Measure 1.6B - Lisburn Bus Centre Lisburn Bus Centre, which received a grant of £373,449, was officially opened by Minister Conor Murphy, MLA, on the 30 September 2008. The modern, fully accessible bus centre is a new addition to the Lisburn City Centre landscape and provides a considerable enhancement in service quality for both the local people and visitors to the area. The investment should help to grow passenger numbers. It is well located opposite the Lisburn Square Shopping Centre and within close walking distance of the busy city centre and social facilities. Passenger comfort and safety have been of paramount importance. There is comfortable passenger seating in the waiting area, which overlooks nine new covered bus stands allowing passengers to see clearly, when buses are coming and going. There is an external PA system and induction loop system used to announce departures and arrivals. Other facilities include public toilets, a dedicated parent and baby room, refreshment area with vending machines, covered cycle shelter, a range of information displays including large electronic monitors carrying bus timetable information and real time information for train services at the nearby Lisburn rail station. CCTV is in operation throughout the complex at all times to help ensure passenger safety. In line with the operational opening (30th September) of the new Bus Centre, local bus services were also improved in order to make the network easier to use and to provide better integration with the rail station for bus/rail 490 BUILDING SUSTAINABLE PROSPERITY PROGRAMME VERSION 3 connections. This included the use of easy to use clock-face city service timetables and improved passenger information including colour coded route maps and new modern bus stops. Low floor fully accessible vehicles operate on all city services. The facilities for drivers, staff and management have improved with the opening of the new centre. Located on the first floor, accessed by stairs or lift, are new administration offices, a training/meeting room, a kitchen and toilet facilities. For press release see http://www.northernireland.gov.uk/news/news-drd080908-transport-minister-opens. Measure 1.7 - Northern Ireland first in Europe with 100% Broadband Over the last 5 to 10 years Government in Northern Ireland has been committed to “working with the private sector, to develop and begin to implement a strategy that will ensure that all of Northern Ireland has a world class telecommunications infrastructure in terms of broadband capacity, access and cost”. Northern Ireland is a small peripheral regional economy. If we are to compete successfully in Europe and the wider global marketplace, it is essential that NI has access to competitively priced telecommunications services to allow our indigenous businesses to remain competitive. The Government’s goal for telecoms is improved communications networks maintaining pace with those in Europe. In recent times the emergence of broadband connectivity is regarded as a key component for the development of knowledge-based economies. It is of strategic importance because of its ability to accelerate the contribution of other information and communication technologies to economic growth, and facilitate innovation recognised at local national and European levels. 491 BUILDING SUSTAINABLE PROSPERITY PROGRAMME VERSION 3 The specific importance of broadband as an enabler of economic activity in Northern Ireland is well established. Broadband is a communication channel of immense power and importance. It makes it possible for Northern Ireland to compete in the global marketplace. In 2004, the NI Government launched a competitive tender to deliver 100% broadband coverage in Northern Ireland funded by the EU Building Sustainable Prosperity Programme. In December 2005, following award of a contract to BT, Northern Ireland became the first region in Europe where broadband was available to every home and business at equitable prices. Almost £10 million was invested in delivering broadband across Northern Ireland, with EU assistance of £6.27m, and this provision is key to ensuring that the infrastructure, necessary to compete successfully in the global market, is in place Under the terms of the contract, a broadband service of at least 512 kbps is available to every household and business should they wish to avail of it. The contract is service-driven, technology neutral and includes price caps for the various domestic and commercial product offerings to ensure equitable access (although the supplier can make lower charges depending on market conditions). Currently the maximum charges the suppler can impose are approximately €90 for installation and €35 per month for service provision, slightly higher than the average urban commercial broadband charges of zero for installation and circa €24 per month to ensure there is no displacement. Furthermore under the terms of this contract the supplier is obliged to offer a wholesale product to other resellers. There are estimated to be 370,000 broadband accounts in NI. News release - http://archive.nics.gov.uk/eti/060116d-eti.htm Measure 1.8 - Belfast Energy Agency - 'Hard to Heat Homes' The project was a pilot study of four Northern Ireland Housing Executive properties to include energy efficiency audits and the installation of monitoring equipment to raise awareness of hard to heat homes, fuel poverty and 492 BUILDING SUSTAINABLE PROSPERITY PROGRAMME VERSION 3 renewable energy. The project received £16,000 of funding from the BSP Programme. This represented 25 per cent of the total cost of the project. The aims and objectives of the project were: •To identify four appropriate NIHE properties and tenants to be included in the pilot study by May 2003; •To undertake property audits in order to identify appropriate energy efficiency measures/renewable technologies for each house by July 2003; •To install real time monitoring equipment in order to monitor pre and post installation data for the period of one year; •To install appropriate measures/technologies by January 2004 (revised to April 2005 due to unforeseen delays); •To educate tenants on the correct use of equipment and importance of energy efficiency by April 2004; •To evaluate project results and produce a published report outlining experiences gained and a comprehensive breakdown of running costs by March 2005 (revised to March 2006 due to unforeseen delays); and •To raise awareness of hard to heat homes, fuel poverty and renewable energy through on an ongoing basis. The project objectives were achieved: properties were identified; property audits were undertaken; and the technologies were installed. The technologies installed in the properties included: ground source heat pumps; wind turbines; solar water heating; PV panels; and ventilation systems. Monitoring of the projects did occur, but the desired information relating to the impact of the project was difficult to obtain. This project has installed a number of renewable technologies in ‘real life’ housing situations and has raised awareness of renewable energy and energy efficiency amongst a wider audience. 493 BUILDING SUSTAINABLE PROSPERITY PROGRAMME VERSION 3 The project was delivered at its planned cost and is delivering savings to the residents of the selected houses both in terms of fuel savings and unmeasured carbon savings. As such, the identified output could not have been achieved at less cost. This project aimed to demonstrate the benefits of renewable technologies and energy efficiency measures in ‘real life’ housing situations. As such, a pilot study was required in order to develop knowledge around the technologies and their installation before a project could be carried out at a wider scale. The desired outputs could not have been achieved in an alternative way. The pilot study has reached an end and the project has delivered its objectives. However, the pilot study has since evolved into the Bryson House CLEVER Homes project which has taken the lessons from this project, and has developed them into a wider reaching project involving the installation of the technologies in more homes. The Post Project Evaluation determined that the ‘Hard to Heat Homes’ project achieved its objectives and outputs, was value for money, had a strategic fit and would achieve project continuation. Given that this project involved the generation of energy from renewable sources, the project links into existing NI and UK Energy Policy, such as targets for the reduction of CO2 emissions, and for electricity generated from indigenous renewable sources. Measure 2.5 - Major Project - C2k The Mission of C2k is to provide, for Northern Ireland’s schools, a world class Learning Technology service and optimise its use throughout the Community. C2k is a regional scheme operating under the auspices of the Education Technology Strategy Management Group of the Department of Education. It is funded by the Department, through the Western Education and Library Board, as part of its Education Technology Strategy, to deliver to schools high quality, sustainable infrastructure, connectivity and resources. The Strategy set out to ensure that young people are well prepared for their life and work in the 494 BUILDING SUSTAINABLE PROSPERITY PROGRAMME VERSION 3 information economy of the 21st century, and that ICT is used to raise educational standards. The C2k element of the measure has numerous components that include: Passive infrastructure to support C2k activities An infrastructure of approximately 23,000 networked computers connected to the Internet and linked to legacy systems; Access to a wide range of content and services to support the Northern Ireland Curriculum and the professional development of teachers; Connection of schools' networks onto a single education network across Northern Ireland, with tools to facilitate the development of online teaching and learning; and Full service support through a central help desk. C2k has been awarded full accreditation by BECTA (British Educational Communications and Technology Agency), for the quality of its schools’ internet service provision. The BECTA Internet Service Provider (ISP) accreditation means that all pupils and teachers in the Province's 284 post primary and special schools can be assured that the internet services provided by C2k meet the required guidelines. C2k’s internet service is constantly monitored to ensure that children and teachers in Northern Ireland are protected against offensive emails and web site content. Further information can be found at www.c2kni.org.uk/. The project received £75.449m in EU assistance. Measure 3.1 - Open Space at Cathedral Close Previously this area of open space in front of St Anne’s Cathedral was regarded as unattractive and unsafe. It provided a gathering place for those engaged in anti-social behaviour i.e. glue sniffing and vandalism. The project received £355,237 of grant assistance. 495 BUILDING SUSTAINABLE PROSPERITY PROGRAMME VERSION 3 The redevelopment of Cathedral Close has revitalised one of Belfast’s oldest areas and linked it to the already successful waterfront developments. The enhancement of an area of 1,370 square metres has provided an attractive setting for St Anne’s Cathedral - a prominent landmark and tourist destination in the City Centre. The new versatile outdoor performance space known as Writers’ Square is capable of accommodating up to one thousand people and has attracted groups of performing and visual artists to the area. The cathedral Quarter is now more accessible and residents and those working in the area have been encouraged to enjoy the benefits of a unique urban renaissance. Writer’s Square Measure 3.2 - Community Housing Advice Project The Department for Social Development supported a Community Housing Advice Project (CHAP). This project was delivered by the Housing Rights Service, an independent charity working to protect and promote the rights of people in housing need in Northern Ireland. It received £175,622 grant assistance. This project was developed against a backdrop of escalating homelessness and rising consumer debt levels and in recognition of the need for housing advice, advocacy and representation to help prevent homelessness and alleviate poor housing conditions. A partnership approach was adopted involving Housing Rights Service, Citizens Advice and Advice NI with the aim of increasing the capacity of frontline advice agencies throughout Northern 496 BUILDING SUSTAINABLE PROSPERITY PROGRAMME VERSION 3 Ireland. Other funding was secured from the NI Housing Executive and the Community Fund. The key objectives of the CHAP project were to • Prevent homelessness by enabling people to sustain existing accommodation through debt counselling services and dealing with issues threatening their security of tenure; • Assist people to access suitable accommodation by exploring the full range of options available including social housing, low cost home ownership and the private rented sector; • Provide advice on issues associated with affordability; and • Assist clients to challenge adverse housing decisions. The project was delivered through 24 frontline voluntary advice agencies who were able to access dedicated advice and support on housing issues, a wide range of information materials, free training and bursaries for accredited training. Housing Rights Service received a prestigious National Training Award in recognition of its training services provided through this project. Measure 3.3 South Tyrone Empowerment Programme Although South Tyrone Empowerment Programme (STEP) is used below to show the types of activities and services delivered to the smaller community groups, it also provides a good example of improved inter-agency working. STEP’s examples of consultations include Pathways for Change (2004), the Review of Public Administration (2005), A Shared Future (2005), and Promoting Good Relations (2007). In response to the closure of services at the local Dungannon and South Tyrone Hospital, STEP facilitated consultation with a range of local community organisations which led to the funding of a pilot Health Action Zone for the Armagh and Dungannon area. Statutory Agencies that STEP has worked with include Southern Health and Social Services Trust, Children and Young Peoples Committee, Southern Health and Social Services Board Community Development Panel, DSD, The Health Action Zone, DEL Migrant Worker Forum, OFMDFM Race Equality Forum, DCAL Language Forum. The project received grant assistance of £146,481. 497 BUILDING SUSTAINABLE PROSPERITY PROGRAMME VERSION 3 Community Group Activity All Grassroots Organisations Provision of a STEP Drop-in Advice and Signposting Service of all community groups and individuals to support their capacity building and training needs and provide advice for problem solving. This service operates on Mondays 9am9pm and Tuesday 9am – 5pm and is staffed a range of specialist staff. It operates at full capacity and supports an average of 10 groups per week. All Grassroots Organisations STEP developed an Essential Skills Programme for members of local community organisations and has enabled more than 3,500 participants to secure accreditation of their learning and skills development All Grassroots organisations STEP developed and delivered training materials on antiracist / sectarian practice to 39 organisations across the community and statutory sector Rural Women’s Project STEP provided support and training to 25 women victims of the Troubles and helped them secure funding for 3 part-time temporary facilitators. Migrant Worker Support Groups & Community Groups STEP provided community development mentoring support to local community groups on a range of issues e.g. language barriers, racism, sectarianism, reducing funding opportunities and networking. Dungannon West Forum; Migrant Workers Forum; Volunteer Centre; Willowbank; Naiscoil Ui Neill; The Peace Factory Victims Group Provision eight training sessions on management roles and responsibilities; financial accountability; monitoring and evaluation to enable them to effectively manage their staff and activities and their legal and financial responsibilities. STEP staff also continued this support on an ad hoc basis throughout the lifetime of the BSP Project. Disability Arts Forum 300 + Organisations Annually Dissemination of policy news, funding opportunities, events etc. through monthly newsletters. All Organisations Advice and support to 79 funding applications. Dungannon Sure Start Facilitated strategy planning sessions for 37 Non-English speaking families and assisted in successful funding applications to the Southern Early Years Partnership to meet the need 498 BUILDING SUSTAINABLE PROSPERITY PROGRAMME VERSION 3 Measure 3.4 - St Malachy’s Nursery Unit The nursery unit is in the South Eastern Education and Library Board area, situated in St Malachy’s Primary School, Bangor. It was opened in September 2001. It provides part-time nursery provision for 52 children who come from the surrounding area. Twenty-five of the children are in their preschool year. One teacher and two classroom assistants are employed with general services being shared with the host primary school (St Malachy’s Primary School). The total cost of the nursery unit was £82,571.96 (inclusive of ‘kitting out’ costs) out of an initial estimate of £95,000. The EU support provided was £41,285.98. As a precursor to an Education and Training Inspectorate (ETI) inspection (of the Primary School and Nursery Unit) ten parents submitted a written comment about the nursery; the written comments indicated that the parents were satisfied with all aspects of the nursery’s provision. The inspection findings endorsed the grounds for their confidence in the nursery’s work. Summarised findings of the Education and Training Inspectorate evaluation: o There is a happy, caring and welcoming atmosphere throughout the nursery and relationships between the staff and the children are very good. o The staff are hard-working and dedicated and encourage the children to attempt new activities. o The staff work very well as a team in the best interests of the children o The playroom is bright and interesting and good use is made of photographs and of a wide range of the children’s art work to create colourful displays. o Interest areas, supported by appropriate books and pictures, stimulate the children’s curiosity and increase their knowledge of the environment. o The parents are welcomed into the life of the nursery 499 BUILDING SUSTAINABLE PROSPERITY PROGRAMME VERSION 3 o There are good opportunities for the parents to assist in the nursery and to participate in school trips. o The curriculum is broad and balanced o A good range of play opportunities is provided; the activities are well developed and make use of some unusual and interesting resources to stimulate the children’s imagination. o The children enjoy a variety of creative experiences involving painting, printing, cutting, sticking and modelling. o Appropriate mathematical language is developed through the children’s play o Elements of science and technology are also introduced effectively through the play activities The strengths of the nursery include: o the happy, caring and welcoming atmosphere; o the hard-working and dedicated staff; o the good relationships between the staff and the children; o the thoughtful and unobtrusive organisation of the daily routines; o the planning for, and the monitoring and evaluation of, the children’s learning; o the behaviour of the children. Overall, the quality of the education provided in this nursery unit is very good; the needs of the children are being well met. Nursery Unit Play Area 500 BUILDING SUSTAINABLE PROSPERITY PROGRAMME VERSION 3 Measure 5.1 (DOE) - Mourne Interpretation & Information Strategy The project aimed to produce information packs on the Mourne Area of Outstanding Natural Beauty (AONB) for the use of schools, universities, local communities and visitors. The pack produced information cards giving details on such topics as biodiversity, farming, fishing and cultural heritage. The project received £6,468 in grant assistance. The Mourne Education Sheets were launched by the Chief Executive of the Mourne Heritage Trust. The sheets, which are aimed at Primary Schools for Key Stage 1 and 2, cover seven key themes about the Mourne Area. The Themes – ‘Mountains of Mourne, Evidence of the Past, Food from the Mournes, Living in the Mournes, Biodiversity, Mourne Coast, The Mournes a Place to Visit’, each have a pupil sheet specifically aimed at Key Stage 1 and Key Stage 2 as well as a teachers advisory sheet. These can be found at www.mournelive.com/publications/index.asp 501 BUILDING SUSTAINABLE PROSPERITY PROGRAMME VERSION 3 Measure 5.1 (DRD) - Carran Hill Water Treatment Works Carran Hill Water Treatment Works was officially opened by Regional Development Minister Conor Murphy MP MLA, on 26 July 2007. This project was part funded by Building Sustainable Prosperity (BSP) Programme which provided £3.95 million funding to the overall project cost of £10.4 million. The new state-of-the-art treatment works will supply up to 6.8 million litres of water every day and will serve a population of 20,000 from Crossmaglen and the surrounding area in South Armagh. In recognition of its environmental efforts in terms of design, construction and commissioning, the Carran Hill project was recently awarded ‘Excellent’ status in the environmental 2006 Civil Engineering Environmental Quality (CEEQUAL) Awards. Carran Hill Water Treatment Works (WTW) is situated on the outskirts of Crossmaglen in County Armagh. The Works treats water from nearby Lough Ross, which historically has been plagued with algae problems. The existing works was reaching the end of its useful life and was struggling to deal with the level of algae produced during the warmer summer months. In November 2004, the joint venture partnership of Farrans (Construction) Ltd and Earth Tech Engineering was awarded a £10m contract to construct a modern new treatment works that would produce high quality drinking water in line with the latest EU directives. Being the fifth in a series of water treatment works to be built as part of Northern Ireland Water’s ‘Water Quality and Treatment Framework’, the contractors at Carran Hill were able to adopt many of the lessons learnt from previous contracts. At the core of the framework is innovation and best practice, with Northern Ireland Water working with its supply chain to implement ‘lean thinking’ modern construction techniques to drive out waste in the design construction and commission of water treatment facilities. 502 BUILDING SUSTAINABLE PROSPERITY PROGRAMME VERSION 3 The new Carran Hill WTW has been carefully designed so that its exterior blends in with the surrounding countryside. Curved roofs and green cladding are two of the aspects which have been adopted to make the building more aesthetically pleasing in a rural environment. Inside the works the treatment process has been set up to allow all the water entering the plant to be recycled. This means that all water used during each of the treatment stages i.e. water used to wash out filters, or water that is produced from the sludge process, is put back to the source of the works. The project is designed to minimize the amount of concrete. Cast in situ concrete tanks, usually used in the final stages of water treatment process, were replaced by stainless steel tanks which were fabricated off site and set in place prior to the roof construction. The footprint of the building was substantially reduced and finish levels reviewed to minimize the amount of rock excavation. Adoption of Respect for people Initiatives and benchmarking performance of key suppliers/sub-contractors on site with respect to site safety, quality, workforce satisfaction, working environment and team effectiveness, allowed continuous feedback and improvement measures to be incorporated during delivery of the project. The open book partnering approach adopted by the team, through the fostering of good relationships with key strategic and local suppliers, is clearly one of the major factors why this project has proved to be a success, being delivered under budget, to appropriate quality and two months ahead of schedule. Conor Murphy – MP MLA Katharine Bryan – Chief Executive NIW Trevor Haslett – Director of Engineering Procurement 503 BUILDING SUSTAINABLE PROSPERITY PROGRAMME VERSION 3 Measure 6.1 – Technical Assistance Technical Assistance provides the resources to cover costs of management and monitoring, control, information and publicity. Examples of the types of activities which were undertaken include: Studies to develop appropriate monitoring and evaluation approaches for the BSP Programme and the Community Support Framework (CSF); Mid term and other evaluations of Measures, Priorities, the Programme and the CSF; Cross-cutting studies commissioned by the CSF working groups Expenses associated with the Programme and CSF Monitoring Committees and other management activities; and Information and publicity in relation to the Programme, its impacts, including the dissemination of best practice. Technical Assistance has also been used to support officers who assist social partners and local government representatives on the Programme Monitoring Committees. 504


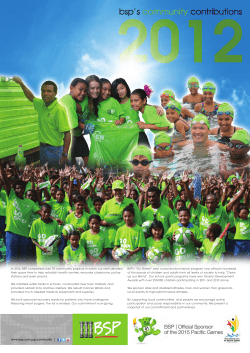


© Copyright 2026