
Study on Situation of Out of School Children (OOSC) in Ethiopia
All children in school by 2015
Global Out of School Children Initiative
Study on Situation of Out of School Children
(OOSC) in Ethiopia
Ministry of Education and UNICEF – Ethiopia Country Office
Consultant:
ATEM Consultancy Service,
Addis Ababa, Ethiopia
July 2012
Addis Ababa
Table of Contents
Page
List of Tables …………………………………………….…………………….…………i
List of Figures ………………………………………….……………………….………iii
Acronyms …………………………………………………………………….…………iv
Acknowledgments ……………………………………………………………………… v
Executive Summary …………………………………………………..…………...……vi
Introduction ……………………………………………….…………………..…………1
Chapter 1: Profiles of Excluded Children………………………………………..………6
1.1 Overview and Analysis of Data Sources…………….…..………………....………6
1.2 Profile of Children in Dimension 1………………….……………………...…….12
1.3 Profiles of OOSC in Dimensions 2 and 3…………..…….………………...…..…10
1.4 OOSC and Involvement in Child Labour…………….…….………………......…22
1.5 Profiles of Children at Risk (Dimensions 4 and 5)…. …….…………………...…31
1.6 Analytical Summary………………………………................................................38
Chapter 2: Barriers and Bottlenecks…………………………………………………….41
2.1 Background………………………………………….……………………….……41
2.2 Socio-Cultural Demand Side……………………….……………………….…….41
2.3 Economic Demand Side……………………………………………………..……49
2.4 Supply Side…………………………………………………………………..……53
2.5 Governance, Capacity, and Financing Barriers……………..…………….………65
2.6 Analytical Summary……………………………….………………………...……72
Chapter 3: Education Policies and Strategies……………..……………………….……73
3.1 Introduction…………………………………………………………………...…..73
3.2 Socio-Cultural Demand Side………………………………………………….…..77
3.3 Economic Demand Side…………………………………………………………..81
3.4 Supply Side……………………………………………………………………..…83
3.5 Management and Governance………………………………………………...…..86
3.6 Budgeting and Finance……………………………………………...………….…89
3.7 Analytical Summary…………………………………………………...……….…91
Chapter 4: Social Protection Systems in Ethiopia……………………………….…..….93
4.1 Introduction ………………………………………………………………………93
4.2 Mapping of Social Protection Programs………………………………………..…94
4.3 Impacts of Social Protection Programs in Education in Ethiopia…...………...…101
4.4 Cross-sectoral Approach in Program Implementation………………………..…104
4.5 Financial Expenditure for Social Protection Programs……………………….…105
4.6 Analytical Summary…………………………………………………….........….106
Conclusions………………………………………………………………...………….108
References………………………………………………………………………...……112
Annexes ……………………………………………………………………………….118
Annex 1: Tables………………………………………………………………...……118
Annex 2: Qualitative Data Collection Instruments……………………………..……121
Annex 3 : Typologies- Tables …………………………………………………...…124
LIST OF TABLES
Page
Table 1: Percentage of children of pre-primary age (age=6 years) in
Pre-primary or primary education, by sex and region ..…………………....…10
Table 2: Adjusted net enrolment rate (ANER), by sex and GPI ………………….……14
Table 3: Percentage and number of out of school, by age and sex based
on enrolment rate ..……………………………………………………………16
Table 4: Percentage of out of school children of primary and lower secondary
Age by region…….…………………………………………………………...17
Table 5: Percentage and number of out of school, by age and sex based
on attendance rate ………………………………………………………...…18
Table 6: Percentage of out-of-school children by school exposure, by age
group and sex …………………………………………………………..……20
Table 7: Percentage of out-of-school children by school exposure, by age
group and residence …….……………….……………………………….…..21
Table 8: Percentage of out-of-school children by school exposure, by age group and
wealth………………….…..……………………………………………….….21
Table 9. Distribution of children aged 5-17 years, by school attendance, age,
sex and place of residence……………..…………………………………..….22
Table 10. Distribution of children aged 10-17 years who were working and
attending school, by effect of work on schooling, 2001………………..……23
Table 11. Child Labour and children not in school ………………………………...…26
Table 12: Out-of-school children in economic activity by sector of employment….….27
Table 13. Percentage of 5-14 children attending school and involved in child
labour versus those who are not involved in child labour ...……………..…28
Table 14: Primary net attendance rate and gross attendance rate by wealth ………..…30
Table 15: Dropout rate by grade at the primary and lower secondary level by sex
and region………….…………………………………………………………32
Table 16: Dropout rate by age and sex from household data …………………………33
Table 17: Repetition rate by grade at the primary and lower secondary
level of education, by sex and region ……………………………….………35
Table 18: Percentage of new entrants to primary education with no
ECCE experience ……………………………………..………………….…37
Table 19: Transition rate from primary to lower secondary education ………..………37
Table 20: Primary completion rate by sex ……………………………………………38
Table 21. Magnitude of violence in Ethiopia ……………………………………….…43
Table 22. Status of early marriage ………………………………………………..……45
Table 23. Places for abducting school girls ……………………………………………47
Table 24. Distance in kilometre to the nearest primary school ……………………..…56
Table 25. Schools with basic infrastructure and facilities ………………………..……58
i
Table 26. Pupil-Teacher Ratio (PTR) …………………………………………….……62
Table 27. Proportion of female teachers ………………………………………….……63
Table 28. Percentages of qualified teachers in primary schools ……………….………64
Table 29. Education expenditure/spending ……………………………………………68
Table 30. Education budget, by region (in millions) …………………………..………70
Table 31. Distribution of organizations and children, by type of
educational support ……….………………………………………..………101
Table 32. Channel 1 expenditure on social-protection-related interventions …..….…105
ii
LIST OF FIGURES
Page
Figure 1: Percentage of children of pre-primary age (6 years) attending pre-primary
or primary education, by region ………………………………………………11
Figure 2: Primary net enrolment rate by year ………………………………..……….…14
Figure 3: Primary net enrolment rate by sex and year ………………………………..…15
Figure 4 : Percentage of children attending school by age ……………………………19
Figure 5 : Percentage of children out of school and in school by age group ……...……19
Figure 6: Percentage of out-of school children by school exposure …………….………20
Figure 7: Primary net and gross attendance rates by wealth quintile ……………………30
Figure 8: Primary net attendance rate by wealth quintile in 2005 and 2011…….…….…31
Figure 9: Trend analysis of school drop out by sex and year ……………………………34
iii
ACRONYMS
5DE
Five Dimensions of Exclusion
ABE
Alternative Basic Education
ANER
Adjusted net enrolment rate
CMF
Conceptual and Methodological Framework
EC
Ethiopian calendar
EDHS
Ethiopian Demographic and Health Survey
EFA
Education for All
EMIS
Education Management Information System
ESAR
Eastern and Southern Africa Region
ESDP
Education Sector Development Program
GC
Gregorian Calendar
GEQIP
General Education Improvement Program
GER
Gross Enrolment Rate
GPI
Gender Parity Index
ISCED
International Standard Classification of Education
JRM
Joint Review Mission
M&E
Monitoring & Evaluation
MDGs
Millennium Development Goals
MOE
Ministry Of Education
MOFED
Ministry of Finance and Economic Development
NER
Net Enrolment Rate
OOSC
Out-of-school children
PASDEP
Plan for Accelerated and Sustained Development to End Poverty
REB
Regional Education Bureau
SIP
School Improvement Program
SNNPR
Southern Nation Nationalities Peoples Region
TVET
Technical and Vocational Education and Training
UIS
UNESCO Institute for Statistics
UNDP
United Nations Development Programme
UNESCO United Nations Educational, Scientific and Cultural Organization
UNICEF
United Nations Children’s Fund
UNPD
United Nations Population Division
UPE
Universal Primary Education
USAID
United States Agency for International Development
iv
Acknowledgements
This study was made possible by contributions from a large number of individuals and
institutions. Special thanks go to Solomon Shiferaw, Director, Planning, EMIS and
Resource Mobilization Directorate of the Ministry of Education, for his overall direction
and support; and to Sibeso Luswata (Ed.D), Chief Education UNICEF Ethiopia in leading
the process and providing guidance and feedback from UNICEF’s side. The technical
work was led on MOE’ side by Rahel Yergashewa , Head of EMIS Sub-process; and on
UNICEF’s side by Setotaw Yimam , Education Specialist.
It would not have been possible without the contribution of time, energy, technical
follow up, input and commitment from the EMIS Working Group chaired by Rahel
Yergashewa and included Asmelash Meresa , Melkie Kassaw, Tesfaye Jinore, Adamu
Gnaro from MoE; Isaac Abraham (UNESCO), Setotaw Yimam (UNICEF) and Shumye
Molla UNICEF). Sincere thanks are also extended to Tizie Maphalala (UNICEF
Ethiopia) who provided feedback at various stages of the study.
Regional Education Bureaus and UNICEF’s Field Offices provided invaluable support
and facilitation for the qualitative survey. Very useful comments and feedback were
obtained from the validation workshop chaired by Demissew Lema from MoE in which
invited government and development partners took part. The report has benefited by the
feedback from Jim Ackers, the UNICEF- ESAR Education Advisor; and Akihiro
Fushimi, former Education Specialist in ESAR.
Marc Bernal, UIS Regional Advisor, Nairobi, was instrumental in training and developing
the capacity of the EMIS Working Group and the Consulting Team members on the
conceptual framework, the methodology and the typologies for the OOSCI. Sheena Bell
and Friedrich Huebler, of UNESCO Institute for Statistics (UIS) had been reviewing the
draft reports critically for data consistency and accuracy, conceptual clarity as well as
correctness of analysis and interpretation of data. Their professional and incisive
suggestions for improvement of the draft reports accord due appreciation.
ATEM Consultancy Service, whose members included Amare Dejene (Coordinator),
Wossenu Yimam (Ph.D), Bulti Gutema (Ph.D), Tamiru Demeke, and Bonsa Baysa
deserves much commendation. The relentless effort and personal commitment
demonstrated by Amare Dejene have led to the successful completion of this assignment.
Animaw Anteneh (Ph.D) was the principal editor of the document. Meron Fantaye
rendered her services as a graphic designer. Liv-Heidi Pedersen, a JPO in UNICEF, also
contributed in editing.
Disclaimer
Any data inconsistencies, conceptual flaws, or other errors, however, are the sole
responsibility of the consulting Firm. The views expressed in the report are those of the
author (consultant) and do not necessarily reflect the views of Ministry of Education of
the Federal Democratic Republic of Ethiopia and UNICEF.
v
EXECUTIVE SUMMARY
Country Context
Ethiopia's total land area is about 1.1 million square km., of which about two thirds is
estimated to be potentially suitable for agricultural production. Out of the total land
suitable for agriculture, the cultivated land is estimated to be 16.5 million hectares (22%).
About 96% of the cultivated land area is under smallholder farming while the remaining
is used for commercial farming (both state and privately owned). Per capita cultivated
land holding averages only around 0.5 hectare. Currently, Ethiopia has a three-tiered
federalist system of government, comprising the federal government; nine administrative
regions and two chartered city administrations; and over 800 woredas and sub-cities. The
government is made up of two tiers of parliament: the House of Peoples' Representatives
and the House of Federations, where political leaders are elected every five years. The
federal government is committed to decentralizing power which is aimed at providing
each region with autonomy. This is accompanied by fiscal decentralization which
devolves decision-making powers to lower tiers of government. Ethiopia's economic
activities have shown encouraging results over the last fifteen years. The Government is
committed to achieving economic stability and keeping inflation low. Average real GDP
growth rates of over 10 percent were registered between 1996 and 2008/2009. This recent
growth translated in an increase in average GDP per capita income, from US$ 102 in
2000/1 to US$ 220 in 2007/8.
The Education Sector and Profiles of Excluded Children in Ethiopia
The economic and social development of Ethiopia has demanded profound improvements
in the education sector. Accordingly, within the framework of the 1994 Education and
Training Policy, three Education Sector Development Programs/ESDPs have been
developed and implemented since 1997 and the fourth ESDP has been launched recently
to guide the operation of the education system by focusing on the following priority
programs: a) quality and internal efficiency: ensuring student completion and
achievement; b) equity in access: reaching the marginalized and un-reached; c) adult
education (with specific attention to Functional Adult Literacy; d) focus on sciences and
TVET; and e) improving management capacities. Consequently, commendable results
have been registered in expanding access to educational opportunities and improving
quality, relevance, equity, and efficiency of the education system. Despite these
achievements, there are still more than three million of out-of-school children that have
never enrolled or that have dropped out of school.
The profiles of excluded children in the country were examined using the Five
Dimensions of Exclusion model introduced by UNICEF and the UNESCO Institute for
Statistics. According to this model, the five dimensions are defined as follows: Dimension
1: children of pre-primary school age who are not in pre-primary or primary school;
Dimension 2: children of primary school age who are not in primary or secondary school;
vi
Dimension 3: children of lower-secondary school age who are not in primary or
secondary school; Dimension 4: children who are in primary school but at risk of
dropping out; and Dimension 5: children who are in lower-secondary school but at risk of
dropping out.
Regarding the profile of OOSC in Dimensions 2 and 3, there are 4,878,385 out of school
children based on the administrative data using enrolment rates. Of these, 3,075,862 are
in the primary age group and 1,802,523 are in the lower secondary age group as per the
structure of the Ethiopian education system (primary 1-8; lower secondary grade 9-10).
According to the International Standard of Education Classification, the number of out of
school children in the primary age group (Grades 1 to 6) and in the lower-secondary age
group (Grades 7 to 10) is 5,017,181 and 2,522,319 respectively as computed from the
Ethiopian Demographic and Health Survey (EDHS) 2011 data.
Concerning the profiles of children in Dimensions 4 and 5, the drop-out rate varies, by
grade level, students’ sex, and region. As regards grade variation, it is very high in the
first grade of primary education and tends to decline consistently in the next higher grades
with some exceptions that are observed in grades 5 and 8. In terms of students’ sex, in
most cases the drop-out rate is slightly lower for boys than it is for girls. Concerning
regional variation, the highest is observed in the Somali region.
Purpose of the Study
The major purpose of this study is to assess the situation of out-of-school children
(OOSC) in Ethiopia and suggest strategies that would help introduce a more systematic
approach to address the problems of children excluded from educational opportunities
and guide concrete education sector reforms towards more equitable coverage of basic
education in Ethiopia and thereby achieve the education MDGs and EFA goals. More
specifically, this study intends: to examine the detailed profiles of out-of-school children
in Ethiopia (Chapter 1), to scrutinise major barriers and bottlenecks to school
participation (Chapter 2), to analyze existing policies and strategies designed to tackle
key bottlenecks (Chapter 3), and to explore existing social protection programs and
interventions that contribute towards mitigating problems of out-of-school children in the
country (Chapter 4).
Methodology
The following methods and procedures were employed to attain the above-mentioned
purposes of the study.
a) Review of available documents related to OOSC
Quite a number of documents were identified from relevant ministries as well as
government and non-government organizations and reviewed thoroughly.
b) Review of quantitative/statistical information from secondary sources
vii
The 2007 population and Housing Census of the Central Statistics Agency, the 2009/2010
Education Statistics Annual Abstract of EMIS/MoE and EDHS 2011 were used as major
data sources and fourteen templates were filled in from these and other data sources.
c) Review of qualitative data from six sample regions (Somali, Gambella, Oromia,
SNNPR, Amhara and Addis Ababa) through the use of interview protocols, focus group
discussion/FGD guides, and case study checklist
The quantitative data were analyzed using descriptive summaries, disparity analyses,
trend/time series analyses, and regression analysis. The qualitative data were categorized
into themes and summarized at regional level and ultimately integrated to see the most
prominent issues related to the 5DEs. Finally, tables, graphs and typologies were produced
to highlight the major findings of the study.
Limitations of the Study
In undertaking this study, the country team has encountered some challenges. The paucity of
administrative data on the profile of out-of-school children in terms of the five dimensions of
exclusion (5DEs), coupled with inaccessibility of the household census of 2007 survey raw
data, has curtailed the effort of the study team to make rigorous statistical analyses on
important household characteristics and produce detailed disaggregated data/results related
to children at risk. Due to this, the information and data from EDHS 2011 was obtained from
UIS to construct the typology of out-of-school children.
Another limitation was the unavailability of enrolment data by ethnic group. This has been
challenging as children from various ethnic background live dispersed in all regions.
Ethiopia is a country of over 80 ethnic groups. The EMIS administrative data and other data
sources do not capture enrolment by ethnic group. As a result it was not possible to analyze
the disparity among the various groups.
Unavailability of data by single year of age in the DHS Report was another challenge. To
overcome this, there was a need to use the enrolment data by age as computed by the
EMIS based on the school age population obtained from the Central Statistics Agency for
the same year.
The time specified for undertaking the country study was not compatible with the nature
of the task. As it was an innovative approach, it was not easy even to conceptualize the
five dimensions of exclusion, the typologies and formulae contained in the Conceptual
and Methodological Framework/CMF developed for the purpose.
The aforementioned constraints might have their negative bearing on the quality of the
study report.
viii
Summary of Findings and Conclusions
Profiles of Excluded Children: The analysis of data on Dimension 1 revealed that only
about 11% of pre-primary school-age children (6 years) attend education at pre-primary
and primary schools. Regional variations were observed in terms of attendance and
enrolment rates at this level of education.
Regarding the profile of OOSC in Dimensions 2 and 3, out of school children are
estimated to be over 3 million in the primary age group and over a million under lower
secondary in the Ethiopian education structure. The estimation is higher when attendance
rate is considered since dropout of school children is observed throughout the year after
enrolment data is captured.
The age of this population varied from 7 years for Grade 1 to 16 years for Grade 10.
Besides, a relatively high percentage of children dropped out of primary schools.
Moreover, as the age of the children increased, the dropout rate also increased. From this
it was possible to identify the following three categories of dropouts:
a) children who dropped out in early grades and thus were unlikely to have acquired
even the most basic mastery of reading, writing, numeracy and other skills;
b) children who dropped out after completing the primary cycle and who may not
continue their education at secondary level; and
c) children who may leave school before or after completing lower-secondary
education.
The percentages of those children whose ages were 7 and 8 and who joined the primary
education as new entrants were found to be high as compared to those of the older
children. It should be emphasized that leaving school without completing the full cycle of
primary education is still problematic. The analyzed data further indicate that those
children who live in rural areas are prone to be OOSC. All these situations may pose a
serious problem for the education system.
The OOSC gender difference is higher at lower ages and almost at parity after age 13.
The findings further indicated that, even though high gross and net enrollment rates were
recorded at national level, over three million children of primary and lower secondary age
were still out of school. It was also clearly observed from the findings that a sizeable
portion of the school-age children were not attending school due to their engagement in
productive and housekeeping activities. Besides, more girls than boys did housekeeping
work and more boys than girls were engaged in economic activities. In general, child
labour was found to be common both in rural and urban areas of the country, though the
participation of rural children is higher than their urban counterparts.
Concerning the profiles of children at risk in Dimensions 4 and 5, the results disclosed
that the dropout rate from primary and lower-secondary education varied from grade to
grade, region to region, and according to students’ sex. Moreover, dropout as well as
repetition rates at primary and lower-secondary levels were found to vary by grade,
ix
region, and sex. Furthermore, the transition rate from primary to lower-secondary
education showed that 80% of both male and female students in the final grade of primary
education were able to enter the first grade of lower-secondary education.
The disaggregated data by wealth and region further unveiled that those in the highest
wealth quintile had better attendance and enrolment rates, especially at the lowersecondary level. This indicates the need to motivate or to give the necessary support like
educational materials and uniform for poor students. In terms of region, the highest
percent of OOSC was documented in Afar, Somali, Addis Ababa, Dire Dawa, and Harari,
whereas the lowest was found in Tigray and Amhara. The trend analyses also revealed
that enrolment rates had increased significantly in the past 15 years. The
multivariate/regression analysis also disclosed that enrolment rates varied significantly by
residence, age, sex, and region.
Barriers and bottlenecks: Education barriers and bottlenecks are directly or indirectly
related to the demand for and supply of education. The demand for education can be
affected by socio-cultural and/or economic barriers and bottlenecks. On the other hand,
the supply of education is affected by the availability of finance to provide physical and
human resources. The socio-cultural barriers are expressed in terms of violence against
children/gender-based violence, harmful traditional practices, lack of awareness about the
ultimate benefit of education, wrong attitude towards children with disabilities and female
children. On the other hand, the economic demand side comprises poverty, the costbenefit of education, being orphan, seasonal factors and migration.
As far as the supply side is concerned, basic services such as textbooks and learning
materials, separate latrines for boys and girls, accessible services for children with
disabilities, etc. were found to be among the major barriers. With regard to political
governance and capacity, it is apparent that the Ethiopian Government has shown its
commitment by expanding schools and increasing the annual budget for education.
However, the weak partnership with NGOs and CSOs in addressing the problems of
OOSC, the absence of comprehensive data on the profiles of OOSC, and the inequitable
resource allocation are identified as bottlenecks.
Education Policies and Strategies: In Ethiopia primary education lasts 8 years and is
split into Grades 1-4 (primary first cycle) and Grades 5-8 (primary second cycle).
Secondary education is also divided into two cycles each with their own specific goals.
Grades 9-10 (secondary first cycle) provides two years of general secondary education
and upon completion students are streamed either into Grades 11-12 (secondary second
cycle) as preparation for university, or into technical and vocational education and
training (TVET), based on performance in the secondary education completion
examination.
Within the framework of the 1994 Education and Training Policy (ETP), the Government
of Ethiopia launched the first five year Education Sector Development Program (ESDP I)
in 1997 as part of a twenty-year education sector plan. Since the inception of ESDP I
x
there has been a dramatic increase especially in primary school enrolment. The target set
for ESDP I of raising primary enrolment from 3.7 million to 7 million was surpassed with
enrolment reaching 8.1 million in 2000/01. This trend continued throughout the duration
of ESDP II (2000/01- 2004/05), III (2005/06-2010/11) and IV (2010/11-2014/15) with
primary school enrolment reaching around 15.8 million in 2009/10.
Review of the available policy documents and strategies shows that the issue of out-ofschool children (OOSC) in terms of the five dimensions of exclusion (5DEs) is not
emphasized in the Ethiopian education system. Although the recently launched Education
Sector Development Program (ESDP IV: 2010/11-2014/15) includes a detailed discussion
on improving equity and access in general education, it does not consider particularly
those children who are in primary and lower-secondary schools that are at risk of
dropping out from schools (Dimensions 4 and 5) as one of the challenges of the education
system. This indicates that the issue of excluded children is not fully addressed in our
education system. It was also observed that, though the country has had its own education
and training policy since 1994, it lacks an education act/law which would serve to enforce
education-related policies and standards; determine the authority, responsibility and
accountability of stakeholders; and ensures the rights of children excluded from
educational opportunities. Although Building Code No. 24/2009 has been put in place
recently, the construction of schools does not still take into consideration the needs of
children with disabilities. Despite the rapid expansion of the system, Ethiopia’s education
sector faces the following four key challenges: access to education opportunities
continues to be an obstacle, especially for females and other most vulnerable children,
poor students and pastoral or semi pastoral areas; inequities in the provision of quality
education are widespread, as better resourced schools are generally located in urban areas
and in the non-emerging regions; there are socio-cultural barriers to participation
(especially for girls in rural areas); and there are financial constraints with households
paying a large share of non-salary recurrent education expenditures.
The ESDP IV (2010) document states that, notwithstanding the significant progress in
access and the improvements in some equity indicators (e.g., gender parity index in
primary education), participation levels at primary education remain much lower in some
of the emerging regions and among pastoralist and semi-pastoralist groups. Overall, more
than three million primary school-age children are out of school in the country. The rural
population in general faces serious accessibility constraints at secondary level.
Alternative Basic Education (ABE) has developed rapidly and helped in increasing
enrolment rate but problems of low quality and of transition between ABE centers and the
formal school system still prevail.
Social Protection systems: Though there are policies and program initiatives that are
implemented to help people not to fall into and to escape from poverty, Ethiopia has not
yet developed comprehensive and integrated social protection systems with robust
implementation strategies and plans of action. Fragmented efforts that the government has
made so far through different pro-poor interventions, including legal and policy reforms
xi
have not reduced vulnerability and poverty to the expected level. According to the 2008
UNDP report, 39% of the people are unable to meet basic nutritional and non-food needs.
Official documents also reveal that the head count, poverty gap and poverty severity
indices in 2004/2005 for rural areas were lower than the levels five years ago by 13, 31,
and 41 percent, respectively. Despite the efforts made through different reforms and
initiatives to improve the livelihood of all citizens including children, several national
strategies and programs and implementation modalities have not mainstreamed the
responsibilities of the relevant institutions operating at different levels. This has
jeopardized the implementation of policies and programs and resulted in insignificant
improvements of people’s livelihood.
The leading agency in the area of social protection is assumed to be the Ministry of
Labour and Social Affairs at the federal level and similar departments of the regional
bureaus of the same sector. But there is no appropriate structure down to the grassroots
where social protection programs are actually implemented. On the other hand, some of
the policies developed to address social protection issues of the vulnerable section of the
society are found to be outdated and need to be revised in order to incorporate emerging
issues related to globalization. Furthermore, as a result of the ineffective coordination
mechanism, the Developmental Social Welfare Policy has become outdated showing no
tangible change in multi-sectoral ways of approaching issues related to social protection.
Though the country has taken remarkable steps in enacting laws and issuing relevant
policies that have bearings on the plights of all citizens, there are still gaps with regard to
consolidating child law and child protection policies. Experience has also shown that the
Ethiopian social protection strategies mainly focus on protection interventions rather than
preventive programs which aim at creating conditions that would enable the targets to
cope with the incidence before they fall into shock and vulnerability.
Recommendations
Policies and strategies for supporting out-of-school children in Ethiopia and closing the
remaining net enrolment gaps will require making hard decisions by policy makers,
particularly given the current context of inequity and inefficiencies. Addressing the five
dimensions of out-of-school children (OOSC) will also require a much stronger policy
framework for bridging the resource divide, which has primarily focussed on supply side
policies without adequate attention to the demand side barriers and bottlenecks to OOSC.
New approaches to addressing the 5DEs will also require short-term and longer-term
policies which attempt to address the structural inequities which characterise the out-ofschool children’s profile.
Hence, the Ministry of Education and Regional Education Bureaus , in collaboration with
other stakeholders, should make a concerted effort and take appropriate actions in order to
solve the barriers and bottlenecks related to out-of-school children and enable the
education system attain UPE by 2015.
xii
Experience in the world shows that the challenge becomes harder in the last 10-15% of
out of school children. This is the most marginalized group with multiple disparities who
remain out of reach and who face considerable disadvantage in overcoming the two main
hurdles-entering schools and progressing through the cycle. To this effect, the following
courses of action are recommended by the country study team:
A concerted nation-wide effort should be made to identify those children who
have dropped out and those who are at risk of dropping out and search for the
means to help these children continue their education.
Due attention should be given to providing children with textbooks and other
learning materials; fulfilling basic facilities such as drinking water and separate
latrines; and making schools suitable for children with disabilities.
The current increasing enrolment trend must be maintained by encouraging two
targets of the population. Firstly, those children at the primary age group should
be able to attend formal education continuously. Secondly, those children above
the age of 14 need to be enrolled in school as much as possible by age 17. Side
by side, strategies ought to be designed to decrease dropout and repetition rates.
Moreover, appropriate strategies must be designed to address the needs of the
pastoralist/semi-pastoralist communities in general and vulnerable children in
particular.
Pre-primary education need to be expanded both in the formal and non-formal
school readiness programmes as it has a contribution to decreasing dropouts and
improving learning achievements in primary. It will also minimize the late entry
into the first grade of primary school, which is a major barrier to achieving
universal primary education, as children who start school late are more likely to
drop out before they complete the cycle.
Alternative modes of delivery of education need to be initiated in order to
address the education of late entrants
A series of discussions should be held with the community regarding the benefits
of education and the rights of children. The issue of OOSC should also be
advocated in such discussions.
Back to school campaign need to be intensified in a sustainable and systematic
way so that who dropped out of school re-enter and continue their education.
Committees that will work on returning OOSC to school should be established in
all schools and these committees should be supported.
Solutions for addressing the problems of those children who are already out of
school will need to be integrated with the issue of addressing the needs of
children at risk of dropping out of primary and lower-secondary schooling over
the next four years.
In order to remove gender-based violence and bring about behavioral change in
schools and communities at large, advocacy work should be done consistently.
Moreover, sensitization and other behavioral change communication training
xiii
should be given to teachers, students and community members on laws, rules
and regulations issued by the government in relation to violence against children.
Teachers should be trained on how to handle children with disabilities and the
society should be sensitized to avoid stigma and discrimination in this regard.
Partnership with national and international NGOs and CSOs should be
strengthened in order to address the problems related to OOSC.
Tracking the dimensions of exclusion requires new systems of capturing OOSC
data, along with better tracking systems of those who are likely to drop out.
Hence, EMIS data collection formats should be upgraded to capture data on the
profile of OOSC, the marginalized and the disadvantaged to facilitate monitoring
on their access and integration in mainstream schools and progress.
There should be stronger relationships between the Ministry of Education, the
Central Statistics Agency, the Ministry of Health, and other relevant institutions
to ensure that vital data on the OOSC profile is collected through the census, the
demographic health survey, and poverty-related studies. This collaboration will
also help to coordinate work and refine indicators on OOSC in the country.
Political, religious and community leaders should work closely with the
respective government officers in order to reduce the number of OOSC.
Better strategic approaches and much closer collaborations among the Ministry
of Education and similar ministries in other African countries with high rates of
OOSC are needed to learn from their best practices and address the problems of
OOSC in the country.
There is a need to put in place comprehensive and integrated social protection
systems with adequate implementation strategies, plans of actions, and budgets
so as to fully address vulnerability and poverty.
A national orphan support program with an adequate budget should be put in
place so as to address the problem of this section of the society.
Re-activating socio-cultural values that promote support in times of crisis and
shock would play a crucial role in building resilience to emergencies. This type
of community support mechanisms have to be brought on board in a new
approach.
Abolishing primary school fees has helped reduce costs, but has not removed the
cost barrier to enrolment for the poorest. Non-fee costs, such as school uniforms
and supplies, can be substantial, particularly for poor households, and require
additional solutions. In this regard, it may be essential to initiate and strengthen
social protection policies to help households send children to school. This
includes targeted scholarships to offset education costs; conditional and
unconditional cash transfers by way of providing cash grants to poor households
that meet criteria such as school attendance ; or unconditionally for certain
population groups.
xiv
INTRODUCTION
Country Context
Geographic Context
Ethiopia's total land area is about 1.1 million square km., of which about two thirds is estimated to
be potentially suitable for agricultural production. Out of the total land suitable for agriculture, the
cultivated land is estimated to be 16.5 million hectares (22%). About 96% of the cultivated land
area is under smallholder farming while the remaining is used for commercial farming (both state
and privately owned). Per capita cultivated land holding averages only around 0.5 hectares.
Political and Socio-economic Development Context
Currently, Ethiopia has a three-tiered ethnic-based federalist system of government, comprising
the federal government; nine administrative regions and two chartered city administrations; and
over 800 woredas and sub-cities. The government is made up of two tiers of parliament: the
House of Peoples' Representatives and the House of Federations where political leaders are
elected every five years. The federal government is committed to decentralization that provides
each region with autonomy accompanied by fiscal decentralization which devolves decisionmaking powers to lower tiers of the government.
Ethiopia's economic activities have shown encouraging results over the last fifteen years. The
Government is committed to achieving economic stability and keeping inflation low. Average real
GDP growth rates of over 10 percent were registered between 1996 and 2008/2009. This recent
growth translated in an increase in GDP per capita income, from US$ 102 in 2000/1 to US$ 220
in 2007/8. The proportion of people below the poverty line at national level measured by the
poverty head count index declined from 44.2% in 1992 to 38.7% in 2004/05. Much of the decline
in national poverty is attributed to improvements in rural areas. The significant decrease in rural
poverty is attributed to the wide-ranging and multi-faceted pro-poor programs that have been
implemented in rural areas such as extension programs to support commercialization of
smallholder agriculture, the Food Security Program, and the recent Productive Safety Net
Program, among others. However, there has been a relative increase in income inequality in urban
Ethiopia as measured by the increase in the Gini Coefficient from 0.38 in 1992 to 0.44 in
2004/05. The agricultural sector is the major driver of the economy and is a source of income for
the majority of the population. The sector contributes about 50% to the total GDP, generates
about 90% of the export earnings, and supplies about 70% of the country’s raw material
requirement for large and medium-sized industries that are agro-based.
The government strategy to invest heavily in infrastructure and social services as a way of jumpstarting a strong private-sector-led growth had created a rapid expansion in domestic demand and
contributed to the overall GDP growth in the last several years. Analyzing employment by sector,
Ethiopian rural areas are dominated by employment in agriculture, which is nonetheless following
1
a declining trend, shifting from 96.6 per cent in 1994 to 88.1 per cent in 1999. Employment in
services shows an increasing pattern, especially in wholesale and retail trade, and hotels and
restaurants. The manufacturing sub-sector has also been growing. The decline in work in
agriculture has been compensated by an increase of women’s employment in the abovementioned sectors.
The Education Sector and Main Players/Stakeholders
As indicated in the ESDP IV, the economic and social development of Ethiopia’s population has
demanded profound improvements in the education sector. Accordingly, ESDP IV was developed
to guide the operation of the education system by focusing on priority programs which help
realize these improvements. The core priorities in the education system in the coming years are
grouped under the following five main themes: a) quality and internal efficiency: ensuring student
completion and achievement; b) equity in access: reaching the marginalized and un-reached; c)
adult education (with specific attention to Functional Adult Literacy); d) focus on sciences and
TVET; and e) improving management capacities.
With the introduction of the federal structure, power has been devolved to lower levels of the
government. At present the provision of education is the concurrent responsibility of the federal,
regional and local governments. The responsibilities for the three levels are clearly delineated.
The Ministry of Education, as the executing agency at the federal level, plays a more policyoriented role and acts as a change agent in leading the education sector towards the realisation of
EFA and MDGs. The regions and woredas are charged with more of operational responsibilities.
The management and financing of primary and secondary education is the responsibility of the
regions and woredas based on the national policy and standards developed and approved by the
Ministry of Education. In addition to the aforementioned government organs, a number of
external financing agencies play an active role by supporting the Ethiopian educational system.
The role of these financing agencies is not limited to providing funds; they also participate in joint
reviews and other supervision missions and are represented in the ESDP central and regional
steering committees. In addition, donors take part in the joint review missions (JRM) and annual
review meetings (ARM).
Parents/Community members are also among the key players/stakeholders who play their part
through the PTAs established in schools. The PTAs serve as the main sources of support for
schools in availing lacking facilities. They also plan the growth of the school in collaboration
with the school leadership, raise awareness of parents to advance education in general and that of
girls in particular, and create conducive school environments to make schools child-friendly. On
top of this, PTAs monitor teachers’ and students’ attendance, and solve disciplinary problems that
may arise from students or teachers. Moreover, teachers and students play a significant role
towards the effectiveness of the education system. As the main actors in the teaching learning
process, teachers are required to prepare lesson plans and deliver the lessons using an active
learning approach, to follow up the performance of each student through continuous assessment
2
methods, to maintain a friendly relationship with students, to show exemplary personality
demeanour, to council students, and to confer with parents to solve student problems. Students, on
their part, contribute their share for the smooth operation of the teaching learning process.
General Introduction to the Five Dimensions of Exclusion (5DEs) in the Country
This study follows the Five Dimensions of Exclusion (5DEs) model introduced in the Conceptual
and Methodological Framework (CMF) of the Global Initiative on Out-of-School Children
(UNICEF and UIS, 2011). The model presents five target groups of children for the data and
policy analysis that span three levels of education: pre-primary, primary and lower-secondary;
and two different population groups: children who are out of school and those who are in school
but at risk of dropping out. The definition of each of the five dimensions is presented below.
The Five Dimensions of Exclusion (5DEs) are:
Dimension 1: children of pre-primary school age who are not in pre-primary or primary school;
Dimension 2: children of primary school age who are not in primary or secondary school;
Dimension 3: children of lower-secondary school age who are not in primary or secondary
school;
Dimension 4: children who are in primary school but at risk of dropping out; and
Dimension 5: children who are in lower-secondary school but at risk of dropping out.
According to the above definitions, children of primary or lower-secondary school age are
considered as being “in school” if they participate in primary or secondary school. On the other
hand, children of primary school age or older who are in pre-primary education are considered to
be out of school according to the CMF standard definition. This study looks at the school
attendance status of primary school-age children by both including and excluding pre-primary
education.
Dimensions 4 and 5 focus on children who are at risk of dropping out. They are grouped by the
level of education they attend, regardless of their age: i.e., primary (Dimension 4) or lowersecondary (Dimension 5). There are many potential indicators for being at risk. This study looks
into the following factors and indicators to understand the profiles of children who have already
dropped out or are considered to have greater chances of dropping out: late entry, grade for age,
grade repetition, and school dropout.
Concerning the profiles of children at risk in Dimensions 4 and 5, the dropout rate from primary
and lower secondary education varies from grade to grade, region to region, and in terms of
gender. Besides, the survival rate of female students is relatively better than that of male students
though the overall survival rate to the last grade of primary education is below the average level.
Moreover, dropout rate as well as repetition rate at primary and lower secondary levels differ by
grade, region, and students’ sex. As regards the transition rate from primary to lower-secondary
3
education, 80% of both male and female students in the final grade of primary education were
able to enter the first grade of lower-secondary education.
Purpose of the Study
The major purpose of this study is to assess the situation of out-of-school children (OOSC) in
Ethiopia and suggest strategies that would help introduce a more systematic approach to address
the problems of children excluded from educational opportunities and guide concrete education
sector reforms towards more equitable coverage of basic education in Ethiopia so that the country
can achieve the education MDGs and EFA goals. More specifically, this study intends: to
examine the detailed profiles of out-of-school children in Ethiopia (Chapter 1), to scrutinise major
barriers and bottlenecks to school participation (Chapter 2), to analyze existing policies and
strategies to tackle key bottlenecks (Chapter 3), and to explore existing social protection programs
and interventions that contribute towards mitigating problems of out-of-school children in the
country (Chapter 4).
Methodology
The following methods and procedures were employed to attain the above-mentioned purposes of
the study.
a) Review of available documents related to OOSC
Quite a number of documents were identified from relevant ministries as well as government and
non-government organizations and reviewed thoroughly.
b) Review of quantitative/statistical information from secondary sources
The 2007 household survey of the Central Statistics Authority and the 2009/2010 education
statistics annual abstract of EMIS/MoE were used as major data sources, and fourteen templates
were filled in from these and other data sources.
c) Review of qualitative data from six sample regions (Somali, Gambella, Oromia, SNNPR,
Amhara and Addis Ababa) through the use of interview protocols, focus group discussion (FGD)
guides, and case study checklists.
The quantitative data were analyzed using descriptive summaries, disparity analyses, trend/time
series analyses, and regression analysis. The qualitative data were categorized into themes and
summarized at regional levels and ultimately integrated to see the most prominent issues related to
the 5DEs. Finally, tables, graphs and typologies were produced to highlight the major findings of the
study.
Limitations of the Study
In undertaking this study, the country team has encountered some challenges. The paucity of
administrative data on the profile of out-of-school children in terms of the five dimensions of
4
exclusion (5DEs), coupled with inaccessibility of the household census of 2007 survey raw data, has
curtailed the effort of the study team to make rigorous statistical analyses on important household
characteristics and produce detailed disaggregated data/results related to children at risk. Due to this,
the information and data from EDHS 2011 was obtained from UIS to construct the typology of outof-school children.
Another limitation was the unavailability of enrolment data by ethnic group from the EMIS
administrative data nor from other data sources. Thus, it was not possible to do an analysis of out of
school children by ethnic background.
Unavailability of data by single year of age in the DHS Report was another challenge. To overcome
this, there was a need to use the enrolment data by age as computed by the EMIS based on the school
age population projected and obtained from the Central Statistics Agency for the same year.
The time specified for undertaking the country study was not compatible with the nature of the
task. As it was an innovative approach, it was not easy even to conceptualize the five dimensions
of exclusion, the typologies and formulae contained in the Conceptual and Methodological
Framework (CMF) developed for the purpose.
5
CHAPTER 1: PROFILES OF EXCLUDED CHILDREN
This chapter presents profiles of excluded children in Ethiopia based on the Conceptual and
Methodological Framework developed by UIS and UNICEF. It is organized into six sections. The
first section focuses on overview and analysis of data sources while the second deals with profiles
of excluded children in Dimension 1. Sections three and four discuss profiles of OOSC in
Dimensions 2 and 3 as well as OOSC involvement in child labour. The chapter then proceeds to
the discussion of profiles of children at risk in Dimensions 4 and 5 and culminates by highlighting
the analytical summary.
1.1 Overview and Analysis of Data Sources
The research team has identified different data sources from relevant ministries as well as
government and non-government organizations. The two major data sources for the study are the
Education Statistics Annual Abstract of EMIS/Ministry of Education and the population and
housing census (household survey) of the Central Statistics Agency. While the EMIS data serve to
generate the enrolment rate and other indicators, the household data serve to generate the
attendance rate in the estimation of D2 and D3. These two major data sources and two additional
sources (the Child Labour Survey and the Ethiopian Demographic and Health Survey) were used
in Chapter One to show the profiles of excluded children. In the Ethiopian context, Grades 1 to 8
are classified as primary while Grades 9 and 10 are classified as lower-secondary. In the
International Standard Classification of Education (ISCED), Grades 1 to 6 are classified as
primary while Grades 7 to 10 are classified as lower-secondary.
The classification of education as per the Ethiopian Education and Training Policy was also
considered in the analysis for comparison and any policy decision at country level.
As clearly stated in the CMF, no single data source can provide a complete profile of OOSC.
Comprehensive analysis requires the use of multiple sources of data because they provide
information on different issues measured at different points in time and because each data source
has limitations that must be considered during analysis.
In this regard, two major data sources, i.e. administrative data obtained from the Education
Statistics Annual Abstracts from EMIS/Ministry of Education and Household Surveys from
Central Statistics Agency were used. At this juncture, it seems appropriate to explain the
advantages and limitations of the two data sources in order to clarify sources of discrepancies that
may be observed in the Report and thereby clear out the doubt in users of this report about
consistency of data.
6
As outlined in the CMF, both sources of data have their own advantages and limitations. In terms
of school participation, administrative data typically refer to enrolment at the beginning of the
school year and do not provide information on regular attendance. By definition, enrolment
records also provide no information on out-of-school children, the number of whom must be
estimated indirectly using data on enrolment and the relevant school-age population. it does not
also provide insight into the individual or household characteristics of students.
This information gap in understanding the characteristics of children and their households is
filled with findings from Household surveys. Moreover, analysis by sex, ethnicity, and area of
residence, household wealth quintile, child labour status, the parents’ level of education and other
factors are possible with data collected by surveys or censuses. More importantly, the survey data
covers children who are not enrolled in school unlike the administrative data.
It is true that surveys are not without limitations. It is often not possible to link results to
information about the education system. The surveys are generally not carried out every year,
unlike the collection of annual administrative data. The sample population typically does not
include the homeless (including street children) and mobile populations.
Administrative data and household surveys measure education participation in different ways.
Administrative sources focus on reporting of enrolment at the beginning of the school year. By
contrast, household surveys estimate educational participation with data on school attendance at
some point during the school year, based on information provided by a parent or guardian. A
child is considered to have been in school even if he or she attended only for one day in the
reference school year. Furthermore, the collection of enrolment and attendance data does not
always occur at the same time. Household surveys are often not coordinated with the academic
calendar and the timing of a survey can affect estimates of participation rates and age reporting.
EMIS’s annual enrolment calculations, in Ethiopia, are based on the school age population
projected by the Central Statistics Agency for that year. UIS calculations of enrolment rates
combine national enrolment statistics with population estimates by the UN Population Division
(UNPD), which relies on projections from national census data. In some cases, UNPD population
estimates may not be compatible with national population estimates and enrolment statistics,
which may lead to discrepancies in the calculation of enrolment rates and other key education
indicators.
In summary, both administrative records and household surveys provide important perspectives
regarding the profiles of OOSC. The overview and analysis of these data sources is presented
hereunder.
Education Statistics Annual Abstract (2009-2010 G.C.)
This abstract depicts the provision of the relevant information on education and training offered
across the country (from preprimary to higher education) and the consequent achievements made
7
so far. The document fundamentally portrays the summaries of student enrollment; teacher
profile; distribution of schools, colleges, and universities; student-section and student-teacher
ratios; dropout and repetition rates; and the gender gaps at all levels.
Moreover, the statistical document briefly spells out the 2009-2010 education and training data
disaggregated by sex, age, region, location (urban/rural), level of education, grade, and type of
school (public, private, NGO). The document also contains both descriptive and analytical
summaries of population, enrolment, teacher profile, schools and sections, facilities, learning
materials, exam results of Grades 10 and 12, and budgets. It is expected that the abstract enables
users to easily identify the regional, urban/rural, and gender disparities pertaining to the country.
Besides, the document helps policy makers to set future goals and make the required interventions
in terms of education and training by identifying feasible measures to be taken and allocating the
much needed resources to further expand access and improve quality in the system. Among the
major advantages of the administrative data are that the data are available for every year and that
the terminology is easily understood by experts and other users.
It is worth mentioning that Ethiopia has a well-established system to collect EMIS data each
year. The system has also introduced data verification mechanism at different stages. The
administrative data is used by government in different development plans and annual plans for
targeting and monitoring. The Ministry of Education gets the projected population size by single
age for each year from the Central Statistics Agency to calculate enrolment and other rates. It is
noted that there is usually a discrepancy between the national and UNPD’s projection.
Nevertheless, the EMIS statistical document fails to properly deal with the profiles of out-ofschool children in the country. Other limitations include the possibility of reporting inflated
enrolments by schools; and inexistence of dropout rates by single age; disaggregated data by
social and ethnic groups as well as by religious affiliation. Moreover, the administrative data does
not capture data on vulnerable children: orphans, children of poor families; migrants; working
children; children affected by HIV/AIDS, children affected by conflict and internally displaced
persons (IDPs) or children, etc.
The 2007 Population and Housing Census
Starting from 1984, national population and housing census has been carried out in our country
once in every ten years. Accordingly, the third national population and housing census was
conducted in the months of May to November 2007. At country level, the 2007 census covered
the then existing total number of 85 zones and 765 weredas. The census report presents the major
statistical data that are essential to policy makers, planners, administrators, researchers and other
data users in a table format. To this effect, such characteristics as region, sex, grade, school
attendance, literacy status, disability status, being orphan status, type of residence, etc. are used
for disaggregated analysis of the population. And conducting disparity analysis by disaggregating
the data using background variables is found to be the advantage of this report.
8
However, the 2007 Census Report was not used in detail since the research team and MoE were
informed that the attendance variable has a problem. On the other hand, it was only used to find
Dimension 1 because it has better information on attendance of 6 years old children.
The Child Labour Survey (2001)
The survey contained information for children aged 5-17 pertaining to their school attendance and
reason for dropout, health and welfare situation, condition of employment of children who are
working for pay, and their working conditions. The information in the survey has been used to
examine the relationship between child labour and children’s education in general and its impact
in terms of enrolment, attendance and dropout, as well as to look into policy gaps and
implementation shortcomings in relation to international conventions and national laws in the area
of child labour.
The Ethiopian Demographic and Health Surveys (2005 and 2011)
Under the 2005 DHS data source, it was possible to compare the disparities by wealth quintile and
see whether school attendance is low among the poor and high among the rich target groups.
Moreover, the ANAR and the number of out of school children were calculated and estimated
using the typology based on the 2011 EDHS and UNPD population projection obtained from UIS.
Continue here
Other Data Sources
On top of the above four data sources, 10 documents that could be used for the rest of the three
chapters were identified. Some of them are studies related to ABE, national learning assessment,
ESDP IV and others that can be applied in the area of demand, supply, bottlenecks, strategies, and
polices. For example, ESDP IV is a five-year program action plan spanning from 2010/20112014/2015 (2003-2007 E.C.) Organized under six chapters (national development context;
education policy framework; priority action programs; implementation, monitoring and
evaluation framework; financial framework; and major assumptions, risks and mitigation), the
program is expected to address different challenges of the education sector.
Ethiopia has carried out three national learning assessments in 2004, 2008 and 2010, covering
sample primary and secondary schools found in all the nine regions and the two city
administrations. The main purposes of conducting the national assessments were to measure
learning achievements of students of Grades 4, 8, 10 and 12 and identify the factors that
determine those achievements. They also aimed at providing comparative information on school
improvement. Both quantitative and qualitative research approaches were employed to obtain the
required information for the three studies.
The main purpose of the ABE paper was to assess the status of ABE in Ethiopia by: identifying
major contributions of the ABE program to achieve UPE, coming up with the role of NGOs in the
9
implementation of the program, identifying good practices of the program, identifying the
different challenges, and suggesting future actions to improve its implementation in future.
1.2 Profile of Children in Dimension 1
The analysis of data on Dimension 1 involves data on the school attendance status of the
population one year younger than the official primary school entrance age (7). In this study,
attendance rate of 6-year-olds was taken from the 2007 Housing and Population Census. These
children are in pre-primary or primary education, or they may be out of school. According to the
CMF, the percentage of pre-primary age children and those who are out of school is calculated as
follows:
1) Percentage of pre-primary children who are in pre-primary or primary education = the
number of children of pre-primary school age enrolled in pre-primary or primary
education divided by the number of children of pre-primary school age;
2) Pre-primary age children out of school = 100 minus percentage of children of pre-primary
age who are enrolled in pre-primary or primary education.
Table 1 presents attendance rate of pre-primary children who are attending in pre-primary and
primary education at national level, disaggregated by region and sex.
Table 1: Percentage of children of pre-primary age (age=6 years) in pre-primary or primary
education, by sex and region
Region
Tigray
Afar
Not
PrePrimary
attending primary
109,708
46,841
7,497
638
Total
pop.
Both
10,745 18,242
2,382 3,020
127,950
14.3
85.7
5.9
8.4
49,861
6.1
93.9
1.3
4.8
36,734 58,275
52,697 93,742
536,118
10.9
89.1
4.0
6.9
984,530
9.5
90.5
4.2
5.4
177,897
4.5
95.5
1.5
3.0
Amhara
477,843
21,541
Oromia
890,788
41,045
Somali
169,926
2,668
5,303
7,971
23,389
888
1,764
Benishangul
Gumuz
SNNP
Gambella
Harari
Addis Ababa
488,316
8,171
3,372
%
%
% not
% preAttending attending primary Primary
2,652
26,041
10.2
89.8
3.4
6.8
565,243
13.6
86.4
6.6
7.0
1,121
39,802 76,927
2,133 3,254
11,425
28.5
71.5
9.8
18.7
990
1,724
5,096
33.8
66.2
19.4
14.4
9,202 27,406
1,333 2,710
39,323
69.7
30.3
46.3
23.4
8,642
31.4
68.6
15.9
15.4
37,125
734
11,917
18,204
5,932
1,377
Male
1,160,600
69,233
83,071 152,304 1,312,904
11.6
88,4
5.3
6.3
Female
1,078,816
64,198
79,844 144,042 1,222,858
11.8
88.2
5.3
6,5
All
2,239,416 133,431 163,515 296,346 2,535,762
11.7
88.3
5.3
6.4
Dire Dawa
Sex
Source: The 2007 Population and Household Survey
10
According to the data in the table, about 11.7% of pre-primary school-age children ( 6) attended
pre-primary school (5.3%) and the remaining 6.4% attended primary school. The disaggregation
by regional level shows the highest percentage of attendance was in Addis Ababa (69.7%),
followed by Harari (33.8%) and Dire Dawa (31.4%). The least were reported to be in the
emerging regions of Somali (4.5%) and Afar (6.1%). The higher percentages in Addis Ababa,
Harari and Dire Dawa could be attributed to the different kindergarten institutions found in these
urban areas.
Figure 1 also complements the data presented in Table 1.
Figure 1: Percentage of children of pre-primary age (6 years) attending pre-primary or primary
education, by region
Source:The 2007 Population and Household Survey
In the Dakar declaration of ‘Education for All’, states have expressed their commitment to
“expanding and improving comprehensive early childhood care and education, especially for the
most vulnerable and disadvantaged children”. Ethiopia is a signatory of this declaration, which
clearly shows that this commitment has to be taken seriously. Currently, the providers at this level
are mostly non-government organizations, communities, private institutions and faith-based
organizations. The roles of the government are limited to teacher training, curriculum
development and closer monitoring to improve the quality of education.
Though, establishing standardized kindergarten at different parts of the country might be
expensive and share the cost of expanding primary education, the current effort of encouraging
pre-primary age children to attend grade zero in primary schools must be encouraged in all parts
of the country. In such cases, we can further reduce the dropout rate from grade one since the
children will adapt to the school environment before reaching the age 7.
11
1.3 Profiles of OOSC in Dimensions 2 and 3
1.3.1 General
This section deals with the profiles of OOSC in Dimension 2 and Dimension 3, hereafter referred
to as DE2 and DE3. The main purpose here is to provide a national estimate of primary and lower
secondary school-age children who are out of school and to analyze the results obtained. To this
effect, the data sources, methods used to estimate the OOSC and data analysis are presented in
that order.
Data Sources and Methods
The main data sources used to estimate the OOSC under the current analysis is the 2009/10
Education Statistics Annual Abstract of the Education Management Information System
(EMIS)/Ministry of Education (MoE). The estimations of OOSC were conducted using the
typology provided by UNICEF and UIS. Moreover, other estimates presented in the tables were
computed using the formulae given in the CMF.
The estimation of OOSC under DE2 and DE3 is performed by considering the Ethiopian
educational structure and context (primary: Grades 1 to 8 and lower-secondary: Grades 9 to 10)
and international standards according to the International Standard Classification of Education
(ISCED) (i.e. primary: Grades 1 to 6 and lower-secondary: Grades 7 to 10).
Data Analysis and Findings
The definitions obtained from the CMF were applied to the administrative and EDHS 2011 data,
as appropriate, which were processed using the typology as well as formulae provided to obtain
the results. Different typologies and tables produced using the aforementioned data sources are
discussed as follows.
Basic Typology
Out-of school-children of primary school and lower-secondary age fall into two main groups with
respect to their exposure to education. The first group consists of children who have yet to start
school while the second group comprises children who have dropped out before reaching the
theoretical age for completing school. The first group can be broken down further in terms of the
probability of future schooling. There is a good chance that many of these children, especially
those at younger ages, will start school at some point in the future. Some, however, will never
begin schooling. Examining rates of school participation for older primary school-age children
allows one to judge the proportion of young out-of-school children that may enter primary school
late.
12
First group of OOSC: Children who attended but left school
As indicated in the typology, significant percentages of children drop out of school. It has also
been observed that, as the age of the child increases, the dropout rate also increases at different
scenarios. From this, it is possible to identify the following three categories of dropouts:
a)
children who dropped out from early grades and thus are unlikely to have acquired even
the most basic mastery of reading, writing, numeracy and other skills;
b) children who dropped out after completing the primary cycle and who may not continue
their education at secondary level; and
c) children who may leave school before or after completing lower-secondary education.
Second group of OOSC: Children who are expected to enter school in the future
Children who will enter in the future are children that have not yet entered formal education but
will do so in the future. Entry into school may be delayed by one or more years. An increase in
this delay is assumed to place children at an increased risk of dropping out or registering a low
academic achievement. For the purpose of this study, the probability of entering in the future
refers to the likelihood of entering school for the first time by age 17. However, entry into the
education system after age 17 is not considered.
In the calculation of the typology, it is indicated that the percentage of those children whose ages
were 7 and 8 when they joined primary school as new entrants was high as compared to the older
children. Out of the total OOSC, some are expected to enter primary school before they reach age
17. From these conditions, one can suggest that the necessary action should be taken to increase
the number of new entrants as early as possible.
Third group of OOSC: Children who are expected to never enter school
The third group of out-of-school children constitutes those that have never been in school. These
are children who have never attended in the past and are not expected to do so in the future. In
contrast to the aforementioned two groups, this group has no exposure to formal education at all.
Out-of-school children who are expected to enter school after they have reached age 18 are
grouped together with people who never enter school.
1.3.2 Adjusted Net Enrolment Rates (ANER) and Out of School Children (OOSC)
In the measurement of school participations, three main indicators are used for the administrative
data. These indicators are gross enrolment rate (GER), net enrolment rate (NER) and adjusted net
enrolment rate (ANER). The first rate measures the enrolment of children at a specific level of
education regardless of their age. The second rate measures the enrolment of children at the
specific level according to the age specific for that level. The third rate in which we are interested
now measures the enrolment of these children at the intended level for education and the
subsequent level. For example, the primary adjusted net attendance rate measures the total
13
number of pupils of the official primary school-age group who are enrolled at primary or
secondary education levels, expressed as a percentage of the corresponding population.
As Table 2 indicates; the adjusted net enrolment declines with age. For example, at age 7 the
adjusted net enrolment for males was 87.6%; for females the figure was 82.5% while the ANER
in total was 85.1%. But at the age of 14, these enrolment trends declined to 71.2%, 65.6% and
68.4%, respectively. The adjusted net enrolment rates at the age of 15 were 59.9%, 52.0%, and
56.0% for male, female, and in total, respectively.
Table 2: Adjusted net enrolment rate (ANER), by sex
Level of Education
Primary age
Age Male Female
7
8
9
10
11
12
13
14
Total
Lower Secondary age
15
16
Total
Total
Gender Parity
Index
87.6
82.5
85.1
0.94
90.9
87.7
89.3
0.97
86.2
83.6
84.9
0.97
92.3
90.1
91.2
0.98
76.5
75.3
75.9
0.98
84.7
82.1
83.4
0.97
77.6
75.7
76.7
0.98
71.2
65.6
68.4
0.92
83.7
59.9
80.6
52.0
82.2
56.0
0.96
0.87
51.7
41.4
46.6
0.80
55.9
46.8
51.4
0.84
Source: EMIS 2010
The trend analysis for the past fifteen years also shows that net enrolment rate (NER) has
increased from 21.6% to 82% for all primary students (See Figures 2 and 3 below).
Net enrolment rate
Figure 2: Primary net enrolment rate by year
90
80
70
60
50
40
30
20
10
0
1996 1997 1998 1999 2000 2001 2002 2003 2004 2005 2006 2007 2008 2009 2010
Year
Source: EMIS Annual Reports
14
Figure 3: Primary net enrolment rate by sex and year
Source: EMIS Annual Reports
Gender Disparities
It is known that gender parity is MDG 3 and Ethiopia is one of the countries that entered
commitment to eliminate gender disparities at all levels of education. As per its commitment,
Ethiopia is on the right track towards eliminating gender disparities. The Gender Parity Index
(GPI) of enrolment or attendance rates, calculated as the ratio of female to male values, provides
information on disparities in educational participation between boys and girls. If the GPI is
between 0.97 and 1.03, it can be said that gender parity is achieved. If GPI is less than 0.97,
females are disadvantaged; and if GPI is greater than 1.03, males are disadvantaged. Moreover, if
GPI for dropout rate is less than 0.97, dropout rate for girls is lower than that of boys, putting
boys at a disadvantage. According to the data in Table 2 above, gender parity in primary
education for ANER is 0.96 and in lower-secondary education it is 0.84.
a) Out of School Children Based on Administrative Data
According to the CMF percent of out of school children for primary education (DE2) in the
Ethiopian context (grades 1 to 8) is calculated by subtracting ANER from 100%, Where ANER
is calculated by considering those enrolled for primary and whose age is 7 to 14 and again
adding to this those enrolled in lower secondary whose age is 7 to 14 and dividing by all
children in the age group of 7 to 14.
15
Table 3: Percentage and number of out of school children, by age and sex based on enrolment
rate
Age
Number of
Male
Children
Male
%
OOSC
No. of
Male
OOSC
Number of
Female
Children
Female
%
OOSC
No. of
Female
OOSC
All
No of
children
All %
OOSC
All
No of
OOSC
Primary
7
1,161,512
12.4
143,628
1,120,971
17.5
196,126
2,282,483
14.9
339,754
8
1,137,811
9.1
103,479
1,097,693
12.3
134,810
2,235,504
10.7
238,290
9
1,113,802
13.8
153,988
1,074,292
16.4
176,338
2,188,095
15.1
330,326
10
1,089,459
7.7
83,731
1,050,764
9.9
104,163
2,140,223
8.8
187,895
11
1,064,756
23.5
250,324
1,027,102
24.7
254,094
2,091,859
24.1
504,419
12
1,038,996
15.2
158,822
1,003,009
17.9
179,912
2,042,005
16.6
338,735
13
1,011,816
22.4
226,834
978,332
24.3
237,477
1,990,149
23.3
464,311
14
983,417
8,601,570
28.8
16.3
283,637
1,404,44
6
953,164
8,305,328
34.4
19.4
327,985
1,610,904
1,936,580
16,906,898
31.6
17.8
611,621
3,015,350
Total (i)
Lower secondary
15
954,870
40.1
382,842
927,933
48.0
445,105
1,882,803
44.0
827,947
16
926,578
48.3
447,724
902,776
58.6
529,144
1,829,354
53.4
976,869
Total (ii)
1,881,448
44.2
830,567
1,830,709
53.2
974,249
3,712,157
48.6
1,804,816
All
10,483,018
21.3
2,235,013
10,136,037
25.5
2,585,153
20,619,055
23.4
4,820,166
(I + ii)
Source: EMIS 2010
The percentage of children of lower secondary school age out of school = 100 - lower secondary
ANER - percentage of children of lower secondary school age enrolled in primary education.
The number of out-of-school children for lower secondary education (DE3) in the Ethiopian
context (grade 9 to 10) is percentage of children of lower secondary school age out-of-school
multiplied by number of children at lower secondary age. For example male whose age is 16 and
enrolled in (a) lower secondary are 200892, (b) upper secondary are 9202 and (c) primary are
268759. The total number of male children whose age is 16 is 926578. According to the
definition of the CMF the percent of out of school children is 100 - (a+b / 926578) - (c/926578) =
100- (200892+9202/926578)- (268759/926578) = 100- 51.7 = 48.3%. Thus, the total male out of
school children is 0.483 x 926578; which is equal to 447,724. The figures in Table 3 for lower
secondary are results of a similar calculation using the definition and formulae of the CMF.
As per the calculation using the administrative data of 2009/2010, about 17.8% of primary school
age children (7-14 year olds) i.e. 3,015,350 children are out of school (DE2). Table 3 depicts that,
16
of these, 1,404,446 (16.3%) are male and the remaining 1,610,904 (19.4%) are female.
Concerning lower secondary, 1,804,816 children (DE3), i.e. 48.6% are out of school. Of these,
44.2% (830,567 children) are male and 53.2% (974,249 children) are female. All in all 4,820,166
are out of school children based on the enrollment data in 2009/2010. Of these, 2,235,013 are
male while the remaining 2,585,153 are female.
1.3.4 Disparities by Region
Table 4 presents percent and number of out of school children of primary and lower secondary
age by region (based on the Ethiopian context primary Grades 1-8 and lower secondary Grades 910 and ANER).
Table 4: Percentage of out of school children of primary and lower secondary age by region
Region
Tigray
Afar
Amhara
Oromia
Somali
Benishangul/Gumuz
SNNP
Gambella
Harari
Addis Ababa
Dire Dawa
Total
Source: EMIS 2010
Percent No of OOSC
Percent of
No of OOSC in
of OOSC in primary OOSC in lower
lower
secondary age
in
age
secondary
primary
age
age
5.2
69.6
5.0
21.7
53.9
8.8
12.3
10.1
18.0
22.4
27.1
49,402
228,522
184,513
1,396,848
561,573
13,791
440,693
7,226
6,832
106,903
19,047
41.1
85.9
48.7
49.2
72.2
21.2
46.5
24.0
24.1
14.4
34.4
86,855
67,974
410,920
667,117
182,701
7,331
351,661
3,910
2,115
19,476
5,756
17.8
3,015,350
23.4
1,804,816
The highest percentage of out of school children for primary is documented in the two
predominantly pastoralist regions of areas of Afar (69.6%) and Somali (53.9%). Similarly, Afar
has the highest percent of out of school for lower secondary (85.9%) followed by Somali (72.2%).
Significant proportions (above 40%) of out of school children are also observed in Oromia
(49.2%), Amhara (48.7%), SNNP (46.5%) and Tigray (41.1%) among lower secondary age
group. These regions are highly populated and cover over 70% of the country’s population
In terms of absolute figures, Oromia has the highest number of out of school children in primary
(i.e. 1,396,848) followed by Somali (561,573) and SNNP (440,693). For lower secondary (Grades
17
9 – 10), the relatively large number of out of school children are found in Oromia (667,117),
Amhara (410,920) and SNNP (351,661) followed by Tigray (86,855).
It has been observed from the findings of the study that these figures are far below the results of
the Adjusted Net Attendance Rate (ANAR) based on the Ethiopian Demographic and Health
Survey 2011 data as could be seen from the sections that follow.
b) Out of School Children Based on 2011 EDHS Data
Table 5 reveals that, according to UIS’s calculation using EDHS 2011 data, percent of primary
and lower secondary out of school is about 34.1% i.e. 7,526,412 children. This figure is expected
to be higher than the estimates of enrollment information using administrative data due to several
factors. One important factor is the phenomenon of dropping out of students throughout the
academic year after the EMIS enrolment data is captured at the beginning of the year during
registration from each school. The gap between enrollment rates and attendance estimates can
only be narrowed as the dropout rate approaches to zero.
Table 5: Percentage and number of out of school children, by age and sex based on 2011
EDHS Data
Age
% OOSC
No of
No of OOSC
children
Primary
Children
7
2,329,150
8
2,313,438
9
2,293,291
10
2,268,982
11
2,241,992
12
2,212,158
Total 13,659,011
62.5
44.9
34.6
29.1
23.1
24.8
36.6
1,455,719
1,027,166
793,479
660,274
517,900
548,615
5,003,153
13
2,177,070
14
2,135,714
15
2,088,953
16
2,039,653
8,441,390
Total
All 22,100,401
Source : EDHS 2011 and UNPD
24.9
27.3
30.9
36.9
29.9
34.1
542,090
583,050
645,487
752,632
Lower secondary
18
2,523,259
7,526,412
Figure 4: Percentage of children attending school by age
Source: EDHS 2011
Figure 4 represents a trend analysis of children attending school by age. The figure reveals that
with age, more children attend school up to the age of 11, where 76.9% of children are in school.
The percentage of children attending school begins to fall steadily from age 12 to 16.
Figure 5: Percentage of children out of school and in school by age group
Source: EDHS 2011
Furthermore, Figure 5 presents a comparison of children who are both in and out of school in the
primary and lower secondary age groups. As can be observed in the Figure, 63.4% and 70.1% of
children in the age groups 7-12 and 13-16 are in primary and lower secondary school
respectively. Moreover, the proportion of children attending school in lower secondary is lower
than that of primary.
1.3.3 Percentage of Out-of-school children by school exposure
Table 6 presents percentage of out-of-school children by school exposure by age and sex based on
the 2011 EDHS source data. Under Dimension 2 (primary age: 7-12) the share expected to enter
is significantly higher than dropped out or expected never to enter both for the total male and
19
female. On the other hand under Dimension 3 (lower secondary age: 13-16) the percentage of
those who have already dropped out and those expected to never enter is significantly higher than
the percentage of those expected to enter in the future.
Table 6: Percentage of out-of-school children by school exposure, by age group and sex
School exposure
Dropped out
Expected to enter in future
Expected never to enter
Dimension 2 (Primary age)
Male
13.5
78.3
8.2
Female
10.2
79.8
9.9
Total
11.9
79.0
9.1
Dimension 3 (Lower
secondary age)
Male Female Total
54.0
51.7
52.9
15.2
11.3
13.1
30.8
37.0
34.0
Source: UIS analysis based on EDHS 2011 using ISCED 1997
The largest proportion of OOSC of lower secondary age are those children who were once in
school but have dropped out (52.9%), followed by those that are never expected to enter to school
(34%). The percentage of out-of-school children who are expected to enter school in the future is
79% and 13.1% respectively. Moreover, 9.1% of primary age out-of-school children and 34% of
lower secondary age out-of-school children are expected never to enter school. These suggest that
with age fewer children will enter to school.
Table 6 also shows that the percentage of female who dropped out is slightly less than the male in
both categories. On the other hand, the proportion of female out-of-school children of primary
school age (79.8%) expected to enter school in the future is slightly higher than for male out-ofschool children (78.3%); while the proportion of male lower secondary age out-of-school children
expected to enter (15.2%) is higher than the proportion of female children (11.3%) in the age
group.
Figure 6: Percentage of out-of school children by school exposure
Primary (age 7-12)
Percent
100
79%
Lower Secondary (age 1316)
52.9%
34%
50
11.9%
13.1%
9.1%
0
Dropped out
Expected to
enter by age 17
Expected to
never enter
School Exposure
Source: UIS analysis based on EDHS 2011 using ISCED 1997
20
Figure 6 further summarizes the situation of out of school children by school exposure. The
proportions of children who dropped out as well as who are expected to never enter school are
higher for lower secondary age than for primary age.
Table 7: Percentage of out-of-school children by school exposure, by age group and
residence
School exposure
Dropped out
Expected to enter in future
Expected never to enter
Dimension 2 (Primary age)
Urban
11.2
84.4
4.4
Rural
18.9
66.4
14.7
Total
11.9
79.0
9.1
Dimension 3 (Lower
secondary age)
Urban Rural Total
63.4
56.6
52.9
12.1
6.7
13.1
24.5
36.7
34.0
Source: UIS analysis based on EDHS 2011 using ISCED 1997
Table 7 presents percentage of out-of-school children by school exposure by age group and
residence based on the 2011 EDHS source data. Under Dimension 2 , percent expected to enter in
the future are significantly higher for urban (84.4%) when compared with the rural (66.4%). The
same is true under Dimension 3 where percent expected to enter in the future is higher for urban
(12.1%) when compared with the rural (6.7%). Those expected never to enter are higher among
rural under both Dimensions 2 and 3.
Table 8: Percentage of out-of-school children by school exposure, by age group and wealth,
School exposure
Dimension 2 (Primary age)
Poor
Rich
Total
Dropped out
9.0
15.4
11.9
Expected to enter in future
75.8
80.5
79.0
Expected never to enter
15.2
4.1
9.1
Source: UIS analysis based on EDHS 2011 using ISCED 1997
Dimension 3 (Lower
secondary age)
Poor
Rich
Total
41.8
67.6
52.9
13.7
11.0
13.1
44.5
21.4
34.0
Table 8 presents percentage of out-of-school children by school exposure by age and wealth
status based on the 2011 EDHS source data. Under Dimension 2 , percent expected to enter in
future are slightly higher for rich (80.5%) when compared with the poor (75.8%).
21
1.4 OOSC and Involvement in Child Labour
Child labour is one of the major impediments that affect children’s school attendance.
Table 9: Distribution of children aged 5-17 years, by school attendance, age, sex and place of
residence
Attending school
Not attending school
Selected
Total
Engaged
Engaged in
Engaged in Engaged in
background number of
in
housekeeping
Schooling
productive housekeeping Idle
variables
children productive
activities
activities
Activities
activities
Total
18,183,432
17.8
16.4
3.9
34.3
16.9
10.6
5-9
8,619,254
8.9
11.0
4.9
30.0
24.4
20.8
10-14
6,529,154
26.2
22.6
3.0
36.2
10.3
1.5
15-17
3,035,022
25.3
18.6
2.5
42.2
10.1
1.3
Male
9,263,302
24.4
13.5
4.9
37.6
9.4
10.2
Female
8,920,13 0
11.0
19.5
2.7
30.9
24.8
11.0
Age
Sex
Place of residence
Urban
2,413,023
12.6
52.2
15.4
6.2
7.0
6.5
Rural
15,770,400
18.6
11. 0
2.1
38.6
18.4
11.2
Source: Child Labour Analysis, p. 25, 2001
The data in Table 9 indicates that more girls than boys do housekeeping work and more boys than
girls are engaged in productive activities. As it is a common phenomenon in most of the
developing countries, Ethiopian families have a preference of sending male children to school. As
a result, there are more male children in school than female ones. This is what one observes from
the table.
Moreover, Table 10 depicts that a sizeable portion of the children combine work and schooling,
which, no doubt, affects their educational performance and their academic achievement. Thus,
those children could not likely acquire the necessary knowledge and skills for their future life. It
can also be observed from the table that child labour is common both in rural and urban areas of
the country, though the participation of rural children is higher than their urban counterparts.
22
Table 10. Distribution of children aged 10-17 years who were working and attending school, by
effect of work on schooling, 2001
Selected
background
variables
Effect of work on schooling
Children working
and attending
school
Affects my
schooling
Doesn’t affect my
schooling
Not
stated
Total
4,333,574
38.5
60.9
0.6
Age
10-14
15-17
3,060,372
1,273,202
38.1
39.4
61.2
60.1
0.6
0.5
Sex
Male
Female
2,453,457
1,880,116
39.1
37.7
60.4
61.6
O,5
0.8
Place of residence
Urban
Rural
1,173,477
3,160,097
29.1
42.0
70.1
57.5
0.9
0.5
Source: Child Labour Analysis, p.26, 2001
The 2001 Ethiopian Child Labour Survey also indicated that 52% of children in Ethiopia were
involved in productive activities, and more than 80% of them (12.6 million) were below the age
of 15. Most types of work that children were engaged in were tiresome and took long hours and,
thus, the children could not get sufficient time to study. It is stated in Article 32 of the Convention
on the Rights of the Child that “State parties recognize the right of the child to be protected from
economic exploitation and from performing any work that is likely to be hazardous or to interfere
with the child’s education, or to be harmful to the child’s health or physical, mental, spiritual,
moral or social development”. But in reality, as depicted in the two tables, a considerable portion
of the school-aged children have been deprived of their right to education and they were out of
school during that year (2001) on account of their engagement in child labour. The key
informants in the focus group discussions have also witnessed that the challenges mentioned are
obstacles for education of children.
Due to the prevailing pervasive poverty and parental attitude towards work, many children have
not enrolled in school or are forced to drop out of school. There is ample evidence that indicates
that the problem of child labour poses a major challenge to children’s education, especially in
rural areas, where the overwhelming majority of children are involved in productive/economic
activities. Eighty-five percent of the country’s children are engaged in some kind of productive or
non-productive activities (Child Labour Survey, 2001), out of which more than two thirds do not
get the chance of attending school. The problem is worse in the rural areas, where more than half
of the working children are compelled to work to supplement family income, deprived of their
23
right to education, to which they are entitled in international conventions and national laws and
policies.
It is commonly agreed that childhood is a period of life which should be dedicated not to work but
to education. It is a period when children need a nurturing and stimulating environment that
fosters their growth and development in all areas of their life. Key among these is education,
which is currently constrained as a result of the prevailing child labour. Child labour has a
tremendous effect on school attendance and educational achievement of children, and hence it
depriving them of educational opportunities and knowledge that would enable them to compete in
a labour market when they become adults. Child labour does not only affect school attendance of
children; it is also harmful for their healthy growth, and has more severe effects when it is carried
out in hazardous conditions.
Children in Ethiopia are engaged in all types of work and sectors including agriculture, industry,
service, trade and household chores, which adversely affect their educational performance. The
children engage in these sectors to supplement the income of their parents at the expense of their
education. This negatively affects the educational status of children in general and female children
in particular. Most parents, especially in the rural areas, consider child labour as a socialization
process and an important experience to be acquired at an early stage of life. As it can easily be
seen from the data in Table 10, more than one third of the children (38.5%) responded that their
engagement in work while attending school affected their school attendance. Working while
attending school affected more rural children (42%) than it affected urban children (29.1). The
Ethiopian Child Labour Survey revealed that only 38.1% of children between 5 and 17 years of
age are attending school, and 34.2% of children aged 5-17 years are engaged in productive or
housekeeping activities while attending school. It was also reported that only 31.7% of children in
rural areas were attending school, whereas the school attendance rate for urban children was
80.2% in the study year.
According to LFS 2005, based on the measurement guidelines contained in the 18th ICLS
resolution, and restricting the scope to children up to and including 14 years of age (the most
common upper-age limit for basic schooling), the child labour measure used in the study
comprises three groups of children:
(1) 5-11 year-olds in economic activity (i.e., those engaged in any activity falling within the
SNA production boundary for at least one hour during the reference week). Economic
activity covers children in all market production and in certain types of non-market
production, including production of goods for own use. It includes forms of work in both
the formal and informal sectors, as well as forms of work both inside and outside family
settings);
24
(2) 12-14 year-olds in non-light or “regular” economic activity (i.e., those engaged in any
activity falling within the SNA production boundary for at least 14 hours during the
reference week); and
(3) 5-14 year-olds in hazardous unpaid household services (i.e., those engaged in the
production of domestic and personal services for consumption within their own
households, commonly called “household chores”, for at least 28 hours during the
reference week).
The first two groups relate to ILO Convention 138, which stipulates a minimum age of at least 14
years in less developed countries for admission to employment or work (art. 2), but states that
national laws may permit persons from age 12 years to engage in light work (art. 7). In
determining the hour threshold for permissible light work, which is not defined explicitly in
C138, the ICLS resolution recommends a cut-off point of 14 hours during the reference week,
below which non-hazardous work can be considered permissible light work. The second group
does not include those children working for less than 14 hours per week, but in hazardous work,
because hazardous sectors are defined by national legislations.
The inclusion of the third group marks the recognition of the fact that the international legal
standards do not rule out a priori children’s work outside the SNA production boundary from
consideration in child labour measurement. The ICLS resolution, building on this recognition,
recommends classifying those performing hazardous, unpaid household services as part of the
group of child labourers for measurement purposes, where hazardous, unpaid household services,
in turn, are defined as those requiring long hours, involving unsafe equipment or heavy loads, in
dangerous locations, etc.
The ICLS resolution does not recommend a specific hour threshold for classifying household
chores as hazardous (and therefore as child labour), and describing the task of establishing
hazardousness criteria as an area requiring further conceptual and methodological development.
In the absence of detailed statistical criteria for hazardousness, an hour threshold of 28 weekly
working hours is used in the current study. Above this, engaging in household chores is classified
as child labour. It should be kept in mind, however, that this threshold is based only on
preliminary evidence of the interaction between household chores and school attendance and does
not constitute an agreed measurement standard.
The child labour indicator utilized in this study, therefore, represents a benchmark for
international comparative purposes, but it is not necessarily consistent with the (estimates based
on) national child labour legislation, owing to the flexibility clauses contained in the international
legal standards.
25
The 2005 LFS study showed the differentials of the above estimates by sex, parent education,
regions, and other variables. The result shows variations according to the different background
variables and, particularly among male, rural, non-school attendance, non-educated parents, in
Amhara and Oromia regions.
Table 11. Child Labour and children not in school
Percentage of children not in school aged 5-14 years involved in child labour
Children not in school who are in child
Children not in school
labour
Sample
Sample size
Percentage
size (n)
Percentage
(n)
Total
70.8
33348
55.3
15273
Sex
Male
16487
69.4
62.3
8417
Female
72.3
16861
48.1
6856
Area
Urban
31.8
8431
17.2
1261
Rural
76.2
24917
57.5
14012
Age
5-11
80.5
27966
52.9
11719
12-14
44.9
5382
66.5
3554
HH head
education
None
76.3
20876
57.0
10644
Primary
65.3
10459
53.2
4223
Secondary or
35.9
1979
higher
33.8
390
Region
Tigray
Afar
Amhara
Oromia
Somali
Benishangul
Gumuz
SNNP
Harari
Addis Ababa
Dire Dawa
60.7
71.9
69.7
73.6
83.3
72.2
2496
1441
6084
8712
2341
1663
49.9
53.2
60.9
56.3
51.4
1087
761
3275
4158
1013
75.4
52.4
17.9
55.0
7194
871
1383
1013
34.6
51.0
37.6
19.0
34.7
494
3222
338
405
517
Source: Child labour, LFS 2005
Table 11 presents percentages of out-of-school children aged 5-14 years involved in child labour
and differentials by background variables. The situation is worse among females, rural areas, and
non-educated parent groups.
26
Table 12. Out-of-school children in economic activity by sector of employment
Percentage of out-of-school children aged 5-14 in economic activity, by sector of employment
Sector of Employment
Total
Agriculture Manufacturing Commerce Service
96.8
1.1
1.0
1.0
Sex
Male
Female
Area
Urban
Rural
Age
5-11
12-14
HH head education
None
Primary
Secondary or
higher
Missing
Region
Tigray
Afar
Amhara
Oromia
Somali
Benishangul
Gumuz
SNNP
Harari
Addis Ababa
Dire Dawa
Other
0.1
Sample
size
out-ofschool
children
involved in
economic
activity (n)
13940
98.5
94.4
0.3
2.1
0.5
1.7
0.5
1.7
0.2
0.1
8,087
5,853
54.3
97.2
7.6
1.0
8.6
0.9
29.2
0.7
0.4
0.1
708
13,232
98.3
92.3
0.5
2.6
0.4
2.6
0.6
2.1
0.1
0.3
10121
3819
96.9
97.1
1.1
1.0
1.1
0.9
0.9
1.0
0.2
0.1
9,985
3,685
85.9
1.5
0.7
11.9
0.0
256
96.7
94.1
98.1
96.6
97.9
1.4
5.8
0.8
1.2
0.6
0.2
0.0
0.4
1.1
0.9
1.4
0.1
0.5
1.0
0.6
0.4
0.0
0.2
0.1
0.0
1,064
715
3,208
3,719
926
89.8
96.0
87.4
23.9
93.3
5.0
1.0
0.6
7.2
0.0
1.4
1.7
8.0
6.6
2.7
1.4
1.2
3.6
59.6
4.0
2.4
0.1
0.4
2.7
0.0
439
2,807
269
316
476
Source: Ethiopia LFS 2005
Table 12 above shows percentage of out-of-school children aged 5-14 involved in economic
activity, by sector of employment. The data reveal that the majority are involved in the agriculture
sector compared to the other sector.
27
Table 13: Percentage of 5-14 children attending school and involved in child labour versus those
who are not involved in child labour
Variable
Total
School attendance rate
of children 5-14.
School attendance rate
of children 5-14
involved in child labour.
School attendance rate
of children 5-14 not
involved in child labour.
%
N
%
N
%
N
29.2
26,740
24.8
6,528
34.0
30.6
27.7
13,521
13,219
26.1
23.0
3,501
3,027
37.0
31.6
10,020
10,192
68.2
23.8
19,153
7,587
66.6
23.1
2,633
3,895
68.5
24.6
16,520
3,692
19.5
55.1
14,247
12,493
17.1
44.4
2,963
3,565
22.0
67.6
11,284
8,928
23.7
34.7
9,723
11,066
21.3
30.1
3,161
2,599
26.6
39.2
6,562
8,467
64.1
5,934
52.2
763
68.1
5,171
39.3
28.1
30.3
26.4
16.7
27.8
24.6
58.9
47.6
82.1
45.0
2,556
638
5,458
5,980
762
953
4,630
215
631
4,321
596
34.5
8.4
26.4
23.8
4.4
25.7
21.6
77.8
30.8
70.4
27.3
731
79
1,553
1,804
75
246
1,261
9
135
489
146
43.5
42.3
35.6
29.5
26.6
28.8
27.4
58.3
54.3
83.6
51.3
1,825
559
3,905
4,176
687
707
3,369
206
496
3,832
450
20,212
Sex
Male
Female
Area
Urban
Rural
Age
5-11
12-14
HH head education
None
Primary
Secondary or
higher
Region
Tigray
Afar
Amhara
Oromia
Somali
Benishangul Gumuz
SNNP
Gambela
Harari
Addis Ababa
Dire Dawa
Source: Child labour, LFS 2005
Analysis of children involved in child labour while at the same time attending school versus
children who were attending school without engaging in any type of child labour shows that about
24.8% is the school attendance rate of 5- to 14-year-old child labourers. The percentage of
children covered by the survey were involved in child labour while attending school is
6528/26740 = 24.4%. Moreover, 34% is the school attendance rate of 5- to 14-year-old children
who are not involved in child labour. The percentage of 5- to 14-year-olds who were attending
school without being involving in any type of child labour is 20212/26740 = 75.6%.
28
The percentage of children who were attending school without engaging in child labour is
20212/26740 = 75.6% (unweighted) of all 5- to 14-year-olds. The percentage of children who
were attending school and at the same time involved in child labour is 6528/26740 = 24.4%
(unweighted) of all 5- to 14-year-olds.
Moreover, 68.2% is the school attendance rate of urban children (regardless of child labour
status), 23.8% is the school attendance rate of rural children (regardless of child labour status).
3895/7587 = 51% of all rural children were engaged in child labour, compared to 2633/19153 =
14% of all urban children. The percentage of child labourers among 5 to 11 year-olds is
2963/14247 = 21%. The percentage of child labourers among 12 to 14 year-olds is 3565/12493 =
29%.
When viewed across regions, the proportion of children involved in child labour while attending
school ranged from 77.8% for Gambella to 4.4% for Somali. Gambella (77.8%) and Addis Ababa
(70.4%) had the highest proportion of children engaged in child labour while attending school,
whereas Somali (4.4%) and Afar (8.4%) had the lowest percentage of children engaged in child
labour while at the same time attending school. As it is also evident from the table, in the city
states like Dire Dawa (27.3%; 51.3%) and Harari (30.3; 54.3%), the proportion of children
attending school without engaging in child labour was very high compared to those who were
involved in child labour while at the same time attending school.
In general, the above table shows that the percentages of children attending school were all higher
for those not involved in child labour in almost all regions. But there was a vibration in the
difference between the two groups among the different regions. For example, the difference
between those who were involved in child labour and those who were not in the Somali Region
was 22.2% (26.6% minus 4.4%) while that in Benishangul Gumuz Region was 2.1% (28.8%
minus 25.7%).
From Table 13 above, it may be observed that the proportion of children who were attending
school varied by status of child labour specially across the three variables by area, education of
head of the household, and by region. It may be noted also that the proportion of children who
were out of school was significantly higher in those households who did not have any education
when compared with those whose educational level was secondary and above. This clearly shows
that multiple variables were affecting children to be out of school. For example, in this case, those
whose attendance was the lowest percentage were those involved in child labour and those who
came from non-educated households (21.3% versus 68.1% for non-working children from
households whose head has secondary or higher education).
Disaggregation by Wealth
EDHS 2011 does not have attendance rates by wealth for lower secondary separately. Table 14
illustrates net attendance and gross attendance rates, by wealth quintile between primary schools,
29
based on the EDHS 2011. The disaggregation by wealth showed that attendance rate increased
with an increase in wealth. For example, at primary level, those with the lowest wealth quintile
documented the lowest attendance rate (52.0%) while those at the highest quintile recorded 83.9%
attendance rate in 2011.
Table 14: Primary net attendance rate and gross attendance rate by wealth in 2011
Status
Net attendance rate
Wealth
Lowest
Second
Middle
Fourth
Highest
Lowest
Second
Middle
Fourth
Highest
Gross attendance Rate
Male
51.3
58.7
60.8
68.2
85.7
70.2
80.3
86.0
93.5
108.4
Female
52.7
57.0
62.5
71.9
82.2
71.8
79.5
87.2
103.2
108.7
All
52.0
57.9
61.7
70.0
83.9
71.0
79.0
86.6
98.2
108.6
GPI
1.03
0.97
1.03
1.05
0.96
1.02
0.99
1.01
1.10
1.00
Source: EDHS 2011
Figure 7 further clarify the fact that both net attendance and gross enrolment rates showed an
increasing trend with an increase in wealth at primary level. The net attendance rate increases
from 52 per cent in the lowest wealth quintile to 84 per cent in the highest wealth quintile. The
gross attendance rate increases from 71.0 per cent in the lowest quintile to 108.6 per cent in the
highest quintile. The GPI results for the wealth quintiles signify that girls’ attendance rates are
greater than the boys’ in all except for the highest quintile for NAR; and for the second quintiles
in both the net and gross attendance rates.
Figure 7: Primary net and gross attendance rates by wealth quintile
Attendance rates
120
100
80
Primary net attendance
rate
60
40
Primary gross attendance
rate
20
0
Lowest Second Middle
Fourth Highest
Wealth quintile
Source: EDHS 2011
30
In general, there is a wide gap in the net attendance and gross attendance rates among children
from the richest and the poorest background indicating that socio-economic status is one of the
determinant factors for children to be in or out of school.
Percent
Figure 8: Primary net attendance rate by wealth quintile in 2005 and 2011
90
80
70
60
50
40
30
20
10
0
2005
2011
Lowest
Second
Middle
Fourth
Wealth quintile
Highest
As can be observed from Figure 8, the net attendance rate has increased with increase in wealth
quintile both in 2005 and 2011.
1.5 Profiles of Children at Risk (Dimensions 4 and 5)
As mentioned earlier, Dimensions 4 and 5 cover children who are in primary and lower-secondary
schools that are at risk of dropping out. In other words, these dimensions represent the potential
OOSC of tomorrow. All children face some risk of dropping out, but not all drop out in the same
way. The analysis of Dimensions 4 and 5 focuses on those children who are at the greatest risk of
dropping out of school. This is considered as a key feature in linking equity in access to quality
education, demand-driven poverty-focused policies to supply-side provision of quality (especially
in relation to school-level processes), and policies for out-of-school children to policies for
children in school.
According to the CMF of this study, a simple way to analyze the population of children at risk of
dropping out is to look at the at-risk children of yesterday, that is, children who recently dropped
out of school. Understanding the profiles of children whose risk of dropping out was realized
provides insight into the profiles of children currently at risk. Accordingly, an attempt has been
made to present and analyze dropout rates at the primary and lower-secondary levels by grade,
sex, and region so as to get useful information about which children leave school early.
1.5.1 Dropouts
Table 15 presents dropout rate at the primary and lower-secondary level, by sex and region.
31
Table 15: Dropout rate by grade at the primary and lower secondary level by sex and region
Sex
Male
Female
Grade
Region
G2
G3
Tigray
14.6
10.8
Afar
41.5
Amhara
21.6
Oromia
Somali
G4
9.2
12.0
13.6
4.4
10.8
21.0
16.1
10.3
29.9
19.7
14.9
13.8
28.38
17.92
10.28
Ben
20.2
7.7
SNNPR
32.3
Gambella
Harari
G5
G6
14.4
G7
G9
G8
9.1
4.4
17.8
17.3
0.7
1.8
15.1
19.3
11.9
19.2
14.0
9.9
13.5
16.6
19.1
10.3
17.2
14.3
22.1
19.50
2.50
9.34
8.46
8.13
11.7
1.3
3.2
15.8
7.8
6.6
4.8
20.7
16.4
12.5
16.0
21.8
11.3
4.8
26.9
20.7
26.3
2.1
8.8
3.9
13.7
9.7
7.2
28.5
45.3
15.3
9.7
17.0
4.7
2.1
15.6
5.5
2.8
4.9
A. Ababa
4.1
3.6
3.4
2.0
6.5
1.1
6.4
2.5
Dire Dawa
29.9
20.9
4.7
8.4
8.0
6.2
3.1
4.9
Total
28.0
21.6
15.1
12.4
18.0
9.2
8.2
15.3
15.4
31.3
Tigray
12.9
9.3
6.9
8.7
13.5
7.3
0.6
23.3
17.2
Afar
37.3
10.4
10.9
13.0
5.5
7.7
13.7
24.5
14.6
Amhara
19.3
16.6
11.3
6.4
17.6
13.5
9.3
16.0
16.7
Oromia
30.9
21.8
Somali
28.88
16.47
7.89
15.58
1.32
6.12
7.98
22.49
12.5
Ben
19.5
6.9
5.7
1.0
16.5
11.2
9.0
4.3
17.1
SNNPR
32.0
19.4
16.0
18.9
22.7
15.4
6.1
27.3
13.4
Gambella
24.7
3.5
2.1
5.5
13.2
4.5
4.0
24.1
Harari
36.4
22.3
16.2
8.4
13.5
1.8
15.0
4.8
5.1
0.3
2.0
3.0
3.3
2.6
2.1
5.0
7.0
0.3
27.9
31.3
A. Ababa
Total
G1
16.6
18.8
20.3
16.4
19.4
5.6
17.8
Dire Dawa
29.5
24.4
5.9
9.1
5.3
5.0
3.3
4.2
Total
28.1
21.4
15.5
14.1
19.1
13.8
10.2
14.2
Tigray
13.8
10.1
8.1
10.4
13.9
8.1
2.4
20.6
17.2
Afar
39.8
12.3
7.0
11.6
2.4
4.0
14.6
21.1
8.1
Amhara
20.5
18.9
13.7
8.3
18.4
13.8
9.6
14.7
16.6
Oromia
30.4
20.7
15.7
16.2
19.7
13.1
18.1
10.8
20.4
28.12
16.02
13.82
17.59
18.62
13.29
18.28
20.52
12.1
19.9
7.3
3.2
2.3
16.1
9.2
7.6
4.6
SNNP
32.2
17.9
14.2
17.3
22.2
13.1
5.3
27.1
18.2
Gambella
25.5
2.7
5.8
4.6
13.5
7.7
6.0
27.0
Harari
41.5
18.6
12.7
13.0
8.7
0.3
15.3
5.2
4.7
1.5
2.6
2.6
4.8
1.9
4.1
1.6
29.7
28.1
22.6
21.5
5.3
15.3
8.7
13.2
6.8
18.6
5.7
11.4
3.2
9.1
4.6
14.8
4.2
3.2
22.4
31.3
Somali
Benishangul
Gumuz
Addis. Ababa
Dire Dawa
Total
19.3
Source : EMIS 2010
32
The dropout rate varies from grade to grade, region to region, and in terms of gender. As regards
grade variation, it is very high in the first grade of primary education and tends to decline
consistently in the next higher grades with some exceptions that are observed in grades 5 and 8.
As indicated in the Education Statistics Annual Abstract (MoE, 2009/10, p 34), 28.1% of pupils
enrolled in Grade 1 in 2008/09 had left school before reaching Grade 2 in 2009/10. This may be
due to lack of ECCE experience/exposure, engagement in child labour, and other related factors.
Though the data for grade 10 was not available, dropout rate at lower-secondary level of
education (Grade 9) was relatively better than that of the primary level except in rare cases.
In terms of the other two variables (sex and region), the data in Table 15 reveal that in most cases
the dropout rate was slightly lower for boys than it was for girls. And the dropout rate varied from
region to region, the highest being in the Somali region. Overall, the data in the table unveil that a
significant number of students in primary and lower-secondary education were dropping out of
school, which could increase the number of potential OOSC of tomorrow. Hence, there is an
urgent need for making a concerted effort towards changing this scenario to enable the education
system to attain UPE by 2015.
Dropout rate by age and sex from the 2007 Population and Housing Census
Dropout rate is one of the indicators of the education system which shows the percentage of those
students who discontinue their learning from a given grade compared to the previous year’s total
enrolment in the same grade. Table 16 portrays the dropout rate by age and sex .The dropout rate
for both male and female students shows an increasing trend with the increase in students’ age.
Table 16: Dropout rate by age and sex from household data
Age
Male
Female
Total No. of
students
No. of
dropped out
students
%
Total No. of
students
No. of
dropped out
students
%
7
472,300
30,237
6.40
455,720
24,908
5.46
8
536,735
44,027
8.20
521,217
38,605
7.40
9
372,153
40,192
10.79
374,570
36,967
9.86
10
579,338
75,684
13.06
539,655
63,900
11.84
11
223,665
34,429
15.39
212,517
30,123
14.17
12
13
507,463
285,434
86,433
53,140
17.03
18.61
468,440
261,552
69,800
45,592
14.90
17.43
14
327,028
67,481
20.63
313,285
54,196
17.29
15
386,422
87,424
22.62
371,677
65,509
17.62
16
335,901
78,961
23.51
310,288
59,637
19.21
Source: 2007 Population and Housing Census
33
Trends of dropout rate based on administrative data
As depicted in Figure 9, the trend analysis for drop outs showed a declining trend from 2003 to
2005 but again started to show an increasing trend from 2006 to 2009.
Figure 9: Trend analysis for primary school dropouts by sex and year (2003 to 2009)
Source: EMIS 2003 - 2009
Figure 9 further reveals that the disparity of between boys and girls in terms of dropout varies
from year to year, i.e. except in 2009 the drop out figure for boys is higher than that of girls;
however, the disparity tends to show insignificant variation in 2006.
Dropout rates show no significant variation between boys and girls each year. The trend first
decreases for the first three years then increases for the last four years but no change when the last
seven years are compared.
1.5.2 Repetition rate
Another way to analyze the at-risk population is to examine various indicators linked to children
in school. One of these indicators is repetition rate at primary and lower secondary level of
education. This indicator measures the proportion of students who have remained in the same
grade for two or more consecutive years by retaking the grade having either left it prematurely or
returning for a second or third time. The repetition rates by grade, sex, and region are presented in
Table 17 to highlight the points at which children are not progressing in school.
34
Table 17: Repetition rate by grade at the primary and lower secondary level by sex and region
Sex
Region
Male
Female
Total
Grade
G1
G2
G3
G4
G5
G6
G7
G8
Tigray
2.8
3.2
3.6
3.6
5.6
3.6
3.8
5.6
8.8
Afar
13.1
9.1
6.9
5.8
9.2
4.5
4.9
4.7
16.4
Amhara
9.4
6.0
5.6
6.0
7.3
5.4
6.9
7.8
15.4
Oromia
3.0
2.9
3.2
3.7
3.6
2.9
4.7
2.9
3.3
Somali
19.5
6.1
11.3 11.6 31.2 47.7
58.2
68.0
42.2
Ben
18.3
11.8 11.2
9.8
15.9 10.7
15.1
12.3
17.6
SNNPR
1.4
1.5
2.5
4.0
3.2
4.3
8.9
16.5
Gambella
18.1
11.1 10.7 10.7 14.2
6.9
7.2
10.8
16.5
1.7
G9
Harari
4.6
5.7
8.0
7.5
13.2
9.0
11.3
7.2
17.6
Addis Ababa
0.9
0.4
0.8
2.7
2.3
2.5
4.4
4.2
5.4
Dire Dawa
0.2
0.5
0.2
0.5
1.5
0.8
1.4
1.5
0.0
National
5.4
3.7
3.8
4.3
5.5
4.4
5.8
6.9
Tigray
2.5
2.7
3.0
2.8
5.6
2.6
3.1
4.9
10.3
Afar
17.7
2.7
3.0
2.8
5.6
2.6
3.1
4.9
10.3
Amhara
7.1
5.4
4.9
5.3
7.1
4.5
6.2
6.1
21.9
Oromia
3.5
3.9
4.8
5.9
6.6
5.8
10.1
6.1
5.1
Somali
18.8
5.7
10.6 11.7 27.0 52.7
64.0
83.7
42.9
Ben
16.9
11.7 10.1
8.5
13.9
9.4
12.2
12.5
17.0
4.4
6.5
SNNPR
1.9
2.1
5.5
7.5
15.2
15.5
Gambella
19.5
11.2 12.4 11.6 17.8 12.2
2.7
12.1
16.0
17.5
Harari
5.9
5.6
8.4
8.6
9.1
8.5
11.8
9.6
10.3
Addis Ababa
0.9
0.6
0.5
1.9
1.9
1.8
4.2
5.8
4.7
Dire Dawa
0.5
0.5
0.4
0.3
2.3
1.0
2.2
3.2
0.0
National
4.1
4.5
4.3
4.8
8.3
6.0
8.8
8.9
Tigray
2.6
3.0
3.3
3.2
5.6
3.1
3.5
5.2
9.5
Afar
15.1
3.3
3.3
3.0
5.8
2.7
3.2
4.9
10.6
Amhara
8.4
5.7
5.2
5.7
7.2
4.9
6.5
7.0
18.5
Oromia
3.2
3.4
3.9
4.8
5.0
4.2
7.0
4.2
4.1
Somali
19.2
6.0
11.0 11.7 29.5 49.3
59.9
72.5
42.4
Benishangul
Gumuz
17.7
11.8 10.7
9.2
15.0 10.2
13.9
12.4
17.4
SNNPR
1.6
1.8
3.4
5.2
4.2
5.7
11.6
16.2
Gambella
18.8
11.1 11.5 11.1 15.7
9.0
9.0
12.6
16.9
Harari
5.1
5.6
8.2
8.0
11.4
8.8
11.5
8.2
14.5
Addis Ababa
0.9
0.5
0.6
2.2
2.1
2.1
4.3
5.1
5.1
Dire Dawa
0.3
0.5
0.3
0.4
1.8
0.9
1.7
2.3
0.0
National
4.5
4.1
4.0
4.5
6.7
5.1
7.1
7.8
2.2
Source: EMIS 2010
35
The repetition rate varies by grade, region, and gender. As regards grade variation, relatively
higher repetition rate is observed in grades 5, 7 and 8 of primary education. The lowest repetition
rate was registered in grade 3 and the highest in grade 8.
As per the explanation in the Education Statistics Annual Abstract (MoE, 2009/10), the relatively
higher repetition rate at grade 8 is observed partly due to a national policy which indicates that
those who could not pass the school leaving examination should repeat grade 8 prior to retaking
the examination (p. 33). Though the data for grade 10 was not available, repetition rate at lower
secondary level of education (Grade 9) varies from region to region the highest being in Somali
and the lowest in Dire Dawa.
Girls’ repetition was lower than that of boys In grade 1, but the reverse is true for the other grade
levels. The repetition rate in primary education is slightly lower for female students than for
male students though it is much higher than the target set in ESDP IV, i.e., 1%. Besides, the
repetition rate of female students is lower than that of male students in lower secondary
education. And the repetition rate at primary education shows regional variation where the highest
being in Somali region and the lowest in Dire Dawa. Overall, the data in Table 16 unveil that
sizeable portion of students in primary and lower secondary education who are not promoted to
the next higher grade, which may raise concerns on the quality of education provided in the
schools.
The repetition rate in seven of the eleven regions is less than 10% whereas in the remaining four
regions (Somali, Gambella, Benishangul Gumuz, and SNNP) are higher than 10%.
1.5.3 Percentage of new entrants without ECCE experience
The percentage of new entrants to primary education without ECCE experience is an indicator of
the risk of exclusion from education. Percentage of new entrants to primary education with no
ECCE experience refers to the number of new entrants to primary education who have not
attended some form of organized early childhood care and education (ECCE) programs,
expressed as percentage of total number of new entrants to primary education. Table 18 depicts
the proportion of new entrants to primary education with no ECCE/pre-primary experience and
thus who have greater risk of dropping out. As shown in the table, except in Addis Ababa and
Harari where close to 49% and 53% of the new entrants to primary education have no ECCE
experience respectively, in other regions and at national level the proportion of those new entrants
to primary education with no ECCE experience ranges between 68% and 93%, the highest being
in Afar region. This may be an indication for the presence of students in primary education with
high risk of dropping out and exclusion from education.
36
Table 18: Percentage of new entrants to primary education with no ECCE experience
Region
Male
Female
Total
Tigray
86.4
85.7
86.0
Afar
93.0
92.9
93.0
Amhara
91.1
90.6
90.9
Oromia
67.6
68.3
67.9
Benishangul-Gumuz
82.6
81.7
82.2
SNNP
69.5
69.4
69.5
Gambella
70.0
71.4
70.7
Harari
55.5
50.8
53.3
Addis Ababa
44.5
52.0
48.7
Dire Dawa
74.6
71.5
73.1
Total
74.0
73.9
74.0
Source: EMIS 2010
Participation in pre-primary has been shown to reduce the likelihood of early school leaving
(Hammond, et. al. 2007). As mentioned in the ESDP IV, participating in ECCE is the right of the
child and it has been considered as a bed rock of EFA and the first step in meeting all the other
EFA goals . The same document also states that GER for ECCE will increase from 6.9% in
2009/10 to 20% in 2014/15 (MoE, 2010, p.31). The findings of a recently conducted study
(Ayalew, 2010) however, disclosed that enrolment at the pre-primary level has generally
remained low even by Sub-Saharan African standard. The study also revealed that most schools
are found in urban areas and even then access is limited to children whose parents can afford to
pay the fees, except in some faith based institutions where there are no or only nominal fees.
Moreover, provisions of early childhood education are mostly left to the non-government sectors
and the Ministry of Education has restricted itself to curriculum development and teacher
education.
1.5.4 Transition rate from primary to lower secondary
One last way to analyze dropout is to look at transition rates from primary to lower secondary
education which is illustrated in Table 19. Transition rate refers to the number of new entrants to
the first grade of secondary education in a given year, expressed as a percentage of the number of
pupils enrolled in the final grade of primary education in the previous year.
Table 19: Transition rate from primary to lower secondary education
Indicator
Male
Female
Total
GPI
Transition rate to lower
secondary education
80%
79%
80%
0.99
Source: EMIS 2010
37
The transition rate from primary to lower secondary education presented in Table 18 shows that
80% of both male and female students in the final grade of primary education were able to enter
to the first grade of lower secondary education. The GPI value (0.99) further indicates the
existence of gender parity in terms of transition rates.
Table 20 indicates primary school completion rate calculated as a proportion of new students in
the last grade of primary (Grade 8) to the population official age (14 years old) in the last grade.
Table 20: Primary completion rate by sex
Indicator
Primary completion rate
Male
51%
Female Total
44.5% 47.8%
GPI
0.87
Source: EMIS 2010
The 2009/10 EMIS report signifies that the primary completion rate at grade 8 is only 47.8%. The
completion rate for male students is higher than that of the female students by 6.5 percentage
points.
1.6 Analytical Summary
This section summarizes the highlights of the major issues related to the profiles of excluded
children that are discussed in the six sections of the chapter. As its main purpose, this specific
chapter attempted to describe the profiles of excluded children in terms of the five dimensions of
exclusion. Accordingly, the analysis of data in Dimension 1 revealed that about 11% of preprimary school-age children (6) attended education at pre-primary and primary schools. The net
enrolment rate for pre-primary education was also found to be close to 5% at national level.
Moreover, regional variations were observed in terms of attendance and enrolment rates at this
level of education.
Pre-primary education should be advocated not only because it is recognized as a child right in
the various conventions but also because it plays an important role in the school success of the
child. Researchers in the field asserted that many children repeat classes and/or dropout from
school altogether because of adjustment problems. Pre-primary education is a proven solution to
this problem. Moreover, this type of education enables mothers to go to work. This sub-sector of
the education system should, therefore, be given due consideration by all stakeholders.
Regarding the profile of OOSC in Dimensions 2 and 3 based on the administrative data , there are
4,878,385 out of school children. Of these, 3,075,862 are in the primary age group and 1,802,523
are in the lower secondary age group. Using EDHS 2011 considering attendance rate the total out
of school children are 7,526,412 which is greater than the number estimated by using enrolment
rate. The number of out of school children are significant in both cases where Government’s
effort must be increased to maximize enrollment and minimize school drop outs to reduce out of
school children significantly.
38
The percentage of those children who were 7 and 8 at joining the primary school as new entrants
was found to be high as compared to older children. It should be emphasized that leaving school
without completing a full cycle of primary education is still problematic. All these indicate that
these situations may pose a much bigger problem for the education system. The data analyzed
above indicate that those children who live in rural areas are prone to be OOSC. This implies that
these children will be forced to spend their lives out of school and there will be no significant
development in their lives; their contribution to their nation’s development will also be affected as
they are not educated.
The OOSC gender disparity is higher at lower ages and almost small after age 13. The findings
further indicated that, even though very high gross and net enrollments are recorded at national
level, over three million children are still out of school. It is clearly observed from the findings
that some of the school-age children are not attending school due to their engagement in
productive and housekeeping activities. Besides, more girls than boys do housekeeping work and
more boys than girls are engaged in productive/economic activities. In general, child labour is
found to be common both in rural and urban areas of the country, though the participation of rural
children is higher than their urban counterparts.
Concerning the profiles of children at risk in Dimensions 4 and 5, the results of this research
disclosed that the dropout rate from primary and lower-secondary education varied from grade to
grade, region to region, and by gender. Moreover, dropout rates as well as repetition rates at
primary and lower-secondary levels were found to vary by grade, region, and gender.
Furthermore, the transition rate from primary to lower-secondary education showed that 80% of
both male and female students in the final grade of primary education were able to enter the first
grade of lower-secondary education. The GPI value (0.99) further indicated the existence of
gender parity.
The disaggregated data by wealth and region further unveiled that those with highest wealth
quintile had better attendance and enrolment rates. This emphasizes the need to motivate poor
children by providing them with basic support like educational materials and school uniform. In
terms of region, the highest percentage of OOSC was recorded in Afar, Somali, Addis Ababa,
Dire Dawa, and Harari, whereas the lowest was found in Tigray and Amhara. However, Oromia,
Amhara, SNNPR and Somali have the largest number of out of school children in terms of
absolute figures.
The trend analysis also revealed that enrolment rate has increased for the past 15 years
significantly. The other interesting observation was that the increased rate for girls was much
better than that of boys. This has to be encouraged by promoting children from ages 7 to 17 years
to join schools and increase the percentage of students who will enter school by age 17. In
general, indicators under this chapter showed the following results:
1.
enrolment rate has significantly increased for the past 15 years;
39
2.
dropout rate appears to be increasing but the rate is not statistically significant. The trend
for dropout is constant, i.e. it was 19% for the year 2003 and again 19% for the year
2009; and
3.
there is a significant difference in enrolment rate by residence, sex, age, and region.
Hence, concerted efforts should be made by all stakeholders towards curbing the problems of outof-school children in general and attaining UPE by 2015 in particular. Among the possible
courses of action, the following are worth considering:
The current increasing enrolment trend must be maintained by encouraging two targets
of the population. That is, those children at the primary age group should be able to
attend the formal education system continuously. Secondly, those children above the age
of 14 need to be enrolled in school as much as possible by age 17. Besides, constructing
additional secondary schools at kebele levels might solve the accessibility problem of
those out-of-school children of the lower-secondary age.
Parallel to increasing enrolment rate, strategies ought to be designed to decrease dropout
and repetition rates, especially at the lower-secondary level.
Appropriate strategies must be designed to address the needs of the pastoralist/semipastoralist communities and vulnerable segments of the population.
40
CHAPTER 2: BARRIERS AND BOTTLENECKS
2.1 Background
Education for All and Universal Primary Education are two UN Conventions Ethiopia has
committed to fulfil. To this effect, the government of Ethiopia has made enormous strides by
increasing the budget allocated for education from year to year and soliciting financial and
technical support from various development partners. In fact, these strides enabled the
government to register commendable results as compared to the country’s school enrolment and
education coverage during the early 1990s. Despite the encouraging results achieved, there are
still a significant number of out-of-school children that could not be enrolled due to various
barriers and bottlenecks.
In this chapter the barriers and bottlenecks that keep children out of school are analyzed and
discussed using the five dimensions of exclusion (5DEs) as a broad structure and guide. The
analysis aims at identifying differences between causes and barriers related to children that are out
of school and those that are likely to drop out of pre-primary, primary, and lower-secondary
school levels. The first and second sections deal with this background and the socio-cultural
demand side, respectively. The third and the fourth sections discuss the economic demand and
supply side. In the fifth section political governance, capacity, and financing issues are discussed.
The chapter culminates by presenting the analytical summary. Even though the chapters are
divided in such a way for the purpose of discussion, it should be noted that the socio-cultural and
economic demand side barriers are most of the time interlinked and difficult to separate from the
other factors, for it is a combination of these barriers and bottlenecks that keep children out of
school.
2.2 Socio-Cultural Demand Side
Ethiopia is a big and populous country with 80 ethnic groups that have their own peculiar as well
as common socio-cultural values. Amongst the various socio-cultural values, some, such as
violence against women and children, early marriage, and negative attitude towards education are
common to most of the ethnic groups. These socio-cultural values are apparently barriers and
bottlenecks to school enrolment, retention, and completion, especially for girls, children with
disability, orphans and other vulnerable children. The key socio-cultural barriers to schooling can
be grouped into five as presented in the table below.
41
Barriers
Dimensions of Exclusion (DE)
Factor
DE1 DE2 DE3 DE4
1. Violence against children (VAC) and genderbased violence (GBV) in and out of school
√
2. Harmful traditional practices
2.1 Early marriage and teenage pregnancy
SocioCultural
Barriers
2.2 Female genital mutilation
towards
√
√
√
√
√
√
√
√
√
√
√
3. Lack of parental awareness regarding the
benefit of education
4. Wrong attitude
disabilities
DE5
children
with
5. Wrong attitude towards the education of girls
√
√
√
√
√
As indicated above, the effects of these barriers differ from one dimension to another. For
instance, violence against children and gender-based violence affect those children who are out of
school (DE2 and DE3) as well as those who are in school but at risk of dropping out (DE4 and
DE5). The second barrier, i.e., harmful traditional practices, also affects children who are not in
school (DE1 and DE3) as well as those who are in school but at risk of dropping out (DE4 and
DE5). Besides, lack of parental awareness regarding the benefits of education, wrong attitude
towards children with disabilities and the education of girls hamper children’s school enrolment
and increase dropout rates at pre-primary, primary, and lower-secondary levels. One thing that
should be noted is that a child can fall into one of the 5DEs because of more than one barrier and
bottleneck, as discussed in this study.
2.2.1 Violence against Children (VAC) and Gender-Based Violence (GBV)
Violence against children does not differentiate gender but affects both male and female children
whereas gender-based violence affects only girls. In this section, these two types of violence
along with their consequences in relation to school attendance and dropout are discussed.
Violence against children is defined in various studies in different ways but their common point is
they focus on children and some types of violence. According to Article 19 of the Convention on
the Rights of the Child (CRC), violence against children is defined as “all forms physical or
mental violence, injury and abuse, neglect or negligent treatment, maltreatment, or exploitation
including sexual abuse” (Jacomy, 2008).
Violence against children is a pervasive and deeply disturbing problem. Violence takes place in
many settings: in homes, in schools, on the streets, in institutions and at work. The forms of
violence range from physical violence such as beating to psychological and sexual violence
including name-calling, humiliation, and rape. Although some forms of violence are unexpected
and isolated, most are committed by people whom children know and trust such as parents, step-
42
parents or parents’ partners, school-mates, teachers and employers. Certain groups of children
such as children with disabilities, children living on the streets, adolescents in conflict with the
law, and refugee and displaced children are more vulnerable for such violence. Often, children
who face violence or witness it remain silent due to fear and stigma and many children accept
violence as an inevitable part of life.
On the other hand, gender-based violence is one of the major barriers that inhibit girls not to be
enrolled in schools. Since girls are exposed for this danger, they are not willing to go to school;
their parents are also reluctant to send them to school for the same reason. Moreover, once a girl
is a victim of gender-based violence, she will not have the interest to pursue her education due to
the trauma she has undergone. Actually, there are no data that show the number of girls who
discontinued their education due to gender-based violence. However, all respondents from the six
sample regions unanimously confirmed that gender-based violence, particularly rape and
abduction, are still the main barriers to girls’ education. The study conducted by Population
Council and UNFPA - Ethiopia Country Office (2010) classifies the types of violence inflicted on
females and males as follows.
Table 21. Magnitude of violence in Ethiopia
Region
Tigray
Afar
Amhara
Oromia
Ben. G.
SNNPR
AA
All 7
Regions
Percentage of children who were affected by violence
Forced sex/Rape
At least one type of domestic violence
Urban
Rural
All
Urban
Rural
All
Male Female Male Female Male Female Male Female Male Female Male Female
14.6%
- 13.5%
13.7%
2%
15.4% 4.6%
3.6% 11% 11.7% 3.9% 11.4%
13.2%
15.4%
14.9%
17.3%
9.5%
10.9%
12%
13.9%
13%
13.3%
15.4 13.8% 13.2%
9%
9.2% 9.8%
9.8%
6.4% 11.4%
19.2%
16.2%
16.4%
19.2%
18.3%
10.3%
26.1%
1.4%
12% 2.8%
16%
2%
15%
5.4%
16.6% 9.8%
10.9% 8.8%
12.5%
Source: Population Council Inc. and UNFPA Ethiopia Country Office Survey (2010)
(a) Sexual Abuse Issues within and out of Schools (Widespread but often Unrecognized
Problem)
Most of the time girls are victims in this regard because they are forced by their peers, older
people who are members of the family such as step-fathers, parents’ relatives, etc. or some
teachers to have sexual intercourse with them. Such violence is also committed either on the way
to school, at home, or in school. As shown in Table 21, 15% (12% urban and 16% rural) of girls
and 2% (1.4% urban and 2.8% rural) of boys have ever experienced forced sex (rape). Forced sex
(rape) was highly prevalent in Tigray, Amhara and SNNPR where, in each region, 14.6%, 13.2%
and 11.4% of urban females and 13.5%, 15.4% and 19.2% of rural females, respectively, were
victims of forced sex (rape).
43
(b) Verbal Abuse, Physical Violence and Chastisement for Coming Late on Regular Basis
A survey conducted in Ethiopia found that 7.2% of children had been slapped for coming late to
school. Moreover, 84% of girls surveyed had experienced physical abuse. Many were beaten
severely and they had to go to a clinic to treat the resulting health complications. Because of these
and other reasons, they do not have interest to go to school.
(c)
Lack of Parental Care and Household Poverty
Those children who are orphans or migrants from other areas are suffering from the above
mentioned violence because their guardians or foster parents do not take care of or pay attention
to them. On the contrary, they demanded the children’s labour for domestic work and when these
children fail to comply with the instruction of the guardians for one reason or another, they hit, or
insult, or raise some bad things about their deceased parents so as to torture them. Moreover, not
only the guardians do not allow these children to study but also they discourage them by saying
“you will not succeed”, etc. Due to these reasons, the children (i) will be discouraged to study
their lessons, (ii) cannot do their assignments given by their teachers, (iii) since they could not do
their assignments they are afraid of going to school because their teachers will ask them to bring
their parents (iv) will not dare to ask their guardians to buy them educational materials so that
they will not take the whole note given by their teachers (v) they underestimate themselves and
develop inferiority complex, (vi) even if they seat in the class, they could not attend the lessons,
etc. In general, the children are abused by their guardians at home and sometimes outside home.
Even if there is no sufficient data that show how many boys and girls dropped out of their
education due to the aforementioned violence, it is possible to presume from the above
disaggregated data that many girls and boys either dropped out of their education (DE2 and DE3)
or are at risk of dropping out of their education due to fear of the violence (DE4 and DE5).
The basic issue here is that even though the magnitude of the violence is as indicated above, it is
not recognized by most people who are out of the school because children do not tell such
violence to any one fearing that they will be attacked again. Therefore, in order to tackle dropout
rate that crop up due to the aforementioned violence, government, community members and
teachers in particular should pay due attention to children who are exposed to different types of
violence by pursuing their class attendance, checking their exam results and approaching them to
know their problems. In addition to this, strict regulation should be enacted so that those people
who attack these children on the way to school, in school or at home can be penalized. Apart from
this, continuous awareness raising activity should be made in and out of school regarding the
types of violence against children and gender-based violence the consequences of such violence
and other related issue.
2.2.2 Harmful Traditional Practices (HTPs)
This is also one of the factors that affect children’s school enrolment and attendance. In Ethiopia
there are different types of harmful traditional practices that are barriers to the demand for
44
education. Among many HTPs that are prevalent in the country are early marriage, female genital
mutilation, and undermining the future fate of female children. The following paragraphs briefly
describe and analyze the status of early marriage and abduction in the country.
Early marriage is a very serious problem that could lead to grave, lifelong health complications.
In Ethiopia the legal age at marriage for both sexes is 18, and child marriage is defined as
marriage before this age. Due to the strictness of the law and the growing awareness of children
and other community members about the bad consequences of early marriage, it is not done
officially; rather, it is happening in hidden and systematic ways. Table 22 shows the status of
early marriage in different regions of Ethiopia.
Table 22. Status of early marriage
Age (12-14)
Boys Girls Boys
Girls
Never
enterred
school
Tigray
1.6%
10.7%
58%
31.2%
16.5%
Afar
0.3%
16%
59.3%
37.3%
36.9%
Amhara
2.7%
25.4%
82.1%
21.3%
17.2%
13.6%
75.9%
30.2%
22.6%
29.4%
74.9%
32.7%
31.8%
2.2%
61.5%
16.6%
17.3%
Region
Oromia
BG
SNNPR
2.7%
Age (15-17)
Dropped out
LPS
UPS
Source: Population Council Inc. and UNFPA Ethiopia Country Office Survey (2010)
As shown in the above table, the highest rate of early marriage was registered in Amhara and
Benishangul Gumuz (BG) regions 28.1% (2.7%+25.4%) and 31.2% (2.7%+29.4%), respectively,
followed by Afar, Oromia, Tigray and SNNPR, which registered 16.3%, 13.6%, 12.3%, and
2.2%, respectively. The report further indicated that a significant number of those who married
early were uneducated. Moreover, 13% of the girls were married by abduction and 13.5% of the
girls were forced to drop out of their education due to the early marriage. In general, the abovementioned study indicated that 1.8% of male and 13.8% female children aged 15-17 were married
while only 1.1% of girls aged 12-14 were married. Greater than 35.3% of the girls who married
before the age of 15 had no education, whereas more than 9.6% and 2.1% of the girls had attained
primary and secondary education, respectively.
The report further showed that, among those girls who were enrolled in different levels of
education, 8.2% had dropped out of their education. Moreover, among those girls who married,
1.1%, 3.7%, and 8.9% were followers of Orthodox Christianity, Islam and Protestantism. Males
were also victims of early marriage. As per the report, 0.4%, 5.8%, 0.9% and 1% of boys in Afar,
Amhara, Oromia and Benishangul Gumuz got married by the age of 15. Of these, 3.2% were
never enrolled in school while 2.2% and 1.1%, had attained primary and secondary school,
respectively. As a result, 2.8% of the boys and 18.2% of the girls were not able to pursue their
45
education. Further, 3.7% (2.9% urban and 4.3% rural) of the boys and 28.9% (21.2% urban and
39.6% rural) of the girls were forced to leave their school due to marriage (DE3). Those girls and
boys who are married are at risk of dropping out of their education (DE5). The respondents from
Afar and Amhara also confirmed that early marriage was the major barrier to girls’ education
even though this practice was showing a declining trend in rural towns of the Amhara region.
The causes for early marriage differ from region to region and from one ethnic group to the other,
but the most common causes, according to Save the Children - Denmark, MoWA, and MoE
(2008), are the following:
i.
ii.
iii.
iv.
v.
vi.
Economic factors: One of the causes for early marriage is obtaining bride price (the
tradition of seeking bride price/bride wealth).
Improvement for the boys’ family, which includes additional labour (the girl) and possible
access to additional land, when a new household is established.
Interest to affiliate with families of high status, i.e. families with important resources such
as land, labour, and cattle: Early marriage is, therefore, one of the major mechanisms to cope
with economic crisis. It enables the family to gain resources from outside the household.
The assumption that an unmarried girl is helpless and totally unprotected: Thus, the
parents of a girl child feel a big responsibility to ensure the marriage of their daughter. Since
life expectancy in Ethiopia is low, parents may not dare to wait too long to get their daughters
married.
Fear of pre-marriage sexual activity: In most of the Ethiopian cultures where early
marriage is practiced, the virginity of the girl is given high value. The fear of the girl losing
her virginity (voluntarily or forced) and becoming pregnant before marriage is a key
motivating factor for the parents to get their daughters married in an early age.
Fear of abduction: Early marriage also serves to protect girls against abduction.
The above discussion indicated that there still remains a long way to go before early marriage is
removed from our society. Therefore, government bodies and other stakeholders should work
together on awareness-raising activities and influencing people not to give their female children
away in early marriage because the burden is very tough. Marriage by abduction differs from
early marriage because the man takes the female forcefully without the consent of her parents or
the girl. In fact, after the abduction, he will send arbitrators to have her parents’ approval. In very
rare cases, there is also arranged abduction either by her parents or herself. Since abduction is
usually committed without the consent and the will of the abducted female, it is a violent act and
in most cases the girl is raped immediately after the actual abduction.
46
Table 23. Places for abducting school girls
Respondents
In school
On the way to and
from school
At home
%
%
%
Yes
7
81
89
No
93
19
11
Yes
18
55
30
No
82
45
70
Yes
9
72
23
No
91
28
77
Total No. of respondents:
Parents= 323; Students= 1260;
Teachers=335
Students
Teachers
Parents
According to the study done by Save the Children - Denmark, MoWA, and MoE (2008), girls are
often abducted from schools, on their way to and from schools, and from home. This is shown in
Table 23.
The factors behind abduction are rather complex and also differ from culture to culture. However,
some of the causes are explained below:
a) Economic cause: If the boy’s family can’t afford the bride price, abduction is an option.
b) Rejection of the boy by the girl’s family: In such cases, the boy becomes harsh and decides
to marry the female forcefully.
c) Male dominance in the act of the abduction: Boys need to prove that they are strong enough
to forcefully get exactly the girl they want – if she is not a married.
In general, due to early marriage and abduction, many young girls drop out of their education
because of teenage pregnancy that may expose them to lifelong complications, including death,
due to different obstetric problems they may encounter during pregnancy and/or delivery. If they
deliver safely, the next step is to be mothers of many children and to assume the responsibility of
caring for them. These and other issues together force the girl to drop out of her education (DE3).
On the other hand, those girls who are attending their education may see the situation their friends
who married either by abduction or early marriage are in and feel discouraged to pursue their
education and may be at risk of dropping out for fear of abduction and early marriage (DE4 and
DE5).
2.2.3 Lack of Awareness regarding the Benefit of Education
It is apparent that children’s school participation depends, to a large extent, on the parental
decision making, which is the most influential factor in sustaining school participation at upperprimary (DE4) and lower-secondary (DE5) levels. However, many parents, particularly those who
live in rural Ethiopia, do not have the proper knowledge regarding the benefit of education due to
the fact that they are illiterate. This remains one of the greatest barriers to children’s non-
47
enrolment in Ethiopia. In particular, mothers’ illiteracy or low educational level plays a major role
in the high children’s dropout rate or in the fact that some never join school.
Another issue related to the high risk of children dropping out of school (DE4 and DE5) is the
lack of parental support to their children, i.e., parents do not provide emotional, social and
economic support for their children to enroll and stay in school. Parental support for schooling is
an important factor in ensuring that the necessary environment for school participation is
sustained. A key enabling factor to school participation is the link between parental perception of
the benefits and outcomes of schooling and their desire to keep children in school. Parents who do
not see the immediate and long-term benefits of sending their children to school because they
expect poor quality education and/or because children do not meet the social and economic
success marker in the community are unlikely to continue to invest on education. Therefore, a
misconception of parents regarding education is amongst the barriers for the enrolment of
children in schools.
A study conducted by Population Council Inc. and UNFPA - Ethiopia Country Office (2010)
indicated that among 4,689 boys and 4,794 girls (both groups aged below 6 and above 18) drawn
from seven regions, 6.8% (2.1 urban and 10.6% rural) and 6.4% (2.5% urban and 11.58% rural)
were forced to drop out of their education due to parents’ disapproval. Those sample respondents
who were asked to express their opinions on the issue replied that families’ education level
determines the enrolment of a child to school. If they are illiterate, they do not know the benefit of
education and thus will have a wrong attitude towards education. Therefore, schools, together
with governmental and non-governmental organizations, should engage in advocacy activities
regarding the long-term positive impact of education and try to address the temporary problems
that inhibit parents to send their children to school.
2.2.4 Wrong Attitude towards Children with Disabilities
In Ethiopia many people, including the parents of children with disabilities, assume that the future
of such children is dark as they cannot do anything. As a result of this, many children with
disabilities could not be enrolled in schools. Such an attitude is a significant barrier to educational
access for children with disabilities. People could not see the value of education for children with
disabilities. This situation often limits the number of children with special needs attending school
and is a barrier particularly in schools where teachers and heads of teachers do not promote
inclusive education. This barrier affects children particularly in entry to pre-primary and primary
education. The above-mentioned survey study revealed that in the seven regions 1.3% of 4,689
boys and 1.3% of 4,794 girls were forced to leave schools or did not attend school (Population
Council Inc. and UNFPA, 2010).
The sample respondents from education and other social sectors clearly indicated that the
importance of special needs education is well articulated in the 1994 Education and Training
Policy, and a special needs education strategy has been developed by the MoE. As a result,
48
children with various kinds of disabilities are enrolled in schools but the public attitude towards
these children has not yet changed. Accordingly, many children are kept in their homes and are
not allowed to go to school. As noted in the UNESCO Global Monitoring Report (2010), failure
to address inequalities, stigmatization and discrimination linked to disability and other socioeconomic characteristics can hold back progress towards Education for All. Therefore, a
concerted effort should be made by all stakeholders to change such wrong attitudes and address
the problems of children with disabilities.
2.2.5 Wrong Attitude towards the Future Fate of Female Children
The other social barrier to girls’ education is the society’s attitude towards the fate of female
children. Parents assume that educating a female child is a waste of time and resources because
when she is old enough, she will marry someone and start taking care of her children and
husband. Such an attitude deters females’ access to education and gives undue advantages for
boys since boys get better chances of getting educated and are considered as an asset to the
family. This is due to the patriarchal system that prevailed in the country and a general low regard
for the value of female education, among other factors. These reasons adversely affect the
participation of girls in education. As a result, educating girls is not seen as a strategic investment.
The money parents spend on girls’ education is often seen as a loss to the family.
The other attitude towards girls’ education is that girls are less competitive in education in general
and less talented in some subjects like Mathematics that are considered tough. Such negative
attitudes erode girls’ confidence to study such subjects. Studies carried out on this issue in
Ethiopia also confirm this view. According to one study by Population Council Inc. and UNFPA
(2010), the attitude among young adults and parents towards girls’ capacity in education is more
or less similar, i.e., 36.2% male and 33.6% female youths said that most girls are lazy in school,
and 29.3% of fathers and 30.6% mothers also felt the same. Such attitudes will increase the
number of students in DE4 and DE5. This implies that a lot of sensitization and awarenesscreation activities should be done in order to curb this problem. Besides, schools, the government,
and non-government organizations should support female students in their education. Apart from
this, older females who have completed their education should be given jobs and other
opportunities so that younger female students will be motivated to successfully complete their
education; if this happens, their parents will be encouraged to send their female children to
school.
2.3 Economic Demand Side
The other essential factor for the enrolment of children in schools is the economic demand side.
This factor comprises household income, schooling cost, presence of schools, community
involvement, transportation, education quality and relevance (Raja and Burnett, 2004). Many
children will either never enter school or drop out of their education even if they have demand for
49
it due to economic problems. In this sub-section, the economic barriers and bottlenecks that keep
children out of school or that will lead those children who are already in school to drop out of
school are discussed.
Dimensions of Exclusions
Factor
DE1
DE2
DE3
DE4
DE5
1. Household poverty
√
√
√
√
√
2. Cost-benefit of education
√
√
√
√
√
3. Being orphan
√
√
√
√
√
√
√
√
√
√
√
√
√
4. Seasonal factor and migration
5. Indirect and opportunity costs of education
√
6. Child labour
√
The aforementioned economic factors, often working together, bring about high rates of
household vulnerability, which can be affected with the slightest economic shock, causing
dropouts and/or preventing other children from enrolling. Parents who are very poor have to make
strategic and hard decisions to bring about the least risk when deciding on which children should
go to school.
2.3.1 Household Poverty
Poverty in Ethiopia is pervasive and multifaceted and, as a result of this, it is estimated that about
38% (39.3% in rural and 35.1% in urban) of the population lives below the poverty line (MOFED,
2006). In fact, in rural area poverty has declined due to pro-poor interventions such as the food
security program, the extension program, and the productive safety net program. When we see
poverty as a barrier for school enrolment and attendance, although school enrolment has increased
dramatically in Ethiopia, there are more than three million children who are out of school. There
are also many others who are attending education but are at risk of dropping out. The main reason
for these children to be excluded from their education is poverty. Children of poor households are
excluded from education for four reasons:
The first reason is their inability to cover indirect costs of schooling. Parents’ inability to afford
education is one of the major reasons why children are out of school, even in countries that have
abolished formal school fees (UNESCO, 2010). Even though Ethiopia has made primary
education free, due to the indirect costs involved, children are deterred from being enrolled in
primary school since their parents cannot afford to cover the indirect costs, which include the cost
of purchasing uniforms, stationary, other learning materials, transport cost, etc. Even if the
children are enrolled, they will be forced to discontinue their education due to the low economic
capacity of their parents.
The second reason for children from poor families to be excluded from their education is family
size. If there are many children in a family, the parents will not send all their children to school
50
because (i) they cannot cover the indirect costs of education as mentioned above, and (ii) they
need the labour of some of their children. In such situations, most of the time, male children are
allowed to go to school while female children are forced to remain at home to take care of
younger children and to support their mothers in doing the domestic work. In fact, in a family
where there is no elder female child, the older boy is responsible for supporting his family;
therefore, he will be engaged in activities which might be beyond his capacity. In these cases,
either female or male children or both will be forced to be out of school (DE2 and DE3) or will be
at the gate of dropping out of their education because they cannot attend their classes regularly
(DE4 and DE5).
The third reason is the opportunity cost of schooling for the poor family. For children from poor
families, the opportunity cost of attending school is high. This means that what they give up in
terms of time and labour makes school relatively more expensive. Therefore, they will be forced
to engage in income-generating activities to help their families.
The fourth reason, which is one way or the other related with the second one, is that children’s
labour is demanded by their families. In Ethiopia, children as young as 7 years old are required to
perform various tasks related to domestic and farm activities. Girls are wanted in household
chores such as fetching water, collecting fire wood, etc. and boys are also forced to be employed
in order to generate income to support their parents. This is especially true of rural school children
who have to work on farms before and after school and also during weekends. The situation of
school girls in particular is worrying because of the double role they assume as helpers in the
domestic unit and as sources of labour for the family farm. While working as such may not be
harmful for school girls, excessive work both at home and on the farm is detrimental to their
physical, emotional and intellectual development. It is from this point of view that excessive work
is considered an abuse.
The data obtained from UNFPA Ethiopia Country Office indicates that 11.9% (12.2% urban and
11.9% rural) of children were not able to attend their education and 22.1% (22.1% urban and
22.3%) of children were forced to stay out of school because the children are engaged in incomegenerating activities to support their families (Population Council Inc. and UNFPA, 2010). The
qualitative data collected from the sample regions also confirm that children are excluded or at a
risk of being excluded from their school due to the above-mentioned reasons. Hence, in order to
alleviate such problems: a) school-feeding programs should be introduced in schools to help those
children who cannot get enough food in their homes; b) parents or guardians of such children
should be supported to find jobs so that they can support themselves and send their children to
school.
2.3.2 The Cost-Benefit of Education
The role of poverty is important for parents to decide whether or not to send their children to
school because parents always compare the costs incurred for education vis-a-vis the future
51
benefits that will be obtained after graduation or completion of schooling. Thus, even though the
poor household heads realize that the benefit that will be obtained after completion or graduation
of education is greater than the costs they now incur for education at higher levels, they will not
volunteer to send their children to school because they estimate that current costs are greater than
any other future benefits (Schaffner, 2004).
2.3.3 Being Orphan
Being orphan often exacerbates financial constraints for poorer households and increases the
demands for child labour (Hunt, 2008). As a result, enrolment of orphans in primary education is
lower (Schaffner, 2005) mainly for two reasons: (i) absence of people who would support them,
and (ii) psychological depression. These two factors negatively affect the children’s attitude to
continue their education, especially at primary level. Regardless of the specific causes of parental
deaths, children will become orphans when they lose one or both of their parents. Being orphan,
particularly for children who come from poor families, negatively affects school enrolment or
attendance. Those children who lost both of their parents or only the mother will either be delayed
from school enrolment or drop out of their education, especially at younger ages as compared to
non-orphans (Pullum and Greenwell, 2009). Because of their economic problems, they will not be
able to cover the costs of education materials, nursing ailing parents, and caring for younger
siblings; they also have to drop out in order to work. Because of this, most of the time, the older
children, particularly girls, will drop out of their primary education (Schaffner, 2005).
Orphan children living in rural areas with poor households are compelled to be engaged in
income-generating activities which are sometimes beyond their capacity. Most of the time, boys
are employed in labourious work while girls are either hired as domestic workers or become
commercial sex workers. Orphans and other poor children of urban areas are also engaged in such
activities in order to support themselves and their siblings. Poor children of rural areas are
involved in such activities when they become orphans or when crops fail (N. Chaudhury et al.,
2006, cited in Taylor and Amdissa, 2007). Moreover, the findings from the qualitative data
collected from the six regions strengthen the conclusions made above and being orphan is
considered as one of the barriers for the enrolment of children in school.
The data obtained from UNFPA - Ethiopia Country Office report further revealed that 5% (6%
urban and 4.8% rural) and 5.5% (5% urban and 6.3% rural) of orphans were compelled not to
attend their education regularly (DE4 and DE5) and to drop out of their school (DE2 and DE3),
respectively (Population Council Inc. and UNFPA, 2010).
2.3.4 Seasonal Factors and Migration
People move from one place to another due to seasonal factors. For instance, pastoralists move
from the place where they live to another in search of grazing land and water for their cattle.
When these people move, undoubtedly children also move along with them. On the other hand,
52
due to natural calamities such as drought, flood, etc. and man-made problems like civil war or
temporary mass rivalry, people may be forced to move to other areas. As a result of such
migration, children move with their parents frequently and do not regularly attend school for the
months when they are away from home. Moreover, when parents are far apart for long periods,
children can be severely affected emotionally due to the lack of remittances, which can create
family stress in relation to children’s education. Not having a parent around to monitor the child’s
progress can adversely affect his/her chances of succeeding in school. Children can also decide on
their own volition whether to attend school or not.
As indicated in the report of Population Council Inc. and UNFPA (2010), at the time of migration,
46.8% (68.6% urban and 28.9% rural) of children never entered in school and 40.3% (62.8%
urban and 21.2% rural) of children were attending primary education at the time of their
migration. During the interview time, sample respondents further confirmed that children of
pastoralist families were forced to drop out of their education due to the movement of their
families to other places. In addition, they were required by their parents to keep herds. Thus,
migration is one of the factors that negatively affects the school enrolment and attendance of
children. Children may move from rural to urban areas with or without their parents temporarily
or permanently, not only in searching of schools but also due to natural and man-made problems,
or to look for paid employment. In areas where there is a lot of rural-urban migration, pupils
frequently drop out of school prior to completing their education (Hunt, 2008). In this connection,
the responses of the sample respondents, particularly from Amhara and Afar regions, were found
to support the observations made above. Thus, it is possible to deduce that seasonal factors and
migration are among those barriers and bottlenecks for children to be enrolled in school. Hence, it
is proposed that: (i) mobile schools for pastoralists should be established because the schools can
move with these people; (ii) flexible school calendars should be used so that at the time of
movement, the school can be closed and when they come back, the school can start operating; and
c), tent schools should be established in areas where people settle for the time being during
emergency situations.
2.4 Supply Side
This section explores the key education supply indicators related to the 5DEs framework. The
supply side factors that lead to children enrolling, staying in school and attending on regular basis
are complex and interwoven. None or irregular enrolment and eventual dropout from school are
caused by a multiplicity of supply side factors which can be grouped into the following areas:
Absence of school infrastructure/Distance to school
The unavailability of child-friendly resources, including potable water and sanitation
facilities
The shortage of textbooks, teacher guides, and labs
Lack of trained teachers
53
Language of instruction
These often lead to poor performance in school, loss of motivation for learning and eventual
dropout, particularly in under-resourced schools. Even parents can be influenced to decide
whether to send or not to send their children to school. The main supply side barriers discussed in
this section are shown below.
Dimensions of Exclusion
Factor
DE1 DE2 DE3 DE4 DE5
√
√
Insufficient sitting and writing place
√
√
√
√
3.
Poor conditions of school facilities
√
√
√
√
4.
Lack of drinking water and sanitation facilities
√
√
√
√
√
5.
Lack of appropriate infrastructure for children
with disabilities
√
√
√
6.
Shortage of textbooks
√
√
√
7.
Shortage of human resources
√
√
√
1.
Distance to school
2.
√
As portrayed above, the supply side barriers affecting DE1, DE2, and DE3 are mainly related to
distance to school, lack of drinking water and sanitation facilities, and lack of appropriate
infrastructure for children with disabilities. The supply side barriers that mainly affect children in
DE4 and DE5 include insufficient sitting and writing place, poor conditions of school facilities,
lack of drinking water and sanitation facilities, and shortage of textbooks and human resources.
It is apparent that increasing the supply of education has important economic effects which are
beyond improving the skills and productivity of labour because it helps to improve health,
hygiene, nutrition practices and child care (MOFED, 2010). Supply of education is expressed in
terms of the availability of school places, physical infrastructure, quality of education, and human
resources. When there is shortage of these resources, it is said that there is shortage of education
supply. The physical infrastructure comprises the accessibility of school to students, the
availability of sufficient number of school facilities such as running or tap water and toilets, and
sufficient classrooms in terms of number and size (Lopez J. et al., 2009). The human resource part
of education supply includes the availability of adequate numbers of trained male and female
teachers.. The inadequate supply of schools, along with other necessary materials and human
resource, will inhibit access to education (Colclough et al., 2000, cited in Hunt, 2008) and,
consequently, it negatively affects the attendance and success of students, particularly girls
(Lopez J. et al., 2009 and Guday E., 2005). In fact, lack of educational supply, most of the time,
affects school enrolment rather than attendance. In other words, when schools are built too far
from the village where children reside, the number of students that will be registered at the
beginning of the academic year will be lower.
54
2.4.1 Physical Supply: School Infrastructure
Remoteness of Schools/Average Distance from School to Home and the Availability of
Classrooms
School infrastructure comprises school places and distance of school from home. Remoteness of
schools or, in other words, the distance of school from home is one of other proxies usually used
to measure school accessibility. When schools are far from children’s homes, it does not only
affect their initial access to school but it also creates barriers to their retention, completion and
transition to higher levels of schooling (Hunt, 2008). Due to higher opportunity costs, which are
expressed in terms of time and transport cost as well as potential risks for children to travel long
distances on their own, the correlation between school attendance and enrolment becomes
negative, particularly in rural areas.
The MoE recognizes that distance between school and pupils’ homes is one of the major
challenges and barriers for schooling for children, in particular for adolescent girls. Cognizant of
this fact, MoE in its three ESDPs and the current ESDP IV has put a strategy to reduce the
distance between schools and pupils’ homes. The strategy was constructing primary schools in
rural areas where there was no school. In fact, other researchers also explained that distance was
one of the barriers for children to attend their education due to time and other opportunity costs
(Al-Samarrai S., 2003). The Ethiopian Welfare Monitoring Survey clearly indicated that, at
country level, about a quarter of the households will get the nearest primary school after traveling
for less than one kilometer. In urban areas almost 44% of the households are supposed to travel
less than one kilometer to access the nearest primary school. With regard to the rural households,
only 22% of the population can get the primary school after they walk for less than one kilometer.
In this same year, as shown in the Education Statistics Annual Abstract of 1997 (2004/05), there
were 16,513 primary schools and 161,795 sections in the country and the GER was 79.8% (88%
for males & 71.5% for females) (MoE, 2005). On the other hand, in 2002 (2009/10) the number
of schools, their corresponding sections, the GER and the NER reached 26,951, 254,744, 93.4%
(96.6% for males and 90.1% for females) and 82.1% (83.7% for boys and 80.5% for girls),
respectively (MoE, 2010).
When these variables are seen with respect to regions, similar results were observed even though
the disparities among regions were significant for different reasons. Table 24 illustrates the
distance of schools from homes in each region and the percentages of the students that were
supposed to walk to their nearest schools.
55
Table 24: Distance in kilometre to the nearest primary school
Distance in kilometre to the nearest primary school
Region
Less than
1 KM
Tigray
24.59%
50.17% 19.21% 3.29% 1.61%
1.09%
0.04%
100%
Afar
34.28%
42.29% 15.81% 4.07% 2.75%
0.56%
0.25%
100%
Amhara
24.62%
46.69% 22.25% 4.01% 1.42%
1.01%
-
100%
Oromia
22.93%
48.09% 23.95% 3.52% 1.18%
0.30%
0.03%
100%
Somali
26.76%
30.83% 23.30% 7.54% 8.26%
3.25%
0.05%
100%
Benishangul-Gumuz
31.27%
40.09% 17.77% 5.27% 1.85%
3.51%
0.24%
100%
SNNPR
25.71%
55.50% 15.58% 2.05% 0.82%
0.34%
-
100%
Harari
53.75%
41.38% 4.74% 0.13%
-
-
100%
Addis Ababa
45.78%
51.21% 2.56% 0.33% 0.01%
-
0.11%
100%
Dire Dawa
39.56%
53.7%
-
0.22%
100%
1-4
KM
5-9
KM
10-14
KM
15-19 20 and
Not
KM over KM stated
-
5.75% 0.60% 0.17%
Total
Source: WMS (CSA, 2004)
The distance of schools adversely affects the enrolment children for pre-primary education
because they are unable to travel beyond 1-2kms. As a result of this, parents do not send their
children to school. Moreover, the distance to school influences parents’ attitudes towards sending
their children to school because of the issue of safety, particularly when there is no older sibling
attending in the same school. Hence, parents wait until their children reach a mature age to walk
the distance, which in turn results in overage enrolment. Research shows that over-aged children
are more prone to dropout at a later stage of schooling. Late-age enrolment has also become a
barrier to age-appropriate targets being met particularly at the primary level of education (DE2).
Girls’ enrolment in school is also negatively affected by school distance due to
parents’/guardians’ fear of sexual harassment, especially as they grow older.
The UNFPA study indicated that 16.9% (13.1% urban and 17.8% rural) of 8,384 children could
not attend their education and 2.6% (2.1 urban and 2.3 rural) of 3,802 children were forced to
leave their school due to the school distance (Population Council Inc. & UNFPA Ethiopia, 2010).
2.4.2 Insufficient Sitting and Writing Place
Insufficient and poor school infrastructure and limited classroom space affect access to schooling
because parents do not send their children in such schools even if they are poor. It can also have a
negative effect on retention, particularly if the infrastructure is damaged in the course of a child’s
education. Moreover, limited classroom space affects the sitting and writing places that
discourage children to attend their education because there is congestion in classrooms, which
creates discomfort to them.
The availability of sufficient sitting and writing places is measured using the pupils-section ratio
(PSR). As the number of pupils in a section becomes fewer, students will have sufficient writing
place, assuming that a sufficient number of desks is availed in each section. The pupils to class
56
ratio (PCR) is not the same as pupils to section ratio (PSR) because in Ethiopia 26.8% of the
primary schools use double shift. According to the MoE Annual Abstract (2010), the PSR at
national level is higher than the standard set by MoE, which is 50 pupils per section. However, at
regional level, PSR in Oromia, Benishangul-Gumuz, SNNPR, and Gambella, was 60, 57.1, 65.4,
and 61.8, respectively. As mentioned above, PSR is used in lieu of PCR to measure the existence
of sufficient sitting and writing places.
Based on the above-mentioned data, it can be seen that there are shortages of sitting and writing
spaces, which means that there is overcrowding in classrooms. Therefore, still more classrooms
should be built in regions where PSR is high in order to alleviate the supply barrier. The
qualitative data also confirm that schools in the six sample regions do not have comfortable rooms
for their students due to shortage of classrooms, desks, tables, etc. Moreover, as indicated in
MoFED (2010), assuming that 50 students will attend in a class, in order to fulfill the universal
primary education/UPE, the government of Ethiopia needs to construct 60,000 additional
classrooms.
2.4.3 Poor Condition of School Facilities
Poor condition of school facilities implies the existence of leaking roofs and structures that are
unsafe in adverse weather conditions, cause irregular participation and attendance in schools, and
result in the closure of schools during rainy or very hot seasons. Parents, teachers and community
members judge the quality of educational delivery by the presence of a well-constructed schools
and availability of appropriate school facilities.
School facilities include libraries, laboratories, teaching and other material inputs that are directly
linked to the instructional processes. School facilities consistently influence pupils’ achievement.
The intensity of school library utilization also contributes to students’ achievement. It is believed
that the presence of quality teaching materials such as textbooks, teacher guides, desks,
blackboards, etc. will not only improve the performance of students but also help inadequatelytrained teachers to improve their teaching skills and upgrade their own knowledge. Researches
show that poor conditions of school facilities negatively affect the school attendance of children,
particularly that of girls (Guday E., 2005).
Cognizant of the fact that improving school facilities will help to keep children in school, the
MoE has paid attention to creating conducive environment through improvement in school
facilities and has planned in ESDP IV to increase the number of schools with standard facilities
(MoE, 2010). Since it is difficult for the government to fulfill the facilities of every primary
school, participation of the community is vital not only to contribute to the fulfillment of the
facilities but also to create the feeling of ownership within them; and this strategy has already
been included in the fourth ESDP.
57
Table 25. Schools with basic infrastructure and facilities
Region
Access to
No. of
No. of
No. of toilets
% of
No. of
No. of
Electricity drinking toilets for toilets for for boys and
schools that
schools libraries
water
boys
girls
girls
have library
Tigray
10%
545
1,246
1,198
430
1955
883
45.2%
Afar
4%
143
386
348
59
366
56
15.3%
Amhara
3%
2,317
4,941
4,743
1,015
6610
2743
41.5%
Oromia
4%
4,194
16,489
14,930
4,615
10742
3835
35.7%
Somali
2%
77
171
134
204
855
46
5.4%
Ben.-Gumuz
3%
124
633
620
20
365
81
22.2%
SNNPR
3%
1,760
8,245
7,423
1,733
4956
1710
34.5%
Gambella
5%
85
168
174
19
205
21
10.2%
Harari
68.8%
38
94
84
27
58
40
69%
Addis
Ababa
94.3%
689
2,400
2,279
385
723
597
82.6%
Dire Dawa
67.2%
98
290
268
15
116
38
32.8%
5%
10,070
35,063
32,201
8522
Total
Source: CSA (2008), EMIS/MoE (2002 EFY)
Table 25 presents schools that have school infrastructure and facilities and percentage of pupils in
schools with basic resources. As shown in the table, the numbers of libraries that are established
in schools are not adequate. This clearly indicates that students do not have access to educational
materials other than their textbooks, which makes them highly dependent on their textbooks if
they are able to get them. This has a negative effect not only on the performance of students but
also on their IQ and general knowledge. Moreover, the MoE statistical abstract reveals that there
is shortage of classrooms, which is expressed in terms of high student section ratio. The
qualitative data obtained from the six regions further disclosed that the schools do not have
sufficient numbers of libraries and laboratories.
2.4.4 Lack of Drinking Water and Sanitary Facilities
The other important factors that determine the supply of education are electricity, drinking water,
and separate sanitary facilities such as toilets (for boys and girls separately). The availability of
these facilities affects school enrolment and attendance of children. Lack of potable water has a
greater effect on young children due to their reduced ability to withstand thirst. Absence of
separate toilets for girls is also one of the main causes of absenteeism and school dropout among
girls at upper-primary and lower-secondary schools. This is due to the special needs of teenage
girls for a private and safe environment, particularly during their menstrual period. According to
Colclough et al. (2000), cited in Hunt (2008), out of 11 schools visited in Ethiopia, only five had
latrines, of which only one had separate latrines for boys and girls. In most cases, these latrines
were not suitable to use.
58
In addition to these, the availability of drinking water also has an impact on children’s school
enrolment as well as attendance because water is essential at any time and at any place for
hygiene as well as for drinking. As reported by MoFED (2010), in schools where there is no
water, children will be compelled to go out of school in search of it or carry it from their homes.
Thus, in schools where there is lack of water, students cannot properly attend their education. The
availability of water affects not only school enrolment and attendance of children but also the
availability of teachers, particularly female teachers, because they are not motivated to teach in
areas where there is serious water shortage (Guday E., 2005).
The research conducted by MoFED (2010) unveils that, among primary schools that are currently
operational, only 34.2% and 90.5% have water and latrines, respectively. The MoE statistical
abstract also indicates that only 37.4% (10,070) of primary schools have reported that they have
water facilities (refer to Table 9 above). According to the educational statistics annual abstract,
some schools have reported that they have two sources of water. Moreover, above 90% of all
schools reported that they have latrines. These data show that those primary schools that are built
in rural areas, particularly those that are far from towns, are suffering from lack of water.
Apart from drinking water and separate sanitary facilities, the presence of electricity in schools is
the other important factor that determines the supply of education. Though it was difficult to get
data regarding the number of schools that have electricity, the electric distribution census
conducted by CSA during the national level census is used here as a proxy to estimate the number
of schools that have electric power, assuming that those schools that are built in areas where there
is electric power use electricity. Also, the proportion of electric power distribution obtained for
regions is applied for schools. At national level, only 5% of the housing units used private electric
meters, which implies that out of the total schools available in the country, only 5% use electric
power from EEPCO (CSA, 2008). All these pieces of evidence indicate that those primary
schools that are located in urban areas have the opportunity to have electric power for lighting
whereas those that are located in rural areas do not. In schools where there is no electricity,
students cannot learn in their classrooms during bad weather conditions or other reasons that need
light. Moreover, they could not utilize laboratory equipment to practice what they have learned in
their classrooms. In general, respondents from the six sample regions confirmed that their schools
were suffering from lack of drinking water, latrines and electricity.
2.4.5 Lack of Appropriate Infrastructure for Children with Disabilities
According to Dang and Pelleriaux (2006), at the primary school level, various types of special
needs education can be provided to children based on the types of disability they have, i.e., slight
intellectual disability, moderate and/or severe intellectual disability, severe emotional and/or
behavioral problems, physical disability, visual impairment, hearing impairment, etc. However,
because of the disabilities that children have and the misconceptions of the society regarding
people with disabilities, these children are excluded from educational opportunities. And even if
59
these children get enrolled somehow, the probability of their dropping out is high (Hunt, 2008).
Even in some primary schools where some physical facilities were available, these facilities were
not disability-friendly (World Bank, 2009). Moreover, those children with disabilities were not
able to enroll and pursue their education due to lack of trained teachers to help them (Hunt, 2008).
Ethiopia has recently developed a strategy for special needs and inclusive education.
Nevertheless, due to limited understanding of the concept of disability, negative attitude towards
people with disabilities, and a hardened resistance to change, schools could not create easy access
to children with disabilities. From the supply side perspective, the main barriers to learning are
rigid and poor teaching methods, inconvenient learning environment, lack of identification
processes, and inadequate assessment procedures. As a result of these, in Ethiopia, less than 3%
of children with disabilities have access to primary education (ESDP IV).
The survey conducted by UNFPA - Ethiopia Country Office also unveiled that 0.8% (1% urban
and 0.7% rural) and 5% (4.6% urban and 5.5% rural) of the children were not able to attend their
education regularly and were forced to drop out of their education, respectively, due to sickness
and disability. Moreover, respondents from the six sample regions expressed that primary and
lower-secondary schools were not suitable for children with disability in their regions. Therefore,
the MoE and other stakeholders should consider the problem of children with disabilities when
they construct new school buildings. Besides, the existing school buildings should be renovated to
solve the problems of children with disabilities.
2.4.6 Shortage of Textbook Supply
An adequate supply of textbooks and other teaching and learning materials is a pre-requisite for
effective teaching and learning processes; however, children at primary and lower-secondary
schools are in short of these books. The presence of appropriate teaching-learning materials can
enhance positive parental judgments of school quality, thereby stimulating more interest in
sending their children to school, particularly at the pre-primary and primary levels. Most
importantly, the presence of these materials can enhance instructional practices and learning
outcomes, particularly in under-resourced environments where trained teachers are not available.
As the demand for quality education is not matched by appropriate teaching and learning
materials, children are prone to dropping out of school.
The quality of teaching is, to a large extent, dependent upon teaching materials, particularly
textbooks (MoE, 2010). Studies conducted on the role of textbooks in the teaching and learning
process indicated that the role of textbooks in the achievement of students and improvement of
the learning and teaching process is vital. Nevertheless, the shortage of textbooks is a serious
problem in almost all primary and lower-secondary schools across the country. One recently
carried out study indicated that, due to the prevailing shortage of textbooks in some instances,
communities and schools had to take their own measures to address the problem, i.e., by
borrowing textbooks from other schools (DfID, 2011).
60
Cognizant of this situation, as indicated in ESDP III, the government of Ethiopia has put a target
to provide one textbook of each subject to each student or to make the primary school studenttextbook ration 1:1 in 2010; nevertheless, the performance stands at 1:1.5. Though the target has
not been met as planned, there has been an improvement as compared to the base year 2004/05
student-textbook ratio, which was 1:2. When students could not get textbooks, teachers put
pressure on the students in different ways to have the required textbooks. As a result, those
students who are not able to have the textbooks will be forced to drop out of their education. Even
if schools tolerate such students to attend classes, their performance will be low. This shows that
inadequate provision of school instructional materials (textbooks) and other support materials will
push children away from their education, and this will be one of the push factors for students to
drop out of their education.
2.4.7 Shortage of Human Resource Supply
The supply of human resources in this study refers to the availability of the required teachers (in
terms of quality and quantity) in schools. It is obvious that shortage of teachers in schools leads to
more children dropping out of school and also affects the quality of education as the students do
not get sufficient attention and follow-up from their teachers. The supply of teachers is measured
using different proxies such as pupil-teacher ratio, presence of female teachers, recruitment
system of teachers, training and quality of teachers, teacher attendance, etc.
Moreover, teachers’ presence in school as well as their attitude and behavior towards both the
children and the community are found to contribute to children’s entry and retention at school. On
the other hand, absenteeism, irregular attendance, lateness and indiscriminate use of corporal
punishment by teachers can be the main causes of irregular attendance and dropout among pupils.
Teacher absenteeism can have a major impact on non-enrolment (DE1 & DE2) and dropping out
of primary levels of schooling (DE4), particularly among pre-primary and primary school-age
children. In general, teacher deployment and performance has a serious bearing on all the
dimensions of exclusion in the 5DE model. In this sub-section, some of the above proxies for
which data could be obtained are presented as follows.
•
Pupil-Teacher Ratio (PTR)
This is one of the common educational indicators for efficiency and quality. There are two views
regarding PTR: a) The lower the PTR, the better the opportunity for contact between the teacher
and pupils, and the greater the support the teacher can provide to students individually, thereby
improving the quality of education; b) A very low PTR may indicate an inefficient use or an
under-utilization of teachers, resulting in low efficiency. Therefore, a low or a high PTR alone
does not explain the quality of education because quality of education depends on other factors
such as the mode of delivery, the commitment and qualification of teachers, the supply of
educational materials, etc.
61
This indicator is, however, useful for setting minimum standards and ensuring a certain level of
equality throughout the country. In Ethiopia, the standard set for PTR is 50 at primary (1-8) level.
However, at national level, PTR for lower-primary level (1-4) is 56; for upper-primary level (5-8)
it is 46, and for all primary education level it is 51. These data indicate that in the upper-primary
level, the PTR is below the minimum standard, which implies that teachers can have more contact
with their students and can follow up each student to provide the necessary assistance, particularly
for those who are weak in their academic performance. Moreover, teachers will be able to know
the life situation of their students and can help them to continue with their education by
discussing with students’ parents and other stakeholders. Particularly if teachers are trained in
identifying students who are at risk of dropping out for various reasons, they can help such
students not to drop out of school.
Table 26 presents PTR, by region and by level of education: lower-primary (Grade 1-4) and
upper-primary education (Grade 5-8).
Table 26. Pupil-Teacher Ratio (PTR)
Region
National
Tigray
Afar
Amhara
Oromia
Somali
Benishangul-Gumuz
SNNPR
Gambella
Harari
Addis Ababa
Dire Dawa
Lowerprimary level
Upperprimary level
All primary
school level
56
46
46
48
62
76
45
64
50
45
24
31
46
43
32
43
43
73
40
54
47
39
25
32
51
44
34
46
54
75
43
59
33
31
25
28
Source: CSA (2008), Education Statistics Annual Abstract, MoE 2002 EFY
As indicated in the above table, the PTR in almost all regions is below the minimum standard set
by the MoE. However, Oromia (for lower-primary level), and Somali and SNNPR (for both
lower- and upper-primary levels) do not meet at least the minimum PTR. These show that there is
no shortage of human resources from the supply side perspective or there are adequate numbers of
teachers per class. And it can be said that, in any case, having more teachers at primary level has a
positive effect on education. On the other hand, the PTR in Addis Ababa and Dire Dawa seems
strange and would indicate overstaffing. The responses obtained from sample respondents also
62
corroborate the above finding, i.e., there is no problem of PTR. But they remarked that the use of
the self-contained teaching method was not effective for two reasons: (a) students would be bored
with the teacher if his/her teaching method was not attractive to them; and (b) one teacher cannot
be competent in all subjects.
•
Proportion of Female Teachers
As regards female teachers, Table 27 shows that, at national as well as regional level, the share of
female teachers is very low.
Table 27. Proportion of female teachers
Region
National
Tigray
Afar
Amhara
Oromia
Somali
Benishangul-Gumuz
SNNPR
Gambella
Harari
Addis Ababa
Dire Dawa
Number of teachers
Male
186,215
14,159
1,748
43,995
66,574
4,518
2,451
40,194
1,898
621
8,638
1,419
Female
Total
105,915 292,130
7,996 22,155
851
2,599
34,957 78,952
34,727 101,301
960
5,478
1,116
3,567
16,487 56,681
514
2,412
515
1,136
7,111 15,749
681
2,100
% of
Female
36.3%
36.1%
32.7%
44.3%
34.3%
17.5%
31.1%
29.1%
21.3%
45.3%
45.2%
32.6%
Source: Education Statistics Annual Abstract, 2002 EFY
As depicted in Table 27, at national level, the proportion of female teachers is 36.3%. The same
proportion is also observed at regional level, except in Amhara, Harari and Addis Ababa, where
the proportion of female teachers is over 44%. The extreme low proportion is observed in the
Somali region where the proportion of female teachers is only 17.5%. This indicates that there is
shortage of female teachers in our schools. Hence, the MoE, along with regional education
bureaus, should make every effort to solve this shortage, as it has implications on the rate of
enrolment of female students. The responses of the sample respondents from education and other
social sectors also proved the existence of shortage of female teachers in schools though efforts
are being made to increase their number.
•
Percentages of Trained Teachers
Apart from the number of available teachers in both cycles of primary level, the other important
parameter that should be considered is their training. According to the standard set by the
63
government (MoE), a teacher should be a diploma graduate from a College of Teacher Education
(CTE) in order to teach in the first cycle of primary education. Accordingly, those teachers who
have graduated from Teacher Training Institutes/TTIs are not considered as qualified to teach at
the primary level. Table 28 presents percentages of qualified teachers in primary schools.
Table 28. Percentages of qualified teachers in primary schools
Region
National
Tigray
Afar
Amhara
Oromia
Somali
Benishangul-Gumuz
SNNPR
Gambella
Harari
Addis Ababa
Dire Dawa
Lower-primary level
15.5%
22.1%
3.8%
2.8%
19.6%
52.0%
26.8%
12.5%
30.7%
43.6%
45.3%
34.9%
Upper-primary level
77.8%
71.3%
67.9%
69.4%
80.2%
27.2%
88.5%
87.3%
66.1%
74.1%
80.1%
83.3%
Source: Education Statistics Annual Abstract, 2002 EFY
As can be seen from Table 28, the percentage of qualified teachers in the upper-primary level is
higher as compare to the lower-primary level across all regions, except in the Somali region. On
the other hand, the percentage of qualified teachers at lower-primary education level in the
Amhara and Afar regions is much lower as compared to other regions. The data in the table
indicate that more attention should be given to the lower-primary level (as it is the base for the
next levels of education) so that problems related to inadequacy of teacher training and low
quality of teachers/teaching will be solved in a systemic manner.
•
Lack of Capacity to Identify the Needs of Students at Risk of Dropping out
Though it was difficult to obtain data regarding those students who were at risk of dropping out,
the following points were obtained through interviews:
There is no pre or in-service training of teachers with respect to identifying and assisting
those students who are the potential out-of-school children of tomorrow. Therefore, such
trainings should be given to teachers so that those students who are at risk of dropping
out will get the necessary support before they drop out.
64
PTAs and clubs have been established in schools to bring those students who have
already dropped out back to school and to identify those who are at risk of dropping out
and then address their needs before they drop out.
Insufficient Provision of Inclusive Education and Teaching Materials
According to the sample respondents, there is an attempt to introduce inclusive education in
Oromia and Addis Ababa but there is no such practice in SNNPR, Afar, Gambella, and Amhara.
With regard to the teaching materials, the respondents noted that textbooks are prepared in such a
way that they reflect the region’s culture, geography and other relevant information. Moreover,
they reported that, although teaching in the mother tongue is useful, the commitment on teachers’
part to teach in the mother tongue is not up to their expectations.
•
Poor Quality of Schooling and School Organization
As far as quality of schooling and school organization is concerned, the internal organization of
schools in Addis Ababa is relatively more suitable for teaching and learning but school
compounds are surrounded by different disrupting things that hinder the teaching-learning
process. In the Amhara region schools are somewhat suitable for the teaching-learning process
and there is a good practice of teachers in categorizing students into three groups so that more
active learners can support the slower ones. Teachers also discuss with parents of students who
are at risk of dropping out and, in collaboration with other concerned organizations, they assist
them to continue with their education. Apart from this, respondents from all the six regions
reported that teachers usually use continuous assessment for the promotion of primary (first cycle)
students from class to class.
2.5 Governance, Capacity, and Financing Barriers
This section presents evidence related to the governance, capacity, and financial barriers and
bottlenecks in Ethiopia based on the 5DEs conceptual framework. The barriers and bottlenecks
discussed in this regard include inadequate/weak partnership with CSOs to address the problems
of OOSC, education policy tensions between expansion and quality improvement, absence of
comprehensive data on the profiles of OOSC, weak school management, and lack of equitable
educational financing across regions as presented below.
65
Barrier
Governance
Dimension of Exclusion
Factor
DE1 DE2 DE3 DE4 DE5
1. Inadequate partnership with CSOs to
address the problems of OOSC
√
2. Education policy tensions between
expansion and quality improvement
√
√
√
√
√
√
Institutional
capacity and
effectiveness
1. Absence of comprehensive data on the
profiles of OOSC
√
√
√
√
√
2. Weak school management committees
√
√
√
√
√
Financing
1. Inequitable resource allocation
√
√
√
√
√
2.5.1 Governance Barriers
Ethiopia’s political system is based on federalism and decentralization. As a result, there are nine
regional states and two city administrations. All offices and bureaus in each region and city
administration work independently though they get budgetary support from the federal
government. Given the federal nature of the Ethiopian political system, regions and woreda’s are
the main implementers of the general education component of the education policy. On top of the
income they generate from within, regional states receive the necessary budget directly from
MoFED and they are free to allocate it within their own set of priorities so as to respond to the
needs of their particular circumstances. In order to achieve a coherent implementation of the
previous three ESDPs, the federal level MoE has worked closely with the regional education
bureaus by providing them with technical guidance for the preparation of the regional plans to
engage in joint operational planning and monitoring of the implementation of ESDPs. Moreover,
the government has reviewed and improved the guidelines for community participation and
school management. In general, the government of Ethiopia has shown its commitment and
interest for the expansion of schools and the achievement of MDGs as well as EFA goals (MoE,
2010).
i) Inadequate/Weak Partnerships with CSOs to Address Problems of OOSC
Even though the aforementioned government efforts are valuable to enhance the political
governance in relation to education and particularly addressing the education demand of OOSC, it
is apparent that the government cannot do everything alone. In this respect, it is observed that the
government of Ethiopia in general and the MoE in particular is working with different national
and international organizations such as UNICEF, UNESCO, WFP, AED, etc. However, the
partnership with CSOs is not that much strong. Hence, it is critically important to enhance such
partnerships with CSOs, particularly with those organizations that are interested in addressing the
problems of OOSC in order to return OOSC back to school and minimize the probability of those
in schools from dropping out, thereby meeting the MDGs in 2015.
66
ii) Education Policy Tension between Expansion and Quality Improvement
It is apparent that the government of Ethiopia has built many schools and increased the education
coverage at national level. As a result of this, the GER has reached more than 100% while the
NER is above 85%. Even though this is an encouraging result, the quality issue should not be seen
as second rate. It is clearly observed that the knowledge capacity of students who are promoted
from one grade to another or from one level to another is declining from year to year. This issue is
frequently raised in different forums and among parents. When education quality is improved,
ceteris paribus, the number of OOSC of primary and lower-secondary levels is likely to decrease.
Therefore, the Government (MoE) should also pay due attention to maintaining the quality of
education.
2.5.2 Capacity
Currently, the MoE, REBs, WEOs, and schools are implementing a decentralized system of
educational management. Accordingly, important responsibilities have been transferred to the
woreda education offices, which are expected to exercise their mandate with the support of
regional bureaus and within the overall framework of the education system developed at national
level. Most of the WEOs, however, do not have the required capacity to fully exercise their
responsibilities effectively. School functioning also needs further improvement, particularly
concerning the provision of quality education. In addition to this, there is no comprehensive data
regarding the profiles of OOSC at all levels of the education system. Since such data are vital to
plan and achieve universal primary education (UPE and EFA goals), the EMIS case team, along
with the concerned bodies, should revise the existing data collection tools so that the team can
garner detailed data on the what and why of OOSC and include the disaggregated data in the
educational statistics annual abstracts and other reports.
The other capacity barrier is related to weak school management committees, which were
supposed to play an active role in enhancing community participation and strengthening capacity
of schools to finance themselves and cover at least their recurrent expenditures. These committees
can also contribute their part in reducing the number of students who are at risk of dropping out as
well as in returning those children who are already out of school. Hence, school management
committees should be strengthened through the provision of trainings as well as technical support.
2.5.3 Education Financing
Ethiopia has officially abolished school fees and implemented free primary education since the
introduction of the Education and Training Policy of 1994, and it has incorporated this feeabolition policy into its Poverty Reduction Strategy Program (PRSP) in 2002. The basic reason
for the introduction of this policy was to reduce the prevailing high direct cost of education that
deters poor households from sending their children to school and to reduce the probability of early
dropout. Due to the introduction of this policy, the financial burden of parents has been reduced
and this has encouraged them to send their children to school. This in turn has increased
67
enrolment in primary schools from year to year. When primary school fees are abolished, the
government has decided to give block grants to schools in order to replace the forfeited revenue,
as shown below:
-
Birr 10 for Grades 1-4 (per year/student)
-
Birr 15 for Grades 5-8 (per year/student)
-
Birr 20 for Grades 9-10 (per year/student)
WEOs cover the capital and the salary component of the education expenditure, whereas the nonsalary recurrent expenditure is covered by the schools per se. although schools receive block
grants and annual budgets from the government, communities are encouraged to cover some of
the costs of primary schools. The community can contribute in cash or in kind through the
provision of materials or labour, especially during the construction of low-cost classrooms. In
general, the education financing system in Ethiopia comprises government direct budget support
that includes donors funding, regional states’ budget allocation through woreda’s to primary
schools, and community contribution.
2.5.4 Trends in Primary and Lower-Secondary Education Expenditure
The government of Ethiopia has given priority for education and this is revealed by the proportion
of the budget allocated to education, as presented in the following table.
Table 29. Education expenditure/spending
Educational spending, general
2010
2009
2008
2007
2006
Total public expenditure on education as a percentage of GDP
4.14%
3.37%
3.77%
4.37%
4.57%
Total public expenditure on education as a percentage of total
government expenditure
25.37%
23.61% 22.82% 24.62% 17.82%
Primary education expenditure as a percentage of total government
education expenditure
54.07%
50.60% 47.10% 41.85% 44.74%
Total public expenditure per student
Spending per student as a percentage of GDP per capita - preprimary
-
-
-
-
-
Spending per student as a percentage of GDP per capita - primary
11.02%
8.32%
8.55%
9.79%
11.79%
Spending per student as a percentage of GDP per capita - secondary
28.08%
22.76% 20.50% 24.85% 28.83%
Spending per student (PPP US$) - pre-primary
Spending per student (PPP US$) - primary
116.00
86.63
82.34
82.97
87.49
Spending per student (PPP US$) - secondary
295.65
236.93
197.54
210.69
213.89
Nature of education expenditure (in millions)
Expenditure on salaries, all staff - primary
7,588.66 5,123.23 3,086.89 2,152.99 1,868.20
Expenditure on total recurrent - primary
7,904.85 5,336.70 3,225.00 2,265.8 2,008.80
Expenditure on salaries, all staff - secondary
1,595.21 1,116.49 532.94
358.19
217.69
Expenditure on total recurrent - secondary
1,833.57 1,283.32
410.40
257.60
Source: MoE/EMIS, 2010
68
614.0
As indicated in Table 29 above, even though total public expenditure on education declined from
4.57% in 2006 to 3.37% in 2009 , it increased again in 2010 to 4.14%. However, this indicates
that it will require exerting much effort to achieve the 2015 target (19.8%) as projected in ESDP
IV. Contrary to this, the share of education as a percentage of total public expenditure on
education dramatically increased from about one fifth to more than one fourth of total government
expenditure during 2006-2010. This shows that the government of Ethiopia has given high
priority to education at all levels of the country.
As far as primary education is concerned, the past decade has witnessed a major expansion of the
public education system, with primary enrollment rising from less than 5 million to over 15
million. Initial success has been achieved in bringing primary schools closer to where people live,
thereby overcoming an important barrier to families’ willingness to send their children to school.
This massive enrollment compelled the government to allocate a significant amount of budget for
primary education. As indicated in Table 29, the share of primary education expenditure as a
percentage of total government education expenditure increased from about 45% in 2006 to more
than 50% in 2010. With regard to the share of spending per student for primary schools, the
expenditure decreased continuously from about 12% in 2006 to 8.32% in 2009, but in 2010 the
expenditure increased again to 11.02%. For secondary students a similar declining trend was
observed though it changed for the better in 2009 and 2010. This same spending in terms of PPP
US$ had a similar trend as it continuously declined from US$ 87.49 to 82.34 in 2008 though it
rose again starting from US$ 86.63 in 2009 and reaching US$ 116 in 2010.
The nature of expenditure, on the other hand, shows that staff salary accounts for more than 93%
and 85% of the recurrent expenditure of primary and secondary education, respectively. This
happened to overcome shortage of teachers that prevailed due to massive enrolment of children at
primary school level. As a result of this, the share of non-salary recurrent expenditures had
decreased from 7% in 2006 to 4% in 2010. Even though solving the problem of teacher shortage
was a positive step to take, it had a negative effect on the provision of textbooks and had
suppressed other non-salary operating costs that are essential for the teaching and learning
process. As it can be understood, the implication of the reduction of recurrent expenditure is that
the quality of education will decline and the dropout rate will increase due to the shortage of
textbooks and other necessary teaching materials. This will happen because schools will be
compelled to require their students to contribute money so as to cover the cost of uncovered
materials. This, in turn, will mean that those children who are unable to contribute the required
money will be forced to drop out of school. In fact, the Ethiopian education and training policy
clearly states that no student should drop out of school due to inability to contribute money even
to purchase the usual uniform. In addition to this, the MoE has set the target of raising non-salary
share of recurring expenditure to 23.5% in the 3rd Education Sector Development Program
(ESDP III).
69
So far, we have looked at government budget allocation to education at national level, but in order
to have a clearer picture of education financing at country level, it is important to see this budget
allocation at regional level.
Table 30. Education budget, by region (in millions)
Primary Education
Region
2006
2007
2008
Recurrent Capital Total Recurrent Capital Total Recurrent Capital
Total
Tigray
176.09
19.72 195.81
145.82
22.58
168.4
207.12
37.83
244.95
Afar
18.44
6.30
24.74
22.65
7.4
30.05
37.82
24.81
62.64
Amhara
447.80
60.40 508.28
516.88
19.79
536.66
815.34
49.19
864.54
Oromia
711.48
9.98
721.47
868.09
14.17
882.26
1162.91
79.71
1242.61
Somali
3.08
4.3
7.38
7.65
21.7
28.75
5.60
6.80
12.40
Ben.-Gumuz
32.94
4.32
37.27
35.59
19.07
54.65
48.56
14.31
62.88
SNNPR
449.44
36.03 485.47
490.28
82.58
572.86
701.58
31.99
733.57
Gambella
4.94
0.53
5.47
13.08
1.40
1448
29.54
1.27
30.81
Harrari
14.26
1.73
15.99
14.14
3.62
17.75
17.72
0.34
18.05
Addis Ababa
133.41
3.13
136.54
132.66
2.01
134.64
164.8
8.37
173.17
Dire Dawa
16.86
1.85
18.7
19.56
0.82
20.38
33.96
2.48
36.44
Source: Education Public Expenditure Review, 2010
Table 30 shows that there was a high discrepancy among regions in the allocation of educational
budget. For instance, the relatively more developed regions (Amhara, Oromia, SNNPR and
Tigray) and Addis Ababa City Administration had allocated a large amount of budget for primary
education, of which the lion’s share was allocated for salary. This was due to the large number of
children that enrolled in primary schools, which forced them to hire many teachers. On the other
hand, in emerging regions like Somali, the capital budget was much higher than the recurrent one.
The Afar region had also allocated a relatively big budget for capital expenditure in 2008
compared to that in 2006 and 2007. This implies that these regions are still constructing new
schools in order to create more access to education for their population. Since the populations of
these regions are mainly pastoralists, the regional education bureaus are required to put more
effort into fulfilling the needs of their populations and enable their children to join schools.
In general, except for the differences in amounts, the trend of budget allocation between recurrent
and capital budgets is similar. From these data one can conclude that primary education remains
the highest priority for the government of Ethiopia both at federal and regional levels and receives
the highest share from the total allocated budget. As far as regional spending per student (PPP
US$) in primary schools is concerned, the data show that it is very low. In regions where the
enrolment is low but the budget allocated is high, the spending per student in Birr as well as PPP
in US$ is high, whereas in other regions, particularly in the more developed regions, the spending
per student is very low as compared to the spending per student at the national level. This
70
indicates that at regional level schools are in short of teachers and lack basic supplies that
facilitate the teaching and learning process due to shortage of budget. This fact was also revealed
at the joint review meeting conducted on ESDP III. According to the report of the review, there
were large variations in spending per student at different levels. Spending per student was the
lowest in regions in which the education budget share was the highest (Oromia and Amhara).
2.5.5 Non-Government Financing (Community Contribution)
As mentioned earlier, community contribution is an important source of finance for schools. Even
though data could not be obtained in this regard for this study, the joint review report of ESDP III
indicated that the revenue generated by schools was significant compared to regional level
budgets (8-10% in Amhara, SNNPR and Oromia) and woreda level budgets (e.g. equivalent to
33% of WEO budget in a woreda of Oromia region). At school level it is often the same order of
magnitude, and in many cases it is greater than the (falling) level of non-salary inputs provided by
WEOs. The joint review meeting (JRM) also found significant variations in the level of
community contribution among regions and woreda’s, and in the schools’ ability to raise nongovernment revenues (e.g. 0.55 Birr per student in a school in Oromia where, in the region as a
whole, community contribution is high; but 23.21 Birr per student in a school in BenishangulGumuz).
Communities contribute massively to school infrastructure expansion in some regions (less so in
the emerging regions); but their inputs and the schools’ own revenues are also critical to financing
the schools’ operating costs. In a number of regions communities also hire teachers (there are
rising trends in some woredas in Oromia). This can be cited as evidence for the role of
community contribution in reducing the non-recurrent budget constraint to improve the quality of
education and the potential dropout rate. Notwithstanding all the above-mentioned remarkable
achievements in expansion of schools and increased budget allocation, more than three million
children are out of school and others are at risk of joining them.
2.5.6 Education Financing Bottlenecks
Lack of Equity-Based Budgeting
The equity issue was also raised during the joint review meeting of ESDP III. In order to address
the equity concern, the government has provided school grants to replace fee revenues to finance
teaching materials. Moreover, to avoid inequitable budget allocation and resource distribution,
WEOs, along with the woreda administration and the cabinet, should mobilize their resources to
recruit additional teachers. It is clear that the above-mentioned budget inequity will affect the
entire dimension of exclusion and out-of-school children. Therefore, when budget equity is
considered, it should address the problems of OOSC.
71
Funding Gaps
It is apparent that the government of Ethiopia cannot afford to solve all financial problems of the
education system. This is clearly shown in ESDP IV as ‘funding gap’. Therefore, the government
should mobilize resources from communities using different modalities, ensuring that such
initiation does not bring about burden on the poor, and lobby donor agencies to fill the funding
gaps. Moreover, schools should be encouraged to generate their own income through different
activities without affecting the teaching and learning process.
2.6 Analytical Summary
Education barriers and bottlenecks are expressed in many ways. These barriers and bottlenecks
are directly or indirectly related to the demand for and supply of education. The demand for
education can be affected by socio-cultural values and economic barriers. On the other hand, the
supply of education is affected by the availability of finance to provide physical and human
resources.
The socio-cultural demand is expressed in terms of violence against children/gender-based
violence, harmful traditional practices, lack of awareness about the ultimate benefit of education,
and wrong attitude towards children with disabilities and the future fate of female children.
Among these, the major barriers that need the attention of policy makers are violence against
children and gender-based violence, wrong attitude towards children with disabilities, and teenage
pregnancy because these problems are still pervasive and can be major causes for not attending
education regularly and for dropping out of schools.
On the other hand, the economic demand side comprises poverty, the cost-benefit of education,
being orphan, seasonal factors, and migration. Among the factors discussed under economic
demand side, the major ones that need policy makers’ attention are household poverty, being
orphan, indirect cost of education, seasonal factors, and child labour.
As far as the supply side is concerned, schools are already expanded and teachers are deployed
but other basic services such as textbooks, separate latrines for boys and girls, easily accessible
services for children with disabilities, etc. are not fulfilled.
With regard to governance, capacity, and education financing, it is apparent that the government
is committed as it has introduced decentralization and devolved power to regional states; it has
also expanded schools and increased the annual education budget. Financing education is another
important aspect that this study has dealt with. It was observed that the country’s education
finance was higher by all measures though there is still a fund gap to achieve the MD and EFA
goals. However, the existing inadequate partnership with CSOs in addressing problems of OOSC
and ensuring the quality of education, absence of comprehensive data on the profiles of OOSC,
and inequitable resource allocation are the major barriers that require the attention of policy
makers.
72
CHAPTER 3: EDUCATION POLICIES AND STRATEGIES
3.1 Introduction
This chapter reviews relevant documents such as the Growth and Transformation Plan (GTP), the
Education and Training Policy (ETP), the Education Sector Strategy and Education Sector
Development Programs (ESDPs) to address the barriers and bottlenecks of OOSC mentioned in
Chapter 2. More specifically, the chapter focuses on examining the existence and appropriateness
of strategies designed to address each barrier and bottleneck related to socio-cultural demand side,
economic demand and supply side, governance, capacity, and financing identified in Chapter 2.
3.2 Socio-Cultural Demand Side
As it is discussed in Chapter 2, socio-cultural barriers and bottlenecks include gender-based
violence, early marriage, wrong attitude towards children with disabilities, and the like.
Socio-cultural barriers and bottlenecks
Strategies designed to address barriers and bottlenecks
Lack of awareness regarding the benefit of Community mobilization through kebele and training board
education
members, parent-teacher associations and school committees
Gender-based violence
Harmful traditional practices
Wrong attitude towards the future fate
of female children
Community awareness raising on gender issues using the
following strategies:
strengthening women’s associations and organizations;
creating conducive environment for women to actively
participate in and benefit from development and
governance programs through their associations and
organizations; and
effectively coordinating women’s associations and
organizations and all other actors.
Seasonal factors and migration
Wrong attitude towards children with
disabilities
The following strategies are developed to avoid stigmatizing
attitudes towards marginalized children in the community and
in the school:
Sector plans focusing on marginalized groups;
Poverty Reduction Strategy;
Gender Education Strategy;
Special Needs and Inclusive Education Strategy;
Functional Adult Literacy Strategy;
Alternative Basic Education Strategy;
Early Childhood Care Education Strategy;
Strategy for Education for Pastoralist Children; and
HIV/AIDS Strategy, which is being finalized.
73
3.2.1 Community Mobilization and Empowerment Strategies
Ethiopia’s education and training policy (1994) calls for greater community engagement at the
final, most localized level of the decentralized system and explicitly mandates participation in
school operations and management. The policy change began with the 1994 Education Sector
Strategy policy of the Transitional Government, which stated: ‘Schools will be strongly linked
with the community, which will take responsibility in its well-being and upkeep. They will be
made to be responsive to the local needs and requirements and shall act as centers for all
educational activities of the community. The management of each school will be democratized
and run with the participation of the community, the teachers, the students and the relevant
government institutions’ (Transitional Government of Ethiopia, 1994, pp. 16–17, cited in
Jennifer, 2006). The Education Sector Strategy (1994) also states that the participation of the
community will be encouraged and enhanced in building schools and providing furniture on a
voluntary self-help basis. The participation of the private sector shall be promoted in the provision
and assistance of the educational service.
The program action plans of ESDPs I to IV echo this rhetoric and further underline the role of the
community in the delivery and management of education. The program action plan of ESDP I
gives specific examples of ways in which communities can participate, including “policy
formulation, project implementation, and problem solving” as well as “construction of new school
buildings…, school maintenance, and mobilization of parents to increase enrollment, especially
that of girls” (Federal Democratic Republic of Ethiopia, 2002, cited in Jennifer, 2006).
ESDP II also greatly emphasizes the role of communities in helping to fund the education sector
program, aiming to have “mechanisms designed so that community [sic] will voluntarily and
directly contribute to the financing of education based on its capacity”. This strategy also intends
to “promote a sense of ownership and thereby raise [the community’s] own role in the
management of schools” (FDRE, 2002, cited in Jennifer, 2006). The action plan of ESDP III
(FDRE, 2005) states that communities and PTAs are playing important roles in all aspects of
education from generating resources to managing schools. PTAs are active in raising the
awareness of the general community on the benefits of education and in encouraging parents to
send their children to school so as to increase access and reduce dropout rates. Financial resources
are generated by the community and used to purchase basic equipment and materials and to hire
teachers on contractual basis. PTAs are involved in school management, annual plan preparation,
and the follow-up of disciplinary cases. Moreover, communities are funding new school
buildings, constructing teachers’ houses, running non-formal education initiatives, and
encouraging girls to go to school and stay in school until they complete a given educational level.
However, PTAs and communities still need further capacity enhancement in carrying out quality
support to help schools to function as desired.
74
The action plan of ESDP III (2010) also states that communities have contributed significantly to
the development and the expansion of education, especially at primary level, during ESDP III
implementation. However, the strong reliance on community involvement also has possible
drawbacks. There are risks of increasing disparities, as the poorer communities may be asked to
contribute more than they can afford.
It is also planned that during the implementation of ESDP IV, communities will continue to be
strongly involved in education, especially at primary level. However, in comparison to ESDP III,
some changes are introduced in this phase. Accordingly, community involvement will focus on
areas which have less financial implications. This relates in particular to activities to increase
enrolment and to decrease early dropout. Several strategies will aim at ensuring that community
organizations and PTAs monitor absenteeism of children and intervene quickly to convince
parents to continue sending their children to school. The school improvement program, which is
one of the components of GEQIP, will involve communities and their representatives and will be
guided by supervisors so that they include activities aimed at improving school management and
student retention. While communities will be required to continue contributing labour and some
finance to school construction, their expected involvement will take into account the level of
economic development of each community so as to keep a balance between requested
contributions and the potential of the community.
According to the research conducted by IREWOC (2007) in Oromia region, in Borena and
Harerghe zones, among the numerous strategies drawn out to address enrolment and retention of
children in primary schools are initiatives to enhance community involvement in educational
matters, such as School Committees (SC) and Parent-Teacher Associations (PTA).
The findings of qualitative data further revealed that kebele and training board members and
parent-teacher associations play a great role in mobilizing the community to participate in
education. It is also reported that there is a strategy called ‘education week’ at the beginning of an
academic year to mobilize and empower the society for education and enable them to send their
children to schools. Respondents from the Afar region also stated that every year there is a
community mobilization plan, community conferences (from region to woreda level), awareness
creation programs by the ruling political party officials and administrative officials, etc.
3.2.2 Community Awareness-Raising on Gender Issues
According to the GTP (2010) document, three key strategies are identified with regard to
women’s affairs. The first concerns strengthening women’s associations and organizations.
Secondly, a more conducive environment will be created for women to actively participate in and
benefit from development and governance programs through their associations and organizations.
Finally, for the participation of and benefits to women to be effective and sustainable, effective
coordination of women’s associations and organizations and all other actors is critical. In this
way, a monitoring mechanism with a clear line of accountability will be established so that
75
women’s affairs are mainstreamed and accordingly executed in all sectors. Implementation
strategies for children’s affairs focus on preparing and implementing a comprehensive children’s
policy; promoting community-based care for vulnerable children and children at risk; and taking
measures to reduce child abuse in the labour market, sexual assault and child trafficking.
One of UNICEF’s CFS (2010) study report claims that during the past two decades, various
policy measures and strategies have been taken with a view towards making primary education
accessible to all children. The construction of new schools, the adoption of alternative strategies,
the provision of free textbooks, the prohibition of school fees, the introduction of mother-tongue
education, the elimination of gender stereotypes in textbooks and teacher training systems,
awareness-raising campaigns (especially to encourage parents to educate their daughters), and the
affirmative action taken to increase the number of female teachers are all examples of the efforts
made to ensure the right of all children to primary education.
According to the Ethiopian Ministry of Finance and Economic Development (MoFED) Report
(2010) on the MDGs, the Government of Ethiopia has declared its commitment to gender
equality, equity, and the empowerment of women by stipulating the rights of women in its
Constitution, by issuing the Women’s Policy of Ethiopia, and by revising the Family Law and the
Criminal Law. In 2005, the government upgraded the Office of Women’s Affairs in the Prime
Minister’s office to the level of a full-fledged Ministry of Women’s Affairs (MoWA) with the
mandate to ensure that due consideration was given to gender issues across all sectoral policies.
Efforts continued to firmly establish gender as a cross-cutting issue through joint planning
sessions between sectoral line ministries and MoWA. The government has also incorporated
gender issues in different national policies including health, education and training; HIV/AIDS;
population; and other sector policies. The formulation of the National Action Plan (NAP) on
Gender and Development ensures that gender is fully considered and incorporated in all the
annual work plans; and the establishment of a gender focal person in each of the regional bureaus
is evidence of the government’s commitment to gender equality.
The MoFED report also states that PASDEP has also recognized addressing gender issues as one
of its eight pillars. To this effect, PASDEP outlines the following strategic measures: increasing
girls’ and women’s access to education, improving water supply and sanitation as well as health
services, and adapting agricultural training to the needs of women. Besides, safeguarding rights
such as access to land and credit, and increasing the number of women that benefit from
government programs such as the construction of low-cost houses in urban areas and the
encouragement of micro and small scale enterprises are essential parts of the PASDEP strategy.
Measures are also taken to reduce violence against women, including the enactment of protective
legislations. In connection to this, a new Penal Code has been adopted, which contains strong
measures in support of women’s rights and curbing gender-based violence.
76
The qualitative survey conducted in Oromia and SNNP regions also indicates that girls’ advisory
committees in schools, community radios, the Women’s Affairs Policy, etc. have contributed a lot
in raising awareness on gender issues. Moreover, key informants from the Addis Ababa City
Administration reported that the Gender Department in education bureaus plays a great role in
creating awareness on gender issues. Similarly, respondents from the Amhara region reported that
girls’ clubs in schools play an important role in creating awareness on gender issues.
3.2.3 Addressing Stigmatizing Attitudes towards Marginalized Children in the Community
and in the School
UNICEF’s (2010) child-friendly-schools case study states that the MoE has developed a strategy
for special needs education. Accordingly, all regions have attempted to include special needs
education in their ESDPs, and some schools have already started to collect information with
regard to children with special needs to encourage their enrolment. The research findings also
indicate that there are colleges of teacher education that have opened special needs education
departments.
However, ESDP IV (2010) states that, notwithstanding the significant progress in access and the
improvements in some equity indicators (e.g. gender parity index in primary education),
participation levels at the primary level remain much lower in some of the emerging regions and
among pastoralist and semi-pastoralist groups. Overall, about three million primary school-age
children are out of school in the country. ESDP IV addresses the need to design specific strategies
to reach the millions of out-of-school children in the pastoralist regions and disadvantaged
communities.
On the other hand, according to an undated pastoralist education research report, the major
favorable conditions available for the expansion of education in pastoralist areas include:
the implementation of a decentralized administrative and education system at the wereda
level and the consequent reduction of the bureaucratic ups and downs; the acceleration of
the decision-making process, the harmonization between government- and nongovernment-led development projects as well as the enhancement of community
participation and a sense of ownership in developmental activities;
the availability of clear policy directions and strategies for socio-economic development
at the federal government level;
the establishment of a federal, special support board composed of sector ministries
including the Ministry of Education, a corresponding technical committee composed of
experts drawn from sector ministries and sections within sector ministries that are
responsible for providing special support to pastoralist and agro-pastoralist regions in
their respective sectors including the education sector;
77
the commencement of inter-regional cooperation in which pastoralist and agropastoralist regions receive support and benefit from the experiences of neighboring
regions in various development sectors including the education sector;
the designing and endorsement of five-year strategic plans in various development
sectors including the education sector by pastoralist regions; and
the presence of conducive policy directions that encourage local and international NGOs
to be engaged in pastoralist education along with the government.
The strategies that are put in place to make primary education accessible to children in pastoralist
areas include: using a variety of educational modalities (Alternative Basic Education, mobile
schools, para-boarding schools, hostels, and formal primary schools), using a flexible academic
calendar, addressing cultural barriers and wrong attitudes, and addressing environmental and
economic constraints related to dropping out of school. A brief description of each of these
strategies is presented below.
Using a Variety of Educational Modalities
Alternative Basic Education: According to the ABE guideline (2009), targets of the
ABE program are school-age children identified to be enrolled or already enrolled in the
program. It includes the following categories of children (boys and girls) between the
ages of 7 and 14 in rural and urban settings. The target children are those who:
do not have any chance of access to any other mode of education;
have special needs of education that prevent them from access to formal schools;
have access to education but are denied attendances by parents or guardians because of
lack of awareness about the value of educating their children;
are denied access to education because parents or guardians require their labour;
act as income earners because their parents are not able to work due to old age or
HIV/AIDS or poverty;
have lost their parents (are orphans), OVCs in wider terms;
live in single-household-headed (father or mother) families;
support themselves (and/or siblings) for survival;
are members of pastoral and semi-pastoral communities; and
have dropped out of the formal school system before completing Grade 4.
Mobile Schools: Provide alternative basic education through mobile schools (easily
moveable tents and simple structures that can provide shelter, flexible blackboards, mats,
etc.) in areas where the duration of mobility of communities in a year is more than 4
months;
Para-boarding Schools: Establish low-cost para-boarding schools that are in harmony
with the life condition of pastoralists and in which the community makes active
78
participation in terms of providing locally-available building materials and labour as well
as managing the schools, for second-cycle primary education (priority should be given to
female students in cases of capacity limitation for admission);
Hostels: Enable pastoralist children and youth who reside in areas where there
are no second-cycle primary schools to continue their education by building low-cost
hostels for them in areas where the schools are available; and
•
Formal Primary Schools: Build low-cost formal primary schools in areas where
settlement is sedentary and the size of population is sufficiently large.
Using a Flexible Academic Calendar
The ABE guideline (2009) document states that parents in rural and urban areas require their
children to engage in income-generating activities to support families’ subsistence. Some are
affected by seasonal migration, others by seasonal upsurges of survival activities that require the
input of the children. Thus, ABE has to be flexible enough to respond to the different needs of the
learners and parents who are influenced by ways of life and challenges at different times in local
conditions. That is, class times are set by the community. Some classes are taught on Saturdays,
and the ABE school year is sometimes longer than the regular school year in order to make sure
that children have time both to attend school and to help with family chores. In this context, the
flexible academic calendar enables parents to send their children to ABE centres while they can
still contribute to family needs during the rest of the day.
Addressing Cultural Barriers and Wrong Community Attitudes
raise the awareness of pastoral communities on such pertinent issues as gender roles,
harmful traditional practices, early marriage, the value of secular education and coeducation through continuous workshops, adult education programs, local radio
programs, etc.;
mobilize the community at large to the attainment of the goal of universal primary
education in pastoralist areas; and
utilize religious, political and community leaders as entry points to achieve the abovestated goals.
Addressing Environmental and Economic Constraints Related to Dropping out of
School
make water sources available at school/center sites;
provide separate latrines for boys and girls;
provide various types of support (stationeries, textbooks, clothing, etc.) to students,
particularly female students who have difficulty to pursue their education because of
abject poverty;
79
expand school-feeding programs in areas of acute food shortage, alongside with
government endeavors to make the community self-sufficient in food production, to
deter students from dropping out of school while taking care that this does not lead to
dependency syndromes; and
promote conflict resolution and peace education.
3.2.4 Partnerships with Religious and Civil Society Organizations
The Education and Training Policy (1994) states that the government will create the necessary
conditions to encourage and give support to private investors to open schools and establish
various educational and training institutions.
According to the CfBT Education Trust (2008) survey report, a key element or requirement to
ensure success in the implementation of the ESDP targets is the need to rethink and reformulate
ways and means of financing education and to find a mix of public financing, private resources
and direct contributions from firms, associations and individuals. The study report states that
Ethiopia needs to be prepared to allow a greater scope for the private supply of education and
training. This is also reflected in the overall strategy of ESDP II, which states: “Therefore, to
implement the program at a possible lower cost, the community and NGOs shall be encouraged to
stand by the side of the government.”
The CfBT Education Trust study report further proposed the following seven specific
recommendations for possible consideration to increase the role of the partnership:
review all private school regulations, with a view to relaxing or abolishing those that are
unnecessary to meet educational or other objectives;
streamline the current land-zoning requirements to facilitate the establishment of private
schools and allow private providers greater access to public land to establish private
schools;
include Non-State Providers (NSP), on a pilot basis, on a formula-driven, student-based
funding system, with funding targeted on factors such as grade level and socio-economic
status;
improve the investment environment for private schools by instituting a program of soft
loans to prospective private school operators who meet certain quality standards;
establish a private education Task Force, comprising members from the public and
private sectors and mandate this Task Force to prepare an innovative private education
development strategy and policy investment framework;
support the establishment of (an) association(s) to represent non-government schools;
and
consider the establishment of co-ordination committees within the central and regional
education public sector departments that have responsibility for liaison with NSPs.
80
The data collected from the sample regions (Addis Ababa, Afar, Amhara, Gambella, Oromia and
SNNP) also confirm that there is no clear policy about the partnership with religious and civil
society organizations. But there are many NGOs and religious organizations that participate in
pre-primary education. Civil society organizations such as youth and women’s associations also
play a great role in the education sector to increase access and equity.
3.2.5 Addressing Opportunity Costs, Especially for Working Children
According to a research report (Tasew et al., 2006), although increasing educational access for all
has been broadly successful, children from poor and/or highly indebted families still face
significant constraints because they have to contribute to household survival through paid and
unpaid work. It is, therefore, necessary to increase efforts to improve the livelihood options of the
poor, including greater income-generation opportunities, particularly in rural areas and for
women. The research survey finding conducted by People In Need - Ethiopia (PIN, 2009) also
indicates that particularly children in rural areas work in farms either independently or to support
their parents regardless of their sex.
3.3 Economic Demand Side
The barriers and bottlenecks, along with the corresponding strategies, are summarized as follows:
Economic barriers and
bottlenecks
Household poverty
Being orphan
Strategies to address barriers and bottlenecks
Abolishing school fees and reducing indirect costs
creating income-generating opportunities for women
simultaneously accompanied by community childcare
systems in order to prevent older children from shouldering
their mothers’ childcare burden; and
making targeted interventions such as scholarships for girls,
take-home food rations, girls’ clubs in all schools, separate
latrines for boys and girls, more gender-sensitive curriculum
and teaching materials, a gender mainstreaming strategy,
tutorial programs and affirmative actions, and girls’
education forum by stakeholders.
3.3.1 Abolishing School Fees and Reducing Indirect Costs
Ethiopia has implemented a free primary education policy as of 1994. The high direct cost of
education to parents has been a reason for poor children not to enter school or to drop out early.
Where schools/woreda’s/regions decide to levy fees in a form of community contribution, they
will need to ensure that arrangements are in place so that no child is excluded from school
because of inability to pay (ESDP IV, 2010).
81
According to Devereux (2006), in the Somali region costs of education are relatively low, but
they are higher for formal schooling than for Koranic schools. Government schools are not
supposed to charge fees, but parents in Jijiga town noted that they have to pay several indirect
costs to send a child to school - registration fee, uniform, books - while the Koranic school
charges only a nominal tuition fee. The estimated cost of sending a child to primary school in
Jijiga is 125–175 Birr per term, while sending a child to a Koranic school costs just 15 Birr. Even
where no fees are required, many parents cannot afford to send their children to school because
the non-fee costs are too high. It is clear that this has an impact on student enrolment. GER and
NER in the Somali region is low compared to that of other regions. To increase enrolment of
children in this region support should be provided in all aspects.
Nowadays, girls’ clubs and/or girls’ education advisory committees are organized and work in
many schools in Ethiopia. These programs are supported by different NGOs. The establishment of
girls’ clubs and the availability of separate latrines have had an impact on girls’ enrolment,
attendance and transition. Building separate latrines is also supported by the GEQIP program.
There is a school grant which enables schools to use the grant to build latrines.
3.3.2 Targeted interventions to disadvantaged children
According to a document entitled ‘Reaching the Marginalized: Reflections from Ethiopia’ (MoE,
n.d), there is a progress in getting and keeping girls into school. That is, there are girls’ clubs in
all schools; there are separate latrines for boys and girls; female scholarships are given for the
needy and the high achievers; there are more gender-sensitive curriculums and teaching materials;
there is a gender-mainstreaming strategy; there is a girls’ education forum organized by
stakeholders; there are tutorial programs; and affirmative actions are being taken.
The 1994 Education and Training Policy clearly states that scholarships will be given to deserving
(outstanding) students. The field survey findings from the Afar, Oromia and SNNP regions also
indicated that there is a policy regarding scholarships for girls, take-home food rations, etc. The
respondents from these regions mentioned that there are some local and international NGOs such
as UNICEF, WFP, PACT/Ethiopia, etc. that support girls to continue their education. The
respondents from Gambella also reported that some students get scholarships from UNICEF to
enable them to continue their education.
82
3.4 Supply Side
The barriers and bottlenecks, along with the corresponding strategies, are summarized as follows:
Supply side barriers
Strategies to address the barriers and
bottlenecks
Remoteness of schools/Average distance from
school to home and the availability of classrooms
increasing the number of primary schools
and ABECs;
Lack of appropriate school infrastructure, drinking
water and sanitary facilities
implementing the WASH project;
Shortage of teachers
increasing teacher supply, reducing class
size, increasing female participation in
teaching; and
Shortage of textbooks and teaching materials
providing, under GEQIP, special support to
the development and supply of textbooks
and teaching materials.
3.4.1 Increasing the Number of Primary Schools and ABECs
According to ESDP IV (2010), the first set of strategies include increasing the number of primary
schools with special emphasis on reducing the distance between schools and pupils’ homes,
particularly at second cycle primary level, transforming the existing ABECs into regular schools,
and establishing more ABE centers when and wherever necessary. ABECs are considered a
temporary solution to providing access for hard-to-reach children. The strategy is to phase out
ABECs and use other solutions to address those children who still cannot access formal schooling
for a variety of reasons.
3.4.2 School Infrastructure: Improving School Facilities; Water and Sanitation;
Adaptations for Children with Disabilities
The Education Statistics Annual Abstract (MoE, 2009/10) indicates that 26.5% of primary
schools (Grades 1-8) use a shift system; 37.4% (10,070) of primary schools have water facilities
and some schools have two sources of water; more than 90% of all schools have latrines; of all
schools, 14.5% have clinics for students; 50.7% of the primary schools have pedagogical centers
that teachers use for producing teaching aids, and 37.3% of all primary schools have library
facilities. Regarding secondary schools (Grades 9-12), 34.9% of them have reported that they use
the shift system; 69.9% (947) of secondary schools have water facilities; all secondary schools
have latrines; 33.4% (452) of them have clinics serving students; 86.42% (1171) of them have
library facilities, and 74.0% have electricity.
83
According to ESDP IV (2010), the status of water, sanitation and hygiene services in schools is a
major problem in many countries, contributing to high disease prevalence, poor learning
environments and impacting on girls’ education. Children should be seen as agents of change for
the WASH (water, sanitation & hygiene) project within their schools, communities and homes.
Water supply and sanitation facilities in schools, coupled with the promotion of hygiene, have a
great influence on the quality of education. The Education Statistics Annual Abstract shows only
the latrine and water supply coverage in primary schools. However, the abstract doesn’t show the
functionality or level of service provided by the schemes.
The implementation of the WASH project will definitely contribute to the improvement of the
water supply, sanitation and hygiene situation of schools, thereby improving educational access,
equity, efficiency and quality and accelerating the attainment of the Growth and Transformation
Plan (GTP). This, in turn, greatly contributes to reducing child and maternal morbidity and
mortality arising from poor water, sanitation and hygiene services. The intervention directly helps
to achieve the water and sanitation MDGs, which aim to halve, by 2015, the proportion of people
without sustainable access to safe drinking water and basic sanitation, which is vital in itself but
also a key prerequisite for reducing child and maternal mortality (MDGs 4 & 5) and combating
major communicable diseases (MDG 6).
As indicated in the Education and Training Policy (1994), special needs education and training
will be provided for people with special needs. A special needs education strategy has also been
developed by the MoE. However, the following main challenges are listed in ESDP IV:
The drinking water coverage at primary school is estimated to be 32.3%, which is very
low compared to the national one.
The quantity of water in schools, where there is a supply, was found to be inadequate,
not satisfying even the minimum needs, at least, of 5 liters per day per capita.
The physical accessibility of water sources is a concern as about 50% of schools were
within more than 1 km of travel time.
The latrine coverage for primary school is 90.6% and predominated by traditional pit
latrines. The overall latrine seat to student ratio is 1:170, which is low and discourages
the actual use of latrines; the physical structure of latrines was not acceptable as it did
not fulfill the required standard to maintain privacy and safety. standing
Separate latrines by standing-alone blocks are very limited, in which case girls are forced
to use the same block as boys.
Hand-washing facilities, including water and soap, are not available in schools.
84
3.4.3 Teacher Supply: Increasing Teacher Supply, Reducing Class Size, and Increasing
Female Participation in Teaching
According to the GTP (2010) document, the qualification of teachers at every stage and for every
type of education will be upgraded as described in the teacher development blue book through
pre-service, in-service and continuous professional development schemes.
Ethiopia: 2010 MDGs Report states that there is an overall increase in the enrollment ratios in
Ethiopia though this seems to come at the expense of educational quality. Given the importance
of education in indirectly addressing the other development goals, the issue of quality is of
paramount importance. Towards this end, the GoE initiated a General Education Quality
Improvement Program (GEQIP), which is being implemented starting from 2009. This included
upgrading the quality of teachers and increasing the number of teachers through on-the-job
training and summer training, as well as reducing the pupil-to-teacher and pupil-to-textbook
ratios.
The Education and Training Policy (1994) shows that teachers at all levels (from kindergarten to
higher education) will be required to have the necessary teaching qualification and competency in
the media of instruction through pre-service and in-service training. It also states that special
attention will be given to the participation of women in the recruitment, training and assignment
of teachers.
The new initiative of the Ministry of Education, i.e., the General Education Quality Improvement
Program (GEQIP), particularly the Teacher Development Program (TDP) and the Management,
Administration and Planning (MAP) initiative, focus on improving the professional capacity of
teachers and education leaders.
However, as the government strives to expand education, it also faces the challenge of ensuring
quality. Currently, the traditional lecture method, in which teachers talk and students listen,
dominates most classrooms. The common obstacles to the employment of innovative methods of
teaching, as found out by one study, are: the Ethiopian tradition of teaching and child upbringing,
lack of institutional support, lack of learning resources, teachers’ lack of expertise, inappropriate
curricular materials, and students’ lack of prior experience to actively participate in the teaching
and learning process (Derebssa, n.d).
The Education Sector Strategy (1994) states that the training and professional competence of
teachers shall be upgraded with the view to improving the quality and standard of education. To
this end, the teacher training program and curriculum will be made relevant to the new
educational objectives and responsive to the different curricula of general education. Teacher
training institutions shall also be upgraded, diversified and expanded in line with the requirements
of the new educational system and services. That is, an expanded program of in-service training
will be instituted in order to continuously upgrade the level and qualifications of teachers.
85
However, education officers that have participated in the focus group discussion and interview
reported that pre- and in-service teacher trainings are not aimed at assisting students at risk of
dropping out. But at school level, teachers are provided orientation on how to support such
students. It is reported that there is no clear structure and policy that supports teachers to address
the needs of such students.
3.4.4 Textbooks and Teaching/Learning Materials
The GEQIP (2008) document states that in the context of available resources and capacity,
priority will be given (in that order) to: the development and provision of textbooks and teachers’
guides for Grades 9-12 in mathematics, biology, chemistry, and physics, which national and
international publishers can readily adapt from their market-tested series; the provision of Grades
9-12 textbooks and teachers’ guides in the other subjects; and the provision of textbooks and
teachers’ guides for Grades 1-8. Where the required quantities are small, as in cases of books for
certain languages of instruction at the primary level, the project would seek alternative methods of
provision, including negotiation with contracted publishers for translation and publication in those
languages. The acquisition of books would be made using open and competitive procurement
procedures. The books would be delivered to MoE-designated woreda’s.
3.5 Management and Governance
3.5.1 Accelerating and Scaling up Successful Pilots
According to the GTP (2010) document, the implementation of best practices referred to in the
GEQIP will be scaled up in every school. Scaling up of education quality will be encouraged by
building communities’ sense of ownership of educational quality by initiating integrated
community mobilization, at all levels, using every media.
Alternative modes of education delivery to be scaled up include: rapid scaling up of Alternative
Basic Education Centers for pastoralists; flexible academic calendars; relevant and compressed
curriculums; mother tongue education; recruitment of facilitators from the localities; mobile
schools for pastoralists; girls’ hostels in towns for those girls coming from rural areas; and special
schools for children with special needs whenever necessary.
3.5.2 Provision of Mixed and Inter-sectoral Packages
One of the sub-components of GEQIP is Program Coordination. GEQIP is implemented at the
federal, regional and woreda levels as well as at the participating public universities and teacher
training institutions that are responsible for pre-service and in-service teacher development
programs. It is coordinated by the Ministry of Education. At the federal level, the Planning and
Policy Analysis Department of the MoE will coordinate the implementation of the GEQIP,
reporting directly to the State Minister for General Education, with inputs from relevant
departments and institutions.
86
The technical support for implementation includes a team of short- and long-term consultants,
specializing in project implementation (including project management, financial management,
procurement, and monitoring & evaluation. The team residents in the MoE and provides regular
support to regions. The MoE will play a key role in technical and procurement aspects of the
project, whereas MoFED will be responsible for financial management aspects. At the regional
level, it was agreed that each region will have similar institutional arrangements as at the federal
level, and the Planning Department of the REB in each region will coordinate the implementation
of the regional GEQIP, reporting directly to the Head of the REB. Funds would flow from
MoFED to BoFED to WFED as directed and then directly to the implementing institutions (i.e.,
Colleges of Teacher Education and schools) while keeping the REBs informed about the
transactions (GEQIP, 2009).
3.5.3 Development of Institutional Arrangements and Technical Capacity within the
Ministry of Education to Address the Needs of the Excluded
As indicated in one official document entitled Reaching the Marginalized: Reflections from
Ethiopia (MoE, n.d), the Ethiopian government has developed the following policies and
strategies to address the marginalized community and children. There are sectoral plans focusing
on marginalized groups: Poverty Reduction Strategy; Gender Education Strategy; Policy and
Strategy on Special Needs and Inclusive Education; Functional Adult Literacy Strategy,
Framework, Implementation Guideline and Ten Years’ Master Plan; Alternative Basic Education
Strategy; Early Childhood Care and Education Strategy; Strategy for Education for Pastoralist
Children; and HIV/AIDS Strategy. Besides, the following activities are carried out: the Special
Support and Inclusive Education Department has been set up in the Federal Ministry of
Education; special needs children have been mainstreamed into formal schools; learning
materials, e.g. free textbooks, have been provided; plans for special needs expertise have been put
in place; there are school-feeding programs in drought-affected areas; there are boarding schools
for girls in Afar and Benishangul-Gumuz; and teachers are being trained (1st, 2nd & terminal
degree programs for Special Needs Education Instructors).
3.5.4 Development of Effective Regulations and Monitoring Mechanisms Affecting the
Children’s Timely Access and Transitions
GEQIP also has a Monitoring and Evaluation (M&E) sub-component. This sub-component
supports the establishment of a robust M&E system at the federal, regional and woreda levels to
monitor and evaluate project outcomes and broader educational trends to provide feedback and
improve performance. Most of the data for monitoring project outcomes will come from existing
sources such as EMIS, or regular project reports, supplemented by project preparatory studies and
a baseline survey undertaken prior to implementation.
It is stated in the GEQIP document that in Ethiopia the management and financing of primary and
secondary education is the responsibility of regions and woreda’s based on the national policy
87
and standards developed and approved by the Ministry of Education. However, some regional and
woreda governments have weak capacity to gather and report on key performance indicators on
time in order to manage and monitor the implementation of education reforms effectively. The
key issues related to policy making, management and monitoring capacity include: (i) weak
institutional capacity for the delivery of general education, which hampers the implementation of
a consistent and effective education policy; (ii) inadequate strategic planning and management
capacity to support tasks such as policy development and medium- to long-term planning; and
(iii) limited monitoring and evaluation systems, which makes the reform process difficult to
operationalize. Compounding these capacity gaps is the constant turnover of key staff in the
sector at different levels of the system, as well as the insufficient number of qualified staff.
3.5.5 Developing Capacities in Policy Analysis and Building Effective Data and Monitoring
Systems
According to the GTP (2010), to ensure quality and efficiency of general education, capacity
development activities will be undertaken to enhance the performance of leaders and
implementers to the standard indicated in GEQIP, at all levels.
CfBT Education Trust (2008) states that capacity building for planning, management, monitoring
and evaluation is vital, particularly in the woreda’s, which lack planning and management
capacity or the skills to interpret policies and collect and analyze data, and indeed they are often
seriously under-staffed.
3.5.6 Developing Accountability Structures
The Education Sector Strategy (1994) states that the administration of elementary and secondary
education and training shall be decentralized in line with the ongoing rationalization process.
Schools will be strongly linked with the community, which will take responsibility for its wellbeing and upkeep. They will be made responsive to the local needs and requirements and shall act
as centers for all educational activities of the community. The management of each school will be
democratized and run with the participation of the community, the teachers, the students and the
relevant government institutions.
It is also indicated in the CfBT Education Trust (2008) document that the decentralization policy
is not only a reflection of the cultural diversity of the country’s ethnic groups but it also
acknowledges the practical difficulties inherent in administering an education sector in a populous
and geographically large country with sometimes unreliable communications facilities. The
relationship between the centre and the regions is not hierarchical, as the federal MoE does not
have line authority over the REBs. Perhaps the highest profile indicator of the drive for
localization of education has been the policy of providing education to children in their early
years in their own languages. This policy has, in spite of inevitable practical difficulties,
demonstrated the government’s commitment to democratic educational structures.
88
3.5.7 Local Support to Schools (School Grants)
The GEQIP document points out that the provision of school grants already exists in Ethiopia.
The MoE bluebook also specifies the amount that schools should receive: 10 Birr per year for
every Grade-1-to-4 child that is enrolled in school, 15 Birr per year for every Grade-5-to-8 child,
20 Birr per year for every Grade 9-to-10 child, and 50 Birr per year for every Grade 11-to-12
child (see JRM, 2006; MoE, 2008). In addition, several development partners (e.g., USAID) have
also provided school grants to some regions, but often using guidelines that are inconsistent from
one program to another and not aligned with the government’s existing school-grant programs.
However, the use of the grant policy varies considerably across the country.
The grant will be used to finance elements of the School Improvement Program (SIP). To assist
with the implementation of the school-grant sub-component, the School Grants Guidelines
(SGGs) have been developed. These guidelines provide guidance on all aspects of implementation
at federal, regional, woreda and school/community levels and are cross-referenced with the SIP
guidelines. The SGGs document is consistent with the government’s bluebook guidelines
document, but it will be implemented as a stand-alone document to ensure that key
responsibilities and outputs are understood at different levels.
According to the MoE bluebook guidelines, woreda’s are expected to provide an unspecified
block grant to schools to cover non-salary costs. The 2006 JRM Report further indicated that if
schools received this grant at all, it is typically below the amount stipulated in the guidelines.
3.5.8 Participatory Management Mechanisms in and around Schools
The 1994 Education and Training Policy states that educational institutions will be autonomous in
their internal administration and in the design and implementation of education and training
programs, with an overall coordination and democratic leadership by boards or committees,
consisting of members from the community (society), development and research institutions,
teachers, and students. However, one of the sample respondents from Addis Ababa City
Administration Education Bureau remarked that some school principals are not assigned to the
position by their merit/performance. This kind of assignment will create problems in running
schools smoothly and efficiently since such school principals do not focus on instructional
leadership issues.
3.6 Budgeting and Finance
3.6.1 Budgetary Allocations to Education
The Education Sector Strategy (1994) states that the financing of the educational system shall be
improved by increasing the government budget allocation, particularly for infrastructure building
and provision of educational materials. The focus will be on elementary and secondary education.
89
According to the GEQIP document, in Ethiopia the regions and woreda’s are responsible for
providing primary and secondary education. In 2006/07, 31.9 percent of regional spending
focused on the education sector. Since 2004, the amount of money spent on education at the
regional and woreda levels has increased at an average rate of over 24 percent per year. Within
this allocation, primary education has accounted for over 73 percent of the total expenditure.
The majority of regional and woreda level financing for education is spent on recurrent costs. In
2006/07 recurrent expenditure accounted for 90 percent of the expenditure, with only 10 percent
going to capital expenditure. Of the recurrent expenditure, the majority is spent on teachers’
salary. Only about 6 percent of woreda recurrent budget was available for quality interventions
and operating expenditures in 2006/07, and the figure has been falling below the Fast Track
Initiative (FTI) benchmark for recurrent non-salary expenditure, which is 33 percent.
3.6.2 Effective Use of Resources for Reaching the Poor, including within ResourceConstrained Environments
As indicated in the 1994 Education and Training Policy, special financial assistance will be given
to those who have been deprived of educational opportunities, and steps will be taken to raise the
educational participation of deprived regions.
The GEQIP document also states that the Teaching and Learning Materials sub-component of
GEQIP supports the provision of educational materials. In the context of available resources and
capacity, priority will be given to the development and provision of textbooks and teachers’
guides for Grades 9-12 in Mathematics, Biology, Chemistry, and Physics, which national and
international publishers can readily adapt from their market-tested series; the provision of Grades
9-12 textbooks and teachers’ guides in the other subjects; and the provision of textbooks and
teachers’ guides for Grades 1-8. Where the required quantities are small - as in the case of books
for certain languages of instruction at the primary level - the project will seek alternative methods
of provision including negotiation with contracted publishers for translation and publication in
those languages.
According to the CfBT Education Trust (2008), it is generally agreed that there has been a
deterioration of quality in education as a result of the rapid rise in enrolments. The three National
Learning Assessments (NLAs) conducted in ESDP I and EDP II (2000, 2004 and 2007) revealed
low student achievement, which was attributed to overcrowded classrooms and the poor quality of
textbooks, as well as the absence of teachers’ guides and, hence, inappropriate use of textbooks
by teachers. ESDP II revealed serious under-investment in teaching and learning materials, and
demonstrated that a lack of adequate textbook management systems had resulted in inefficient
ordering and distribution of textbooks.
Great steps forward have already been taken through ESDP I, ESDP II and ESDP III, with
emphasis upon ministerial capacity building and improvements in the provision of textbooks and
learning materials. And these steps are expected to accelerate the reform process.
90
3.7 Analytical Summary
From the survey conducted in the sample regions and the analysis of policy documents, it is
possible to provide the following summary regarding the policies and strategies of education of
the country.
The issue of out-of-school children (OOSC) in terms of the five dimensions of exclusion (5DEs)
is not emphasized in the existing policies and strategies of the Ethiopian education system. Even
the recently launched Education Sector Development Program (ESDP IV) does not consider
particularly Dimension 4 (children who are in primary school but at risk of dropping out) and
Dimension 5 (children who are in lower-secondary school but at risk of dropping out) as one of
the challenges of the education system, though it discusses in detail the issue of improving equity
and access in general education. Though the country has had its own education and training
policy since 1994, it lacks educational law which serves to enforce education-related policies,
standards, rights, authority, responsibility and accountability of all stakeholders. Although
Building Code No. 24/2009 has been put in place recently, the construction of schools does not
still take into consideration the needs of children with disabilities.
Despite the rapid expansion of the education system, Ethiopia’s education sector faces the
following four key challenges (World Bank, 2005; cited in GEQIP): a) access to education
opportunities continues to be an obstacle, especially for females and other “most vulnerable
children’’ (UNICEF, 2008; cited in GEQIP), poor students, and pastoral areas (e.g., Somali and
Afar); b) inequities in access to quality education are widespread, as better-resourced schools are
generally located in urban areas and in the non-emerging regions; c) there are socio-cultural
barriers to participation (especially for girls in rural areas); and d) there are financial constraints
with households paying a large share of non-salary recurrent education expenditures.
Similarly, the ESDP IV (2010) document states that, notwithstanding the significant progress in
access and the improvements in some equity indicators (e.g., gender parity index in primary
education), participation rates at primary level remain much lower in some of the emerging
regions and among pastoralist and semi-pastoralist groups. Overall, about three million primary
school-age children are out of school in the country. Rural populations in general face serious
accessibility constraints at secondary level. Alternative Basic Education has developed rapidly
and has helped increase enrolment but problems of low quality and of transition between
Alternative Basic Education and the formal school system still prevail. These problems need to be
addressed in order for Ethiopia to achieve Universal Primary Education (UPE) and to work
towards the universalization of secondary education, which are the foundation on which to build a
competitive economy and a society characterized by justice and fairness.
As suggested in the ESDP IV document, strategies to increase quantitative supply include those
aimed at further developing the formal school system. These are: a) transforming the existing
ABE centers to formal/regular schools in the relatively densely populated areas of pastoral/agro-
91
pastoral regions; b) constructing new schools, especially second cycle primary schools; and c)
expanding the existing primary schools – by constructing new classrooms. Some strategies that
have the objective to further develop alternative models include establishing new/more ABE
centers and introducing or strengthening the alternative education modalities such as mobile
schools, multi-grade classes, and para-boarding schools for second cycle primary schools.
It is also important to note that the quality of education in the emerging regions can improve
through: a) providing learning materials (such as exercise-books, pens, pencils) and uniforms for
the needy students, and b) upgrading academic and professional facilitators. Strategies to incite
more demand for education will include strengthening and/or introducing special support
programs such as school feeding and scholarship programs, with special attention to the
indigenous children, girls and the vulnerable children. Finally, some strategies focus on
strengthening the management of the education system through capacity building of officials and
professionals at different levels of the education structure, and through developing and
implementing different implementation manuals and standards of alternative educational
modalities.
The 1994 Education and Training Policy of Ethiopia states the commitment of the government to
offer special support to the marginalized areas that were deprived of education services in the
past. However, realizing an equitable provision of quality education services in the pastoral or
semi-pastoral and emerging regions (namely, Somali, Afar, Gambella and Benishangul Gumuz)
has remained challenging because of the socio-economic problems that emanated from a long
period of neglect and marginalization and the natural environment they inhabit. Pastoralists have
been leading a mobile lifestyle because of the absence of basic infrastructures and social services
(including education and health), frequent drought, poverty, lack of water and pasture, etc. It is
difficult, if not impossible, to satisfy the educational needs of pastoralists by using conventional
ways of schooling as the sole means of education delivery. Therefore, it is necessary to develop
and put into effect the alternative strategies discussed in this chapter so as to satisfy the education
needs of these regions and, thereby, enable our country achieve Universal Primary Education
(UPE) by 2015.
92
CHAPTER 4: SOCIAL PROTECTION SYSTEMS IN ETHIOPIA
4.1 Introduction
This section of the report focuses on the analysis of social-protection-related interventions
existing in the education sector and beyond that would contribute to mitigating problems of outof-school children in the country. The section also attempts to assess the progress made in the
provision of social protection both by the government and non-governmental organizations, and
to identify the limitations of these interventions. The status of coordination and multi-sectoral
participation in the implementation of the available programs are also areas of concern in the
analysis.
According to Devereux and Sabates-wheeler (2004), cited in UNICEF (2008), social-protection
interventions can be broadly categorized into four: protective, preventive, promotive and
transformative measures/programs. A brief description of what these four programs intend to
address is presented hereunder.
Protective programs refer to programs put in place to offer relief from socio-economic
deprivations, including social assistance for the most vulnerable, mainly for those who are not in a
position to earn their livelihood. These types of intervention include targeted resource transfer
schemes and social service schemes for those who are in dire need of special care and protection.
Preventive programs refer to programs put in place before the occurrence of the shock to avert
deprivations, and also to mitigate the impact of an adverse shock. These are programs designed to
assist those people who have fallen or might fall into poverty so that they may be able to manage
their livelihood shock. These types of intervention include social insurance for economically
vulnerable groups and non-contributory pension schemes.
Promotive programs aim at enhancing income and capabilities which can be achieved through
capacity building schemes like targeted skill training at household or individual levels for the
poor and marginalized sections of society.
Transformative interventions deal with power in-balance to address issues of social equity and
exclusion. Relevant measures under this category include reforms in regulatory frameworks to
protect socially vulnerable groups, budgetary analysis and reform, and policy review and
monitoring. These interventions also deal with issues of sensitization campaigns to transform
public attitudes and behaviors.
The current analysis of social-protection intervention in Ethiopia, thus, followed this pattern of
categorization of existing social-protection interventions/programs.
93
4.2 Mapping of Social Protection Programs
4.2.1 Social Protection Programs in Ethiopia
Today, social-protection policies and strategies are considered as the best instrument that could
respond to the changing life cycle patterns of the population in light of increasing pressures such
as poverty, unemployment, ageing, mobility, changing social structures, and increasing
expectations of different segments. It has been clearly stated in the African Social Policy
Framework that social protection is an instrument that would break the inter-generational poverty
cycle and reduce the growing inequalities that constrain economic and social development.
Therefore, there is a high need for comprehensive social policy measures that could address these
needs of the different sections of the population in any country including Ethiopia. This, of
course, depends on the economic capacity and social commitments of a particular nation. That is
why we are currently observing social protection systems in many developing countries that are
targeted at particular groups, and in the developed counties that are aimed at the provision of
multifaceted services for their citizens.
It is true that Ethiopia does not have a comprehensive, structured, organized and integrated socialprotection system. However, there are programs, policies and strategies initiated by the
Government, non-governmental organizations and communities that are serving social-protection
purposes, aimed at reducing social and economic risks, vulnerabilities, contingencies and chronic
poverty (Daniel, 2010). There have also been many initiatives for decades that have been
designed and implemented to promote the livelihood and welfare of people exposed to socioeconomic risks, vulnerabilities and shocks. Different attempts have been undertaken at different
times by all governments that came into power in the country (MoWA, 2009). Nonetheless, all
the attempts undertaken mainly by the past two governments (the Imperial and the Military
regimes) focused on specific sections of the society and emphasized economic growth without
considering the vital importance of social capital. It is commonly understood that, though
economic growth is necessary for the advancement of the well-being of the people, it cannot be
the only determinant factor to reduce poverty and address inequality. Economic measures need to
be complemented by social interventions and changes in regulatory frameworks. Interventions in
health and education create a sustainable ground for a healthy, literate and secure society that
plays a vital role in creating a suitable situation for a smooth economic progress (ILO, 2003).
Over the past few years, within the domain of the overall policy, strategies and program
frameworks, Ethiopia has taken steps to reform policies and legal frameworks so as to lay a firm
ground for the protection of its citizens, especially for children and women who are vulnerable to
any shock and contingencies. As a result of these measures, the policy and strategy environment
of the country appears to be favorable towards attaining the welfare and the well-being of the
vulnerable groups, including women and children. The National Youth Policy, which addresses
the problems and concerns of the youth between the ages of 15 and 29; the Ethiopian National
94
Plan of Action for Children (2003-2010 and beyond); the Orphans and Vulnerable Children
National Plan of Action (2004-2006); the National Action Plan on Sexual Abuse and Exploitation
of Children (2006-2010); the Educational and Training Policy (1994); the Health Policy (1993);
the HIV/AIDS Policy and Strategy; the National Food Security Strategy; the Nutrition Strategy;
the Developmental Social Welfare Policy; and different interventions implemented at various
levels are relevant policies, strategies and programs that contain protection strategies of various
sections of the society, especially that of the marginalized groups.
All these policies targeted at reducing factors that hamper access of children to education at all
levels, especially at pre-primary and primary levels, lay a solid ground for the expansion of preprimary and primary education. For instance, the Ethiopian National Plan of Action for Children
says that poverty-stricken children should be supported in the form of nutrition, health care,
educational materials, etc. These policies and strategies are also aimed at reducing educational
wastage, particularly dropout and repetition rate. Elimination of regional and gender disparities in
raising the enrolment rate is the area to which these policy and strategy documents have given top
priority. The share of education from the total national budget has also been targeted in some of
these policy documents.
The Developmental Social Welfare Policy, which was issued in 1996, is aimed at the creation of a
social condition conducive to a healthy life and a sustainable social development. Though it
includes all segments of the population, it mainly focuses on the most vulnerable sections,
including children, women, the youth, people with disability, the elderly, etc. Recognizing the
dire needs of children, women, people with disabilities, the elderly, and others, this policy
prioritized ten areas of intervention in order to bring about changes in their livelihood. The policy
outlined activities that have to be undertaken to realize the welfare of these groups so as to enable
them to enjoy the rights enshrined in international and national laws and policies. Even though
MoLSA is the leading agency in the area of social welfare and particularly given clear
responsibilities to coordinate the implementation of this policy, the attempts made over the last
years were weak, to put it mildly. The issues included in the developmental social welfare policy
are multi-sectoral and targeted at different sections of the society. Therefore, the implementation
of this policy to address these issues requires the collaboration of different government ministries
and organizations. However, the coordination effort in due course of its implementation was not
strong and the forum that was supposed to be established for proper coordination was not put in
place.
The Government of Ethiopia has taken important steps to address the issues of social inequality
and exclusion, and to harmonize national laws with international conventions and the new
Constitution. In view of this, the Ethiopian Constitution guarantees all Ethiopians equality before
the law and their equal access to protection and services. It also addresses the rights of all citizens
95
in general and the vulnerable groups in particular. Moreover, according to Article 9, sub-Article 4
of the Constitution, any international agreement ratified by Ethiopia is an integral part of the law
of the land. It has been stipulated that fundamental rights and freedoms enshrined in the Ethiopian
Constitution are to be interpreted in a manner conforming to the principle of the Universal
Declaration of Human Rights and the International Covenants on Human Rights (The Ethiopian
Constitution, 1995). The revised family law also has provisions that protect the rights of children
and women and, as a whole, the cohesion of the family. It obliges the guardian to look after the
health of the child, to educate him or her and oversee the entire social relationship of the child so
as to ensure his/her healthy development. The code contains issues such as marriage, adoption,
affiliation, maintenance, and succession. It does away with the discriminatory marriageable age
for boys and girls and prescribes age 18 as the marriageable age for both sexes (Revised Family
Code, 2000).
4.2.1.1 Poverty Reduction Strategies
The Plan for Accelerated and Sustained Development to End Poverty (PASDEP) has been
Ethiopia’s MDG-based plan implemented throughout the nation since 2005. It is a comprehensive
intervention in which government commitment has been expressed to the achievement of equality
and equal benefits to men and women from the expected progress. It is the main development
policy document in which the government declared its unreserved effort to meet the Millennium
Development Goal. The PASDEP, as a vehicle towards achieving Ethiopia’s MGD’s plan,
presents Ethiopia’s vision of becoming “a country where democratic rule, good governance and
social justice reigns, upon the involvement and free will of its people; and once extricating itself
from poverty, becomes a middle-income economy.” The strategy has over-arching policy effect in
addressing the multi-social issues currently facing different segments of the population, mainly
those who are suffering from chronic poverty and vulnerability (PASDEP, 2005-2010).
This shows that Ethiopia is committed to bring about social justice to its citizens through
accelerated socio-economic progress that benefits all segments of the population. Among other
things, this would involve a big push on education to create human resource capacity for
sustainable development that would also result in fewer out-of-school children, as family income
would increase through different interventions. The realization of this grand vision would secure
access to education and health care, social welfare, livelihood, stable income, social justice,
equity, as well as employment.
Ethiopia’s first-generation Poverty Reduction Strategy Paper (PRSP), known as the Sustainable
Development and Poverty Reduction Program (SDPRP 2002/03-2004/05), was the first attempt in
formulating a program of a national coverage with massive participation at different levels;
different segments of the population played a vital role in identifying poverty reduction measures
that need priority attention. The strategy is considered to contribute to the country’s effort to put
an end to poverty and ensure social justice, to build human capital and sustainable progress,
96
which would improve economic development and living condition of the people. Job creation to
address unemployment and full participation and equal benefit to address gender equity are some
of the elements of social protection which are given due attention in the plan. Education, health
and other social-protection-related cross-cutting issues treated under different sectoral policies are
also given considerable attention in the strategy.
4.2.1.2 Productive Safety Net Programme
The Ethiopian productive safety net program was developed in 2004, as a collaborative effort
between the Government and a joint donor group including the Canadian International
Development Agency (CIDA), the UK Department for International Development (DFID),
Development Co-operation Ireland, the European Commission (EC), the US Agency for
International Development (USAID), and the World Bank. This program has a wide range of
targeted beneficiaries in the country. The prior objective of the program is to create a fertile
ground to move from relief-oriented safety nets to a development-oriented approach. The program
has been designed to bridge the income gap for chronically food-insecure households and engage
such households in public work programs to earn income. It targets the chronically food-insecure
and transfers a combination of cash for those who are unable to work and earn their livelihood
and/or vouchers through a cash-for-work scheme, with direct grants being given to those
ineligible. There is evidence that 30 per cent of the safety net program continued to transfer food
(UNICEF, 2008). According to the above-mentioned assessment, the program was designed to
reach 5-6 million direct beneficiaries through cash-for-work and cash relief components
envisioning to raise the number of beneficiaries to 15 million people in an inter-year emergency
program.
The target groups of the productive safety net include rural food-insecure households in any of the
262 chronically food-insecure woreda’s; those who are usually known to have faced continuous
food shortages for at least three month in the last three years and have received food assistance;
those who do not have labour to participate in public works and who cannot participate in, or
contribute to, other community-based activities or initiatives (e.g., lactating and pregnant mothers,
orphaned teenagers, labour-poor households); those households without family support or other
means of social protection; those households who suddenly become vulnerable due to a drastic
loss of assets and have been unable to be self-supportive in the last two years (Devereuxs and
Bruce, 2009).
Some research findings showed that the program is currently benefiting 8 million people in a year
and operating in about 300 woreda’s. The lion’s share of the program budget comes from
multilateral donors ($500 million) and the Government contributes Birr 2 billion per annum.
Eligibility for the unconditional cash component depends on a person’s ability to work. The
government has set an 80-to-20 ratio for cash-for-work to gratuitous relief, but it is likely that
fewer than 5 per cent receive the gratuitous relief. The value of the cash transfer amounts to about
97
30 Birr per person per month. During the hungry period, the transfer is a (100 per cent)
cash/coupon payment for immediate redemption. During the post-harvest period, 50 per cent is
for immediate payment, while 50 per cent (cash) is deferred payment (in the form of a coupon) for
redemption in the hungry period. Support for cash transfers has waxed and waned according to
changes in development practices, and there is currently a renewed interest in cash transfers
within the non-governmental sector (UNICEF, 2008). Though there are no available data that
indicate the impact of this program on education, one can say that those families who are
benefiting from the program are in a position to send their children to school, since they can
currently afford to fulfill school supplies for their children.
4.2.1.3 Cash Transfer Schemes
In Ethiopia, there are also International NGOs like Save the Children UK who have been
operating in the area of cash transfer schemes in some of the northern parts of the country. This
organization implemented the Livelihood Development Project for Meket Woreda (MLDP) in
North Wollo Zone, Amhara National Regional State, which began in 2003. The program was
designed to provide cash transfers to vulnerable households to meet ‘essential food expenditure’
in bad years and invest in assets in better years; to learn lessons and advocate for change of
policy, funding, and practice in the linking of relief to development and child nutrition
development; and to stimulate local markets and the economy through cash distribution and other
related interventions. Targeted at able-bodied and vulnerable food-insecure households, it had
benefited 46,600 beneficiaries, around 11 per cent of whom received the unconditional cash
transfer, having been identified as vulnerable and unable to work (Save the Children, 2005).
There are also other small-scale cash transfer initiatives among local and international NGOs,
notably SOS Sahel, ACCORD, Help Age International, and World Vision. One example is a child
sponsorship project that provides welfare assistance to orphaned and destitute children, without
separating them from their extended family or native community. A pioneer local NGO, known as
Abebech Gobena Yehetsanat Kibikabenna Limat Mahiber, is currently providing different types
of educational and social support for about 14,000 orphans and vulnerable children in the
community as well as in orphanages. (The majority of the children who have access to the
program are those children who, at some point, dropped out of school or may not have entered at
all, but are now attending school as a result of the support provided through the program).
Another local NGO, known as Integrated Family Service Organization, is also implementing a
support project which is benefiting 1,128 orphans and vulnerable children. The monthly cash
transfer to be spent on basic needs under this project is between 130 and 150 Birr. There are also
other organizations like FHI and SOS Sahel, which focuses on traditional social organizations like
idir’s to handle community-level orphan support, home-based care and income-generating
activities (USAID, 2004). The same report describes that there is little information on small
transfer schemes in the Ethiopia Rapid Assessment, Analysis and Action Plan (RAAAP), which
was launched in April 2005. No information was available in the plan as to whether there would
98
be any direct cash component. A similar situation prevails with the multi-sectoral HIV and AIDS
program that has just been drawn up to deal with prevention, treatment and care. (Beneficiary
families started sending their children as a result of assistance they get through the schemes.)
4.2.1.4 School-Feeding Program
The school-feeding program is one of the interventions designed to address the problems of
children who are in dire need of assistance. It is intended to enable vulnerable children to attend
school and continue their education without seasonal interruption to higher level. This program is
implemented in 1,200 schools selected throughout the country for having low enrollment and for
being in high-food insecure areas to reduce student dropouts and boost school performance.
Parents in the pastoral areas are also provided with incentives such as food and edible oil to send
their daughters to schools and attend at least 80% of the school days. Official records show that
the school-feeding program has contributed to the high enrolment rates and retentions in areas
where the program is properly implemented; however, there is a shortfall in responding to the
demand. It is also observed that there are challenges to fulfill the demand, which is much higher
than the available resources. Official reports further revealed that the Government, together with
the WFP, gives priority to “hot-spot areas” and, as a result, only 25% of the demand is covered.
To begin with, the school-feeding program is implemented in very few schools, as mentioned
above. Nonetheless, general observations and school-based assessments reveal that school
enrolment has gone up and dropout rates have declined as a result of the school-feeding program
in areas where the program is functional. However, there is no nationally conducted impact
evaluation that came out with a national representative data on school-feeding programs.
4.2.1.5 Assistance to Vulnerable Groups
Ethiopia has a National HIV/AIDS Policy that was adopted in 1998. The Policy deals extensively
with prevention, control as well as treatment aspects of HIV/AIDS. The National HIV/AIDS
Policy states that people with HIV/AIDS "shall not be subjected to special restrictions on
employment, education, access to public facilities, or housing". But the Policy does not embrace
specific guidelines regarding the problems of stigmatization and discrimination of children on
account of their HIV/AIDS status, that of their parents, or on account of their being orphaned by
AIDS. Though the general protection against gender-based discrimination in the Constitution and
other laws are noteworthy, there is a general lack of laws dealing with the treatment of child
victims specifically, and laws targeting non-discrimination aspects of children are also not put in
place (MoWA, 2009.)
There are 1.1 million people who are living with HIV/AIDS in Ethiopia, of which 14,140 are
children. Out of the total number of people living with the virus, 30% (336,160) require treatment
with ART. Furthermore, it is estimated that about 84,189 pregnant mothers are infected with
HIV/AIDS (HAPCO, 2010). Unlike other policies, the HIV/AIDS Policy has been mainstreamed
into the main activities of all ministries and government agencies at all levels, starting from the
99
federal level down to kebele’s. Therefore, the policy and strategy of HIV/AIDS is implemented
throughout the country by all government structures starting from the federal level down to the
grass-roots level, including private organizations and faith-based institutions. This is beneficial
for people living with the virus including children. Domestic and inter-country adoption is has
also been a coping mechanism through which orphans and abandoned children are supported.
Domestic adoption is an age-old tradition, known as Guddiffachaa, particularly among the
Oromo. In the traditional practice, a guddiffachaa child has all the rights to property inheritance,
name and other benefits, as a natural born child, and the practice is accepted socio-culturally for
the common benefit of the child and the guddiffachaa family. Currently few children are getting
this kind of service. Domestic adoption is practiced at a very minimal level and there is no
guideline that regulates domestic adoption and ensures whether it is in the best interests of the
child or not.
According to the 2010 annual report of HAPCO, there are 5.4 orphans in Ethiopia, of which
855,720 are estimated to have lost their parents due to HIV/AIDS. The report further explains that
provisions of necessary supplies like school materials to enable them to go to school, food and
shelter, income-generating activities (IGAs) and training in IGAs are required. The same report
further depicts that it was planned (2009/10) to provide 444,648 children with school materials, of
which 325,201 (73.1%) were beneficiaries. Similarly, 229,287 children (72.1%), out of the
planned 371,949, were provided with food and shelter; 43,843 (48.0%), out of the planned
91,264, were provided with IGAs, and 40,872 (35.6%), out of the planned 114,844, were
provided with IGA training. It can be concluded that, though there is an attempt to reach the
vulnerable children, some are not accessing the support for various reasons. For instance, about
6% (325,201) get school-material support and 4.2% (229,287) get support for food and shelter,
from the total of 5.4 million. Official records indicate that there are also many orphans and other
vulnerable children who are supported by the PEPFAR initiative through USAID.
Considering the total number of children who are in need of assistance, there are few children
who are currently getting residential care in Ethiopia. Only 6333 children of different ages are
beneficiaries of the residential care given by government, non-government, and faith-based
organizations in 87 child-care institutions. More than 2/3 of these institutions are run by nongovernment organizations (FHI, 2009). On the other hand, the head-count assessment of street
children in Addis Ababa revealed that there are 11,830 children living in the streets of Addis
Ababa (UNICEF, 2011). The same document indicates that, according to the Ministry of Labour
and Social Affairs, 150,000 children are living on the streets in different parts of the country,
about 60,000 of whom are found in Addis Ababa. Non-governmental actors estimate the number
of street children to be nearly 600,000 country-wide. At the level of non-governmental actors,
there are numerous NGOs, both of national and international origin, working on the promotion
and protection of the rights of children in the country. Given the limited resource the
governmental has, the role of NGOs in filling the gap in this regard proved to be significant,
100
particularly in awareness creation activities, the provision of essential services, and the training of
implementing partners at various levels. There are a lot of NGOs which support orphans and other
vulnerable children in different intervention programs: educational, psychosocial, health,
livelihood, food and nutrition, early childhood development, housing and shelter. However, there
is proper documentation as to the size of the available forms of support. One assessment done in
Addis Ababa and its surrounding showed that the major share of the intervention in the area of
OVC support, 23%, goes to educational support (HACI Ethiopia, 2006). The same assessment
identified OVC problems as being social, psychological, economic, institutional, and bottlenecks
related to policy issues.
Table 31. Distribution of organizations and children, by type of educational support
No. of org.
(N=115)
% of
org.
No. of children
(N=51114)
% of
children
Children
per org.
School uniforms
School fees
99
94
86.1
81.7
40,037
37,024
78.3
72.4
404
394
Tutorial support
62
53.9
21,258
41.6
343
Lab and resource center
31
27.0
10,648
20.8
444
Non-formal education
School feeding
26
24
22.6
20.9
10065
3,873
19.7
7.6
387
161
School materials
21
18.3
5,182
10.1
247
Sponsorship
2
1.7
158
0.3
79
Pocket money for college
students
1
0.9
6
0.0
6
Educational support
Source: HACI Ethiopia, 2006, p. 16
As can be seen from Table 31 above, 51,114 orphans and other vulnerable children are provided
with different types of educational support. Some children are getting more than one type of
support. Such support enables the children to attend school and reduces the number of children
who are out of school due mainly to luck of financial and educational support. As the table shows,
72.4% of the children are provided with school fees, while 78.3% are getting school uniforms.
Provision of tutorial sessions for such children has a great impact on their educational
performance and helps them to keep up with other children. Though there are no available data
that show existing educational support in different parts of the country, it can be assumed that
many children are provided with multi-faceted support that would contribute to the efforts
underway to solve the problems of out-of-school children and exercise inclusive education.
4.3 Impacts of Social Protection Programs on Education in Ethiopia
Education is a basic development indicator, and both national and international instruments give
due attention to the enjoyment of equal access to education by boys and girls, and by rural and
urban residents. According to Article 28 of the Convention on the Rights of the Child, to which
101
Ethiopia is a signatory, parties recognize the rights of the child to education, and with the view to
achieving this right progressively and on the basis of equal opportunity, they shall, in particular,
make primary education compulsory and available free for all. Similarly, the African Charter on
the Rights and Welfare of the Child underlined that parties to the present charter shall take all
appropriate measures with a view to achieving the full realization of the right to education and
shall, in particular, provide free and compulsory basic education. In both conventions inclusive
education and the removal of financial obstacles are considered as crucial factors in order to
achieve free and compulsory education and ensure that all children have access to primary
education.
The need to eliminate stereotypes in education, the reduction of dropout rates, and tackling all
legal and other measures necessary to provide effective protection against gender-based violence
in schools are areas that received attention in all national policy documents intending to address
issues of education at all levels. It goes without saying that laws, policies, and programs initiated
to improve the livelihood of citizens would have impacts in different sectors based on the nature
of the issues dealt with by each sector. Social protection programs usually aim to improve child
welfare through positive effects of increased household income, which, in turn, increases school
participation and reduces child labour. However, public work programs through which poor
families earn income may sometimes increase the demand for child labour in the household. In
case of Ethiopia, however, public work in the PSNP increased school attendance of children. The
PSNP had positive effects on the schooling of boys for households that received Birr 90 (as
initially planned) per household member from participating in public work regularly. Official
records indicate that, as a result of the public work, households income has moderately increased
and, in effect, agricultural labour hours and domestic labour hours have moderately reduced for
boys, while the result is not satisfactory for girls, especially for younger girls. Restricting the
beneficiary sample to those that earn at least 90 Birr per house member shows that the program is
much more effective in improving child welfare when payments are near the level intended in the
program design. As a result, school attendance rates increased substantially for boys and girls
aged 11-16 years (John, Daniel, and Alemayehu, 2009).
Ethiopia’s progress in education demonstrated the sustainable government-led efforts to reduce
poverty and expand the public education system equitably, backed by relatively huge resources
and improved service delivery systems both at federal and regional level that dramatically
resulted in school expansion and increase in enrolment. In 1992, four out of five primary-age
children were not in school, but this figure dramatically reduced to one in five in 2010. The
improvement in education is real in most regions, except for the two pastoralist dominated regions
of Afar and Somali (Jakob and Rose, 2010). The same report confirmed that educational progress
in Ethiopia has coincided with substantial reduction in poverty and rapid improvement in food
security, health and nutrition. The priorities given to education are expected to be translated into a
number of strategies targeted at increasing access to schooling for all Ethiopians and particularly
102
for marginalized groups such as girls, orphans, the rural poor, and children of pastoralist
communities. It is true that there is a close correlation between poverty among families and low
level of education among children.
The school-feeding program which is currently implemented in 1200 selected schools throughout
the country has had a remarkable impact on getting children to school and retaining them there.
As a result of the implementation of the school-feeding program, enrolment rate of children is on
the increase. However, due to resource constraints, the program is not in a position to respond to
the existing demands, which is so high in many parts of the country. Major steps taken to
encourage child enrolment like abolishing school fee for primary and secondary schools; supplyside measures such as availing the necessary infrastructure, especially in rural area; alternative
basic education for out-of-school children in remote areas; mobile schools in pastoralist areas; and
school-feeding programs are of great importance in addressing the problem of out-of-school
children of different dimensions. Different types of support provided by non-governmental
organizations in different parts of the country are also of paramount importance in reducing the
number of out-of-school children and maintain them in school. As it is mentioned in the
preceding chapters, the progress made in the provision of social services such as education, health
and other pro-poor sectors by spending huge amounts of the government budget, no doubt, had
impacts on school enrolment and attendance rates as well.
Fast economic growth over the last five years has contributed much to the reduction of the
incidence and severity of poverty in the country. Poverty is declining to an estimated 29.2% in
2009/20109 (Ethiopia - United Nations Development Assistance Framework, 2011). The same
report revealed that, as a result of the overall reform made in the country, the gross enrolment rate
(GER) for primary school (1-8) reached 95.9 and the net enrolment rate (NER) reached 89%. The
increase in coverage was also accompanied by an increase in retention and a decrease in dropout
rates.
The Labour Law Proclamation, No. 377/2003, Article 89, has also provisions which tend to
promote the best interests of the child. It prohibits employment of children below the age of
fourteen. Such prohibition is intended to provide an opportunity for such children to complete
their primary education prior to joining the labour force. Since, in a modern society, education is
believed to be a source of career development, it is in the child’s best interest to undertake such
protective measures. Moreover, even for employees within the age range of fourteen and eighteen,
they are not allowed to work at night, on public holidays, on weekly rest days, and overtime. They
are not also to be assigned in weight-lifting, underground work and other hazardous activities, and
their regular daily working hours are set to be one hour less. The employment of children between
ages 14 and 18 is subject to various safeguards and conditions (Tilahun and Yonas, 2010).
Despite all such efforts and achievements, government intervention in education is not effective
enough to reach the most vulnerable sections of the society. For instance, orphans and children
103
coming from poor families could not attend classes because of their inability to purchase school
uniforms, books and also for the reason that many do not even get adequate food (MoLSA, 2011).
The same report states that in most cases there are no educational facilities for children in special
circumstances (children with various disabilities and special needs). However, it is very
encouraging to observe that alternative basic education strategy has been put in place for out-ofschool children. This strategy is being implemented to address the problem of children who have
no chance of joining formal school. All these initiatives have had observable impacts though the
success is limited for various reasons including poor coordination and integration, and inadequate
funding which hamper the effort to reach all intended beneficiaries as required, especially in the
marginalized areas.
4.4 Cross-sectoral Approach in Program Implementation
Many of the policies and programs in which social protection issues have been incorporated have
stated the need for multi-sectoral participation in realizing the goals of the policies/programs.
However, this has not been done and responsible government ministries lacked a legally defined
mandate to coordinate other line ministries as required. Similarly, the duties and responsibilities
of other concerned ministries and structures at different levels were not clearly defined as far as
coordination is concerned. Effective implementation requires the involvement of a lot of actors at
federal or regional levels and of public or private nature. To the extent that the activities of all
these actors are not coordinated, the intervention will be fragmented and will fail to bring about
the intended results. At times there could be duplication and wastage of resources. Thus, a
coordinated and holistic approach is the recommended fashion of operation. The establishment of
an autonomous organ with the necessary capacity and power of coordination would be an asset in
undertaking programs designed to address public concern (MoWA, 2009).
Coordination is essential to create synergy in service delivery, to avoid duplication, and to bring
about effectiveness. It is an essential part of making government work for citizens because
invariably many departments provide services for different targets and have an impact on the
realization of policies and/or programs. The obligations inherent in social protection as a multisectoral issue are, however, not well recognized by relevant sectors that have a substantial impact
on education, health, welfare and so on. This coordination problem is confirmed by one third of
the key informants in the sample regions. The mandate of the coordination mechanism should,
thus, be well defined to address all relevant areas affecting all issues of protection programs. It is
also essential to define or redefine the purpose of coordination and collaboration between the
different government ministries and departments. The purpose will, in turn, indicate which
government ministries are most needed and appropriate to make the implementation effective. It
is also important for the coordination mechanism to raise consciousness of common interests,
develop opportunities for collective action, and create unity of purpose. However, the sample key
informants underlined that there is lack of understanding and awareness among concerned actors
104
as to the importance of coordination and coordinated efforts to make social-protection-related
policies and strategies a reality in the country.
4.5 Financial Expenditure for Social Protection Programs
According to the Ministry of Finance and Economic Development, there are 3 channels of
government expenditure on SP. Detailed fiscal data is not available on channels 2 & 3 for SP
expenditure. Therefore, the analysis focused only on channel 1. Channel 1 resources are raised
from the national treasury and are core components of the national budget for SP.
Table 32. Channel 1 expenditure on social-protection-related interventions
Fiscal year
Basic social services
Education Health
Water
Social Humanitarian
All other
welfare
Response
Expenditures
Justice
2001/02
2714.32
797.67
419.55
333.28 311.48
1344.00
4418.02
2002/03
3776.20
891.74
74.50
235.93 817.69
557.17
12071.42
2003/04
2004/05
4448.97
4527.69
837.77
1944.44
316.87
149.98
408.84 142.98
471.88 307.78
373.25
220.52
15997.65
18313.33
2005/06
6148.72
1418.70 1164.80 329.75 278.69
120.83
20678.37
2006/07
2007/08
8069.02
9715.92
1338.64 554.29 448.08 145.89
2050.35 1216.58 747.52 204.02
68.07
75.83
22664.67
29298.2
Source: Daniel, 2010, p. 22
As it can clearly be seen from Table 32, the budget allocated to social-protection-related sectors
has been increasing throughout the identified fiscal years. Although the expenditures are
distributed to different sectors, it is difficult to identify the share of social protection programs as
there is no social protection expenditure as such. While social protection programs are run at
different levels by different institutions including both government and non-governmental
institutions, from the data in the above table, it is only possible to describe the budget and
expenditure of the different sectors like education, health and other national programs. The funds
for the existing programs that serve social protection purposes have been obtained from diverse
sources including government budget and support by civil society organizations and international
funding agencies. The productive safety net program is funded by different international donor
groups, with the lion’s share coming from the World Bank,.
Generally, the social protection programs and policies/strategies mentioned in this part of the
report are not coordinated and, hence, are left to several government ministries for their
implementation. So far, there has not been a solely responsible coordinating body as far as social
protection is concerned, though MoLSA is considered in various ways to be a leading ministry in
the area of social protection.
105
4.6 Analytical Summary
Though there are policies and program initiatives that are implemented to help people not to fall
into poverty but rather to escape from it, Ethiopia has not yet developed comprehensive and
integrated social protection systems with adequate implementation strategies and plans of action.
Fragmented efforts that the government has made so far through different pro-poor interventions
including legal and policy reforms have not yet reduced vulnerability and poverty. According to
the 2008 UNDP report, 39% of the people are unable to meet basic nutritional and non-food
needs.
Official documents reveal that the head count, poverty gap, and poverty severity indices in
2004/2005 for rural areas were lower than the levels five years before. Of course, there were a lot
of efforts made through different reforms and initiatives to improve the livelihood of all citizens
including vulnerable segments of the population, i.e., children and women, although issues of
gender and children, which, by their nature, demand for multi-sectoral participation, have not
been mainstreamed into the plans and strategies of relevant institutions operating at different
levels (MoFED, 2011). This absence of synergy between policies has jeopardized the
implementation of programs and has resulted in insignificant improvements of people’s
livelihood.
The leading agency in the area of social protection is assumed to be the Ministry of Labour and
Social Affairs (MoLSA) at a federal level and similar departments of the regional bureaus of the
same sector. But the sector has no appropriate structure down to the grassroots where social
protection programs are actually implemented. On the other hand, some of the policies that
happen to address social protection issues of the vulnerable sections of the society are out-dated
and need to be revised in order to incorporate emerging issues in the sector. For instance, the
Developmental Social Welfare Policy, which is currently under revision, had no appropriate
provision for HIV/AIDS, which is a serious problem not only for Ethiopia, but for all developing
nations as well. Furthermore, as a result of the ineffective coordination mechanism, the policy
became out-dated without bringing about any tangible results in the lives of the target groups
expected to benefit from the policy. Therefore, the coordination of policies and strategies is
required for common efforts by various government and non-government organizations to bear
fruits in realizing protection programs in all sectors. This, however, requires an immediate
response by the concerned institution of the Government.
The non-existence of birth registration has also become one of the challenges in the realization of
the rights and protections of the child in Ethiopia. It is understood that birth registration is the first
ticket of the child to existence and is considered under Article 7 of the Convention on the Rights
of the Child. The 2000 Revised Family Code called for the establishment of a birth (and marriage)
registration system to be started within six months, but to date this has not materialized. Another
point that needs due attention to ensure the rights of vulnerable children is the issue of inter-
106
country adoption. In order to make inter-country adoption work to the best interests of the child,
Ethiopia should consider accession to the Hague Convention on Protection of Children and
Cooperation in respect of Inter-country Adoption. Membership in such conventions will enable
the country to have regular access to reliable information not only about the would-be adoptive
parents but also about the adopted child once it entered the territory of the receiving state. As
soon as Ethiopia accedes to the said Convention, it is recommended that “inter-country adoption
arrangement, if at all to be undertaken, be limited to countries which are signatories to the same
Convention only” (MoWA, 2009 p. 48).
Though the country has taken remarkable steps in enacting laws and issuing relevant policies and
strategies that have a bearing on the plights of all citizens in general and vulnerable sections of the
society in particular to build resilience and respond to shocks and emergencies, there are still gaps
with regard to consolidating child law and child protection policies. As Daniel (2010) noted, it is
widely recognized that the pro-poor strategies adopted by successive PRSPs have significantly
reduced the urban/rural, rich/poor, male/female divide that has existed in relation to basic social
services. However, there is a need to establish the extent to which available demand side
interventions have enabled the poorest of the poor to have equitable access to basic social
services.
Experience has shown that the Ethiopian social protection strategies mainly focus on protection
interventions rather than preventive programs, which aim at creating conditions that would enable
the target to cope with the incidence before they fall into shock and vulnerability. Therefore, there
is a need to put in place interventions of all types of the broad categories of social protection,
including educational support, so as to build the capacity of families so that they would be able to
send their children to school and keep them there. If social protection is to be implemented in its
true sense, the current approach of reactive and localized poverty reduction, which is poorly
coordinated, except for the productive safety net program, has to be changed to pro-active,
predictable and nation-wide poverty reduction initiatives led by a designated ministry.
107
CONCLUSIONS
Based on the major findings of this study, the following conclusions are drawn and
recommendations forwarded.
The analysis of the profiles of excluded children in Ethiopia revealed that only about 11% of preprimary school-age children attend education at pre-primary and primary schools. The findings
further indicated that, even though high gross and net enrolments are recorded at national level,
over three million children of primary and lower secondary age are still out of school.
As far as education barriers and bottlenecks are concerned, violence against children and genderbased violence, early marriage, and wrong attitudes towards children with disabilities, household
poverty, being orphan, indirect costs of education, seasonal factors, child labour, inadequate
supply of basic services such as textbooks and teaching/learning materials, absence of separate
latrines for boys and girls, absence of easily accessible services for children with disabilities,
weak partnership with NGOs and CSOs in addressing problems of OOSC, lack of quality of
education, absence of comprehensive data on the profiles of OOSC, and inequitable resource
allocation are found to be among the major socio-cultural, economic demand side, supply side,
governance, and capacity barriers and bottlenecks that require the attention of policy makers.
Review of the available policy documents and strategies unveiled that the issue of out-of-school
children in terms of the five dimensions of exclusion (5DEs) is not emphasized in the Ethiopian
education system. Although the recently launched Education Sector Development Program
(ESDP IV) includes a detailed discussion on improving equity and access in general education, it
does not consider particularly those children who are in primary and lower-secondary schools but
are at risk of dropping out of schools (Dimensions 4 and 5) as one of the challenges of the
education system. This indicates that the issue of excluded children is not fully addressed in our
education system. It was also observed that, although the country has had its own education and
training policy as of 1994, it lacks an educational law which serves to enforce education-related
policies and standards; authority, responsibility and accountability of stakeholders; and rights of
children excluded from educational opportunities.
With regard to social protection systems, it was uncovered that Ethiopia has not yet developed
comprehensive and integrated social protection systems with adequate implementation strategies
and plans of action though there are policy and program initiatives that are implemented to help
people not to fall into poverty but rather to escape from it. Fragmented efforts that the government
has made so far through different pro-poor interventions including legal and policy reforms have
not yet reduced vulnerability and poverty.
108
Recommendations
Policies and strategies for supporting out-of-school children in Ethiopia and closing the remaining
net enrolment gaps will require making hard decisions by policy makers, particularly given the
current context of inequity and inefficiencies. Addressing the five dimensions of out-of-school
children (OOSC) will also require a much stronger policy framework for bridging the resource
divide, which has primarily focussed on supply side policies without adequate attention to the
demand side barriers and bottlenecks to OOSC. New approaches to addressing the 5DEs will also
require short-term and longer-term policies which attempt to address the structural inequities
which characterise the out-of-school children’s profile.
Hence, the Ministry of Education and Regional Education Bureaus , in collaboration with other
stakeholders, should make a concerted effort and take appropriate actions in order to solve the
barriers and bottlenecks related to out-of-school children and enable the education system attain
UPE by 2015. To this effect, the following courses of action are recommended by the country
study team:
1.
2.
3.
4.
5.
A concerted nation-wide effort should be made to identify those children who have
dropped out and those who are at risk of dropping out and search for the means to help
these children continue their education.
Due attention should be given to providing children with textbooks and other learning
materials; fulfilling basic facilities such as drinking water and separate latrines; and
making schools suitable for children with disabilities.
The current increasing enrolment trend must be maintained by encouraging two targets
of the population. Firstly, those children at the primary age group should be able to
attend formal education continuously. Secondly, those children above the age of 14 need
to be enrolled in school as much as possible by age 17. Side by side, strategies ought to
be designed to decrease dropout and repetition rates. Moreover, appropriate strategies
must be designed to address the needs of the pastoralist/semi-pastoralist communities in
general and vulnerable children in particular.
Pre-primary education need to be expanded both in the formal and non-formal school
readiness programmes as it has a contribution to decreasing dropouts and improving
learning achievements in primary. It will also minimize the late entry into the first grade
of primary school, which is a major barrier to achieving universal primary education, as
children who start school late are more likely to drop out before they complete the cycle.
Alternative modes of delivery of education need to be initiated in order to address the
education of late entrants
109
6.
A series of discussions should be held with the community regarding the benefits of
education and the rights of children. The issue of OOSC should also be advocated in
such discussions.
7.
Back to school campaign need to be intensified in a sustainable and systematic way so
that who dropped out of school re-enter and continue their education. Committees that
will work on returning OOSC to school should be established in all schools and these
committees should be supported.
8.
Solutions for addressing the problems of those children who are already out of school
will need to be integrated with the issue of addressing the needs of children at risk of
dropping out of primary and lower-secondary schooling over the next four years.
In order to remove gender-based violence and bring about behavioral change in schools
and communities at large, advocacy work should be done consistently. Moreover,
sensitization and other behavioral change communication training should be given to
teachers, students and community members on laws, rules and regulations issued by the
government in relation to violence against children.
Teachers should be trained on how to handle children with disabilities and the society
should be sensitized to avoid stigma and discrimination in this regard.
Partnership with national and international NGOs and CSOs should be strengthened in
order to address the problems related to OOSC.
Tracking the dimensions of exclusion requires new systems of capturing OOSC data,
along with better tracking systems of those who are likely to drop out. Hence, EMIS data
collection formats should be upgraded to capture data on the profile of OOSC, the
marginalized and the disadvantaged to facilitate monitoring on their access and
integration in mainstream schools and progress.
There should be stronger relationships between the Ministry of Education, the Central
Statistics Agency, the Ministry of Health, and other relevant institutions to ensure that
vital data on the OOSC profile is collected through the census, the demographic health
survey, and poverty-related studies. This collaboration will also help to coordinate work
and refine indicators on OOSC in the country.
Political, religious and community leaders should work closely with the respective
government officers in order to reduce the number of OOSC.
Better strategic approaches and much closer collaborations among the Ministry of
Education and similar ministries in other African countries with high rates of OOSC are
needed to learn from their best practices and address the problems of OOSC in the
country.
There is a need to put in place comprehensive and integrated social protection systems
with adequate implementation strategies, plans of actions, and budgets so as to fully
address vulnerability and poverty.
9.
10.
11.
12.
13.
14.
15.
16.
110
17. A national orphan support program with an adequate budget should be put in place so as
to address the problem of this section of the society.
18. Re-activating socio-cultural values that promote support in times of crisis and shock
would play a crucial role in building resilience to emergencies. This type of community
support mechanisms have to be brought on board in a new approach.
19. Abolishing primary school fees has helped reduce costs, but has not removed the cost
barrier to enrolment for the poorest. Non-fee costs, such as school uniforms and supplies,
can be substantial, particularly for poor households, and require additional solutions. In
this regard, it may be essential to initiate and strengthen social protection policies to help
households send children to school. This includes targeted scholarships to offset
education costs; conditional and unconditional cash transfers by way of providing cash
grants to poor households that meet criteria such as school attendance; or unconditionally
for certain population groups.
111
REFERENCES
Abebech Gobena. (2010). Annual Report on the Performance of Abebech Gobena Yehetsanat
Kibikabenna Limat Mahiber, Addis Ababa.
African Charter on the Rights and Welfare of the Child. (1990). Addis Ababa.
African Child Policy Forum. (2008). The African Report on Child Wellbeing: How Child-friendly
are African Governments? Addis Ababa, Ethiopia.
African Union. (2008). Social Policy Framework. Windhoek, Namibia.
Al-Samarrai S. (2003). Financing Primary Education for All: Public Expenditure and Education
Outcomes in Africa. University of Sussex.
Ayalew Shibeshi. (2010). Investing in Boys and Girls in Ethiopia: Past, Present and Future
(Education). Addis Ababa: MoFED and UN.
Benoit, D.†and Rajshri, J. (2003). Determinants of School Attendance in Indian Villages: Do
Contextual Effects Matter?
Bulder J. (2007). Country Analysis of Education, Ethiopia.
Cennet, E., Demir, E., and Sevil, U. (2006). The Relationship between Work, School Performance
and School Attendance of Primary School Children in Turkey. Paper presented at the
European Conference on Educational Research, University of Geneva.
Central Statistics Agency. (2008). Population Census of 2007. Addis Ababa, Ethiopia.
CfBT Education Trust on Behalf of the DAG Secretariat UNDP. (2008). Study into Utilization in
the Regions of Ethiopia (STURE), Addis Ababa.
Dang, K. T. and Pelleriaux, K. (2006). Equity in Education, Thematic Review, Country
Analytical Report. University of Antwerp. Belgium.
Daniel Hailu. (2010). Investing in Boys and Girls in Ethiopia: Past, Present and Future (Social
Protection). Addis Ababa: MoFED and UN.
Deb Partha. (2004). Determinants of Child Labour and School Attendance: The Role of
Households Unobservable, Addis Ababa.
Degenet Abebaw, Andinet Delegen and Assefa Admassie. (2007). Determinants of Child
Schooling Progress in Rural Ethiopia. Proceedings of the 5th International Conference on the
Ethiopian Economy. Ethiopian Economic Association, Addis Ababa.
Department for International Development/DfID. (2011). Social Assessment for the Education
Sector, Ethiopia. Addis Ababa, Ethiopia.
Derebssa D. (n.d). Quality Teaching and Learning in Ethiopian Primary Schools: Tension
between Traditional and Innovative Teaching-Learning Approaches. (from the Internet).
112
Devereux, S. and Bruce G. (2009). Research Report 57. Vulnerable Livelihood in Somali Region,
Ethiopia. Institute of Development Studies (IDS), (retrieved from the Internet).
Dryden S. (2010). Barriers to Accessing Primary Education in Conflict-Affected Fragile States:
Literature Review. International Save the Children Alliance, University of Toronto.
EconStatt: Ethiopia. (2011). World Economic Outlook, IMF.
Eldis. (2011). Social Protection and Education. (from the Internet).
Ethiopia: United Nations Development Assistance Framework (2012-2015). (2011). Addis
Ababa.
Family Health International - Ethiopia, Ministry of Women’s Affairs, UNICEF. (2009).
Improving Care Options for Children in Ethiopia through Understanding and Preventing
Institutionalization. Addis Ababa.
Fantini, E. (n.d). State Formation and Capacity in Ethiopia, University of Turin.
FDRE. (1995). Federal Democratic Republic of Ethiopia Constitution. Addis Ababa.
FDRE. (2000). Revised Family Code Proclamation. Addis Ababa.
Gibbons, E. D., Friedrich, H., and Edilberto, L. (2005). Changing Educational Aspirations of
Children Living in Poverty in Ethiopia. UNICEF, New York.
Giovannetti, G. and Sanfilippo M. (2011). Social Protection in Sub-Saharan Africa: Learning
from Experience. www.voxeu.org/
Guday Emirie. (2005). Early Marriage and Its Effects on Girls’ Education in Rural Ethiopia: The
Case of Mecha Woreda in West Gojjam, North-Western Ethiopia. Unpublished PhD Thesis,
Georg-August University of Goettingen.
Hammond, C., Dan L., Jay S., and Sam D. (2007). Dropout Risk Factors and Exemplary
Programs: A Technical Report. Clemson, SC: National Dropout Prevention Center.
HAPCO. (2009/10). Annual Performance Report. Addis Ababa.
Harry, A. Sackey (2007). The Determinants of School Attendance and Attainment in Ghana: A
Gender Perspective. AERC Research Paper 173 African Economic Research Consortium,
Nairobi.
Hunt, F. (2008). Dropping out from School: A Cross Country Review of Literature.
ILO. (2003). Social Protection, Geneva.
IMF. (2011). World Economic and Financial Surveys. World Economic Outlook.
IMF. (2010). World Economic and Financial Surveys. Regional Economic Outlook.
Jakob, E. and Rose, P. (2010). Ethiopia’s Progress in Education - A Rapid and Equitable
Expansion of Access. (from the Internet).
113
Jacomy, S. (2008). Reporting on Violence against Children: A Thematic Guide for Nongovernmental Organizations Reporting to the UN Committee on the Rights of the Child.
NGO Group for the Convention on the Rights of the Child. Geneva.
Jeilu Oumer. (n.d). The Challenges of Free Primary Education in Ethiopia. Addis Ababa
University.
Jennifer, S. M. (2006). What Community Participation in Schooling Means: Insights from
Southern Ethiopia (From the internet).
Jennings, M., et al. (2011). Social Assessment for the Education Sector. Addis Ababa, Ethiopia.
Department for International Development.
John, Hoddinott, Daniel O. Gilligan, and Alemayehu Seyoum. (2009). The Impact of Ethiopia’s
Productive Safety Net Program.
Lopez, J., Moumié Maoulidi, and MCI. (2009). Education Needs Assessment for Mekelle City,
Ethiopia.
May, A. Rihani. (2006). Keeping the Promise: Five Benefits of Girls’ Secondary Education.
Academy for Educational Development.
Ministry of Education. (1994). Education Sector Strategy. Addis Ababa.
Ministry of Education. (1994). Education and Training Policy. Addis Ababa.
Ministry of Education. (1998). Education Sector Development Program I (ESDP I). Addis Ababa.
Ministry of Education. (2002). Education Sector Development Program II (ESDP II). Addis
Ababa.
Ministry of Education. (2005). Education Sector Development Program III (ESDP III). Addis
Ababa.
Ministry of Education. (2006). Joint Review Mission Report on Education Sector Development
Program (ESDP) III. Addis Ababa, Ethiopia.
Ministry of Education. (2008). General Education Quality Improvement Program (GEQIP). Addis
Ababa.
Ministry of Education. (2010). Education Sector Development Program/ESDP IV (2010/20112014/2015) Program Action Plan/PAP. Addis Ababa.
Ministry of Education. (2010). Education Statistics Annual Abstract. Addis Ababa.
Ministry of Education (n.d). Reaching the Marginalized: Reflections from Ethiopia. (from the
Internet).
Ministry of Finance and Economic Development. (2006). A Plan for Accelerated and Sustained
Development to End Povery – PASDEP 2005/06-2009/10. Addis Ababa.
Ministry of Finance and Economic Development. (2010). Growth and Transformation Plan 2010/11-2014/15. Volume 1. Main Text. Addis Ababa.
114
Ministry of Finance and Economic Development. (2010). Ethiopia: 2010 MDGs Report: Trends
and Prospects for Meeting MDGs by 2015. Addis Ababa.
Ministry of Labour and Social Affairs. (1996). Developmental Social Welfare Policy. Addis
Ababa.
Ministry of Labour and Social Affairs. (2004). Ethiopia’s National Plan of Action for Children
(2003-2010 & beyond). Addis Ababa.
Ministry of Labour and Social Affairs/UNICEF. (2011). Report on the Revision of the
Developmental Social Welfare Policy of Ethiopia. Addis Ababa.
Ministry of Science and Technology. (2002). Green Paper: The National Science, Technology and
Innovation Policy - Building Competitiveness through Innovation.
Ministry of Women’s Affairs. (1994). OVC Plan of Action. Addis Ababa.
Ministry of Women’s Affairs. (2009). Assessment Report on Coordination Structures Established
by the Government for the Implementation of Child Rights. Addis Ababa.
Ministry of Women Affairs (2009). Review and Analysis of Domestic Child Labour vis-a-vis
International Conventions, Guidelines, Covenants and Procedures, Addis Ababa.
National Bank of Ethiopia. (2009). Annual Report. Addis Ababa.
Nazmul, C., Luc, C., and Mohammad N. A. (2006). Schools, Household, Risk, and Gender:
Determinants of Child Schooling in Ethiopia. The World Bank and ESRC Centre on SKOPE,
Oxford University.
O. A. Ajala and Kerebih Asres. (2008). Accessibility in Equality to Basic Education in Amhara
Region, Ethiopia.
Obayelu, A. E. and Victor, O. (n.d).Analysis of Child Labour and School Attendance in Nigeria:
The Present and Future Implications, a Conference Paper, University of lbadan, lbadan. Oyo
State, Nigeria
Orbeta, A. C. and M. Alba M. (1999). A Probit Model of School Attendance for Children 7 to 14
Years Old. MIMAP Research Paper, No. 20. Ottawa, Canada.
Paola, Pereznieto and Nicola, Jones. (2006). Educational Choices in Ethiopia: What Determines
whether Poor Children Go to School? Young Lives Policy Brief 2. UK.
PASDEP Implementation Report Presented on the Annual Progress Review Meeting. (2008).
Addis Ababa.
People in Need in Ethiopia. (2009). A Study on the Situation of Child Labour in Ethiopia: Review
of Existing Studies and Brief Assessment. Addis Ababa. (from the Internet).
Population Council Inc. and UNFPA – Ethiopia. (2010). Ethiopia Young Adults Survey: A Study
in Seven Regions. Addis Ababa.
Population Council Inc. and UNFPA – Ethiopia. (2010). Ethiopia Gender Survey: A Study in
Seven Regions. Addis Ababa.
115
Prospects, Challenges and Policy Options of Ethiopian Educational System towards the
Achievement of EFA Goals (undated).
Pullum, T. W. and Greenwell K. F. (2009). Orphanhood, Household Composition, and Child
Outcomes in Sub-Saharan Africa. Morocco.
Raja, B. K. and Burnett, N. (2004). User Fees in Primary Education. Education Sector, Human
Development Network. World Bank.
Ravishankar, V. J., Abdulhamid Kello, and Alebachew Tiruneh. (2010). Ethiopia - Education
Public Expenditure Review, Ministry of Education, Addis Ababa.
Report on Gender Relation in Ethiopia. (2005). Addis Ababa.
Roschanski, H. (2007). Deprived Children and Education: Ethiopia. IREWOC (International
Research on Working Children) (from the Internet).
Save the Children Denmark, Ministry of Women’s Affairs, and Ministry of Education. (2008). A
Study on Violence against Girls in Primary Schools and Its Impacts on Girls’ Education in
Ethiopia, Addis Ababa, Ethiopia.
Schaffner, J. A. (2004). The Determinants of Schooling Investments among Primary-SchoolAged Children in Ethiopia: Background Paper for the 2004 Ethiopia Education Country
Status Report. Africa Region Human Development Working Paper Series. Africa Region,
World Bank.
Schaffner, J. A. (2005). The Determinants of Primary School Enrollment in Ethiopia: Evidence
from Three Household Surveys. Proceedings of the 2nd International Conference on the
Ethiopian Economy, Volume I. Alemayhu Seyoum, et al. (ed). Ethiopian Economic
Association. Addis Ababa.
Tassew Woldehana, Nicola, J., & Bekele T. (2006). Children’s Educational Completion Rates and
Dropouts in the Context of Ethiopia’s National Poverty Reduction Strategy. (from the
Internet)
Tassew Woldehana. (2009). Children’s Educational Completion Rates and Dropouts in the
Context of Ethiopia’s National Poverty Reduction Strategy. Proceedings of the 6th
International Conference on the Ethiopian Economy, Volume 1, Ethiopian Economic
Association, Addis Ababa.
Taylor, Brown and Amdissa Teshome. (2007). Implementing Policies for Chronic Poverty in
Ethiopia, UK.
Tietjen K. (1998). The Demand for Primary Schooling in Rural Ethiopia. Technical Paper No. 87,
USAID.
Tilahun Teshome and Yonas Birmeta. (2010). Investing in Boys and Girls in Ethiopia: Past,
Present and Future (Legislative Framework). Addis Ababa: MoFED and UN.
116
Tilahun Teshome and Yonas Birmeta. (2010). Investing in Boys and Girls in Ethiopia.: Past,
Present and Future (Children and Women Protection). Addis Ababa: MoFED and UN.
UNESCO. (2010). Education for All Global Monitoring Report 2010: Reaching the Marginalized.
www.unesco.org
UNICEF. (2008). Social Protection in Eastern & Southern Africa: A Framework and Strategy for
UNICEF.
UNICEF. (2010). Child-Friendly Schools - Case Studies: Ethiopia. (from the Internet).
UNICEF. (2011). Head Counting of Street Children in Addis Ababa & Adama.
UNICEF and UNESCO Institute for Statistics (UIS). (2011). Global Initiative on Out-of-School
Children: Conceptual and Methodological Framework (CMF). New York and Montreal:
UNICEF and UIS.
United Nations Department of Economic and Social Affairs/Population Division. (n.d.). The
Impact of AIDS on Education, New York.
VIS. (2009). International Conventions, Guidelines, Covenants, and Procedures. Addis Ababa.
World Bank. (2004). Education in Ethiopia: Strengthening the Foundation for Sustainable
Progress.
World Bank. (2009). Abolishing School Fees in Africa: Lessons from Ethiopia, Ghana, Kenya,
Malawi, and Mozambique.
World Bank. (2009). Six Steps to Abolishing Primary School Fees: Operational Guide.
Yisak Tafere. (2010). Changing Educational Aspirations of Children Living in Poverty in
Ethiopia. Young Lives, UK.
117
ANNEXES
Annex 1: Tables
Table 33: Education expenditure in millions Birr by year
Year
1998 (2005/06)
1999 (2006/07)
2000 (2007/08)
2001 (2008/09)
2002 (2009/10)
Education expenditure
5,999.6
7,632.1
9,372.9
11,340.7
15,719.3
All Gov. expenditure
33,615.9
30,998.2
41,070.9
48,036.2
61,958.9
Source: EMIS, 2010
Table 34: Number of schools and sections in Primary Schools (grades 1-8)
2004/05
Region
2009/10
Change in %
Number of
Number of
Number of
Number of
Number of
Number of
Primary School Sections Primary School Sections Primary School Sections
Tigray
1,232
14,031
1,955
21,532
59%
53%
205
1,021
366
2,106
79%
106%
Amhara
4,059
41,584
6,610
72,550
63%
74%
Oromia
6,466
60,967
10,742
90,917
66%
49%
Somali
715
2,187
855
2,670
20%
22%
Afar
Ben.-Gumuz
312
2,244
365
2,660
17%
19%
2,866
30,913
4,956
51,443
73%
66%
Gambella
162
784
205
1,270
27%
62%
Harari
50
525
58
1,003
16%
91%
Addis Ababa
367
6,760
723
9,902
97%
46%
Dire Dawa
79
779
116
1,361
47%
75%
16,513
161,795
26,951
254,744
63%
57%
SNNPR
Total
Table 35: Pupil-Section Ratio
Region
PupilSection
Ratio
National Tigray Afar
57.4
45.5
41.4
Amhara Oromia Somali
49.6
60.2
39.8
Source: EMIS 2010
118
Ben.SNNP Gambella Harari
Gumuz
57.1
65.4
61.8
34.8
Addis
Ababa
Dire
Dawa
39.1
43.6
Table 36: Schools that have libraries
Number
of schools
Number of
libraries
% of schools that
have library
1955
366
6610
10742
855
365
4956
205
58
723
116
883
56
2743
3835
46
81
1710
21
40
597
38
45.2%
15.3%
41.5%
35.7%
5.4%
22.2%
34.5%
10.2%
69%
82.6%
32.8%
Tigray
Afar
Amhara
Oromia
Somali
Benishangul-Gumuz
SNNPR
Gambella
Harari
Addis Ababa
Dire Dawa
Table 37: Spending per student (PPP US$)
Primary Education, 2008
Region
Enrolled
students
Tigray
992,917
244.95
246.7
70.59
83,018
62.64
754.54
215.89
Amhara
4,074,715
864.54
212.17
60.71
Oromia
5,541,919
1242.61
224.22
64.15
Somali
328,220
12.40
37.78
10.81
Benishangul Gumuz
165842
62.88
379.16
108.49
3,456,765
733.57
212.21
60.72
Gambella
79,428
30.81
387.90
110.99
Harari
38,948
18.05
463.44
152.6
521,506
173.17
332.06
95.01
57,508
36.44
653.56
181.30
Afar
SNNPR
Addis Ababa
DireDawa
Budget
allocated
119
Spending per
Spending per
students in Birr students in PPP US$
Table 38: Support Strategy
Region
Strategy
Strategy implemented/to
Type of
No. of
implemented/supported
be implemented
beneficiaries beneficiaries
by
Gambella Scholarship
School feeding
UNICEF, Pact, World
Vision
Children from
poor family
especially girls
Data collection is
ongoing
Children from
poor family
NA
At kebele level
Committee organized to
return children who drop out
from education
Children who
dropped out
from education
NA
Scholarship
NA
Children from
poor family
especially girls
232
School feeding
NA
NA
NA
Scholarship
UNICEF, Save the
Children, USAID
Children from
poor family
especially girls
250
School feeding
NA
NA
NA
Boarding school
Mekane Yesus Church
Girls and Boys
Providing uniform and
educational materials
USAID
Orphan Girls
and Boys
School feeding
NA
NA
Oromia
Stipend fund Birr
150/month (Now all except
Tumsa discontinued this
support)
UNICEF, Tumsa
Children from
endorsement, Furi Addis, poor family
FAWE.
especially
764
SNNPR
Boarding for female
students in four woredas
Irish Fund
NA
NA
Educational material support Pact
NA
NA
PTC members tried to return Schools
students who dropout their
education though the
number of dropped out
children is large
NA
NA
Edible oil support
Those female
students who
attend their
class regularly
NA
Amhara
Afar
Addis
Ababa
WFP
120
85 (girls)
>1000
NA
Annex 2: Qualitative Data Collection Instruments
A. Check list for the education sector’s experts
1.
Education Sector Key Informants
Profile of Respondent
1. Sex: a) Male_______________ b) Female________________
2. Education level: _____________________________________
3. Name of the Organization: _____________________________
4. Position in the Organization: ___________________________
5. Work experience (in years): ____________________________
2.
Key Questions on Demand Side Economic, cultural and Social Barriers and Policies and
Strategies
1.
What are the major economic, cultural and social causes (poverty, distance to school,
education of parents, culture, child labour, natural calamities, migration, etc) that make
children out of school? Are there any policies that will mitigate the above mentioned
economic, social and cultural barriers (abolish school fees and reducing indirect costs)?
If yes, is it applicable, if not why?
2.
Are there strategies to mitigate the dropout and out of school children such as
scholarships for girls, take home food rations and to address opportunity cost? If yes,
who sponsored/support them? How many children benefited?
3.
What are the strategies pursued to empower and increase the participation of the
community to alleviate the aforementioned economic, social, natural and cultural
barriers?
4.
What are the policies and strategies used for to raise community awareness regarding the
negative impact of gender based violation such as any violence in and out of school and
sexual harassment in attending primary and lower secondary education?
5.
How do you address to reduce stigmatizing attitudes towards marginalized (physical and
intellectual disability, AIDS orphans,) children in the community and in the schools?
6.
Is there any partnership with religious and civil society organizations? If yes how do you
work? If no, why? Is there any policy regarding partnership?
7.
What do you suggest to improve OOSC situation?
121
3.
Key Questions on Supply Side Barriers, Policies and Strategies
1.
What are the barriers in relation to school infrastructure such as classroom space,
availability of teaching materials, electricity, water and sanitation, school facilities like
library computer and other labouratories, suitability for children with disabilities?
2.
What are the policies and strategies to reduce the above mentioned barriers?
3.
What are the barriers in relation to human resources such as increase female teachers,
teacher –student ratio, the availability of trained teachers, the availability of single
teacher schools, children thought by non-mother tongue?
4.
What are the policies and strategies to reduce the above mentioned barriers?
5.
How do you assess school and classroom management, organizational and pedagogical
characteristics?
6.
What are the policies and strategies to reduce the above mentioned barriers?
7.
Is there pre- and in-service teacher training in knowledge and skills to assist at risk
students? Is there a structure that supports teachers to address the needs of at risk
students? Tell us the impacts of training teachers and developing supportive structure? If
not, Why?
8.
Please tell us about textbooks and materials:- curriculum for inclusive teaching and
learning; provision of didactic materials to stimulate learning; inclusion of local contents
in the curriculum; provision of textbooks in minority languages
9.
How do you assess the quality of schooling and school organization- that is, effective
pedagogical administrative methods with regard to student’s performance; use of
promotion criteria based on processes; assistance to the student at risk of dropping out;
teaching methods based on the development of capabilities
10. Please would you tell us about multiple pathways to learning- remedial education and
second chance learning programs; bridging programs for returning child workers to
school; effective multi-grade teaching; expansion of lower secondary education to rural
areas; development of programs supporting education transitions and addressing school
failure?
11. Are there policies and strategies developed to accelerate and scale up successful pilots?
Mention them
12. Are there mixed and intersectoral interventions packages such as school health;
feeding/nutrition programs? If yes what are they? If not why?
4.
Key Questions on Political, Governance, Capacity and Financial Bottlenecks
1.
What are the major political bottlenecks which contributed to the OOSC?
2.
What are the major governance and capacity bottlenecks?
122
3.
Is there financial problem to run effectively the teaching learning process?
4.
Is there institutional arrangement and technical capacity within MOE/RSEB/WEO to
address the needs of excluded; to conduct policy analysis to build effective data and
monitoring system, to develop effective regulations in order to increase the timely access
and transitions of out of school children? If yes, mention them, if not, why?
5.
Is there local support to schools (school grants); participatory and management systems
in and around schools? If yes, mention them, if not, why?
B. Check list for the social sector’s experts
1.
Social Sector Key Informants
Profile of Respondent
1. Sex: a) Male_______________ b) Female________________
2. Education level: _____________________________________
3. Name of the Organization: _____________________________
4. Position in the Organization: ___________________________
5. Work experience (in years): ____________________________
1.
What kind of social protection programs do exist in the country? What is the coverage?
How long have they been in place? What are the target beneficiaries? Who are the duty
bearers?
2. To what extent do the social protection programs involve families, communities and
other social structures? How integrated are the social protection programs/systems with
other systems like, education, health, etc.? Who is the leading Agency?
3. Do you think there is a move from focusing on responding to instances of abuses to
creating a more comprehensive, protective environment for children in school and out of
school?
4. What coordination mechanisms are in place to ensure the participation of other
stakeholders and successful functioning of the programs/systems?
5. What kind of cross-sectoral social protection policies/frameworks are in place?
6. What are the challenges in the cross-sectoral approach/coordination and its
effectiveness?
7. What actual or potential benefits do the social protection programs/systems provide to
getting children to school and retaining them there?
8. How is the social protection programs/systems financed?
9. Where is the source of budget? How sustainable is it?
10. What do you suggest to improve OOSC situation
123
Annex 3 of Typology
Ethiopia 2011
Global Initiative on Out-of-school Children -- Calculation spreadsheet for Dimensions 2 and 3
All
Table 2
Table 3
Education system
Entry age
Duration of level (years)
7
6
Population by age
Total population
4
School attendance status (%)
4
Lower
secondary
(ISCED 2)
13
4
5
Source data
School attendance (Table 2) DHS 2011
Population by age (Table 3) UNPD data for 2011 (2010 revision)
6
5
6
Out of school (OOS)
Dropped out
Never been in school
New entrants to primary school
Table 4
New entrants
Categories of OOSC (%)
Dropped out
Expected to enter by age 17
Expected to never enter
Categories of OOSC (population)
Dropped out
Expected to enter by age 17
Expected to never enter
9
2,329,150
2,313,438
2,293,291
2,268,982
11
12
13
2,241,992
2,212,158
2,177,070
Lower secondary age
14
15
2,135,714
2,088,953
16
2,039,653
7
8
9
10
11
12
13
14
15
16
17
44.9
2.7
42.2
26.7
34.6
3.6
31.0
22.9
29.1
4.4
24.8
16.6
23.1
5.4
17.7
12.4
24.8
9.3
15.5
7.6
24.9
9.7
15.2
6.1
27.3
14.4
12.9
3.9
30.9
17.7
13.2
3.1
36.9
22.0
15.0
1.8
39.8
25.3
14.5
1.3
10
40.1
11
41.1
12
32.9
13
28.6
14
23.1
15
19.0
16
10.7
17
8.3
11
12
13
16
17
6
7
30.1
8
38.7
9
42.5
4
5
6
7
8
9
1.8
95.2
3.0
5.9
89.4
4.7
10.4
81.9
7.7
15.0
72.8
12.2
23.3
58.0
18.7
37.4
39.8
22.8
38.9
29.9
31.2
52.8
15.9
31.4
57.3
7.7
35.0
59.5
3.4
37.2
26,459
1,386,732
43,451
61,809
928,773
48,446
82,457
650,136
61,306
98,984
481,480
80,847
120,846
300,748
97,091
204,947
217,956
124,714
211,288
162,393
169,066
307,074
92,527
182,507
369,162
49,873
225,529
447,925
25,255
279,721
1,456,642
1,039,029
793,899
661,311
518,685
547,617
542,746
582,108
644,564
752,901
Primary age
Lower
secondary
age
Primary
Lower
age
secondary age
Categories of OOSC (%) (Dimension 2) (Dimension 3)
52.9
17
1,988,436
62.5
1.1
61.4
26.4
5
Number of OOSC
Table 6
8
4
New entrants as % of OOSC never in school in
previous year
Table 5
Primary age
10
7
Total population
Primary age
10
Dropped out (% of OOSC)
11.9
13,659,011
8,441,390
Expected to enter by age 17 (% of OOSC)
79.0
13.1
Percent in school
63.3
70.1
Expected to never enter (% of OOSC)
9.1
34.0
Number in school
8,641,830
5,919,071
Total out-of-school children
Categories of OOSC (population)
36.7
29.9
Dropped out
Expected to enter by age 17
Expected to never enter
595,502
3,965,825
455,854
1,335,449
330,047
856,822
Total out-of-school children
5,017,181
2,522,319
UNESCO Institute for Statistics
www.uis.unesco.org
15 August 2012
124
Lower secondary age
14
15
100%
Primary age children in
and out of school
Table 1
Primary
(ISCED 1)
79
90%
9
80%
12
70%
60%
50%
40%
Dropped out
Expected to enter by age 17
Expected to never enter
30%
20%
10%
0%
OOSC
In school
Ethiopia 2011
Global Initiative on Out-of-school Children -- Calculation spreadsheet for Dimensions 2 and 3
Female
Table 2
Table 3
Education system
Entry age
Duration of level (years)
7
6
Population by age
Total population
4
School attendance status (%)
4
Lower
secondary
(ISCED 2)
13
4
5
Source data
School attendance (Table 2) DHS 2011
Population by age (Table 3) UNPD data for 2011 (2010 revision)
6
5
6
Out of school (OOS)
Dropped out
Never been in school
New entrants to primary school
Table 4
New entrants
Categories of OOSC (%)
Dropped out
Expected to enter by age 17
Expected to never enter
Categories of OOSC (population)
Dropped out
Expected to enter by age 17
Expected to never enter
1,134,762
1,184,249
Primary age
9
10
1,113,622
1,151,735
11
12
13
1,062,480
1,107,185
########
Lower secondary age
14
15
927,327
1,194,672
16
17
1,080,608
1,065,802
7
8
9
10
11
12
13
14
15
16
17
64.7
1.6
63.1
25.1
46.7
2.5
44.2
26.1
34.9
3.9
31.0
23.2
26.8
4.1
22.7
16.7
23.3
3.9
19.4
10.2
22.9
6.7
16.1
8.7
21.8
8.1
13.7
5.1
22.5
10.9
11.5
3.6
27.7
15.5
12.2
2.7
38.0
22.0
15.9
1.7
40.7
24.2
16.5
1.0
9
42.9
10
42.4
11
34.5
12
35.0
13
27.3
14
24.0
15
18.2
16
9.9
17
5.9
11
12
13
16
17
5
6
7
28.4
8
37.1
4
5
6
7
8
2.5
94.2
3.3
5.3
89.6
5.1
11.3
80.4
8.3
15.2
71.0
13.8
16.6
62.7
20.8
29.4
43.6
27.0
37.2
29.7
33.1
48.6
15.8
35.7
55.9
6.7
37.4
58.0
2.5
39.5
18,632
691,858
24,168
29,368
495,470
28,104
43,765
312,303
32,388
46,970
219,144
42,686
41,031
155,146
51,391
74,434
110,268
68,467
85,117
67,867
75,589
101,131
32,845
74,236
184,720
22,181
123,781
238,009
10,187
162,077
734,659
552,942
388,456
308,800
247,567
253,169
228,572
208,212
330,682
410,274
Primary age
Lower
secondary
age
Number of OOSC
Table 6
8
4
New entrants as % of OOSC never in school in
previous year
Table 5
7
Primary
Lower
secondary age
age
Categories of OOSC (%) (Dimension 2) (Dimension 3)
Primary age
9
10
Dropped out (% of OOSC)
10.2
51.7
Total population
6,754,033
4,252,173
Expected to enter by age 17 (% of OOSC)
79.8
11.3
Percent in school
63.2
72.3
Expected to never enter (% of OOSC)
9.9
37.0
Number in school
4,268,441
3,074,433
Total out-of-school children
36.8
27.7
Dropped out
Expected to enter by age 17
Expected to never enter
254,199
1,984,188
247,205
608,976
133,080
435,684
Total out-of-school children
2,485,593
1,177,740
Categories of OOSC (population)
UNESCO Institute for Statistics
www.uis.unesco.org
15 August 2012
125
Lower secondary age
14
15
100%
Primary age children in
and out of school
Table 1
Primary
(ISCED 1)
80
90%
10
80%
10
70%
60%
50%
40%
Dropped out
Expected to enter by age 17
Expected to never enter
30%
20%
10%
0%
OOSC
In school
Ethiopia 2011
Global Initiative on Out-of-school Children -- Calculation spreadsheet for Dimensions 2 and 3
Male
Table 2
Table 3
Education system
Entry age
Duration of level (years)
7
6
Population by age
Total population
4
School attendance status (%)
4
Lower
secondary
(ISCED 2)
13
4
5
Source data
School attendance (Table 2) DHS 2011
Population by age (Table 3) UNPD data for 2011 (2010 revision)
6
New entrants
5
6
Categories of OOSC (%)
Dropped out
Expected to enter by age 17
Expected to never enter
Categories of OOSC (population)
Dropped out
Expected to enter by age 17
Expected to never enter
1,179,669
1,117,247
11
12
13
1,179,512
1,104,973
1,127,505
Lower secondary age
14
15
1,208,387
894,281
16
959,045
17
922,634
7
8
9
10
11
12
13
14
15
16
17
60.4
0.7
59.8
27.7
43.1
2.9
40.2
27.3
34.4
3.3
31.1
22.6
31.5
4.7
26.9
16.4
23.0
6.8
16.2
14.3
26.6
11.8
14.8
6.5
27.9
11.2
16.7
7.0
30.9
17.0
13.9
4.1
35.1
20.6
14.5
3.6
35.7
21.9
13.8
1.9
38.8
26.6
12.3
1.6
9
42.1
10
37.9
11
46.9
12
30.5
13
29.6
14
22.6
15
19.8
16
11.8
17
11.7
11
12
13
16
17
5
6
7
31.7
8
40.5
4
5
6
7
8
1.1
96.3
2.7
6.7
89.1
4.2
9.5
83.4
7.1
14.8
74.5
10.7
29.4
53.9
16.7
44.3
36.7
19.0
40.2
30.9
28.9
55.1
16.9
28.1
58.8
9.1
32.1
61.3
4.5
34.2
7,815
694,894
19,221
32,436
433,192
20,510
38,691
338,126
28,625
52,005
262,664
37,766
79,752
146,110
45,263
130,440
108,156
55,797
126,170
97,065
90,936
205,966
63,031
104,929
184,420
28,657
100,773
209,912
15,551
117,097
721,929
486,138
405,441
352,434
271,124
294,393
314,171
373,927
313,850
342,560
Primary age
Lower
secondary
age
Number of OOSC
Table 6
1,129,189
Primary age
9
10
4
New entrants as % of OOSC never in school in
previous year
Table 5
8
1,194,388
Out of school (OOS)
Dropped out
Never been in school
New entrants to primary school
Table 4
7
Primary
Lower
age
secondary age
Categories of OOSC (%) (Dimension 2) (Dimension 3)
Total population
Primary age
9
10
Dropped out (% of OOSC)
13.5
54.0
6,904,978
4,189,217
Expected to enter by age 17 (% of OOSC)
78.3
15.2
Percent in school
63.3
67.9
Expected to never enter (% of OOSC)
8.2
30.8
Number in school
4,373,518
2,844,710
Total out-of-school children
Categories of OOSC (population)
36.7
32.1
Dropped out
Expected to enter by age 17
Expected to never enter
341,137
1,983,142
207,181
726,468
204,305
413,735
Total out-of-school children
2,531,460
1,344,508
UNESCO Institute for Statistics
www.uis.unesco.org
15 August 2012
126
Lower secondary age
14
15
100%
Primary age children in
and out of school
Table 1
Primary
(ISCED 1)
78
90%
8
80%
13
70%
60%
50%
40%
Dropped out
Expected to enter by age 17
Expected to never enter
30%
20%
10%
0%
OOSC
In school
Ethiopia 2011
Global Initiative on Out-of-school Children -- Calculation spreadsheet for Dimensions 2 and 3
Urban
Table 2
Table 3
Education system
Entry age
Duration of level (years)
7
6
Population by age
Total population
4
School attendance status (%)
4
Lower
secondary
(ISCED 2)
13
4
5
Source data
School attendance (Table 2) DHS 2011
Population by age (Table 3) UNPD data for 2011 (2010 revision)
6
New entrants
5
6
Categories of OOSC (%)
Dropped out
Expected to enter by age 17
Expected to never enter
Categories of OOSC (population)
Dropped out
Expected to enter by age 17
Expected to never enter
287,480
439,655
12
13
349,300
325,254
Lower secondary age
14
15
429,279
389,172
16
17
428,123
7
8
9
10
11
12
13
14
15
16
17
19.0
0.7
18.3
25.8
14.2
2.9
11.3
18.2
11.3
2.3
9.0
11.1
6.1
1.2
4.9
2.2
10.1
2.3
7.8
4.6
8.8
4.4
4.5
4.0
11.4
7.6
3.7
0.7
13.8
8.0
5.8
3.8
19.1
13.2
5.9
2.6
26.6
23.4
3.2
0.0
9
61.8
10
55.2
11
31.0
12
37.1
13
47.0
14
15.3
15
39.7
16
30.4
17
0.6
11
12
13
16
17
6
7
64.9
8
58.5
4
5
6
7
8
0.1
99.3
0.6
3.8
94.8
1.3
20.6
76.5
2.9
20.1
73.4
6.5
19.0
71.4
9.5
23.1
62.5
14.4
49.5
32.7
17.8
67.3
19.1
13.6
58.2
12.9
28.9
69.3
0.2
30.5
116
77,574
450
2,325
57,753
814
8,574
31,788
1,202
6,526
23,886
2,112
5,109
19,165
2,556
8,159
22,071
5,076
14,228
9,401
5,122
32,838
9,294
6,636
31,280
6,947
15,546
56,719
158
24,958
78,140
60,892
41,564
32,524
26,830
35,307
28,751
48,769
53,773
81,835
11.2
63.4
491,939
27.9
0.0
27.9
51.6
Primary
Lower
age
secondary age
Categories of OOSC (%) (Dimension 2) (Dimension 3)
Dropped out (% of OOSC)
293,083
11
5
Number of OOSC
Table 6
319,948
Primary age
9
10
4
New entrants as % of OOSC never in school in
previous year
Table 5
8
279,964
Out of school (OOS)
Dropped out
Never been in school
New entrants to primary school
Table 4
7
Primary age
9
10
Lower
secondary
Primary age
age
Total population
1,969,429
1,571,828
Expected to enter by age 17 (% of OOSC)
84.4
12.1
Percent in school
86.0
86.4
Expected to never enter (% of OOSC)
4.4
24.5
Number in school
1,694,172
1,358,701
Total out-of-school children
Categories of OOSC (population)
14.0
13.6
Dropped out
Expected to enter by age 17
Expected to never enter
30,810
232,237
12,210
135,064
25,800
52,263
Total out-of-school children
275,257
213,127
UNESCO Institute for Statistics
www.uis.unesco.org
15 August 2012
127
Lower secondary age
14
15
100%
Primary age children in
and out of school
Table 1
Primary
(ISCED 1)
84
90%
80%
11
70%
60%
50%
40%
30%
20%
10%
0%
4
Dropped out
Expected to enter by age 17
Expected to never enter
OOSC
In school
Ethiopia 2011
Global Initiative on Out-of-school Children -- Calculation spreadsheet for Dimensions 2 and 3
Rural
Table 2
Table 3
Table 4
Education system
Entry age
Duration of level (years)
7
6
Source data
School attendance (Table 2) DHS 2011
Population by age (Table 3) UNPD data for 2011 (2010 revision)
13
4
Population by age
Total population
4
5
School attendance status (%)
Out of school (OOS)
Dropped out
Never been in school
New entrants to primary school
4
New entrants
4
5
4
5
6
5
6
Categories of OOSC (%)
Dropped out
Expected to enter by age 17
Expected to never enter
Categories of OOSC (population)
Dropped out
Expected to enter by age 17
Expected to never enter
Number of OOSC
Table 6
8
2,049,186
1,993,490
Primary age
9
10
2,000,208
1,981,502
11
12
13
1,802,337
1,862,858
1,851,816
Lower secondary age
14
15
1,706,435
1,699,781
16
17
1,611,530
1,496,497
7
8
9
10
11
12
13
14
15
16
17
49.1
3.0
46.1
26.8
37.6
3.7
33.9
23.6
31.7
4.7
27.1
17.4
27.3
6.4
20.9
14.9
27.5
10.6
16.9
8.2
27.8
10.6
17.1
6.5
31.2
16.1
15.2
4.7
34.8
19.9
14.9
2.9
41.7
24.3
17.4
1.6
44.2
25.9
18.3
1.7
60.4
35.2
25.2
0.6
6
7
36.8
8
41.0
9
39.1
10
41.6
11
32.6
12
27.5
13
23.6
14
16.4
15
8.4
16
8.7
17
2.4
6
7
8
11
12
13
16
17
6.1
88.9
5.0
9.8
82.0
8.2
14.7
72.6
12.7
23.5
56.9
19.5
38.4
38.3
23.3
38.3
29.5
32.2
51.4
15.4
33.2
57.2
7.8
35.0
58.3
4.5
37.2
58.7
1.0
40.4
61,157
893,836
50,615
73,632
614,668
61,428
93,347
460,770
80,747
127,316
308,124
105,608
190,424
189,740
115,564
198,209
152,343
166,429
297,562
89,098
192,028
339,356
46,473
207,543
412,906
32,010
263,463
417,523
6,938
287,274
1,005,608
749,728
634,864
541,048
495,728
516,981
578,687
593,372
708,379
711,736
Primary age
Lower
secondary
age
New entrants as % of OOSC never in school in
previous year
Table 5
7
Primary
Lower
age
secondary age
Categories of OOSC (%) (Dimension 2) (Dimension 3)
Primary age
9
10
Dropped out (% of OOSC)
18.9
56.6
Total population
11,689,582
6,869,562
Expected to enter by age 17 (% of OOSC)
66.4
6.7
Percent in school
66.3
62.3
Expected to never enter (% of OOSC)
14.7
36.7
Number in school
7,745,624
4,277,389
Total out-of-school children
Categories of OOSC (population)
33.7
37.7
Dropped out
Expected to enter by age 17
Expected to never enter
744,085
2,619,482
580,391
1,467,347
174,518
950,308
Total out-of-school children
3,943,958
2,592,173
UNESCO Institute for Statistics
www.uis.unesco.org
15 August 2012
128
Lower secondary age
14
15
100%
Primary age children in
and out of school
Table 1
Lower
secondary
(ISCED 2)
Primary
(ISCED 1)
66
90%
15
80%
70%
19
60%
Dropped out
Expected to enter by age 17
Expected to never enter
50%
40%
30%
20%
10%
0%
OOSC
In school
Ethiopia 2011
Global Initiative on Out-of-school Children -- Calculation spreadsheet for Dimensions 2 and 3
Poor
Table 2
Table 3
Education system
Entry age
Duration of level (years)
7
6
Population by age
Total population
4
School attendance status (%)
4
Lower
secondary
(ISCED 2)
13
4
5
Source data
School attendance (Table 2) DHS 2011
Population by age (Table 3) UNPD data for 2011 (2010 revision)
6
New entrants
5
6
Categories of OOSC (%)
Dropped out
Expected to enter by age 17
Expected to never enter
Categories of OOSC (population)
Dropped out
Expected to enter by age 17
Expected to never enter
448,568
11
479,890
442,121
12
13
461,677
422,352
Lower secondary age
14
15
411,766
408,599
16
382,231
17
297,072
7
8
9
10
11
12
13
14
15
16
17
70.0
0.7
69.3
21.0
59.0
2.6
56.4
23.1
46.7
4.3
42.4
24.6
42.9
4.3
38.6
13.8
38.0
4.0
34.0
17.7
37.7
11.6
26.1
10.0
37.6
11.4
26.2
8.6
38.0
12.9
25.1
6.1
40.4
19.4
21.0
4.9
55.8
28.8
27.0
1.5
48.0
18.2
29.8
2.3
9
36.7
10
26.3
11
34.2
12
27.8
13
24.8
14
19.6
15
18.8
16
5.1
17
7.3
11
12
13
16
17
5
6
7
23.3
8
29.1
4
5
6
7
8
1.0
92.3
6.7
4.5
86.4
9.1
9.3
77.0
13.7
10.1
71.5
18.4
10.6
61.6
27.9
30.7
39.4
29.9
30.2
29.7
40.0
33.9
18.9
47.2
48.0
6.3
45.7
51.6
3.5
44.9
3,780
341,787
24,850
13,478
260,566
27,521
19,439
161,338
28,673
20,865
147,234
37,936
17,731
103,369
46,773
53,374
68,521
51,984
47,980
47,196
63,521
52,951
29,567
73,754
79,287
10,352
75,482
109,926
7,530
95,754
370,417
301,565
209,450
206,035
167,873
173,880
158,696
156,271
165,121
213,210
Number of OOSC
Table 6
511,038
Primary age
9
10
4
New entrants as % of OOSC never in school in
previous year
Table 5
8
528,950
Out of school (OOS)
Dropped out
Never been in school
New entrants to primary school
Table 4
7
Primary
Lower
age
secondary age
Categories of OOSC (%) (Dimension 2) (Dimension 3)
Primary age
9
10
Lower
secondary
Primary age
age
Dropped out (% of OOSC)
9.0
41.8
Total population
2,872,244
1,624,947
Expected to enter by age 17 (% of OOSC)
75.8
13.7
Percent in school
50.2
57.3
Expected to never enter (% of OOSC)
15.2
44.5
Number in school
1,443,023
931,650
Total out-of-school children
Categories of OOSC (population)
49.8
42.7
Dropped out
Expected to enter by age 17
Expected to never enter
128,668
1,082,815
217,738
290,143
94,644
308,511
Total out-of-school children
1,429,221
693,298
UNESCO Institute for Statistics
www.uis.unesco.org
15 August 2012
129
Lower secondary age
14
15
100%
Primary age children in
and out of school
Table 1
Primary
(ISCED 1)
76
90%
15
80%
9
70%
60%
50%
40%
Dropped out
Expected to enter by age 17
Expected to never enter
30%
20%
10%
0%
OOSC
In school
Ethiopia 2011
Global Initiative on Out-of-school Children -- Calculation spreadsheet for Dimensions 2 and 3
Rich
Table 2
Table 3
Education system
Entry age
Duration of level (years)
7
6
Population by age
Total population
4
School attendance status (%)
4
Lower
secondary
(ISCED 2)
13
4
5
Source data
School attendance (Table 2) DHS 2011
Population by age (Table 3) UNPD data for 2011 (2010 revision)
6
New entrants
5
6
Categories of OOSC (%)
Dropped out
Expected to enter by age 17
Expected to never enter
Categories of OOSC (population)
Dropped out
Expected to enter by age 17
Expected to never enter
318,338
475,078
12
13
417,877
373,585
Lower secondary age
14
15
479,681
409,853
16
17
467,488
7
8
9
10
11
12
13
14
15
16
17
17.5
0.5
17.0
29.6
13.3
3.6
9.8
22.7
13.3
2.3
11.1
8.6
7.2
2.4
4.8
3.6
9.7
3.5
6.3
4.9
12.1
6.9
5.3
2.5
9.7
7.2
2.5
0.9
15.5
10.1
5.3
3.6
19.4
13.9
5.5
2.2
28.2
23.8
4.5
0.0
9
69.9
10
43.8
11
43.1
12
44.1
13
32.0
14
26.4
15
40.3
16
28.8
17
0.4
11
12
13
16
17
6
7
66.8
8
63.5
4
5
6
7
8
0.1
99.5
0.4
2.8
96.1
1.1
26.9
70.3
2.8
17.1
77.3
5.6
33.8
58.4
7.8
35.8
50.6
13.6
56.6
29.9
13.5
74.0
15.0
11.0
65.4
10.1
24.5
71.5
0.1
28.4
64
86,739
362
1,708
58,572
675
13,357
34,912
1,374
7,274
32,851
2,372
11,555
19,988
2,683
14,583
20,593
5,525
25,595
13,540
6,114
34,382
6,983
5,112
41,422
6,390
15,530
64,940
111
25,797
87,165
60,955
49,643
42,498
34,225
40,701
45,249
46,478
63,341
90,848
15.4
67.6
513,215
26.1
0.0
26.1
52.5
Primary
Lower
age
secondary age
Categories of OOSC (%) (Dimension 2) (Dimension 3)
Dropped out (% of OOSC)
371,972
11
5
Number of OOSC
Table 6
348,404
Primary age
9
10
4
New entrants as % of OOSC never in school in
previous year
Table 5
8
333,767
Out of school (OOS)
Dropped out
Never been in school
New entrants to primary school
Table 4
7
Primary age
9
10
Lower
secondary
Primary age
age
Total population
2,265,436
1,730,608
Expected to enter by age 17 (% of OOSC)
80.5
11.0
Percent in school
86.1
85.8
Expected to never enter (% of OOSC)
4.1
21.4
Number in school
1,950,250
1,484,691
Total out-of-school children
Categories of OOSC (population)
13.9
14.2
Dropped out
Expected to enter by age 17
Expected to never enter
48,540
253,655
12,991
166,339
27,024
52,553
Total out-of-school children
315,186
245,917
UNESCO Institute for Statistics
www.uis.unesco.org
15 August 2012
130
Lower secondary age
14
15
100%
Primary age children in
and out of school
Table 1
Primary
(ISCED 1)
80
90%
80%
15
70%
60%
50%
40%
30%
20%
10%
0%
4
Dropped out
Expected to enter by age 17
Expected to never enter
OOSC
In school
131


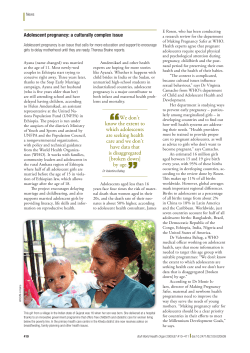


© Copyright 2026