
The Department of Health and Human Services
The Department of Health and Human Services
2013 Annual Report on the
Quality of Care for Children in Medicaid and CHIP
Health and Human Services Secretary
Kathleen Sebelius
September 2013
This page left blank for double-sided copying.
CONTENTS
EXECUTIVE SUMMARY ........................................................................................................ xvii
I
INTRODUCTION ..........................................................................................................1
II
STATE-SPECIFIC FINDINGS ON QUALITY AND ACCESS IN
MEDICAID AND CHIP .................................................................................................3
A. Quality Measurement Using the Core Set of Children’s Health Care
Quality Measures .....................................................................................................3
B. Changes in State Reporting of the Child Core Set for FFY 2012 ............................5
C. Summary of Key Findings .......................................................................................6
1.
2.
3.
4.
III
Primary Care Access and Preventive Care .......................................................7
Perinatal Health ................................................................................................7
Management of Acute and Chronic Conditions ...............................................8
Dental and Oral Health Services.......................................................................8
MONITORING AND IMPROVING CARE FOR CHILDREN
ENROLLED IN MANAGED CARE ...........................................................................11
A. Overview ................................................................................................................11
B. External Quality Review Technical Reports Submitted to CMS for the
2012–2013 Reporting Cycle ..................................................................................12
C. Reporting of Performance Measures in 2012–2013 External Quality
Review Technical Reports .....................................................................................13
D. Description of Performance Improvement Projects in 2012–2013........................14
E. Focused Review of Performance Improvement Projects .......................................14
1.
2.
3.
4.
IV
Childhood Obesity ..........................................................................................15
Dental Care .....................................................................................................15
Prenatal/Postpartum Care ...............................................................................16
Adolescent Well Care .....................................................................................16
SUMMARY AND CONCLUSION..............................................................................17
APPENDIX: MEASURE SNAPSHOTS .................................................................... A.1
iii
This page left blank for double-sided copying.
EXECUTIVE SUMMARY EXHIBITS
Exhibit 1 Number of Medicaid/CHIP Children’s Health Care Quality Measures Reported by
States, FFY 2012 .................................................................................................................... xxii
Exhibit 2 Number of States Reporting the Core Set of Medicaid/CHIP Children’s Health
Care Quality Measures, FFY 2012 ........................................................................................ xxiii
Exhibit 3 Performance Rates on Frequently Reported Medicaid/CHIP Children’s Health
Care Quality Measures, FFY 2012 ........................................................................................ xxiv
Exhibit 4 Comparison of Performance Measures Evaluating Children’s Health Care Quality
That Were Reported in External Quality Review (EQR) Technical Reports for the
2010, 2011–2012, and 2012–2013 Reporting Cycles for 26 States, by General
Topic ....................................................................................................................................... xxv
Exhibit 5 Comparison of Performance Improvement Projects (PIPs) Targeting Children
That Were Reported in External Quality Review (EQR) Technical Reports for the
2010, 2011–2012, and 2012–2013 Reporting Cycles for 28 States, Selected
Topics .................................................................................................................................... xxvi
This page left blank for double-sided copying.
TABLES
Table 1
Number and Percentage of Children Enrolled in Medicaid or CHIP by State and
Service Delivery Type, FFY 2012 ............................................................................................ 21
Table 2
Overview of State Reporting of the Core Set of Medicaid/CHIP Children’s Health
Care Quality Measures, FFY 2012 ........................................................................................... 23
Table 3
Performance Rates on Frequently Reported Medicaid/CHIP Children’s Health
Care Quality Measures, FFY 2012 ........................................................................................... 25
Table 4
Performance Improvement Projects (PIPs) Targeting Children or Pregnant
Women Included in External Quality Review (EQR) Technical Reports, 2012–
2013 Reporting Cycle, by Topic Area ...................................................................................... 26
Table 5
Childhood Obesity Performance Improvement Projects (PIPs) Included in
External Quality Review (EQR) Technical Reports, 2012–2013 Reporting Cycle.................. 28
Table 6
Dental Care Performance Improvement Projects (PIPs) Included in External
Quality Review (EQR) Technical Reports, 2012–2013 Reporting Cycle ................................ 29
Table 7
Prenatal/Postpartum Care Performance Improvement Projects (PIPs) Included in
External Quality Review (EQR) Technical Reports, 2012–2013 Reporting Cycle.................. 30
Table 8
Adolescent Well-Care Performance Improvement Projects (PIPs) Included in
External Quality Review (EQR) Technical Reports, 2012–2013 Reporting Cycle.................. 31
vii
This page left blank for double-sided copying.
FIGURES
Figure 1
Changes in the Number of States Reporting the Medicaid/CHIP Children’s Health
Care Quality Measures, FFY 2010–2012 ................................................................................. 35
Figure 2
Number of Medicaid/CHIP Children’s Health Care Quality Measures Reported by
States, FFY 2012 ...................................................................................................................... 36
Figure 3
Number of States Reporting the Core Set of Medicaid/CHIP Children’s Health
Care Quality Measures, FFY 2012 ........................................................................................... 37
Figure 4
Comparison of Performance Measures Evaluating Children’s Health Care Quality
That Were Reported in External Quality Review (EQR) Technical Reports for the
2010, 2011–2012, and 2012–2013 Reporting Cycles for 26 States, by General
Topic ......................................................................................................................................... 38
Figure 5
Comparison of Performance Improvement Projects (PIPs) Targeting Children
That Were Reported in External Quality Review (EQR) Technical Reports for the
2010, 2011–2012, and 2012–2013 Reporting Cycles for 28 States, Selected
Topics ....................................................................................................................................... 39
ix
This page left blank for double-sided copying.
APPENDIX: MEASURE SNAPSHOTS
PRIMARY CARE ACCESS AND PREVENTIVE CARE ...................................................................... A.1
Child and Adolescent Access to Primary Care Practitioners .......................................................... A.3
Well-Child Visits in the First 15 Months of Life ............................................................................ A.7
Well-Child Visits in the Third, Fourth, Fifth, and Sixth Years of Life ........................................... A.9
Adolescent Well-Care Visits ......................................................................................................... A.11
Childhood Immunization Status .................................................................................................... A.13
Adolescent Immunization Status................................................................................................... A.15
Chlamydia Screening .................................................................................................................... A.17
Body Mass Index Assessment for Children and Adolescents ....................................................... A.19
PERINATAL HEALTH ......................................................................................................................... A.21
Timeliness of Prenatal Care .......................................................................................................... A.23
Frequency of Ongoing Prenatal Care ............................................................................................ A.25
MANAGEMENT OF ACUTE AND CHRONIC CONDITIONS ......................................................... A.27
Appropriate Testing for Children with Pharyngitis....................................................................... A.29
Follow-Up After Hospitalization for Mental Illness ..................................................................... A.31
Follow-Up Care for Children Prescribed Attention-Deficit/ Hyperactivity Disorder
Medication .............................................................................................................................. A.33
Central Line-Associated Blood Stream Infections in Neonatal Intensive Care Units................... A.35
DENTAL AND ORAL HEALTH SERVICES ...................................................................................... A.39
Preventive Dental Services ........................................................................................................... A.41
Dental Treatment Services ............................................................................................................ A.43
xi
This page left blank for double-sided copying.
GLOSSARY
AAP
American Academy of Pediatrics
ABCD
Assuring Better Child Health and Development
ACA
Affordable Care Act
ACSC
Ambulatory Care Sensitive Condition
ADD
Follow-Up Care for Children Prescribed ADHD Medication
ADHD
Attention-Deficit/Hyperactivity Disorder
AHRQ
Agency for Healthcare Research and Quality
AWC
Adolescent Well-Care Visits
Behav
Behavioral
BHC
Behavioral Health Concepts
BHO
Behavioral Health Organization
BMI
Body Mass Index
CAP
Child and Adolescent Access to Primary Care Practitioners
CAHPS
Consumer Assessment of Healthcare Providers and Systems
CARTS
CHIP Annual Reporting Template System
CCC
Supplemental Items for Children with Chronic Conditions
CDC
Centers for Disease Control and Prevention
CG
Clinician & Group Survey
CHIP
Children’s Health Insurance Program
CHIPRA
Children’s Health Insurance Program Reauthorization Act of 2009
CHL
Chlamydia Screening
CIS
Childhood Immunization Status
CLABSI
Central Line-Associated Blood Stream Infection
CMCS
Center for Medicaid and CHIP Services
CMS
Centers for Medicare & Medicaid Services
COE
Center of Excellence
CPT
Current Procedural Terminology
CWP
Appropriate Testing for Children with Pharyngitis
xiii
CY
Calendar Year
C&M
Continuation and Maintenance
DTaP
Diphtheria, Tetanus, and Acellular Pertussis Vaccine
ED
Emergency Department
EHR
Electronic Health Record
EPSDT
Early and Periodic Screening, Diagnostic, and Treatment
EQR
External Quality Review
EQRO
External Quality Review Organization
ER
Emergency Room
FFS
Fee-for-Service
FFY
Federal Fiscal Year
FPC
Frequency of Ongoing Prenatal Care
FPL
Federal Poverty Level
FQHC
Federally Qualified Health Center
FUH
Follow-Up After Hospitalization for Mental Illness
HbA1c
Hemoglobin A1c
HCE
Health Care Excel
HCPCS
Healthcare Common Procedure Coding System
HEDIS
Healthcare Effectiveness Data and Information Set
HepA
Hepatitis A
HepB
Hepatitis B
HFS
Healthy First Steps
HHS
U.S. Department of Health and Human Services
HiB
Haemophilus Influenza Type B
HIO
Health Insuring Organization
HIV
Human Immunodeficiency Virus
HMO
Health Maintenance Organization
HPV
Human Papillomavirus
HSAG
Health Services Advisory Group
xiv
ICD
International Classification of Diseases
ICHP
Institute for Child Health Policy
IMA
Adolescent Immunization Status
IPV
Inactivated Polio Virus Vaccine
LOINC
Logical Observation Identifiers Names and Codes
MACBIS
Medicaid and CHIP Business Information Solutions
MCO
Managed Care Organization
MMIS
Medicaid Management Information System
MMR
Measles, Mumps, and Rubella
NA
Not Applicable
NCQA
National Committee for Quality Assurance
NHSN
National Healthcare Safety Network
NICU
Neonatal Intensive Care Unit
NR
Not Reported
NTSV
Nulliparous Term Singleton Vertex
OB
Obstetrician
OB/GYN
Obstetrical/Gynecological Provider
OME
Otitis Media with Effusion
ONC
Office of the National Coordinator for Health Information Technology
PCCM
Primary Care Case Management
PCMH
Patient-Centered Medical Home
PCP
Primary Care Practitioner/Provider
PCV
Pneumococcal Conjugate Vaccine
PDENT
Preventive Dental Services
PIHP
Prepaid Inpatient Health Plan
PIP
Performance Improvement Project
PPC
Timeliness of Prenatal Care
PQMP
Pediatric Quality Measures Program
RHCC
Rural Health Care Center
xv
RSV
Respiratory Syncytial Virus
RV
Rotavirus
SCI
State Coverage Insurance
SEDS
Statistical Enrollment Data System
SFY
State Fiscal Year
SIPP
Statewide Inpatient Psychiatric Program
SIR
Standardized Infection Ratio
SQL
Structured Query Language
SSIS
SQL Server Integration Services
STI
Sexually Transmitted Infection
TA/AS
Technical Assistance and Analytic Support
Td
Tetanus and Diphtheria Vaccine
Tdap
Tetanus, Diphtheria, and Pertussis Vaccine
TDENT
Dental Treatment Services
URI
Upper Respiratory Infection
VNA
Visiting Nurse Association
WCC
Body Mass Index Assessment for Children and Adolescents
W15
Well-Child Visits in the First 15 Months of Life
W34
Well-Child Visits in the Third, Fourth, Fifth, and Sixth Years of Life
xvi
EXECUTIVE SUMMARY
Together, Medicaid and the Children’s Health Insurance Program (CHIP) served more than 44
million children in federal fiscal year (FFY) 2012, representing more than half the beneficiaries
currently enrolled in these programs and more than 1 in 3 children in the United States. 1,2
Medicaid and CHIP play a key role in ensuring that low-income children get health care
coverage and access to a comprehensive set of benefits and other medically necessary services.
This report, required by Section 1139A(c)(2) of the Social Security Act (the Act), as amended by
Section 401(a) of the Children’s Health Insurance Program Reauthorization Act of 2009
(CHIPRA), summarizes state-specific information on the quality of health care furnished to
children covered by Medicaid and CHIP.
The Department of Health and Human Services (HHS) is working closely with states, health care
providers, and program enrollees to ensure a high quality system of care for children in
Medicaid/CHIP. As the HHS agency responsible for ensuring effective health care coverage for
Medicare, Medicaid, and CHIP beneficiaries, the Centers for Medicare & Medicaid Services
(CMS) plays a key role in promoting quality health care for children in Medicaid/CHIP. CMS’s
quality agenda is closely aligned with that of the HHS National Quality Strategy’s three aims of
achieving better care, a healthier population and community, and more affordable care. 3
Over the past three years, CMS and states have continued to break new ground with standardized
reporting on CMS’s core set of children’s health care quality measures (referred to as the Child
Core Set). 4 The 2013 Secretary’s Report presents information on key activities CMS undertook
to provide an update on the quality of care children receive in Medicaid/CHIP, including
reviewing findings on the Child Core Set and summarizing information on managed care quality
measurement and improvement efforts reported in the External Quality Review (EQR) technical
reports. Below are key findings from these information sources.
Measurement and Voluntary Reporting Using the Child Core Set
•
Over the past year, CMS has made substantial efforts to streamline reporting of Child
Core Set data, reduce the burden on states, and improve consistency of the data. For FFY
2012, data on the Child Core Set measures were obtained through three sources: (1) the
CMS CHIP Annual Reporting Template System (CARTS), (2) Form CMS-416, and (3)
the Centers for Disease Control and Prevention’s (CDC’s) National Healthcare Safety
Network (NHSN). One Initial Child Core Set measure that had proven challenging for
1
For additional information, see Table I.16 in “2012 CMS Statistics,” available at http://www.cms.gov/ResearchStatistics-Data-and-Systems/Research/ResearchGenInfo/CMSStatistics.html.
2
http://kff.org/other/state-indicator/children-0-18/.
3
http://www.ahrq.gov/workingforquality/nqs/nqs2012annlrpt.pdf.
4
The 2010, 2011, and 2012 Secretary’s Reports are available at http://www.medicaid.gov/Medicaid-CHIP-ProgramInformation/By-Topics/Quality-of-Care/CHIPRA-Initial-Core-Set-of-Childrens-Health-Care-QualityMeasures.html.
xvii
states to collect in previous years was not collected for FFY 2012, and will be retired in
FFY 2013. 5
•
All states reported two or more of the Child Core Set measures for FFY 2012 (Exhibit
1). 6 The median number of measures reported by states for FFY 2012 was 14, up from 12
in FFY 2011. Altogether, 35 states reported at least 11 of the 22 core measures to CMS in
FFY 2012. 7 Two states, Florida and Tennessee, reported 22 of the core measures for FFY
2012.
•
The increase in the number of measures reported by states for FFY 2012 has allowed
CMS, for the first time, to conduct deeper analysis on 16 Child Core Set measures
reported by 25 or more states. 8 Detailed findings for these measures (including
percentiles, trends, and geographic variation) are featured in the Appendix.
•
The completeness of Child Core Set data reported by states improved for FFY 2012. For
example, 38 states now include both Medicaid and CHIP populations in one or more
measures, up from 34 states for FFY 2011.
•
The most frequently reported measures in the Child Core Set assess children’s access to
primary care, well-child visits, and dental services (Exhibit 2).
State Performance on the Child Core Set
1. Primary Care Access and Preventive Care
•
In FFY 2012, as in FFY 2011, states continued to have high performance rates on the
children’s primary care access measure. The vast majority of children, across all
states, had at least one visit to a primary care practitioner (PCP) during the reporting
period, with the median rate ranging from a high of 97 percent among children ages
12 to 24 months to 88 to 91 percent for the other age groups (Exhibit 3).
•
As in FFY 2011, the proportion of children with a well-child visit varied by age
group, but remained below the recommended guidelines (Exhibit 3). 9
•
The content of a well-child visit can be indicated by several Child Core Set measures
(Exhibit 3):
5
Otitis Media with Effusion (OME) –Avoidance of Inappropriate Systemic Antimicrobials in Children (ages 2-12)
was retired in 2013. For more information, see the 2013 Children’s Core Set of Health Care Quality Measures state
health official letter available at http://www.medicaid.gov/Federal-Policy-Guidance/downloads/SHO-13-002.pdf.
6
The term “states” includes the 50 states and the District of Columbia.
7
The base of 22 measures excludes two core measures: (1) the central line-associated blood stream infections
(CLABSI) measure, which was obtained from the CDC’s NHSN beginning in FFY 2012; and (2) the otitis media
with effusion (OME) measure, which was not collected for FFY 2012 and was retired in 2013 because it draws on
CPT-II codes not commonly used by Medicaid/CHIP agencies.
8
Although 17 measures were reported by at least 25 states for FFY 2012, the ambulatory care: emergency
department visits measure is not profiled in the Appendix due to data quality issues.
9
The American Academy of Pediatrics and Bright Futures recommend nine well-child visits in the first 15 months
of life and annual well-child visits for children ages 3 and older.
xviii
•
The median childhood immunization rate for children turning age 2 was 68 percent,
while the adolescent immunization rate among 13-year-olds was 52 percent.
•
The median Chlamydia screening rate among sexually active girls between the ages
of 16 and 20 was 60 percent.
•
The median rate of body mass index (BMI) percentile documentation in the medical
record was 39 percent for children ages 3 to 17.
2. Perinatal Health
•
The health of a child is affected by a mother’s health and the care she receives during
pregnancy. In FFY 2012, data on two of the maternity care measures in the Child
Core Set indicate (Exhibit 3):
•
The large majority of pregnant women (a median of 83 percent) had a prenatal
care visit in the first trimester or within 42 days of enrollment in Medicaid/CHIP.
•
Slightly more than half of women (a median of 59 percent) received the expected
number of visits during their pregnancy (based on when they enrolled in
Medicaid/CHIP and when they delivered).
3. Management of Acute and Chronic Conditions
•
The extent to which children are receiving safe, timely, and effective treatment can be
indicated by several Child Core Set measures (Exhibit 3):
•
Two-thirds (a median of 69 percent) of children diagnosed with pharyngitis and
dispensed an antibiotic received the recommended strep test.
•
A median of 41 percent of children prescribed medication for attentiondeficit/hyperactivity disorder (ADHD) had a follow-up visit during the first 30
days (known as the initiation phase), and of the children with a visit during the
initiation phase, a median of 53 percent had two visits during the next nine
months (known as the continuation and maintenance phase).
•
The median rate of a 30-day follow-up visit after hospitalization for mental
illness was 68 percent.
•
Among the 40 states with state-level rates for central line-associated blood
stream infections (CLABSIs) in neonatal intensive care units (NICUs), 28 had a
significant decrease in CLABSIs since the 2006‒2008 baseline period, and 12
had no change in infections since the baseline period. No state had a significant
increase in infections.
xix
4. Dental and Oral Health Services
•
Children’s access to dental services in FFY 2011 was similar to patterns observed in
previous years (Exhibit 3). 10
•
A median of 44 percent of children ages 1 to 20 received at least one preventive
dental service (such as dental cleanings or application of dental sealants) paid for by
Medicaid in FFY 2011.
•
A median of 24 percent of children ages 1 to 20 received at least one dental treatment
service paid for by Medicaid in FFY 2011.
Managed Care External Quality Review Findings
1. External Quality Review Technical Reports
•
Of the 41 states 11 that currently contract with managed care plans to deliver services
to Medicaid and CHIP enrollees, 33 submitted EQR technical reports to CMS for the
2012–2013 reporting cycle. The most frequently reported children’s performance
measures in the EQR reports are similar to those in the Child Core Set (Exhibit 4).
•
The 33 EQR technical reports varied considerably in their organization, level of
detail, and focus of the discussion on quality, access, and timeliness of care. This
variation is a byproduct of differences in states’ interpretation of regulatory language.
For example, although the regulations require states to annually validate performance
measures and performance improvement projects (PIPs), they do not require states to
include details related to outcomes or interventions. Therefore, some states choose to
include this information, while others do not.
2. Performance Improvement Projects
•
Through their managed care entities, states are engaged in various types of
improvement projects specific to children. Among the 28 states that submitted EQR
technical reports over the last three reporting cycles, the most frequently reported PIP
topics focused on immunizations and well-child care (Exhibit 5).
•
PIP topics, target populations, and interventions and activities were generally specific
to each managed care organization (MCO) or prepaid inpatient health plan (PIHP) in
a state, but 18 states mandated PIP topics or required MCOs or PIHPs to engage in
collaborative PIPs on priority health care topics. 12 For example, Georgia, Missouri,
10
States are to submit the CMS-416 report to CMS by April 1 of each year. At the time of this writing, CMS had not
received enough FFY 2012 data from states to make meaningful comparisons, so this report includes data submitted
by states on the FFY 2011 CMS-416. The Child Core Set measures for dental services include children enrolled in
Medicaid and CHIP Medicaid expansion programs that are eligible for the EPSDT benefit. Children enrolled in
separate CHIP programs are not included in this measure.
11
For purposes of EQR, the term “states” includes the 50 states, the District of Columbia, and the territories.
12
States mandating PIP topics for MCOs or PIHPs include Arizona, Delaware, District of Columbia, Florida,
Georgia, Hawaii, Illinois, Maryland, Michigan, Minnesota, Missouri, Nevada, New Jersey, Pennsylvania, Rhode
Island, South Carolina, Virginia, and Washington.
xx
and New Jersey required all MCOs to implement PIPs to improve dental care for
children, and Arizona required MCOs to implement PIPs to improve asthma care.
• As in the previous reporting cycle, CMS conducted detailed abstractions of External
Quality Review Organization (EQRO) reporting on PIPs in four CMS priority health
topic areas: (1) childhood obesity, (2) dental care, (3) prenatal and postpartum care,
and (4) adolescent well care. Overall, the analyses of PIP design and implementation
provided in the current EQR technical reports were more comprehensive than were
found during the 2011–2012 reporting cycle. Analysis of the PIPs indicates that states
are using a diverse set of interventions to improve quality of care.
CMS/HHS Efforts to Improve the Quality of Care for Children in Medicaid and CHIP
This report shows the progress made by CMS and states to systematically measure and report on
the quality of care children receive in Medicaid/CHIP. Although the ultimate goal is to improve
children’s health by driving improvements in the quality of care, measuring the care children
receive is a critically important step in that process.
CMS and the states have built a solid foundation for improving the quality of care provided to
Medicaid and CHIP enrollees through efforts such as: the Medicaid and CHIP Quality Measures
Technical Assistance and Analytic Support (TA/AS) Program, the Oral Health Initiative, the
Perinatal Health Initiative, the 10 CHIPRA quality demonstration grantees across 18 states,
technical assistance efforts to standardize and strengthen managed care quality monitoring and
improvement activities in Medicaid and CHIP, and CMS’s Technical Advisory Groups
(workgroups that focus on policy areas such as quality, oral health, mental health, managed care,
and coverage). 13,14
The measurement and reporting tools now in place can guide HHS and states in the next phase of
efforts to more thoroughly measure the care obtained by children covered by Medicaid/CHIP and
use the measures to assess and improve the quality of care provided to children in their states.
Moving forward, HHS will strengthen existing partnerships and build new ones between CMS,
states, health care providers, and program enrollees on quality measurement as well as quality
improvement. The quality improvement efforts recently launched by CMS are helping to set the
stage for the next generation of efforts designed to improve children’s health care and health
outcomes and to help transform Medicaid/CHIP into a high quality system of coverage and care.
13
The TA/AS contract is led by Mathematica Policy Research and supported by subcontracts with the National
Committee for Quality Assurance (NCQA), the Center for Health Care Strategies (CHCS), and the National
Initiative for Children’s Healthcare Quality (NICHQ).
14
For more information about these efforts, please see http://www.medicaid.gov/Medicaid-CHIP-ProgramInformation/By-Topics/Quality-of-Care/Quality-of-Care.html.
xxi
Exhibit 1. Number of Medicaid/CHIP Children’s Health Care Quality Measures Reported by States, FFY 2012
Florida
Tennessee
Alabama
Iowa
Oregon
West Virginia
Georgia
North Carolina
South Carolina
Illinois
Pennsylvania
Arkansas
Rhode Island
Massachusetts
Oklahoma
Delaware
Hawaii
New York
Alaska
Indiana
Kentucky
Michigan
New Jersey
New Mexico
Texas
22
22
21
21
21
21
20
20
20
19
19
18
18
17
17
16
16
16
15
15
15
15
15
15
15
State Median
14
14
14
14
D.C.
Maine
Wyoming
Maryland
California
Colorado
Missouri
Utah
Mississippi
Washington
Idaho
Ohio
Nevada
Virginia
North Dakota
Arizona
Louisiana
Montana
New Hampshire
Vermont
Connecticut
Minnesota
Kansas
Nebraska
South Dakota
Wisconsin
13
12
12
12
12
11
11
10
10
9
9
8
7
7
7
7
7
6
5
3
2
2
2
0
5
15
10
Number of Measures
20
25
Source: Based on Mathematica analysis of FFY 2012 CARTS reports.
Notes: This figure is based on state reporting of 22 core set measures for FFY 2012. Beginning in FFY 2012, data for the
CLABSI measure were obtained from the National Healthcare Safety Network. The OME measure was not collected
for FFY 2012 and was retired in 2013. The term “states” includes the 50 states and the District of Columbia.
xxii
Exhibit 2. Number of States Reporting the Core Set of Medicaid/CHIP Children’s Health Care Quality Measures,
FFY 2012
Preventive Dental Services
51
Dental Treatment Services
51
Well-Child Visits in the 3rd, 4th,
5th, and 6th Years of Life
46
Well-Child Visits in the First 15 Months of Life
43
Adolescent Well-Care Visits
43
Child and Adolescent Access to
Primary Care Practitioners
43
Appropriate Testing for Children with Pharyngitis
36
Chlamydia Screening
35
Childhood Immunization Status
34
Adolescent Immunizations Status
32
Timeliness of Prenatal Care
31
Follow-Up Care for Children Prescribed Attention-Deficit/
Hyperactivity Disorder (ADHD) Medication
29
Ambulatory Care: Emergency Department Visits
28
Body Mass Index Assessment for
Children and Adolescents
27
Follow-Up After Hospitalization for Mental Illness
27
Consumer Assessment of Healthcare Providers
and Systems (CAHPS ®) Health Plan Survey
27
Frequency of Ongoing Prenatal Care
25
Live Births Weighing Less than 2,500 Grams
15
Annual Percentage of Asthma Patients with 1 or More
Asthma-Related Emergency Room Visits
15
Annual Pediatric Hemoglobin A1c Testing
13
Cesarean Rate for Nulliparous Singleton Vertex
12
Developmental Screening in the
First Three Years of Life
12
0
5
10
15
20
25
30
35
40
45
50
Number of States
Source: Based on Mathematica analysis of FFY 2012 CARTS reports.
Notes:
Beginning in FFY 2012, to minimize state burden, the two dental measures were calculated using data reported by
states on Form CMS-416. Beginning in FFY 2012, data for the CLABSI measure were obtained from the National
Healthcare Safety Network. The OME measure was not collected for FFY 2012 and was retired in 2013. The term
“states” includes the 50 states and the District of Columbia.
xxiii
55
Exhibit 3. Performance Rates on Frequently Reported Medicaid/CHIP Children’s Health Care Quality Measures, FFY 2012
Number of States Reporting
25th
75th
Using Core Set Specifications Mean Median Percentile Percentile
51
43.0
44.0
39.3
48.3
51
23.7
23.8
19.6
25.8
Measure Description
Preventive Dental Services: 1 – 20 Years
Dental Treatment Services: 1 – 20 Years
Measure
Percentage with a Preventive Dental Service
Percentage with a Dental Treatment Service
Access to Primary Care: 12 – 24 Months
Access to Primary Care: 25 Months – 6 Years
Access to Primary Care: 7 – 11 Years
Access to Primary Care: 12 – 19 Years
Percentage with a PCP Visit in the Past Year
Percentage with a PCP Visit in the Past Year
Percentage with a PCP Visit in the Past Two Years
Percentage with a PCP Visit in the Past Two Years
43
43
43
43
95.6
87.7
88.5
87.4
96.8
88.1
91.0
89.2
94.9
85.2
86.5
85.8
98.0
91.2
93.1
91.5
Well-Child Visits: First 15 Months
Well-Child Visits: 3 – 6 Years
Well-Care Visits: 12 – 21 Years
Percentage with Six or More Visits
Percentage with One or More Visits
Percentage with One or More Visits
43
46
43
59.5
65.9
44.4
62.1
67.7
41.7
55.3
60.9
38.0
67.3
74.9
53.5
Childhood Immunization Status: 2 Years
Percentage Up to Date on Immunizations
(Combination 3)a
Percentage Up to Date on Immunizations
(Combination 1)b
Percentage of Sexually Active Women Screened
Percentage with a BMI Percentile Documented
33
64.2
67.9
61.0
76.4
30
57.6
59.9
48.8
71.1
35
27
48.0
31.8
49.5
38.9
42.2
1.6
57.8
51.9
Percentage with a Prenatal Visit in the First Trimester
(or within 42 Days of Medicaid/CHIP Enrollment)
Percentage with More than 80 Percent of Expected
Prenatal Visits
Percentage Who Were Dispensed an Antibiotic and
Received a Strep Test
Percentage of Discharges with a Follow-Up Visit
within 7 Days
Percentage of Discharges with a Follow-Up Visit
within 30 Days
Percentage with a Follow-Up Visit during the
Initiation Phase
Percentage with Two Follow-Up Visits during the
Continuation and Maintenance Phase
31
78.1
83.4
72.2
87.8
25
55.6
58.7
50.9
70.2
36
64.5
69.1
55.4
75.8
27
50.0
53.4
40.3
60.2
27
66.9
68.4
61.1
79.9
29
42.1
41.1
37.1
50.0
28
52.9
53.4
46.4
61.1
Adolescent Immunization Status: 13 Years
Chlamydia Screening: 16 – 20 Years
Body Mass Index Assessment: 3 – 17 Years
xxiv
Timeliness of Prenatal Care
Frequency of Ongoing Prenatal Care
Appropriate Testing for Children with Pharyngitis:
2 – 18 Years
Follow-Up After Hospitalization for Mental Illness:
6 – 20 Years
Follow-Up After Hospitalization for Mental Illness:
6 – 20 Years
Follow-Up Care for Children Prescribed ADHD
Medication: 6 – 12 Years
Follow-Up Care for Children Prescribed ADHD
Medication: 6 – 12 Years
Source: Based on Mathematica analysis of FFY 2012 CARTS reports.
Notes: This table includes data for states that used core set specifications to report the measures. This table excludes states that used other specifications and states that did not report the
measures for FFY 2012. If a state reported separate rates for its Medicaid and CHIP populations, the rate for the program with the larger measure-eligible population was used. The
ambulatory care: emergency department visits measure was excluded from this table due to data quality issues. The central line-associated blood stream infections (CLABSI)
measure was excluded from this table because the measure uses a summary statistic different from those in this table.
a
Combination 3 includes four doses of diphtheria, tetanus, and acellular pertussis (DTaP); three doses of polio (IPV); one dose of measles, mumps, and rubella (MMR); two doses of H
influenza type B (HiB); three doses of hepatitis B (HepB), one dose of chicken pox (VZV); and four doses of pneumococcal conjugate (PCV) vaccine.
b
Combination 1 includes one dose of meningococcal vaccine and one tetanus and diphtheria toxoids and acellular pertussis (Tdap) vaccine or one tetanus and diphtheria toxoids (Td) vaccine.
Exhibit 4. Comparison of Performance Measures Evaluating Children’s Health Care Quality That Were Reported in
External Quality Review (EQR) Technical Reports for the 2010, 2011–2012, and 2012–2013 Reporting Cycles for
26 States, by General Topic
25
21
20
21
21
20 20
20 20
19
19
Number of States
17
16
15
15
15 15
14
12
12
11
10
10
10
9
9
9
9 9
8
8
7
7
6 6
6
6 6
5
5
3
0
Immuni- Well-Child Adolescent Asthma
zations
Care
Well Care
2010
Lead
Primary
Screening
Care
Access
STIs
2011–2012
Dental
Care
URI
Pharyngitis Weight
ADHD
Assessment
2012–2013
Sources: Performance measures for 2010 EQR technical reports obtained from the 2011 Secretary’s Report. Performance
measures in the EQR technical reports for the 2011–2012 and 2012–2013 reporting cycles from Mathematica analysis
of 2011–2012 and 2012–2013 EQR technical reports.
Notes:
Data are from managed care EQR technical reports. States include AZ, CA, DE, FL, GA, HI, IL, IN, MD, MA, MI,
MN, MO, NE, NV, NJ, NM, NY, PA, RI, TN, UT, VT, VA, WA, and WV. SC and WI submitted EQR technical
reports in the 2010, 2011–2012, and 2012–2013 reporting cycles, but one or more of these reports did not list
performance measures, so the states were excluded from this analysis.
Analysis excludes plans that provide only limited services, such as primary care case management. Analysis also
excludes plans that do not serve children or pregnant women, such as long-term care plans or Medicare Advantage
plans that cover dual eligibles.
ADHD = attention-deficit/hyperactivity disorder; Pharyngitis = appropriate testing for children with pharyngitis;
STI = sexually transmitted infection; URI = upper respiratory infection.
xxv
Exhibit 5. Comparison of Performance Improvement Projects (PIPs) Targeting Children That Were Reported in
External Quality Review (EQR) Technical Reports for the 2010, 2011–2012, and 2012–2013 Reporting Cycles for
28 States, Selected Topics
15
Number of States
11
10
10
10
9
8
8
8
8
8
7
6
7
6
6
6
5
5
4
3
3
2
3
2
1
1
0
0
Immunizations Well-Child
Care
Weight
Assessment
2010
Asthma
Lead
Screening
2011–2012
Dental
Care
Primary
Care
Access
ADHD
1
0
Behavioral
Health
2012–2013
Sources: PIPs for the 2010 EQR technical reports obtained from the 2011 Secretary's Report. PIPs in the EQR technical reports
for the 2011–2012 and 2012–2013 reporting cycles from Mathematica analysis of 2011–2012 and 2012–2013 EQR
technical reports.
Notes:
Data are from managed care EQR technical reports. States include AZ, CA, DE, FL, GA, HI, IL, IN, MD, MA, MI,
MN, MO, NE, NV, NJ, NM, NY, PA, RI, SC, TN, UT, VT, VA, WA, WV, and WI.
Analysis excludes plans that provide only limited services, such as primary care case management. Analysis also
excludes plans that do not serve children or pregnant women, such as long-term care plans or Medicare Advantage
plans that cover dual eligibles. Analysis includes PIPs listed in the EQR technical report for each state that specifically
targeted children or pregnant women.
ADHD = attention-deficit/hyperactivity disorder.
xxvi
I.
INTRODUCTION
With the adoption of a core set of children’s health care quality measures (Child Core Set) in
2010, the Centers for Medicare & Medicaid Services (CMS) has a new set of tools to promote
high quality care in Medicaid and the Children’s Health Insurance Program (CHIP). As
documented in the 2012 Secretary’s Report on the Quality of Care for Children in Medicaid and
CHIP, 15 CMS and states have made considerable progress in building a solid foundation for
quality measurement and improvement. Working collaboratively with its many partners
including states, health care providers, and program enrollees, CMS is now engaged in a number
of efforts to use this information to drive improvements in care.
Together, Medicaid and CHIP served more than 44 million children in federal fiscal year (FFY)
2012, representing more than half the beneficiaries currently enrolled in these programs and
more than 1 in 3 children in the United States. 16,17 Enrollment increased nearly 2 percent
between FFY 2011 and FFY 2012, and it is anticipated that the number of children covered by
Medicaid and CHIP will continue to increase due to (1) extensive outreach efforts related to
implementing the Affordable Care Act (ACA) of 2010, and (2) parents learning about the
available coverage options when they seek coverage. It is important to continue to build a strong
foundation for quality measurement and improvement as these key sources of coverage continue
to grow.
The majority (64 percent) of children covered by Medicaid and CHIP obtain care from managed
care arrangements (Table 1), although the range of services and the population groups included
in these plans vary across states. For example, some states provide behavioral health and dental
services through their managed care plans and others provide these services using fee-for-service
arrangements. Because of the varying arrangements, a diverse set of quality measurement and
improvement efforts are under way across payment and service delivery settings.
The objective of this report, as required by the Children’s Health Insurance Program
Reauthorization Act of 2009 (CHIPRA), 18 is to summarize state-specific information on the
quality of health care furnished to children under Titles XIX (Medicaid) and XXI (CHIP).
Section 1139A(c)(1)(B) of the Act specifically requests information gathered from the external
quality reviews (EQRs) of managed care organizations (MCOs) 19 and benchmark plans. 20 The
Secretary of the Department of Health and Human Services (HHS) is required to make this
information publicly available annually. This year’s report provides a snapshot of states’
performance on the Child Core Set measures for which at least 25 states provided information to
CMS.
15
http://www.medicaid.gov/Medicaid-CHIP-Program-Information/By-Topics/Quality-of-Care/Downloads/2012Ann-Sec-Rept.pdf.
16
For additional information, see Table I.16 in “2012 CMS Statistics,” available at http://www.cms.gov/ResearchStatistics-Data-and-Systems/Research/ResearchGenInfo/CMSStatistics.html.
17
http://kff.org/other/state-indicator/children-0-18/.
18
Section 1139A(c)(2) of the Social Security Act, as amended by Section 401(c) of CHIPRA.
19
Established under the authority of Section 1932 of the Social Security Act.
20
Established under the authority of Sections 1937 and 2103 of the Social Security Act.
1
This page left blank for double-sided copying.
II. STATE-SPECIFIC FINDINGS ON QUALITY AND ACCESS IN MEDICAID AND CHIP
A. Quality Measurement Using the Core Set of Children’s Health Care Quality Measures
For the past three years, CMS and its partner states have continued to break new ground with
standardized reporting on CMS’s core set of children’s health care quality measures (Child Core
Set). 21 The 2010 Secretary’s Report signaled the first time CMS released state-specific
information from voluntary reporting on the Child Core Set, an important milestone in CMS’s
efforts to uniformly measure and report on the quality of care obtained by children covered by
Medicaid/CHIP. Over the next two years, states continued to improve the quality and
completeness of the data they collected and reported for the Child Core Set measures.
For FFY 2012, CMS set the following internal goals for quality measurement and improvement:
•
Increase the number of states reporting on the core measures
•
Maintain or increase the number of measures reported by each state
•
Improve the completeness of the data reported (that is, report on both Medicaid and
CHIP enrollees)
•
Streamline data collection and reporting processes, to the extent possible
•
Assess states’ managed care performance improvement projects (PIPs) related to the
core measures
•
Support states to drive improvements in health care quality at the local level using
data from the Child Core Set
CMS continues to work with states, through its Quality Measures Technical Assistance and
Analytic Support (TA/AS) Program, to improve the completeness and accuracy of the data
reported, and to support states’ efforts to build internal capacity to conduct quality improvement
projects. Over the past year, CMS’s TA/AS program provided support to states in understanding
the technical aspects of collecting and reporting the Child Core Set measures through technical
assistance webinars on calculating state-level rates, collecting the Consumer Assessment of
Healthcare Providers and Systems (CAHPS®) survey data, and reporting the developmental
delays screening core set measure. 22
Section 1139A(b)(5) of the Social Security Act provides that, beginning January 1, 2013, and
annually thereafter, the Secretary shall publish recommended changes to the Initial Child Core
Set. Part of the process of collecting, reporting, and using the Child Core Set measures is to
establish a way to periodically identify new measures for possible inclusion in the Child Core
21
For a list of the Child Core Set measures, please see Table 1 at http://www.medicaid.gov/Medicaid-CHIPProgram-Information/By-Topics/Quality-of-Care/Downloads/Overview-of-the-Child-Core-Set-Measures-FFY2012.zip.
22
These resources are available at http://www.medicaid.gov/Medicaid-CHIP-Program-Information/ByTopics/Quality-of-Care/CHIPRA-Initial-Core-Set-of-Childrens-Health-Care-Quality-Measures.html.
3
Set. This process serves several purposes: (1) build upon the original measure set by addressing
gap areas, (2) improve upon existing Initial Child Core Set measures, and (3) better align with
national quality measurement activities. The intended result is a Child Core Set that is more
robust and better able to support states’ and CMS’s quality measurement needs. CMS issued a
January 2013 state health official letter outlining updates to the Initial Child Core Set and the
multi-stakeholder process used to inform the decision-making process. 23 Three measures were
added as a result of this process and one of the Initial Child Core Set measures was retired due to
reporting challenges cited by state Medicaid and CHIP agencies. 24 States choosing to voluntarily
report these new measures can submit data to CMS during the FFY 2013 reporting cycle.
Related to ensuring that measures are relevant to current approaches to health care delivery and
reflect updates to clinical guidelines and feedback from states is devoting the resources necessary
to continue developing the pediatric measurement field. Through a partnership with the Agency
for Healthcare Research and Quality (AHRQ), CMS has spent the past three years working with
the seven Centers of Excellence (COEs) that comprise the AHRQ-CMS Pediatric Quality
Measures Program (PQMP). 25 CMS funded grants to these centers, administered by AHRQ, of
$60 million over four years. Additionally, CMS continues to work with the Office of the
National Coordinator for Health Information Technology (ONC) to develop pediatric measures
in areas that support the gaps in the Child Core Set and that can be collected through an
electronic health record (EHR).
As with the measures themselves, the data systems and sources used to collect information and
monitor progress are also subject to periodic adjustments. Learning from the experiences of the
past three years of reporting, CMS has made additional refinements to the CMS CARTS
reporting system, the vehicle states use to report the children’s quality measures to CMS. In FFY
2012, CMS decided to abstract data from other sources on behalf of the states for three Child
Core Set measures: (1) preventive dental services, (2) dental treatment services, and (3) neonatal
central line-associated blood stream infection (CLABSI) rates. Because the two dental measures
parallel the reporting on lines 12b and 12c of Form CMS-416, CMS has begun calculating these
measures on behalf of states using data from that report. Also, as hospitals already report data for
the CLABSI measure to the Centers for Disease Control and Prevention’s (CDC’s) National
Healthcare Safety Network (NHSN), CMS now collaborates with the CDC to obtain state-level
data for Child Core Set reporting.
CMS has also continued to make progress toward a modernized and streamlined Medicaid and
CHIP data infrastructure known as the Medicaid and CHIP Business Information Solutions
(MACBIS) initiative. In the future, information collected as part of MACBIS will serve as the
23
The 2013 Children’s Core Set of Health Care Quality Measures state health official letter is available at
http://www.medicaid.gov/Federal-Policy-Guidance/downloads/SHO-13-002.pdf.
24
The three measures added to the Child Core Set in 2013 are: Medication Management for People with Asthma,
Human Papilloma Virus (HPV) Vaccination for Female Adolescents, and Behavioral Health Risk Assessment (for
pregnant women). One measure was retired: Otitis Media with Effusion (OME)–Avoidance of Inappropriate
Systemic Antimicrobials in Children (ages 2–12).
25
Additional information on the PQMP is available at http://www.ahrq.gov/policymakers/chipra/pqmpback.html.
4
primary data source for the Center for Medicaid and CHIP Services’ (CMCS’s) quality reporting
and performance measurement capacities for Medicaid and CHIP. CMS expects that these efforts
will (1) help ensure that information is more accurate, complete, and uniform; (2) reduce burden
on our state partners; and (3) have the potential to strengthen quality reporting for children,
reduce health care costs associated with inefficiencies in the health care delivery system, and
ultimately facilitate better health outcomes for children.
CMS undertook the following activities to assess the status of quality measurement, reporting,
and improvement efforts by states for the 2013 Secretary’s Report:
•
Reviewing and analyzing findings on the Child Core Set measures reported to CMS
by states for FFY 2012, including detailed analyses of 16 measures reported by at
least 25 states (see the Appendix for profiles on these measures)
•
Analyzing data submitted by states on the CMS-416
•
Reviewing and analyzing neonatal CLABSI data submitted to CDC’s NHSN
•
Abstracting and summarizing information on the quality measures and PIPs reported
in the EQR technical reports from states that contract with managed care plans to
deliver services to Medicaid and CHIP enrollees
B. Changes in State Reporting of the Child Core Set for FFY 2012
One of CMS’s quality measurement-related goals is to work with states to improve the
completeness of data reported (that is, to include both Medicaid and CHIP enrollees). CMS
continues to encourage states to report data on the Child Core Set that include both Medicaid and
CHIP populations. The number of states reporting at least one measure for both Medicaid and
CHIP enrollees has increased consistently over the past three years, from 23 states in FFY 2010
to 34 states in FFY 2011 and 38 states in FFY 2012 (Table 2).
The third year of voluntary reporting also saw an overall increase in the number of states
reporting child core measures and the number of measures reported by each state. In FFY 2012,
the number of states reporting on the Child Core Set was 51, up from 49 in FFY 2011 and 43 in
FFY 2010 (Figure 1). This steady increase in the number of states reporting from FFY 2010 to
FFY 2011 can be attributed to various factors, including increased familiarity with the measures
by states and technical assistance support provided by CMS. In addition, the increase in reporting
in FFY 2012 is due in part to CMS’s streamlining of state reporting of the Child Core Set
measures. 26,27 Altogether, 35 states reported at least 11 of the 22 core measures to CMS in FFY
26
Beginning in FFY 2012, to minimize state burden, the two dental measures were calculated using data reported by
states on Form CMS-416. Beginning in FFY 2012, data for the CLABSI measure were obtained from the National
Healthcare Safety Network. The measure, otitis media with effusion, was not collected for FFY 2012 and was
retired in 2013.
27
For information on the number of states reporting each measure as well as the reasons for not reporting, see Table
7 at http://www.medicaid.gov/Medicaid-CHIP-Program-Information/By-Topics/Quality-ofCare/Downloads/Overview-of-the-Child-Core-Set-Measures-FFY-2012.zip.
5
2012 (Figure 2). 28 Two states, Florida and Tennessee, reported 22 of the core measures for FFY
2012.
The median number of measures reported by each state also continued to increase gradually over
the past three years, moving from 7 in FFY 2010 to 12 in FFY 2011 and 14 in FFY 2012. While
three measures were reported by fewer states for FFY 2012 than for FFY 2011, 29 and three other
measures were reported by the same number of states over the same period, 30 all other measures
saw increases in reporting for FFY 2012 (Figure 1). The measures with the largest increases in
reporting from FFY 2011 to FFY 2012 were:
•
Body Mass Index (BMI) Assessment for Children and Adolescents (increased from
18 to 27 states reporting)
•
Frequency of Ongoing Prenatal Care (increased from 18 to 25 states reporting)
•
Appropriate Testing for Children with Pharyngitis (increased from 28 to 36 states
reporting)
The increase in the number of measures reported by states allowed CMS to conduct deeper
analysis on 16 Child Core Set measures reported by 25 or more states for FFY 2012. 31 State
performance on these measures (including percentiles, trends, and geographic variation) is
profiled in the Appendix. 32
C. Summary of Key Findings
This section summarizes CMS’s analysis of state performance on 16 frequently reported
measures for FFY 2012 (Table 3). 33 The most frequently reported measures reflect a continuum
of quality measures within the maternal and child health population, including overall access to
28
The base of 22 measures excludes the CLABSI measure, for which data were obtained from the CDC’s NHSN
beginning in FFY 2012, and the OME measure, which was not collected for FFY 2012 and was retired in 2013
because it draws on CPT-II codes not commonly used by Medicaid/CHIP agencies.
29
Well-Child Visits in the First 15 Months of Life; Well-Child Visits in the Third, Fourth, Fifth, and Sixth Years of
Life; and Child and Adolescent Access to Primary Care Practitioners.
30
Adolescent Well-Care Visits; Preventive Dental Services; and Dental Treatment Services.
31
Although 17 measures were reported by at least 25 states for FFY 2012, the Ambulatory Care: Emergency
Department visits measure is not profiled in the Appendix due to data quality issues.
32
These 16 measures were profiled because they were consistently reported by at least 25 states for FFY 2012 using
core set specifications. Trends were calculated for 6 of the 16 measures for which at least 20 states reported data for
FFY 2010–2012 using core set specifications.
33
For a comparison of state Medicaid/CHIP and commercial medians for key measures, see Table 6 at
http://www.medicaid.gov/Medicaid-CHIP-Program-Information/By-Topics/Quality-of-Care/Downloads/Overviewof-the-Child-Core-Set-Measures-FFY-2012.zip.
6
primary care and use of well-child care, timeliness and frequency of prenatal care, management
of acute and chronic conditions, and use of dental and oral health services (Figure 3). 34
1.
Primary Care Access and Preventive Care
States continued to have high performance rates on the children’s primary care access measure,
as reflected by the state median among the 43 states reporting the measure for FFY 2012. As
shown in Table 3, the state median of the percentage with a visit to a primary care practitioner
(PCP) was highest for children ages 12 to 24 months (97 percent had at least one PCP visit in the
past year), and lowest for children ages 25 months to 6 years (88 percent). Among older children,
most had a PCP visit in the past two years (the state median was 91 percent for children ages 7 to
11 and 89 percent for children ages 12 to 19).
Despite high rates of overall PCP access, fewer children received well-child care according to
the periodicity schedule recommended by the American Academy of Pediatrics and Bright
Futures. 35 For example, nine well-child visits are recommended during the first 15 months of
life. As shown in Table 3, about two-thirds of infants received six or more visits (the state
median was 62 percent).
Adolescents ages 12 to 21 had the lowest well-care visit rate of all age groups. The state median
for the adolescent well visit rate was 42 percent in FFY 2012. Table 3 also shows that the median
adolescent immunization rate was 60 percent; 50 percent of sexually active women ages 16 to 20
were screened for Chlamydia; and BMI percentile documentation in the medical record was 39
percent for children in FFY 2012.
2.
Perinatal Health
State reporting on two of the maternity care measures in the Child Core Set doubled over the past
three years, from 15 to 31 states for the timeliness measure, and from 12 to 25 states for the
frequency of ongoing prenatal care measure (Figure 1). The state median for timely prenatal care
(care in first trimester or within 42 days of enrollment) was 83 percent (Table 3). About 6 in 10
women received the expected number of visits (based on when they enrolled in Medicaid/CHIP
and when they delivered).
34
In previous Secretary’s Reports, data from the Consumer Assessment of Healthcare Providers and System
(CAHPS®) survey were included to provide important information on consumer experiences with care, a dimension
of quality of care. Although states are asked to report in CMS’s CARTS system whether they collected the CAHPS
survey data, CMS does not accept raw data from states into the system, but rather analyzes data voluntarily
submitted by states to AHRQ’s National CAHPS Benchmarking Database for this report. Due to contractual issues,
the Benchmarking Database was unavailable at the time of this writing, and data collected for 2012 were similarly
inaccessible. CMS aims to include data from the CAHPS survey in the 2014 Secretary’s Report.
35
American Academy of Pediatrics. “Recommendations for Preventive Pediatric Health Care.” Practice
Management Online at
http://brightfutures.aap.org/pdfs/AAP%20Bright%20Futures%20Periodicity%20Sched%20101107.pdf.
7
3.
Management of Acute and Chronic Conditions
The growth in state reporting of the Child Core Set is also facilitating an increased understanding
by CMS about the clinical quality of care provided to children in Medicaid and CHIP. Four
measures of the management of acute and chronic conditions available for analysis in FFY 2012
indicate:
4.
•
About two-thirds (a state median of 69 percent) of children diagnosed with
pharyngitis and receiving an antibiotic had a strep test (Table 3).
•
Among children prescribed ADHD medication, the state median for a follow-up visit
during the first 30 days (known as the initiation phase) was 41 percent, and of the
children with a visit during the initiation phase, 53 percent had a visit during the next
nine months (known as the continuation and maintenance phase; Table 3).
•
Among the 40 states with state-level rates for central line-associated blood stream
infections (CLABSIs) in neonatal intensive care units (NICUs), 28 had a significant
decrease in CLABSI infections since the 2006–2008 baseline period, and 12 had no
change in infections since the baseline period. 36 No states had a significant increase in
infections. The Standardized Infection Ratio (SIR) in NICUs was 0.65 in 2011,
compared with a national goal of 0.51 by the end of 2013. 37 These data suggest there
is room for improvement for states to reach the national goal of reducing CLABSIs
by 50 percent by the end of 2013. 38
Dental and Oral Health Services
All children enrolled in Medicaid and CHIP have coverage for dental and oral health services.
Children’s access to oral health care continues to be a primary focus of improvement efforts in
Medicaid and CHIP. Among children ages 1 to 20 enrolled in Medicaid and CHIP Medicaid
Expansion programs (those eligible for Early and Periodic Screening, Diagnostic, and Treatment
[EPSDT]), 44 percent received a preventive dental service in FFY 2011 and 24 percent received
36
See Table CLABSI at http://www.medicaid.gov/Medicaid-CHIP-Program-Information/By-Topics/Quality-ofCare/Downloads/Performance-on-the-Child-Core-Set-Measures-FFY-2012.zip.
37
The SIR is the summary measure used to track CLABSIs over time. It compares the number of infections reported
in a given year to the number that would be predicted based on national, historical baseline data that adjust for the
type of facility and patient population. The SIR indicates whether the rate of infections increased, decreased, or did
not change significantly relative to the baseline (calculated using data for 2006–2008). The SIR is evaluated based
on the 95 percent confidence interval, standardized to a baseline of 1. This measure is obtained from data reported
by hospitals to the CDC NHSN. It includes all neonatal CLABSI incidents not just those for infants covered by
Medicaid/CHIP. For further information on the methods used to assess state performance, see the 2011 National and
State Healthcare-Associated Infections Standardized Infection Ratio Report, available at
http://www.cdc.gov/hai/pdfs/SIR/SIR-Report_02_07_2013.pdf.
38
More information about CDC's NHSN Healthcare-associated Infections Summary Data Reports is available at
http://www.cdc.gov/hai/surveillance/QA_stateSummary.html.
8
a dental treatment service (Table 3). 39 These rates are similar to those reported by states in FFY
2010. In 11 states, however, at least half of children received a preventive dental service in FFY
2011 (Alabama, Colorado, Connecticut, District of Columbia, Maryland, Massachusetts, New
Hampshire, South Carolina, Texas, Vermont, and Washington).
39
The two core set dental measures are obtained from data reported by states in the CMS-416 reports. States are to
submit the CMS-416 report to CMS by April 1 of each year. At the time of this writing, CMS had not received
enough FFY 2012 data from states to make meaningful comparisons, so this report includes FFY 2011 data.
9
This page left blank for double-sided copying.
III. MONITORING AND IMPROVING CARE FOR CHILDREN ENROLLED IN
MANAGED CARE
In FFY 2012, 64 percent of publicly insured children obtained their care through managed care
plans (Table 1). The rate of managed care enrollment varied widely across state Medicaid and
CHIP programs, ranging from 17 percent of children in Iowa to 95 percent of children in both
Maryland and Michigan. Regardless of the rate of managed care enrollment, states implementing
a managed care delivery system must comply with certain federal requirements, including
standards related to assessing and monitoring the quality of care provided by contracted managed
care plans. This chapter summarizes CMS’s and states’ activities related to monitoring and
improving care for children enrolled in managed care.
A. Overview
The Balanced Budget Act of 1997 created system-wide quality standards for states opting to use
managed care for the delivery of health care in Medicaid or CHIP. 40 Federal regulations
implemented in 2003 require states to perform an annual EQR for each contracted MCO, prepaid
inpatient health plan (PIHP), and health insuring organization (HIO). 41,42 These annual EQRs
analyze and evaluate information on quality, timeliness, and access to the health care services
that an MCO or PIHP, and their contractors, furnish to Medicaid beneficiaries. Section 1139A(c)
of the Social Security Act, as amended by Section 401 of CHIPRA, requires the HHS Secretary
to include in this annual report the information that states collect through EQRs of MCOs and
PIHPs participating in Medicaid or CHIP. 43
Federal managed care regulations 42 CFR 438.300 et seq. lay out the parameters for conducting
an EQR, including state responsibilities, qualifications of an external quality review organization
(EQRO), federal financial participation, and state deliverable requirements. Per the regulations,
the state, its agent (not an MCO or PIHP), or an EQRO may perform eight EQR-related
activities. The following three of these activities are mandatory:
40
Codified at Section 1932(c) of the Social Security Act.
41
See 42 CFR 438.2 for full definitions of a PIHP and HIO.
42
The external quality review requirement applies to Medicaid programs and CHIP Medicaid expansion programs.
For separate CHIP programs, the external quality review requirement became law with the enactment of CHIPRA.
Specifically, Section 403 of CHIPRA requires all states that operate a CHIP managed care program to comply with
the requirements of Section 1932 of the Social Security Act.
43
Section 1139A(c) of the Social Security Act also requires the reporting of state-specific information on the quality
of health care furnished to children in benchmark plans under Sections 1937 and 2103 of the Act. There are
currently no separate state reporting requirements for benchmark plans other than the EQR reporting process
required for states contracting with MCOs and PIHPs. In other words, state EQR technical reports must include
information related to benchmark plans that deliver care through MCOs or PIHPs; however, because this
information is reported in the aggregate, which is allowable under EQR requirements, detailed data are not available
for benchmark plans.
11
1. Validation of performance measures 44
2. Validation of PIPs
3. A review, at least every 3 years, to determine the managed care plan’s compliance
with state standards for access to care, structure and operations, and quality
measurement and improvement
The state may choose to perform up to five additional, optional EQR-related activities. 45 A
statutorily required set of CMS EQR Protocols provide instruction to states and EQROs on the
standards for conducting the eight EQR-related activities. 46 In October 2012, CMS revised the
EQR Protocols for the purpose of standardizing and strengthening managed care quality
monitoring and improvement activities in Medicaid and CHIP.
In accordance with regulations, the EQRO must produce an annual technical report for the state
that assesses the quality, timeliness, and access to care provided by each managed care plan. This
report must also include an assessment of each MCO’s or PIHP’s strengths and weaknesses with
respect to quality and set forth recommendations for improving the quality of health care
provided by each managed care entity. Per regulations, the EQR technical report is a public
document, available upon request to all interested parties. Annually, CMS reviews each state’s
EQR technical report for evaluation and follow-up.
B. External Quality Review Technical Reports Submitted to CMS for the 2012–2013 Reporting
Cycle
Of the 41 states 47 that contracted with MCOs or PIHPs during the 2012–2013 reporting cycle, 33
submitted EQR technical reports to CMS. 48 These states contracted with 16 different EQROs to
conduct the annual EQR, and 4 EQROs conducted reviews for multiple states in 2012–2013. 49
44
In accordance with 42 CFR 438.240, states that use Medicaid managed care must require each MCO and
PIHP to annually measure and report to the state its performance using standard measures specified by the state or
MCO. States are then required to validate any performance measures reported by the MCO or PIHP during the
preceding 12 months. 42 CFR 438.320 defines validation as the review of information, data, and procedures to
determine the extent to which they are accurate, reliable, free from bias, and in accord with standards for data
collection and analysis.
45
Refer to 42 CFR 438.358 for a comprehensive list of EQR-related activities.
The CMS EQR Protocols are available under “Technical Assistance Documents” at
http://www.medicaid.gov/Medicaid-CHIP-Program-Information/By-Topics/Quality-of-Care/Quality-of-CareExternal-Quality-Review.html.
46
47
For purposes of EQR, the term “states” includes the 50 states, the District of Columbia, and the territories.
48
Alabama, Alaska, Arkansas, Connecticut, Guam, Idaho, Maine, Montana, New Hampshire, Oklahoma, South
Dakota, the Virgin Islands, and Wyoming do not have MCOs or PIHPs that enroll children covered by Medicaid or
CHIP. Mississippi and North Dakota were not required to submit EQR technical reports for the 2012–2013
reporting cycle. Kentucky, Louisiana, North Carolina, Ohio, Puerto Rico, and Texas did not submit EQR technical
reports before May 13, 2013, for inclusion in this analysis.
49
For a list of EQROs with current state Medicaid contracts in 2013, see Table EQR 1 at
http://www.medicaid.gov/Medicaid-CHIP-Program-Information/By-Topics/Quality-of-Care/Downloads/Findingsfrom-EQR-Technical-Reports-2012-2013-.zip.
12
The 2012–2013 EQR technical reports revealed that managed care entities engage in a variety of
different quality measurement and improvement efforts, based on the states’ priorities and other
factors, such as clinical areas in need of improvement.
The 33 EQR technical reports varied considerably in their organization, level of detail, and focus
of the discussion on quality, access, and timeliness of care. This variation is a byproduct of a
difference in state interpretation of regulatory language. For example, although the regulations
require states to annually validate performance measures and PIPs, they do not specifically
require them to include details about outcomes or interventions. Therefore, some states choose to
include this information in the final EQR technical report, while others do not.
To improve the content of the EQR technical reports, CMS included language in the updated
CMS EQR Protocols encouraging states to include outcomes and interventions information.
CMS also recently began providing feedback to states that submit EQR technical reports. This
feedback aims to assist states in producing EQR technical reports that include more meaningful
information about the quality of care each managed care plan provides to Medicaid/CHIP
enrollees. Additionally, because the regulations only require states to produce EQR technical
reports annually, the updated CMS EQR Protocols encourage states to submit the EQR technical
report to CMS and the public by April 30 of each year.
C. Reporting of Performance Measures in 2012–2013 External Quality Review Technical
Reports
Of the 33 EQR technical reports submitted for the 2012–2013 reporting cycle, every state except
one identified the performance measures reported by MCOs and PIHPs. The most frequently
reported performance measures focused on childhood immunization rates, well-child visits,
adolescent well-care visits, and prenatal care, and are similar to those included in the Child Core
Set (Figure 4). In the 2012–2013 reporting cycle:
•
Thirty of the 33 EQR technical reports included the performance rates achieved by
each MCO or PIHP for all performance measures evaluating children or pregnant
women. Some states listed each measure and the performance rate achieved by the
MCO or PIHP, while other states also included context for the performance rates
achieved by the MCO or PIHP and suggestions for improving future performance.
•
Nine states reported performance rates for subpopulations within their state.
Colorado, Michigan, Minnesota, New Mexico, Rhode Island, Kansas, Nevada, and
New York separately reported performance for different Medicaid populations,
including children and families. Florida and New York included performance rates
for different geographic regions within the state.
•
Twenty-six states compared performance in the 2012–2013 reporting cycle to
performance in previous years; 23 states compared performance by MCOs and PIHPs
to national Healthcare Effectiveness and Information Data Set (HEDIS®) Medicaid
rates; and 20 states included statewide managed care performance rates.
13
D. Description of Performance Improvement Projects in 2012–2013
Thirty of the 33 EQR technical reports submitted for the 2012–2013 reporting cycle included
PIPs specific to children or pregnant women. Among these states, the number of PIPs for
children or pregnant women varied (Table 4). For example, while most states conducted 10 or
fewer PIPs during the reporting cycle, Florida had 37 PIPs aimed at improving well-child care
visit rates and 23 PIPs focused on improving the quality of mental health care for children or
pregnant women.
PIP topics, target populations, and interventions and activities were generally specific to each
MCO or PIHP in a state, but 18 states mandated PIP topics or required MCOs or PIHPs to
engage in collaborative PIPs on priority health care topics. 50 For example, Georgia, Missouri,
and New Jersey required all MCOs to implement PIPs to improve dental care for children;
Pennsylvania required all five PIHPs to implement PIPs on promoting healthy weight through
screening, physical activity, and nutrition counseling; and Arizona required MCOs to implement
PIPs to improve asthma care.
As in previous years, many states had PIPs to improve prenatal and postpartum care. In the
2012–2013 reporting cycle, states also frequently reported PIPs on improving well-care visits for
children and adolescents, childhood immunization rates, asthma, weight assessment, and BMI
counseling. All 33 EQR technical reports indicated that the EQR validated PIPs as required by
the managed care regulations.
There were some shifts in PIP topics over the last three reporting cycles among the 28 states that
submitted reports for all three years (Figure 5). The number of states conducting weight
assessment/BMI PIPs increased and the number of dental care PIPs decreased. Some PIP topics
were undertaken by similar numbers of states in all three reporting cycles, but the states
conducting the PIPs shifted. For example, of the states reporting PIPs on weight assessment/BMI
in 2011–2012 and 2012–2013, only five completed PIPs on this topic during both reporting
cycles. No states reported behavioral health or ADHD PIPs during the 2012–2013 reporting
cycle. Changes in PIP topics may reflect changing health care priorities in these states or that
progress was achieved in improving care. Since EQR technical reports are not required to
include outcomes data on PIPs from previous years, CMS’s ability to assess performance
improvements realized from these projects is limited.
E. Focused Review of Performance Improvement Projects
Although states may contract with their EQRO to provide detailed interventions and outcomes
data related to PIPs, the current regulations do not explicitly require states to submit this
information to CMS. Education and outreach for members, providers, and communities are
common interventions across the profiled health topics, but interventions vary significantly
50
States that mandated PIP topics for MCOs or PIHPs include Arizona, Delaware, District of Columbia, Florida,
Georgia, Hawaii, Illinois, Maryland, Michigan, Minnesota, Missouri, Nevada, New Jersey, Pennsylvania, Rhode
Island, South Carolina, Virginia, and Washington.
14
across topic areas and MCOs. Over the next year, CMS plans to continue to share best practices
and innovations to encourage further quality improvement in these areas and others.
Overall, the analyses of PIP design and implementation provided in the current EQR technical
reports were more comprehensive than those provided in the 2011–2012 reporting cycle;
however, descriptions of PIPs frequently lacked key details. Discussions of the EQRO findings
on the performance, progress, and limitations of each PIP differed greatly across reports. These
factors have limited CMS’s ability to provide comprehensive outcomes information on the
efficacy of states’ quality improvement efforts for children enrolled in managed care.
This section presents findings from detailed abstractions of EQRO reporting on PIPs in four
CMS priority health topic areas: (1) childhood obesity, (2) dental care, (3) prenatal and
postpartum care, and (4) adolescent well care. 51 An example of a state PIP, including
interventions and outcomes (where available), is provided for each priority topic area.
1.
Childhood Obesity
Eleven states reported childhood obesity-related PIPs for one or more health plans during this
reporting cycle (Table 5). Nine states focused on this topic during the previous reporting cycle,
and five states reported PIPs on this topic across both cycles. Reported PIPs mainly focused on
improving BMI percentile documentation, nutrition counseling, and physical activity counseling.
Only two states (Georgia and West Virginia) reported baseline and post-intervention
performance rates.
For example, Michigan was one of four states to mandate PIPs aimed at reducing childhood
obesity. PIPs resulted in improved performance across MCOs. Interventions in Michigan
included community outreach and education such as grants to elementary schools to implement
programs to promote healthy eating and exercise habits, and sponsorship/partnership of
community wellness events. Care delivery changes included a county partnership to provide
reimbursement for dietician visits, nutritional counseling programs, and revised policies and
procedures for services related to childhood weight management. Interventions for providers
included training in conducting exercise programs, office visits, profile reports to identify
members with special needs, and initiatives to align clinical practices with evidence-based
practices. Member-focused interventions included education, incentives, reminder calls and
letters, and educational newsletters.
2.
Dental Care
During this reporting cycle, managed care plans in three states conducted mandatory PIPs
focused on improving performance on the annual dental visit rate (Table 6). All states currently
reporting dental PIPs also reported PIPs on this topic during the 2011–2012 cycle.
51
Additional information on “Findings from EQR Technical Reports, 2012-2013” is available at
http://www.medicaid.gov/Medicaid-CHIP-Program-Information/By-Topics/Quality-of-Care/Downloads/Findingsfrom-EQR-Technical-Reports-2012-2013-.zip.
15
In Georgia, for example, the PIPs resulted in a statistically significant improvement over the
baseline rate for the annual dental visit measure for children ages 2 to 21 for all MCOs.
Interventions in Georgia included community outreach and education through dental events,
providing dental services to members via a mobile van, and dental presentations at local Head
Start locations. Provider-focused interventions included a pay-for-performance program for highvolume practices that improved quality scores, missed opportunity reports, handbooks, and
annual dental rate report cards to providers. Member-focused interventions included outreach
and education such as telephone calls to remind members of their dental benefits and to offer
assistance in finding a dentist, missed appointment reminders, and educational newsletters.
3.
Prenatal/Postpartum Care
PIPs targeting prenatal or postpartum care were conducted in 13 states during this reporting cycle
(Table 7). Sixteen states completed PIPs on this topic during the previous reporting cycle, and 10
states conducted PIPs in both reporting cycles.
For example, Illinois mandated PIPs on prenatal/postpartum care during this reporting cycle.
Three MCOs collected performance data on the perinatal HEDIS® measures along with rates of
depression screening and treatment. Although the results across measures and MCOs were
mixed, the EQRO reported strong performance in the design and implementation phases for
these PIPs. Interventions also varied by MCO and included care delivery changes such as referral
of high-risk cases to additional services. Outreach and education interventions for members
included health-related text messaging (for prenatal health, mental health, and health education)
and family case management services, and provider interventions included immunization
incentives and educational materials.
4.
Adolescent Well Care
During this reporting cycle, six states reported PIPs aimed at improving rates of adolescent wellcare visits (Table 8). Three of these states reported PIPs on this topic during both the 2011–2012
and 2012–2013 reporting cycles. At the time the EQR technical reports were drafted, the PIPs in
four states (Maryland, Oregon, Virginia, and West Virginia) were in the first year of
implementation and able to report only baseline data. Two of the six states (Hawaii and
Maryland) provided details on their interventions.
For example, Maryland required all MCOs to conduct PIPs on adolescent well care. The MCOs
incorporated multiple interventions for both members and providers. Interventions related to care
delivery included the use of school-based clinics and Saturday appointments. Member-focused
interventions included outreach and education such as health fairs at pediatric offices for
members without well-care visits, focused outreach calls and other reminders to members, and
incentives for completing visits. Provider interventions included reports on members without
well-child visits and incentives to schedule well-child visits. Systems-focused interventions
included hiring additional staff, such as provider relations liaisons and outreach representatives.
16
IV. SUMMARY AND CONCLUSION
The 2013 Secretary’s Report on the Quality of Care for Children in Medicaid and CHIP
documents the substantial progress made by HHS and states in building a solid foundation for
national, cross-state quality measurement and improvement in Medicaid/CHIP. All states
reported two or more of the Child Core Set measures for FFY 2012, and both the number of
states reporting and the number of measures reported by states reflect progress over last year.
Although some variation remains in the populations included, 38 states now include both
Medicaid and CHIP populations in one or more measures, up from 34 states for FFY 2011.
Additionally, CMS’s detailed review of performance improvement projects summarized in the
EQR technical reports from the 2012–2013 reporting cycle identified the many state-initiated
efforts under way to improve the quality of care for children enrolled in managed care.
This report provides evidence that, across all states, Medicaid and CHIP provide an important
source of access to primary care and other services for children. It also highlights opportunities
to improve care for children, including their use of preventive dental services and adolescent
care, and the need to improve the content of the clinical care provided (as measured by
immunization rates, Chlamydia screening rates, and appropriate testing for pharyngitis).
To help states further improve the completeness and consistency of their reporting and their
performance, CMS has undertaken several efforts including: (1) continuing the Quality Measures
Technical Assistance and Analytic Support Program, (2) providing better oversight and
monitoring of data submitted on Form CMS-416, and (3) better aligning quality measurement
and reporting efforts across Medicaid/CHIP-related activities. With access to data on a
comprehensive set of performance measures and efforts under way to improve the stability of
coverage for children in Medicaid/CHIP, HHS now has a greater capacity to work toward its
goal of achieving a high quality system of coverage and care for all children enrolled in
Medicaid/CHIP.
17
This page left blank for double-sided copying.
TABLES
Table 1
Number and Percentage of Children Enrolled in Medicaid or CHIP by State and
Service Delivery Type, FFY 2012 ............................................................................................ 21
Table 2
Overview of State Reporting of the Core Set of Medicaid/CHIP Children’s Health
Care Quality Measures, FFY 2012 ........................................................................................... 23
Table 3
Performance Rates on Frequently Reported Medicaid/CHIP Children’s Health
Care Quality Measures, FFY 2012 ........................................................................................... 25
Table 4
Performance Improvement Projects (PIPs) Targeting Children or Pregnant
Women Included in External Quality Review (EQR) Technical Reports, 2012–
2013 Reporting Cycle, by Topic Area ...................................................................................... 26
Table 5
Childhood Obesity Performance Improvement Projects (PIPs) Included in
External Quality Review (EQR) Technical Reports, 2012–2013 Reporting Cycle.................. 28
Table 6
Dental Care Performance Improvement Projects (PIPs) Included in External
Quality Review (EQR) Technical Reports, 2012–2013 Reporting Cycle ................................ 29
Table 7
Prenatal/Postpartum Care Performance Improvement Projects (PIPs) Included in
External Quality Review (EQR) Technical Reports, 2012–2013 Reporting Cycle.................. 30
Table 8
Adolescent Well-Care Performance Improvement Projects (PIPs) Included in
External Quality Review (EQR) Technical Reports, 2012–2013 Reporting Cycle.................. 31
19
This page left blank for double-sided copying.
Table 1. Number and Percentage of Children Enrolled in Medicaid or CHIP by State and Service Delivery Type, FFY 2012
21
State
(CHIP Program Type)
Total
Medicaid/CHIP
Enrollment
Managed Care
(Number)
U.S. Total
44,453,639
28,317,604
64
9,958,975
22
6,177,060
14
Alabama (S)a
Alaska (M)
Arizona (S)
Arkansas (C)
California (C)
979,066
98,425
967,179
521,520
6,324,764
48,284
0
874,311
0
4,834,393
5
0
90
0
76
112,972
98,425
92,868
521,520
1,490,371
12
100
10
100
24
817,810
0
0
0
0
84
0
0
0
0
Colorado (S)
Connecticut (S)
Delaware (C)
D.C. (M)
Florida (C)
611,051
333,231
102,394
99,777
2,470,453
169,135
6,720
95,327
89,574
1,471,027
28
2
93
90
60
430,030
326,511
4,957
10,203
326,885
70
98
5
10
13
11,886
0
2,110
0
672,541
2
0
2
0
27
Georgia (S)
Hawaii (M)
Idaho (C)
Illinois (C)
Indiana (C)
1,422,184
183,884
254,809
2,657,779
853,624
1,219,526
163,899
0
157,528
753,246
86
89
0
6
88
202,658
19,985
0
955,179
100,354
14
11
0
36
12
0
0
254,809
1,545,072
24
0
0
100
58
0
395,317
294,176
568,450
823,298
212,931
66,938
227,201
413,924
336,547
0
17
77
73
41
0
116,166
56,669
151,631
103,927
80,428
29
19
27
13
38
212,213
10,306
2,895
382,824
132,503
54
4
1
46
62
606,931
652,310
1,286,270
503,961
550,703
589,257
302,323
1,232,144
376,374
117,948
97
46
96
75
21
17,674
163,919
54,126
127,587
432,755
3
25
4
25
79
0
186,068
0
0
0
0
29
0
0
0
657,378
106,781
223,269
276,783
105,954
394,400
0
175,446
207,117
0
60
0
79
75
0
262,978
28,596
47,823
69,666
105,954
40
27
21
25
100
0
78,185
0
0
0
0
73
0
0
0
Iowa (C)
Kansas (S)
Kentucky (C)
Louisiana (C)
Maine (C)
Maryland (M)
Massachusetts (C)
Michigan (C)
Minnesota (C)
Mississippi (S)
Missouri (C)
Montana (C)
Nebraska (C)
Nevada (C)
New Hampshire (M)
Managed Care
(Percentage)
Fee-for-Service
(Number)
Fee-for-Service
(Percentage)
Primary Care Case
Management
(Number)
Primary Care Case
Management
(Percentage)
Table 1 (continued)
State
(CHIP Program Type)
Total
Medicaid/CHIP
Enrollment
Managed Care
(Number)
Managed Care
(Percentage)
Fee-for-Service
(Number)
Fee-for-Service
(Percentage)
Primary Care Case
Management
(Number)
Primary Care Case
Management
(Percentage)
22
New Jersey (C)
New Mexico (M)
New York (C)
North Carolina (C)
North Dakota (C)
860,796
390,698
2,757,215
1,411,865
64,324
808,311
316,575
2,435,988
0
0
94
81
88
0
0
52,485
74,123
321,227
266,401
17,853
6
19
12
19
28
0
0
0
1,145,464
46,471
0
0
0
81
72
Ohio (M)
Oklahoma (C)
Oregon (S)
Pennsylvania (S)
Rhode Island (C)
1,685,004
674,079
521,785
1,582,616
137,898
1,330,642
570,628
136,410
1,270,318
128,413
79
85
26
80
93
354,362
103,451
383,320
97,002
9,485
21
15
73
6
7
0
0
2,055
215,296
0
0
0
0
14
0
South Carolina (M)
South Dakota (C)
Tennessee (C)
Texas (S)
Utah (S)
626,901
64,815
862,817
4,518,670
347,369
330,993
0
787,332
3,670,344
65,983
53
0
91
81
19
180,287
15,613
75,485
777,303
140,616
29
24
9
17
40
115,621
49,202
0
71,023
140,770
18
76
0
2
41
80,499
827,092
815,683
298,479
712,817
67,565
0
679,929
650,183
208,357
595,894
8,715
0
82
80
70
84
13
14,215
142,325
159,960
84,872
116,923
58,850
18
17
20
28
16
87
66,284
4,838
5,540
5,250
0
0
82
1
1
2
0
0
Vermont (S)
Virginia (C)
Washington (S)
West Virginia (S)
Wisconsin (C)
Wyoming (S)
Source:
CMS analysis of CHIP Statistical Enrollment Data System (SEDS) as of June 13, 2013.
Notes:
Managed care is defined in this context as a system in which the state contracts with health maintenance organizations (HMOs) or health insuring
organizations (HIOs) to provide a comprehensive set of services on a prepaid capitated risk basis. Enrollees choose a plan and a primary care
provider (PCP) who will be responsible for managing their care. A child is counted in the managed care category if managed care was the last
system in which he or she was covered for basic services during the quarter.
CHIP program type is denoted as follows: S = Separate CHIP program; M = CHIP Medicaid Expansion program; C = Combination CHIP program.
a
Data for Alabama Medicaid are for FFY 2011 due to technical issues with FFY 2012 data at the time of publication of this table.
Frequency of Ongoing Prenatal Care
Live Births Weighing Less than 2,500 Grams
Cesarean Rate for Nulliparous Singleton Vertex
Childhood Immunization Status
Adolescent Immunization Status
Body Mass Index Assessment for
Children and Adolescents
Developmental Screening in the First
Three Years of Life
Chlamydia Screening
Well-Child Visits in the First 15 Months
of Life
Well-Child Visits in the Third, Fourth, Fifth,
and Sixth Years of Life
Adolescent Well-Care Visits
Preventive Dental Services
Child and Adolescent Access to PCPs
Appropriate Testing for Children
with Pharyngitis
Dental Treatment Services
Ambulatory Care: Emergency Department
Visits
Asthma Patients with 1 or More
Asthma-Related Emergency Room Visits
Follow-Up Care for Children Prescribed
ADHD Medication
Annual Pediatric Hemoglobin A1c Testing
Follow-Up After Hospitalization for
Mental Illness
CAHPS Health Plan Survey
14
(Median)
Timeliness of Prenatal Care
Total
State Reported at Least One Measure for
Both Medicaid and CHIP Populations
-
Number of Measures Reported
Table 2. Overview of State Reporting of the Core Set of Medicaid/CHIP Children’s Health Care Quality Measures, FFY 2012
38
31
25
15
12
34
32
27
12
35
43
46
43
51
43
36
51
28
15
29
13
27
27
X
X
X
-
X
X
-
X
X
X
-
X
-
X
X
X
-
X
-
23
Alabama
Alaska
Arizona
Arkansas
California
21
15
7
18
12
X
X
X
X
X
X
X
X
-
X
X
X
-
X
X
X
-
X
X
X
X
X
X
X
X
X
X
X
X
-
X
X
X
X
X
X
X
X
X
X
X
X
X
X
X
X
X
X
X
X
X
X
X
X
X
X
X
X
X
X
X
X
X
X
X
X
X
Colorado
Connecticut
Delaware
D.C.
Florida
12
6
16
14
22
X
X
X
X
X
X
X
X
X
X
X
X
X
X
X
X
X
X
X
X
X
X
X
X
X
X
X
X
X
X
X
X
X
X
X
X
X
X
X
X
X
X
X
X
X
X
X
X
X
X
X
X
X
X
X
X
X
X
X
X
X
X
X
X
X
X
X
X
X
X
X
X
X
X
X
Georgia
Hawaii
Idaho
Illinois
Indiana
20
16
10
19
15
X
X
X
X
X
X
X
X
X
X
X
X
X
X
X
-
X
-
X
X
X
X
X
X
X
X
X
X
X
-
X
-
X
X
X
X
X
X
X
X
X
X
X
X
X
X
X
X
X
X
X
X
X
X
X
X
X
X
X
X
X
X
X
X
X
X
X
X
X
X
X
X
X
X
X
X
-
X
X
X
-
X
X
X
X
X
-
X
X
X
X
X
Iowa
Kansas
Kentucky
Louisiana
Maine
21
3
15
7
14
X
X
X
X
X
X
X
-
X
X
-
X
-
X
-
X
X
-
X
X
-
X
X
-
-
X
X
X
X
X
X
X
X
X
X
X
X
X
X
X
X
X
X
X
X
X
X
X
X
X
X
X
X
X
X
X
X
X
X
X
X
X
X
X
X
X
X
X
X
X
X
X
X
Maryland
Massachusetts
Michigan
Minnesota
Mississippi
13
17
15
5
11
X
X
X
-
X
X
X
-
X
X
-
-
-
X
X
X
-
X
X
X
-
X
X
-
-
X
X
X
X
X
X
X
X
-
X
X
X
X
X
X
X
X
X
X
X
X
X
X
X
X
X
X
X
X
X
X
X
X
X
X
X
X
X
X
-
X
X
X
X
-
X
X
X
X
X
X
Missouri
Montana
Nebraska
Nevada
New Hampshire
12
7
2
9
7
X
X
X
-
-
-
-
X
X
-
X
-
-
-
X
-
X
X
X
X
X
X
X
X
X
X
-
X
X
X
X
X
X
X
X
X
X
X
X
X
X
X
X
X
-
-
-
-
X
X
X
X
X
-
Live Births Weighing Less than 2,500 Grams
Cesarean Rate for Nulliparous Singleton Vertex
Childhood Immunization Status
Adolescent Immunization Status
Body Mass Index Assessment for
Children and Adolescents
Developmental Screening in the First
Three Years of Life
Chlamydia Screening
Well-Child Visits in the First 15 Months
of Life
Well-Child Visits in the Third, Fourth, Fifth,
and Sixth Years of Life
Adolescent Well-Care Visits
Preventive Dental Services
Child and Adolescent Access to PCPs
Appropriate Testing for Children
with Pharyngitis
Dental Treatment Services
Ambulatory Care: Emergency Department
Visits
Asthma Patients with 1 or More
Asthma-Related Emergency Room Visits
Follow-Up Care for Children Prescribed
ADHD Medication
Annual Pediatric Hemoglobin A1c Testing
X
X
X
X
-
X
X
X
X
-
X
X
X
-
X
-
X
-
X
X
X
X
-
X
X
X
X
X
X
X
X
X
-
X
-
X
X
X
X
-
X
X
X
X
-
X
X
X
X
X
X
X
X
X
X
X
X
X
X
X
X
X
X
X
X
X
X
X
X
X
X
X
X
X
X
X
-
X
-
X
X
X
X
-
X
-
X
X
X
X
X
-
Ohio
Oklahoma
Oregon
Pennsylvania
Rhode Island
10
17
21
19
18
X
X
X
X
X
X
X
X
X
X
X
X
X
X
X
X
X
X
-
X
X
X
X
X
X
X
X
X
X
X
X
X
X
-
X
X
X
X
X
X
X
X
X
X
X
X
X
X
X
X
X
X
X
X
X
X
X
X
X
X
X
X
X
X
X
X
X
X
X
X
X
X
X
X
X
X
X
X
X
-
X
X
X
X
X
X
X
-
X
X
X
X
X
X
South Carolina
South Dakota
Tennessee
Texas
Utah
20
2
22
15
12
X
X
-
X
X
X
-
X
X
X
-
X
-
X
-
X
X
X
X
X
X
X
X
X
X
X
X
-
X
X
X
-
X
X
X
X
X
X
X
X
X
X
X
X
X
X
X
X
X
X
X
X
X
X
X
X
X
X
X
X
X
X
X
X
X
-
X
X
-
X
X
X
X
X
X
-
X
X
X
-
X
X
X
X
Vermont
Virginia
Washington
West Virginia
Wisconsin
Wyoming
7
9
11
21
2
14
X
X
X
X
-
X
X
X
-
X
X
-
X
X
X
-
X
X
-
X
X
X
X
X
X
X
X
X
X
X
X
X
X
X
X
X
X
X
X
X
X
X
X
X
X
X
X
X
X
X
X
X
X
X
X
X
X
X
X
X
X
X
X
X
X
X
X
-
X
-
X
X
X
-
X
X
-
X
CAHPS Health Plan Survey
Frequency of Ongoing Prenatal Care
15
15
16
20
8
-
Follow-Up After Hospitalization for
Mental Illness
Timeliness of Prenatal Care
New Jersey
New Mexico
New York
North Carolina
North Dakota
Number of Measures Reported
State Reported at Least One Measure for
Both Medicaid and CHIP Populations
Table 2 (continued)
24
Source: Based on Mathematica analysis of FFY 2012 CARTS reports.
Note:
This table excludes the OME and CLABSI measures. The OME measure was not collected for FFY 2012 and was retired in 2013. Beginning in FFY 2012, data for the CLABSI
measure were obtained from CDC’s National Healthcare Safety Network.
Table 3. Performance Rates on Frequently Reported Medicaid/CHIP Children’s Health Care Quality Measures, FFY 2012
Measure Description
Preventive Dental Services: 1 – 20 Years
Dental Treatment Services: 1 – 20 Years
Access to Primary Care: 12 – 24 Months
Access to Primary Care: 25 Months – 6 Years
Access to Primary Care: 7 – 11 Years
Access to Primary Care: 12 – 19 Years
Well-Child Visits: First 15 Months
Well-Child Visits: 3 – 6 Years
Well-Care Visits: 12 – 21 Years
Childhood Immunization Status: 2 Years
Adolescent Immunization Status: 13 Years
25
Chlamydia Screening: 16 – 20 Years
Body Mass Index Assessment: 3 – 17 Years
Timeliness of Prenatal Care
Frequency of Ongoing Prenatal Care
Appropriate Testing for Children with Pharyngitis:
2 – 18 Years
Follow-Up After Hospitalization for Mental Illness:
6 – 20 Years
Follow-Up After Hospitalization for Mental Illness:
6 – 20 Years
Follow-Up Care for Children Prescribed ADHD
Medication: 6 – 12 Years
Follow-Up Care for Children Prescribed ADHD
Medication: 6 – 12 Years
Measure
Percentage with a Preventive Dental Service
Percentage with a Dental Treatment Service
Percentage with a PCP Visit in the Past Year
Percentage with a PCP Visit in the Past Year
Percentage with a PCP Visit in the Past Two Years
Percentage with a PCP Visit in the Past Two Years
Percentage with 6 or More Visits
Percentage with 1 or More Visits
Percentage with 1 or More Visits
Percentage Up to Date on Immunizations
(Combination 3)a
Percentage Up to Date on Immunizations
(Combination 1)b
Percentage of Sexually Active Women Screened
Percentage with a BMI Percentile Documented
Percentage with a Prenatal Visit in the First Trimester
(or within 42 Days of Medicaid/CHIP Enrollment)
Percentage with More than 80 Percent of Expected
Prenatal Visits
Percentage Who Were Dispensed an Antibiotic and
Received a Strep Test
Percentage of Discharges with a Follow-Up Visit
within 7 Days
Percentage of Discharges with a Follow-Up Visit
within 30 Days
Percentage with a Follow-Up Visit During the
Initiation Phase
Percentage with Two Follow-Up Visits During the
Continuation and Maintenance Phase
Number of States Reporting
25th
75th
Using Core Set Specifications Mean Median Percentile Percentile
51
51
43
43
43
43
43
46
43
33
43.0
23.7
95.6
87.7
88.5
87.4
59.5
65.9
44.4
64.2
44.0
23.8
96.8
88.1
91.0
89.2
62.1
67.7
41.7
67.9
39.3
19.6
94.9
85.2
86.5
85.8
55.3
60.9
38.0
61.0
48.3
25.8
98.0
91.2
93.1
91.5
67.3
74.9
53.5
76.4
30
57.6
59.9
48.8
71.1
35
27
31
48.0
31.8
78.1
49.5
38.9
83.4
42.2
1.6
72.2
57.8
51.9
87.8
25
55.6
58.7
50.9
70.2
36
64.5
69.1
55.4
75.8
27
50.0
53.4
40.3
60.2
27
66.9
68.4
61.1
79.9
29
42.1
41.1
37.1
50.0
28
52.9
53.4
46.4
61.1
Source:
Based on Mathematica analysis of FFY 2012 CARTS reports.
Notes:
This table includes data for states that used core set specifications to report the measures. This table excludes states that used other specifications and states that did not report the measures for
FFY 2012. If a state reported separate rates for its Medicaid and CHIP populations, the rate for the program with the larger measure-eligible population was used. The ambulatory care:
emergency department visits measure was excluded from this table due to data quality issues. The central line-associated blood stream infections (CLABSI) measure was excluded from this
table because the measure uses a summary statistic different from those in this table.
a
Combination 3 includes four doses of diphtheria, tetanus, and acellular pertussis (DTaP); three doses of polio (IPV); one dose of measles, mumps, and rubella (MMR); two doses of H influenza type B
(HiB); three doses of hepatitis B (HepB), one dose of chicken pox (VZV); and four doses of pneumococcal conjugate (PCV).
b
Combination 1 includes one dose of meningococcal vaccine and one tetanus and diphtheria toxoids and acellular pertussis (Tdap) vaccine or one tetanus and diphtheria toxoids (Td) vaccine.
Table 4. Performance Improvement Projects (PIPs) Targeting Children or Pregnant Women Included in External Quality Review (EQR) Technical Reports,
2012–2013 Reporting Cycle, by Topic Area
Number of
PIPs for
Children or
Pregnant
Women
Years of Data
300
30
.
.
.
.
0
0
Arizona
Californiac
Colorado
Delaware
D.C.
7
8
6
4
3
FFY 2010
SFY 2011
FY 2011–12
Varies by PIP
CY 2011
All
All
All
All
All
-
Florida
Georgia
Hawaii
Illinois
Indiana
73
15
4
6
0
Varies by PIP
Varies by PIP
Varies by PIP
SFY 2010–2011
NA
All
All
All
All
NA
Iowa
Kansas
Maryland
Massachusetts
Michigan
1
5
7
3
14
2009–2011
Varies by PIP
CY 2011
CY 2010
CY 2011
Minnesota
Missouri
Nebraska
Nevada
New Jersey
8
11
5
4
16
New Mexico
New York
Oregon
Pennsylvania
Rhode Island
State
Total PIPs (33 States)
Total States (33 States)
PIPS
Validated
Behav. Childhood
Dental
by EQRO a ADHD Asthma Health Immunization Care
28
9
Lead
Screening
Mental
Health
Prenatal
Primary Weight/
Care
Care Access BMI
WellChild
Care
Adolescent
Well Care Other b
26
4
2
25
12
13
3
26
6
27
3
28
13
4
2
40
11
52
8
16
6
37
11
7*
1
2
1
-
-
-
-
1
-
1
-
2
2*
3*
-
2
2
-
1
-
-
3
-
-
-
-
3*
2
-
3*
-
3
3*
-
23*
-
3*
-
3
1*
-
7
3*
-
37*
3*
-
1*
-
3*
-
All
All
All
All
All
-
-
1
-
-
-
-
-
1
3
-
-
14*
1
-
7*
-
3
-
2011
CY 2011
2011
FY 2011–2012
CY 2011
All
All d
All
All
All
-
2
-
-
2
1
2*
-
6*
4*
2*
4*
-
1
4*
-
2
2*
1
1*
1*
8*
1
-
6
7
14
5
4
FY 2011
Varies by PIP
Varies by PIP
2011
2010–2011
All
All
Some e
All
All
-
2
5
-
3
-
1
1
1
1
-
-
-
2
1
1*
-
1
5*
-
-
1
-
1
8
2*
South Carolina
Tennessee
Utah
Vermont
Virginia
17
4
0
0
5
2011
Varies by PIP
NA
NA
2011
Some
All
NA
NA
All
-
7*
-
-
1
-
-
-
-
4
-
-
1
-
1
-
5*
4
3
-
Washington
West Virginia
Wisconsin
15
4
19
2011
CY 2011
2010
All
All
All
-
1
-
-
5*
5
-
13
3
-
1
-
1
-
7*
-
1
-
1
-
Table 4 continued
Source:
EQR technical reports submitted to CMS for the 2012–2013 reporting cycle as of May 13, 2013.
Notes:
AL, AK, AR, CT, GU, ID, ME, MT, NH, OK, SD, VI, and WY do not have MCOs or PIHPs that enroll children covered by Medicaid or CHIP. MS and ND were not required to submit
EQR technical reports for the 2012–2013 reporting cycle. KY, LA, NC, OH, PR, and TX did not submit EQR technical reports before May 13, 2013, for inclusion in this analysis.
Analysis excludes plans that provide only limited services, such as primary care case management. Analysis also excludes plans that do not serve children or pregnant women, such as
long-term care plans or Medicare Advantage plans that cover dual eligibles.
Analysis includes PIPs for children or pregnant women that were listed in the EQR technical report for each state.
Information about the EQR process is available at: http://www.medicaid.gov/Medicaid-CHIP-Program-Information/By-Topics/Quality-of-Care/Quality-of-Care-External-QualityReview.html.
a
Use of the term “validation” differed across EQR technical reports. In this analysis, “validation” indicates that the EQRO reported reviewing information, data, and procedures to determine the extent
to which they are accurate, reliable, free from bias, and in accord with standards for data collection and analysis. Some PIPs that were reviewed in the validation process did not meet all of the review
criteria.
b
PIPs for children on “Other” topics include appropriate treatment for children with pharyngitis (SC, TN); appropriate treatment for children with upper respiratory infections (CA); assuring better child
health and development (OR); Chlamydia screening (CA, KS); Consumer Assessment of Healthcare Providers and Systems (CAHPS) quality improvement activity for children (SC); Early and Periodic
Screening, Diagnostic and Treatment participation (IL, SC); health risk assessments for children (RI); human papillomavirus (MN); improving diabetes care for children (KS); reducing non-emergent
Emergency Department use among children (MO, WV); preventive health screenings for children ages 3 to 6 (SC); use of synagis in improving health and reducing hospitalizations in RSV vulnerable
infants and children (NM).
c
Information for this analysis was extracted from the Medi-Cal Managed Care Program Technical Report: July 1, 2010–June 30, 2011. Additional CA quality reports are available at:
http://www.dhcs.ca.gov/dataandstats/reports/Pages/MMCDQualPerfMsrRpts.aspx.
d
EQR was unable to fully validate PIPs for one MCO that refused to participate in the on-site review.
27
e
EQR did not validate the Assuring Better Child Health and Development (ABCD) program PIPs because a separate EQRO (the Oregon Pediatric Improvement Partnership) held the contract for PIP
development and validation.
* PIP topic was mandated by state.
ADHD = attention-deficit/hyperactivity disorder; Behav. = behavioral; BMI = body mass index; CY = calendar year; EQRO = external quality review organization; FFY = federal fiscal year
NA = not applicable, EQR technical report did not include any PIPs for children or pregnant women; NR = not reported; RSV = respiratory syncytial virus; SFY = state fiscal year; STI = sexually
transmitted infection.
Table 5. Childhood Obesity Performance Improvement Projects (PIPs) Included in External Quality Review (EQR) Technical
Reports, 2012–2013 Reporting Cycle
Number of
MCOs
Participating
State
Performance Measure(s)
and/or Aims
Comments
Results
California*
2
Varied by MCO;
BMI percentile documentation,
nutrition counseling, physical
activity counseling
No intervention
information
Improvement
across MCOs,
some statistically
significant
Colorado
2
Varied by MCO;
BMI percentile documentation,
nutrition counseling, physical
activity counseling
No intervention
information
First year of PIP
no outcomes
reported
Florida
7
Reduce obesity; no measures
identified
No intervention
information; did not fully
meet validation rating
None reported
Georgia
3 (All)
BMI percentile documentation,
nutrition counseling, physical
activity counseling
Detailed intervention
information
Mixed results;
varied by MCO
Michigan*
14
Varied by MCO;
BMI percentile documentation,
nutrition counseling, physical
activity counseling
Some intervention
information
Improvement
across MCOs,
some statistically
significant; decline
on one measure for
two MCOs
Nebraska*
2 (All)
BMI percentile documentation,
nutrition counseling, physical
activity counseling
Detailed intervention
information
None reported
New Jersey
2
Varied by MCO; BMI percentile
documentation
No intervention
information
None reported
Oregon*
1
BMI percentile documentation
Some intervention
information
None reported
Pennsylvania
5
Varied by MCO;
BMI percentile documentation,
nutrition counseling, physical
activity counseling, provider
education
PIP not fully
implemented;
some intervention
information
None reported
Tennessee
1
BMI percentile documentation,
nutrition counseling, physical
activity counseling
No intervention
information
None reported
West Virginia*
1
BMI percentile documentation,
nutrition counseling, physical
activity counseling
Detailed intervention
information
Mixed results; very
small changes
Source: EQR technical reports submitted to CMS for the 2012–2013 reporting cycle as of May 13, 2013.
Notes:
Analysis includes PIPs that were listed in the EQR technical report for each state.
* State reported a PIP on this topic during both 2011–2012 and 2012–2013 reporting cycles.
Additional details can be found in the EQR technical report tables at http://www.medicaid.gov/Medicaid-CHIP-ProgramInformation/By-Topics/Quality-of-Care/Downloads/Findings-from-EQR-Technical-Reports-2012-2013-.zip.
28
Table 6. Dental Care Performance Improvement Projects (PIPs) Included in External Quality Review (EQR)
Technical Reports, 2012–2013 Reporting Cycle
Number of
MCOs
Participating
Performance
Measure(s) and/or
Aims
Georgia*
3 (All)
Missouri*
New Jersey*
State
Comments
Results
Annual dental visit
Detailed intervention
information
Improvement, not all
statistically significant
6 (All)
Annual dental visit
Detailed intervention
information
Varied by MCO
4 (All)
Varied by MCO;
Improve oral health,
annual dental visit
No intervention
information
None reported
Source: EQR technical reports submitted to CMS for the 2012–2013 reporting cycle as of May 13, 2013.
Notes: Analysis includes PIPs that were listed in the EQR technical report for each state.
* State reported a PIP on this topic during both 2011–2012 and 2012–2013 reporting cycles.
Additional details can be found in the EQR technical report tables at http://www.medicaid.gov/MedicaidCHIP-Program-Information/By-Topics/Quality-of-Care/Downloads/Findings-from-EQR-TechnicalReports-2012-2013-.zip.
29
Table 7. Prenatal/Postpartum Care Performance Improvement Projects (PIPs) Included in External Quality Review
(EQR) Technical Reports, 2012–2013 Reporting Cycle
Number of
MCOs
Participating
State
Performance Measure(s) and/or Aims
Comments
Results
California*
2
Varied by MCO; depression screening,
postpartum care
Some intervention
information
Some improvement
Delaware*
2
Varied by MCO; NICUa admission rate,
prenatal care, low birth weight rate,
postpartum care, preterm delivery rate
Detailed intervention
information
Results varied by measure;
low to moderate confidence
in results
District of
Columbia*
3 (All)
Reduce adverse prenatal outcomesb
Some intervention
information
Varied by MCO
Illinois*
3 (All)
Prenatal care (timeliness and frequency),
postpartum care, multiple depression
measures
Some intervention
information
Results varied by measure
Kansas
1
Prenatal care, postpartum care
Detailed intervention
information
Results varied by measure
Massachusetts
3
Varied by MCO; prenatal care (timeliness
and frequency), low birth weight rate,
postpartum care
Detailed intervention
information
First year of PIP no
outcomes reported
Nebraska*
1
Prenatal care (timeliness and frequency),
postpartum care
Detailed intervention
information
Performance declined
New Jersey*
4 (All)
Varied by MCO;
prenatal care, birth outcomes, smoking
cessation; no measures identified
No intervention
information
None reported
New Mexico*
2
Varied by MCO;
prenatal care (frequency), postpartum
care
Some intervention
information
Varied by MCO
New York*
1
Reduce readmissions for pregnant
women; no measures identified
Detailed intervention
information
First year of PIP for this
MCO; no outcomes reported
Rhode Island*
1
Prenatal care (timeliness and frequency),
postpartum care
Detailed intervention
information
Results varied by measure
South Carolina*
4
Varied by MCO;
prenatal care, postpartum care, and
improve birth outcomes; no measures
identified
No intervention
information
None reported; first year of
PIP for one MCO
Wisconsin
1
Improve birth outcomes; no measures
identified
No intervention
information
No improvement
Source: EQR technical reports submitted to CMS for the 2012–2013 reporting cycle as of May 13, 2013.
Notes:
Analysis includes PIPs that were listed in the EQR technical report for each state.
* State reported a PIP on this topic during both 2011–2012 and 2012–2013 reporting cycles.
Additional details can be found in the EQR technical report tables at http://www.medicaid.gov/Medicaid-CHIP-ProgramInformation/By-Topics/Quality-of-Care/Downloads/Findings-from-EQR-Technical-Reports-2012-2013-.zip.
a
NICU = neonatal intensive care unit.
b
Adverse prenatal outcomes are defined as newborns with birth weight less than 2,500 grams, newborns of 32 weeks or less
gestational age, pregnant women not tested for HIV before giving birth, pregnancies ending in miscarriage or fetal loss (early or
late), and deaths of infants in the first year of life.
30
Table 8. Adolescent Well-Care Performance Improvement Projects (PIPs) Included in External Quality Review
(EQR) Technical Reports, 2012–2013 Reporting Cycle
Number of
MCOs
Participating
State
Performance Measure(s)
and/or Aims
Comments
Results
Primary care visit rate
Detailed intervention
information
No significant
improvement
Hawaii*
1
Maryland
7 (All)
Well-care visit rate
Detailed intervention
information
First year
implementation; no
reported results
New
Jersey*
1
Well-care visit rate
No intervention
information
None reported
Oregon*
1
Well-care visit rate
Some intervention
information
First year
implementation with
revised age range;
no reported results
Virginia
5
Well-care visit rate
No intervention
information
First year
implementation; no
reported results
West
Virginia
1
Well-care visit rate
Baseline proposal; no
intervention information
First year
implementation; no
reported results
Source: EQR technical reports submitted to CMS for the 2012–2013 reporting cycle as of May 13, 2013.
Notes: Analysis includes PIPs that were listed in the EQR technical report for each state.
* State reported a PIP on this topic during both 2011–2012 and 2012–2013 reporting cycles.
Additional details can be found in the EQR technical report tables at http://www.medicaid.gov/MedicaidCHIP-Program-Information/By-Topics/Quality-of-Care/Downloads/Findings-from-EQR-TechnicalReports-2012-2013-.zip.
31
This page left blank for double-sided copying.
FIGURES
Figure 1
Changes in the Number of States Reporting the Medicaid/CHIP Children’s Health
Care Quality Measures, FFY 2010–2012 ................................................................................. 35
Figure 2
Number of Medicaid/CHIP Children’s Health Care Quality Measures Reported by
States, FFY 2012 ...................................................................................................................... 36
Figure 3
Number of States Reporting the Core Set of Medicaid/CHIP Children’s Health
Care Quality Measures, FFY 2012 ........................................................................................... 37
Figure 4
Comparison of Performance Measures Evaluating Children's Health Care Quality
That Were Reported in External Quality Review (EQR) Technical Reports for the
2010, 2011–2012, and 2012–2013 Reporting Cycles for 26 States, by General
Topic ......................................................................................................................................... 38
Figure 5
Comparison of Performance Improvement Projects (PIPs) Targeting Children
That Were Reported in External Quality Review (EQR) Technical Reports for the
2010, 2011–2012, and 2012–2013 Reporting Cycles for 28 States, Selected
Topics ....................................................................................................................................... 39
33
This page left blank for double-sided copying.
Figure 1. Changes in the Number of States Reporting the Medicaid/CHIP Children’s Health Care Quality Measures,
FFY 2010–2012
51
Preventive Dental Services
37
22
51
Dental Treatment Services
35
19
Well-Child Visits in the 3rd, 4th,
5th, and 6th Years of Life
46
48
42
43
Well-Child Visits in the First 15 Months of Life
46
40
43
43
Adolescent Well-Care Visits
29
Child and Adolescent Access to
Primary Care Practitioners
43
44
40
36
Appropriate Testing for Children with Pharyngitis
28
20
35
Chlamydia Screening
32
21
34
Childhood Immunization Status
30
20
32
Adolescent Immunizations Status
25
12
31
Timeliness of Prenatal Care
24
15
29
Follow-Up Care for Children Prescribed Attention-Deficit/
Hyperactivity Disorder (ADHD) Medication
24
15
28
27
Ambulatory Care: Emergency Department Visits
15
27
Body Mass Index Assessment for
Children and Adolescents
18
10
27
Follow-Up After Hospitalization for Mental Illness
24
11
27
Consumer Assessment of Healthcare Providers
and Systems (CAHPS ® ) Health Plan Survey
22
1
25
Frequency of Ongoing Prenatal Care
17
12
15
Live Births Weighing Less than 2,500 Grams
11
3
15
14
Annual Percentage of Asthma Patients with 1 or More
Asthma-Related Emergency Room Visits
5
FFY 2012
FFY 2011
13
Annual Pediatric Hemoglobin A1c Testing
10
8
FFY 2010
12
Cesarean Rate for Nulliparous Singleton Vertex
5
2
Developmental Screening in the
First Three Years of Life
12
7
2
0
5
10
15
20
25
30
35
40
45
50
55
Number of States
Source: Based on Mathematica analysis of FFY 2010–2012 CARTS reports.
Notes: The term “states” includes the 50 states and the District of Columbia.
The FFY 2010 and 2011 counts for the two dental measures reflect the number of states reporting the dental measures
in CARTS, whereas the FFY 2012 count reflects the number of states reporting data on Form CMS-416. In FFY 2012,
to minimize state burden, CMS began calculating the two dental measures on behalf of states using data reported on
Form CMS-416.
Beginning in FFY 2012, data for the CLABSI measure were obtained from the CDC National Healthcare Safety
Network. The OME measure was not collected for FFY 2012 and was retired in 2013.
35
Figure 2. Number of Medicaid/CHIP Children’s Health Care Quality Measures Reported by States, FFY 2012
Florida
Tennessee
Alabama
Iowa
Oregon
West Virginia
Georgia
North Carolina
South Carolina
Illinois
Pennsylvania
Arkansas
Rhode Island
Massachusetts
Oklahoma
Delaware
Hawaii
New York
Alaska
Indiana
Kentucky
Michigan
New Jersey
New Mexico
Texas
22
22
21
21
21
21
20
20
20
19
19
18
18
17
17
16
16
16
15
15
15
15
15
15
15
State Median
14
14
14
14
D.C.
Maine
Wyoming
Maryland
California
Colorado
Missouri
Utah
Mississippi
Washington
Idaho
Ohio
Nevada
Virginia
North Dakota
Arizona
Louisiana
Montana
New Hampshire
Vermont
Connecticut
Minnesota
Kansas
Nebraska
South Dakota
Wisconsin
13
12
12
12
12
11
11
10
10
9
9
8
7
7
7
7
7
6
5
3
2
2
2
0
5
15
10
Number of Measures
20
25
Source: Based on Mathematica analysis of FFY 2012 CARTS reports.
Notes:
This figure is based on state reporting of 22 Core Set measures for FFY 2012. Beginning in FFY 2012, data for the
CLABSI measure were obtained from the CDC National Healthcare Safety Network. The OME measure was not
collected for FFY 2012 and was retired in 2013. The term “states” includes the 50 states and the District of Columbia.
36
Figure 3. Number of States Reporting the Core Set of Medicaid/CHIP Children’s Health Care Quality Measures,
FFY 2012
Preventive Dental Services
51
Dental Treatment Services
51
Well-Child Visits in the 3rd, 4th,
5th, and 6th Years of Life
46
Well-Child Visits in the First 15 Months of Life
43
Adolescent Well-Care Visits
43
Child and Adolescent Access to
Primary Care Practitioners
43
Appropriate Testing for Children with Pharyngitis
36
Chlamydia Screening
35
Childhood Immunization Status
34
Adolescent Immunizations Status
32
Timeliness of Prenatal Care
31
Follow-Up Care for Children Prescribed Attention-Deficit/
Hyperactivity Disorder (ADHD) Medication
29
Ambulatory Care: Emergency Department Visits
28
Body Mass Index Assessment for
Children and Adolescents
27
Follow-Up After Hospitalization for Mental Illness
27
Consumer Assessment of Healthcare Providers
and Systems (CAHPS ®) Health Plan Survey
27
Frequency of Ongoing Prenatal Care
25
Live Births Weighing Less than 2,500 Grams
15
Annual Percentage of Asthma Patients with 1 or More
Asthma-Related Emergency Room Visits
15
Annual Pediatric Hemoglobin A1c Testing
13
Cesarean Rate for Nulliparous Singleton Vertex
12
Developmental Screening in the
First Three Years of Life
12
0
5
10
15
20
25
30
35
40
45
50
55
Number of States
Source: Based on Mathematica analysis of FFY 2012 CARTS reports.
Notes:
Beginning in FFY 2012, to minimize state burden, the two dental measures were calculated using data reported by
states on Form CMS-416. Beginning in FFY 2012, data for the CLABSI measure were obtained from the CDC
National Healthcare Safety Network. The OME measure was not collected for FFY 2012 and was retired in 2013. The
term “states” includes the 50 states and the District of Columbia.
37
Figure 4. Comparison of Performance Measures Evaluating Children’s Health Care Quality That Were Reported in
External Quality Review (EQR) Technical Reports for the 2010, 2011–2012, and 2012–2013 Reporting Cycles for
26 States, by General Topic
25
21
20
21
21
20 20
20 20
19
19
Number of States
17
16
15
15
15 15
14
12
12
11
10
10
10
9
9 9
9
9
8
8
7
7
6 6
6
6 6
5
5
3
0
Immuni- Well-Child Adolescent Asthma
zations
Care
Well Care
2010
Lead
Primary
Screening
Care
Access
STIs
2011–2012
Dental
Care
URI
Pharyngitis Weight
ADHD
Assessment
2012–2013
Sources: Performance measures for 2010 EQR technical reports obtained from 2011 Secretary’s Report. Performance measures
in the EQR technical reports for the 2011–2012 and 2012–2013 reporting cycles from Mathematica analysis of 2011–
2012 and 2012–2013 EQR technical reports.
Notes:
Data are from managed care EQR technical reports. States include AZ, CA, DE, FL, GA, HI, IL, IN, MD, MA, MI,
MN, MO, NE, NV, NJ, NM, NY, PA, RI, TN, UT, VT, VA, WA, and WV. SC and WI submitted EQR technical
reports in the 2010, 2011–2012, and 2012–2013 reporting cycles, but one or more of these reports did not list
performance measures, so the states were excluded from this analysis.
Analysis excludes plans that provide only limited services, such as primary care case management. Analysis also
excludes plans that do not serve children or pregnant women, such as long-term care plans or Medicare Advantage
plans that cover dual eligibles.
ADHD = attention-deficit/hyperactivity disorder; Pharyngitis = appropriate testing for children with pharyngitis;
STI = sexually transmitted infection; URI = upper respiratory infection.
38
Figure 5. Comparison of Performance Improvement Projects (PIPs) Targeting Children That Were Reported in
External Quality Review (EQR) Technical Reports for the 2010, 2011–2012, and 2012–2013 Reporting Cycles for
28 States, Selected Topics
15
Number of States
11
10
10
10
9
8
8
8
8
8
7
6
7
6
6
6
5
5
4
3
3
2
3
2
1
1
0
0
Immunizations Well-Child
Care
Weight
Assessment
2010
Asthma
Lead
Screening
2011–2012
Dental
Care
Primary
Care
Access
ADHD
1
0
Behavioral
Health
2012–2013
Sources: PIPs for the 2010 EQR technical reports obtained from the 2011 Secretary's Report. PIPs in the EQR technical reports
for the 2011–2012 and 2012–2013 reporting cycles from Mathematica analysis of 2011–2012 and 2012–2013 EQR
technical reports.
Notes:
Data are from managed care EQR technical reports. States include AZ, CA, DE, FL, GA, HI, IL, IN, MD, MA, MI,
MN, MO, NE, NV, NJ, NM, NY, PA, RI, SC, TN, UT, VT, VA, WA, WV, and WI.
Analysis excludes plans that provide only limited services, such as primary care case management. Analysis also
excludes plans that do not serve children or pregnant women, such as long-term care plans or Medicare Advantage
plans that cover dual eligibles. Analysis includes PIPs listed in the EQR technical report for each state that specifically
targeted children or pregnant women.
ADHD = attention-deficit/hyperactivity disorder.
39
This page left blank for double-sided copying.
APPENDIX
MEASURE SNAPSHOTS
This page left blank for double-sided copying.
PRIMARY CARE ACCESS AND PREVENTIVE CARE
Access to regular primary care and services that help prevent infectious and chronic disease are
important to helping people live longer, healthier lives and improving the health of the population.
Medicaid and CHIP help millions of children gain access to wellness visits and other preventive
health care services. Preventive services include immunizations, screenings for common chronic and
infectious diseases, clinical and behavioral interventions to manage chronic disease and reduce
associated risks, and counseling to support healthy living and self-management of chronic disease.
In 2013, CMS launched several new activities to support state efforts to expand access to and
improve the quality of preventive health care in Medicaid and CHIP. For example:
•
The Promoting Prevention in Medicaid and CHIP technical assistance webinar series, held in
spring 2013, featured presentations on the activities of several state Medicaid programs and
their collaborations with federal prevention initiatives, managed care organizations, public
health departments, and other stakeholders to improve access to preventive care.
•
The Medicaid Prevention Learning Network will be launched in fall 2013 and aims to help
states increase access to and use of preventive services and improve reporting and
performance on CMS’s prevention-related quality measures. The Learning Network will
provide enhanced technical assistance to states and facilitate exchange of information about
promising practices of high impact, effective preventive care delivery.
•
New content on Medicaid.gov provides summaries and links to information on preventionrelated coverage policy, prevention provisions in the Affordable Care Act that affect
Medicaid and CHIP, and opportunities for additional technical assistance.
The eight Child Core Set measures included in this section are those for which information is
available from at least 25 states for the FFY 2012 reporting year. 1 These measures are useful in
assessing the adequacy of children’s and adolescents’ access to essential primary and preventive
care, and provide insights into the current status of health care quality provided to publicly insured
children and areas for improvement. The measures are as follows:
1. Child and Adolescent Access to Primary Care Practitioners
2. Well-Child Visits in the First 15 Months of Life
3. Well-Child Visits in the Third, Fourth, Fifth, and Sixth Years of Life
4. Adolescent Well-Care Visits
5. Childhood Immunization Status
6. Adolescent Immunization Status
7. Chlamydia Screening
8. Body Mass Index Assessment for Children and Adolescents
1
Another measure, Ambulatory Care – Emergency Department Visits – is not included in the Appendix due to data
quality issues.
A.1
This page left blank for double-sided copying.
CHILD AND ADOLESCENT ACCESS TO PRIMARY CARE PRACTITIONERS (CAP)
Measure Steward: National Committee for Quality Assurance (NCQA)
Access to primary care practitioners (PCPs) is essential for all children. Whether children have a comprehensive
well-care visit or see a PCP when they are sick, all primary care visits offer the opportunity for routine care, such as
determining whether children are up to date immunizations, measuring height and weight, gathering vital signs,
offering age-appropriate counseling, and generally assessing their well-being. A basic measure of access to PCPs is
whether children ages 1 to 6 had a visit in the past year and children ages 7 to 19 had a visit in the past two years.
Measure Description
•
This measure shows the percentage of
children and adolescents ages 12 months to
19 years that had a visit with a PCP. Rates
are reported for four age groups: children
ages 12 to 24 months and 25 months to 6
years that had a PCP visit during the
measurement year and children ages 7 to 11
and 12 to 19 that had a PCP visit during the
current or prior measurement year. 2
Exhibit CAP.1. Percentage of Children and
Adolescents with a PCP Visit in the Past Year (12 to
24 Months and 25 Months to 6 Years) or Past Two
Years (7 to 11 Years and 12 to 19 Years), FFY 2012
(n = 43 states)
Overview of State Reporting
•
•
The number of states reporting the Children
and Adolescent Access to PCPs measure
increased from 40 states for FFY 2010 to 44
states for FFY 2011 and decreased to 43
states for FFY 2012. 3
Of the 43 states reporting the measure for
FFY 2012, 29 states reported the measure for
both their Medicaid and CHIP populations,
11 reported the measure for their CHIP
population only, and 3 reported the measure
for their Medicaid population only.
100
90
In FFY 2012, all 43 states reported the
measure using Core Set specifications.
85.2
88.1
91.5
91.2
91.0 93.1
89.2
86.5
85.8
60
50
25th Percentile
40
Median
30
75th Percentile
20
10
0
The median rate among the 43 states
reporting the measure for FFY 2012 was
highest for the 12-24 month age group, with
a median of 97 percent and a 3-point spread
between the 25th and 75th percentiles
(Exhibit CAP.1). Median rates for other age
groups were slightly lower, but still quite
high: 88 percent for ages 25 months to 6
years (6-point spread); 91 percent for ages 7
to 11 (7-point spread); and 89 percent for
ages 12 to 19 (6-point spread).
12–24 25 Months– 7–11
Months 6 Years
Years
12–19
Years
Source: Mathematica analysis of FFY 2012 CARTS reports.
2
This measure is calculated using the administrative method
(claims/encounter data) or the hybrid method (claims/encounter
data combined with medical record review).
3
98.0
70
State Performance
•
94.9 96.8
80
Percentage
•
Performance on this measure ranged from
79 to100 percent for children ages 12 to 24
months and from 75 to 96 percent for
children ages 25 months to 6 years. The
range across states was wider for the older
age groups, ranging from 62 to 97 percent
for ages 7 to 11 and from 61 to 97 percent
for ages 12 to 19 (Exhibits CAP.3 through
CAP.6).
•
The term “states” includes the 50 states and District of Columbia.
A.3
Trends
•
Among the 35 states reporting the measure using Core Set specifications for all three years, the median
rates did not change substantially between FFY 2010 and 2012 (Exhibit CAP.2). Across all three years, the
rates were highest for the 12-to-24-month age group, exceeding 95 percent each year.
Exhibit CAP.2. Trends in the Percentage of Children and Adolescents with a PCP Visit in the Past Year (12 to 24
Months and 25 Months to 6 Years) or Past Two Years (7 to 11 Years and 12 to 19 Years), FFY 2010–2012 (n = 35
states)
Rate
FFY 2010
FFY 2011
FFY 2012
.
.
.
Mean
95.7
96.4
95.7
Median
96.5
97.1
97.0
25th Percentile
95.6
95.8
95.3
75th Percentile
98.0
98.2
98.2
25 Months to 6 Years
.
.
.
Mean
88.2
88.4
88.0
Median
90.1
89.3
88.5
25th Percentile
85.9
85.5
85.8
75th Percentile
92.4
91.6
91.8
.
.
.
Mean
89.9
89.3
88.8
Median
91.5
90.8
91.2
25th Percentile
87.5
87.7
86.5
75th Percentile
93.4
93.0
93.1
.
.
.
Mean
88.5
88.2
87.8
Median
88.9
89.3
89.7
25th Percentile
86.4
85.6
85.8
75th Percentile
91.6
92.1
91.6
a
12 to 24 Months
7 to 11 Years
12 to 19 Years
Source: Mathematica analysis of FFY 2010, 2011, and 2012 CARTS reports.
a
Two states did not report a rate for the 12-to-24-month age group for all three years (n = 33).
A.4
Exhibit CAP.3. Geographic Variation in the Percentage of Children Ages 12 to 24 Months with a PCP Visit in the
Past Year, FFY 2012 (n = 43 states)
WA
MT
ME
ND
OR
MN
ID
WI
SD
WY
UT
CA
PA
KS
WV
MO
DC
MD
NC
SC
AR
AL
MS
GA
LA
TX
HI
VA
KY
TN
OK
NM
OH
IN
IL
CO
AZ
MI
IA
NE
NV
VT
NH
MA
RI
CT
NJ
DE
NY
AK
FL
Did Not Report
78% to 94%
95% to 96%
State Median: 97%
97%
98% to 100%
Source: Mathematica analysis of FFY 2012 CARTS reports.
Exhibit CAP.4. Geographic Variation in the Percentage of Children Ages 25 Months to 6 Years with a PCP Visit in
the Past Year, FFY 2012 (n = 43 states)
WA
MT
ME
ND
OR
MN
ID
WI
SD
WY
NV
CA
UT
AZ
CO
MI
IA
NE
PA
IN
IL
KS
HI
VA
KY
DC
MD
NC
TN
SC
AR
MS
TX
OH
WV
MO
OK
NM
VT
NH
MA
RI
CT
NJ
DE
NY
AL
GA
LA
AK
FL
Did Not Report
75% to 85%
86% to 88%
89% to 91%
State Median: 88%
92% to 96%
Source: Mathematica analysis of FFY 2012 CARTS reports.
To view state-specific data for this measure, please see Table CAP at http://www.medicaid.gov/Medicaid-CHIPProgram-Information/By-Topics/Quality-of-Care/Downloads/Performance-on-the-Child-Core-Set-Measures-FFY2012.zip.
A.5
Exhibit CAP.5. Geographic Variation in the Percentage of Children Ages 7 to 11 with a PCP Visit in the Past Two
Years, FFY 2012 (n = 43 states)
WA
MT
ME
ND
OR
MN
ID
WI
SD
WY
UT
CA
AZ
MI
IA
NE
NV
PA
KS
WV
MO
DC
MD
NC
SC
AR
MS
AL
GA
LA
TX
HI
VA
KY
TN
OK
NM
OH
IN
IL
CO
VT
NH
MA
RI
CT
NJ
DE
NY
AK
FL
Did Not Report
62% to 86%
87% to 91%
State Median: 91%
92% to 93%
94% to 97%
Source: Mathematica analysis of FFY 2012 CARTS reports.
Exhibit CAP.6. Geographic Variation in the Percentage of Adolescents Ages 12 to 19 with a PCP Visit in the Past
Two Years, FFY 2012 (n = 43 states)
WA
MT
ME
ND
OR
MN
ID
WI
SD
WY
NV
CA
UT
AZ
CO
MI
IA
NE
PA
IN
IL
KS
HI
VA
KY
DC
MD
NC
TN
SC
AR
MS
TX
OH
WV
MO
OK
NM
VT
NH
MA
RI
CT
NJ
DE
NY
AL
GA
LA
AK
FL
Did Not Report
61% to 85%
86% to 88%
89% to 91%
State Median: 89%
92% to 97%
Source: Mathematica analysis of FFY 2012 CARTS reports.
To view state-specific data for this measure, please see Table CAP at http://www.medicaid.gov/Medicaid-CHIPProgram-Information/By-Topics/Quality-of-Care/Downloads/Performance-on-the-Child-Core-Set-Measures-FFY2012.zip.
A.6
WELL-CHILD VISITS IN THE FIRST 15 MONTHS OF LIFE (W15)
Measure Steward: National Committee for Quality Assurance (NCQA)
The American Academy of Pediatrics and Bright Futures recommend nine well-care visits by the time children turn
15 months of age, including a newborn evaluation and evaluations at 3 to 5 days after birth, by 1 month, 2 months, 4
months, 6 months, 9 months, 12 months, and 15 months. Preventive care during infancy includes a health history,
physical examination, immunizations, vision and hearing screening, developmental/behavioral assessment, and an
oral health risk assessment. In addition, parenting education on a wide range of topics (including breastfeeding and
nutrition) is a key component of providing support to new parents. The Core Set measure assesses the percentage of
children receiving six or more visits by 15 months.
Exhibit W15.1. Percentage of Children Receiving 6
or More Well-Child Visits in the First 15 Months of
Life, FFY 2012 (n = 43 states)
Measure Description
This measure shows the percentage of
children that turned 15 months old during
the measurement year and had zero, one,
two, three, four, five, or six or more wellchild visits with a primary care practitioner
during their first 15 months of life. 4
70
60
Percentage
•
Overview of State Reporting
•
•
•
The number of states reporting the WellChild Visits in the First 15 Months of Life
measure increased from 40 states for FFY
2010 to 46 states for FFY 2011, then
decreased to 43 states for FFY 2012. 5
•
50
40
30
20
0
Of the 43 states reporting the measure for
FFY 2012, 32 states reported the measure
for both their Medicaid and CHIP
populations, 8 states reported the measure
for their CHIP population only, and 3 states
reported the measure for their Medicaid
population only.
25th
50th 75th
Percentile
Source: Mathematica analysis of FFY 2012 CARTS reports.
Trends
•
In FFY 2012, all 43 states reported the
measure using Core Set specifications.
Among the 33 states reporting the measure
using Core Set specifications for all three
years, the median rate with 6 or more visits
in the first 15 months of life increased by 6.5
percentage points from FFY 2010 to FFY
2012 (Exhibit W15.2).
Exhibit W15.2. Trends in the Percentage of Children
Receiving 6 or More Well-Child Visits in the First 15
Months of Life, FFY 2010–2012 (n = 33 states)
The median rate among the 43 states
reporting the measure for FFY 2012 was 62
percent, with a 12-point spread between the
25th and 75th percentiles (Exhibit W15.1).
Rate
FFY 2010 FFY 2011 FFY 2012
Mean
52.9
59.4
62.3
Median
55.4
60.5
61.9
25th Percentile
50.9
56.6
55.9
75th Percentile
64.6
69.2
68.8
Source: Mathematica analysis of FFY 2010, 2011, and
2012 CARTS reports.
Performance on this measure ranged from
23 percent to 88 percent among states, with
considerable geographic variation across
states (Exhibit W15.3, next page).
4
This measure is calculated using the administrative method
(claims/encounter data) or the hybrid method (claims/encounter
data combined with medical record review).
5
67.3
10
State Performance
•
55.3
62.1
The term “states” includes the 50 states and District of Columbia.
A.7
Exhibit W15.3. Geographic Variation in the Percentage of Children Receiving 6 or More Well-Child Visits in the
First 15 Months of Life, FFY 2012 (n = 43 states)
WA
MT
ME
ND
OR
MN
ID
WI
SD
NY
WY
CA
UT
AZ
CO
MI
IA
NE
NV
PA
IL
KS
OH
WV
VA
KY
DC
MD
NC
TN
SC
AR
MS
AL
GA
LA
TX
HI
IN
MO
OK
NM
VT
NH
MA
RI
CT
NJ
DE
AK
FL
Did Not Report
23% to 54%
55% to 61%
62% to 67%
State Median: 62 %
68% to 88%
Source: Mathematica analysis of FFY 2012 CARTS reports.
To view state-specific data for this measure, please see Table W15 at http://www.medicaid.gov/Medicaid-CHIPProgram-Information/By-Topics/Quality-of-Care/Downloads/Performance-on-the-Child-Core-Set-Measures-FFY2012.zip.
A.8
WELL-CHILD VISITS IN THE THIRD, FOURTH, FIFTH, AND SIXTH YEARS OF LIFE (W34)
Measure Steward: National Committee for Quality Assurance (NCQA)
The American Academy of Pediatrics and Bright Futures recommend a comprehensive annual preventive visit at
ages 3, 4, 5, and 6. These visits should include a health history, physical examination, immunizations, vision and
hearing screening, developmental/behavioral assessment, and an oral health assessment (at ages 3 and 6). In
addition, these visits should include age-appropriate anticipatory guidance on a wide range of topics to engage
parents in promoting their child’s healthy development. Referrals for follow-up care may occur if physical, social, or
emotional issues are detected. A key aim of preventive care during this period is to facilitate a child’s school
readiness and address any issues that would interfere with their school attendance and learning.
Exhibit W34.1. Percentage of Children Receiving
At Least One Well-Child Visit in the Third, Fourth,
Fifth, and Sixth Years of Life, FFY 2012 (n = 46
states)
Measure Description
•
This measure shows the percentage of
children ages 3 to 6 that had one or more
well-child visits with a primary care
practitioner during the measurement year. 6
80
70
Overview of State Reporting
•
•
The number of states reporting the WellChild Visits in the Third, Fourth, Fifth, and
Sixth Years of Life measure increased from
42 states for FFY 2010 to 48 states for FFY
2011 and then decreased to 46 states for
FFY 2012. 7
Percentage
•
60
•
50
40
30
10
Of the 46 states reporting the measure for
FFY 2012, 34 reported the measure for both
their Medicaid and CHIP populations, 10
reported the measure for their CHIP
population only, and 2 reported the measure
for their Medicaid population only.
0
25th
50th 75th
Percentile
Source: Mathematica analysis of FFY 2012 CARTS reports.
Trends
In FFY 2012, all 46 states reported the
measure using Core Set specifications.
•
The median rate among the 46 states
reporting the measure for FFY 2012 was 68
percent, with a 14-point spread between the
25th and 75th percentiles (Exhibit W34.1).
Among the 37 states reporting the measure
using Core Set specifications for all three
years, the median rate increased by 3
percentage points from FFY 2010 to FFY
2012 (Exhibit W34.2).
Exhibit W34.2. Trends in the Percentage of Children
Receiving At Least One Well-Child Visit in the Third,
Fourth, Fifth, and Sixth Years of Life, FFY 2010–2012
(n = 37 states)
Performance on this measure ranged from
40 percent to 85 percent among states, with
considerable geographic variation across
states (Exhibit W34.3, next page).
Rate
FFY 2010 FFY 2011 FFY 2012
Mean
63.8
66.6
66.9
Median
64.9
69.6
67.7
25th Percentile
58.9
61.5
62.2
75th Percentile
74.1
74.9
75.1
Source: Mathematica analysis of FFY 2010, 2011, and
2012 CARTS reports.
6
This measure is calculated using the administrative method
(claims/encounter data) or the hybrid method (claims/encounter
data combined with medical record review).
7
74.9
20
State Performance
•
60.9
67.7
The term “states” includes the 50 states and District of Columbia.
A.9
Exhibit W34.3. Geographic Variation in Percentage of Children Receiving At Least One Well-Child Visit in the
Third, Fourth, Fifth, and Sixth Years of Life, FFY 2012 (n = 46 states)
WA
MT
ME
ND
OR
MN
ID
WI
SD
NY
WY
CA
UT
AZ
CO
MI
IA
NE
NV
PA
IL
KS
WV
VA
KY
DC
MD
NC
TN
SC
AR
MS
AL
GA
LA
TX
HI
OH
IN
MO
OK
NM
VT
NH
MA
RI
CT
NJ
DE
AK
FL
Did Not Report
40% to 59%
60% to 66%
67% to 74%
State Median: 68 %
75% to 85%
Source: Mathematica analysis of FFY 2012 CARTS reports.
To view state-specific data for this measure, please see Table W34 at http://www.medicaid.gov/Medicaid-CHIPProgram-Information/By-Topics/Quality-of-Care/Downloads/Performance-on-the-Child-Core-Set-Measures-FFY2012.zip.
A.10
ADOLESCENT WELL-CARE VISITS (AWC)
Measure Steward: National Committee for Quality Assurance (NCQA)
The American Academy of Pediatrics and Bright Futures recommend annual well-care visits during adolescence to
promote healthy behaviors, prevent risky ones, and detect conditions that can interfere with a teen’s physical, social,
and emotional development. Comprehensive well care includes a physical exam, immunizations, screening,
developmental assessment, an oral health risk assessment, and referral for specialized care if necessary. Anticipatory
guidance is tailored by age but, in general, covers such topics as physical growth and development, social and
academic competence, emotional well-being, risk reduction, and violence and injury prevention. Additional Core Set
measures reflect the clinical quality of these visits, including adolescent immunization status, Chlamydia screening
among sexually active women, and assessment of body mass index.
Exhibit AWC.1. Percentage of Adolescents with a
Well-Care Visit, FFY 2012 (n = 43 states)
Measure Description
This measure shows the percentage of
adolescents ages 12 to 21 that had at least
one comprehensive well-care visit with a
primary care practitioner or an
obstetrical/gynecological practitioner during
the measurement year. 8
70
60
Percentage
•
Overview of State Reporting
•
•
•
The number of states reporting the
Adolescent Well-Care Visits measure
increased from 29 states for FFY 2010 to 43
states for FFY 2011 and remained at 43
states for FFY 2012. 9
•
38.0
41.7
30
20
0
25th
50th 75th
Percentile
Source: Mathematica analysis of FFY 2012 CARTS reports.
Of the 43 states reporting the measure for
FFY 2012, 32 states reported the measure
for both their Medicaid and CHIP
populations, 8 reported the measure for their
CHIP population only, and 3 reported the
measure for their Medicaid population only.
Trends
•
In FFY 2012, all 43 states reported the
measure using Core Set specifications.
Among the 27 states reporting the measure
using Core Set specifications for all three
years, the median rate remained at 46
between FFY 2010 and FFY 2012 (Exhibit
AWC.2).
Exhibit AWC.2. Trends in the Percentage of
Adolescents Ages 12 to 21 Receiving At Least One
Well-Care Visit, FFY 2010–2012 (n = 27 states)
The median rate among the 43 states
reporting the measure for FFY 2012 was 42
percent, with a 16-point spread between the
25th and 75th percentiles (Exhibit AWC.1).
Rate
FFY 2010 FFY 2011 FFY 2012
Mean
46.1
45.9
46.8
Median
46.3
46.3
46.0
25th Percentile
37.3
37.5
39.6
75th Percentile
56.1
56.4
57.6
Source: Mathematica analysis of FFY 2010, 2011, and
2012 CARTS reports.
Performance on this measure ranged from
24 percent to 67 percent among states, with
considerable geographic variation across
states (Exhibit AWC.3, next page).
8
This measure is calculated using the administrative method
(claims/encounter data) or the hybrid method (claims/encounter
data combined with medical record review).
9
40
10
State Performance
•
53.5
50
The term “states” includes the 50 states and District of Columbia.
A.11
Exhibit AWC.3. Geographic Variation in the Percentage of Adolescents with a Well-Care Visit, FFY 2012 (n = 43
states)
WA
MT
ME
ND
OR
MN
ID
WI
SD
NY
WY
NV
CA
UT
AZ
CO
MI
IA
NE
PA
IL
OK
NM
OH
WV
VA
KY
DC
MD
NC
TN
SC
AR
MS
AL
GA
LA
TX
HI
IN
MO
KS
VT
NH
MA
RI
CT
NJ
DE
AK
FL
Did Not Report
24% to 38%
39% to 42%
43% to 53%
State Median: 42%
54% to 67%
Source: Mathematica analysis of FFY 2012 CARTS reports.
To view state-specific data for this measure, please see Table AWC at http://www.medicaid.gov/Medicaid-CHIPProgram-Information/By-Topics/Quality-of-Care/Downloads/Performance-on-the-Child-Core-Set-Measures-FFY2012.zip.
A.12
CHILDHOOD IMMUNIZATION STATUS (CIS)
Measure Steward: National Committee for Quality Assurance (NCQA)
A key indicator of the continuity of primary care is whether children are up to date on their immunizations by age 2.
The Centers for Disease Control and Prevention recommends the following immunizations by age 2: four diphtheria,
tetanus, and acellular pertussis (DTaP); three polio (IPV); one measles, mumps and rubella (MMR); two H influenza
type B (HiB); three hepatitis B (HepB); one chicken pox (VZV); four pneumococcal conjugate (PCV); two hepatitis
A (HepA); two or three rotavirus (RV); and two influenza (flu) vaccines. The Childhood Immunization Status
measure includes 10 rates for the individual vaccines and 9 combination rates. The most common combination rate
reported by states is “Combination 3,” which includes all of the vaccines except HepA, RV, and flu. State
performance is measured on the basis of the Combination 3 rate.
State Performance
Measure Description
•
This measure shows the percentage of
children that turned 2 years old during the
measurement year and had specific vaccines
and combinations of vaccines by their
second birthday. This measure is reported as
10 separate immunization rates and 9
combination rates. State performance is
measured on the basis of Combination 3, as
noted above. 10
Overview of State Reporting
•
•
The median Combination 3 rate among the
31 states using Core Set specifications to
report the measure for FFY 2012 was 68
percent, with a 15-point spread between the
25th and 75th percentiles (Exhibit CIS.2,
next page).
•
Performance on this measure ranged from 4
percent to 92 percent among states, with
considerable geographic variation across
states (Exhibit CIS.2, next page).
Exhibit CIS.1. Percentage of Children Up to Date on
Recommended Immunizations by their Second
Birthday, FFY 2012 (n = 31 states)
The number of states reporting the
Childhood Immunization Status measure
increased from 20 states for FFY 2010 to 30
states for FFY 2011 to 34 states for FFY
2012. 11
76.4
80
70
60
Of the 34 states reporting the measure for
FFY 2012, 28 states reported the measure
for both their Medicaid and CHIP
populations, 5 reported the measure for their
CHIP population only, and 1 reported the
measure for their Medicaid population only.
Percentage
•
•
61.0
67.9
50
40
30
20
In FFY 2012, 33 states reported the measure
using Core Set specifications (although 2 of
these states did not report the Combination 3
rate for FFY 2012). One state used another
specification.
10
0
25th
50th 75th
Percentile
Source: Mathematica analysis of FFY 2012 CARTS reports.
Trends
•
10
This measure is calculated using the administrative method
(claims/encounter or registry data) or the hybrid method
(claims/encounter data combined with medical record review).
11
The term “states” includes the 50 states and District of Columbia.
A.13
Trends are not available for this measure.
Trends are shown for measures reported by
at least 20 states for all three years (FFY
2010 to FFY 2012); 17 states reported this
measure for all three years.
Exhibit CIS.2. Geographic Variation in the Percentage of Children Up to Date on Recommended Immunizations by
their Second Birthday, FFY 2012 (n = 31 states)
WA
MT
ME
ND
OR
MN
ID
WI
SD
NY
WY
NV
CA
UT
AZ
CO
MI
IA
NE
PA
IL
KS
OH
WV
VA
KY
DC
MD
NC
TN
SC
AR
MS
AL
GA
LA
TX
HI
IN
MO
OK
NM
VT
NH
MA
RI
CT
NJ
DE
AK
FL
Did Not Report
4% to 60%
61% to 68%
69% to 76%
State Median: 68%
77% to 92%
Source: Mathematica analysis of FFY 2012 CARTS reports.
To view state-specific data for this measure, please see Table CIS at http://www.medicaid.gov/Medicaid-CHIPProgram-Information/By-Topics/Quality-of-Care/Downloads/Performance-on-the-Child-Core-Set-Measures-FFY2012.zip.
A.14
ADOLESCENT IMMUNIZATION STATUS (IMA)
Measure Steward: National Committee for Quality Assurance (NCQA)
Recommended well care for adolescents includes reviewing their immunization history to ensure they are up to date
on their vaccines. Between their 11th and 13th birthdays, adolescents should receive one dose of meningococcal
vaccine and one tetanus and diphtheria toxoids and acellular pertussis (Tdap) vaccine or one tetanus and diphtheria
toxoids (Td) vaccine. Adolescents should also receive the 3-dose human papillomavirus (HPV) series, although the
HPV vaccine is not captured in this quality measure. The Adolescent Immunization Status measure includes two
rates for the individual vaccines and one combination rate. State performance is measured on the basis of the
combination rate. An indicator of high-quality preventive care for adolescents is being up to date on these vaccines
by their 13th birthday.
State Performance
Measure Description
•
This measure shows the percentage of
adolescents that turned 13 years old during
the measurement year and had one
meningococcal and one Tdap or Td vaccine
by their 13th birthday. This measure is
reported as two separate immunization rates
and one combination rate. State performance
is measured on the basis of the combination
rate. 12
Overview of State Reporting
•
•
The median combination rate among the 30
states using Core Set specifications to report
the measure for FFY 2012 was 60 percent,
with a 22-point spread between the 25th and
75th percentiles (Exhibit IMA.1).
•
Performance on this measure ranged from
15 percent to 86 percent among states, with
considerable geographic variation across
states (Exhibit IMA.2, next page).
Exhibit IMA.1. Percentage of Adolescents Up to
Date on Recommended Immunizations by their 13th
Birthday, FFY 2012 (n = 30 states)
The number of states reporting the
Adolescent Immunization Status measure
increased from 12 states for FFY 2010 to 25
states for FFY 2011 and 32 states for FFY
2012. 13
80
71.1
70
60
Of the 32 states reporting the measure for
FFY 2012, 26 states reported the measure
for both their Medicaid and CHIP
populations, 4 reported the measure for their
CHIP population only, and 2 reported the
measure for their Medicaid population only.
Percentage
•
•
50
59.9
48.8
40
30
20
10
In FFY 2012, 30 states reported the measure
using Core Set specifications (although one
of these states did not report the
combination rate for FFY 2012). One state
used another specification.
0
25th
50th 75th
Percentile
Source: Mathematica analysis of FFY 2012 CARTS reports.
Trends
•
12
This measure is calculated using the administrative method
(claims/encounter or registry data) or the hybrid method
(claims/encounter data combined with medical record review).
13
The term “states” includes the 50 states and District of Columbia.
A.15
Trends are not available for this measure.
Trends are shown for measures reported by
at least 20 states for all three years (FFY
2010 to FFY 2012); 10 states reported this
measure for all three years.
Exhibit IMA.2. Geographic Variation in the Percentage of Adolescents Up to Date on Recommended
Immunizations by their 13th Birthday, FFY 2012 (n = 30 states)
WA
MT
ME
ND
OR
MN
ID
WI
SD
NY
WY
CA
UT
AZ
CO
MI
IA
NE
NV
PA
IL
KS
OH
WV
VA
KY
DC
MD
NC
TN
SC
AR
MS
AL
GA
LA
TX
HI
IN
MO
OK
NM
VT
NH
MA
RI
CT
NJ
DE
AK
FL
Did Not Report
15% to 48%
49% to 60%
61% to 70%
State Median: 60 %
71% to 86%
Source: Mathematica analysis of FFY 2012 CARTS reports.
To view state-specific data for this measure, please see Table IMA at http://www.medicaid.gov/Medicaid-CHIPProgram-Information/By-Topics/Quality-of-Care/Downloads/Performance-on-the-Child-Core-Set-Measures-FFY2012.zip.
A.16
CHLAMYDIA SCREENING (CHL)
Measure Steward: National Committee for Quality Assurance (NCQA)
Recommended well care for adolescents includes annual screening for Chlamydia for women who are sexually
active. Chlamydia is the most commonly reported sexually transmitted infection and easy to cure when it is detected.
However, most people have no symptoms and are not aware they are infected. Left untreated, Chlamydia can affect
a woman’s ability to have children. This measure is an indicator of the clinical quality of care for adolescents.
Exhibit CHL.1. Percentage of Sexually Active Women
Ages 16 to 20 Receiving At Least One Test for
Chlamydia, FFY 2012 (n = 35 states)
Measure Description
This measure shows the percentage of
women ages 16 to 20 that were identified as
sexually active and had at least one
Chlamydia test during the measurement
year. 14
70
Overview of State Reporting
•
•
•
57.8
60
Percentage
•
The number of states reporting the
Chlamydia Screening measure increased
from 21 states for FFY 2010 to 32 states for
FFY 2011 and 35 states for FFY 2012. 15
50
40
42.2
49.5
30
20
10
0
Of the 35 states reporting the measure for
FFY 2012, 25 states reported the measure
for both their Medicaid and CHIP
populations, 5 reported the measure for their
CHIP population only, and 5 reported the
measure for their Medicaid population only.
25th
50th 75th
Percentile
Source: Mathematica analysis of FFY 2012 CARTS reports.
Trends
•
In FFY 2012, all 35 states reported the
measure using Core Set specifications.
State Performance
Among the 20 states reporting the measure
using Core Set specifications for all three
years, the median rate increased by 5
percentage points from FFY 2010 to FFY
2012 (Exhibit CHL.2).
•
The median rate among the 35 states
reporting the measure for FFY 2012 was 50
percent, with a 16-point spread between the
25th and 75th percentiles (Exhibit CHL.1).
Exhibit CHL.2. Trends in the Percentage of Sexually
Active Women Ages 16 to 20 Receiving At Least
One Test for Chlamydia, FFY 2010–2012 (n = 20
states)
•
Performance on this measure ranged from 5
percent to 69 percent among states, with
considerable geographic variation across
states (Exhibit CHL.3, next page).
Rate
FFY 2010 FFY 2011 FFY 2012
Mean
41.7
46.1
46.7
Median
44.0
48.4
49.4
25th Percentile
25.1
39.6
39.0
75th Percentile
58.7
59.0
57.2
Source: Mathematica analysis of FFY 2010, 2011, and
2012 CARTS reports.
14
This measure is calculated using the administrative method
(claims/encounter data).
15
The term “states” includes the 50 states and District of Columbia.
A.17
Exhibit CHL.3. Geographic Variation in the Percentage of Sexually Active Women Ages 16 to 20 Receiving At
Least One Test for Chlamydia, FFY 2012 (n = 35 states)
WA
MT
ME
ND
OR
MN
ID
WI
SD
NY
WY
CA
UT
AZ
CO
MI
IA
NE
NV
PA
IL
KS
OH
WV
VA
KY
DC
MD
NC
TN
SC
AR
MS
AL
GA
LA
TX
HI
IN
MO
OK
NM
VT
NH
MA
RI
CT
NJ
DE
AK
FL
Did Not Report
5% to 42%
43% to 49%
50% to 58%
Source: Mathematica analysis of FFY 2012 CARTS reports.
State Median: 50%
59% to 69%
To view state-specific data for this measure, please see Table CHL at http://www.medicaid.gov/Medicaid-CHIPProgram-Information/By-Topics/Quality-of-Care/Downloads/Performance-on-the-Child-Core-Set-Measures-FFY2012.zip.
A.18
BODY MASS INDEX ASSESSMENT FOR CHILDREN AND ADOLESCENTS (WCC)
Measure Steward: National Committee for Quality Assurance (NCQA)
Overweight and obesity in childhood pose serious short- and long-term health risks, including higher incidence of
chronic diseases (such as high blood pressure, high cholesterol, diabetes, and asthma) and a higher risk of social and
emotional problems (such as low self-esteem). Overweight and obesity are frequently assessed based on the child’s
body mass index (BMI). BMI is calculated based on a child’s height and weight, adjusting for age and gender.
Primary care practitioners can play an important role in detecting and addressing overweight and obesity among
children by assessing their BMI. This measure indicates the frequency with which the BMI percentile is recorded in
the medical record.
Measure Description
•
•
This measure shows the percentage of
children ages 3 to 17 that had an outpatient
visit with a primary care practitioner or
obstetrical/gynecological provider and
whose weight is classified based on BMI
percentile for age and gender. 16
Exhibit WCC.1. Percentage of Children Whose
Weight is Classified Based on BMI Percentile,
FFY 2012 (n = 27 states)
Overview of State Reporting
•
•
The number of states reporting the BMI
Assessment for Children and Adolescents
measure increased from 10 states for FFY
2010 to 18 states for FFY 2011 and 27 states
for FFY 2012. 17
70
60
Percentage
•
Of the 27 states reporting the measure for
FFY 2012, 21 states reported the measure
for both their Medicaid and CHIP
populations, 3 reported the measure for their
CHIP population only, and 3 reported the
measure for their Medicaid population only.
•
30
20
1.6
25th
50th 75th
Percentile
Source: Mathematica analysis of FFY 2012 CARTS reports.
The median rate among the 27 states
reporting the measure for FFY 2012 was 39
percent, with a 50-point spread between the
25th and 75th percentiles (Exhibit WCC.1).
Trends
•
Performance on this measure ranged from 0.1
percent to 89 percent, with considerable
geographic variation across states (Exhibit
WCC.2, next page).
16
This measure is calculated using the administrative method
(claims/encounter data) or the hybrid method (claims/encounter
data combined with medical record review).
17
38.9
40
0
All 27 states reported the measure using
Core Set specifications for FFY 2012.
51.9
50
10
State Performance
•
The 15 states using the hybrid method had a
median of 45 percent, whereas the 12 states
using the administrative method had a
median of 2 percent. Assessment of the BMI
percentile is more likely to be noted in
medical records than in claims/encounter
data.
The term “states” includes the 50 states and District of Columbia.
A.19
Trends are not available for this measure.
Trends are shown for measures reported by
at least 20 states for all three years (FFY
2010 to FFY 2012); 10 states reported this
measure for all three years.
Exhibit WCC.2. Geographic Variation in the Percentage of Children Whose Weight is Classified Based on BMI
Percentile, FFY 2012 (n = 27 states)
WA
MT
ME
ND
OR
MN
ID
WI
SD
NY
WY
NV
CA
UT
AZ
CO
MI
IA
NE
PA
IL
KS
OH
WV
VA
KY
DC
MD
NC
TN
SC
AR
MS
AL
GA
LA
TX
HI
IN
MO
OK
NM
VT
NH
MA
RI
CT
NJ
DE
AK
FL
Did Not Report
0% to 1%
2% to 39%
40% to 52%
State Median: 39 %
53% to 89%
Source: Mathematica analysis of FFY 2012 CARTS reports.
To view state-specific data for this measure, please see Table WCC at http://www.medicaid.gov/Medicaid-CHIPProgram-Information/By-Topics/Quality-of-Care/Downloads/Performance-on-the-Child-Core-Set-Measures-FFY2012.zip.
A.20
PERINATAL HEALTH
Two out of every three women enrolled in Medicaid are in their reproductive years (ages 19 to 44)
and Medicaid currently finances about 45 percent of all births in the United States. CMS has a major
role to play in improving maternity care and birth outcomes, and measuring how care is delivered to
pregnant and postpartum women. Despite improvements in access to coverage and care, the rate of
preterm births among low-income women enrolled in Medicaid is higher than the rate for all other
women (11.9 percent vs. 8.7 percent). 18
CMS launched two national initiatives in 2012 to help improve perinatal outcomes among
Medicaid/CHIP and other payers. One initiative, Strong Start for Mothers and Newborns, which is
led by the CMS Innovation Center, includes two primary strategies: (1) testing ways to encourage
best practices for reducing the number of early elective deliveries that lack medical indication, across
all payer types; and (2) a grant initiative to test and evaluate four models of enhanced prenatal care
for reducing preterm births and decreasing the anticipated total cost of medical care during
pregnancy, delivery, and the first year of life among women and infants covered by Medicaid/CHIP.
In February 2013, CMS awarded grants to 27 recipients to support the testing of enhanced prenatal
care through three approaches: (1) group or centering visits, (2) at birth centers, and (3) at maternity
care homes. 19 Projects are located in 32 states, the District of Columbia, and Puerto Rico, and will
serve more than 80,000 women enrolled in Medicaid or CHIP over a three-year period.
The second initiative, the Expert Panel on Improving Maternal and Infant Outcomes in Medicaid and
CHIP (Expert Panel), was launched in June 2012 to explore policy and reimbursement opportunities
for Medicaid programs to provide better care, improve birth outcomes, and reduce health care costs
for mothers and infants. In August 2013, the Expert Panel presented strategies for CMS leadership to
consider as it develops implementation plans to improve birth outcomes. The strategies were selected
based on potential impact, available resources, and partnership opportunities.
To support its maternity-focused efforts, CMS identified a core set of eight Medicaid/CHIP maternity
measures for voluntary reporting by states. This core set, which consists of five of CMS’s Child Core
measures and three of the Adult Core Set measures, will be used by CMS to measure progress toward
improvement and evaluate efforts. 20
The two Child Core Set measures included in this section are those for which information is available
from at least 25 states for the FFY 2012 reporting year. The measures are as follows:
1. Timeliness of Prenatal Care
2. Frequency of Ongoing Prenatal Care
These measures, along with the measure assessing children’s receipt of well-child visits in the
first 15 months of life (discussed in the previous section), are three of the five Child Core Set
measures that are part of CMS’s Maternity Core Set.
18
CDC, PRAMS 2008. Infants born preterm (that is, at less than 37 weeks of gestation) are at higher risk of developmental
problems and health problems than infants born at full term. Substantial medical and societal costs are also associated with
preterm births.
19
The fourth model, home visiting implemented by the Health Resources and Services Administration (HRSA), will be evaluated
along with the other three enhanced models of care.
20
The CMS Medicaid/CHIP Maternity Core Set is available at http://www.medicaid.gov/Medicaid-CHIP-ProgramInformation/By-Topics/Quality-of-Care/Downloads/2013-Core-Set-of-Maternity-Measures.pdf.
A.21
This page left blank for double-sided copying.
TIMELINESS OF PRENATAL CARE (PPC)
Measure Steward: National Committee for Quality Assurance (NCQA)
Initiation of prenatal care during the first trimester of pregnancy facilitates a comprehensive assessment of a
woman’s health history, pregnancy risk, and health knowledge. Early screening and referrals for specialized care can
prevent pregnancy complications resulting from pre-existing health conditions (such as diabetes and high blood
pressure) or promote access to recommended care (such as immunizations and oral health services). Moreover,
health education and counseling related to having a healthy pregnancy can encourage healthy behaviors (such as
healthy eating and weight gain) and reduce risky behaviors (such as tobacco, alcohol and other drug use). This
measure indicates how often Medicaid/CHIP enrollees receive timely prenatal care (that is, in the first trimester or
within 42 days of Medicaid/CHIP enrollment).
Exhibit PPC.1. Percentage of Pregnant Women with a
Prenatal Care Visit in the First Trimester or within 42
Days of Medicaid/CHIP Enrollment, FFY 2012 (n =
31 states)
Measure Description
•
This measure shows the percentage of
deliveries of live births that received a
prenatal care visit in the first trimester or
within 42 days of Medicaid/CHIP
enrollment. 21
100
90
80
Overview of State Reporting
•
•
The number of states reporting the
Timeliness of Prenatal Care measure
increased from 15 states for FFY 2010 to 24
states for FFY 2011 and 31 states for FFY
2012. 22
Percentage
•
70
Performance on this measure ranged from
30 percent to 92 percent among states, with
considerable geographic variation across
states (Exhibit PPC.2, next page).
50
40
0
25th
50th 75th
Percentile
Source: Mathematica analysis of FFY 2012 CARTS reports.
Trends
•
21
This measure is calculated using the administrative method
(claims/encounter data) or the hybrid method (claims/encounter
data combined with medical record review).
22
60
10
State Performance
•
72.2
20
In FFY 2012, 31 states reported the measure
using Core Set specifications.
The median rate among the 31 states
reporting the measure for FFY 2012 was 83
percent, with a 16-point spread between the
25th and 75th percentiles (Exhibit PPC.1).
87.8
30
Of the 31 states reporting the measure for
FFY 2012, 20 states reported the measure
for both their Medicaid and CHIP
populations, 9 reported the measure for their
Medicaid population only, and 2 reported
the measure for their CHIP population only.
•
83.4
The term “states” includes the 50 states and District of Columbia.
A.23
Trends are not available for this measure.
Trends are shown for measures reported by
at least 20 states for all three years (FFY
2010 to FFY 2012); 13 states reported this
measure for all three years.
Exhibit PPC.2. Geographic Variation in the Percentage of Pregnant Women with a Prenatal Care Visit in the First
Trimester or within 42 Days of Medicaid/CHIP Enrollment, FFY 2012 (n = 31 states)
WA
MT
ME
ND
OR
MN
ID
WI
SD
NY
WY
CA
UT
AZ
CO
MI
IA
NE
NV
PA
IL
KS
OH
WV
VA
KY
DC
MD
NC
TN
SC
AR
MS
AL
GA
LA
TX
HI
IN
MO
OK
NM
VT
NH
MA
RI
CT
NJ
DE
AK
FL
Did Not Report
30% to 72%
73% to 83%
84% to 88%
State Median: 83 %
89% to 92%
Source: Mathematica analysis of FFY 2012 CARTS reports.
To view state-specific data for this measure, please see Table PPC at http://www.medicaid.gov/Medicaid-CHIPProgram-Information/By-Topics/Quality-of-Care/Downloads/Performance-on-the-Child-Core-Set-Measures-FFY2012.zip.
A.24
FREQUENCY OF ONGOING PRENATAL CARE (FPC)
Measure Steward: National Committee for Quality Assurance (NCQA)
Ongoing prenatal care enables prenatal care providers to make periodic assessments of a woman’s pregnancy risk
and health status, perform recommended screenings and laboratory tests, and provide timely referrals for specialized
care. Through regular, ongoing prenatal care, women can develop trusted relationships with their prenatal care
providers, facilitating meaningful opportunities for health education and counseling targeted to a woman’s
circumstances and stage of pregnancy. Regular prenatal care enables providers to promote positive maternal and
infant health outcomes by addressing a wide range of women’s health, social, and emotional issues. The Core Set
measure focuses on the extent to which women had more than 80 percent of the expected prenatal care visits.
Measure Description
•
•
This measure shows the percentage of
deliveries that received the following
number of expected prenatal visits:
Exhibit FPC.1. Percentage of Pregnant Women
Receiving More Than 80 Percent of the Expected
Number of Prenatal Care Visits, FFY 2012
(n = 25 states)
< 21 percent of expected visits
21 percent – 40 percent of expected visits
41 percent – 60 percent of expected visits
61 percent – 80 percent of expected visits
> 80 percent of expected visits. 23
80
•
•
60
Percentage
The number of states reporting the
Frequency of Ongoing Prenatal Care
measure increased from 12 states for FFY
2010 to 17 states for FFY 2011 and 25 states
for FFY 2012. 24
40
30
10
0
25th
50th 75th
Percentile
Source: Mathematica analysis of FFY 2012 CARTS reports.
In FFY 2012, 25 states reported the measure
using Core Set specifications.
Trends
•
The median rate among the 25 states
reporting the measure for FFY 2012 was 59
percent, with a 19-point spread between the
25th and 75th percentiles (Exhibit FPC.1).
23
This measure is calculated using the administrative method
(claims/encounter data) or the hybrid method (claims/encounter
data combined with medical record review).
24
50
58.7
50.9
20
Of the 25 states reporting the measure for
FFY 2012, 17 states reported the measure
for both their Medicaid and CHIP
populations, 6 reported the measure for their
Medicaid population only, and 2 reported
the measure for their CHIP population only.
State Performance
•
70.2
70
Overview of State Reporting
•
Performance on this measure ranged from 2
percent to 79 percent among states, with
considerable geographic variation across
states (Exhibit FPC.2, next page).
The term “states” includes the 50 states and District of Columbia.
A.25
Trends are not available for this measure.
Trends are shown for measures reported by
at least 20 states for all three years (FFY
2010 to FFY 2012); 10 states reported the
measure for all three years.
Exhibit FPC.2. Geographic Variation in the Percentage of Pregnant Women Receiving More Than 80 Percent of the
Expected Number of Prenatal Care Visits, FFY 2012 (n = 25 states)
WA
MT
ME
ND
OR
MN
ID
WI
SD
NY
WY
CA
UT
AZ
CO
MI
IA
NE
NV
PA
IL
KS
OH
WV
VA
KY
DC
MD
NC
TN
SC
AR
MS
AL
GA
LA
TX
HI
IN
MO
OK
NM
VT
NH
MA
RI
CT
NJ
DE
AK
FL
Did Not Report
2% to 50%
51% to 58%
59% to 70%
State Median: 59 %
71% to 79%
Source: Mathematica analysis of FFY 2012 CARTS reports.
To view state-specific data for this measure, please see Table FPC at http://www.medicaid.gov/Medicaid-CHIPProgram-Information/By-Topics/Quality-of-Care/Downloads/Performance-on-the-Child-Core-Set-Measures-FFY2012.zip.
A.26
MANAGEMENT OF ACUTE AND CHRONIC CONDITIONS
The extent to which children receive safe, timely, and effective care is a key indicator of the quality
of care provided in Medicaid and CHIP. Children covered by Medicaid have higher rates of physical,
developmental, and intellectual health problems than privately insured children. Therefore, ensuring
early detection and effective treatment will reduce the need for more costly care later and improve
children’s chances of leading healthy, productive lives.
Through Medicaid’s Early and Periodic Screening, Diagnostic, and Treatment (EPSDT) benefit,
children and adolescents under age 21 are entitled to receive treatment for Medicaid-covered services
listed in Section 1905(a) of the Social Security Act if that treatment or service is necessary to
“correct or ameliorate” a physical or mental condition. 25 Children enrolled in CHIP Medicaid
expansion programs are also entitled to this benefit.
CMS has efforts under way to improve children’s access to and use of medically necessary care. For
example:
•
The CHIPRA-funded, multistate Quality Demonstration Grants include efforts to evaluate
provider-based models of care, use of electronic health record systems, and integration of
physical and behavioral health services. 26
•
A Health Home provision, authorized by Section 2703 of the Affordable Care Act, gives
states two years of an enhanced match to improve care coordination for children and adults
with multiple chronic conditions (such as asthma, obesity, and substance use disorder).
•
Two recently released informational bulletins provide guidance on (1) coverage of behavioral
health services for children with mental health and substance abuse problems, and (2)
promotion of trauma-informed services for children. 27
To support these efforts, CMS has identified several Child Core Set measures to track performance
on getting children the “right care in the right setting at the right time.” The four Child Core Set
measures included in this section are those for which information is available from at least 25 states
for the FFY 2012 reporting year:
1. Appropriate Testing for Children with Pharyngitis
2. Follow-Up After Hospitalization for Mental Illness
3. Follow-Up Care for Children Prescribed Attention-Deficit/Hyperactivity Disorder
Medication
4. Pediatric Central Line-Associated Blood Stream Infections in Neonatal Intensive Care
Units
25
Section 1905(a)(r)(5).
26
See http://www.medicaid.gov/Medicaid-CHIP-Program-Information/By-Topics/Childrens-Health-InsuranceProgram-CHIP/CHIPRA-Quality-Demonstration-Grants-Summary.html.
27
See http://medicaid.gov/Federal-Policy-Guidance/Downloads/CIB-05-07-2013.pdf and
http://medicaid.gov/Federal-Policy-Guidance/Downloads/SMD-13-07-11.pdf.
A.27
This page left blank for double-sided copying.
APPROPRIATE TESTING FOR CHILDREN WITH PHARYNGITIS (CWP)
Measure Steward: National Committee for Quality Assurance (NCQA)
Appropriate administration of a strep test for pharyngitis (sore throat) among children dispensed an antibiotic is an
indicator of clinical quality in the delivery of primary care for children. A strep test is required to assess whether a
sore throat is caused by a viral rather than a bacterial infection. Antibiotics should be prescribed only for sore throats
caused by bacterial infections, and most sore throats in children are caused by viruses. Concerns about overuse of
antibiotics and development of antibiotic resistance have led to increased emphasis on conducting a strep test before
an antibiotic is prescribed. Therefore, this measure assesses whether providers performed a strep test among children
diagnosed with a sore throat and dispensed an antibiotic.
Exhibit CWP.1. Percentage of Children Diagnosed
with Pharyngitis, Dispensed an Antibiotic, and
Received a Group A Streptococcus Test, FFY 2012
(n = 36 states)
Measure Description
•
This measure shows the percentage of
children ages 2 to 18 that were diagnosed
with pharyngitis, dispensed an antibiotic,
and received a group A streptococcus (strep)
test for the episode. 28
80
70
60
•
•
Percentage
Overview of State Reporting
•
The number of states reporting the
Appropriate Testing for Children with
Pharyngitis measure increased from 20
states for FFY 2010 to 28 states for FFY
2011 and 36 states for FFY 2012. 29
•
55.4
50
40
30
10
Of the 36 states reporting the measure for
FFY 2012, 24 states reported the measure
for both their Medicaid and CHIP
populations, 9 reported the measure for their
CHIP population only, and 3 reported the
measure for their Medicaid population only.
0
25th
50th 75th
Percentile
Source: Mathematica analysis of FFY 2012 CARTS reports.
Trends
In FFY 2012, all 36 states reported the
measure using Core Set specifications.
•
The median rate among the 36 states
reporting the measure for FFY 2012 was 69
percent, with a 20-point spread between the
25th and 75th percentiles (Exhibit CWP.1).
Among the 20 states reporting the measure
using Core Set specifications for all three
years, the median rate for Medicaid/CHIP
programs increased by 5 percentage points
from FFY 2010 to FFY 2012 (Exhibit
CWP.2).
Exhibit CWP.2. Trends in the Percentage of Children
Diagnosed with Pharyngitis, Dispensed an Antibiotic,
and Received a Group A Streptococcus Test, FFY
2010–2012 (n = 20 states)
Performance on this measure ranged from
17 percent to 91 percent among states, with
considerable geographic variation across
states (Exhibit CWP.3, next page).
Rate
FFY 2010 FFY 2011 FFY 2012
Mean
62.7
62.9
66.9
Median
65.6
65.3
70.8
25th Percentile
55.5
55.8
58.8
75th Percentile
72.8
72.8
78.0
Source: Mathematica analysis of FFY 2010, 2011, and
2012 CARTS reports.
28
This measure is calculated using the administrative method
(claims/encounter data).
29
75.8
20
State Performance
•
69.1
The term “states” includes the 50 states and District of Columbia.
A.29
Exhibit CWP.3. Geographic Variation in the Percentage of Children Diagnosed with Pharyngitis, Dispensed an
Antibiotic, and Received a Group A Streptococcus Test, FFY 2012 (n = 36 states)
WA
MT
ME
ND
OR
MN
ID
WI
SD
NY
WY
CA
UT
AZ
CO
MI
IA
NE
NV
PA
IL
KS
OH
WV
VA
KY
DC
MD
NC
TN
SC
AR
MS
AL
GA
LA
TX
HI
IN
MO
OK
NM
VT
NH
MA
RI
CT
NJ
DE
AK
FL
Did Not Report
17% to 55%
56% to 69%
70% to 76%
State Median: 69%
77% to 91%
Source: Mathematica analysis of FFY 2012 CARTS reports.
To view state-specific data for this measure, please see Table CWP at http://www.medicaid.gov/Medicaid-CHIPProgram-Information/By-Topics/Quality-of-Care/Downloads/Performance-on-the-Child-Core-Set-Measures-FFY2012.zip.
A.30
FOLLOW-UP AFTER HOSPITALIZATION FOR MENTAL ILLNESS (FUH)
Measure Steward: National Committee for Quality Assurance (NCQA)
After a child receives inpatient treatment for mental illness, follow-up outpatient mental health treatment is
necessary to manage medications, continue therapy, facilitate transitions to home and school, and generally prevent
readmissions due to the lack of continuous care. The first visit with an outpatient mental health provider should take
place within 30 days of discharge and ideally, within 7 days of discharge. This measure is an indicator of the
coordination of care across settings (inpatient and outpatient) for children with behavioral health conditions.
Measure Description
•
This measure shows the percentage of
discharges for children ages 6 to 20
hospitalized for treatment of selected mental
health disorders who had an outpatient visit,
an intensive outpatient encounter, or partial
hospitalization with a mental health
practitioner within 7 days of discharge and
within 30 days of discharge. 30
•
Performance on the 7-day follow-up visit
measure ranged from 7 percent to 80 percent
among state and from 16 percent to 94
percent for the 7-day follow-up visit
measure, with considerable geographic
variation across states (Exhibits FUH.2 and
FUH.3, next page).
•
Although the Child Core Set measure is
specified to include discharges for children
ages 6 to 20, 9 of the 27 states reporting this
measure for FFY 2012 noted that their rates
are not limited to children and include
individuals over age 20. 32
Overview of State Reporting
•
•
The number of states reporting the FollowUp After Hospitalization for Mental Illness
measure increased from 11 states for FFY
2010 to 24 states for FFY 2011 and 27 states
for FFY 2012. 31
Exhibit FUH.1. Percentage of Discharges for Mental
Illness for Children Ages 6 to 20 Receiving a FollowUp Visit within 7 and 30 Days of Discharge, FFY 2012
(n = 27 states)
Of the 27 states reporting the measure for
FFY 2012, 21 states reported the measure
for both their Medicaid and CHIP
populations, 5 reported the measure for their
CHIP population only, and 1 reported the
measure for their Medicaid population only.
90
79.9
80
70
Percentage
•
In FFY 2012, 27 states reported the measure
using Core Set specifications.
60
50
40
53.4
60.2
61.1
68.4
40.3
25th Percentile
Median
30
75th Percentile
20
10
State Performance
•
0
The median rate among the 27 states
reporting the measure for FFY 2012 was 68
percent for a follow-up visit within 30 days
of discharge (with a 19-point spread
between the 25th and 75th percentiles). The
median rate for a follow-up visit within 7
days of discharge was 53 percent (with a 20point spread) (Exhibit FUH.1).
Within 30 Days
Source: Mathematica analysis of FFY 2012 CARTS reports.
Trends
•
30
This measure is calculated using the administrative method
(claims/encounter data).
31
Within 7 Days
Trends are not available for this measure.
Trends are shown for measures reported by
at least 20 states for all three years (FFY
2010 to FFY 2012); 7 states reported this
measure for all three years.
32
The HEDIS measure, on which the Core Set measure is based,
includes individuals 6 years of age and over and does not
disaggregate this measure for children ages 6 to 20.
The term “states” includes the 50 states and District of Columbia.
A.31
Exhibit FUH.2. Geographic Variation in the Percentage of Discharges for Mental Illness for Children Ages 6 to 20
Receiving a Follow-Up Visit within 7 Days of Discharge, FFY 2012 (n = 27 states)
WA
MT
ME
ND
OR
MN
ID
WI
SD
WY
NV
UT
CA
AZ
MI
IA
NE
PA
IL
CO
KS
IN
WV
VA
KY
DC
MD
NC
TN
SC
AR
MS
AL
GA
LA
TX
HI
OH
MO
OK
NM
VT
NH
MA
RI
CT
NJ
DE
NY
AK
FL
Did Not Report
7% to 39%
40% to 52%
State Median: 53 %
53% to 60%
61% to 80%
Source: Mathematica analysis of FFY 2012 CARTS reports.
Exhibit FUH.3. Geographic Variation in the Percentage of Discharges for Mental Illness for Children Ages 6 to 20
Receiving a Follow-Up Visit within 30 Days of Discharge, FFY 2012 (n = 27 states)
WA
MT
ME
ND
OR
MN
ID
WI
SD
WY
CA
UT
AZ
CO
MI
IA
NE
NV
PA
IL
KS
HI
OH
WV
VA
KY
DC
MD
NC
TN
SC
AR
MS
TX
IN
MO
OK
NM
VT
NH
MA
RI
CT
NJ
DE
NY
AL
GA
LA
AK
FL
Did Not Report
16% to 61%
62% to 68%
69% to 80%
State Median: 68 %
81% to 94%
Source: Mathematica analysis of FFY 2012 CARTS reports.
To view state-specific data for this measure, please see Table FUH at http://www.medicaid.gov/Medicaid-CHIPProgram-Information/By-Topics/Quality-of-Care/Downloads/Performance-on-the-Child-Core-Set-Measures-FFY2012.zip.
A.32
FOLLOW-UP CARE FOR CHILDREN PRESCRIBED ATTENTION-DEFICIT/HYPERACTIVITY DISORDER
MEDICATION (ADD)
Measure Steward: National Committee for Quality Assurance (NCQA)
Attention-deficit/hyperactivity disorder (ADHD) is a common chronic condition among school-age children,
associated with academic, behavior, and relationship problems, and often treated with medication to improve
children’s functioning. Among those newly prescribed an ADHD medication, clinical guidelines recommend a
follow-up visit within the first 30 days (the Initiation Phase) for medication management. Among those remaining
on ADHD medication, two additional visits are recommended during the 9-month Continuation and Maintenance
(C&M) Phase for ongoing medication management and assessment of the child’s functioning. This measure shows
the clinical quality and continuity of care for children with a chronic condition.
Measure Description
•
•
This measure shows the percentage of
children newly prescribed ADHD
medication that had at least three follow-up
visits within a 10-month period, one of
which was within 30 days from the time the
first ADHD medication was dispensed. Two
rates are reported: one for the Initiation
Phase and one for the C&M Phase. 33
Exhibit ADD.1. Percentage of Children Prescribed
Medication for ADHD that Received At Least One
Visit during the 30-Day Initiation Phase and At Least
Two Visits during the 9-Month Continuation and
Maintenance Phase, FFY 2012
Overview of State Reporting
•
•
The number of states reporting the FollowUp Care for Children Prescribed ADHD
Medication measure increased from 15
states for FFY 2010 to 24 states for FFY
2011 and 29 states for FFY 2012. 34
70
Of the 29 states reporting the measure for
FFY 2012, 23 states reported the measure
for both their Medicaid and CHIP
populations, 4 reported the measure for their
CHIP population only, and 2 reported the
measure for their Medicaid population only.
50
40
37.1
41.1
46.4
53.4
25th Percentile
Median
30
75th Percentile
20
0
In FFY 2012, all 29 states reported the
measure using Core Set specifications
(although one of these states did not report a
rate for the C&M Phase).
Initiation
Continuation and
Phase
Maintenance Phase
(n = 29 states)
(n = 28 states)
Source: Mathematica analysis of FFY 2012 CARTS reports.
Trends
•
The median rate among the states reporting
the measure for FFY 2012 was 41 percent
for the Initiation Phase (29 states) and 53
percent for the C&M Phase (28 states), with
a 13- and 15-point spread between the 25th
and 75th percentiles (Exhibit ADD.1). 35
33
This measure is calculated using the administrative method
(claims/encounter data).
34
50.0
10
State Performance
•
61.1
60
Percentage
•
Performance on this measure ranged from
18 percent to 66 percent among states for the
Initiation Phase and from 5 percent to 100
percent for the C&M Phase, with
considerable geographic variation across
states (Exhibit ADD.2, next page).
The term “states” includes the 50 states and District of Columbia.
35
The rate for the C&M Phase is based on those children who had
at least one visit in the 30-day Initiation Phase.
A.33
Trends are not available for this measure.
Trends are shown for measures reported by
at least 20 states for all three years (FFY
2010 to FFY 2012); 15 states reported this
measure for all three years.
Exhibit ADD.2. Geographic Variation in the Percentage of Children Prescribed Medication for ADHD that
Received At Least One Visit during the 30-Day Initiation Phase, FFY 2012
WA
MT
ME
ND
OR
MN
ID
WI
SD
WY
NV
UT
CA
AZ
MI
IA
NE
PA
IL
CO
KS
WV
VA
KY
DC
MD
NC
TN
SC
AR
AL
MS
GA
LA
TX
HI
OH
IN
MO
OK
NM
VT
NH
MA
RI
CT
NJ
DE
NY
AK
FL
Did Not Report
18% to 37%
38% to 41%
State Median: 41%
42% to 50%
51% to 66%
Source: Mathematica analysis of FFY 2012 CARTS reports.
Exhibit ADD.3. Geographic Variation in the Percentage of Children Prescribed Medication for ADHD that
Received At Least Two Visits during the 9-Month Continuation and Maintenance Phase, FFY 2012
WA
MT
ME
ND
OR
MN
ID
WI
SD
WY
NV
CA
UT
AZ
CO
MI
IA
NE
PA
IL
KS
IN
HI
VA
KY
DC
MD
NC
TN
SC
AR
MS
TX
OH
WV
MO
OK
NM
VT
NH
MA
RI
CT
NJ
DE
NY
AL
GA
LA
AK
FL
Did Not Report
5% to 46%
47% to 53%
54% to 61%
State Median: 5 3%
62% to 100%
Source: Mathematica analysis of FFY 2012 CARTS reports.
To view state-specific data for this measure, please see Table ADD at http://www.medicaid.gov/Medicaid-CHIPProgram-Information/By-Topics/Quality-of-Care/Downloads/Performance-on-the-Child-Core-Set-Measures-FFY2012.zip.
A.34
CENTRAL LINE-ASSOCIATED BLOOD STREAM INFECTIONS IN NEONATAL INTENSIVE CARE UNITS
(CLABSI)
Measure Steward: Centers for Disease Control and Prevention (CDC)
Central Line-Associated Blood Stream Infections (CLABSIs) are a significant cause of mortality and morbidity in
hospital neonatal intensive care units (NICUs). Improper insertion of central lines (an intravascular catheter that
terminates at or close to the heart or in one of the great vessels) can cause life-threatening infections. Premature
infants in NICUs are particularly susceptible to infection because of their immature immune systems. Neonatal
CLABSIs are preventable through changes in the safety culture in NICUs, including the use of proper insertion
techniques and maintenance protocols. Efforts to prevent CLABSIs are effective in reducing infections, saving lives,
and reducing health care costs. This measure is an indicator of state performance in reducing CLABSIs in NICUs.
State Performance
Measure Description
•
This measure shows the rate of CLABSIs in
NICUs. The Child Core Set measure also
includes the rate of CLABSIs in pediatric
intensive care units (PICUs). At this time,
data on CLABSIs occurring in PICUs are
not available.
•
The Standardized Infection Ratio (SIR) is
the summary measure used to track
CLABSIs over time. The SIR compares the
number of infections reported in a facility or
state to the baseline U.S. experience,
adjusting for several risk factors that have
been found to be associated with differences
in infection rates.
•
The SIR indicates whether the rate of
infections increased, decreased, or did not
change significantly relative to the baseline
(calculated using data for 2006–2008). The
SIR is evaluated based on the 95 percent
confidence interval and the baseline
population SIR of 1.
•
This measure is obtained from data reported
by hospitals to the CDC National Healthcare
Safety Network. The measure includes all
neonatal CLABSI events not just those for
infants covered by Medicaid/CHIP.
•
Of the 40 states, 28 had a significant decrease
in infections since the baseline period and 12
had no change in infections since the baseline
period (Exhibit CLABSI.1). No states had a
significant increase in infections.
•
Among the 40 states with CLABSI rates for
2011, the SIRs ranged from 0.233 to 1.307
(Exhibit CLABSI.2). An SIR less than 1 means
that fewer infections occurred relative to what
would have been predicted given the baseline
data. An SIR greater than 1 means that more
infections occurred relative to what would have
been predicted given the baseline data. An SIR
equal to 1 means that the number of infections
is no different than the baseline period. The
percentage change is determined by calculating
1 minus the SIR; for example, an SIR of 0.233
signifies a 76.7 percent reduction from the
baseline period, while an SIR of 1.307 indicates
a 30.7 percent increase. Whether an increase or
decrease is significant is determined by
evaluating the SIR based on the 95 confidence
interval and the baseline population SIR of 1. 37
Progress
•
The national goal for CLABSIs in all ICUs
(including non-neonatal ICUs) is 0.51 by the
end of 2013. The CLABSI rate in NICUs was
0.65 in the 40 states in 2011.
•
Although no states reported an increase in
CLABSIs in NICUs since the baseline period,
there is room for improvement for states to
meet the Secretary’s Goal for reducing
CLABSIs by 50 percent by the end of 2013.
Overview of State Reporting
•
36
In 2011, CDC calculated state-level
CLABSI rates for 40 states. 36 CDC does not
calculate rates for states that had fewer than
five facilities reporting (Exhibit CLABSI.1,
next page).
37
For further information on the methods used to assess state
performance, see the CDC 2011 National and State HealthcareAssociated Infections Standardized Infection Ratio Report,
available at http://www.cdc.gov/hai/pdfs/SIR/SIRReport_02_07_2013.pdf.
The term “states” includes the 50 states and District of Columbia.
A.35
Exhibit CLABSI.1. Geographic Variation in State Performance on Central Line-Associated Blood Stream Infections
in Neonatal Intensive Care Units, 2011
WA
MT
ME
ND
OR
MN
ID
WI
SD
NY
WY
CA
UT
AZ
CO
MI
IA
NE
NV
PA
IL
KS
NM
OH
WV
VA
KY
DC
MD
NC
TN
SC
AR
MS
AL
GA
LA
TX
HI
IN
MO
OK
VT
NH
MA
RI
CT
NJ
DE
AK
Baseline = 1.0
FL
No change in infections since baseline period
Decrease in infections since baseline period
Increase in infections since baseline period
Fewer than five facilities reporting
CLABSI data during 2011
Source: Centers for Disease Control and Prevention, 2011 National and State Healthcare-Associated Infections
Standardized Infection Ratio Report, Table 3d, available at http://www.cdc.gov/hai/pdfs/SIR/SIRReport_02_07_2013.pdf.
To view state-specific data for this measure, please see Table CLABSI at http://www.medicaid.gov/Medicaid-CHIPProgram-Information/By-Topics/Quality-of-Care/Downloads/Performance-on-the-Child-Core-Set-Measures-FFY2012.zip.
To view a CMS-convened workgroup report on state reporting of the CLABSI measure, please see
http://www.medicaid.gov/Medicaid-CHIP-Program-Information/By-Topics/Quality-of-Care/Downloads/CLABSIWorkgroup-Report.pdf.
A.36
Exhibit CLABSI.2. State Performance on Central Line-Associated Blood Stream Infections in Neonatal Intensive
Care Units, 2011
Lower Numbers are Better
1.237
Alabama
Arizona
Arkansas
California
Colorado
Connecticut
D.C.
Florida
Georgia
Idaho
Illinois
Indiana
Iowa
Kansas
Kentucky
Louisiana
Maryland
Massachusetts
Michigan
Minnesota
Mississippi
Missouri
Montana
Nebraska
Nevada
New Jersey
New York
North Carolina
North Dakota
Ohio
Oklahoma
Oregon
Pennsylvania
South Carolina
Tennessee
Texas
Utah
Virginia
Washington
Wisconsin
0.668
0.364
0.460
0.550
0.548
0.296
0.733
0.986
0.693
0.474
0.709
0.370
0.587
1.082
0.896
0.642
0.748
0.642
0.438
1.307
0.522
0.233
0.765
0.343
0.872
0.864
0.383
0.844
0.543
0.670
0.417
0.666
1.057
0.621
0.622
0.874
0.478
0.528
0.664
0
1.0
Baseline
Standardized Infection Ratio (SIR)
No change in infections since baseline period
Decrease in infections since baseline period
Increase in infections since baseline period
A.37
2.0
Exhibit CLABSI.2 (continued)
Source: Centers for Disease Control and Prevention, 2011 National and State Healthcare-Associated Infections Standardized
Infection Ratio Report, Table 3d, available at http://www.cdc.gov/hai/pdfs/SIR/SIR-Report_02_07_2013.pdf.
Notes:
This figure includes data for 40 states. Data are displayed if at least 5 facilities reported CLABSI data during the
reporting period; 11 states (AK, DE, HI, ME, NH, NM, RI, SD, VT, WV, and WY) had fewer than 5 facilities
reporting. The term “states” includes the 50 states and the District of Columbia.
Data are included from all NICU locations, including Level II/III and Level III nurseries. For this report, umbilical-line
and central line-associated bloodstream infections are both considered CLABSIs.
*The Standardized Infection Ratio (SIR) compares the actual number of healthcare-associated infections (HAIs) in a
facility or state with the baseline U.S. experience, adjusting for several risk factors that have been found to be most
associated with differences in infection rates. Evaluation is determined using the 95 percent confidence interval around
the SIR. If the SIR is 1, the number of infections reported is the same as the number of infections predicted given the
baseline data, indicating there has been no change in infections since the baseline period. If the SIR is less than 1, the
number of infections reported is less than the number of infections predicted given the baseline data, indicating that
infections have been prevented since the baseline period. If the SIR is greater than 1, the number of infections reported
is greater than the number of infections predicted given the baseline data, indicating that infections have increased since
the baseline period. More information is available at: http://www.cdc.gov/hai/surveillance/QA_stateSummary.html.
A.38
DENTAL AND ORAL HEALTH SERVICES
States’ efforts over the past decade have resulted in improved access to dental care for children
covered by Medicaid and CHIP. Between 2007 and 2011, almost half of all states achieved at least a
10 percentage point increase in the proportion of enrolled children who received a preventive dental
service during the reporting year. 38 Despite considerable progress in pediatric oral health care in
recent years, tooth decay remains the most common chronic disease among children. As such,
children’s oral health continues to be a primary focus of improvement efforts in both Medicaid and
CHIP, through which all enrolled children have dental coverage.
Over the past several years, CMS has worked with federal and state partners, the dental and medical
provider communities, and other stakeholders to continue to improve children’s access to dental care.
Launched in April 2010, CMS’s Oral Health Initiative has two goals: (1) increase the proportion of
Medicaid and CHIP children ages 1 to 20 who receive a preventive dental service by 10
percentage points; and (2) increase the proportion of Medicaid and CHIP children ages 6 to 9
who receive a sealant on a permanent molar by 10 percentage points.
In April 2013, CMS set state-specific baselines and FFY 2015 goals for children’s use of preventive
dental services, based on data reported by states on the FFY 2011 Form CMS-416. 39 CMS invited
Medicaid agencies to develop Oral Health Action Plans as a roadmap to achieving these goals.
CMS offers technical assistance to states to develop and implement their Oral Health Action Plans. It
also hosts a quarterly series of webinars entitled The CMS Learning Lab: Improving Oral Health
Through Access. 40 In September 2013, CMS released a strategy guide highlighting effective
approaches for state Medicaid programs. It also released oral health education materials available for
order at no cost. 41
Important components of these efforts are the data used to set baselines and monitor progress. To
improve the completeness and accuracy of data, CMS initiated a quality improvement process for
FFY 2010 Form CMS-416 data, from which the data originate. Data are checked against a series of
audit criteria intended to identify possible reporting and arithmetic errors. This audit has been made a
permanent part of the data-submission process.
State performance related to children’s access to dental care is evaluated through two measures in the
Child Core Set. 42 The measures are as follows:
1. Preventive Dental Services
2. Dental Treatment Services
To streamline reporting and reduce burden on states, in FFY 2012, CMS began calculating these
measures on behalf of states using data from the CMS-416. The two dental measures were reported
by at least 25 states for the FFY 2012 reporting year and are included in this section.
38
See http://medicaid.gov/Federal-Policy-Guidance/Downloads/CIB-04-18-13.pdf.
Ibid.
40
See CMS Learning Lab, available at http://www.medicaid.gov/Medicaid-CHIP-Program-Information/ByTopics/Benefits/Dental-Care.html.
41
These materials are available at http://www.insurekidsnow.gov/professionals/dental/index.html.
42
The two Child Core Set dental measures parallel reporting on lines 12b and 12c of the Form CMS-416.
39
A.39
This page left blank for double-sided copying.
PREVENTIVE DENTAL SERVICES (PDENT)
Measure Steward: Centers for Medicare & Medicaid Services
Tooth decay, or dental caries, is the most common chronic disease of children. It is a growing problem: among
children ages 2 to 5, the prevalence of early childhood caries increased 15 percent between 1988–1994 and 1999–
2004. Low-income children suffer disproportionately from tooth decay: in 1999–2004, 32 percent of children in
households with incomes above 200 percent of the federal poverty level (FPL) had tooth decay, compared with 54
percent of children in households with incomes below 100 percent of FPL. The disease is almost entirely preventable
through a combination of good oral health habits at home, a healthy diet, and early and regular use of preventive
dental services. This measure assesses the extent to which children are receiving preventive dental services.
this measure since the 2011 Secretary’s
Report.
Measure Description
•
•
This measure shows the percentage of
children ages 1 to 20, eligible for Medicaid
or CHIP Medicaid Expansion programs (that
is, eligible for the EPSDT benefit), enrolled
for at least 90 continuous days, who
received preventive dental services. 43
•
State Performance
The EPSDT benefit provides comprehensive
and preventive health care services,
including dental services, for children under
age 21 who are enrolled in Medicaid. 44
•
The median rate among the 51 states
reporting the measure for the FFY 2012
Core Measures reporting cycle was 44
percent, with a 9-point spread between the
25th and 75th percentiles (Exhibit
PDENT.1).
•
Performance on this measure ranged from
14 percent to 58 percent among states, with
considerable geographic variation across
states (Exhibit PDENT.3, next page).
Overview of State Reporting
•
The number of states reporting the
Preventive Dental Services measure in
CARTS increased from 22 states for FFY
2010 to 37 for FFY 2011. 45 In FFY 2010
and 2011, states reported data on this
measure in two ways: through CARTS and
Form CMS-416 (the annual EPSDT report).
The number of states reporting may vary
depending on the data source used for public
reporting. 46
Exhibit PDENT.1. Percentage of Children Receiving
Preventive Dental Services, FFY 2012 Core Measures
Reporting Cycle (n = 51 states)
60
50
To reduce state reporting burden and have a
single information source, in FFY 2012,
CMS formally began calculating this
measure on behalf of states based on data
submitted as part of the CMS-416. It should
be noted, however, that performance data
from the CMS-416 have been presented for
Percentage
•
40
39.2
44.0
48.5
30
20
10
0
25th
50th 75th
Percentile
Source: Mathematica analysis of FFY 2011 CMS416 reports.
43
This measure is calculated using the administrative method
(claims/encounter data).
44
http://www.medicaid.gov/Medicaid-CHIP-ProgramInformation/By-Topics/Benefits/Early-and-Periodic-ScreeningDiagnostic-and-Treatment.html.
45
For the FFY 2012 Core Measures reporting
cycle, all 51 states submitted data for this
measure on the FFY 2011 CMS-416. 47
The term “states” includes the 50 states and District of Columbia.
46
The 2011 and 2012 Secretary’s Reports reflect the number of
states reporting the dental measures in CARTS, whereas the
performance data for this Report are drawn from the CMS-416 and
represent all 51 states. CMS formally began calculating this
measure on behalf of states using CMS-416 data for the FFY 2012
Core Measures reporting cycle.
47
States are to submit the CMS-416 report to CMS by April 1st of
each year. At the time of this writing, CMS had not received
enough FFY 2012 data from states to make meaningful
comparisons. As such, this Report includes data submitted by
states on the FFY 2011 CMS-416.
A.41
Trends
• Among the 51 states reporting data for this measure on the CMS-416 for two years using the new reporting
definition, 48 the median rate increased by less than 1 percentage point between the FFY 2011 and FFY
2012 reporting cycles (Exhibit PDENT.2).
Exhibit PDENT.2. Trends in the Percentage of Children Receiving Preventive Dental
Services, FFY 2011–2012 Core Measures Reporting Cycles (n = 51 states)
Rate
FFY 2011
FFY 2012
U.S. Total
40.8
41.5
Median
43.2
44.0
25th Percentile
38.2
39.2
75th Percentile
46.8
48.5
Source: Mathematica analysis of FFY 2010 and 2011 CMS-416 reports.
Exhibit PDENT.3. Geographic Variation in the Percentage of Children Receiving Preventive Dental Services, FFY
2012 Core Measures Reporting Cycle (n = 51 states)
WA
MT
ME
ND
OR
MN
ID
WI
SD
WY
NV
CA
UT
AZ
CO
MI
IA
NE
PA
IL
OK
NM
HI
OH
WV
VA
KY
DC
MD
NC
TN
SC
AR
MS
TX
IN
MO
KS
VT
NH
MA
RI
CT
NJ
DE
NY
AL
GA
LA
AK
FL
13% to 39%
40% to 44%
45% to 48%
State Median: 44%
49% to 58%
Source: Mathematica analysis of FFY 2011 CMS-416 reports.
To view state-specific data for this measure, please see Table PDENT at http://www.medicaid.gov/Medicaid-CHIPProgram-Information/By-Topics/Quality-of-Care/Downloads/Performance-on-the-Child-Core-Set-Measures-FFY2012.zip.
48
Starting with the FFY 2010 CMS-416, the population of children for whom the receipt of dental services was to be reported shifted from all
children, regardless of length of enrollment, to children covered by Medicaid for at least 90 continuous days.
A.42
DENTAL TREATMENT SERVICES (TDENT)
Measure Steward: Centers for Medicare & Medicaid Services
Tooth decay, or dental caries, is the most common chronic disease of children. If left untreated, tooth decay can
negatively affect a child’s physical and social development and school performance. The prevalence of untreated
tooth decay among children ages 2 to 5 increased 7 percent between 1988–1994 and 1999–2004. Among children
ages 2 to 11, untreated tooth decay disproportionately affects low-income children: in 1999–2004, 33 percent of
children in households with incomes below 100 percent of the federal poverty level (FPL) had untreated tooth
decay, compared with 28 percent of children between 100 and 200 percent of FPL and 15 percent of those above
200 percent of FPL. This measure assesses the extent to which children are receiving dental treatment services.
submitted as part of the CMS-416. It should
be noted, however, that performance data
from the CMS-416 have been presented for
this measure since the 2011 Secretary’s
Report.
Measure Description
•
•
This measure shows the percentage of
children ages 1 to 20 eligible for Medicaid
or CHIP Medicaid Expansion programs (that
is, individuals eligible for the EPSDT
benefit), enrolled for at least 90 continuous
days, who received dental treatment
services. 49
•
The EPSDT benefit provides comprehensive
and preventive health care services,
including dental services, for children under
age 21 who are enrolled in Medicaid. 50
State Performance
•
The median rate among the 51 states
reporting the measure for the FFY 2012 Core
Measures reporting cycle was 24 percent,
with a 6-point spread between the 25th and
75th percentiles (Exhibit TDENT.1).
•
Performance on this measure ranged from 8
percent to 51 percent among states, with
considerable geographic variation across
states (Exhibit TDENT.3, next page).
Overview of State Reporting
•
The number of states reporting the Dental
Treatment Services measure in CARTS
increased from 19 states for FFY 2010 to 35
for FFY 2011. 51 In FFY 2010 and 2011,
states reported data on this measure in two
ways: through CARTS and Form CMS-416
(the annual EPSDT report). The number of
states reporting may vary depending on the
data source used for public reporting. 52
Exhibit TDENT.1. Percentage of Children Receiving
Dental Treatment Services, FFY 2012 Core Measures
Reporting Cycle (n = 51 states)
50
To reduce state reporting burden and have a
single information source, in FFY 2012,
CMS formally began calculating this
measure on behalf of states based on data
Percentage
•
49
This measure is calculated using the administrative method
(claims/encounter data).
40
30
20
http://www.medicaid.gov/Medicaid-CHIP-ProgramInformation/By-Topics/Benefits/Early-and-Periodic-ScreeningDiagnostic-and-Treatment.html.
19.6
23.8
25.9
10
0
50
51
For the FFY 2012 Core Measures reporting
cycle, all 51 states submitted data for this
measure on the FFY 2011 CMS-416. 53
25th
50th 75th
Percentile
Source: Mathematica analysis of FFY 2011 CMS-416
reports.
The term “states” includes the 50 states and District of Columbia.
52
The 2011 and 2012 Secretary’s Reports reflect the number of
states reporting the dental measures in CARTS, whereas the
performance data for this Report are drawn from the CMS-416 and
represent all 51 states. CMS formally began calculating this
measure on behalf of states using CMS-416 data for the FFY 2012
Core Measures reporting cycle.
53
States are to submit the CMS-416 report to CMS by April 1st of
each year. At the time of this writing, CMS had not received
enough FFY 2012 data from states to make meaningful
comparisons. As such, this Report includes data submitted by
states on the FFY 2011 CMS-416.
A.43
Trends
• Among the 51 states reporting data for this measure on the CMS-416 for two years using the new reporting
definition, 54 the median rate increased by less than 1 percentage point between the FFY 2011 and FFY
2012 reporting cycles (Exhibit TDENT.2).
Exhibit TDENT.2. Trends in the Percentage of Children Receiving Dental Treatment
Services, FFY 2011–2012 Core Measures Reporting Cycles (n = 51 states)
Rate
FFY 2011
FFY 2012
U.S. Total
23.0
23.1
Median
23.5
23.8
25th Percentile
20.2
19.6
75th Percentile
25.8
25.9
Source: Mathematica analysis of FFY 2010 and 2011 CMS-416 reports.
Exhibit TDENT.3. Geographic Variation in the Percentage of Children Receiving Dental Treatment Services, FFY
2012 Core Measures Reporting Cycle (n = 51 states)
WA
MT
ME
ND
OR
MN
ID
WI
SD
WY
NV
CA
UT
AZ
CO
MI
IA
NE
PA
IL
OK
NM
HI
OH
WV
VA
KY
DC
MD
NC
TN
SC
AR
MS
TX
IN
MO
KS
VT
NH
MA
RI
CT
NJ
DE
NY
AL
GA
LA
AK
FL
8% to 19%
20% to 23%
24% to 26%
State Median: 24%
27% to 51%
Source: Mathematica analysis of FFY 2011 CMS-416 reports.
To view state-specific data for this measure, please see Table TDENT at http://www.medicaid.gov/Medicaid-CHIPProgram-Information/By-Topics/Quality-of-Care/Downloads/Performance-on-the-Child-Core-Set-Measures-FFY2012.zip.
54
Starting with the FFY 2010 CMS-416, the population of children for whom the receipt of dental services was to be reported shifted from all
children, regardless of length of enrollment, to children covered by Medicaid for at least 90 continuous days.
A.44


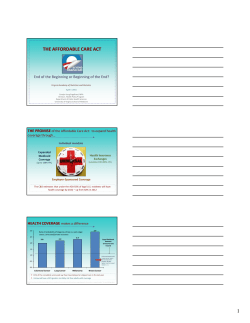
© Copyright 2026