
The Department of Health and Human Services
The Department of Health and Human Services
2012 Annual Report on the
Quality of Care for Children in Medicaid and CHIP
Health and Human Services Secretary
Kathleen Sebelius
December 2012
This page has been left blank for double-sided copying.
CONTENTS
EXECUTIVE SUMMARY .......................................................................................................... XI
I.
INTRODUCTION ..........................................................................................................1
II.
STATE AND FEDERAL EFFORTS FOR QUALITY MEASUREMENT,
REPORTING, AND IMPROVEMENT .........................................................................3
A. Measuring and Reporting on Quality of Care ..........................................................3
1.
2.
The CMS Federal-State Data Systems for Quality Reporting ..........................4
Tracking Results ...............................................................................................5
B. Improving Quality of Care .......................................................................................6
C. Private Sector Efforts Supporting State Medicaid Quality
Measurement and Improvement ..............................................................................7
III.
STATE-SPECIFIC FINDINGS ON QUALITY AND ACCESS IN
MEDICAID AND CHIP .................................................................................................9
A. Quality Measurement Using the Initial Core Set of Children’s Health
Care Quality Measures .............................................................................................9
1.
2.
3.
4.
5.
6.
Overview of State Reporting of the Initial Core Set Quality
Measures in FFY 2011....................................................................................10
Changes in State Reporting of the Initial Core Set Quality
Measures from FFY 2010 to FFY 2011 .........................................................11
Analysis of Eight Frequently Reported Initial Core Set Quality
Measures in FFY 2011....................................................................................12
Changes in Primary Care Access and Well-Child Visit Rates
Between FFY 2010 and 2011 .........................................................................14
Quality of Care in Medicaid/CHIP Programs and Commercial
Health Plans ....................................................................................................15
Sources of Variation in Children’s Health Care Quality Measures ................15
B. External Quality Reviews of Managed Care Organizations ..................................17
1.
2.
3.
4.
5.
6.
External Quality Reviews ...............................................................................17
External Quality Review Reports Submitted to CMS for the 20112012 Reporting Cycle .....................................................................................18
Reporting of Performance Measures in 2011-2012 EQRO
Technical Reports ...........................................................................................18
Performance Improvement Projects (PIPs) in 2011-2012 EQRO
Technical Reports ...........................................................................................20
Summary of EQRO Reporting for Selected PIP Topics .................................21
Benchmark Benefit Plans ...............................................................................22
iii
C. Consumer Experiences with Health Care ..............................................................23
D. Use of Dental Services in Medicaid and CHIP ......................................................25
E. State Spotlight: Arkansas .......................................................................................27
IV.
STRENGTHENING QUALITY OF CARE THROUGH
DEMONSTRATION GRANTS AND PARTNERSHIPS............................................29
A. CHIPRA Quality Demonstration ...........................................................................29
1.
2.
3.
Overview of Demonstration Grant Activities .................................................29
National Evaluation of the CHIPRA Quality Demonstrations .......................32
Model Children’s Electronic Health Record Format ......................................32
B. AHRQ-CMS Pediatric Quality Measures Program ...............................................33
C. Coordination with HHS Quality Partners ..............................................................34
V.
SUMMARY AND CONCLUSION..............................................................................35
iv
EXECUTIVE SUMMARY EXHIBITS
1
Number of Initial Core Set of Medicaid/CHIP Children’s Health Care
Quality Measures Reported in FFY 2011 CARTS Reports, by State ......................... xvi
2
Number of States Reporting the Initial Core Set of Medicaid/CHIP
Children’s Health Care Quality Measures in FFY 2011 CARTS Reports................. xvii
3
Performance Measures Evaluating Children or Pregnant Women Included
in External Quality Review Organization (EQRO) Technical Reports for
the 2011-2012 Reporting Cycle for 37 States, by General Topic ............................. xviii
4
Performance Rates on Frequently Reported Medicaid/CHIP Children’s
Health Care Quality Measures in FFY 2011 CARTS Reports ................................... xix
5
Percentage and Number of Eligible Children Age 1-20, Enrolled for at
Least 90 Continuous Days, Who Received Preventive Dental Services and
Dental Treatment Services in FFY 2010 .......................................................................xx
6
Comparison of Median Rates for State Medicaid/CHIP Programs and
Commercial Health Plans for Frequently Reported Children’s Health Care
Quality Measures, FFY 2011 ..................................................................................... xxii
7
Parents’ Assessment of the Ease of Getting Care for Their Child, 25 States,
2010 ........................................................................................................................... xxiii
8
Parents’ Assessment of How Well Their Child’s Doctor Communicates, 25
States, 2010 ............................................................................................................... xxiii
9
Performance Improvement Projects (PIPs) Targeting Children or Pregnant
Women Included in External Quality Review Organization (EQRO)
Technical Reports, 2011-2012 Reporting Cycle ....................................................... xxiv
v
This page has been left blank for double-sided copying.
TABLES
Table 1.
Number and Percent of Children Enrolled in Medicaid or CHIP by State and Service
Delivery Type, FFY 2011
Table 2.
Initial Core Set of Children’s Health Care Quality Measures for Medicaid and CHIP
Table 3.
Frequency of State Reporting of the Initial Core Set of Medicaid/CHIP Children’s
Health Care Quality Measures and Reasons for Not Reporting, FFY 2011
Table 4.
Number of States Reporting Deviations from the Measure Specifications in Their
Calculation of the Initial Core Set of Medicaid/CHIP Children’s Health Care Quality
Measures, FFY 2011
Table 5.
Change in the Number of States Reporting the Initial Core Set of Medicaid/CHIP
Children’s Health Care Quality Measures, FFY 2010–2011
Table 6.
Changes in State Reporting of the Initial Core Set of Medicaid/CHIP Children’s
Health Care Quality Measures, FFY 2010–2011
Table 7.
Performance Rates on Frequently Reported Medicaid/CHIP Children’s Health Care
Quality Measures in FFY 2011 CARTS Reports
Table 8.
Changes in Performance Rates on Frequently Reported Medicaid/CHIP Children’s
Health Care Quality Measures as Reported by States in Their FFY 2010 and FFY
2011 CARTS Reports
Table 9.
Percentage of Children Receiving Well-Child Visits in the 3rd, 4th, 5th, and 6th
Years of Life as Reported by States in Their FFY 2010 and FFY 2011 CARTS
Reports
Table 10.
Comparison of Median Rates for State Medicaid/CHIP Programs and Commercial
Health Plans for Frequently Reported Children’s Health Care Quality Measures,
FFY 2011
Table 11.
Managed Care Plans Covering Children or Pregnant Women Included in External
Quality Review Organization (EQRO) Technical Reports, 2011-2012 Reporting
Cycle
Table 12.
Types of Performance Measures Evaluating Children or Pregnant Women Included
in External Quality Review Organization (EQRO) Technical Reports, 2011-2012
Reporting Cycle
Table 13.
Reporting of Performance Rates for Measures Included in External Quality Review
Organization (EQRO) Technical Reports, 2011-2012 Reporting Cycle
Table 14.
Performance Improvement Projects (PIPs) Targeting Children or Pregnant Women
Included in External Quality Review Organization (EQRO) Technical Reports,
2011-2012 Reporting Cycle
vii
Table 15.
Overview of State-Level Reporting on Selected Child Medicaid CAHPS Measures,
25 States, 2010
Table 16.
Percentage and Number of Eligible Children Age 1-20, Enrolled for at Least 90
Continuous Days, Who Received Preventive Dental Services and Dental Treatment
Services in FFY 2010
Table 17.
Summary of CHIPRA Quality Demonstrations
Table 18.
Examples of Measurement Topics being Addressed by the Centers of Excellence
(COE)
viii
FIGURES
Figure 1.
Number of States Reporting the Initial Core Set of Medicaid/CHIP Children’s
Health Care Quality Measures in FFY 2011 CARTS Reports
Figure 2.
Number of Initial Core Set of Medicaid/CHIP Children’s Health Care Quality
Measures Reported in FFY 2011 CARTS Reports, by State
Figure 3.
Changes in the Number of States Reporting the Initial Core Set of Medicaid/CHIP
Children’s Health Care Quality Measures, FFY 2010 and FFY 2011
Figure 4.
Changes in Medians of Frequently Reported Medicaid/CHIP Children’s Health Care
Quality Measures, FFY 2010 to FFY 2011
Figure 5.
Populations Included in Frequently Reported Medicaid/CHIP Children’s Health Care
Quality Measures, FFY 2011
Figure 6.
Data Sources Used for Frequently Reported Medicaid/CHIP Children’s Health Care
Quality Measures, FFY 2011
Figure 7.
Performance Measures Evaluating Children or Pregnant Women Included in
External Quality Review Organization (EQRO) Technical Reports for the 2011-2012
Reporting Cycle for 37 States, by General Topic
Figure 8.
Comparison of Performance Measures Evaluating Children That Were Reported in
External Quality Review Organization (EQRO) Technical Reports for 29 States, for
the 2010 and 2011-2012 Reporting Cycles
Figure 9.
Performance Improvement Projects (PIPs) Targeting Children or Pregnant Women
That Were Included in External Quality Review Organization (EQRO) Technical
Reports for the 2011-2012 Reporting Cycle for 37 States, by General Topic
Figure 10. Comparison of Performance Improvement Projects (PIPs) Targeting Children That
Were Reported in External Quality Review Organization (EQRO) Technical Reports
for the 2010 and 2011-2012 Reporting Cycles for 30 States, Selected Topics
Figure 11. Parents’ Overall Rating of Their Child’s Health Care, by State, 2010
Figure 12. Parents’ Assessment of the Ease of Getting Care for Their Child, 25 States, 2010
Figure 13. Parents’ Assessment of How Well Their Child’s Doctor Communicates, 25 States,
2010
Figure 14. Geographic Variation in the Percentage of Children Receiving Preventive Dental
Services, FFY 2010
Figure 15. Geographic Variation in the Percentage of Children Receiving Dental Treatment
Services, FFY 2010
ix
This page has been left blank for double-sided copying.
EXECUTIVE SUMMARY
Together, Medicaid and the Children’s Health Insurance Program (CHIP) served more than 43.5
million children in federal fiscal year (FFY) 2011, representing about half of the beneficiaries
currently enrolled in these programs. The number of children enrolled in Medicaid and CHIP
grew by more than 1.5 million between FFY 2010 and FFY 2011. This increase in enrollment is
evidence of the role Medicaid and CHIP play in ensuring that low-income children get the health
care coverage they need, including access to a comprehensive set of benefits and other medically
necessary services. This report, required by section 1139A(c)(2) of the Social Security Act (the
Act), as amended by section 401(c) of the Children’s Health Insurance Program Reauthorization
Act of 2009 (CHIPRA), summarizes state-specific and national information on the quality of
health care furnished to children under Titles XIX (Medicaid) and XXI (CHIP) of the Act.
Under the Affordable Care Act of 2010, millions of uninsured Americans will gain access to
coverage through Medicaid, CHIP, and the Affordable Insurance Exchanges. The Department of
Health and Human Services (HHS) is working closely with states, health care providers, and
program enrollees to ensure a high-quality system of care for children in Medicaid/CHIP, as well
as for those with private insurance and other sources of coverage. As the HHS agency
responsible for ensuring effective health care coverage for Medicare, Medicaid, and CHIP
beneficiaries, the Centers for Medicare & Medicaid Services (CMS) plays a key role in
promoting quality health care for children in Medicaid/CHIP. CMS’ quality agenda is closely
aligned with that of the HHS National Quality Strategy’s three aims of achieving better care, a
healthier population and community, and more affordable care. 1
Since the release of the Secretary’s annual Report on the Quality of Care for Children in
Medicaid and CHIP in 2011, CMS has continued to work collaboratively with states and other
stakeholders to strengthen systems for measuring and collecting data on access and quality,
including developing capacity through ten CHIPRA quality demonstration grantees in 18 multistate collaborations, and working with the CMS Technical Advisory Groups (workgroups that
focus on policy areas such as quality, oral health, mental health, managed care, and coverage).
The 2012 Secretary’s Report presents information on key activities CMS undertook to update
information on the quality of care children receive in Medicaid/CHIP, including reviewing
findings on the initial set of core children’s health care quality measures reported to CMS by the
states and summarizing information on the quality measures and performance improvement
projects reported in the External Quality Review Organization (EQRO) technical reports
provided to CMS by states. This report offers the first nationwide review of improvement
projects initiated by state managed care plans, 2 and supported by the 75 percent Federal
matching rate available to states contracting with EQROs. Key findings from these information
sources include:
1
http://www.ahrq.gov/workingforquality/nqs/nqs2012annlrpt.pdf.
2
Either managed care organizations (MCOs) or Prepaid Inpatient Health Plans (PIHPs).
xi
Measurement and Reporting
•
Forty-eight states and the District of Columbia (D.C.) voluntarily reported one or
more of the initial core set of children’s health care quality measures for FFY 2011
for Medicaid and/or CHIP children (Exhibit 1). The median number of measures
reported by states for FFY 2011 was 12, up from 7 for FFY 2010. Altogether, 27
states and D.C. reported at least half (12 of 24) of the children’s quality measures.
One state, Oregon, reported data on all 24 measures for FFY 2011.
•
Completeness of reporting on the children’s core measures improved for FFY 2011.
The number of states reporting at least one measure for both Medicaid and CHIP
enrollees increased from 23 states and D.C. for FFY 2010 to 33 states and D.C. for
FFY 2011.
•
The most frequently-reported measures assess children’s use of preventive services,
primary care, and dental services (Exhibit 2).
•
Of the 41 states (including D.C. and Puerto Rico) that contract with managed care
plans to deliver services to Medicaid and CHIP enrollees, 37 submitted EQRO
technical reports to CMS for the 2011-2012 reporting cycle. The most frequentlyreported children’s performance measures in the EQRO reports are similar to those in
the initial core set of children’s health care quality measures 3 (Exhibit 3).
Quality and Access to Care
•
In FFY 2011, as in FFY 2010, states had high performance rates on the children’s
primary care access measure: a visit to a primary care practitioner (PCP). Most
children, across all states, had at least one primary care visit during the reporting
period, with the median rate ranging from a high of 97 percent among children ages
12-24 months to 88-90 percent for the other age groups (Exhibit 4).
•
The proportion of children with a well-child visit varied by age group, but generally
was below the recommended guidelines. 4 A median of 61 percent of children had 6
or more well-child visits in the first 15 months of life. The rate was slightly higher
for children ages 3-6, with a median of 67 percent having a well-child visit during the
reporting period. Adolescents (ages 12-21 years) had a considerably lower median
well-child visit rate (46 percent) than the other age groups (Exhibit 4).
•
An indication of the effectiveness of a well-child visit can be reflected by four of the
children’s core measures reported by at least 25 states. The median childhood
immunization rate for children turning age 2 was 71 percent, while the median
adolescent immunization rate among 13 year olds was 52 percent. The Chlamydia
screening rate among sexually active girls between the ages of 16 and 20 was 47
3
The most frequently-reported children’s performance measures were focused on immunization rates, well-child
visits, adolescent well-care, and prenatal and perinatal care.
4
The American Academy of Pediatrics and Bright Futures recommend 9 well-child visits in the first 15 months of
life and annual well-child visits for children ages 3 and older.
xii
percent and the rate for appropriate testing for children with pharyngitis was 63
percent (Exhibit 4).
•
Children’s access to dental services in FFY 2010 was similar to patterns observed in
FFY 2009. 5 A median of 43 percent of children ages 1 to 20 received at least one
preventive dental service (e.g., dental cleanings, application of dental sealants) paid
for by Medicaid. The percentage of children receiving at least one preventive dental
service ranged across states from a low of 7 percent to a high of 58 percent (Exhibit
5).
•
Although children covered by Medicaid/CHIP and by commercial plans differ
demographically and socio-economically, their access to care and quality of care was
fairly comparable on five of eight measures tracked by the National Committee for
Quality Assurance (NCQA) for private plans and also reported by at least 25 states: a
PCP visit in the past year; well-child visit rates for adolescents 12-21 years;
childhood immunization status, adolescent immunization status; and Chlamydia
screening rate (Exhibit 6).
Consumer Experiences with Health Care
•
Data from the Child Medicaid Consumer Assessment of Healthcare Providers and
Systems (CAHPS®) Health Plan Survey from 25 states in 2010 provide information
on consumer experiences with care, a dimension of quality of care. This survey
indicates that:
•
Parents generally could get care for their child when needed for an illness or
injury (state median of 76 percent responding “always”), but it was more difficult
to get routine care (state median of 65 percent responding “always”) or specialty
care (state median of 47 percent responding “always”) (Exhibit 7).
•
Most parents had a favorable assessment of their child’s doctor’s communication
with the parent, but somewhat less favorable assessment of the doctor’s
interactions with the child (Exhibit 8).
Improving the Quality of Care
•
CMS is engaged in a number of efforts to improve the quality of care available to
children in Medicaid and CHIP. Two major efforts underway – one on perinatal
health and the other on oral health – are national in scope and use the core health care
quality measures to guide improvement efforts and evaluate outcomes.
5
States are to submit the annual CMS-416 (EPSDT) report to CMS by April 1st of each year. At the time of this
writing, CMS had not received enough data from states for FFY 2011 to make meaningful comparisons. As such,
this Report includes data for FFY 2010.
xiii
•
In 2012, CMS launched two initiatives to improve perinatal health outcomes:
Strong Start for Mothers and Newborns (Strong Start) 6 and an Expert Panel for
Improving Maternal and Infant Health Outcomes (Expert Panel). 7
•
CMS’ Oral Health Initiative seeks to improve children’s access to dental care,
with an emphasis on early prevention. The initiative has two improvement
goals, 8 and CMS is working with state partners and other stakeholder groups to
achieve them.
•
States, through their managed care plans, also are engaged in various performance
improvement projects (PIPs) specific to children or pregnant women. The 268 PIPs,
described in the EQRO technical reports, vary by state in number and focus and
sometimes target only a subset of Medicaid/CHIP enrollees. For example, Florida
had 14 PIPs focused on improving the quality of mental health care of
institutionalized children, while Michigan and New York required all MCOs to
implement PIPs to improve weight assessment and body mass index (BMI)
counseling (Exhibit 9).
•
Information on PIPs abstracted from the EQRO technical reports in four CMS priority
areas – weight assessment and BMI counseling, dental care, prenatal care, and
adolescent well-care – reveal the strengths and weaknesses of current approaches
states and CMS use to improve care in MCOs. For example, while many of the PIPs
commonly engaged in interventions that included member and provider outreach and
education, the EQROs varied in the criteria they used to validate PIPs as well as the
level of detail they included in technical reports about PIP progress and performance.
6
Strong Start, under the leadership of the CMS Center for Medicare and Medicaid Innovation, has two primary
strategies to improve maternal and infant health outcomes. First, a public-private partnership is testing ways to
encourage best practices for reducing early elective deliveries prior to 39 weeks (across all payer types) that lack
medical indication. Second, through a funding opportunity made available to states and providers, it is testing
whether three models of enhanced prenatal care can reduce the rate of preterm births among women covered by
Medicaid and/or CHIP at high risk for poor pregnancy outcomes.
7
The Expert Panel, initiated by the CMS Center for Medicaid and CHIP Services, is identifying specific
opportunities and strategies to provide better care, while reducing the cost of care for mothers and infants covered by
Medicaid/CHIP. Co-chaired by the Ohio Medicaid Medical Director and the immediate past president of the
American Congress of Obstetricians and Gynecologists (ACOG), the Expert Panel consists of Medicaid medical
directors, clinical experts, representatives of health plans, and advocacy stakeholder groups.
8
The two oral health goals are to: (1) increase the proportion of Medicaid and CHIP children ages 1 to 20 who
receive a preventive dental service by 10 percentage points; and (2) increase the proportion of Medicaid and CHIP
children ages 6 to 9 who receive a sealant on a permanent molar by 10 percentage points.
xiv
The objective of this report is to show the progress HHS and states have made to systematically
measure and report on the quality of care children receive in Medicaid/CHIP. While the ultimate
goal is to improve children’s health by driving improvements in the quality of care, measuring
the care children receive is a critically important step in that process. Through mechanisms such
as the Center for Medicaid and CHIP Services Quality Measures Technical Assistance and
Analytic Support (TA/AS) Program 9 and the Annual CMS Medicaid/CHIP Quality
Conference, 10 HHS and the states have built a solid foundation for measuring and improving
children’s quality of health care.
Evidence in this report suggests that access to care and quality of care were fairly comparable for
children with public and private coverage for five of the eight measures tracked by NCQA and
routinely reported by at least 25 states. Yet, this comparison is a cursory assessment of care
given considerable evidence that low-income children have greater health care needs than
children covered by commercial health plans. Nonetheless, the measurement and reporting tools
now in place can guide HHS and states in the next phase of efforts to more thoroughly measure
the care obtained by children covered by Medicaid/CHIP and use the measures to assess and
improve the quality of care provided to children in their states.
Moving forward, HHS seeks to build a stronger and more effective partnership between CMS,
states, health care providers, and program enrollees on quality measurement as well as quality
improvement. The two major quality-improvement efforts recently launched by CMS are
helping to set the stage for the next generation of efforts designed to improve health care and
health outcomes of children, and to help transform Medicaid/CHIP into a high quality system of
coverage and care.
9
The TA/AS contract is led by Mathematica Policy Research and supported by subcontracts with the National
Committee for Quality Assurance (NCQA), the Center for Health Care Strategies (CHCS), and the National
Initiative for Children’s Healthcare Quality (NICHQ). The TA/AS program supports state reporting of the initial
core set measures by responding to individual state requests for TA with the initial core set measures, helping to
plan and implement CMS’s annual Medicaid/CHIP Quality Conferences, holding technical assistance webinars, and
creating TA briefs and tool kits to provide states with information on specific topics.
10
http://www.medicaid.gov/State-Resource-Center/Events-and-Announcements/Annual-Medicaid-CHIP-QualityConference.html
xv
Exhibit 1. Number of Initial Core Set of Medicaid/CHIP Children’s Health Care Quality Measures Reported in FFY
2011 CARTS Reports, by State
Oregon
Tennessee
Florida
Georgia
Iowa
South Carolina
Alabama
Illinois
Rhode Island
Michigan
West Virginia
New Mexico
Connecticut
Indiana
Kentucky
Maine
Wyoming
Alaska
Arkansas
District of Columbia
North Carolina
Pennsylvania
Colorado
Hawaii
Maryland
Missouri
New York
Texas
24
23
20
19
18
18
17
17
17
16
16
15
14
14
14
14
14
13
13
13
13
13
Median (50 States and DC)
California
Massachusetts
New Hampshire
Ohio
Virginia
Mississippi
North Dakota
Utah
Washington
Arizona
Nevada
Vermont
Idaho
Lousiania
New Jersey
Kansas
Montana
Nebraska
Oklahoma
Minnesota
South Dakota
1
Delaware
0
Wisconsin
0
0
12
12
12
12
12
12
12
11
11
11
11
11
8
8
8
8
7
7
7
6
6
6
5
5
5
4
3
5
10
15
Number of Measures
20
24
Source:
Mathematica analysis of FFY 2011 CARTS reports as of June 20, 2012.
Notes:
Wisconsin did not submit a CARTS report for FFY 2011. Delaware submitted an FFY 2011 CARTS report,
but did not submit data on any of the initial core set of children’s health care quality measures. For the eight
states that submitted separate data for their Medicaid and CHIP programs (Colorado, Iowa, Kentucky,
Michigan, New York, Pennsylvania, Tennessee, and West Virginia), the state was counted as reporting a
measure if either report included data for that measure. The Medicaid/CHIP initial core set includes 24
measures.
xvi
Exhibit 2. Number of States Reporting the Initial Core Set of Medicaid/CHIP Children’s Health Care Quality
Measures in FFY 2011 CARTS Reports
Well-Child Visits in the 3rd, 4th,
5th, and 6th Years of Life (#11)
48
Well-Child Visits in the First 15 Months of Life (#10)
46
Child and Adolescent Access to
Primary Care Practitioners (#14)
44
Adolescent Well-Care Visits (#12)
43
Percentage of Eligibles That Received
Preventive Dental Services (#13)
37
Percentage of Eligibles That Received
Dental Treatment Services (#17)
35
Chlamydia Screening (#9)
32
Childhood Immunization Status (#5)
30
Appropriate Testing for Children with Pharyngitis (#15)
28
Ambulatory Care: Emergency Department Visits (#18)
27
Adolescent Immunizations Status (#6)
25
Timeliness of Prenatal Care (#1)
24
Follow-Up Care for Children Prescribed Attention-Deficit
Hyperactivity Disorder (ADHD) Medication (#21)
24
Follow-Up After Hospitalization for Mental Illness (#23)
24
Consumer Assessment of Healthcare Providers And
Systems (CAHPS®) Health Plan Survey (#24)
22
Frequency of Ongoing Prenatal Care (#2)
18
Body Mass Index Assessment for
Children and Adolescents (#7)
18
Annual Percentage of Asthma Patients with 1 or More
Asthma-Related Emergency Room Visits (#20)
14
Percentage of Live Births Weighing
Less than 2,500 Grams (#3)
11
10
Annual Pediatric Hemoglobin A1C Testing (#22)
Developmental Screening in the First
Three Years of Life (#8)
7
5
Cesarean Rate for Nulliparous Singleton Vertex (#4)
Otitis Media with Effusion–Avoidance of Inappropriate
Use of Systemic Antimicrobials in Children (#16)
Pediatric Central-Line Associated Blood
Stream Infections–NICU and PICU (#19)
3
1
0
5
10
15
20
25
30
35
40
45
50
Number of States
Source:
Mathematica analysis of FFY 2011 CARTS reports as of June 20, 2012.
Notes:
Numbers in parentheses identify the measure number in the children’s initial core set. Wisconsin did
not submit a CARTS report for FFY 2011. Delaware submitted an FFY 2011 CARTS report, but did
not submit data on any of the initial core set of children’s health care quality measures. For the eight
states that submitted separate data for their Medicaid and CHIP programs (Colorado, Iowa, Kentucky,
Michigan, New York, Pennsylvania, Tennessee, and West Virginia), the state was counted as reporting
a measure if either report included data for that measure.
xvii
Exhibit 3. Performance Measures Evaluating Children or Pregnant Women Included in External Quality Review
Organization
(EQRO)
Technical
Reports
for
the
2011-2012
Reporting
Cycle
for
37 States, by General Topic
30
27
26
25
25
25
Number of States
22
22
20
20
18
15
15
14
13
11
10
10
9
8
5
5
0
Immuni- Wellzations Child
Care
Adole- Prenatal/ Primary Asthma STIs
scent Perinatal Care
Access
Well
Care
Mental
Lead
Dental Weight
Health Screening Care Assessment
URI
ADHD Pharyn- Behav- Other
ioral
gitis
Health
Source:
EQRO technical reports submitted to CMS for the 2011-2012 reporting cycle as of July 31, 2012.
Notes:
Alabama, Alaska, Arkansas, Connecticut, Idaho, Maine, Montana, New Hampshire, Oklahoma, South
Dakota, and Wyoming do not have MCOs or PIHPs that enroll children covered by Medicaid or CHIP.
Louisiana, Mississippi, and North Dakota have newly applicable managed care requirements and were
not required to submit EQRO technical reports for 2011. North Carolina submitted an EQRO technical
report, but managed care in the state was limited to behavioral health programs that did not enroll
children, so the state is excluded from the analysis.
Analysis excludes plans that provide only limited services, such as primary care case management.
Analysis also excludes plans that do not serve children or pregnant women, such as long-term care
plans or Medicare Advantage plans that cover dual eligibles.
ADHD = Attention Deficit Hyperactivity Disorder; Pharyngitis = Appropriate Testing for Children with Pharyngitis;
STI = Sexually Transmitted Infection; URI = Upper Respiratory Infection.
xviii
Exhibit 4. Performance Rates on Frequently Reported Medicaid/CHIP Children’s Health Care Quality Measures in FFY 2011 CARTS Reports
Age Group
Number of States Reporting
Using HEDIS Specifications
Mean
Median
25th Percentile
75th Percentile
12-24 Months
25 Months - 6 Years
7-11 Years
12-19 Years
43
43
43
43
95.9
87.8
88.5
87.3
96.7
88.1
90.0
89.0
95.6
85.1
86.7
85.3
98.2
91.6
93.0
91.7
First 15 Months
45a
57.9
60.8
54.8
69.3
3-6 Years
47
65.0
66.9
59.6
74.9
12-21 Years
43
45.2
45.7
35.4
56.4
Childhood Immunization
Status
Percent Up to Date on
Immunizations (Combo 3)b
2 Years
28
65.0
70.7
62.1
76.6
Immunizations for
Adolescents
Percent Up to Date on
Immunizations (Combo 1)c
13 Years
22
48.4
51.9
32.8
59.5
Chlamydia Screening
Percent Screened
16-20 Years
32
46.0
47.1
36.8
57.0
Appropriate Testing for
Children with Pharyngitis
Percent Tested
2-18 Years
28
62.2
63.1
52.2
75.2
Measure
Access to Primary Care
Percent with a PCP Visit
Well-Child Visits
Percent with 6 or More
Visits
Percent with 1 or More
Visits
Percent with 1 or More
Visits
xix
Source:
Mathematica analysis of FFY 2011 CARTS Reports as of June 20, 2012.
Note:
Exhibit 4 includes states that used HEDIS specifications to report these measures. Exhibit excludes states that used other specifications and states that
did not report these measures in FFY 2011 CARTS Reports. In the cases where a state reported rates for both their Medicaid and CHIP populations,
the highest rate of the two populations was used. See Appendix Tables E.2 – E.9 for details.
a
South Dakota did not report the percent of children in the first 15 months of life with 6 or more well-child visits but reported rates for other numbers of well-child
visits.
b
Combination 3 includes DTaP, IPV, MMR, HiB, HepB, VZV, and PCV.
c
Combination 1 includes Meningococcal and Tdap.
PCP = Primary Care Practitioner.
Exhibit 5. Percentage and Number of Eligible Children Age 1-20, Enrolled for at Least 90 Continuous Days, Who
Received Preventive Dental Services and Dental Treatment Services in FFY 2010
Total Number of
Children Receiving
Dental Service:
Preventive
Percent of Children
Receiving Dental
Service: Preventive
Total Number of
Children Receiving
Dental Service:
Treatment
244,112
33,016
333,511
166,106
1,451,686
50
41
46
46
37
105,432
21,780
189,986
91,528
870,922
21
27
26
25
22
Colorado
Connecticut
Delaware
D.C.
Florida
167,886
155,039
36,357
32,435
266,213
47
54
41
39
15
95,085
77,445
18,763
18,060
146,327
27
27
21
22
8
Georgia
Hawaii
Idaho
Illinois
Indiana
471,278
53,413
10,887
703,305
201,713
46
41
7
47
29
231,232
32,479
7,279
282,818
102,865
22
25
5
19
15
Iowa
Kansas
Kentucky
Louisiana
Maine
103,098
36,774
205,633
318,133
49,654
40
18
43
43
38
49,098
15,169
118,592
183,682
23,758
19
7
25
25
18
Maryland
Massachusetts
Michigan
Minnesota
Mississippi
252,729
256,381
395,241
162,552
160,053
48
50
35
40
43
132,667
152,793
173,502
81,715
83,026
25
30
15
20
22
Missouri
Montana
Nebraska
Nevada
New Hampshire
183,283
23,779
66,420
69,767
48,020
30
35
46
36
56
99,882
14,829
31,780
45,064
22,390
17
22
22
24
26
New Jersey
New Mexico
New York
North Carolina
North Dakota
244,920
153,855
712,872
430,929
12,780
40
45
37
44
30
149,067
165,572
368,940
231,775
6,607
24
49
19
24
16
Ohio
Oklahoma
Oregon
Pennsylvania
Rhode Island
484,502
236,163
105,438
400,804
39,542
44
47
36
37
41
225,042
142,334
58,916
220,480
18,613
20
28
20
20
19
South Carolina
South Dakota
277,137
30,099
53
39
135,827
12,026
26
16
State
Alabama
Alaska
Arizona
Arkansas
California
xx
Percent of Children
Receiving Dental
Service: Treatment
Exhibit 5 (continued)
Total Number of
Children Receiving
Dental Service:
Preventive
State
Tennessee
Texas
Utah
Vermont
Virginia
Washington
West Virginia
Wisconsin
Wyoming
U.S. Total
Source:
Percent of Children
Receiving Dental
Service: Preventive
Total Number of
Children Receiving
Dental Service:
Treatment
340,073
1,591,256
81,512
45
55
48
186,995
1,037,158
40,871
24
36
24
33,403
265,212
357,672
84,670
114,869
22,366
58
46
51
44
23
43
14,003
148,238
225,107
96,313
57,367
12,277
24
26
32
50
12
24
12,678,548
43 (Median)
41 (Mean)
FFY 2010 CMS-416 reports, Line 1b, Line 12b, Line 12c.
xxi
7,073,476
Percent of Children
Receiving Dental
Service: Treatment
22 (Median)
23 (Mean)
Exhibit 6. Comparison of Median Rates for State Medicaid/CHIP Programs and Commercial Health Plans for
Frequently Reported Children’s Health Care Quality Measures, FFY 2011
Age Group
State Medicaid/CHIP
Median
Health Plan
Commercial Median
12-24 Months
25 Months - 6 Years
7-11 Years
12-19 Years
96.7
88.1
90.0
89.0
98.2
91.8
92.4
89.6
First 15 Months
60.8
78.1
3-6 Years
66.9
73.1
12-21 Years
45.7
41.8
Childhood Immunization
Status
Percent Up to Date on
Immunizations (Combo 3)a
2 Years
70.7
75.8
Immunizations for
Adolescents
Percent Up to Date on
Immunizations (Combo 1)b
13 Years
51.9
51.3
Chlamydia Screening
Percent Screened
16-20 Years
47.1
39.6
Appropriate Testing for
Children with Pharyngitis
Percent Tested
2-18 Years
63.1
79.6
Measure
Access to Primary Care
Percent with a PCP Visit
Well-Child Visits
Percent with 6 or More
Visits
Percent with 1 or More
Visits
Percent with 1 or More
Visits
Sources:
State Medicaid/CHIP medians from FFY 2011 CARTS reports; Commercial Health Plan medians from
unpublished data provided by the National Committee for Quality Assurance (NCQA).
a
Combination 3 includes DTaP, IPV, MMR, HiB, HepB, VZV, and PCV.
b
Combination 1 includes Meningococcal and Tdap.
PCP = Primary Care Practitioner.
xxii
Exhibit 7. Parents’ Assessment of the Ease of Getting Care for Their Child, 25 States, 2010
Child Can Get Care
for Illness/Injury
as Soon as Needed
76
Child Can Get
Appointment for
Routine Care as
Soon as Needed
65
How Often It Was
Easy to Get
Appointment
with a Specialist
47
0%
10%
70%
20%
30%
40%
50%
60%
Percentage Reporting Always (State Median)
80%
Source:
Mathematica analysis of National CAHPS Benchmarking Database.
Note:
Parents assessed the ease of getting care on a four-point scale (never, sometimes, usually, always). The
percentages shown here are the median percentages reporting “always.”
Exhibit 8. Parents’ Assessment of How Well Their Child’s Doctor Communicates, 25 States, 2010
Child’s Doctor
Shows Respect
for What Parent
Has to Say
81
Child’s Doctor
Listens Carefully
to Parent
78
Child’s Doctor
Explains Things
Clearly to Parent
77
How Well
Child’s Doctor
Communicates
(Composite)
73
Child’s Doctor
Explains Things
Clearly to Child
68
Child’s Doctor
Spent Enough
Time with Child
62
0%
10%
20%
70%
30%
40%
50%
60%
Percentage Reporting Always (State Median)
80%
90%
Source:
Mathematica analysis of National CAHPS Benchmarking Database.
Note:
Parents assessed doctor’s communication on a four-point scale (never, sometimes, usually, always).
The percentages shown here are the median percentages reporting “always.”
xxiii
Exhibit 9. Performance Improvement Projects (PIPs) Targeting Children or Pregnant Women Included in External Quality Review Organization (EQRO) Technical
Reports, 2011-2012 Reporting Cycle
Number of PIPs by Topic Area
State
Number of PIPs
for Children or
Pregnant Women
Years of Data
PIPs Validated
Behav
Childhood
by EQRO a ADHD Asthma Health Immunization
Dental
Care
Lead
Screening
Mental
Health
Prenatal
Care
Primary Care
Well-Child
Access
Weight / BMI
Care
Other b
xxiv
Total PIPs (37 States)
268
4
16
5
17
24
11
19
46
2
42
56
26
Total States (37 States)
30
4
7
1
9
7
6
4
16
1
9
11
9
Arizona
California
Colorado
Delaware
D.C.
7
22
3
4
FFY 2006–2009
Jan–March 2012
FFY 2010–2011
Varies by PIP
All
All
All
All
1
7*
1
1
3
1
3
CY 2010
All
Florida
Georgia
Hawaii
Illinois
Indiana
59
9
6
6
3
SFY 2011
Varies by PIP
Varies by PIP
SFY 2009–2010
CY 2010
All
All
All
All
All
Iowa
Kansas
Kentucky
Maryland
Massachusetts
0
2
4
0
0
CY 2009-2010
Varies by PIP
Varies by PIP
NA
NA
All
All
All
All
NA
Michigan
Minnesota
Missouri
Nebraska
Nevada
14
2
11
5
4
CY 2010
NR
CY 2010
CY 2010
CY 2011
All
All
All
All
All
New Jersey
New Mexico
New York
Ohio
Oregon
16
5
17
12
12
CY2009
FY 2010
2009-2010
SFY 2010
2011–2012
All
All
All
All
Some c
Pennsylvania
Puerto Rico
Rhode Island
South Carolina
Tennessee
6
1
2
4
4
CY 2008–2010
NR
Varies by PIP
NR
CY 2010
All
All
All
All
Some
12
5
1
1
1
2*
3*
2
5*
3
3*
3
3*
14*
2
2
1
1
1
1
1
1
2
1
3*
1
6*
2
1
2
6*
1
1
4*
2
3*
2
3
1
1
2
6*
14*
4
1
1
2
1
1
14*
1
1
2
3
3*
1
30*
3*
1
1
1
1
7*
7*
3
1
3
3
1
Number of PIPs by Topic Area
State
Texas
Utah
Vermont
Virginia
Washington
West Virginia
Wisconsin d
Number of PIPs
for Children or
Pregnant Women
Years of Data
0
0
0
10
10
5
0
NA
2010
NA
CY 2010
Varies by PIP
CY 2010
NA
PIPs Validated
Behav
Childhood
by EQRO a ADHD Asthma Health Immunization
NA
All
NA
All
All
All
NA
2
Dental
Care
Lead
Screening
5*
2
1
Mental
Health
Prenatal
Care
Primary Care
Well-Child
Access
Weight / BMI
Care
Other b
5*
6*
2
1
Source:
EQRO technical reports submitted to CMS for the 2011-2012 reporting cycle as of July 31, 2012.
Notes:
Alabama, Alaska, Arkansas, Connecticut, Idaho, Maine, Montana, New Hampshire, Oklahoma, South Dakota, and Wyoming do not have MCOs or PIHPs that enroll children covered by
Medicaid or CHIP. Louisiana, Mississippi, and North Dakota have newly applicable managed care requirements and were not required to submit EQRO technical reports for the 2011-2012
reporting cycle. North Carolina submitted an EQRO technical report, but managed care in the state was limited to behavioral health programs that did not enroll children.
Analysis excludes plans that provide only limited services, such as primary care case management. Analysis also excludes plans that do not serve children or pregnant women, such as long-term
care plans or Medicare Advantage plans that cover dual eligibles.
xxv
Analysis includes PIPs listed in the EQRO technical report for each state that specifically targeted children or pregnant women.
a
Use of the term “validation” differed across EQRO technical reports. In Exhibit 9, validation indicates that the EQRO technical reported reviewing information, data, and procedures to determine the extent to
which they are accurate, reliable, free from bias, and in accord with standards for data collection and analysis. Some PIPs that were reviewed in the validation process did not meet all of the review criteria.
b
PIPs for children on “Other” topics include appropriate treatment for children with pharyngitis (South Carolina); assuring better child health and development (Oregon); emergency room diversion (Colorado,
West Virginia); EPSDT participation rates (Illinois, Kentucky, Ohio); improving customer service rates: children (Kansas); improving rates of cervical cancer screening (California); reduction of out-of-home
placement (California); school attendance rates (California); sexually transmitted infections (Kansas).
c
EQRO did not review or validate the Assuring Better Child Health and Development (ABCD) Program PIP because a separate EQRO (the Oregon Pediatric Improvement Partnership) held the contract for PIP
development and validation.
d
Managed care plans in Wisconsin operate PIPs, but PIP topics and descriptions were not included in the 2011 EQRO technical report.
*PIP topic was mandated by state; ADHD = Attention Deficit Hyperactivity Disorder; Behav = Behavioral; BMI = Body Mass Index; NA = Not Applicable, EQRO technical report did not include any PIPs for
children or pregnant women; NR = Not Reported
1
This page has been left blank for double-sided copying.
I.
INTRODUCTION
The Centers for Medicare & Medicaid Services (CMS), working collaboratively with its many
partners, including states, health care providers, and families, is entering a new era of quality
measurement and improvement in Medicaid and the Children’s Health Insurance Program
(CHIP). Since the release of the 2011 Secretary's Report on the Quality of Care for Children in
Medicaid and CHIP, 11 CMS has made progress in encouraging states and providers to use a core
set of health care quality measures to assess and improve care provided to children covered by
Medicaid and CHIP.
Together, Medicaid and CHIP served more than 43.5 million children in federal fiscal year
(FFY) 2011, representing one-half of beneficiaries currently enrolled in these programs. The
number of children enrolled in Medicaid and CHIP grew by more than 1.5 million between FFY
2010 and FFY 2011. This increase in enrollment is evidence of the role Medicaid/CHIP play in
ensuring that low-income children get the health care coverage they need, especially during
economic downturns. It is anticipated that the number of children covered by Medicaid/CHIP
will continue to increase due to population growth, loss of employer sponsored coverage by lowincome families, and outreach efforts targeting children who are eligible but not enrolled in the
programs.
The majority (63 percent) of children covered by Medicaid/CHIP obtain care from managed care
plans (Table 1), though the range of services and the population groups included in these plans
vary across states. For example, some states include mental health and dental services in their
managed care plans and others provide these services using fee-for-service arrangements.
Because of these varying arrangements, a diverse set of quality measurement and improvement
efforts are underway across payment and delivery care settings (see Appendix A).
With the enactment of the Children’s Health Insurance Program Reauthorization Act of 2009
(CHIPRA) and the Affordable Care Act of 2010, CMS has worked to foster a shared sense of
accountability for ensuring that the care purchased and provided by Medicaid/CHIP is of the
highest quality. These efforts are aligned with HHS’ National Quality Strategy’s three aims of
better care, healthier people and communities, and more affordable care. 12
The objective of this report, as required by CHIPRA, 13 is to summarize state-specific
information on the quality of health care furnished to children under titles XIX (Medicaid) and
XXI (CHIP). Section 1139A(c)(1)(B) of the Act specifically requests information gathered from
the external quality reviews of managed care organizations (MCOs) 14 and benchmark plans. 15
The Secretary of HHS was required to make this information publicly available annually starting
September 30, 2010.
11
The 2011 Secretary’s Report is available at: http://www.medicaid.gov/Medicaid-CHIP-Program-Information/ByTopics/Quality-of-Care/Downloads/2011_StateReporttoCongress.pdf
12
The National Quality Strategy is available at: http://www.ahrq.gov/workingforquality/nqs/nqs2012annlrpt.pdf
13
Section 1139A(c)(2) of the Social Security Act, as amended by section 401(c) of CHIPRA.
14
Established under the authority of Section 1932 of the Social Security Act.
15
Established under the authority of Sections 1937 and 2103 of the Social Security Act.
1
This page has been left blank for double-sided copying.
II. STATE AND FEDERAL EFFORTS FOR QUALITY MEASUREMENT, REPORTING,
AND IMPROVEMENT
The Affordable Care Act seeks to improve access, affordability, and the overall quality of health
care for all Americans. HHS’ efforts in achieving these goals are guided by The National
Strategy for Quality Improvement in Health Care (National Quality Strategy) 16 that was required
by the Affordable Care Act. The strategy identifies principles 17 and a strategic plan for
improvements in areas important to children’s quality of care. CMS also recognizes that the
quality of care a child receives is closely interlinked with having a stable source of coverage 18
and a benefit package that can meet a child’s needs. Thus, keeping eligible children enrolled in
Medicaid/CHIP and ensuring access to the services covered through Medicaid’s Early and
Periodic Screening, Diagnostic, and Treatment (EPSDT) benefits are top priorities that support
CMS’ quality agenda. CMS efforts related to implementation of the National Quality Strategy
for children in Medicaid/CHIP are discussed in this chapter of the report.
A. Measuring and Reporting on Quality of Care
With the release of the 2011 Secretary’s Report, CMS released state-specific information from
the first year of voluntary reporting on the initial core set of children’s health care quality
measures. It was an important milestone in CMS’ efforts to uniformly measure and report on the
quality of care obtained by children covered by Medicaid/CHIP and yet, it was the first of many
steps that need to be taken to support states and providers in continuous quality improvement
efforts.
In preparing for the 2012 Secretary’s Report, CMS set several internal goals for improving
quality measurement. These goals were to:
• Increase the number of states reporting on the core measures;
• Increase the number of measures reported by each state;
• Improve the completeness of the data reported (that is, report on both Medicaid and
CHIP enrollees); and
• Assess state managed care quality improvement efforts reported through external
quality review performance improvement projects reporting.
16
Report to Congress: National Strategy for Quality Improvement in Health Care, April 2012. Available at:
http://www.ahrq.gov/workingforquality/nqs/nqs2012annlrpt.pdf
17
The principles are increasing person-centeredness and family engagement; eliminating disparities in care; making
primary care a bigger focus; enhancing coordination of care; and integrating care delivery. For a full listing of the
Strategy’s underlying principles visit: http://www.ahrq.gov/workingforquality/nqs/principles.htm#principles
18
When a child rotates in and out of the health system, it makes it difficult, if not impossible, for physicians and
other caregivers to provide high quality care or to measure the care obtained.
3
States, with the assistance of CMS and its Quality Measures Technical Assistance and Analytic
Support (TA/AS) Program contractor, 19 made progress on all of these goals for year two
reporting.
Sustaining quality measurement and improvement depends on ensuring that the pediatric
measurement field is robust and reflects the range of health care and psycho-social issues
relevant to children’s health care quality. Supplementing efforts in the measurement
development field is the AHRQ-CMS Pediatric Quality Measures Program (PQMP), which
consists of seven Centers of Excellence in Pediatric Quality Measures (see Chapter IV).
Working in partnership with the Agency for Healthcare Research and Quality (AHRQ), AHRQ
and CMS awarded grants of $60 million over four years to these centers in March 2011. 20 CMS
also is working with the Office of the National Coordinator for Health Information Technology
(ONC) to develop pediatric measures that can be collected through an electronic health record
and to assure that the initial core set measures are electronically-specified.
1.
The CMS Federal-State Data Systems for Quality Reporting
As the states and the Federal government undergo changes in preparation for the January 1, 2014
launch date of the new Affordable Insurance Exchanges and the expansion of Medicaid
eligibility, so too do the information technology systems used to monitor these programs. In
order to seamlessly and efficiently meet consumers’ health care needs, improve quality, and
lower costs, these programs will need to work together by using consistent standards and
systems. Many systems are being developed to support these changes, and some are being
improved, but both types of systems ultimately allow CMS to do a better job of ensuring that all
Americans have access to a high quality system of coverage and care.
Previous Secretary’s Reports have referenced efforts underway at CMS to develop a uniform
information and reporting system that will include accurate data for information management
and monitoring quality improvement. Since the last Secretary’s Report, CMS has made
substantial progress in moving toward an improved information technology system, by
streamlining several current Medicaid and CHIP data-collection and reporting efforts through a
unified data model. This model will also improve program oversight and facilitate quality of
care reporting by states. The two primary components of this model are: (1) the Medicaid and
CHIP Program (MACPro) system, which will serve as the single repository for states to submit
key programmatic information and the system of record for all state Medicaid and CHIP actions;
and (2) the Transformed Medicaid Statistical Information System (TMSIS), which is an
expanded yet streamlined MSIS, the claims-based system that serves at the primary data source
to manage Medicaid and CHIP programs. It is CMS’ expectation that such efforts to streamline
or create integrated data systems will strengthen reporting at CMS and help to ease potential
burdens and redundancies imposed on states by various CMS reporting requirements. MACPro
19
This TA/AS contract is led by Mathematica Policy Research and supported by subcontracts with the National
Committee for Quality Assurance (NCQA), the Center for Health Care Strategies (CHCS), and the National
Initiative for Children’s Healthcare Quality (NICHQ).
20
For more information on the PQMP, refer to: http://www.ahrq.gov/chipra/pqmpfact.htm
4
and TMSIS will also serve as the primary data sources for the Center for Medicaid and CHIP
Services (CMCS) quality reporting and performance measurement capacities for Medicaid and
CHIP.
While preparing for the future, CMS also continues to work on maintaining and improving the
systems currently used to manage programs and monitor the quality of care provided to children
in Medicaid and CHIP. Learning from the experiences of the first two years of reporting the
initial core set of children’s health care quality measures, for example, CMS continues to make
improvements to the CHIP Annual Reporting Template System (CARTS), the vehicle states use
to report the children’s quality measures to CMS. These changes aim to both facilitate more
accurate and complete reporting by states, and also reduce potential burdens associated with this
reporting. 21
CMS has also made improvements to the Form CMS-416, the reporting tool used to assess the
effectiveness of Medicaid’s Early and Periodic Screening, Diagnostic and Treatment (EPSDT)
benefit. In an effort to both improve future reporting on the Form CMS-416 and impart greater
confidence in the accuracy of the information submitted, CMS developed a set of criteria used to
flag data that raise concerns about the accuracy of information submitted on the Form CMS-416.
Using these criteria, CMS recently completed a state-by-state review of data submitted on the
Form CMS-416 report for FFY 2010, and have continued these reviews to also analyze data
submitted on the FFY 2011 Form CMS-416 report. States that were identified as having data
concerns received a communication from CMS which explained, in detail, the specific issues of
concern noted in the Form CMS-416 data submission. They were given an opportunity to
correct and resubmit this information. Feedback from states regarding these reviews will lead to
improvements in the Form CMS-416 instructions prior to the next reporting cycle. The audit
will be made a permanent part of the Form CMS-416 data-submission process.
CMS expects that efforts to streamline, improve, or develop new information systems will help
ensure that information is more accurate, complete, and uniform, having the potential to
strengthen quality reporting for children, reduce health care costs associated with inefficiencies
in the health care delivery system, and ultimately facilitate better health outcomes for children.
2.
Tracking Results
CMS undertook several activities to assess the status of quality measurement, reporting, and
improvement efforts by states for the 2012 Secretary’s Report, including:
• Reviewing findings on the initial set of core measures reported to CMS by states for
FFY 2011;
• Analyzing data reported to CMS by states on the annual EPSDT report;
21
See Chapter III for a more detailed discussion of the changes that occurred in CARTS.
5
• Abstracting and summarizing information on the quality measures and performance
improvement projects reported in the External Quality Review Organization (EQRO)
technical reports from states using MCOs in Medicaid/CHIP; and
• Analyzing information from the Consumer Assessment of Healthcare Providers and
Systems (CAHPS®) to assess the experiences of children in Medicaid/CHIP.
B. Improving Quality of Care
Since the 2011 Report, HHS and states have been engaged in a number of efforts to improve the
quality of health care provided to children enrolled in Medicaid and CHIP. Appendix B
highlights examples of public-private partnerships to improve the quality of care in
Medicaid/CHIP.
Two major efforts underway – one on perinatal health and the other on oral health – reflect a
major shift in the approach used previously by Medicaid/CHIP. These initiatives are national in
scope rather than state-based, and use CMS quality of care performance measures to guide
quality improvement efforts and evaluate outcomes.
• Improving Perinatal Health. Medicaid currently finances between 40 and 50 percent
of all births in the United States. Despite improvements in access to coverage and
care, low-income women enrolled in Medicaid have a rate of preterm births that is
higher than the rate for all other women (11.9 percent vs. 8.7 percent). 22 CMS
launched two initiatives in 2012 to improve perinatal health outcomes. One initiative,
Strong Start for Mothers and Newborns, which is led by the CMS Innovation Center
(CMMI) working in partnership with the Center for Medicaid and CHIP Services
(CMCS), includes two primary strategies: (1) testing ways to encourage best practices
for reducing the number of early elective deliveries that lack medical indication
(across all payer types); and (2) testing three models of enhanced prenatal care 23 for
reducing preterm births among women covered by Medicaid/CHIP. The other
national activity, CMCS’s Expert Panel for Improving Maternal and Infant Health
Outcomes 24 (the Expert Panel) is identifying specific opportunities and strategies to
provide better care, while reducing the cost of care for mothers and infants covered
by Medicaid/CHIP. By fall of 2013, the Expert Panel is expected to recommend a set
of opportunities for improvement and action steps for Medicaid/CHIP. To support
both of these maternity-focused efforts, CMS identified a Medicaid maternity core set
22
CDC, PRAMS 2008. Infants born preterm (i.e., at less than 37 weeks of gestation) are at higher risk of
developmental problems and health problems than infants born at full term. There are also substantial medical and
societal costs associated with preterm births.
23
The three models of enhanced prenatal care are centering/group care; birthing centers; or medical homes. For
additional information see: http://innovations.cms.gov/initiatives/Strong-Start/
24
The Expert Panel, co-chaired by the Ohio Medicaid Medical Director and the immediate past president of the
American Congress of Obstetricians and Gynecologists (ACOG), consists of Medicaid medical directors, clinical
experts, representatives of health plans, and advocacy stakeholder groups.
6
of quality measures for voluntary reporting by states. This core set, which consists of
5 of the children’s initial core set of measures and 3 of the adult core set of
measures, 25 will be used by CMS to measure progress towards improvement and
evaluate efforts.
• Improving Oral Health. The Oral Health Initiative was developed to address the
significant need for low-income children’s improved access to oral health care, given
evidence that children in America’s poorest families were twice as likely to have
untreated dental disease as children in non-poor families. 26 On average, 40 percent of
publicly-insured children ages 2-17 received any dental service in 2007, as compared
with 60 percent of children with private insurance. 27 Working with Federal and state
partners, the dental and medical provider communities, children’s advocates and other
stakeholders, CMS seeks to improve children’s access to dental care, with an
emphasis on early prevention. The national CMS Oral Health Strategy, 28 has set two
improvement goals through the Initiative: (1) to increase by ten percentage points the
proportion of Medicaid and CHIP children ages 1 to 20 who receive a preventive
dental service; and (2) to increase by ten percentage points the proportion of
Medicaid and CHIP children ages 6 to 9 who receive a sealant on a permanent molar.
For the first goal, baselines will be set using FFY 2011 data 29 and the goal year is
FFY 2015. The second goal will be phased in over time. In addition to national
baselines and goals, each state will have its own baselines and goals. Two of the
twenty-four measures in the initial core set of children’s quality measures focus on
oral health: preventive dental services and dental treatment services. These measures
parallel the reporting in the annual EPSDT report (Form CMS-416) and, along with
data collected through other sources, will be used to monitor the effectiveness of this
initiative. In calendar year 2012, CMCS began working with states to develop oral
health action plans and will be providing ongoing technical assistance to states to
assist them in implementing access-improvement strategies.
C. Private Sector Efforts Supporting State Medicaid Quality Measurement and Improvement
Accreditation by a third party that reviews a health plan’s adherence to quality standards is
increasingly being encouraged by states and utilized by Medicaid agencies. Three private sector
organizations accredit Medicaid MCOs (Appendix C): the National Committee for Quality
Assurance (NCQA), URAC, and the Accreditation Association for Ambulatory Health Care
(AAAHC). States may elect to require or recognize one or all three of the accrediting bodies for
25
http://www.medicaid.gov/Medicaid-CHIP-Program-Information/By-Topics/Quality-ofCare/Downloads/AdultCoreMeasures.pdf
26
http://www.nidcr.nih.gov/datastatistics/surgeongeneral/sgr/chap4.htm
27
http://www.ahrq.gov/qual/nhqrdr09/nhqrdrchild09.htm
28
http://www.medicaid.gov/Medicaid-CHIP-Program-Information/By-Topics/Quality-of-Care/Downloads/CMSOral-Health-Strategy.pdf
29
Baselines for separate CHIP programs will be set using FFY 2013 CARTS data.
7
participating MCOs. States may choose to use accreditation results as proof of compliance with
some of the quality standards required under 42 CFR Part 438, subpart D. In those cases, 42
CFR §438.360(b) (4) requires the state to set forth in its quality strategy the standards for which
the EQR will use information from the accrediting agency to determine compliance. The quality
strategy must also include an explanation of the rationale for why the standards are duplicative.
NCQA’s Medicaid Managed Care Toolkit, 30 developed in collaboration with CMS in 2006,
includes information to support public reporting of quality measures and provides a crosswalk of
NCQA accreditation standards with the Federal quality standards under 42 CFR Part 438,
subpart D. As of March 2012, 29 Medicaid programs recognize or require NCQA accreditation
(Appendix C). Of the 29 programs, eleven states (Indiana, Kansas, Kentucky, Massachusetts,
Missouri, New Mexico, Ohio, Rhode Island, South Carolina, Tennessee, and Virginia) and the
District of Columbia require NCQA accreditation by managed care plans participating in
Medicaid.
Other nationally-recognized organizations dedicated to improving quality of care in the United
States have provided significant support to states’ efforts to evaluate and implement quality
improvement initiatives in Medicaid and CHIP programs (Appendix D). These organizations
have established peer-to-peer and regional learning collaboratives on targeted clinical quality
improvement initiatives, directed technical assistance to states on quality improvement
methodologies, and created opportunities to share lessons learned and promising practices in
utilizing evidenced-based clinical improvement projects.
30
The Medicaid managed care toolkit is available online at: http://www.ncqa.org/tabid/134/Default.aspx
8
III. STATE-SPECIFIC FINDINGS ON QUALITY AND ACCESS
IN MEDICAID AND CHIP
A. Quality Measurement Using the Initial Core Set of Children’s Health Care Quality Measures
As noted in Chapter II, states gained substantial momentum during the second year of voluntary
reporting of the initial core set of children’s health care quality measures. Table 2 provides a list
of the core quality measures. Several indicators highlight states’ increased reporting of the initial
core set of measures for FFY 2011 compared to FFY 2010:
• The number of states reporting at least one measure for Medicaid and/or CHIP
children increased from 42 states and the District of Columbia (D.C.) for FFY 2010 to
48 states and D.C. for FFY 2011.
• The median number of measures reported by states increased from 7 measures in FFY
2010 to 12 measures for FFY 2011.
• The number of states reporting at least one measure for both their Medicaid and CHIP
populations increased from 23 states and D.C. for FFY 2010 to 33 states and D.C. for
FFY 2011.
This marked progress in the level of state reporting was accompanied by evidence of room for
improvement in state performance related to the quality of care for children covered by
Medicaid/CHIP:
• Between FFY 2010 and 2011, the state medians for the percentage of children with
six or more well-child visits during the first 15 months increased by 5 percentage
points (from 56 to 61 percent) and the percentage with one or more well-child visits
at 3-6 years of age increased by 4 percentage points (from 65 to 69 percent) for the
states reporting in both years. Nevertheless, the rates of well-child visits still fell well
below clinical recommendations, 31 reflecting the continued need for significant
improvement.
• On average, the performance rates for the adolescent preventive care measures were
lower than the performance rates for younger children. The median rate of well-child
visits among adolescents ages 12 to 21 was 46 percent. Moreover, adolescents at age
13 were much less likely than children at age 2 to be up to date with recommended
immunizations; the median adolescent immunization rate was nearly 20 percentage
points lower than the median rate for younger children. Finally, the median rate of
Chlamydia screening was 47 percent. Taken together, these data suggest that only
about half of adolescents, on average, are receiving recommended well-child care,
immunizations, and Chlamydia screening. The lower rates among the adolescent
31
American Academy of Pediatrics. Recommendations for Preventive Pediatric Health Care. Practice Management
Online at: http://practice.aap.org. 2010. The AAP and Bright Futures recommend well-child visits for newborns, 35 days, 1 month, 2 months, 4 months, 6 months, 9 months, 12 months, and 15 months.
9
health quality measures reflect the challenges of reaching and engaging adolescents in
preventive and primary health care, and barriers to serving this population within
pediatric practices.
Much work remains to be done to standardize reporting of the children’s health care quality
measures across states and to understand underlying differences in state performance. Moreover,
although recent evidence on state performance is encouraging, children covered by Medicaid and
CHIP continue to receive less care than recommended by clinical guidelines (as do children
covered by commercial health plans), signifying the need for effective quality improvement
initiatives.
This chapter of the 2012 Secretary’s Report summarizes state reporting of the initial core set of
children’s health care quality measures for FFY 2011 and highlights progress between FFY 2010
and 2011. In addition, state Medicaid/CHIP program performance is benchmarked against
commercial health plan performance to provide a context for state reporting.
1.
Overview of State Reporting of the Initial Core Set Quality Measures in FFY 2011
The CHIP Annual Reporting Template System (CARTS) serves as the standardized reporting
vehicle for the initial core set of children’s health care quality measures. To facilitate
completeness and comparability of state reporting for FFY 2011, CARTS was enhanced by CMS
to allow states to identify deviations from the measure specifications and by aligning the
performance measure fields more closely with the technical specifications. In addition, technical
assistance was provided to states through a TA mailbox, webinar, and updated resource
manual. 32,33
States demonstrated strong commitment to reporting the initial core set measures for FFY 2011:
48 states and the District of Columbia submitted at least one measure to CARTS for FFY 2011.
As shown in Table 3 and Figure 1, the most frequently-reported measures for FFY 2011 were the
three child health measures that states have been reporting through CARTS since FFY 2003.
These measures assess children’s use of primary care and preventive services and were each
reported by 44 to 48 states for FFY 2011. The higher rate of reporting for these three measures
reflects states’ experience reporting on these measures for the past 9 years. See Appendix Table
E.1, for state-by-state detail on the frequency of reporting of the 24 children’s health care quality
measures for FFY 2011.
Fifteen measures were reported by 20 or more states for FFY 2011; of these, 13 are based on
Healthcare Effectiveness Data and Information Set (HEDIS®) specifications, and two are based
32
Technical assistance resources for the initial core set of children’s health care quality measures are available at:
http://www.medicaid.gov/Medicaid-CHIP-Program-Information/By-Topics/Quality-of-Care/CHIPRA-Initial-CoreSet-of-Childrens-Health-Care-Quality-Measures.html
33
Centers for Medicare & Medicaid Services, Center for Medicaid and CHIP Services. “Initial Core Set of
Children’s Health Care Quality Measures: Technical Specifications and Resource Manual for Federal Fiscal Year
2011 Reporting.” Baltimore, MD: CMS, December 2011. Available at: http://www.medicaid.gov/Medicaid-CHIPProgram-Information/By-Topics/Quality-of-Care/Downloads/InitialCoreSetResouceManual.pdf
10
on the EPSDT (Form CMS-416) report. These specifications are familiar to state
Medicaid/CHIP programs, and as a result, many states were able to report these measures
voluntarily. The three measures reported by five or fewer states for FFY 2011 involve coding
schemes (such as CPT-category II codes) or data sources (such as vital records or hospital
records) that few states were able to incorporate into their FFY 2011 reports. 34
The number of child health care quality measures reported by states for FFY 2011 ranged from
zero in two states (Delaware and Wisconsin) to 24 measures in one state (Oregon) (Figure 2).
The median number of quality measures reported for FFY 2011 was 12. (The median indicates
that half the states reported 12 or more measures and half the states reported fewer than 12
measures). Altogether, 27 states and D.C. reported at least half of the children’s core quality
measures for FFY 2011, while 6 states reported 1 to 5 measures. 35 As shown in Table 3, the
most common reason for not reporting a measure was that data were not available, although
many states did not specify a reason or reported an “other” reason.
To provide more transparency in how the measures were calculated across states, CARTS was
enhanced for FFY 2011 to allow states to specify whether they deviated from the specifications.
Examples of deviations include using an earlier year of data due to data lags; excluding children
not served by managed care plans due to lack of data in the fee-for-service delivery system; or
reporting age groups that differ from the specifications (Table 4).
2.
Changes in State Reporting of the Initial Core Set Quality Measures from FFY 2010 to FFY
2011
Between FFY 2010 and 2011, increases were observed in both the number of measures reported
by each state and the number of states reporting each measure. Across the initial core set of
measures, each of the 24 measures was reported by more states for FFY 2011 than for FFY 2010
(Table 5 and Figure 3). This increase may be due in part to CMS’ efforts to provide guidance to
states through the TA mailbox, revisions to the technical specifications, enhancements in
CARTS, webinar trainings, and a TA brief providing guidance on reporting of dental measures
released to states in early 2012. 36 Also of note, the pediatric Central-Line Associated
Bloodstream Infections (CLABSI) measure was reported by one State (Oregon) for FFY 2011,
whereas no states reported this measure for FFY 2010. CMS convened a work group in 2012 to
34
Two of these measures, Otitis Media with Effusion (measure 16) and Pediatric Central-Line Associated
Bloodstream Infections (CLABSI) (measure 19), were “on hold” for FFY 2011 pending updated specifications from
the measure stewards. In preparation for submission of the FFY 2012 reports, which are due by December 31, 2012,
CMS is focusing special attention on refining the specifications and providing technical assistance to states for the
measures that few states were able to report.
35
The 6 states reporting five or fewer measures reported primarily the HEDIS well-care or access-to-primary-care
measures or the EPSDT oral health quality measures. Reasons cited for not reporting additional measures included
lack of sufficient staff time or estimates had been determined using small sample sizes that limited accuracy.
36
CMS, Center for Medicaid and CHIP Services. “Improving Access to Oral Health Services in Medicaid and
CHIP: How States Can Report the Dental Measures in the Initial Core Set of Children’s Health Care Quality
Measures.” Baltimore, MD: CMS, February 2012. Available at: http://www.medicaid.gov/Medicaid-CHIPProgram-Information/By-Topics/Quality-of-Care/Downloads/TA1-Dental.pdf.
11
assess the feasibility and challenges of state reporting of the pediatric CLABSI measure and
plans to provide additional guidance on state-level reporting of this measure for FFY 2012.
The median number of measures reported by states increased from 7 for FFY 2010 to 12 for FFY
2011. 37 Compared to FFY 2010, 35 states reported more measures for FFY 2011, 10 reported the
same number of measures, and 6 reported fewer measures (Table 6). Among the 35 states
reporting more measures for FFY 2011 than for FFY 2010, the increase ranged from 1 to 24
measures, with 19 states reporting at least 5 more measures, and 8 states reporting at least 10
more measures. Of the eight states that did not report any measures for FFY 2010, all but one
(Delaware) reported for FFY 2011, including Arkansas (13 measures for FFY 2011), Hawaii
(12), Idaho (6), Kansas (5), Massachusetts (11), Oregon (24), and Texas (12). (See Section E of
this Chapter for a profile of Arkansas’ quality measurement system.)
Another indicator of the completeness of reporting is the number of states reporting measures for
both their Medicaid and CHIP populations, rather than for CHIP only or Medicaid only. As
shown in Table 6, 33 states and D.C. reported data for both Medicaid and CHIP populations for
at least one measure for FFY 2011, an increase from 23 states and D.C. reporting Medicaid and
CHIP data for at least one measure for FFY 2010. Moreover, the median number of measures
reported by states for both Medicaid and CHIP increased from 0 to 6. This level of progress
reflects CMS’ efforts to encourage state reporting of the initial core set measures for all or most
publicly insured children in each state.
3.
Analysis of Eight Frequently Reported Initial Core Set Quality Measures in FFY 2011
Since the first annual Secretary’s Report in FFY 2010, CMS has been working with states to
improve the collection and reporting of data on the quality of health care for children covered by
Medicaid and CHIP. Specifically, CMS has focused on improving states’ adherence to the
measure specifications and providing more transparency about variations in state reporting. This
enables a more in-depth look at state performance related to eight frequently reported measures
(defined as measures reported by 25 or more states). 38 The eight measures are:
• Children’s and adolescents’ access to primary care practitioners (PCPs) (measure 14)
• Well-child visits in the first 15 months of life (measure 10)
• Well-child visits in the 3rd, 4th, 5th, and 6th years of life (measure 11)
• Adolescent well-child visits (measure 12)
• Childhood immunization status (measure 5)
37
The initial core set includes 15 HEDIS and 9 non-HEDIS measures. The median number of HEDIS measures
reported by states increased from 6 in FFY 2010 to 10 in FFY 2011, while the median number of non-HEDIS
measures reported by states increased from 1 to 2.
38
The 2011 Secretary’s Report highlighted five measures. The additional measures highlighted in the 2012
Secretary’s Report are: immunizations for adolescents, appropriate testing for children with pharyngitis, and
Chlamydia screening.
12
• Immunizations for adolescents (measure 6)
• Chlamydia screening (measure 9)
• Appropriate testing for children with pharyngitis (measure 15)
These measures reflect a range of services— access to primary care, use of preventive care use,
and appropriateness of acute care—and include all age groups—infants, preschool, school-age,
and adolescents. (Measures related to dental services were also frequently reported in FFY 2011
and are discussed elsewhere in this report.) Appendix Tables E.2 through E.9 provide state-bystate detail on reporting of the eight selected measures for FFY 2011. These measures are useful
in assessing the adequacy of children’s and adolescents’ access to and use of care. They provide
insights into the current status of health care quality provided to publicly-insured children and
areas for improvement.
As shown in Table 7, performance was considerably higher on the primary care access measure
than on the other frequently-reported measures for FFY 2011. This is consistent with findings
reported in the 2011 Secretary’s Report. The vast majority of children had at least one primary
care visit during the reporting period, although the median rate ranged from a high of 97 percent
among children ages 12-24 months to 88-90 percent for the other age groups. The rates across
states tended to cluster around the median, with a range of 2.6 to 6.5 percentage points between
the 25th and 75th percentiles for all age groups.
In contrast to the primary care access measure, fewer children received the recommended
number of well-child visits for FFY 2011. The American Academy of Pediatrics (AAP) and
Bright Futures recommend 9 well-child visits in the first 15 months of life and annual well-child
visits for children ages 3 and older. 39 As shown in Table 7, the rate of well-child visits was
substantially lower than these recommendations. Across states, a median of 61 percent of infants
had 6 or more well-child visits in the first 15 months of life. The rate was slightly higher for
children ages 3-6, with a median of 67 percent of children having a well-child visit during the
reporting period. However, adolescents (ages 12-21 years) had a considerably lower median
well-child visit rate (46 percent) than the other age groups.
The effectiveness of well-child care can be reflected by four measures related to childhood and
adolescent immunization rates, Chlamydia screening rate, and appropriate pharyngitis testing
rate. The median childhood immunization rate for children turning age 2 was 71 percent, with a
39
American Academy of Pediatrics. Recommendations for Preventive Pediatric Health Care. Practice Management
Online at: http://practice.aap.org. 2010. The AAP and Bright Futures recommend well-child visits for newborns, 35 days, 1 month, 2 months, 4 months, 6 months, 9 months, 12 months, and 15 months.
13
15 percentage point spread between the 25th and 75th percentiles. 40,41 The median adolescent
immunization rate among 13-year-olds was 52 percent, with an even wider spread of 27
percentage points between the 25th and 75th percentiles. 42 The Chlamydia screening rate among
sexually active girls between the ages of 16 and 20 was 47 percent.
The effectiveness of primary care is also reflected by the appropriateness of testing for
pharyngitis (specifically, the administration of a strep test among those dispensed an antibiotic
for pharyngitis). The median rate of children and adolescents receiving appropriate testing for
pharyngitis was 63 percent, although this measure varied widely across states, with a 23
percentage point difference between the 25th and 75th percentiles. Four states reported a rate
under 40 percent, while two states reported a rate over 80 percent.
4.
Changes in Primary Care Access and Well-Child Visit Rates Between FFY 2010 and 2011
One of the goals of state reporting of the initial core set of children’s health care quality
measures to is drive improvements in quality both within individual states and nationally. With
only two years of initial core set reporting experience, data are not yet available to assess trends
across the full range of measures. Nevertheless, state median performance related to access to
primary care and well-child visits can be tracked over two points in time, subject to the caveat
that states are continuing to improve the quality of their data and their adherence to the technical
specifications.
As shown in Table 8 and Figure 4, median primary care access rates changed minimally from
FFY 2010 to FFY 2011 among the states that reported this measure using HEDIS specifications
during both years. The rate of primary care access was high in both years across all age groups.
The rates of well-child visits were substantially lower; evidence suggests, however, that the
median rates may be increasing slightly in the younger age groups. For example, the median
percentage with 6 or more visits at 15 months of age increased from 56 percent to 61 percent in
the 37 states reporting in both years. Similarly, the percentage of children ages 3 to 6 with a
well-child visit increased from 65 percent to 69 percent across 38 states. The rate of adolescent
well-child visits held steady at 47 percent, on average, across 29 states.
Table 9 provides more in-depth analysis of changes between FFY 2010 and 2011 in well-child
visit rates across states for children ages 3-6. Although the state median increased from 65 to 69
percent over the two-year period, calculations varied within and across States. As reported in the
2011 Secretary’s Report, the rate on this measure ranged from a low of 26 percent in North
40
The childhood immunization rate is based on “Combo 3,” which was the most frequently reported immunization
measure across states. Combo 3 includes 4 diphtheria, tetanus, and pertussis (DTaP); 3 polio (IPV); 1 measles,
mumps, rubella (MMR); 2 influenza (HiB); 2 hepatitis B (HepB); 1 chicken pox vaccine (VZV), and 4
pneumococcal conjugate (PCV).
41
One factor that may influence the wide range in rates across states is the variation in the use of hybrid versus
administrative data only. For example, among states that used administrative data only, the median rate was 53
percent, while among states that used hybrid methods, the median was 74 percent.
42
The adolescent immunization rate is based on “Combo 1,” which includes Tetanus, Diphtheria, Pertussis (Tdap)
and Meningococcal.
14
Carolina’s CHIP program to a high of 82 percent in Maryland’s Medicaid/CHIP program for
FFY 2010. In FFY 2011, North Carolina reported a rate of 71 percent, although this rate was for
the Medicaid program, whereas the FFY 2010 rate was for 6-year-olds in the CHIP program.
Maryland’s rate fluctuated slightly but remained above 80 percent. For FFY 2011, the rate
ranged from 29 percent in North Dakota’s CHIP program to 85 percent in Massachusetts’
Medicaid/CHIP program. Variations in the population included in the measure (Medicaid only,
CHIP only, or Medicaid and CHIP), type of data used to calculate the measure (administrative
only or hybrid), and other factors (such as year of data or definition of denominator) may affect
the comparability of data across states and over time.
5.
Quality of Care in Medicaid/CHIP Programs and Commercial Health Plans
One of the measures of success of CMS efforts is to track the quality of care for children enrolled
in Medicaid/CHIP programs with that of commercially insured children. Table 10 shows the
state medians for the eight measures reported in CARTS for FFY 2011 by at least 25 states.
These medians are compared to the health plan medians for commercially-insured populations,
as provided by the National Committee for Quality Assurance (NCQA). Although the
populations covered by Medicaid/CHIP and private insurance may differ on socioeconomic and
other demographic characteristics, this comparison provides context for assessing performance
reported by state Medicaid/CHIP programs.
In general, the percentages of children with a primary care visit during the year are quite high
and comparable between the two groups. Well-child visit rates are lower among publiclyinsured children during the first 15 months and ages 3 to 6, but higher among adolescents. 43
Immunization rates at age 2 are lower among publicly-insured children, but similar at age 13.
Appropriate testing for pharyngitis was substantially higher among children in commercial
health plans, while Chlamydia screening among sexually active teens was substantially higher
among those in public programs.
These results suggest that adolescents in public programs may fare at least as well or better than
those in commercial health plans as evidenced by similar rates of primary care access and
immunization rates and slightly higher rates of adolescent well-care visits and Chlamydia
screening rates. Improvement in adolescent health care quality remains a high priority for CMS
in the coming year. Similarly, improvements in receipt of recommended well-child care for
younger children in Medicaid/CHIP continues to be a priority.
6.
Sources of Variation in Children’s Health Care Quality Measures
As noted earlier, ongoing technical assistance is focusing on increasing the standardization of
state reporting of the initial core set measures, as well as encouraging transparency in state
reporting of methods used to calculate the measures. One source of variation in state reporting is
the population included in the measure: Medicaid (Title XIX) only, CHIP (Title XXI) only, or
43
The American Academy of Pediatrics (AAP) and Bright Futures recommend well-child visits for newborns, 3-5
days, 1 month, 2 months, 4 months, 6 months, 9 months, 12 months, and 15 months. AAP Recommendations for
Preventive Pediatric Health Care. Practice Management Online at: http://practice.aap.org. 2010.
15
both Medicaid and CHIP. As shown in Figure 5, the majority of states included both Medicaid
and CHIP populations in their rates for the eight frequently reported measures for FFY 2011,
although not surprisingly, the pattern varied by the type of CHIP program. Specifically, states
with Medicaid-expansion or combination CHIP programs more frequently included Medicaid
(Title XIX) children than states with separate CHIP programs only. This pattern is illustrated by
the 47 states that reported the percentage of children ages 3 to 6 who received one or more wellchild visits (Appendix Table E.4). 44 CMS’ ultimate goal is for states to report quality measures
for all publicly insured children, regardless of whether they are covered under CHIP (Title XXI)
or Medicaid (Title XIX).
States that include both Medicaid and CHIP populations provide a more complete picture of the
quality of care provided to publicly-insured children in the state. Moreover, including Medicaid
children increases the denominator for measures related to less frequent events (such as followup after mental hospitalization or follow-up care for children prescribed ADHD medication) and
related to populations that are more likely to be covered under Medicaid than CHIP (such as
infants).
Another source of variation is the method used to develop the measures. As shown in Figure 6,
most states used administrative (claims/encounter) data to measure performance, except for the
immunization measures where more states relied on a hybrid method using both administrative
and medical record data to report performance. Although hybrid methods are more resourceintensive than measures using administrative data alone, rates produced using hybrid methods
tend to be substantially higher than administrative-data-only rates for certain measures. One
study, for example, found that childhood immunization rates were 43 percentage points higher,
on average, when hybrid methods were used. 45 Of the 15 measures examined in the study, only
three—well-child visits in the first 15 months, well-child visits for ages 15 to 34 months, and
adolescent well care—were not significantly different across the two methods. Thus, the method
states used to calculate the measure may be an important source of variation among states,
especially for immunization rates.
As states are preparing for the third year of voluntary reporting of the initial core set of
children’s health care quality measures, ongoing technical assistance will focus on addressing
methodological challenges and reducing barriers encountered by states in calculating, reporting,
and using the initial core set measures. Increased emphasis will be placed on supporting states to
use the measures to drive improvements in the quality of care for children enrolled in Medicaid
and CHIP.
44
Six of the 7 states with Medicaid-expansion CHIP programs included both Medicaid and CHIP children, while 8
of the 18 reporting states with separate CHIP programs included both Medicaid and CHIP children. Among states
with combination programs (that is, states with both Medicaid expansion and separate CHIP components), 17 of 22
included both Medicaid and CHIP children in their rates.
45
Pawlson, G., Sarah Hudson Scholle, and Anne Powers. “Comparison of Administrative-Only Versus
Administrative Plus Chart Review Data for Reporting HEDIS Hybrid Measures.” American Journal of Managed
Care, vol. 13, no. 10, October 2007, pp. 91-96. Available online at:
http://www.ncqa.org/Portals/0/PublicComment/HEDIS2010Update/AJMC_Oct07.pdf.
16
B. External Quality Reviews of Managed Care Organizations
In FFY 2011 approximately 63 percent of publicly insured children obtained their care through
full-risk managed care plans (Table 1). The rate of managed care enrollment varies widely
across state Medicaid and CHIP programs, ranging from 5 percent of children in Alabama to 97
percent of children in Maryland. States contract with two types of managed care plans that are
required by federal regulations to conduct an annual external review of the quality of care: (1)
comprehensive managed care organizations (MCOs), which typically provide all of the acute
care health services covered by Medicaid or CHIP; and (2) prepaid inpatient health plans
(PIHPs). Managed care plans typically carve out services such as behavioral and mental health
services or dental services. 46
1.
External Quality Reviews
The Balanced Budget Act of 1997 created new system-wide quality standards for states opting to
use managed care for the delivery of health care in Medicaid or CHIP. Since January 2003,
federal regulations require that states arrange for an external review of the quality of care
provided by MCOs and PIHPs. 47 These annual external quality reviews assess the quality
outcomes, timeliness of, and access to, the items and services that each managed care
organization is responsible for providing. Section 1139A(c) of the Social Security Act, as
amended by section 401 of CHIPRA, requires the Secretary of HHS to include in this annual
report the information that states collect through external quality reviews of MCOs and PIHPs
participating in Medicaid or CHIP.
Managed care regulations at 42 CFR 438.300 et seq. lay out the parameters of conducting an
external quality review, including state responsibilities, qualifications of an external quality
review organization (EQRO), federal financial participation, and state deliverable requirements.
Per the regulations, each external quality review must include three mandatory activities:
• Validation of performance measures; 48
• Validation of PIPs; and
46
See 42 CFR 438.2 for full definition of a PIHP.
47
Section 1932(c) of the Social Security Act and 42 CFR 438.66. This requirement applied to Medicaid programs
and Medicaid-expansion CHIP programs. For separate CHIP programs, this requirement became law with the
enactment of CHIPRA. Section 403 of CHIPRA requires all states that operate a CHIP managed care program to
comply with the requirements of Section 1932 of the Social Security Act.
48
In accordance with 42 CFR 438.240, states that use Medicaid managed care systems must require each MCO and
PIHP to annually measure and report to the state its performance using standard measures specified by the state or
MCO. States are then required to validate any performance measures reported by the MCO or PIHP during the
preceding 12 months. 42 CFR 438.320 defines validation as the review of information, data, and procedures to
determine the extent to which they are accurate, reliable, free from bias, and in accord with standards for data
collection and analysis.
17
• A review, at least every 3 years, to determine the managed care plan’s compliance
with state standards for access to care, structure and operations, and quality
measurement and improvement.
To assist states in meeting the regulatory requirements for external quality reviews, CMS
released revised protocols that provide guidance on how to complete the mandatory and optional
external quality review activities. 49 Upon completion of the external quality review, the EQRO
must produce for the state a detailed technical report that assesses the quality, timeliness, and
access to care provided by each managed care plan as well as provides recommendations for
improving the quality of health care provided by managed care plans. Per 42 CFR 438.364(b),
the EQRO technical report is a public document, available upon request to all interested parties.
2.
External Quality Review Reports Submitted to CMS for the 2011-2012 Reporting Cycle
Thirty-five states, the District of Columbia, and the territory of Puerto Rico submitted EQRO
technical reports for 2011-2012 reporting cycle, for a total of 37 EQRO technical reports (Table
11). 50 These states contracted with 18 EQROs to conduct their external quality reviews and five
EQROs conducted quality reviews for multiple states in 2011-2012 (Appendix F). The 20112012 EQRO technical reports revealed that states engage in a variety of different quality
improvement efforts, based on each state’s priorities and other factors such as clinical areas that
need improvement. As will be discussed in this analysis, the 37 EQRO technical reports varied
substantially in the organization, level of detail, and focus of the discussion on quality, access,
and timeliness of care.
3.
Reporting of Performance Measures in 2011-2012 EQRO Technical Reports
In the 37 EQRO technical reports submitted for 2011-2012 reporting cycle, every state except
South Carolina listed the performance measures reported by MCOs and PIHPs (Table 12). Of
the EQRO technical reports that listed performance measures, Iowa was the only state without
performance measures that specifically evaluated children or pregnant women. 51 Two states
49
Protocols also cover evaluation of the five optional EQR activities: encounter data validation, quality of care
surveys, calculation of performance measures, conduct of PIPs, and focused quality of care studies.
http://www.medicaid.gov/Medicaid-CHIP-Program-Information/By-Topics/Quality-of-Care/Quality-of-CareExternal-Quality-Review.html
50
Of the remaining 15 states, 11 states (Alabama, Alaska, Arkansas, Connecticut, Idaho, Maine, Montana, New
Hampshire, Oklahoma, South Dakota, and Wyoming) did not use MCOs or PIHPs to deliver Medicaid or CHIP
services in 2011, and thus, have no EQR reporting. Two states (Louisiana and Mississippi) only recently
implemented Medicaid managed care and will report EQR data to CMS in FFY 2012 at the earliest. One state
(North Dakota) does not use a managed care delivery system for the Medicaid program, but uses managed care for
the CHIP population, and will report EQR data to CMS in FFY 2012 at the earliest. Finally, North Carolina
submitted an EQR report for the 2011-2012 reporting cycle, but managed care in the state was limited to behavioral
health programs that did not enroll children.
51
Managed care coverage for children in Iowa is limited to a PIHP that provides mental health and substance abuse
services.
18
(Delaware and Indiana) that did not include any performance measures specific to children in
2010, began reporting performance measures for children in 2011.
The most frequently-reported performance measures focus on childhood immunization rates,
well-child visits, adolescent well-care visits, and prenatal and perinatal care (Figure 7). Most of
the performance measures reported in the EQRO technical reports are HEDIS measures, and
many of the commonly-reported performance measures are similar to those included in the initial
core set of children’s health care quality measure (Appendix Table G.1).
All 37 of the 2011-2012 EQRO technical reports included the results of performance measure
validation. EQRO technical reports for five states (Illinois, Indiana, New Mexico, Tennessee,
and Virginia), however, indicated that the EQRO validated only some of the performance
measures in 2011-2012 (Table 13).
The amount of detail provided about performance on these measures varied across EQRO
technical reports. This is in part because federal regulations only require EQROs to validate the
performance measures. Thirty-one of the 37 EQRO technical reports included the performance
rates that were achieved by each MCO or PIHP for all performance measures evaluating children
or pregnant women (Table 13). 52 Some states simply listed each measure and the performance
rate achieved by the MCO or PIHP, other states included context for the performance rates
achieved by the MCO or PIHP as well as suggestions for improving future performance. Ten
states reported performance for subpopulations within the state. For example, Colorado,
Kentucky, Minnesota, and Ohio separately reported performance for different groups of
Medicaid enrollees, including children and families. California, New York, Pennsylvania,
Puerto Rico, and Texas included performance rates for different geographic regions within the
state. In addition, 29 states compared performance in the 2011-2012 EQRO technical report to
performance in previous years, 27 states compared performance by MCOs and PIHPs to national
HEDIS Medicaid rates, and 22 states included statewide managed care performance rates. This
contextual information helps assess performance rates for publicly insured children within and
across states.
Twenty-nine states submitted EQRO technical reports that included performance measures in
both 2010 and 2011-2012. 53 Among these states, childhood immunization measures were the
most commonly reported performance measures in both years. As Figure 8 shows, more states
reported performance measures for asthma, dental care, sexually transmitted infections, weight
assessment/BMI, adolescent well-care, and Attention Deficit Hyperactivity Disorder (ADHD) in
the 2011-2012 reports than in the 2010 reports. Conversely, fewer states reported performance
measures for well-child care and appropriate treatment of upper respiratory infections (URI) in
2011-2012, but these declines were caused by fewer reported measures in EQRO technical
52
EQRO technical reports for two states (New Mexico and Washington) included performance rates for some
measures, while three states (Indiana, South Carolina, Wisconsin) did not include performance rates for any of the
measures.
53
30 states submitted EQRO technical reports for 2010 and 2011-2012. The 2010 report for South Carolina,
however, did not include performance measures and the state is excluded from this analysis.
19
reports in just two states (Massachusetts and Tennessee). Other states that reported these
measures in 2010 continued to report them in 2011-2012.
4.
Performance Improvement Projects (PIPs) in 2011-2012 EQRO Technical Reports
Thirty of the 37 EQRO technical reports for the 2011-2012 reporting cycle included PIPs
specific to children or pregnant women. Among the states with these PIPs, the number of PIPs
for children or pregnant women varied (Table 14). For example, Puerto Rico had one applicable
PIP, while Florida had 30 PIPs focused on improving well-child care visit rates and 14 PIPs
focused on improving the quality of mental health care for institutionalized children. PIP topics,
target populations, and interventions and activities were generally specific to each MCO or PIHP
in a state, but 14 states mandated PIP topics or required MCOs or PIHPs to engage in
collaborative PIPs on priority health care topics. 54 For example, Michigan and New York
required all MCOs to implement PIPs to improve weight assessment and body mass index (BMI)
counseling. Florida required all 14 mental health PIHPs for institutionalized children under age
18 to engage in a collaborative PIP on reducing the use of seclusion and restraints during
institutional stays.
As in previous years, many states had PIPs targeting well-care visits for children and adolescents
(Figure 9). In the 2011-2012 reporting cycle, states also frequently reported PIPs on improving
prenatal and perinatal care, childhood immunization rates, and weight assessment and BMI
counseling. All 37 EQRO technical reports indicated that the EQR included validation of PIPs,
as required by 42 CFR 438.358.
There were some shifts in PIP topics between 2010 and 2011-2012 among the 30 states that
submitted reports for both years (Figure 10). Most notably, the number of states conducting
weight assessment/BMI PIPs increased from two states in 2010 to nine states in 2011-2012.
Conversely, fewer states reported well-child care and primary care access PIPs in the 2011-2012
reporting cycle. Some PIP topics implemented by similar numbers of states in 2010 and 20112012 had shifts in which states carried out these PIPs. For example, although eight states had
PIPs to improve childhood immunization rates in both 2010 and 2011-2012, only five of these
states had an immunization PIP in both years. 55 A pattern of frequent changes in PIP topics may
reflect changing health care needs and priorities in these states. Annual PIP changes, however,
may limit the potential for longer-term assessments of the effectiveness of PIP interventions
within these states.
54
States that mandated PIP topics for MCOs or PIHPs include Arizona, Colorado, Delaware, District of Columbia,
Florida, Georgia, Michigan, Minnesota, New Jersey, Ohio, Pennsylvania, Virginia, Washington, and West Virginia.
55
The five states with an immunization PIP in both years were Georgia, Nebraska, Nevada, New Mexico, and
Washington. The three states with an immunization PIP in 2010 (but not 2011) were Florida, Rhode Island, and
Wisconsin. The three states with an immunization PIP in 2011 (but not 2010) were Missouri, Virginia, and West
Virginia.
20
5.
Summary of EQRO Reporting for Selected PIP Topics
CMS conducted detailed abstractions of EQRO reporting on PIPs in four priority health topics:
weight assessment and BMI counseling, dental care, prenatal care, and adolescent well-care
(Appendix Tables G.2-5). Discussions of the EQRO findings on the performance, progress, and
limitations of each PIP differed greatly across reports. For example, EQROs assigned different
summary validation ratings, with different underlying scoring criteria, to PIPs. The
inconsistency of these rating scales limited comparisons of PIP performance across states.
Despite the variation in EQRO reporting on PIPs, some key patterns appeared across the four
selected PIP topics in the EQRO technical reports submitted during the 2011-2012 reporting
cycle:
• PIPs in each of the four selected topic areas assessed progress using measures similar
to the initial core set measures. PIPs for prenatal care often assessed the frequency
and timeliness of prenatal and postpartum care. Many weight assessment and BMI
PIPs used HEDIS weight documentation and counseling measures. Adolescent wellcare PIPs assessed progress on primary care access and rates of well-care visits.
Finally, dental PIPs assessed annual dental visit rates, which is similar to initial core
set measures on preventive and treatment dental visits.
• PIPs commonly engaged in interventions focused on member, community, and
provider outreach and education. These efforts varied greatly, but generally focused
on encouraging member adherence to recommended health behaviors and completion
of medical appointments and on encouraging providers to follow recommended care
guidelines. To a lesser extent, PIPs involved changes to care delivery, such as
implementing new programs targeted to improve specific aspects of care (for
example, new care management programs for high-risk pregnant women or new
fluoride varnish programs for children), expanding provider availability (for example,
by hiring new providers or working with existing providers to expand office hours or
implement mobile service units), and system-level changes (such as reviewing
medical record data to ensure that dental visits were being appropriately captured).
• The EQRO technical reports included some common recommendations for improving
PIPs. One was that MCOs should conduct additional analyses to identify specific
barriers to improvement in the target population. EQROs also frequently
recommended that MCOs more directly align PIP interventions to address barriers
and conduct targeted assessments to determine the effectiveness of each intervention
separately.
• Descriptions of PIPs in the EQRO technical reports frequently lacked key details.
Some EQRO technical reports contained little information about the PIPs and their
progress. For EQR summaries of PIPs to be most useful to states and CMS, the
reports should include the target population, performance measures, baseline and
post-intervention performance rates, descriptions of PIP interventions and activities,
assessments of the link between PIP activities and performance rate changes, and
recommendations and feedback for improving the PIP. The EQRO technical reports
that contained this level of detail were the most effective in conveying the relative
strengths and weaknesses of PIPs.
21
• Summaries of PIP validation ratings in EQRO technical reports often focus on
compliance with review criteria rather than assessing PIP achievements and linking
them to interventions. As a result, some PIPs received high validation ratings from
EQROs even though they did not achieve performance improvements. Compliance
with review criteria is an important factor for validation, but alone it is not a sufficient
criterion for high ratings. To improve, EQRO validation ratings should emphasize
successful improvements in performance on priority health goals as well as
compliance with protocols. EQRO assessments should encourage MCOs and PIHPs
to improve performance rates and health outcomes and link improvements to PIP
interventions.
To support continued improvement of EQRO technical reports, CMS revised external quality
review protocols in December 2011, and just received Office of Management and Budget (OMB)
approval for their use through September 30, 2015. 56 The revised protocols aim to standardize
and strengthen the level of detail in EQRO technical reports and the EQRO role in improving the
effectiveness of quality improvement activities in Medicaid and CHIP. The protocols reflect
updated standards and practices for quality review, emphasize alignment with the initial core set
measures, encourage alignment of performance measures and PIPs with state quality program
goals, and encourage EQROs to include information on health outcomes and trends in
performance measure and PIP data in the annual EQRO technical reports. Future reports will
continue to assess the progress of external quality review reporting and evidence of improving
the quality of health care for children in Medicaid and CHIP.
6.
Benchmark Benefit Plans
Benchmark benefit plans give states flexibility in offering some Medicaid-eligible individuals a
benefits package that is not necessarily comparable to the benefits available statewide through
Medicaid. Sections 1937 and 2103(b) of the Act identify types of health benefit packages that
qualify as benchmark benefit packages. There are no separate state reporting requirements for
benchmark plans other than the EQRO reporting process used for MCOs and PIHPs.
Currently, nine states, D.C., and 1 territory operate Medicaid benchmark plans (CT, DC, ID, KY,
KS, MN, VA, WA, WI, WV and GU). Four of the states (DC, MN, WI and WV) deliver care
through MCOs or PIHPs and thus require an external quality review. 57 The external quality
review reports for these four states do not separate out information related to the quality of
benchmark plans. Because this information is reported in the aggregate, which is allowable
under external quality review requirements, specific data are not available on the performance of
the benchmark plans in these states.
56
Revised EQR protocols are available for download at: https://www.cms.gov/Regulations-andGuidance/Legislation/PaperworkReductionActof1995/PRA-Listing-Items/CMS-R-305.html
57
Since the 2010 Secretary’s Report, three of these eleven states began contracting with Medicaid benchmark plans
(CT, DC, and MN).
22
As of December 2011, 19 states provided CHIP coverage through benchmark or benchmark
equivalent plans. Of those, 16 now deliver care through MCOs or PIHPs and thus require an
external quality review (CA, CO, DE, IA, IL, IN, KS, KY, MA, ND, NE, NJ, NY, PA, UT, and
WV). North Dakota uses managed care only for CHIP and is in the beginning stages of
reporting. The remaining states currently submit external quality review reports to CMS, but do
not separate out information related to the quality of CHIP benchmark plans. Because this
information is also reported in the aggregate, specific data are not available on the performance
of the CHIP benchmark plans in these states.
C. Consumer Experiences with Health Care
Consumer assessment of experiences with health care is another dimension of the quality of care,
reflecting an aspect of person-and family-centeredness of care. Section 402 of CHIPRA directs
state CHIP programs (Title XXI) to provide data regarding access to primary and specialty
services, access to networks of care, and care coordination provided under the state child health
plan, using quality and consumer satisfaction measures included in the Consumer Assessment of
Healthcare Providers and Systems (CAHPS®) Health Plan Survey.
Because state-level CAHPS data were not systematically reported in CARTS in FFY 2011,58
CMS obtained state-level CAHPS data from AHRQ’s National CAHPS Benchmarking
Database. Data from the CAHPS Child Medicaid Questionnaire were available for 2010 for 25
states, covering 88,694 respondents across 133 plans. The analysis spans several domains
covered by the Child Medicaid CAHPS survey, including parents’ global rating of their child’s
health care (1 item), experience getting needed care for their child (1 item), experience getting
care quickly (2 items), and how well the child’s doctor communicates (5 items and composite).
Table 15 presents state-level data for the 10 CAHPS Child Medicaid Questionnaire items
included in the analysis.
As shown in Figure 11, the percentage of parents rating their child’s overall health care a 9 or 10
(on a scale of 0 to 10) ranged from 54 percent in three states (Connecticut, Texas, and
Washington) to 68 percent in Delaware. As discussed in the 2011 Secretary’s Report, the overall
rating of health care for children covered by Medicaid was considerably higher than that for
Medicaid and commercially insured adults (state medians of 60 percent, 46 percent, and 49
percent, respectively). Nevertheless, these data suggest the need to better understand and address
those factors influencing parents’ ratings of their child’s health care in all states, but most
importantly, those below the median.
58
The CAHPS survey is one of the 24 initial core set measures and states were encouraged to report CAHPS data
into CARTS in FFY 2011. Overall, 22 states reported CAHPS data in FFY 2011, including 13 states that reported
they submitted a summary report to CMS and 9 states that reported they submitted raw data to the Agency for
Healthcare Research and Quality (AHRQ). More than half of these states (12) reported they included both Medicaid
and CHIP populations in their CAHPS measure, while 6 reported they included CHIP only, and the remaining 4
reported they included Medicaid only. Based on information provided by states in CARTS, of the 29 states not
reporting the measure in FFY 2011, 14 indicated they are in the process of planning for data collection in 2012 or
2013. Thus, the number of states reporting CAHPS data as part of the initial core set of children’s health care
quality measures is expected to increase in FFY 2012 and FFY 2013.
23
Figure 12 shows parents’ assessments of the ease of getting care for their child. The figure
shows medians across the 25 states for the percentage reporting “always” for each of the three
items. Parents were far more likely to indicate their child could always get care as soon as
needed for an illness or injury than for routine care (state medians are 76 percent and 65 percent,
respectively). Fewer than half of parents, on average, indicated that it was always easy to get an
appointment with a specialist (state median is 47 percent). Of the 10 measures included in this
analysis, parents’ assessment of the ease of getting a specialist appointment was by far the lowest
rated. As shown in Table 15, the state-level percentages ranged from 40 percent (California) to
61 percent (South Carolina), with the 25th and 75th percentiles at 45 percent and 55 percent,
respectively. These data suggest that ensuring access to specialty care is an area for ongoing
quality improvement by Medicaid and CHIP programs.
Most parents had favorable assessments of their child’s doctor’s communication with them as a
parent, but somewhat less favorable assessments of the doctor’s interactions with the child. As
shown in Figure 13, on average, 81 percent of parents said the child’s doctor always showed
respect for what the parent had to say, 78 percent said the doctor listened carefully to them as a
parent, and 77 percent said the child’s doctor explained things clearly to them as a parent.
Parents were less likely to indicate that the child’s doctor always explained things clearly to the
child (state median is 68 percent) or that the doctor spent enough time with the child (62
percent). Of the five items in the communications composite, the two with the largest gaps
across states related to parents’ experience with the amount of time the doctor spent with the
child and parents’ perception that the child’s doctor explained things clearly; in both cases, there
was a 22 percentage point disparity between the lowest and highest states, with Texas at the low
end on both measures, and West Virginia and South Carolina at the high end on both measures.
This analysis of state-level CAHPS data highlights the opportunities for improving the quality of
children’s health care across all states and dimensions. Three states (Delaware, South Carolina,
and West Virginia) were consistently in the top quartile across 9 or 10 measures, while three
states (California, New Jersey, and Texas) were consistently in the bottom quartile across 9 or 10
measures. Factors driving these differences across states are unknown at this time, but may be
related to variations in the Medicaid/CHIP delivery systems, provider participation in public
programs, or other program attributes.
In summary, most parents reported they could get care for their child when they needed it for an
illness or injury but less often for routine care or specialty care. Most parents also provided
favorable assessments of the doctor’s communication with the parent, but assessments of the
doctor’s interactions with the child were less favorable. Although the parents’ global assessment
of their child’s overall health care was higher than similar ratings for Medicaid and commercial
adults, the rate is still relatively low—60 percent, on average, gave a rating of 9 or 10—
suggesting substantial room for improvement, particularly in the states below the median. As the
Medicaid and CHIP programs strive to provide high-quality care, these results illustrate areas for
attention, particularly access to specialty care, timely routine care, and more “person-centered”
care that encourages doctors to explain things clearly to the child and to spend more time with
the child.
24
D. Use of Dental Services in Medicaid and CHIP
Because tooth decay remains the most common chronic childhood disease, children’s oral health
continues to be a primary focus of improvement efforts in both Medicaid and CHIP, through
which all enrolled children have dental coverage. And because children eligible for Medicaid
and CHIP have been shown to have an elevated risk for dental disease, 59 the potential for
positive impact increases as program enrollment continues its upward trend.
In the context of CMS’ Oral Health Initiative, announced in 2010, CMS is working with Federal
and state partners, the dental and medical provider communities, children’s advocates and other
stakeholders to improve children’s access to dental care, with an emphasis on early prevention. 60
CMS has set two improvement goals through the Initiative: (1) to increase by ten percentage
points the proportion of Medicaid and CHIP children ages 1 and older, enrolled continuously for
at least 90 days, who receive a preventive dental service; and (2) to increase by ten percentage
points the proportion of Medicaid and CHIP children ages 6 to 9, enrolled continuously for at
least 90 days, who receive a sealant on a permanent molar. For the first goal, baselines will be
set using FY 2011 data 61 and the goal year is FY 2015. The second goal will be phased in over
time as CMS and states gain experience in collecting data to track progress on the goal. In
addition to national baselines and goals, each state will have its own baselines and goals.
To improve the completeness and accuracy of the data being used to set baselines and to track
progress, CMS has initiated a data quality improvement process for the annual EPSDT report.
The FFY 2010 Form CMS-416 data were manually checked against a set of audit criteria
intended to identify possible reporting and arithmetic errors. Seventeen states were flagged on
one or more audit criteria on the “dental” lines of the form. States were notified of the results
and invited to submit corrected data. The audit process was repeated on the FFY 2011 Form
CMS-416 data using a new automated review process, and states were asked to resubmit
corrected data. The audit will be made a permanent part of the Form CMS-416 data submission
process.
State performance related to children’s access to dental care is also evaluated through the initial
core set of children’s quality measures. Two of the 24 measures in the initial core set focus on
oral health: total eligibles who received a preventive dental service (ages 1-20); and total
eligibles who received a dental treatment service (ages 1-20). These measures parallel the
reporting in lines 12b and 12c of the Form CMS-416 and the reporting required of separate CHIP
programs in Section G of CARTS.
Table 16 presents national and state level data on utilization of preventive dental services and
dental treatment services during FFY 2010 among children ages 1 to 20 enrolled in Medicaid and
59
http://www.nidcr.nih.gov/datastatistics/surgeongeneral/sgr/chap4.htm
60
The CMS Oral Health Strategy is available online at: http://www.medicaid.gov/Medicaid-CHIP-ProgramInformation/By-Topics/Quality-of-Care/Downloads/CMS-Oral-Health-Strategy.pdf
61
Baselines for separate CHIP programs will be set using FFY 2013 CARTS data.
25
Medicaid expansion programs. 62 The data are drawn from the Form CMS-416. Data are
reported for children who are eligible for EPSDT services and enrolled for at least 90 continuous
days, and for 50 states and the District of Columbia
Findings
• Nationwide, about 12.7 million children (41 percent of all children who met the
reporting criteria) received a preventive dental service paid by Medicaid in FFY
2010. Preventive dental services include dental cleanings and application of dental
sealants. The percentage of children who received a preventive dental service ranged
from a low of 7 percent in Idaho to a high of 58 percent in Vermont.
• Nationwide, more than 7 million children (23 percent of all children who met the
reporting criteria) received a dental treatment service paid by Medicaid in FFY 2010.
Dental treatment services include treatments to correct a problem, such as filling a
cavity in a tooth. The percentage of children who received a dental treatment service
ranged from a low of 5 percent in Idaho to a high of 50 percent in West Virginia.
While there are some concerns about the quality of the data, 63 there is sufficient confidence in
the data to say that vast differences persist between states in the utilization of dental care by
children enrolled in Medicaid (see Figures 14 and 15). One goal of the CMS Oral Health
Initiative is to share the lessons learned in the higher performing states with the lower
performing States in an effort to significantly improve utilization in the lower performing states.
A brief note is in order about any comparison between the FFY 2009 Form CMS-416 dental data
(as shown in the 2011 Secretary’s Report) and similar data from the FFY 2010 Form CMS-416
(as shown in this report). Because of several changes in the reporting methodology between
FFY 2009 and FFY 2010, the data are not directly comparable.
• Beginning in FFY 2010, CMS added four requests for dental information to the Form
CMS-416. One of the requests (line 12f – total eligibles receiving oral health services
provided by a non-dentist provider) asks states to report services performed by a
licensed practitioner who is not a dentist or who is not working under the supervision
of a dentist. For example, oral health risk assessments and application of fluoride
varnish, when performed by a physician or other medical provider, would be reported
on this line. Prior to FFY 2010, some states may have reported these same services
on line 12b, preventive dental services. The new reporting methodology could result
in a decline in the number of services reported on line 12b, but would not represent an
actual decline in the preventive services being provided to Medicaid children.
However, lines 12b and 12f cannot simply be aggregated because the same children
62
Data for separate CHIP programs will be reported in the 2013 Secretary’s report.
63
For example, the data for Idaho showed a decrease of more than 80 percent from FFY 2009 to FFY 2010; the data
for Kansas showed a decrease of more than 50 percent, and the data for Oregon showed a more than a 70 percent
decrease.
26
may be included in both categories and thus, would result in a duplicated count of
children receiving preventive services. 64
• Also in FFY 2010, CMS asked states to report the number of children enrolled for at
least 90 continuous days on line 1b. This number is being used as the denominator in
the calculation of percentages in this report, instead of the number of children
enrolled for any period as was used in the 2011 Secretary’s report. 65 This change
could result in a small upward shift in the percentage of children receiving services.
• Though states continue to report utilization figures for all children from birth to age
20 on the Form CMS-416, CMS has limited the age range in this year’s Report to
children ages 1 to 20, which coincides with the goal set in the CMS Oral Health
Initiative and is consistent with expectations of dental practice for children. This
change could result in a small upward shift in the percentage of children receiving
services.
E. State Spotlight: Arkansas
Arkansas reported 13 of the 24 children’s health care quality measures for FFY 2011, all of
which are part of the HEDIS measurement set (Appendix Table E.1). The state has calculated
HEDIS measures for more than 10 years and has established a claims data warehouse to support
quality measurement. The Medicaid/CHIP HEDIS results are publicly reported each year and
compared to rates from previous years as well as to national Medicaid HEDIS benchmarks. 66
The state contracts with an EQRO to calculate the rates and produce the report.
The state noted that several of its initial core set measures are underreported in CARTS. For
example, its immunization rate (Combo 3) is underreported because it is calculated based only
on claims data; the hybrid method produces a substantially higher rate. 67 Similarly, the BMI
assessment rate of 1.2 percent is substantially underreported in CARTS because school records
are not included. The state has a school-based obesity initiative in which each child’s BMI is
assessed by school nurses, tracked, and reported to parents.
Arkansas takes a “system-wide approach” to quality improvement (QI) in its Medicaid/CHIP
program. Children enrolled in Medicaid and CHIP are served through a Primary Care Case
Management (PCCM) program, and the state views the PCCM program as a health plan. All
children who enroll in ARKids First are required to choose a primary care provider (PCP) and a
dental provider. The ConnectCare program, operated by the Arkansas Department of Health
64
http://www.medicaid.gov/Medicaid-CHIP-Program-Information/By-Topics/Quality-of-Care/Downloads/TA1Dental.pdf
65
This change was recommended by the CMS Oral Health Technical Advisory Group (OTAG).
66
https://ardhs.sharepointsite.net/DMS%20Public/DMS%20Reports/HEDIS%20Measures/HSAG_HEDIS_2010.pdf
67
The childhood immunization rate (Combo 3) reported in CARTS for FFY 2011 was 32.8 percent for the
Medicaid/CHIP population combined. The state fiscal year 2009 rates reported in the state’s annual HEDIS report
were substantially higher--63.4 percent for ARKids First A (Medicaid) and 71.8 percent for ARKids First B (CHIP)-because the state used the hybrid method to calculate the rates.
27
under contract with the Arkansas Medicaid program, helps families choose a PCP and dental
provider for their children. To assess the performance of its health plan and providers, the state
conducts the CAHPS Health Plan Survey annually.
The state recognizes the importance of engaging providers in QI efforts and is working with
medical directors of large practices and federally-qualified health centers to identify ways each
site can improve quality. The state is using a data-driven approach with site-level report cards to
motivate provider participation in QI initiatives. One initiative is to ensure that practices provide
24/7 live-voice access to reduce emergency department use and improve continuity of care.
The state pursues a multi-pronged approach to increase well-child visit and immunization rates.
Because the state knows the medical home for each child, it notifies providers of patients that are
due for check-ups and immunizations. It also educates families on the schedule for well-child
care and immunizations. In addition, it offers immunizations at health fairs, schools, and clinics,
and offers incentives to providers and patients for completion of recommended care. The state
actively uses quality measures to drive these QI efforts and monitor their progress.
28
IV. STRENGTHENING QUALITY OF CARE THROUGH DEMONSTRATION GRANTS
AND PARTNERSHIPS
CMS continues to build a framework for measuring and improving the quality of care for
children in Medicaid/CHIP through the CHIPRA Quality Demonstration Grants, the AHRQCMS Pediatric Quality Measures Program, and its work with Federal partners who are also
working to improve children’s health care quality and measurement.
A. CHIPRA Quality Demonstration
On February 22, 2010, CMS awarded CHIPRA Quality Demonstration Grants to 10 states:
Colorado, Florida, Maine, Maryland, Massachusetts, North Carolina, Oregon, Pennsylvania,
South Carolina, and Utah. Including both single-state projects and multi-state collaborations, 18
states participate in this grant program. These projects, totaling grant awards of $100 million,
are now in their third funding year. Although each Grantee designed projects that covered a
broad range of quality improvement activities, section 1139A(d) of the Act outlines a specific set
of activities to be implemented by the demonstrations grants with the ultimate goal of evaluating
promising ideas for improving the quality of children’s health care under Medicaid or CHIP 68
(Table 17).
1.
Overview of Demonstration Grant Activities
As part of these multi-dimensional demonstrations, Grantees are testing and implementing
quality improvement activities aimed at supporting CMS’ focus on enhancing children’s health
care quality in the areas of EPSDT benefits, behavioral health, oral health, obesity prevention,
and care coordination.
• EPSDT: Half of the 18 participating states designed grant projects to specifically
target improvements on EPSDT rates. Most commonly, states listed improving
EPSDT data collection as a priority and are implementing ways of better collecting
and reporting the data by using a more automated or streamlined process. Other
states have incorporated EPSDT program requirements and reporting procedures into
learning collaboratives as a way to educate providers.
•
For example, the Maine/Vermont Demonstration implemented a learning
initiative focused on improving children’s preventive health care by
raising rates for: childhood immunizations, lead screening, healthy
weight, and oral health. As part of the project, Maine provides outreach,
education, monthly data collection, and quality improvement support to
68
The four specific set of activities were: (1) experiment with, and evaluate the use of new measures for quality of
Medicaid/CHIP children’s health care; (2) promote the use of Health Information Technology (HIT) for the delivery
of care for children covered by Medicaid/CHIP; (3) evaluate provider-based models which improve the delivery of
Medicaid/CHIP children's health care services; or (4) demonstrate the impact of the model Electronic Health Record
(EHR) format for children (developed and disseminated under section 1139A(f) of the Act on improving pediatric
health, and pediatric health care quality, as well as reducing health care costs).
29
primary care practices to improve rates of screening and other medically
necessary services available through the EPSDT benefit. Additionally,
the state coordinates with health systems and Federally Qualified Health
Centers to determine interface specifications in order to participate in the
automation and exchange of EPSDT data.
• Behavioral Health: A majority of the 18 state grant participants have committed,
through their grant activities, to improving access to and the quality of behavioral
health services for children. Grant activities underway include identification of
behavioral health measures, integration of physical services and behavioral health
services, implementation of screening tools to identify children in need of behavioral
health care, integration of tele-psychiatry services, and implementation of
wraparound behavioral health services.
•
South Carolina is focused on improving Attention Deficit Hyperactivity
Disorder (ADHD) outcomes, and has developed training and educational
materials including presentation packets, evidence-based discussion
points, and clinical training on ADHD. The State has also completed onsite visits to all 18 participating pediatric offices, which involved
individual educational meetings about ADHD with a total of 129
practitioners. Follow-up visits were also completed with 82 practitioners
reinforcing information provided during initial visits.
•
Wyoming, as part of a tri-state grant project with Maryland and Georgia,
is using a care management entity (CME) service delivery model to
improve psychotropic prescribing practices for youth and ensuring
appropriate psychotropic prescribing practices for 100 percent of youth
served by the CME. The state is using telehealth services to support
behavior/mental health assessments and screenings in order to ensure
adherence to state psychotropic medications prescribing patterns.
• Oral Health: Improving oral health is a critical clinical area across the
Demonstrations, with 11 of the 18 states focused on this area. Through their grants,
states have placed emphasis on measurement of oral health, developed oral health
toolkits and screening tools, partnered dental homes with medical homes, and
provided educational opportunities through learning collaboratives.
•
North Carolina has implemented several promising oral health initiatives
over the past year including the Priority Oral Health Risk Assessment and
Referral Tool (PORRT) which is being piloted in the CHIPRA Connect
practices. The state also established an Oral Health workgroup through
which members from the group provide training to primary care providers
on how to use PORRT, how to assess for oral health risk factors, and
when to make referrals.
•
South Carolina is using learning collaboratives to improve oral health
care for children and is focused on the following four activities:
performing and documenting an oral health risk assessment between 12
and 36 months; referring the patient to a dental home; applying fluoride
varnish to high risk patients between 12 and 36 months of age; and
30
discussing fluoride in the family’s drinking water source. Practices have
implemented changes including distributing infant tooth brushes,
providing oral health goody bags containing toothbrushes and education
materials; and using fluoride oral health-risk computer templates. The
Grantee has succeeded in almost doubling fluoride varnish administration
across the state.
• Obesity: Many of the Grantees are dedicated to improving obesity prevention
practices in primary care settings. Most commonly, states have focused on collecting
obesity-related (e.g., body-mass index) measures and developing quality
improvement plans based on these measures, including programs supporting obesity
screening and healthy weight promotion, a top priority. Two states are engaging
school based health centers in quality improvement projects focused on reducing
obesity.
•
•
West Virginia is in the process of designing an obesity project that will
use care coordinators to ensure that students screened in school-based
health centers and found to have a BMI at or above the 85th percentile
make and keep appointments with their primary care physician within the
coordinator’s practice.
Care Coordination: Nearly all (14) of the states participating in the Demonstrations
have incorporated some aspect of care coordination into their grant activities—much
of this work is focused on improving care coordination for children with special
health care needs. The types of activities range from implementation of health IT
solutions; employment of coordinators within primary care and subspecialty
practices, implementation of pre-visit questionnaires to target individuals in need of
additional services; evaluation of the impact of care coordination on structure, process
and outcomes; and the administration of surveys and focus groups in order to solicit
information from families about care currently received.
•
•
Illinois is focused on improving the referral process for early intervention
(EI) services by using health information technology to support
transferring information from the EI provider to the medical home, and
referral to and feedback from other community services for children not
eligible for EI services.
Pennsylvania is using information technology to support care
coordination and referrals by identifying children with developmental
delays, autism, ADHD/disruptive behavior, depression/suicide risk in
adolescents, and mothers with maternal depression. The Grantee is using
a pre-visit screening tool which is made available to parents prior to the
office visit to help detect children requiring additional special needs
referrals and treatment. Children identified by the screening tool are
electronically referred to specialists and, in the case of developmental
delay and autism, linked to the state’s early intervention network.
31
2.
National Evaluation of the CHIPRA Quality Demonstrations
With funding from CMS, AHRQ is working with a national evaluation team comprised of
Mathematica, AcademyHealth, and the Urban Institute to evaluate the CHIPRA Quality
Demonstration. The goals of the national evaluation are to determine the demonstration’s
effectiveness in improving the quality of health care provided to children in Medicaid and CHIP
and to assess if and how the demonstration increases transparency and consumer choice. With
the states transitioning from the planning stage to actual implementation of the projects, current
evaluation efforts are focused on gathering information about early implementation experiences,
lessons learned to date, and challenges encountered. By the end of August 2012, the national
evaluation team will have completed site visits to each of the 18 states participating in the
demonstration program.
A few observations stand out from initial site visits. First, the scope and intent of the states’
demonstration projects vary even more widely than states’ final operational plans suggested they
would. For example, some states are implementing pilot projects to promote patient-centered
medical homes for children with the intention of eventually broadening their efforts statewide.
Others are expanding on previous efforts to build a statewide data infrastructure that improves
coordination of care by helping doctors and other health care providers share information more
effectively. Site visits have also indicated that certain factors have had important implications
for early implementation. For example, multi-state partnerships are providing important
opportunities for learning and collaboration. Some states reported that leadership changes and
budget or hiring constraints have been obstacles to program implementation.
In the coming year, the national evaluation team will begin producing reports and issue briefs on
findings from the initial site visits and other data sources. In addition, the team is finalizing
plans for gathering survey data directly from child-serving physicians and parents about their
perceptions of quality initiatives in selected demonstration states. More information about the
progress of the national evaluation, as well as findings from both the national and granteespecific evaluation efforts, can be found on the following webpage:
http://www.ahrq.gov/chipra/demoeval.
3.
Model Children’s Electronic Health Record Format
As part of the Quality Demonstrations, two Grantees (North Carolina and Pennsylvania) were
selected to demonstrate the impact of the model Electronic Health Record (EHR) format for
children. The development and dissemination of the model EHR format (the Format) is required
under section 1139A(f) of the Act. In 2010, AHRQ, working in collaboration with CMS,
awarded a $5 million contract to Westat to develop a model children’s electronic health record
format. Two Grantees, North Carolina and Pennsylvania, will put the model format into practice
and evaluate the impact of the model EHR format over the next two years.
The overall goals of the Format, as required by section 1139A(f) of the Act, are to improve
pediatric health, enhance pediatric health care quality, and reduce health care costs. The
legislation specified that the model children’s EHR format should be: (1) accessible to caregivers
for school and leisure compliance; (2) designed to allow interoperable exchanges; (3) compatible
with other EHR standards; and (4) usable by caregivers to assure care appropriateness and
quality. The Format will take into account a variety of topics including growth data, medication
32
management, birth information, and EPSDT requirements. CMS and a variety of other
stakeholders including other federal agencies, physician informaticians, non-physician clinicians,
children’s advocacy organizations, and vendors have provided guidance and served as resources
for this project.
The first phase of the work on the Format was completed in Spring 2012. This work resulted in
a Format that is comprised of a set of requirements containing child-specific items (or items of
special importance for children) that identify the incremental functionality (beyond what is
needed for adults) that an EHR should have to meet the particular needs of children. The Format
expands upon the hierarchy created by HL7® 69 for the EHR-S Functional Model and
incorporates the HL7 Child Health Functional Profile. Work on the Format will continue over
the next several years with the goal of creating a Format that can be valuable to various
audiences, including developers of EHR software who want to ensure their systems optimally
address the needs of children; purchasers of software to enable them to assess the degree to
which EHR systems support the care of children; child health advocates who want to influence
the future development of products for children; and standards and certification organizations
that could leverage selected requirements to specify best practices or certification criteria.
B. AHRQ-CMS Pediatric Quality Measures Program
In addition to the Quality Demonstrations, CHIPRA also called for the development of a
Pediatric Quality Measures Program (PQMP) to address the need for improved core measures
and for the development of new measures. The PQMP, required by section 1139A(b)(1) of the
Act, is designed to “(A) improve and strengthen the initial core child health quality measures
established by the Secretary…; (B) expand on existing pediatric quality measures used by public
and private health care purchasers and advance the development of such new and emerging
quality measures; and (C) increase the portfolio of evidence-based, consensus pediatric quality
measures available to public and private purchasers of children’s health care services, providers,
and consumers.”
The PQMP was launched in early 2011. As part of the PQMP, AHRQ and CMS are working
with seven Centers of Excellence to develop new measures and refine the core measures as
necessary. The Centers of Excellence are a cohort of entities with expertise in health care quality
measurement specific to the needs of children and their health care delivery system and include
collaborations of academic institutions, children’s hospitals, and measurement experts (Table
18). 70 In addition, two of the Quality Demonstration Grantees that are developing new measures
related to children’s health care quality (Illinois and Massachusetts) participate in the activities
of the PQMP. In the past year, the Centers of Excellence have participated in a collaborative
learning environment through the use of work groups addressing varying types of measurementrelated topics including: results aggregation; race/ethnicity/socio-economic status; and
informatics.
69
Information on Health Level Seven International (HL7) can be found at:
http://www.hl7.org/about/index.cfm?ref=common
70
Information on the Centers of Excellence can be found at: http://www.ahrq.gov/chipra/pqmpfact.htm
33
C. Coordination with HHS Quality Partners
CMS collaborates with and leverages the ongoing work of other HHS agencies focused on
improving the quality of child health, including the Administration on Children and Families
(ACF), the Centers for Disease Control and Prevention (CDC), the Health Resources and
Services Administration (HRSA), the Office of the National Coordinator for Health Information
Technology (ONC), and AHRQ.
CMS is continuing its work with HRSA and the CDC in a number of areas. HRSA’s Maternal
and Child Health (MCH) Bureau and the Office of Strategic Priorities are key CMS partners on
oral health. The CDC has helped CMS explore possible ways to improve the accuracy of data
reflecting dental care provided to children enrolled in Medicaid and CHIP. CMS has also begun
to identify synergistic efforts with the Indian Health Service, which has an early childhood caries
initiative. HRSA’s MCH Bureau and CDC are key partners for CMS efforts to improve maternal
and infant health outcomes.
In addition, CMS works with CDC and other partners on other initiatives including obesity,
immunizations, and lead screening. In the area of childhood obesity, CMS provides technical
assistance and participates on the departmental Steering Committee that CDC established to
support the CHIPRA-required childhood obesity demonstration grants. CMS continues to work
closely with CDC on the Vaccines for Children program, and serves as an ex officio member of
the Advisory Committee on Immunization Practices. Further, CMS participated in the
department’s 2011/12 Flu Campaign and is part of the 2012 Adult Immunization Steering
Committee. Both activities are directed by the Office of the Assistant Secretary for Health. In
the area of lead screening, CMS continues to work closely with CDC and ACF, as well as serves
as an ex officio member of the Advisory Committee on Childhood Lead Poisoning Prevention.
CMS’ partnership with AHRQ on the initial and improved core measure set for children, the
Pediatric Quality Measures Program, and the model Electronic Health Record format for
children’s care were noted earlier. CMS also partners with ONC to develop children’s health
care quality measures and to electronically specify the initial core set of children’s health care
quality measures.
Last Spring, the Obama Administration launched the Partnership for Patients, a new publicprivate partnership designed to improve the quality and safety of health care for all Americans. 71
CMS is working to engage with State Medicaid/CHIP agencies in Partnership activities as well
as in implementing non-payment policies for provider preventable conditions and collecting the
children’s core quality measure related to patient safety.
71
http://www.healthcare.gov/center/programs/partnership
34
V. SUMMARY AND CONCLUSION
The 2012 Secretary’s Report on the Quality of Care for Children in Medicaid and CHIP
documents the substantial progress made by HHS and states in building a solid foundation for
quality measurement and improvement in Medicaid/CHIP. Nearly all states (48 states and D.C.)
reported one or more of the core set of children’s health care quality measures for FFY 2011, and
more than half of these states reported data on twelve or more measures. Both the number of
states reporting and the number of measures reported by states reflect progress over last year.
Although there remains some variation in the populations included, 32 states and D.C. provided
data on both Medicaid and CHIP enrollees for FFY 2011, up from 22 states and D.C. for FFY
2010. Additionally, CMS’ detailed review of improvement projects summarized in the EQRO
technical reports from the 2011 reporting cycle identified the many state-initiated efforts
underway to improve the quality of care for children enrolled in Medicaid managed care
organizations.
This report provides evidence that, across all states, Medicaid and CHIP provide an important
source of access to primary care and other services for children. Particularly encouraging were
findings about patient experiences with the health care system; most parents had a favorable
assessment of their ability to get care when their child was ill or injured, even though they were
somewhat less confident about their ability to get routine or specialty care. The report also
highlights opportunities to improve care for children, including their use of preventive dental
services and receipt of well-child visits, and the need to do a better job on the content of the
clinical care provided (as measured by immunization rates, Chlamydia screening rates, and
appropriate testing for pharyngitis).
To assist states in further improving the completeness and consistency of their reporting and their
performance, CMS has undertaken several efforts including: (1) continuing the Quality Measures
Technical Assistance and Analytic Support Program; (2) convening states and other stakeholders
for a two-day conference in June 2012 to highlight CMS priority initiatives and provide technical
assistance and resources for Medicaid and CHIP quality measurement; (3) providing better
oversight and monitoring of data submitted on the annual EPSDT report; (4) better aligning
quality measurement and reporting efforts across Medicaid/CHIP-related activities (i.e.,
children’s core measure set, EPSDT, EQROs, and TMSIS); and (5) launching two nationwide
improvement initiatives – one on perinatal health and the other on oral health. With access to
data on a comprehensive set of performance measures and efforts underway to improve the
stability of coverage for children in Medicaid/CHIP, HHS now has a greater capacity to work
toward its goal of achieving a first-class system of coverage and care for all children enrolled in
Medicaid/CHIP.
35
This page has been left blank for double-sided copying.
36
TABLES
1
Number and Percent of Children Enrolled in Medicaid or CHIP by State
and Service Delivery Type, FFY 2011 ...........................................................................1
2
Initial Core Set of Children’s Health Care Quality Measures for Medicaid
and CHIP .........................................................................................................................3
3
Frequency of State Reporting of the Initial Core Set of Medicaid/CHIP
Children’s Health Care Quality Measures and Reasons for Not Reporting,
FFY 2011 ........................................................................................................................6
4
Number of States Reporting Deviations from the Measure Specifications in
Their Calculation of the Initial Core Set of Medicaid/CHIP Children’s
Health Care Quality Measures, FFY 2011 ......................................................................8
5
Change in the Number of States Reporting the Initial Core Set of
Medicaid/CHIP Children’s Health Care Quality Measures, FFY 2010–2011 ..............10
6
Changes in State Reporting of the Initial Core Set of Medicaid/CHIP
Children’s Health Care Quality Measures, FFY 2010–2011 ........................................11
7
Performance Rates on Frequently Reported Medicaid/CHIP Children’s
Health Care Quality Measures in FFY 2011 CARTS Reports .....................................13
8
Changes in Performance Rates on Frequently Reported Medicaid/CHIP
Children’s Health Care Quality Measures as Reported by States in Their
FFY 2010 and FFY 2011 CARTS Reports ...................................................................14
9
Percentage of Children Receiving Well-Child Visits in the 3rd, 4th, 5th,
and 6th Years of Life as Reported by States in Their FFY 2010 and FFY
2011 CARTS Reports ...................................................................................................15
10
Comparison of Median Rates for State Medicaid/CHIP Programs and
Commercial Health Plans for Frequently Reported Children’s Health Care
Quality Measures, FFY 2011 ........................................................................................17
11
Managed Care Plans Covering Children or Pregnant Women Included in
External Quality Review Organization (EQRO) Technical Reports, 20112012 Reporting Cycle ...................................................................................................18
12
Types of Performance Measures Evaluating Children or Pregnant Women
Included in External Quality Review Organization (EQRO) Technical
Reports, 2011-2012 Reporting Cycle............................................................................20
13
Reporting of Performance Rates for Measures Included in External Quality
Review Organization (EQRO) Technical Reports, 2011-2012 Reporting
Cycle .............................................................................................................................22
14
Performance Improvement Projects (PIPs) Targeting Children or Pregnant
Women Included in External Quality Review Organization (EQRO)
Technical Reports, 2011-2012 Reporting Cycle ...........................................................24
15
Overview of State-Level Reporting on Selected Child Medicaid CAHPS
Measures, 25 States, 2010 .............................................................................................26
16
Percentage and Number of Eligible Children Age 1-20, Enrolled for at
Least 90 Continuous Days, Who Received Preventive Dental Services and
Dental Treatment Services in FFY 2010 .......................................................................27
17
Summary of CHIPRA Quality Demonstrations ............................................................29
18
Examples of Measurement Topics being Addressed by the Centers of
Excellence (COE)..........................................................................................................31
Table 1. Number and Percent of Children Enrolled in Medicaid or CHIP by State and Service Delivery Type, FFY 2011
State
Managed Care
Fee-for-Service
Primary Care Case Management
Total
48,284
0
870,220
0
4,734,916
5%
0%
90%
0%
75%
109,255
92,073
96,800
514,295
1,593,931
11%
100%
10%
100%
25%
817,810
0
0
0
0
84%
0%
0%
0%
0%
975,349
92,073
967,020
514,295
6,328,847
Colorado
Connecticut
Delaware
District of Columbia
Florida
145,583
303,063
99,098
103,993
1,410,206
26%
94%
91%
90%
58%
401,191
18,554
5,680
11,182
385,328
72%
6%
5%
10%
16%
12,200
0
4,168
0
655,258
2%
0%
4%
0%
27%
558,974
321,617
108,946
115,175
2,450,792
Georgia
Hawaii
Idaho
Illinois
Indiana
1,214,145
150,440
0
159,473
752,019
86%
88%
0%
6%
88%
200,567
20,294
167
871,452
104,493
14%
12%
0%
35%
12%
2,162
0
220,686
1,484,910
9
0%
0%
100%
59%
0%
1,416,874
170,734
220,853
2,515,835
856,521
54,114
225,980
143,986
0
0
14%
82%
26%
0%
0%
127,174
40,316
99,985
144,101
45,101
33%
15%
18%
17%
26%
200,003
9,838
319,250
679,954
130,824
52%
4%
57%
83%
74%
381,291
276,134
563,221
824,055
175,925
568,302
311,723
1,230,329
376,455
120,772
97%
48%
95%
75%
22%
17,013
183,179
58,124
123,515
438,881
3%
28%
5%
25%
78%
0
150,399
0
0
0
0%
23%
0%
0%
0%
585,315
645,301
1,288,453
499,970
559,653
Missouri
Montana
Nebraska
Nevada
New Hampshire
396,701
0
110,306
201,990
10,217
60%
0%
50%
76%
10%
263,326
24,389
108,823
64,130
97,209
40%
24%
50%
24%
90%
0
76,490
0
0
0
0%
76%
0%
0%
0%
660,027
100,879
219,129
266,120
107,426
New Jersey
New Mexico
777,898
315,558
93%
81%
60,149
74,450
7%
19%
0
0
0%
0%
838,047
390,008
1
Alabama
Alaska
Arizona
Arkansas
California
Iowa
Kansas
Kentucky
Louisiana
Mainea
Maryland
Massachusetts
Michigan
Minnesota
Mississippi
Table 1 (continued)
State
New York
North Carolina
North Dakota
Managed Care
2,310,024
86%
0
0%
0
0%
Fee-for-Service
366,366
14%
287,079
20%
9,970
18%
Ohio
Oklahoma
Oregon
Pennsylvania
Rhode Island
1,232,187
551,867
420,434
1,233,786
125,395
82%
88%
85%
78%
93%
262,750
76,012
75,028
83,831
9,628
18%
12%
15%
5%
7%
0
0
1,834
254,917
0
0%
0%
0%
16%
0%
1,494,937
627,879
497,296
1,572,534
135,023
South Carolina
South Dakota
Tennessee
Texas
Utah
314,389
0
822,544
3,128,586
233,339
55%
0%
93%
70%
76%
157,725
14,319
0
303,738
52,660
28%
22%
0%
7%
17%
100,995
49,773
65,786
1,011,701
20,997
18%
78%
7%
23%
7%
573,109
64,092
888,330
4,444,025
306,996
0
610,826
636,652
199,758
591,912
8,586
0%
76%
79%
70%
83%
13%
14,244
149,082
166,486
77,984
117,632
59,142
18%
18%
21%
27%
17%
87%
65,636
47,658
4,888
9,092
0
0
82%
6%
1%
3%
0%
0%
79,880
807,566
808,026
286,834
709,544
67,728
27,256,056
63%
8,678,803
20%
7,605,246
17%
43,540,105
2
Vermont
Virginia
Washington
West Virginia
Wisconsin
Wyoming
National Totals
Primary Care Case Management
0
0%
1,162,380
80%
45,628
82%
Total
2,676,390
1,449,459
55,598
Source:
CMS analysis of CHIP Statistical Enrollment Data System (SEDS) as of July 10, 2012.
Note:
Managed care is defined in this context as a system in which the state contracts with health maintenance organizations (HMOs) to provide a
comprehensive set of services on a prepaid capitated risk basis. Enrollees choose a plan and a primary care provider (PCP), who will be responsible
for managing their care. A child is counted in the managed care category if managed care was the last system in which he or she was covered for
basic services during the quarter.
a
FFY 2011 data for Maine are unavailable; FFY 2010 data were used in this table.
Table 2. Initial Core Set of Children’s Health Care Quality Measures for Medicaid and CHIP
3
Category
Measure
Measure Steward
Description
Data Source
Prevention and
Health
Promotion
1. Timeliness of Prenatal
Care
National Center for Quality
Assurance
(NCQA)/Healthcare
Effectiveness Data and
Information Set (HEDIS)
Percentage of deliveries of live births between November 6 of the year
prior to the measurement year and November 5 of the measurement year
that received a prenatal care visit in the first trimester or within 42 days
of enrollment
Administrative or
hybrid
2. Frequency of Ongoing
Prenatal Care
NCQA/HEDIS
Percentage of deliveries between November 6 of the year prior to the
measurement year and November 5 of the measurement year that
received the following number of expected prenatal visits:
< 21 percent of expected visits
21 percent – 40 percent of expected visits
41 percent – 60 percent of expected visits
61 percent – 80 percent of expected visits
≥ 81 percent of expected visits
Administrative or
hybrid
3. Percentage of Live
Births Weighing Less
Than 2,500 Grams
Centers for Disease Control
and Prevention (CDC)
Percentage of live births that weighed less than 2,500 grams in the state
during the reporting period
State vital records
4. Cesarean Rate for
Nulliparous Singleton
Vertex
California Maternal Quality
Care Collaborative
Percentage of women that had a cesarean section among women with
first live singleton births (also known as nulliparous term singleton vertex
[NTSV] births) at 37 weeks of gestation or later
State vital records
alone or merged
with discharge
diagnosis data
5. Childhood
Immunization Status
NCQA/HEDIS
Percentage of children that turned 2 years old during the measurement
year and had specific vaccines by their second birthday
Administrative or
hybrid
6. Adolescent
Immunization Status
NCQA/HEDIS
Percentage of adolescents that turned 13 years old during the
measurement year and had specific vaccines by their 13th birthday
Administrative or
hybrid
7. Body Mass Index
Assessment for Children/
Adolescents
NCQA/HEDIS
Percentage of children ages 3 to 17 that had an outpatient visit with a
PCP or OB/GYN and whose weight is classified based on body mass
index percentile for age and gender
Administrative or
hybrid
8. Developmental
Screening In the First
Three Years of Life
Child and Adolescent Health
Measurement Initiative
(CAHMI) and NCQA
Percentage of children screened for risk of developmental, behavioral,
and social delays using a standardized screening tool in the 12 months
preceding their first, second, or third birthday
Administrative or
hybrid
9. Chlamydia Screening
NCQA/HEDIS
Percentage of women ages 16 to 20 that were identified as sexually active
and had at least one test for Chlamydia during the measurement year
Administrative
10. Well-Child Visits in
the First 15 Months of
Life
NCQA/HEDIS
Percentage of children that turned 15 months old during the measurement
year and had zero, one, two, three, four, five, or six or more well-child
visits with a primary care practitioner (PCP) during their first 15 months
of life
Administrative or
hybrid
Table 2 (continued)
Category
Availability
Measure
Measure Steward
Description
Data Source
11. Well-Child Visits in
the 3rd, 4th, 5th, and 6th
Years of Life
NCQA/HEDIS
Percentage of children ages 3 to 6 that had one or more well-child visits
with a primary care practitioner during the measurement year
Administrative or
hybrid
12. Adolescent Well-Care
Visits
NCQA/HEDIS
Percentage of adolescents ages 12 to 21 that had at least one
comprehensive well-care visit with a primary care practitioner or an
obstetrical/gynecological (OB/GYN) practitioner during the measurement
year
Administrative or
hybrid
13. Percentage of Eligibles
That Received Preventive
Dental Services
Centers for Medicare &
Medicaid Services (CMS)
Percentage of individuals ages 1 to 20 eligible for Medicaid or CHIP
Medicaid Expansion programs (that is, individuals eligible for EPSDT
services) that received preventive dental services
Administrative
14. Child and Adolescent
Access to Primary Care
Practitioners
NCQA/HEDIS
Percentage of children and adolescents ages 12 months to 19 years that
had a visit with a primary care practitioner (PCP), including four separate
percentages:
Administrative
4
Management of
Acute
Conditions
•
Children ages 12 to 24 months and 25 months to 6 years who had a
visit with a PCP during the measurement year
•
Children ages 7 to 11 years and adolescents ages 12 to 19 years who
had a visit with a PCP during the measurement year or the year prior
to the measurement year
15. Appropriate Testing
for Children with
Pharyngitis
NCQA/HEDIS
Percentage of children ages 2 to 18 that were diagnosed with pharyngitis,
dispensed an antibiotic, and received a group A streptococcus test for the
episode
Administrative
16. Otitis Media with
Effusion (OME) –
Avoidance of
Inappropriate Use of
Systemic Antimicrobials
in Children
American Medical
Association/ Physician
Consortium for Performance
Improvement (PCPI)
Percentage of children ages 2 months to 12 years with a diagnosis of
otitis media with effusion (OME) that were not prescribed systemic
antimicrobials
Administrative or
electronic health
record (EHR
17. Percentage of Eligibles
that Received Dental
Treatment Services
CMS
Percentage of individuals ages 1 to 20 eligible for Medicaid or CHIP
Medicaid Expansion programs (that is, individuals eligible for EPSDT
services) that received dental treatment services
Administrative
18. Ambulatory Care –
Emergency Department
(ED) Visits
NCQA/HEDIS
Rate of ED visits per 1,000 member months among children up to age 19
Administrative
Table 2 (continued)
Category
Management of
Chronic
Conditions
5
Family
Experiences of
Care
Note:
Measure
Measure Steward
Description
Data Source
19. Pediatric Central LineAssociated Blood Stream
Infections – Neonatal
Intensive Care Unit and
Pediatric Intensive Care
Unit
CDC
Rate of central line-associated blood stream infections (CLABSI) in the
pediatric and neonatal intensive care units during periods selected for
surveillance
National
Healthcare Safety
Network (NHSN)
20. Annual Percentage of
Asthma Patients with One
or More Asthma-Related
Emergency Room Visits
Alabama Medicaid
Percentage of children ages 2 to 20 diagnosed with asthma during the
measurement year with one or more asthma-related emergency room
(ER) visits
Administrative
21. Follow-Up Care for
Children Prescribed
Attention Deficit
Hyperactivity Disorder
(ADHD) Medication
NCQA/HEDIS
Percentage of children newly prescribed ADHD medication that had at
least three follow-up care visits within a 10-month period, one of which
was within 30 days from the time the first ADHD medication was
dispensed, including two rates: one for the initiation phase and one for
the continuation and maintenance phase
Administrative
22. Annual Pediatric
Hemoglobin A1C Testing
NCQA
Percentage of children ages 5 to 17 with diabetes (type 1 and type 2) that
had a Hemoglobin A1c (HbA1c) test during the measurement year
Administrative or
hybrid
23. Follow-Up After
Hospitalization for Mental
Illness
NCQA/HEDIS
Percentage of discharges for children ages 6 to 20 that were hospitalized
for treatment of selected mental health disorders and who had an
outpatient visit, an intensive outpatient encounter, or partial
hospitalization with a mental health practitioner within 7 days of
discharge and within 30 days of discharge
Administrative
24. Consumer Assessment
of Healthcare Providers
and Systems® (CAHPS)
NCQA/HEDIS
Survey on parents’ experiences with their children’s care
Survey
The measure steward is the organization responsible for maintaining a particular measure or measure set. Responsibilities of the measure steward include updating
the codes that are tied to technical specifications and adjusting measures as the clinical evidence changes. Starting in FFY 2012, data for the CLABSI measure will
be obtained from the National Healthcare Safety Network.
Table 3. Frequency of State Reporting of the Initial Core Set of Medicaid/CHIP Children’s Health Care Quality Measures and Reasons for Not Reporting, FFY
2011
Reasons for Not Reporting
Measure
Number
of States
Reporting
Number of
States Not
Reporting
Data Not
Available
Population
Not
Covered
Sample
Size Too
Small
Other
Not
Specified
6
Well-Child Visits in the 3rd, 4th, 5th, and 6th Years of Life (#11)
Well-Child Visits in the First 15 Months of Life (#10)
Child and Adolescent Access to Primary Care Practitioners (#14)
Adolescent Well-Care Visits (#12)
Percentage of Eligibles That Received Preventive Dental Services (#13)
48
46
44
43
37
3
5
7
8
14
0
0
2
2
6
0
0
0
1
1
0
2
0
0
0
0
1
2
2
4
3
2
3
3
3
Percentage of Eligibles That Received Dental Treatment Services (#17)
Chlamydia Screening (#9)
Childhood Immunization Status (#5)
Appropriate Testing for Children with Pharyngitis (#15)
Ambulatory Care: Emergency Department Visits (#18)
35
32
30
28
27
16
19
21
23
24
2
12
10
13
11
2
0
0
0
0
0
0
1
0
0
4
5
8
8
10
3
2
2
3
3
Adolescent Immunization Status (#6)
Timeliness of Prenatal Care (#1)
Follow-Up Care for Children Prescribed Attention-Deficit Hyperactivity
Disorder (ADHD) Medication (#21)
Follow-Up After Hospitalization for Mental Illness (#23)
Consumer Assessment of Healthcare Providers and Systems (CAHPS®)
Health Plan Survey (#24)
25
24
24
26
27
27
15
13
18
0
3
1
0
4
1
9
6
4
2
2
3
24
22
27
29
15
16
1
2
1
0
7
8
3
3
18
18
14
33
33
37
18
19
21
3
1
1
3
2
0
8
9
12
2
2
3
11
10
40
41
23
21
4
3
2
1
9
14
2
3
7
5
3
44
46
48
28
22
30
0
4
1
1
2
1
13
16
16
2
2
3
1
50
31
2
1
13
3
Frequency of Ongoing Prenatal Care (#2)
Body Mass Index Assessment for Children and Adolescents (#7)
Annual Percentage of Asthma Patients with 1 or More Asthma-Related
Emergency Room Visits (#20)
Percentage of Live Births Weighing Less than 2,500 Grams (#3)
Annual Pediatric Hemoglobin A1C Testing (#22)
Developmental Screening in the First Three Years of Life (#8)
Cesarean Rate for Nulliparous Singleton Vertex (#4)
Otitis Media with Effusion – Avoidance of Inappropriate Use of
Systemic Antimicrobials in Children (#16)
Pediatric Central-Line Associated Blood Stream Infections – NICU and
PICU (#19)
Table 3 (continued)
Source:
Mathematica analysis of FFY 2011 CARTS reports as of June 20, 2012.
Note:
Wisconsin did not submit a CARTS report for FFY 2011. Delaware submitted an FFY 2011 CARTS report but did not submit data on any of the
initial core set of children’s health care quality measures. For the eight states that submitted separate data for their Medicaid and CHIP programs
(Colorado, Iowa, Kentucky, Michigan, New York, Pennsylvania, Tennessee, and West Virginia), the state was counted as reporting a measure if
either report included data for that measure.
7
Table 4. Number of States Reporting Deviations from the Measure Specifications in Their Calculation of the Initial Core Set of Medicaid/CHIP Children’s
Health Care Quality Measures, FFY 2011
Deviations from Measure Specifications
Number
of States
Reporting
Measure
Number of States
Reporting
Deviations from
Measure
Specificationsb
Year
of
Data
Data
Source
Numerator
Denominator
Other
Well-Child Visits in the 3rd, 4th, 5th, and 6th Years of Life (#11)
Well-Child Visits in the First 15 Months of Life (#10)
Child and Adolescent Access to Primary Care Practitioners (#14)
Adolescent Well-Care Visits (#12)
Percentage of Eligibles That Received Preventive Dental Services
(#13)
48
46
44
43
37
5
6
4
7
4
2
3
2
2
2
1
1
0
1
1
0
0
0
0
0
1
1
1
2
1
1
2
1
2
0
Percentage of Eligibles That Received Dental Treatment Services
(#17)
Chlamydia Screening (#9)
Childhood Immunization Status (#5)
Appropriate Testing for Children with Pharyngitis (#15)
Ambulatory Care: Emergency Department Visits (#18)
35
3
2
0
0
1
0
32
30
28
27
5
4
1
2
1
1
0
1
1
2
0
1
0
2
1
0
1
0
0
0
2
0
0
0
Adolescent Immunization Status (#6)
Timeliness of Prenatal Care (#1)
Follow-Up Care for Children Prescribed Attention-Deficit
Hyperactivity Disorder (ADHD) Medication (#21)
Follow-Up After Hospitalization for Mental Illness (#23)
Frequency of Ongoing Prenatal Care (#2)
25
24
24
0
2
1
0
0
0
0
0
1
0
1
0
0
0
0
0
1
0
24
18
1
4
0
1
1
2
0
2
0
2
0
1
Body Mass Index Assessment for Children and Adolescents (#7)
Annual Percentage of Asthma Patients with 1 or More AsthmaRelated Emergency Room Visits (#20)
Percentage of Live Births Weighing Less than 2,500 Grams (#3)
Annual Pediatric Hemoglobin A1C Testing (#22)
Developmental Screening in the First Three Years of Life (#8)
18
14
0
1
0
0
0
0
0
0
0
0
0
1
11
10
7
2
2
2
0
1
0
2
0
0
0
1
1
0
1
1
0
0
0
5
3
1
0
0
0
1
0
0
0
0
0
0
0
1
0
0
0
0
0
0
Measurea
8
Cesarean Rate for Nulliparous Singleton Vertex (#4)
Otitis Media with Effusion – Avoidance of Inappropriate Use of
Systemic Antimicrobials in Children (#16)
Pediatric Central-Line Associated Blood Stream Infections – NICU
and PICU (#19)
Table 4 (continued)
Source:
Mathematica analysis of FFY 2011 CARTS reports as of June 20, 2012.
Note:
Wisconsin did not submit a CARTS report for FFY 2011. Delaware submitted an FFY 2011 CARTS report but did not submit data on any of the
initial core set of children’s health care quality measures. For the eight states that submitted separate data for their Medicaid and CHIP programs
(Colorado, Iowa, Kentucky, Michigan, New York, Pennsylvania, Tennessee, and West Virginia), the state was counted as reporting a measure if
either report included data for that measure.
a
Because states were not asked to report deviations from measure specifications for the CAHPS measure in their FFY 2011 CAHPS report, this measure is
excluded from the table.
b
States may have reported more than one deviation from the measure specification for a measure; therefore the number of deviations may sum to more than the
number of states reporting a deviation.
9
Table 5. Change in the Number of States Reporting the Initial Core Set of Medicaid/CHIP Children’s Health Care Quality Measures, FFY 2010–2011
Number of States
Reporting in FFY
2010
Number of States
Reporting in FFY
2011
Well-Child Visits in the 3rd, 4th, 5th, and 6th Years of Life (#11)
Well-Child Visits in the First 15 Months of Life (#10)
Child and Adolescent Access to Primary Care Practitioners (#14)
Adolescent Well-Care Visits (#12)
Percentage of Eligibles That Received Preventive Dental Services (#13)
42
40
40
29
22
48
46
44
43
37
6
6
4
14
15
Percentage of Eligibles That Received Dental Treatment Services (#17)
Chlamydia Screening (#9)
Childhood Immunization Status (#5)
Appropriate Testing for Children with Pharyngitis (#15)
Ambulatory Care: Emergency Department Visits (#18)
19
21
20
20
15
35
32
30
28
27
16
11
10
8
12
Adolescent Immunization Status (#6)
Timeliness of Prenatal Care (#1)
Follow-Up Care for Children Prescribed Attention-Deficit Hyperactivity Disorder (ADHD) Medication (#21)
Follow-Up After Hospitalization for Mental Illness (#23)
Consumer Assessment of Healthcare Providers and Systems (CAHPS®) Health Plan Survey (#24)
12
15
15
11
1
25
24
24
24
22
13
9
9
13
21
Frequency of Ongoing Prenatal Care (#2)
Body Mass Index Assessment for Children and Adolescents (#7)
Annual Percentage of Asthma Patients with 1 or More Asthma-Related Emergency Room Visits (#20)
Percentage of Live Births Weighing Less than 2,500 Grams (#3)
Annual Pediatric Hemoglobin A1C Testing (#22)
12
10
5
3
8
18
18
14
11
10
6
8
9
8
2
2
2
1
0
7
7
5
3
1
12
5
3
2
1
-
Measure
10
Developmental Screening in the First Three Years of Life (#8)
Cesarean Rate for Nulliparous Singleton Vertex (#4)
Otitis Media with Effusion – Avoidance of Inappropriate Use of Systemic Antimicrobials in Children (#16)
Pediatric Central-Line Associated Blood Stream Infections – NICU and PICU (#19)
Median Number of Measures Reported by States
Change in Number of
States Reporting FFY
2010–2011
Source:
State data for FFY 2010 obtained from 2011 Secretary’s report. State data for FFY 2011 obtained from Mathematica analysis of FFY 2011 CARTS reports as of
June 20, 2012.
Note:
Wisconsin did not submit a CARTS report for FFY 2011. Delaware submitted an FFY 2011 CARTS report but did not submit data on any of the initial core set of
children’s health care quality measures. For the eight states that submitted separate data for their Medicaid and CHIP programs (Colorado, Iowa, Kentucky,
Michigan, New York, Pennsylvania, Tennessee, and West Virginia), the state was counted as reporting a measure if either report included data for that measure.
Table 6. Changes in State Reporting of the Initial Core Set of Medicaid/CHIP Children’s Health Care Quality Measures, FFY 2010–2011
Number of Measures Reported for
Both Medicaid and CHIP
Number of Measures Reported
11
State
2010
2011
Change in Number of
Measures Reported
FFY 2010–2011
Alabama
Alaska
Arizona
Arkansas
California
13
14
8
0
9
17
13
7
13
11
4
-1
-1
13
2
0
14
0
0
0
0
13
0
12
0
0
-1
0
12
0
Colorado
Connecticut
Delaware
District of Columbia
Florida
5
10
0
12
12
12
14
0
13
20
7
4
0
1
8
0
10
0
12
0
9
12
0
13
16
9
2
0
1
16
Georgia
Hawaii
Idaho
Illinois
Indiana
18
0
0
7
14
19
12
6
17
14
1
12
6
10
0
16
0
0
7
13
19
11
6
17
14
3
11
6
10
1
Iowa
Kansas
Kentucky
Louisiana
Maine
3
0
13
5
11
18
5
14
6
14
15
5
1
1
3
0
0
9
0
9
4
4
11
5
13
4
4
2
5
4
Maryland
Massachusetts
Michigan
Minnesota
Mississippi
12
0
12
3
8
12
11
16
3
8
0
11
4
0
0
9
0
0
3
0
12
11
6
3
0
3
11
6
0
0
Missouri
Montana
Nebraska
Nevada
New Hampshire
12
7
5
3
5
12
5
5
7
11
0
-2
0
4
6
11
0
2
0
1
11
0
2
0
0
0
0
0
0
-1
2010
2011
Change in Number of Measures
Reported for Both Medicaid and
CHIP FFY 2010–2011
Table 6 (continued)
Number of Measures Reported for
Both Medicaid and CHIP
Number of Measures Reported
State
2010
2011
Change in Number of
Measures Reported
FFY 2010–2011
New Jersey
New Mexico
New York
6
15
9
2
2
6
15
12
13
8
0
0
3
11
6
6
13
0
0
0
6
15
8
0
0
0
2
8
0
0
Oregon
Pennsylvania
Rhode Island
3
4
0
9
15
11
4
24
13
17
8
0
24
4
2
2
4
0
0
14
10
4
21
0
17
8
0
21
0
3
South Carolina
South Dakota
Tennessee
Texas
Utah
9
4
15
0
3
18
1
23
12
8
9
-3
8
12
5
0
1
0
0
0
0
0
18
0
0
0
-1
18
0
0
Vermont
Virginia
Washington
West Virginia
Wisconsin
Wyoming
9
3
6
15
2
13
7
11
8
16
0
14
-2
8
2
1
-2
1
5
3
4
0
2
0
5
10
6
0
0
0
0
7
2
0
-2
0
7
12
-
0
6
-
North Carolina
North Dakota
Ohio
Oklahoma
12
Median
2010
2011
Change in Number of Measures
Reported for Both Medicaid and
CHIP FFY 2010–2011
Source:
State data for FFY 2010 obtained from 2011 Secretary’s report. State data for FFY 2011 obtained from Mathematica analysis of FFY 2011 CARTS reports as of
June 20, 2012.
Note:
Wisconsin did not submit a CARTS report for FFY 2011. Delaware submitted an FFY 2011 CARTS report but did not submit data on any of the initial core set of
children’s health care quality measures. For the eight states that submitted separate data for their Medicaid and CHIP programs (Colorado, Iowa, Kentucky,
Michigan, New York, Pennsylvania, Tennessee, and West Virginia), the state was counted as reporting a measure if either report included data for that measure.
Table 7. Performance Rates on Frequently Reported Medicaid/CHIP Children’s Health Care Quality Measures in FFY 2011 CARTS Reports
Age Group
Number of States Reporting
Using HEDIS Specifications
Mean
Median
25th
Percentile
75th
Percentile
12-24 Months
25 Months - 6 Years
7-11 Years
12-19 Years
43
43
43
43
95.9
87.8
88.5
87.3
96.7
88.1
90.0
89.0
95.6
85.1
86.7
85.3
98.2
91.6
93.0
91.7
First 15 Months
3-6 Years
12-21 Years
45a
47
43
57.9
65.0
45.2
60.8
66.9
45.7
54.8
59.6
35.4
69.3
74.9
56.4
Childhood Immunization Status
Percent Up-to-Date on Immunizations (Combo 3)b
2 Years
28
65.0
70.7
62.1
76.6
Immunizations for Adolescents
Percent Up-to-Date on Immunizations (Combo 1)c
13 Years
22
48.4
51.9
32.8
59.5
Chlamydia Screening
Percent Screened
16-20 Years
32
46.0
47.1
36.8
57.0
Appropriate Testing for Children with Pharyngitis
Percent Tested
2-18 Years
28
62.2
63.1
52.2
75.2
Measure
Access to Primary Care
Percent with a PCP Visit
Well-Child Visits
Percent with 6 or More Visits
Percent with 1 or More Visits
Percent with 1 or More Visits
13
Source:
Mathematica analysis of FFY 2011 CARTS reports as of June 20, 2012.
Note:
Table includes states that used HEDIS specifications to report these measures. Table excludes states that used other specifications and states that did not report these
measures in FFY 2011 CARTS reports. In the cases where a state reported rates for both their Medicaid and CHIP populations, the highest rate of the two
populations was used. See Appendix Tables E.2–E.9 for details.
a
South Dakota did not report the percent of children in the first 15 months of life with six or more well-child visits but reported rates for other numbers of well-child visits.
b
Combination 3 includes DTaP, IPV, MMR, HiB, HepB, VZV, and PCV.
c
Combination 1 includes Meningococcal and Tdap.
Table 8. Changes in Performance Rates on Frequently Reported Medicaid/CHIP Children’s Health Care Quality Measures as Reported by States in Their FFY
2010 and FFY 2011 CARTS Reports
FFY 2010
Measure
Access to Primary Care
Percent with a PCP Visit
14
Well-Child Visits
Percent with 6 or More
Visits
Percent with 1 or More
Visits
Percent with 1 or More
Visits
FFY 2011
Age Group
Number of States
Reporting in FFY 2010 and
FFY 2011 Using HEDIS
Specifications
12-24 Months
25 Months - 6 Years
7-11 Years
12-19 Years
35
37
37
37
95.4
88.0
89.7
88.2
96.2
89.9
91.2
88.8
95.5
85.8
87.3
85.8
98.0
92.2
93.3
91.4
96.1
88.3
89.2
88.1
96.9
88.4
90.6
89.3
95.7
85.3
87.3
85.1
98.2
91.6
93.1
91.8
First 15 Months
36
53.9
56.5
51.7
65.8
60.3
61.3
56.8
69.6
3-6 Years
38
64.1
65.2
59.1
75.2
66.5
69.3
61.6
74.9
12-21 Years
29
47.0
47.0
37.4
56.7
47.4
47.3
38.4
58.6
25th
75th
Mean Median Percentile Percentile Mean
25th
75th
Median Percentile Percentile
Source:
State data for FFY 2010 obtained from 2011 Secretary’s report. State data for FFY 2011 obtained from Mathematica analysis of FFY 2011 CARTS
reports as of June 20, 2012.
Note:
For each measure, analysis includes states that used HEDIS specifications to report rates in both the FFY 2010 and FFY 2011 CARTS reports. In
the cases where a state reported separate rates for Medicaid and CHIP populations, this analysis includes the higher rate of the two populations.
Table 9. Percentage of Children Receiving Well-Child Visits in the 3rd, 4th, 5th, and 6th Years of Life as Reported by States in Their FFY 2010 and FFY 2011
CARTS Reports
Population Included in the Measure
Year of Data
State
FFY 2010
15
FFY 2010
FFY 2011
Alabama
Alaska
Arizona
Arkansas
California
2010
2009
2009
NR
2009
Jan-10 - Dec-10
Jan-10 - Dec-10
Oct-09 - Sep-10
Oct-09 - Sep-10
Jan-10 - Dec-10
Colorado
Medicaid
CHIP
Connecticut
D.C.
Florida
Georgia
NR
2010
NR
2009
2010
2009
Jan-10 - Dec-10
Jan-10 - Dec-10
Jan-10 - Dec-10
Jan-10 - Dec-10
Jan-10 - Dec-10
Jan-10 - Dec-10
NR
Hawaii
Idaho
Illinois
Indiana
Iowa
NR
NR
2010
2009
2009
Jan-10 - Dec-10
Oct-10 - Sep-11
Jan-10 - Dec-10
Jan-10 - Dec-10
Jan-10 - Dec-10
NR
NR
X
Kansas
Kentucky
Louisiana
Maine
Maryland
NR
2009
2010
2010
2009
Jan-11 - Dec-11
Jan-10 - Dec-10
Jul-10 - Jun-11
Oct-10 - Sep-11
Jan-10 - Dec-10
NR
X
NR
2009
NR
2009
2009
2009
Massachusetts
Michigan
Medicaid
CHIP
Minnesota
Mississippi
Missouri
Medicaid
NR
CHIP
X
X
X
NR
X
FFY 2011
Medicaid
X
X
Data Source Used for the Measure
FFY 2010
CHIP
Administrative
X
X
X
X
X
X
X
X
NR
X
NR
X
X
X
X
X
X
X
X
X
NR
NR
X
X
X
X
X
X
X
X
X
X
X
X
X
X
X
X
X
X
X
X
X
X
NR
X
X
X
X
NR
X
X
X
X
Jan-09 - Dec-09
NR
NR
X
X
NR
Jan-10 - Dec-10
Jan-10 - Dec-10
Jan-10 - Dec-10
Jan-10 - Dec-10
Jan-10 - Dec-10
X
NR
X
X
X
X
NR
X
X
X
X
X
X
X
X
X
X
NR
X
X
X
Hybrid
Administrative
NR
X
X
X
X
X
X
NR
Hybrid
FFY 2010
FFY 2011
Change
X
46.4
51.0
74.1
NR
76.8
44.9
47.6
75.9
62.5
74.0
-1.5
-3.4
1.8
N/A
-2.8
NR
61.1
77.0
73.6
63.3
53.4
66.9
63.1
61.7
79.5
70.5
57.7
N/A
2.0
-15.3
5.9
7.2
4.3
NR
NR
61.1
69.1
58.8
66.2
49.3
69.6
69.7
62.4
N/A
N/A
8.5
0.6
3.6
48.7
75.3
64.0
62.8
80.7
N/A
-1.4
-1.5
3.9
-1.1
X
X
X
X
X
X
X
NR
NR
X
X
X
X
X
X
NR
X
X
X
FFY 2011
X
X
X
NR
NR
X
Percentage of Children Receiving 1+
Well-Child Visits in the 3rd, 4th, 5th,
and 6th Years of Life
X
X
NR
X
X
X
NR
76.7
65.5
58.9
81.8
NR
X
NR
85.5
N/A
X
75.9
NR
65.6
33.6
60.2
74.9
67.6
67.3
35.9
59.4
-1.0
N/A
1.7
2.3
-0.8
X
X
X
X
NR
X
X
X
X
X
Table 9 (continued)
Population Included in the Measure
Year of Data
State
FFY 2010
FFY 2011
FFY 2010
Medicaid
FFY 2011
CHIP
16
Montana
Nevada
New
Hampshire
New Jersey
New Mexico
2009
2009
Jan-10 - Dec-10
Jul-10 - Jun-11
X
X
2009
2009
2009
Jul-09 - Jun-10
Jan-10 - Dec-10
Jan-10 - Dec-10
X
X
X
New York
North Carolina
North Dakota
Ohio
Oklahoma
2009
2009
NR
2009
2009
Jan-10 - Dec-10
Jan-10 - Dec-10
Jan-10 - Dec-10
Jan-10 - Dec-10
Jan-10 - Dec-10
Oregon
Pennsylvania
Rhode Island
South Carolina
South Dakota
NR
2009
2009
NR
2009
Jan-10 - Dec-10
Jan-10 - Dec-10
Jan-10 - Dec-10
Oct-10 - Sep-11
NR
NR
Tennessee
Medicaid
CHIP
Texas
Utah
Vermont
Virginia
NR
2009
NR
2009
2009
2009
Jan-10 - Dec-10
Jan-10 - Dec-10
Sep-09 - Aug-10
Jul-10 - Jun-11
Jan-10 - Dec-10
Jan-10 - Dec-10
NR
Washington
West Virginia
Wisconsin
Wyoming
2009
2009
2009
2010
Jan-09 - Dec-10
Jan-10 - Dec-10
NR
Oct-10 - Sep-11
X
NR
X
NR
NR
X
X
X
X
NR
NR
X
NR
X
X
NR
X
Medicaid
X
X
X
X
X
X
X
X
NR
NR
X
NR
X
X
X
X
X
X
X
X
X
X
X
NR
Data Source Used for the Measure
FFY 2010
CHIP
Administrative
X
X
X
X
X
X
X
X
FFY 2011
Hybrid
FFY 2010
FFY 2011
Change
X
44.4
70.7
44.5
77.9
0.1
7.2
X
X
80.4
77.4
60.9
79.0
81.3
62.6
81.0
26.3
NR
61.2
64.9
80.6
71.3
28.6
62.4
59.8
-0.4
45.0
N/A
1.2
-5.1
NR
75.5
76.5
NR
46.6
55.4
74.9
77.2
63.5
NR
N/A
-0.6
0.7
N/A
N/A
NR
59.5
NR
50.0
70.6
72.7
71.8
64.4
68.1
56.5
69.0
74.9
N/A
4.9
N/A
6.5
-1.6
2.2
62.1
73.5
63.1
45.6
61.5
73.3
NR
48.5
-0.6
-0.2
N/A
2.9
X
X
X
X
X
X
X
NR
NR
X
X
NR
X
NR
X
NR
X
NR
X
X
NR
NR
NR
NR
X
X
X
X
X
X
X
X
X
NR
X
X
X
X
X
X
X
NR
X
X
X
X
X
X
Hybrid
X
X
X
X
X
X
NR
X
Administrative
X
X
X
NR
X
X
X
X
X
X
X
Percentage of Children Receiving 1+
Well-Child Visits in the 3rd, 4th, 5th,
and 6th Years of Life
X
X
NR
X
NR
-1.4
3.9
1.7
Source:
State data for FFY 2010 obtained from 2011 Secretary’s report. State data for FFY 2011 obtained from Mathematica analysis of FFY 2011 CARTS reports as of June 20,
2012.
Note:
Delaware did not submit a CARTS report for FFY 2010 or FFY 2011. This table excludes Nebraska in both FFY 2010 and FFY 2011 and North Dakota in FFY 2010 as
these states reported using other specifications.
NR = not reported; NA = not applicable
Table 10. Comparison of Median Rates for State Medicaid/CHIP Programs and Commercial Health Plans for
Frequently Reported Children’s Health Care Quality Measures, FFY 2011
Age Group
State Medicaid/
CHIP Median
Health Plan
Commercial Median
12-24 Months
25 Months - 6 Years
7-11 Years
12-19 Years
96.7
88.1
90.0
89.0
98.2
91.8
92.4
89.6
First 15 Months
3-6 Years
12-21 Years
60.8
66.9
45.7
78.1
73.1
41.8
Childhood Immunization Status
Percent Up-to-Date on Immunizations
(Combo 3)a
2 Years
70.7
75.8
Adolescent Immunization Status
Percent Up-to-Date on Immunizations
(Combo 1)b
13 Years
51.9
51.3
Chlamydia Screening
Percent Screened
16-20 Years
47.1
39.6
Appropriate Testing for Children with
Pharyngitis
Percent Tested
2-18 Years
63.1
79.6
Measure
Access to Primary Care
Percent with a PCP Visit
Well-Child Visits
Percent with 6 or More Visits
Percent with 1 or More Visits
Percent with 1 or More Visits
Source:
State Medicaid/CHIP medians from FFY 2011 CARTS reports; Commercial Health Plan medians from
unpublished data provided by the National Committee for Quality Assurance (NCQA).
a
Combination 3 includes DTaP, IPV, MMR, HiB, HepB, VZV, and PCV.
b
Combination 1 includes Meningococcal and Tdap.
17
Table 11. Managed Care Plans Covering Children or Pregnant Women Included in External Quality Review Organization (EQRO) Technical Reports, 2011-2012
Reporting Cycle
Plan Type
(Number of Plans)
State
EQRO
Total (37 States)
Arizona
California
Colorado
Delaware
D.C.
18
Florida
Georgia
Hawaii
Illinois
Indiana
Iowa
Kansas
Kentucky
Maryland
Massachusetts
Michigan
Minnesota
Missouri
Nebraska
Nevada
New Jersey
New Mexico
New York
Ohio
Oregon
Number of
Plans
MCO
(HMO)
PIHP
Population Enrolled in Managed Care
(Number of Plans)
Medicaid and
CHIP Combined
Medicaid
Only
CHIP
Only
Unknown
Population
CHIP Program Type
321
232
89
78
5
0
238
HSAG
HSAG
HSAG
Mercer
Delmarva
9
22
7
2
3
9
20
1
2
2
0
2
6
0
1
0
0
0
2
3
0
0
0
0
0
0
0
0
0
0
9
22
7
0
0
Separate
Combination
Separate
Combination
Medicaid Expansion
HSAG
HSAG
HSAG
HSAG
Burns & Associates
51
3
3
3
3
25
3
3
3
3
26
0
0
0
0
3
0
0
3
0
0
0
0
0
0
0
0
0
0
0
48
3
3
0
3
Combination
Separate
Medicaid Expansion
Combination
Combination
Telligen
KFMC
IPRO
Delmarva
APS Healthcare
1
2
1
7
2
0
2
1
7
0
1
0
0
0
2
0
0
1
7
0
0
0
0
0
0
0
0
0
0
0
1
2
0
0
2
Combination
Separate
Combination
Medicaid Expansion
Combination
HSAG
MPRO
BHC
IPRO
HSAG
32
8
6
2
2
14
5
6
2
2
18
3
0
0
0
0
0
0
0
0
0
0
0
0
0
0
0
0
0
0
32
8
6
2
2
Combination
Combination
Combination
Medicaid Expansion
Separate
MPRO
NMMRA
IPRO
HSAG
Acumentra
6
5
18
7
25
6
4
18
7
25
0
1
0
0
0
6
0
18
7
0
0
0
0
0
0
0
0
0
0
0
0
5
0
0
25
Combination
Medicaid Expansion
Separate
Medicaid Expansion
Separate
Table 11 (continued)
Plan Type
(Number of Plans)
EQRO
Number of
Plans
IPRO
IPRO
IPRO
CCME
QSource
12
5
3
4
7
Texas
Utah
Vermont
Virginia
Washington
ICHP
QQ
HSAG
Delmarva
Acumentra
West Virginia
Wisconsin
Delmarva
Meta Star
State
Pennsylvania
Puerto Rico
Rhode Island
South Carolina
Tennessee
MCO
(HMO)
Population Enrolled in Managed Care
(Number of Plans)
PIHP
Medicaid and
CHIP Combined
Medicaid
Only
CHIP
Only
Unknown
Population
CHIP Program Type
7
4
3
4
7
5
1
0
0
0
0
0
3
0
0
0
0
0
0
0
0
0
0
0
0
12
5
0
4
7
Separate
NA
Combination
Medicaid Expansion
Combination
5
11
1
5
20
5
1
1
5
7
0
10
0
0
13
0
0
0
5
20
5
0
0
0
0
0
0
0
0
0
0
11
1
0
0
Separate
Separate
Separate
Combination
Separate
3
15
3
15
0
0
0
0
0
0
0
0
3
15
Separate
Combination
19
Source:
EQRO technical reports submitted to CMS for the 2011-2012 reporting cycle, as of July 31, 2012.
Note:
Alabama, Alaska, Arkansas, Connecticut, Idaho, Maine, Montana, New Hampshire, Oklahoma, South Dakota, and Wyoming do not have MCOs or
PIHPs that enroll children covered by Medicaid or CHIP. Louisiana, Mississippi, and North Dakota have newly applicable managed care
requirements and were not required to submit EQRO technical reports for the 2011-2012 reporting cycle. North Carolina submitted an EQRO
technical report, but managed care in the State was limited to behavioral health programs that did not enroll children.
South Carolina ended its Separate CHIP program effective October 1, 2010. At that time, the state transitioned all CHIP enrollees to a Medicaid
Expansion CHIP.
BHC = Behavioral Health Concepts; CCME = Carolinas Center for Medical Excellence; HSAG = Health Services Advisory Group; ICHP = Institute for Child
Health Policy at the University of Florida; KFMC = Kansas Foundation for Medical Care; MPRO = Michigan Peer Review Organization; NMMRA = New
Mexico Medical Review Association; QQ = HCE Quality Quest.
Table 12. Types of Performance Measures Evaluating Children or Pregnant Women Included in External Quality Review Organization (EQRO) Technical Reports, 2011-2012
Reporting Cycle
States with Performance Measures Evaluating Children or Pregnant Women
State
Total (37 States)
Arizona
California
Colorado
Delaware
D.C.
Florida
Georgia
Hawaii
Illinois
Indiana
Behav
Childhood Dental
Lead
Mental
ADHD Asthma Health Immunization Care Screening Health
10
X
X
X
X
X
X
X
27
X
X
X
X
X
X
X
X
X
14
15
18
8
25
22
19
11
13
X
X
X
X
X
X
X
X
X
X
X
X
X
X
X
X
X
X
X
X
X
X
X
20
X
X
X
X
X
X
X
X
X
X
X
X
X
X
X
X
X
X
X
X
Xb
X
X
X
X
X
X
X
X
X
X
X
X
X
X
X
X
X
X
X
26
25
8
X
X
X
X
X
X
X
X
X
X
X
X
X
X
X
X
X
X
X
X
X
X
X
X
X
X
X
X
X
X
X
X
Michigan
Minnesota
Missouri
Nebraska
Nevada
Pennsylvania
Puerto Rico
Rhode Island
South Carolina c
Tennessee
5
X
Iowa
Kansas
Kentucky
Maryland
Massachusetts
New Jersey
New Mexico
New York
Ohio
Oregon
22
Pharyngitis
Primary
Well-Child Well-Child
Prenatal Care
URI Weight / Care:
Care:
Care
Access STIs Treatment BMI
Children Adolescent Other a
X
X
X
X
X
X
X
X
X
X
X
X
X
X
X
X
X
X
X
X
X
X
X
X
X
X
X
X
X
X
X
X
X
X
X
X
X
X
X
X
X
X
X
X
X
X
X
X
X
X
X
X
X
X
X
X
X
X
X
X
X
X
X
X
X
X
X
X
X
X
X
X
X
X
X
X
X
X
X
X
X
X
X
X
X
X
X
X
X
X
X
X
X
X
X
X
X
X
X
X
X
X
Table 12 (continued)
States with Performance Measures Evaluating Children or Pregnant Women
Behav
Childhood Dental
Lead
Mental
ADHD Asthma Health Immunization Care Screening Health
State
Texas
Utah
Vermont
Virginia
X
Washington
West Virginia
Wisconsin
X
X
X
X
X
X
X
X
X
X
X
X
X
X
X
Pharyngitis
X
X
Primary
Well-Child Well-Child
Prenatal Care
URI Weight / Care:
Care:
Care
Access STIs Treatment BMI
Children Adolescent Other a
X
X
X
X
X
X
X
X
X
X
X
X
X
X
X
X
X
X
X
X
X
X
X
X
X
X
X
X
X
X
X
X
X
X
X
Source:
EQRO technical reports submitted to CMS for the 2011-2012 reporting cycle, as of July 31, 2012.
Note:
Alabama, Alaska, Arkansas, Connecticut, Idaho, Maine, Montana, New Hampshire, Oklahoma, South Dakota, and Wyoming do not have MCOs or PIHPs that
enroll children covered by Medicaid or CHIP. Louisiana, Mississippi, and North Dakota have newly applicable managed care requirements and were not required
to submit EQRO technical reports for the 2011-2012 reporting cycle. North Carolina submitted an EQRO technical report, but managed care in the state was
limited to behavioral health programs that did not enroll children.
21
Analysis excludes plans that provide only limited services, such as primary care case management. Analysis also excludes plans that do not serve children or
pregnant women, such as long-term care plans or Medicare Advantage plans that cover dual eligibles.
Analysis includes performance measures listed in the EQRO technical report for each state that specifically evaluate children or pregnant women.
a
Appendix Table G.1 includes information about the “Other” performance measures for children and pregnant women reported by states.
b
The Kansas EQRO technical report included primary care access for adolescents, but did not report rates of primary care access for children ages 12 months to 11 years.
c
The South Carolina EQRO technical report did not list performance measures for managed care plans.
BMI = Body Mass Index; Behav = Behavioral; STI = Sexually Transmitted Infection; URI = Upper Respiratory Infection.
X
Table 13. Reporting of Performance Rates for Measures Included in External Quality Review Organization (EQRO) Technical Reports, 2011-2012 Reporting Cycle
Comparisons for Performance Ratesb
State
Year of Data
Performance MCO / PIHP Rates for
Rates
To
Measures
Performance Measures Reported for Previous
Validated by
Reported in EQRO
Subgroups
Year(s)
EQRO a
Report
within State
Rates
Total (37 States)
29
22
27
X c,d
Xg
X
X
X
X
X
X
X (2011)
X (2010)
X
X
X (2011)
X
X
X (2009)
X (2010)
X (2010)
X (2005–2010)
22
FFY 2009
CY 2010
CY 2010
CY 2010
CY 2010
All
All
All
All
All
All
All
All
All
All
Florida
Georgia
Hawaii
Illinois
Indiana
CY 2009
CY 2009
CY 2010
CY 2009
CY 2009
All
All
All
Some
Some
All
All
All
All
None
X
X
X
X
Iowa
Kansas
Kentucky
Maryland
Massachusetts
SFY 2010
CY 2009
CY 2009
CY 2010
CY 2009
All
All
All
All
All
All
All
All
All
All
X
X
X
X
X
Michigan
Minnesota
Missouri
Nebraska
Nevada
CY 2010
2010
CY 2009
CY 2010
CY 2010
All
All
All
All
All
All
All
All
All
All
CY 2009
CY 2009
CY 2009–2010
CY 2009
CY 2010
All
Some
All
All
All
All
Some
All
All
None
CY 2010
CY 2009
CY 2009
CY 2010
CY 2010
All
All
All
All
Some
All
All
All
None
All
Pennsylvania
Puerto Rico
Rhode Island
South Carolina
Tennessee
To State
To National
Target
HEDIS Medicaid
Other
Rates (HEDIS Performance
Rates
Comparisons
year)
10
Arizona
California
Colorado
Delaware
D.C.
New Jersey
New Mexico
New York
Ohio
Oregon
To
Statewide
Managed
Care Rate
Xg
X
X (2008–2010)
X (2010)
X (2010)
X
X
X
X (2010)
X (NR)
X (2006 –2009)
X
X (2010)
X
X
X
X
X
X (2008–2009)
X (2010)
X
X
X
X
X (2010)
X (2010)
X (2010)
X
X
X (2010)
X
Xg
X
X
X
X
Xi
Xg
Xc
Xc
X
X
10
5
X
X
X e, f
X
X
X
Xh
X
Xe
Xe
X
X (2010)
X
Table 13 (continued)
Comparisons for Performance Ratesb
Year of Data
State
Texas
Utah
Vermont
Virginia
Washington
West Virginia
Wisconsin
Performance MCO / PIHP Rates for
Rates
To
Measures
Performance Measures Reported for Previous
Validated by
Reported in EQRO
Subgroups
Year(s)
EQRO a
Report
within State
Rates
9/2009 – 8/2010
CY 2010
CY 2010
CY 2010
CY 2010
All
All
All
Some
All
All
All
All
All
Some
CY 2010
CY 2009
All
All
All
None
Xc
X
To
Statewide
Managed
Care Rate
X
X
To State
To National
Target
HEDIS Medicaid
Other
Rates (HEDIS Performance
Rates
Comparisons
year)
X
X
X
X
X
X (2010)
X (2011)
X (2010)
X (2010–2011)
X (2011)
X
X
X (2010)
X
X
Xj
Source:
EQRO technical reports submitted to CMS for the 2011-2012 reporting cycle, as of July 31, 2012.
Notes:
Alabama, Alaska, Arkansas, Connecticut, Idaho, Maine, Montana, New Hampshire, Oklahoma, South Dakota, and Wyoming do not have MCOs or PIHPs that
enroll children covered by Medicaid or CHIP. Louisiana, Mississippi, and North Dakota have newly applicable managed care requirements and were not required
to submit EQRO technical reports for the 2011-2012 reporting cycle. North Carolina submitted an EQRO technical report, but managed care in the state was
limited to behavioral health programs that did not enroll children.
23
Analysis excludes plans that provide only limited services, such as primary care case management. Analysis also excludes plans that do not serve children or
pregnant women, such as long-term care plans or Medicare Advantage plans that cover dual eligibles.
a
Use of the term “validation” differed across EQRO technical reports. In Table 13, validation indicates that the EQRO reported reviewing information, data, and procedures to
determine the extent to which they are accurate, reliable, free from bias, and in accord with standards for data collection and analysis. Some measures that were reviewed in the
validation process did not meet all of the review criteria.
b
Comparisons may apply to only some performance measures reported by the EQRO.
c
Reported performance rates for geographic regions within state or territory.
d
Reported performance separately by type of managed care model in state (county-operated health system, geographic managed care, and two-plan model).
e
Comparisons to National HEDIS Commercial Averages.
f
Comparisons to Healthy People 2010.
g
Reported performance separately for Medicaid eligibility categories, including children and families, adults without dependent children, aged, and disabled populations.
h
Comparisons to statewide FFS Medicaid rates.
i
Compared rates for enrollees in New York City with the rest of the state.
j
Rates for AHRQ Pediatric Quality Indicators are compared with AHRQ national estimates for 2008, based on area-level indicators that include commercial and Medicaid
populations.
NR = not reported.
Table 14. Performance Improvement Projects (PIPs) Targeting Children or Pregnant Women Included in External Quality Review Organization (EQRO) Technical Reports, 2011-2012
Reporting Cycle
Number of PIPs by Topic Area
State
Number of
PIPs for
Children or
Pregnant
Women
Years of Data
PIPs
Validated
by EQROa ADHD Asthma
Behav
Childhood
Dental
Lead
Health Immunization Care Screening
Mental
Health
Prenatal
Care
Primary
Care
Access
Weight/ Well-Child
BMI
Care
Other b
24
Total PIPs (37 States)
268
4
16
5
17
24
11
19
46
2
42
56
26
Total States (37 States)
30
4
7
1
9
7
6
4
16
1
9
11
9
Arizona
California
Colorado
Delaware
D.C.
7
22
3
4
3
FFY 2006–2009
Jan–March 2012
FFY 2010–2011
Varies by PIP
CY 2010
All
All
All
All
All
1
7*
1
1
3
1
Florida
Georgia
Hawaii
Illinois
Indiana
59
9
6
6
3
SFY 2011
Varies by PIP
Varies by PIP
SFY 2009–2010
CY 2010
All
All
All
All
All
Iowa
Kansas
Kentucky
Maryland
Massachusetts
0
2
4
0
0
CY 2009-2010
Varies by PIP
Varies by PIP
NA
NA
All
All
All
All
NA
Michigan
Minnesota
Missouri
Nebraska
Nevada
14
2
11
5
4
CY 2010
NR
CY 2010
CY 2010
CY 2011
All
All
All
All
All
New Jersey
New Mexico
New York
Ohio
Oregon
16
5
17
12
12
CY2009
FY 2010
2009-2010
SFY 2010
2011–2012
All
All
All
All
Some c
Pennsylvania
Puerto Rico
Rhode Island
6
1
2
CY 2008–2010
NR
Varies by PIP
All
All
All
12
5
1
1
2
1
5*
3
3*
3
3*
2*
3*
14*
2
2
1
1
1
1
1
1
2
1
3*
1
6*
2
1
2
1
2
6*
1
4*
2
3*
6*
14*
4
1
2
3
1
1
2
1
1
14*
1
1
2
3
3*
1
30*
3*
1
1
3
1
1
1
7*
7*
Table 14 (continued)
Number of PIPs by Topic Area
Number of
PIPs for
Children or
Pregnant
Women
Years of Data
South Carolina
Tennessee
4
4
NR
CY 2010
All
Some
Texas
Utah
Vermont
Virginia
Washington
0
0
0
10
10
NA
2010
NA
CY 2010
Varies by PIP
NA
All
NA
All
All
West Virginia
Wisconsin d
5
0
CY 2010
NA
All
NA
State
PIPs
Validated
by EQROa ADHD Asthma
Behav
Childhood
Dental
Lead
Health Immunization Care Screening
Mental
Health
Prenatal
Care
Primary
Care
Access
Weight/ Well-Child
BMI
Care
3
3
1
5*
2
2
1
5*
6*
2
1
1
EQRO technical reports submitted to CMS for the 2011-2012 reporting cycle, as of July 31, 2012.
Note:
Alabama, Alaska, Arkansas, Connecticut, Idaho, Maine, Montana, New Hampshire, Oklahoma, South Dakota, and Wyoming do not have MCOs or PIHPs that enroll children
covered by Medicaid or CHIP. Louisiana, Mississippi, and North Dakota have newly applicable managed care requirements and were not required to submit EQRO technical
reports for the 2011-2012 reporting cycle. North Carolina submitted an EQRO technical report, but managed care in the state was limited to behavioral health programs that did
not enroll children.
25
Source:
Analysis excludes plans that provide only limited services, such as primary care case management. Analysis also excludes plans that do not serve children or pregnant women,
such as long-term care plans or Medicare Advantage plans that cover dual eligibles.
Analysis includes PIPs listed in the EQRO technical report for each state that specifically evaluated children or pregnant women.
a
Use of the term “validation” differed across EQRO technical reports. In Table 14, validation indicates that the EQRO technical reported reviewing information, data, and procedures to
determine the extent to which they are accurate, reliable, free from bias, and in accord with standards for data collection and analysis. Some PIPs that were reviewed in the validation process
did not meet all of the review criteria.
b
PIPs for children on “Other” topics include appropriate treatment for children with pharyngitis (South Carolina); assuring better child health and development (Oregon); emergency room
diversion (Colorado, West Virginia); EPSDT participation rates (Illinois, Kentucky, Ohio); improving customer service rates: children (Kansas); improving rates of cervical cancer screening
(California); reduction of out-of-home placement (California); school attendance rates (California); sexually transmitted infections (Kansas).
c
EQRO did not review or validate the Assuring Better Child Health and Development (ABCD) Program PIP because a separate EQRO (the Oregon Pediatric Improvement Partnership) held
the contract for PIP development and validation.
d
Other b
Managed care plans in Wisconsin operate PIPs, but PIP topics and descriptions were not included in the EQRO technical report.
*PIP topic was mandated by state; ADHD = Attention Deficit Hyperactivity Disorder; Behav = Behavioral; BMI = Body Mass Index; NA = Not Applicable, EQRO technical report did not
include any PIPs for children or pregnant women; NR = Not Reported.
1
Table 15. Overview of State-Level Reporting on Selected Child Medicaid CAHPS Measures, 25 States, 2010
Median
Mean
25th
percentile
75th
percentile
Low-High
60%
60%
58%
64%
54% - 68%
Child Can Get Care for Illness/Injury as
Soon as Needed
76%
75%
74%
78%
65% - 85%
Child Can Get Appointment for Routine
Care as Soon as Needed
65%
65%
61%
68%
52% - 77%
How Often It Was Easy to Get
Appointment with a Specialist
47%
50%
45%
55%
40% - 61%
Child’s Doctor Shows Respect for What
Parent Has to Say
81%
81%
79%
83%
75% - 89%
Child’s Doctor Listens Carefully to Parent
78%
77%
75%
80%
69% - 86%
Child’s Doctor Explains Things Clearly to
Parent
77%
76%
74%
78%
63% - 85%
Child’s Doctor Explains Things Clearly to
Child
68%
68%
66%
70%
61% - 76%
Child’s Doctor Spent Enough Time with
Child
62%
62%
61%
65%
49% - 71%
How Well Child’s Doctor Communicates
(Composite)
73%
73%
70%
76%
65% - 80%
CAHPS Measure
Parent’s Global Assessment of Health
Care a
Overall Rating of Health Care
Parent’s Assessment of Ease of Getting
Care for Child b
Parent’s Assessment of How Well Child’s
Doctor Communicates c
Source:
Mathematica analysis of National CAHPS Benchmarking Database.
a
Parents assessed overall rating of health care on a scale of 0 to 10, where 0 is “worst possible” and 10 is “best
possible.” This table shows the percentage reporting a rating of 9 or 10.
b
Parents assessed the ease of getting care on a four-point scale (never, sometimes, usually, always), and the
percentages shown here are the percentages reporting “always.”
c
Parents assessed doctors’ communication on a four-point scale (never, sometimes, usually, always) and the
percentages shown here are the percentages reporting “always.”
26
Table 16. Percentage and Number of Eligible Children Age 1-20, Enrolled for at Least 90 Continuous Days, Who Received Preventive Dental Services and
Dental Treatment Services in FFY 2010
State
Alabama
Alaska
Arizona
Arkansas
California
Total Number of Children
Receiving Dental Service:
Preventive
Percent of Children Receiving
Dental Service: Preventive
Total Number of Children
Receiving Dental Service:
Treatment
Percent of Children Receiving
Dental Service: Treatment
27
244,112
33,016
333,511
166,106
1,451,686
50
41
46
46
37
105,432
21,780
189,986
91,528
870,922
21
27
26
25
22
Colorado
Connecticut
Delaware
D.C.
Florida
167,886
155,039
36,357
32,435
266,213
47
54
41
39
15
95,085
77,445
18,763
18,060
146,327
27
27
21
22
8
Georgia
Hawaii
Idaho
Illinois
Indiana
471,278
53,413
10,887
703,305
201,713
46
41
7
47
29
231,232
32,479
7,279
282,818
102,865
22
25
5
19
15
Iowa
Kansas
Kentucky
Louisiana
Maine
103,098
36,774
205,633
318,133
49,654
40
18
43
43
38
49,098
15,169
118,592
183,682
23,758
19
7
25
25
18
Maryland
Massachusetts
Michigan
Minnesota
Mississippi
252,729
256,381
395,241
162,552
160,053
48
50
35
40
43
132,667
152,793
173,502
81,715
83,026
25
30
15
20
22
Missouri
Montana
Nebraska
Nevada
New Hampshire
183,283
23,779
66,420
69,767
48,020
30
35
46
36
56
99,882
14,829
31,780
45,064
22,390
17
22
22
24
26
Table 16 (continued)
Total Number of Children
Receiving Dental Service:
Preventive
Percent of Children Receiving
Dental Service: Preventive
New Jersey
New Mexico
New York
North Carolina
North Dakota
244,920
153,855
712,872
430,929
12,780
40
45
37
44
30
149,067
165,572
368,940
231,775
6,607
24
49
19
24
16
Ohio
Oklahoma
Oregon
Pennsylvania
Rhode Island
484,502
236,163
105,438
400,804
39,542
44
47
36
37
41
225,042
142,334
58,916
220,480
18,613
20
28
20
20
19
277,137
30,099
340,073
1,591,256
81,512
53
39
45
55
48
135,827
12,026
186,995
1,037,158
40,871
26
16
24
36
24
33,403
265,212
357,672
84,670
114,869
22,366
58
46
51
44
23
43
14,003
148,238
225,107
96,313
57,367
12,277
24
26
32
50
12
24
State
South Carolina
South Dakota
Tennessee
Texas
Utah
28
Vermont
Virginia
Washington
West Virginia
Wisconsin
Wyoming
U.S. Total
12,678,548
43 (Median)
41 (Mean)
Source:
FFY 2010 CMS-416 reports, Line 1b, Line 12b, Line 12c.
Total Number of Children
Receiving Dental Service:
Treatment
7,073,476
Percent of Children Receiving
Dental Service: Treatment
22 (Median)
23 (Mean)
Table 17. Summary of CHIPRA Quality Demonstrations
Grant
States
Initial
Core
Quality
Measures
Testing
1
Maine
X
Vermont
2
HIT
Initiative
Provider
Delivery
Model
X
X
X
X
X
EHR
Format
Testing
State
Initiative
Developing pediatric quality measures to support patient-centered medical
home. Enhancing HIT infrastructure by automating EPSDT and other
clinical data. Implementing an electronic comprehensive health assessment
for children in foster care.
29
Florida
X
X
X
X
Illinois
X
X
X
X
3
Massachusetts
X
X
X
4
Pennsylvania
X
5
Utah
X
X
X
Idaho
X
X
X
Colorado
X
X
New Mexico
X
X
6
X
Grantee Highlights
X
Developing state specific measures. Partnering with American Academy of
Pediatrics to design a pediatric medical home. Focusing on improving birth
outcomes. Identifying opportunities to reduce elective pre-term delivery
(Florida).
Implementing care coordinators in the patient centered medical home project
to support improved care at the practice level. Using learning collaboratives
as a tool to drive transformation.
Implementing a pre-visit screening tool to help identify potential conditions
needing special attention – such as developmental delays, autism, and
maternal depression. Creating linkages with two of four health systems
across the state to the Pennsylvania Department of Health’s Statewide
Immunization Information System.
Implementing a medical home model using an administrative service model
with medical home coordinators embedded in primary and sub-specialty care
practices. Using learning collaborative to establish support and foster quality
improvement in care in areas such as mental health and asthma.
Integrating school-based health centers and mental health services with
medical home model. Created an Electronic Student Health Questionnaire, a
risk assessment screening tool to identify patients at risk for depression and
anxiety.
Table 17 (continued)
Initial
Core
Quality
Measures
Testing
HIT
Initiative
Provider
Delivery
Model
EHR
Format
Testing
X
X
State
Initiative
States
7
North
Carolina
X
8
Oregon
X
X
X
Alaska
West Virginia
X
X
X
X
X
X
9
South
Carolina
X
X
X
Using the medical home model in pediatric practices focused on
coordinating and integrating physical and mental health services. Improving
preventive oral health by training and certifying pediatric staff to provide
fluoride varnish.
10
Maryland
X
Improving clinical, functional, and social outcomes for children with serious
behavioral health needs through a Care Management Entity (CME) provider
model, which incorporates wrap-around services, peer supports, and
intensive care coordination.
30
Grant
Georgia
Wyoming
X
Grantee Highlights
Using public-private partnership of professional/community organizations to
test quality measures with provider-led community-based provider models.
Using learning collaborative model to support the medical home with a focus
on children with special health care needs. Piloting an oral health screening
tool.
Collecting and reporting core measures. Testing the patient centered medical
home model and using health information technology to support their efforts.
Implementing learning collaboratives used in each state to support the
patient centered medical home.
X
X
HIT = Healthcare Information Technology; EHR = Electronic health records; EPSDT = Early Periodic Screening, Diagnosis, and Treatment.
Table 18. Examples of Measurement Topics being Addressed by the Centers of Excellence (COE)
COE Acronym
Site
Principal Investigator
Sample Measure Topic
Q-Metric
University of Michigan
Gary Freed, MD, MPH
Sickle cell disease
treatment
CAPQuaM
Mount Sinai School of
Medicine, NY
Lawrence Kleinman, MD, MPH
Availability of services for
high-risk OB patients
COE4CCN
University of Washington,
Seattle
Rita Mangione-Smith, MD, MPH
Care coordination for
children with special
health care conditions
PMCoE
University of Wisconsin,
Milwaukee
Ramesh Sachdeva, PhD, JD
Dental treatment
NCINQ
National Committee for
Quality Assurance,
Washington, DC
Sarah Hudson Scholle, DrPH
Adolescent depression
screening and follow-up
CEPQM
Children’s Hospital, Boston
Mark Schuster, MD, PhD
Readmissions
CHOP
Children’s Hospital of
Philadelphia
Jeffrey H. Silber, MD, PhD
Duration of enrollment
Note:
A comprehensive list of measure topics assigned to the COEs is available at:
http://ahrq.gov/chipra/pqmpmeasures
31
This page has been left blank for double-sided copying.
FIGURES
1
Number of States Reporting the Initial Core Set of Medicaid/CHIP
Children’s Health Care Quality Measures in FFY 2011 CARTS Reports......................1
2
Number of Initial Core Set of Medicaid/CHIP Children’s Health Care
Quality Measures Reported in FFY 2011 CARTS Reports, by State .............................2
3
Changes in the Number of States Reporting the Initial Core Set of
Medicaid/CHIP Children’s Health Care Quality Measures, FFY 2010 and
FFY 2011 ........................................................................................................................3
4
Changes in Medians of Frequently Reported Medicaid/CHIP Children’s
Health Care Quality Measures, FFY 2010 to FFY 2011 ................................................4
5
Populations Included in Frequently Reported Medicaid/CHIP Children’s
Health Care Quality Measures, FFY 2011 ......................................................................5
6
Data Sources Used for Frequently Reported Medicaid/CHIP Children’s
Health Care Quality Measures, FFY 2011 ......................................................................6
7
Performance Measures Evaluating Children or Pregnant Women Included
in External Quality Review Organization (EQRO) Technical Reports for
the 2011-2012 Reporting Cycle for 37 States, by General Topic ...................................7
8
Comparison of Performance Measures Evaluating Children That Were
Reported in External Quality Review Organization (EQRO) Technical
Reports for 29 States, for the 2010 and 2011-2012 Reporting Cycles............................8
9
Performance Improvement Projects (PIPs) Targeting Children or Pregnant
Women That Were Included in External Quality Review Organization
(EQRO) Technical Reports for the 2011-2012 Reporting Cycle for 37
States, by General Topic .................................................................................................9
10
Comparison of Performance Improvement Projects (PIPs) Targeting
Children That Were Reported in External Quality Review Organization
(EQRO) Technical Reports for the 2010 and 2011-2012 Reporting Cycles
for 30 States, Selected Topics .......................................................................................10
11
Parents’ Overall Rating of Their Child’s Health Care, by State, 2010 .........................11
12
Parents’ Assessment of the Ease of Getting Care for Their Child, 25 States,
2010 ...............................................................................................................................12
13
Parents’ Assessment of How Well Their Child’s Doctor Communicates, 25
States, 2010 ...................................................................................................................12
14
Geographic Variation in the Percentage of Children Receiving Preventive
Dental Services, FFY 2010 ...........................................................................................13
15
Geographic Variation in the Percentage of Children Receiving Dental
Treatment Services, FFY 2010 .....................................................................................14
Figure 1. Number of States Reporting the Initial Core Set of Medicaid/CHIP Children’s Health Care Quality
Measures in FFY 2011 CARTS Reports
Well-Child Visits in the 3rd, 4th,
5th, and 6th Years of Life (#11)
48
Well-Child Visits in the First 15 Months of Life (#10)
46
Child and Adolescent Access to
Primary Care Practitioners (#14)
44
Adolescent Well-Care Visits (#12)
43
Percentage of Eligibles That Received
Preventive Dental Services (#13)
37
Percentage of Eligibles That Received
Dental Treatment Services (#17)
35
Chlamydia Screening (#9)
32
Childhood Immunization Status (#5)
30
Appropriate Testing for Children with Pharyngitis (#15)
28
Ambulatory Care: Emergency Department Visits (#18)
27
Adolescent Immunizations Status (#6)
25
Timeliness of Prenatal Care (#1)
24
Follow-Up Care for Children Prescribed Attention-Deficit
Hyperactivity Disorder (ADHD) Medication (#21)
24
Follow-Up After Hospitalization for Mental Illness (#23)
24
Consumer Assessment of Healthcare Providers And
Systems (CAHPS®) Health Plan Survey (#24)
22
Frequency of Ongoing Prenatal Care (#2)
18
Body Mass Index Assessment for
Children and Adolescents (#7)
18
Annual Percentage of Asthma Patients with 1 or More
Asthma-Related Emergency Room Visits (#20)
14
Percentage of Live Births Weighing
Less than 2,500 Grams (#3)
11
10
Annual Pediatric Hemoglobin A1C Testing (#22)
Developmental Screening in the First
Three Years of Life (#8)
7
5
Cesarean Rate for Nulliparous Singleton Vertex (#4)
Otitis Media with Effusion–Avoidance of Inappropriate
Use of Systemic Antimicrobials in Children (#16)
Pediatric Central-Line Associated Blood
Stream Infections–NICU and PICU (#19)
3
1
0
10
5
15
20
25
30
35
40
45
50
Number of States
Source:
Mathematica analysis of FFY 2011 CARTS reports as of June 20, 2012.
Notes:
Numbers in parentheses identify the measure number in the children’s initial core set. Wisconsin did
not submit a CARTS report for FFY 2011. Delaware submitted an FFY 2011 CARTS report, but did
not submit data on any of the initial core set of children’s health care quality measures. For the eight
states that submitted separate data for their Medicaid and CHIP programs (Colorado, Iowa, Kentucky,
Michigan, New York, Pennsylvania, Tennessee, and West Virginia), the state was counted as reporting
a measure if either report included data for that measure.
1
Figure 2. Number of Initial Core Set of Medicaid/CHIP Children’s Health Care Quality Measures Reported in FFY
2011 CARTS Reports, by State
Oregon
Tennessee
Florida
Georgia
Iowa
South Carolina
Alabama
Illinois
Rhode Island
Michigan
West Virginia
New Mexico
Connecticut
Indiana
Kentucky
Maine
Wyoming
Alaska
Arkansas
District of Columbia
North Carolina
Pennsylvania
Colorado
Hawaii
Maryland
Missouri
New York
Texas
24
23
20
19
18
18
17
17
17
16
16
15
14
14
14
14
14
13
13
13
13
13
Median (50 States and DC)
California
Massachusetts
New Hampshire
Ohio
Virginia
Mississippi
North Dakota
Utah
Washington
Arizona
Nevada
Vermont
Idaho
Lousiania
New Jersey
Kansas
Montana
Nebraska
Oklahoma
Minnesota
South Dakota
1
Delaware
0
Wisconsin
0
0
12
12
12
12
12
12
12
11
11
11
11
11
8
8
8
8
7
7
7
6
6
6
5
5
5
4
3
5
10
15
Number of Measures
20
24
Source:
Mathematica analysis of FFY 2011 CARTS reports as of June 20, 2012.
Notes:
Wisconsin did not submit a CARTS report for FFY 2011. Delaware submitted an FFY 2011 CARTS
report, but did not submit data on any of the initial core set of children’s health care quality measures.
For the eight states that submitted separate data for their Medicaid and CHIP programs (Colorado,
Iowa, Kentucky, Michigan, New York, Pennsylvania, Tennessee, and West Virginia), the state was
counted as reporting a measure if either report included data for that measure. The Medicaid/CHIP
initial core set includes 24 measures.
2
Figure 3. Changes in the Number of States Reporting the Initial Core Set of Medicaid/CHIP Children’s Health Care
Quality Measures, FFY 2010 and FFY 2011
48
Well-Child Visits in the 3rd, 4th,
5th, and 6th Years of Life (#11)
42
46
Well-Child Visits in the First 15 Months of Life (#10)
40
44
Child and Adolescent Access to
Primary Care Practitioners (#14)
40
43
Adolescent Well-Care Visits (#12)
29
Percentage of Eligibles That Received
Preventive Dental Services (#13)
37
22
35
Percentage of Eligibles That Received
Dental Treatment Services (#17)
19
32
Chlamydia Screening (#9)
21
30
Childhood Immunization Status (#5)
20
28
Appropriate Testing for Children with Pharyngitis (#15)
20
27
Ambulatory Care: Emergency Department Visits (#18)
15
25
Adolescent Immunizations Status (#6)
12
24
Timeliness of Prenatal Care (#1)
15
24
Follow-Up Care for Children Prescribed Attention-Deficit
Hyperactivity Disorder (ADHD) Medication (#21)
15
24
Follow-Up After Hospitalization for Mental Illness (#23)
11
22
Consumer Assessment of Healthcare Providers And
Systems (CAHPS®) Health Plan Survey (#24)
1
18
Frequency of Ongoing Prenatal Care (#2)
12
18
Body Mass Index Assessment for
Children and Adolescents (#7)
10
14
Annual Percentage of Asthma Patients with 1 or More
Asthma-Related Emergency Room Visits (#20)
5
FFY 2011
FFY 2010
11
Percentage of Live Births Weighing
Less than 2,500 Grams (#3)
3
10
Annual Pediatric Hemoglobin A1C Testing (#22)
8
7
Developmental Screening in the First
Three Years of Life (#8)
2
5
Cesarean Rate for Nulliparous Singleton Vertex (#4)
2
3
Otitis Media with Effusion–Avoidance of Inappropriate
Use of Systemic Antimicrobials in Children (#16)
Pediatric Central-Line Associated Blood
Stream Infections–NICU and PICU (#19)
1
1
0
0
10
5
15
20
25
30
35
40
45
50
Number of States
Source:
State data for FFY 2010 obtained from 2011 Secretary’s Report. State data for FFY 2011 from
Mathematica analysis of CARTS reports as of June 20, 2012.
Notes:
Numbers in parentheses identify the measure number in the children’s initial core set. Wisconsin did
not submit a CARTS report for FFY 2011. Delaware submitted an FFY 2011 CARTS report, but did
not submit data on any of the initial core set of children’s health care quality measures. For the eight
states that submitted separate data for their Medicaid and CHIP programs (Colorado, Iowa, Kentucky,
Michigan, New York, Pennsylvania, Tennessee, and West Virginia), the state was counted as reporting
a measure if either report included data for that measure.
3
Figure 4. Changes in Medians of Frequently Reported Medicaid/CHIP Children’s Health Care Quality Measures,
FFY 2010 to FFY 2011
100
96.2 96.9
89.9 88.4
90
91.2
90.6
88.8
89.3
80
70
65.2
69.3
State Median
61.3
60
56.5
47.0 47.3
50
40
30
20
10
0
25 Months 12-24 Months
6 Years (n = 37)
(n = 35)
7-11 Years
(n = 37)
12-19 Years
(n = 37)
Percent with a PCP Visit
First 15 Months
(n = 36)
Percent with
6 or More
Well-Child Visits
3-6 Years
(n = 38)
12-21 Years
(n = 29)
Percent with 1 or More
Well-Child Visits
FFY 2011 Median
FFY 2010 Median
Sources:
State data for FFY 2010 obtained from 2011 Secretary’s Report. State data for FFY 2011 from
Mathematica analysis of CARTS reports as of June 20, 2012.
Notes:
For each measure, analysis includes states that used HEDIS specifications to report rates in both the
FFY 2010 and FFY 2011 CARTS reports. In the cases where a state reported rates for both their
Medicaid and CHIP populations, the highest rate of the two populations was used. See Appendix
Tables E.2–E.9 for details.
n = number of states.
PCP = Primary Care Practitioner.
4
Figure 5. Populations Included in Frequently Reported Medicaid/CHIP Children’s Health Care Quality Measures,
FFY 2011
35
31
29
30
28
26
Number of States
25
20
20
19
17
14
15
14
14
13
12
11
10
8
6
5
3
3
2
3
2
6
5
2
0
0
Well-Child
Child and
Visits in the
Adolescent
First 15
Access to
Months of Life
PCPs
(n = 45)
(n = 43)
Well-Child Adolescent Childhood
Visits in the Well-Care Immunization
Visits
Status
3rd, 4th, 5th
(n = 28)
and 6th Years (n = 43)
of Life
(n = 47)
Both Medicaid and CHIP
Adolescent
Immunization
Status
(n = 22)
Medicaid Only
Chlamydia
Screening
(n = 32)
Appropriate
Testing for
Children with
Pharyngitis
(n = 28)
CHIP Only
Source:
Mathematica analysis of FFY 2011 CARTS reports as of June 20, 2012.
Notes:
Figure includes states that used HEDIS specifications to report these measures. Figure excludes states
that used other specifications and states that did not report these measures in FFY 2011 CARTS
reports. In the cases where a state reported rates for both their Medicaid and CHIP populations, the
highest rate of the two populations was used. See Appendix Tables E.2–E.9 for details.
n = number of states.
PCP = Primary Care Practitioner.
5
Figure 6. Data Sources Used for Frequently Reported Medicaid/CHIP Children’s Health Care Quality Measures,
FFY 2011
45
40
40
35
Number of States
30
29
30
27
27
25
25
20
16
15
12
11
0
10 9
9
10
5
12
7
6
6
3
3
3
1
0
Well-Child
Child and
Visits in the
Adolescent
First 15
Access to
Months of Life
PCPs
(n = 45)
(n = 43)
Well-Child Adolescent Childhood
Visits in the Well-Care Immunization
Visits
Status
3rd, 4th, 5th,
(n = 28)
and 6th Years (n = 43)
of Life
(n = 47)
Administrative Data
Hybrid Data
Adolescent
Immunization
Status
(n = 22)
1
Chlamydia
Screening
(n = 32)
1
0
Appropriate
Testing for
Children with
Pharyngitis
(n = 28)
Both Administrative and Hybrid Data
Source:
Mathematica analysis of FFY 2011 CARTS reports as of June 20, 2012.
Notes:
Figure includes states that used HEDIS specifications to report these measures. Figure excludes states
that used other specifications and states that did not report these measures in FFY 2011 CARTS
reports. Hybrid methods rely on both medical records and administrative data to calculate the measure.
States are included in the hybrid and administrative category either if the plans within the state had the
option to use either method or the state submitted separate data for their Medicaid and CHIP programs
and used a different method for each program.
n = number of states.
PCP = Primary Care Practitioner.
6
Figure 7. Performance Measures Evaluating Children or Pregnant Women Included in External Quality Review
Organization (EQRO) Technical Reports for the 2011-2012 Reporting Cycle for 37 States, by General Topic
30
27
26
25
25
25
Number of States
22
22
20
20
18
15
15
14
13
11
10
10
9
8
5
5
0
Immuni- Wellzations Child
Care
Adole- Prenatal/ Primary Asthma STIs
scent Perinatal Care
Access
Well
Care
Mental
Lead
Dental Weight
Health Screening Care Assessment
URI
ADHD Pharyn- Behav- Other
ioral
gitis
Health
Source:
EQRO technical reports submitted to CMS for the 2011-2012 reporting cycle as of July 31, 2012.
Notes:
Alabama, Alaska, Arkansas, Connecticut, Idaho, Maine, Montana, New Hampshire, Oklahoma, South
Dakota, and Wyoming do not have MCOs or PIHPs that enroll children covered by Medicaid or CHIP.
Louisiana, Mississippi, and North Dakota have newly applicable managed care requirements and were
not required to submit EQRO technical reports for 2011. North Carolina submitted an EQRO technical
report, but managed care in the state was limited to behavioral health programs that did not enroll
children, so the state is excluded from the analysis.
Analysis excludes plans that provide only limited services, such as primary care case management.
Analysis also excludes plans that do not serve children or pregnant women, such as long-term care
plans or Medicare Advantage plans that cover dual eligibles.
ADHD = Attention Deficit Hyperactivity Disorder; Pharyngitis = Appropriate Testing for Children with Pharyngitis;
STI = Sexually Transmitted Infection; URI = Upper Respiratory Infection.
7
Figure 8. Comparison of Performance Measures Evaluating Children That Were Reported in External Quality
Review Organization (EQRO) Technical Reports for 29 States, for the 2010 and 2011-2012 Reporting Cycles
25
23 23
23
21
21
22
Number of States
20
18
16
17
16
15
13 13
11
12
10
10
10
9
7
5
8
6
7
7
7
3
0
Immuni- Well-Child Adolescent Primary
zations
Care
Care
WellCare
Access
Asthma
STIs
Lead
Screening
Dental
Weight
Care Assessment
URI
ADHD Pharyngitis
2011-2012
2010
Sources:
Performance measures for 2010 EQRO technical reports obtained from 2011 Secretary’s Report.
Performance measures in the EQRO technical reports for the 2011-2012 reporting cycle from
Mathematica analysis of 2011-2012 EQRO technical reports.
Notes:
States include Arizona, California, Delaware, Florida, Georgia, Hawaii, Illinois, Indiana, Kentucky,
Maryland, Massachusetts, Michigan, Minnesota, Missouri, Nebraska, Nevada, New Jersey, New
Mexico, New York, Ohio, Pennsylvania, Rhode Island, Tennessee, Utah, Vermont, Virginia,
Washington, West Virginia, and Wisconsin. South Carolina submitted EQRO technical reports in 2010
and 2011-2012 reporting cycle, but the 2011-2012 report did not list the performance measures, so the
state is excluded from this analysis. North Carolina submitted an EQRO technical report, but managed
care in the state is limited to behavioral health programs that did not enroll children, so the state is
excluded from the analysis.
Analysis excludes plans that provide only limited services, such as primary care case management.
Analysis also excludes plans that do not serve children or pregnant women, such as long-term care
plans or Medicare Advantage plans that cover dual eligibles.
ADHD = Attention Deficit Hyperactivity Disorder; Pharyngitis = Appropriate Testing for Children with Pharyngitis;
STI = Sexually Transmitted Infection; URI = Upper Respiratory Infection.
8
Figure 9. Performance Improvement Projects (PIPs) Targeting Children or Pregnant Women That Were Included in
External Quality Review Organization (EQRO) Technical Reports for the 2011-2012 Reporting Cycle for 37 States,
by General Topic
30
Number of States
25
20
16
15
11
10
9
9
10
8
7
6
5
4
4
1
1
0
Prenatal/ Well-Child Weight ImmuniPerinatal
Care Assessment zations
Dental
Care
Asthma
Lead
Screening
Mental
Health
ADHD Behavioral Primary
Health
Care
Access
Other
Source:
EQRO technical reports submitted to CMS for the 2011-2012 reporting cycle as of July 31, 2012.
Notes:
Alabama, Alaska, Arkansas, Connecticut, Idaho, Maine, Montana, New Hampshire, Oklahoma, South
Dakota, and Wyoming do not have MCOs or PIHPs that enroll children covered by Medicaid or CHIP.
Louisiana, Mississippi, and North Dakota have newly applicable managed care requirements and were
not required to submit EQRO technical reports for 2011. North Carolina submitted an EQRO technical
report, but managed care in the state was limited to behavioral health programs that did not enroll
children.
Analysis excludes plans that provide only limited services, such as primary care case management.
Analysis also excludes plans that do not serve children or pregnant women, such as long-term care
plans or Medicare Advantage plans that cover dual eligibles. Analysis includes PIPs listed in the
EQRO technical report for each State that specifically targeted children or pregnant women.
PIPs for children on “Other” topics include appropriate treatment for children with pharyngitis (South
Carolina);
assuring Better Child Health and Development (Oregon); communication with child’s doctor
(Georgia); emergency room diversion (Colorado, West Virginia); EPSDT participation rates (Illinois,
Kentucky, Ohio); improving customer service rates (Kansas); improving rates of cervical cancer
screening (California); rating of child’s doctor (Georgia); reduction of Out-of-Home Placement
(California); school attendance rates (California); sexually transmitted infections (Kansas).
Well-Child Care PIPs include PIPs that target well-care visits for children or adolescents.
ADHD = Attention Deficit Hyperactivity Disorder; EPSDT = Early and Periodic Screening, Diagnosis and
Treatment; MCO = Managed Care Organization; PIHP = Prepaid Inpatient Health Plan.
9
Figure 10. Comparison of Performance Improvement Projects (PIPs) Targeting Children That Were Reported in
External Quality Review Organization (EQRO) Technical Reports for the 2010 and 2011-2012 Reporting Cycles for
30 States, Selected Topics
15
Number of States
11
10
9
9
8
8
8
7
6
7
6
6
5
4
3
3
2
1
1
1
0
Well-Child Immunizations
Care
Dental
Care
Asthma
Lead
Weight
Assessment Screening
2010
ADHD
Primary
Care
Access
Behavioral
Health
2011-2012
Sources:
Performance measures for 2010 EQRO technical reports obtained from 2011 Secretary’s Report.
Performance measures in the EQRO technical reports from Mathematica analysis of reports for the
2011-2012 reporting cycle.
Notes:
States include Arizona, California, Delaware, Florida, Georgia, Hawaii, Illinois, Indiana, Kentucky,
Maryland, Massachusetts, Michigan, Minnesota, Missouri, Nebraska, Nevada, New Jersey, New
Mexico, New York, Ohio, Pennsylvania, Rhode Island, South Carolina, Tennessee, Utah, Vermont,
Virginia, Washington, West Virginia, and Wisconsin.
Analysis excludes plans that provide only limited services, such as primary care case management.
Analysis also excludes plans that do not serve children or pregnant women, such as long-term care
plans or Medicare Advantage plans that cover dual eligibles. Analysis includes PIPs listed in the
EQRO technical report for each state that specifically targeted children or pregnant women.
ADHD = Attention Deficit Hyperactivity Disorder.
10
Figure 11. Parents’ Overall Rating of Their Child’s Health Care, by State, 2010
68
Delaware
Iowa
65
Virginia
65
Missouri
64
Kansas
64
West Virginia
64
Pennsylvania
64
Utah
63
South Carolina
63
Arizona
62
Maryland
62
Ohio
60
Tennessee
Median
60
60
(24 States and DC)
Indiana
59
New Mexico
59
Florida
59
New Jersey
58
District of Columbia
58
Colorado
58
Oklahoma
56
Oregon
56
California
55
Connecticut
54
Washington
54
Texas
54
0%
10%
20%
30%
40%
50%
60%
Percentage Reporting a Rating of 9 or 10
70%
80%
Source:
Mathematica analysis of National CAHPS Benchmarking Database.
Note:
Parents assessed overall rating of health on a scale of 0 to 10, where 0 is “worst possible” and 10 is
“best possible.” This figure shows the percentage reporting a rating of 9 or 10.
11
Figure 12. Parents’ Assessment of the Ease of Getting Care for Their Child, 25 States, 2010
Child Can Get Care
for Illness/Injury
as Soon as Needed
76
Child Can Get
Appointment for
Routine Care as
Soon as Needed
65
How Often It Was
Easy to Get
Appointment
with a Specialist
47
0%
10%
70%
20%
30%
40%
50%
60%
Percentage Reporting Always (State Median)
80%
Source:
Mathematica analysis of National CAHPS Benchmarking Database.
Note
Parents assessed the ease of getting care on a four-point scale (never, sometimes, usually, always). The
percentages shown here are the median percentages reporting “always.”
Figure 13. Parents’ Assessment of How Well Their Child’s Doctor Communicates, 25 States, 2010
Child’s Doctor
Shows Respect
for What Parent
Has to Say
81
Child’s Doctor
Listens Carefully
to Parent
78
Child’s Doctor
Explains Things
Clearly to Parent
77
How Well
Child’s Doctor
Communicates
(Composite)
73
Child’s Doctor
Explains Things
Clearly to Child
68
Child’s Doctor
Spent Enough
Time with Child
62
0%
10%
20%
70%
30%
40%
50%
60%
Percentage Reporting Always (State Median)
80%
90%
Source:
Mathematica analysis of National CAHPS Benchmarking Database.
Note:
Parents assessed doctor’s communication on a four-point scale (never, sometimes, usually, always).
The percentages shown here are the median percentages reporting “always.”
12
Figure 14. Geographic Variation in the Percentage of Children Receiving Preventive Dental Services, FFY 2010
WA
MT
ME
ND
OR
MN
ID
WI
SD
NY
WY
MI
IA
NE
NV
PA
IL
UT
IN
OH
CO
CA
KS
AZ
WV
MO
TN
SC
AL
GA
LA
TX
AK
State Median: 43%
State Mean: 41%
FL
47% to 58% (Top Quartile)
43% to 46%
37% to 41%
7% to 36% (Bottom Quartile)
FFY 2010 CMS-416 reports, Line 1b, Line 12b.
13
DC
NC
AR
MS
Source:
VA
KY
OK
NM
HI
VT
NH
MA
RI
CT
NJ
DE
MD
Figure 15. Geographic Variation in the Percentage of Children Receiving Dental Treatment Services, FFY 2010
WA
MT
ME
ND
OR
MN
ID
WI
SD
NY
WY
MI
IA
NE
NV
PA
IL
UT
IN
OH
CO
CA
KS
AZ
WV
MO
TN
SC
AL
GA
LA
TX
AK
State Median: 22 %
State Mean: 23 %
FL
26% to 50% (Top Quartile)
24% to 25%
20% to 22%
5% to 19% (Bottom Quartile)
FFY 2010 CMS-416 reports, Line 1b, Line 12c.
14
DC
NC
AR
MS
Source:
VA
KY
OK
NM
HI
VT
NH
MA
RI
CT
NJ
DE
MD


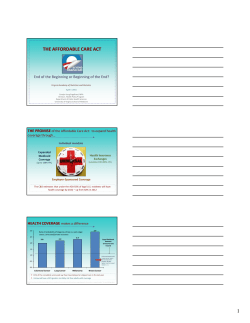

© Copyright 2026