
Do Solar Lamps Help Children Study? Chishio Furukawa
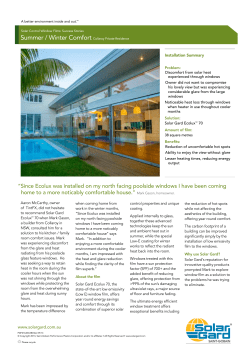
Do Solar Lamps Help Children Study? Contrary Evidence from a Pilot Study in Uganda Chishio Furukawa† First Draft: July 2012 This Draft: January 2013 Abstract Over half a billion children lack adequate lighting and rely on dim, smoky, and dangerous kerosene-based lighting for their evening studies. This paper examines if the brighter, clean, safe, and zero-marginal-cost light of solar lamps enhances children’s learning outcomes. In a randomized field experiment, unexpectedly, solar lamps lowered test scores by 5 points. Given that solar lamps increased reported study time by approximately 30 minutes, this may be due to flickering from lack of full charge that lowered their productivity. The nationwide learning assessment survey suggests that solar lamps likely have insignificant effect on educational attainment. JEL Classifications: I25, O14, Q55 *Special thanks to Andrew Foster for his guidance in economic analysis. I also thank Sriniketh Nagavarapu and David Weil for inspiring this study, and Daniel Prinz for detailed feedback. Hisashi Noma at the Institute for Statistical Mathematics advised statistical analysis. Uwezo Uganda generously shared their data from Learning Assessment Surveys. The Brown International Scholars Program 2011-12; and the Barbara Anton Internship Grant from the Pembroke Center for Teaching and Research on Women; and the Center of Environmental Studies at Brown University provided funding for this research. I am indebted to Ruth Nanteza, Abdulrazaq Nassir, John Ssebayigga, Miho Shinke, and Abdulwahid Ngobya, for their assistance in the fieldwork in Kyannamukaaka, and above all, to the office of Barefoot Power Uganda Ltd., Dirk Kam, Benard Kalyango, Frank Yiga, Joyce Demucci, Annet Nalumansi, and Francis Ejuku, who provided guidance and supplied the solar lamps. Without their support and co-operation from students, parents, and teachers of the Kyannamukaaka community, this research could not have been completed. All errors are mine. † Brown University Class of 2012.5, Sc.B. Applied Mathematics-Economics and A.B. Environmental Studies; Email: [email protected] 1 1 Introduction Lack of adequate lighting critically undermines children’s ability to study in the evening and consequently inhibits their performance in the classrooms. A large fraction of studies on educational policy interventions has focused on improving school environments and student attendance, but not on the household study environment. Previous research has examined, among other things, the impact of merit scholarship (Kremer et al. 2009) [1], textbooks (Glewwe et al. 2009) [2], teacher attendance (Glewwe et al. 2003) [3], midday meals (Vermeersch and Kremer 2004, McEwan 2010) [4, 5] deworming (Kremer and Miguel 2001), eyeglasses provision (Glewwe et al. 2006) [6], and information on the benefits of schooling (Jensen 2010) [7]. This paper examines the educational benefits of introducing solar panel-charged LED lamps for non-electrified rural households. The Lighting Africa program of the World Bank and the International Finance Cooperation as well as various solar light enterprises advocate for the provision of solar lamps. They believe that the bright and clean light can enhance learning of children who use kerosene-based lighting for their homework. Today, approximately 800 million children1 lack access to reliable lighting and rely on dim kerosene candles as their main source of lighting, which inhibits their study through dimness, indoor air pollution, fire risks, and high marginal cost of usage that makes parents unwilling to provide ample kerosene. An abundance of qualitative evidence suggests that solar lamps can be a potential solution to improving the poor household study environments prevalent in Africa and South Asia where electricity is scarce and unreliable. Using experimental and observational evidence from Uganda, however, this paper finds no support for this hypothesis. A pilot randomized field experiment with 204 participants (including siblings) conducted over a period of 1 International Energy Agency [8] reports that there are approximately 2 billion people who do not have access to reliable energy. Given the population composition in developing countries where those with age under 15 has about 40 percent of the entire population, a back-of-the-envelop would give 800 million. Since not all the children go to schools, the number of children who actually study in the evening would be smaller than 800 million. 2 5 months with the most affordable model of solar lamp finds not only no evidence for improvement but also modest evidence for solar lamps lowering children’s test scores. Point estimates are approximately -5 for both English and mathematics and -16 when specified to students in the top quantile at the baseline. In this way, the magnitude is much larger for girls, consistent with results from other studies that girls’ learning achievements depend on their study and efforts more than boys’, and for the students with originally high performance, consistent with the explanation that solar lamps affected those who study hard. An even more perplexing result is that children with solar lamps report an average study time of 30 minutes longer per day than those left with kerosene – while the estimate is much lower than theirs, also consistent with previous field studies reporting longer study time for children who received solar lightings. There are three possible explanations for these contradictory results: (i) significant reporting bias of study time as children do not have a watch or clock at home; (ii) decrease in productivity of study due to the flickering of light when the recharge is done inadequately and the batteries are low; and (iii) additional factors, such as intra-household dynamics that inhibit children from using the lamp that may have led to decrease in test scores. The nationally representative Uwezo Uganda Learning Assessment Survey also suggests that children with solar lamps improved their literacy and numeracy only at similar speed as those with kerosene, failing to support the notion that solar lamps can help children study. Nevertheless, these results are far from implying that solar lamps cannot help in an ideal condition. This study has a number of limitations, including relatively small sample size and short observation time. Furthermore, the solar lamps used in this experiment have already been phased out and replaced by those with brighter LED bulbs and batteries of higher quality. These results, however, do imply three important lessons: first, merely providing solar lamps without thorough training of users for recharge and maintenance is highly likely to be ineffective; second, market distribution has likely been contributing to positive selection where only those who are careful and can learn how to use solar lamps actually adopt the technology, implying that scaling up 3 may eventually face a limit; and third, field experiments, in addition to wellcontrolled laboratory experiments, and measurement of actual outputs (test scores), in addition to inputs (study time), are necessary in order to make accurate prediction of robustness and effectiveness of new technologies. This paper proceeds as follows: section 2 will discuss the background and review previous literatures; section 3 will explain the details of randomized evaluation and the learning assessment data; section 4 will present the results from the randomized evaluationand the learning assessment survey; and section 5 will include some concluding remarks. 2 2.1 Lighting and Learning Lighting Sources in Rural Uganda According to the Uwezo Uganda Learning Assessment Survey, over 70 percent of Ugandan households use simple wick kerosene candles, which are the least costly source of lighting in the short-run, but provide only around one lumen of light. In contrast, 2 percent use solar lighting, which requires relatively high capital investment, but provide brighter light of 15 lumens for some options. Electricity users remain as few as 5 percent, and many of them do not have access to a reliable source. (Appendix Table 1) There are three important pathways through which the use of kerosene candles can limit students’ study at home. First, the dimness of light can make children inefficient and less focused on their work. Second, serious air pollution emitted from kerosene candles harms children’s visionary and air quality-related health. Fire risks posed by kerosene candles discourage children from continuing to study. In a related study (Furukawa 2012) [9], I find that the health and safety consequences of using kerosene candles are substantial. Third, the high marginal cost of burning kerosene makes parents unwilling to provide enough kerosene for children to continue their studies. In a survey of children, “no more kerosene left” (45.74 percent) and “parents told to stop” (21.28 percent) were the second and the third most common reasons for going 4 to bed without completing their homework, after the top reason, being “too tired” (46.81 percent)2 . Until today, there have been few studies that have examined the impact of solar lamp provision on the hours of study and found positive impacts. Given these results, the World Bank Lighting Africa program suggests “facilities can extend to other potential grants/funds aimed at supporting the health, education, etc. impact of solar portable lights.” Agoramoorthy and Hsu (2009) report that by using a 5-7 W panel that costs 87.5USD they were able to increase the average number of study hours per night from 1.47 to 2.71. [10] Although they claim that “this increase in study hours has had a positive influence on students’ performance at school,” they do not present any evidence of such an improvement. This study furthers these previous studies, first, by using 1W3 panels costing about 15USD, which is more affordable and scalable, and second, by collecting the students’ test scores. 2.2 What Improves Learning Outcomes What are the most effective ways to improve children’s learning outcomes? This is the central question that a number of education economists have been asking in the past decade, both in the context of developing and developed countries. There are three important pieces of evidence especially relevant to analyzing the impact of solar lamps on children’s educational outcomes: First, there is some evidence confirming the causal impact of increased study time on school achievement. The correlation between the two is not entirely driven by omitting variables such as attitude and ability, but there is likely a significant causality. Using the probability of being paired with a roommate with video games as an instrument, Stinebrickner and Stinebrickner (2007) estimate a large impact of study time and efforts on students’ achievement. [11] Although this paper is concerned with upper primary school stuThis survey asked up to three reasons that they stopped studying without completing homework. 3 The study only used 0.5W panels in the first month. However, given that rainy season could be a serious concern for solar lamps’ function, the researchers provided 1W panel later on. 2 5 dents, it is likely that students’ study plays a significant role in determining their school learning outcomes. Second, girls’ achievement is generally more dependent on their study environments and incentives than boys’. In a certification reward randomized trial in Israel, Angrist and Lavy (2009) find substantial impact for girls, but not for boys. [12] This result is consistent with the finding of Anderson (2008) that an early childhood intervention had a substantial impact for girls in both short- and long-term, but no effect for boys for long-term. [13] By comparing the magnitude of effect for girls and boys, this paper aims to further examine if the effect of introducing solar lamps reflects such gender differences. Third, providing higher incentives is generally more effective than providing better study environments in improving children’s learning outcomes. Some of the most successful programs in improving children’s learning outcomes are merit scholarships (Kremer et al. 2004) [1] and financial incentives for inputs (Fryer 2010) [14]. On the other hand, some other programs such as providing textbooks or midday meals showed positive impact on achievement only among the subgroup that were more capable of harnessing such resources; only the top quarter improved their test scores from provision of textbooks, and only schools with experienced teachers improved their test scores from midday meals (Vermeersch and Kremer 2004). [4] At the same time, McEwan (2010) found no evidence of improvement in test scores for midday meals provision using a regression discontinuity approach. [5] Deworming program in Kenya substantially increased children’s school participation, but had a limited impact on their achievements(Miguel and Kremer 2001). [15] Considering these pieces of evidence, ex ante, it can be expected that provision of solar lamp may actually have limited impact on children’s achievement. 6 3 Data This paper combines experimental and observational data from Uganda. The experimental data is from a 5-month pilot randomized field experiment by Barefoot Power Uganda Ltd 4 in seven primary schools in Kyannamukaaka, rural Uganda. The observational data is from the Uwezo Uganda Learning Assessment Survey 2011. 3.1 Randomized Evaluation in rural Uganda, 2011 This pilot randomized evaluation was designed to assess if the most affordable solar lamps can enhance children’s study efforts and increase their test scores in relatively high maintenance services5 . Although it would have been ideal to use a brighter lighting source in order to test the maximum possible benefit of introducing the technology as a pilot study, the $10 solar lamp was chosen because it is more scalable and suitable given the funding for this study. 3.1.1 Participants The research team recruited 155 upper primary school students between grades 5 and 7. Since this trial also assessed the impact on children’s health, it targeted those who reported some respiratory symptoms, like coughing, chest pain, and difficulty breathing during the baseline survey. As a pilot experiment, we were not able to conduct any power calculations that would reach statistical significance. However, to increase the sample size and draw implications for the intra-household dynamics of solar lamp usage, the research team also collected test scores from siblings of students reported (29 additional observations). Barefoot Power Uganda Ltd. is a solar lamp enterprise that designs and distributes solar lighting in Uganda. Its major products include the Firefly series, which has various degrees of lighting, and the larger-scale PowaPack series. The company received Lighting Africa 2010 Outstanding Product Award. (http://barefootpoweruganda.com/) 5 During the resurveys, the surveyors asked if the lamps were functioning well. If the student said no, they replaced the students’ lamps with the properly functioning lamps. 4 7 The additional inclusion criteria included day school students, the usage of kerosene candles as a main lighting source, parents’ participation in the baseline survey, absence of elder siblings in the study group to avoid withinhousehold spillover effect. (Appendix Figure 1) There was no previous study, thus, power calculation could not be conducted. 3.1.2 Interventions This research used Firefly 56 , which has 5 LED bulbs that collectively provide 15 lumens. Through a public lottery of a coin toss at each school, the team distributed the lamps to half of the participants (73). One of the research team members was officially trained by the Barefoot Power Uganda Microfranchise Training Program and learned how to teach the users how to charge the lamps. The research team provided training regarding how to use the lamps; demonstrating to put it on the roof or on the ground so that sunrays can hit perpendicularly and conveying to be careful of relatively vulnerable parts such as the button and the neck. Realizing that a 0.5W panel may not be sufficient for adequate recharge during the rainy season, the research team supplied 1W panels a month after the intervention. For ethical consideration, students in the control group were also given solar lamps in December upon the conclusion of the study. Since reselling was a potential threat that increases dropouts, the participating schools kept the panels at school for the first two weeks so that children would have to bring back the lamps every morning for recharge. As panels and lamps were given separately, reselling did not become a large concern. To further encourage compliance, the research team replaced the lamps with any faultiness every month after the intervention. About 20 lamps were replaced in the first month, but after introducing the 1W panels, this came to no more than 10 lamps. 6 Firefly 5 is the cheapest option at only $10. 8 3.1.3 Assessments This research aimed to assess children’s effort level, proxied by reported study time, and their actual school achievement, proxied by test scores. Students’ test scores were reported by school teachers, and their siblings’ test scores were reported by the students themselves, as some siblings were in different schools. There were four periods of test scores reported: the 1st semester’s final exam as baseline, the 2nd semester’s final that was 2 months after the intervention, the 3rd semester’s mid-term, which only some schools had, and the end-ofacademic year final that grade 7 pupils took at the national level, and grade 5 and grade 7 pupils took at each of their schools. Since the nation-wide exam was marked on a scale of 10, it was multiplied by 10 to make the range of test scores consistent. 3.1.4 Limitations: Threats to Internal Validity There are five major threats to the internal validity of this research: validity of randomization, lack of full recharge, sensitization, differential dropouts, and income effects. These factors altogether may have underestimated the efficacy and benefits in the ideal situation of solar lamp provision. 1. Validity of Randomization: Table 17 checks the extent to which randomization was valid with respect to various underlying household characteristics. It confirms that the treatment and control group have jointly insignificant differences (F-statistic=0.91) from one another. A few variables that show statistically significant differences are uniform ownership, cooking time, and number of children under 18 living together. However, these do not show any systematic biases. 2. Lack of Full Recharge: When the solar lamps could not be charged fully, they shed light only for short periods of time (47 percent report a shortage of light) and experience flickering problems (45 percent report flickering of light). In these times, some children in the treatment group decided to use kerosene candles again. There was a rainy season between October and 7 This table is exactly the same as a related paper (Furukawa 2012). 9 December, which may have further inhibited the recharge process. 3. Attenuation (Sensitization among kerosene candle users): After hearing that kerosene candles were not good for health, some households in the control group purchased electric torches or kerosene lanterns, which provide better lighting. There were 24 students who reported that they purchased torches. This leads to underestimation of positive results and overestimation of negative results. 4. Attrition: There were a few cases of dropouts from the study. One student in the control group had her best friend who was in the treatment group, and thus, they studied together using solar lighting. One student had his lamp stolen. Nevertheless, they were included as the Intention-to-Treat estimation would be more appropriate than the Treatment-on-Treated estimation. 5. Siblings’ Selection Bias: Since siblings’ test scores depended on students’ ability to recall their siblings’ test scores, there is a significant bias where siblings’ average test scores were 34.58 point higher than the students themselves. (t=20.7) This difference may be due to reporting or recalling bias. Nevertheless, inclusion or exclusion of the siblings’ test scores did not alter the regression results. 3.2 Uwezo Uganda Learning Assessment Survey 2011 Uwezo Uganda conducts nationwide learning assessment surveys in literacy and numeracy every year since 2009, in order to evaluate the extent to which children are actually learning. They designed primary school level Mathematics and English tests, and collected data from approximately 48,000 households in 2011. The survey contains a wealth index, which includes asset information and basic living conditions, and most importantly, lighting sources. One limitation is that the survey does not ask the type of solar lamps each household uses. Therefore, it is difficult to examine if the solar lamps they use were the most affordable type or rather the expensive type that has larger panels and brighter light than the most affordable options. 10 4 Results 4.1 4.1.1 Randomized Evaluation Test Scores Table 2 presents the summary regression results with respect to each time period as in Equation (1). The control variables are age, gender, class, sibling dummy, and imputed log of household expenditure8 . T estScoreit = α0 + α1 T RTit + α2 Xit + εit (1) Since the trial was randomized, the test score before the solar lamp distribution is not statistically significantly different. Nevertheless, it is important to note that there was a large difference of (-3.7) when the control variables were added. This raises a concern of failure to randomize; the treatment was weakly correlated with the underlying characteristics so that the point estimate also changed. This is due to a small sample size. However, for average test scores both with and without controls, the solar lamp group performs lower and lower over time, making the difference in test scores of final exam for 3rd semester statistically significant at 90 percent and at 95 percent with control variables. The magnitude of α1 is -6.5 on a scale of 100, which should be considered practically significant. The magnitude of impact is larger for girls, which is consistent with the previous findings that girls’ test scores depend on their study more than boys’. For girls’ scores of mathematics, the point estimate was -9.7 points, significant at the 95% confidence level. The results are not driven entirely by Mathematics or entirely by English. This is also consistent with a questionnaire that children find lack of lighting as a contributing factor inhibiting their study for both subjects. Given that the difference becomes larger over time, regressions with a difference-in-difference specification as in Using the data from Uganda National Household Survey 2005/06, the income level was computed as follows: log(household expenditure) = 0.5679545×TVradio + 1.106305×bicycle + 0.3776105×motorcycle + 0.4172422×phone + 11.45439 8 11 Equation (2) can identify the statistical significance of the trend: T estScoreit = β0 + β1 T RTi + β2 T RTi ∗ timet + β3 Xi + ft + εit (2) Here, the time fixed effect is appropriate because the test scores depend on overall difficulty of tests that vary from time to time. The coefficient of interest is β2 . Control variables (Xi ) are included in order to reduce the standard error. They include age, class, gender, imputed log household expenditure,9 and a sibling dummy. The time variable is omitted due to multicollinearity. Missing values are dummied out. Table 3 shows that there are both statistically significant and insignificant (but consistently negative) coefficients depending on the exact specification. With all specifications, the β2 remains relatively constant. The p-values from the Hausman test were 0.003 for time fixed effect in Mathematics and the average, indicating that the estimation from time random effect is inconsistent. Therefore, I report the specifications that give consistent estimators, excluding time random effect. The β2 is about -0.9 to -1.1, which means that, on average, the test scores declined by about 1 point as the students with solar lamps took the next test. After the study period, this accumulated to about 5 points in decline. The standard deviation changes with various specifications: random effect and clustering at the individual levels have coefficients 9 Since it was impossible to directly ask the wealth level, the questionnaire included some asset information that can help approximate the expenditure. Using the Uganda National Household Survey, I constructed the income variable with the following formula: Log(household expenditure)=-0.196×bednets+0.172×radioorTV+0.632×mobilephone +0.466×bicycle+0.0584×averagenumberofmeals+0.744×othertypesofstoves +1.456×improvedfirewoodstove+0.293×improvedcharcoalstove+0.39×traditionalmetalstove +0.611×gravityflowscheme+0.36×river,stream,lake,pond+0.15×protectedwell/spring +0.142×borehole-0.845×privatelyconnectedpipeline+0.568×cement1.148×earthandcowdung +0.215×othertypesofwall-0.156×burntbrickswithcement+0.0973×burntbrickswithmud +0.346×un-burntbricks-0.341×mudandpoles+-0.72×thatchandstraw+0.208×ironsheetroof -0.0355×asbestos+1.188×tiles-0.0606×othertypesofroof-0.0115×everychildhasblanket+11.64 Here, I choose log expenditure because it is (i) less subject to seasonal variation compared to income and (ii) log makes the distribution normal, which is less subject to extreme values than log normal. 12 significant at 90 percent. The sub-group analysis shows that boys experienced minimal effect whereas girls lost points considerably: β2 for girls is about -1.4. This variation is similar to the other studies discussed in the introduction. In addition, Mathematics has β1 of around -0.8 and English has β2 of about -1.0. These are not significantly different from one another, but just by cutting the threshold value, English has a few specifications that make its β2 , at 90 percent, significant. Given that many students reported that they feel a lack of lighting would affect their mathematics more, this result is not consistent. However, some may say that reading would require more bright light than thinking about mathematics problems. 4.1.2 Reported Study Time Another outcome of interest was study time: previously, it was reported that solar lamps can allow children to study for a longer time because of brighter light, lack of health and fire risks, and lack of concern for kerosene running out. Table 3 confirms this result: students with solar lamps, on average, reported 0.43 hours longer study time (p<0.01). This holds with school fixed effect. Furthermore, this increase was more significant for girls (0.52 hours with p=0.008) than for boys (0.34 hours with p=0.102), and more significant for the participants themselves than for their siblings. 4.1.3 Sub-group Analysis for Top Quintile Students A study on the impact of textbooks (Glewwe et al. 2007) conducts a sub-group analysis for top quintile students and finds significant impact among them.[2] They argue that this is because those who can study from English textbooks can benefit from textbook provision. They do not find such impact among others. In a similar way, it is helpful to check if the top students actually performed especially lower compared to other students. The summary statistics suggests that 52.5 point is the approximate quantile cut-off point. Table 3 presents the result of regression above and below the 13 52.5 points in the baseline. This analysis finds that the top quintile group has a coefficient of -16.1 points while the others have coefficient of -0.9. To confirm, at the baseline, there was no difference between the two groups. This result is consistent with the explanation that solar lamps affect children’s performance through their study – the large drop in test scores was driven by the top students who study, not by students who do not study. It is also possible that, depending on how the tests are designed and curved, it may be easier for top students to lose the points. 4.1.4 Discussion It is perplexing that while reported study time increased, children felt encouraged to study, and children’s health moderately improved, their test scores went down. A few potential explanations are: a. Reporting Bias in Study Time Although test scores are not subject to reporting bias because they are given from the school teachers, study time may be subject to reporting bias. Those who received solar lamps may have felt that they were studying more or were motivated to report longer study times out of a sense of gratitude. In fact, many households did not have a watch or a clock at home, thus, it was difficult for the students to know the precise length of their study. b. Decrease in Study Productivity If the study time indeed increased but the test scores decreased, then it must be the case that their study productivity dropped substantially. What could explain such a drop in productivity? • One significant concern of solar lighting is inappropriate recharge, which leads to the flickering of light or a shortage of lighting time. To recharge the battery fully, the panels must be exposed to the sun throughout the day at a right angle. Although the researchers informed the students how to recharge, this was particularly difficult for households to implement. Consequently, 47 percent of those who received solar lamps reported that they experienced flickering and 48 percent reported some shortage 14 of lighting. When the solar lamps stopped working, 34.7 percent said they gave up on their work and 48.6 percent said they switched back to kerosene candles. Nevertheless, if the households did not prepare the kerosene, then the children would be forced to stop. When the solar lamps start flickering, 64.6 percent said that they kept studying even under such light, 6.25 percent said that they stopped studying, and 29.17 percent said that they switched to another lighting source. • Another possible explanation is that the children actually did not get to use the solar lamps due to their parents’ or other siblings’ usage. Since children generally have weak negotiation power within the households, other members who want to use the solar panel may have used them for themselves. It is also important to note that 96 percent of the students who participated in this study and received the solar lamps reported that their quality of study improved after receiving the lamps. This critical contradiction between the qualitative and quantitative evidence suggests that the test score results are either largely subject to the error or that the direct question from the researchers regarding the benefit of intervention is often unreliable due to reporting biases out of the participants’ sense of gratitude. 4.1.5 Empirical Tests for Hypotheses Which of these explanations match the data? The first hypothesis of reporting bias is difficult to test, but is likely to be true given that 48 percent of those who received solar lamps said that they experienced some shortages of lighting. Although positive, the correlation between study time and test score is not statistically significant. (Appendix Table5) The second hypothesis may contribute to the decline in test scores because 47 percent report that they experienced flickering, but it may still not be the driving force. The third hypothesis is unlikely to be very significant because children seem to have been using the solar lamps for themselves. In a follow-up questionnaire, 77 percent 15 of the students reported that they had no conflict using the solar lamps with other siblings and only 19 percent said they did. All in all, none of these three explanations seem to match the data perfectly: perhaps it is a combination of these factors and some noise due to the relatively small sample size that caused these results. Lastly, I would like to note the possibility that this study may have underestimated the negative impact of solar lamps on education due to the experimental effect: evidence suggests that those who received solar lamps felt encouraged to study10 whereas 61 percent (34/55) of those who were left with kerosene felt discouraged to study.11 Overall, the direction of bias is ambiguous because attenuation could have led to an overestimation of negative results, but encouragement effect could have led to their underestimation. 4.2 Learning Assessment Survey It is helpful to check if the results of the randomized trial are consistent with the observational data. 4.2.1 Endogenous Regression Table 4 presents the endogenous regression results of test scores on the choice of lighting sources as in Equation (3): T estScoreij = γ0 + γ1 Lightij + γ2 Xij + εij (3) Compared to kerosene candle group, electricity, kerosene lantern, and solar lamp group perform significantly higher, even after controlling for underlying features. At the same time, the magnitude of coefficient drops as more and more control variables are added. this is only an endogenous regression with significant omitted variable bias, such as preference for education and access Among 55 students with solar who were surveyed, all of them answered that they were “very encouraged” to study when asked “Do you feel encouraged to study?” 11 In contrast, 17 percent (7/41) of those who received the solar lamps reported that they felt discouraged to study. 10 16 to the market; no causation can be claimed from this analysis. Nevertheless, the observation that kerosene lanterns’ coefficients are generally and slightly higher than the solars’ was unexpected. Since the exact types of solar lamps and kerosene lanterns are not reported, it is impossible to make a comparison between the two in a precise way. 4.2.2 Cross Sectional Endogenous Analysis One way to check if this difference in learning outcome comes from the pathway of interest – differential productivity due to provision of brighter, safer, and healthier light with zero marginal cost – is to see whether the improvement in test scores is faster for those with solar lamps as compared to those with kerosene candles. Figure 2 presents the change in average test scores over age. While this largely depends on test design, if everything is held constant and solar lamps do help children study, then there should be a steeper increase in test scores over age. Nevertheless, this is not what is observed. The difference in learning attainment is observed just from age 6 (Primary 1) and the difference remains more or less unchanged until age 10. Note that the questions were set at the level of primary 2. Therefore, beyond age 9 or 10, the improvement in children’s learning outcome is no longer reflected in an increase in test scores. In this way, focusing on the age range of 6 to 9 or 10 would likely give more accurate analysis. It is likely that solar lamps is no better improvement than kerosene lanterns, and even compared to kerosene candles, the impact is practically insignicant. Here, the primary concern is that a significant selection bias that may have led to the overestimation of the effect: choice of better lighting is most likely positively correlated with the ability to learn faster. This is analogous to other studis that found positive impact with observational data, but no impact with experimental ones. (Kremer 2003) [16] Even with this omitted variable that would give positive selection bias, there does not seem to be any positive impact. Therefore, it is likely that the effect of solar lamps is insignificant. 17 4.2.3 Discussion on External Validity of the Randmoized Evaluation A valid instrument for the adoption of solar lamps is, in fact, very difficult to find. Possible candidates are geographic variation of (i) rain and (ii) insolation. Rainfall fails to satisfy the instrument validity because it affects solar lamp adoption in two main ways: it discourages solar lamp adoption because panels can become spoiled after continuous exposure to the rain, and it also encourages adoption because it produces higher seasonal income, which allows households to purchase them. Moreover, these factors contribute to solar lamp adoption and function in the long-run, which no longer have a significant idiosyncratic variation like they do in the short-term, and thus, be correlated with the underlying factors such as agricultural productivity, income, and socioeconomic well-being. Insolation, intuitively, may seem to affect children’s learning outcome only through the adoption and functionality of solar lamps. However, again, insolation is correlated with rainfall, making the exogeniety condition unsatisfied. Does this result indicate that the distribution of solar lamps actually hinders children’s study? The probable answer is no, because households typically stopped using solar lamps after observing that they did not improve the quality of lighting. The experimental effect of encouraging these children to keep using the solar lamp may have played a significant role in making them study even under the flickering light of solar lamps. Researchers conducted a resurvey in June 2012, six months after the study was complete. Many students changed schools, and response rate was 47 percent. Among them, only 33 percent kept using the solar lamps and over 60 percent returned to using kerosene candles. After active checking of usage stopped and maintenance service became unavailable, many children were unable to keep using the solar lamps. Nevertheless, 56 percent said that the household was planning to purchase another solar lamp, 80 percent said they would be willing to pay for repair, and 84 percent said that the lamps met their expectation. Therefore, despite the limitations that the solar lamps may have had, households still seem to be willing to invest in the new technology. 18 Furthermore, there is a sign that the users are able to learn how to recharge the lamps appropriately over time: all of those who were resurveyed said they put theri panels either on the roof or on the ground while there used to be those who hang them on the wall (Figure 4 in Appendix), which is an inefficient way to recharge the batteries. 5 Conclusion Solar lamps are seen as some of the most robust alternative energy sources for bringing modern lighting to developing countries and thereby improving the educational environment, health, and safety of rural households. However, this study shows that benefits of solar lamps are mixed: while health and safety show evidence of improvement, children’s learning outcomes show no such evidence; in fact, those who received the solar lamps performed, on average, 5 points lower compared to those who kept using kerosene candles after five months. The exact reason for this unexpected result remains unclear; it may be an error due to relatively small sample size (n=204), shortage or flickering of light that made the lamps provide unstable light due to lack of full recharge, or intra-household mechanisms that prevented children from using the lamps. Currently, the World Bank Lighting Africa program rewards Outstanding Product Award to the lamps that were identified as reliable and user-friendly. Although the lamps used in this project came from the same series of solar lamps that received the award, they still experienced signicant challenges in the field. This study highlights the importance of long-term field evaluation of durability of the products. Since the result largely contradicts anecdotal evidence, it is critical to examine whether the same results hold for future trials. Although the technologies themselves may appear to provide clear benefits, technologies combined with inappropriate usage may inhibit such benefits or, even diminish the quality of life. Given the importance and potential of this technology, future efforts and research should explore possible solutions such as (i) local maintenance mechanisms that households can rely on; (ii) thorough users training programs that reinforce appropriate usages; and (iii) reconsid19 eration of the balance between the brightness of LED bulbs and the size of solar panels to ensure the long-term functioning. 20 References [1] Michael Kremer, Rebecca T. Edward Miguel M. Edward Miguel: Incentives to Learn. In: The Review of Economics and Statistics 91 (2009), S. 437–456 [2] Paul Glewwe, Michael K. ; Moulin, Sylvie: Many Children Left Behind? Textbooks and Test Scores in Kenyal. In: American Economic Journal: Applied Economics 1 (2009), S. 112–35) [3] Paul Glewwe, Nauman I. ; Kremer, Michael: Teacher Incentives. In: NBER Working Paper (2003) [4] Vermeersch, Christel ; Kremer, Michael: School Meals, Educational Achievement and School Competition: Evidence from a Randomized Evaluation. In: World Bank Policy Research Working Paper (2004) [5] McEwan, Patrick: The Impact of School Meals on Education Outcomes: Discontinuity Evidence from Chile. (2011) [6] Paul Glewwe, Meng Z. Albert Park P. Albert Park: The impact of eyeglasses on the academic performance of primary school students: Evidence from a randomized trial in rural China. In: Working Paper (2006) [7] Jensen, Robert: The (Perceived) Returns to Education and the Demand for Schooling. In: The Quarterly Journal of Economics 125 (2010), S. 515–548 [8] International Energy Agency: Energy for all: Financing access for the poor. (2011) [9] Author: Health and Safety Benefits of Replacing Kerosene Candles by Solar Lamps: Evidence from Uganda. In: Brown University Manuscript (2012) [10] Agoramoorthy ; Hsu: Lighting the Lives of the Impoverished in India’s Rural and Tribal Drylands. In: Human Ecology 37 (2009), S. 513–517 21 [11] Stinebrickner, Todd ; Stinebrickner, Ralph: The Causal Effect of Studying on Academic Performance. In: NBER Working Paper (2007) [12] Angrist, Joshua ; Lavy, Victorr: The Effects of High Stakes High School Achievement Awards: Evidence from a Randomized Trial. In: The American Economic Review 99 (2009), S. 301–331 [13] Anderson, Michael: Multiple Inference and Gender Differences in the Effects of Early Intervention: A Reevaluation of the Abecedarian, Perry Preschool, and Early Training Projectsl. In: Journal of the American Statistical Association 103 (2008), S. 1481–95 [14] Fryer, Roland: Financial incentives and student achievement: Evidence from randomized trials. In: The NBER Working Paper (2010) [15] Kremer, Michael ; Miguel, Edward: Worms: Education and Health Externalities in Kenya. In: The Poverty Action Lab Paper (2001) [16] Kremer, Michael: Randomized Evaluations of Educational Programs in Developing Countries: Some Lessons. In: The American Economic Review 93 (2003), S. 102–106 22 A. Figures and Tables Figure 1: Difference in Average Test Scores 23 Figure 2: Uwezo Uganda Learning Assessment Survey Change in Literacy and Numeracy 24 Table 1. Baseline Descriptive Statistics Household characteristics Household head is father Household head is farmer Household head's years of education Main dwelling is permanent Num. of kerosene candles at home Num. children below 18 living together Num. older children living together Cookstove if 3-stone stove Num. rooms in main dwelling Each child owns blanket at home Each member has at least two clothes Floor made of cement Wall made of bricks Water comes from unclean sources Treatment Mean Observations (1) (2) .5 74 (.5034) .8108 74 (.3943) 6.8571 70 (3.0988) .5 74 (.5034) 1.9444 72 (.6897) 5.2394 71 (2.728) 2.4058 69 (2.6696) .527 74 (.5027) 3.9054 74 (1.2405) .5811 74 (.4967) .5405 74 (.5018) .2838 74 (.4539) .6757 74 (.4713) .5921 76 (.4947) Control Difference Mean Observations Mean (3) (4) (5) .5072 -0.007 69 (.5036) (0.084) .8551 -0.044 69 (.3546) (0.063) 6.0484 0.809 62 (3.0911) (0.540) .5072 -0.007 69 (.5036) (0.084) 1.9032 0.041 62 (.6945) (0.120) 4.3676 0.872** 68 (2.4671) (0.441) 2.2698 0.136 63 (2.1191) (0.418) .6377 -0.111 69 (.4842) (0.083) 4.0294 -0.124 68 (1.486) (0.231) .6029 -0.022 68 (.4929) (0.083) .6029 -0.062 68 (.4929) (0.084) .2754 0.008 69 (.45) (0.076) .6957 -0.020 69 (.4635) (0.078) .5443 0.048 79 (.5012) (0.080) Note: robust standard errors in parenthesis. There are few missing values due to missing entries in the survey. "Water comes from unclean sources" means that water sources are either unprotected well or river. Table 1. Baseline Descriptive Statistics continued Individual characteristics Gender (male) Grade (either P5, P6, or P7) Age Wear uniform Wear shoes Have registered lunch at school Use bed net last night Sleeping with kerosene candles on Did homework in the past 7 days Time students cooked Experienced illness or injury in 30 days Num. days suffered from illness or injury Difference Treatment Control Mean Observations Mean Observations Mean (1) (2) (3) (4) (5) 0.3947 .4937 -0.099 76 79 (0.492) (.5032) (0.080) 5.7237 5.8101 -0.086 76 79 (.7411) (.7524) (0.120) 12.942 13.1452 -0.203 69 62 (1.5707) (1.7727) (0.294) .7027 .5588 0.144* 74 68 (.4602) (.5002) (0.081) .2568 .2941 -0.037 74 68 (.4398) (.459) (0.076) .6757 .6029 0.073 74 68 (.4713) (.4929) (0.081) 0.257 0.25 0.007 74 68 (0.525) (0.436) (0.081) .1831 .0984 0.085 71 61 (.3895) (.3003) (0.060) .662 .6613 0.001 71 62 (.4764) (.4771) (0.083) 1.9571 2.803 -0.846** 70 66 (1.7729) (2.4001) (0.364) .7397 .8182 -0.078 73 66 (.4418) (.3887) (0.070) 3.5139 4.8462 -1.332 72 65 (3.3651) (5.8769) (0.830) F-Statistics: Difference Jointly Significant=0.91 p -value=0.59 -4.045 (4.595) 74 0.011 -8.159* (4.442) 66 0.315 -1.124 (4.779) 70 0.001 -5.377 (3.680) 64 0.512 -5.187 (4.011) 84 0.020 -8.549** (3.582) 76 0.318 1.357 (8.364) 32 0.001 2.294 (7.996) 28 0.467 -3.322 -2.004 (3.060) (4.696) 201 97 0.006 0.002 -7.505*** -0.457 (2.677) (3.987) 179 85 0.349 0.443 -5.399 (4.448) 74 0.019 -9.579** (4.690) 66 0.266 -5.450* -1.501 (3.153) (3.267) 176 169 0.017 0.001 -9.107*** -4.697* (2.878) (2.541) 159 151 0.310 0.422 -0.111 (3.028) 201 0.000 -2.393 (2.371) 179 0.451 -1.038 (4.463) 117 0.000 -3.547 (3.663) 103 0.454 Observations R-squared (iii) Girls A. TRT Observations R-squared B. TRT -3.407 (6.920) 34 0.007 -1.296 (6.202) 31 0.510 -5.859* 0.815 (3.064) (3.309) 176 168 0.021 0.000 -7.349*** -2.679 (2.677) (2.788) 159 150 0.375 0.355 -0.089 -2.227 -3.583 -8.641** 0.531 -3.415 -3.423 -7.578* -0.585 (4.310) (4.230) (5.560) (4.214) (4.480) (4.443) (5.711) (4.345) (4.708) Observations 99 117 65 102 98 117 65 102 99 R-squared 0.000 0.002 0.007 0.041 0.000 0.005 0.006 0.030 0.000 B. TRT -2.738 -5.672 -4.002 -7.133* -2.183 -7.796* -1.710 -9.440** -3.243 (3.534) (3.487) (4.427) (3.763) (4.251) (4.051) (5.475) (4.227) (3.421) Observations 87 103 57 93 86 103 57 93 87 R-squared 0.438 0.453 0.572 0.417 0.302 0.377 0.487 0.334 0.488 Notes: (i) Robust standard errors in parentheses: *** p<0.01, ** p<0.05, * p<0.1 (ii) Row A presents regression estimates without controls and row B presents one with controls. (iii) Sample size for 3rd mid-term is smaller than others because not all schools had the mid-term arranged. -2.889 (3.642) 84 0.007 -5.155* (2.949) 76 0.443 -2.650 (4.017) 70 0.006 -6.484* (3.245) 64 0.506 -3.011 (4.333) 99 0.005 -3.189 (3.222) 88 0.529 -0.590 (3.864) 84 0.000 -1.762 (3.163) 76 0.455 -1.717 (2.871) 201 0.002 -4.949** (2.259) 179 0.444 -0.394 (3.050) 169 0.000 -3.744 (2.318) 151 0.450 -4.177 (4.101) 70 0.013 -7.591* (4.002) 64 0.330 Observations R-squared (ii) Boys A. TRT Observations R-squared B. TRT (i) Boys and girls A. TRT -2.432 (5.583) 73 0.003 -6.648 (5.144) 65 0.297 -6.181* (3.473) 175 0.018 -5.534* (3.103) 158 0.367 -3.744 -9.704** (6.101) (4.720) 65 102 0.006 0.041 -6.294 -4.826 (4.735) (4.230) 57 93 0.501 0.424 -6.786 (7.219) 33 0.025 -5.435 (7.205) 30 0.413 -3.818 (4.709) 98 0.007 -6.948* (3.642) 87 0.463 Average English Mathematics 1st Final 2nd Final 3rd Mid 3rd Final 1st Final 2nd Final 3rd Mid 3rd Final 1st Final 2nd Final 3rd Mid 3rd Final (1) (2) (3) (4) (5) (6) (7) (8) (9) (10) (11) (12) Table 2. Summary of Test Scores English Average Score Average Score All Boys Girls Study Time (hrs) TRT*time (1) -1.088 (0.868) -0.967 (0.947) -1.154 (0.911) -0.361 (1.175) -1.559 (1.212) -2.874** (1.165) -0.0657 (0.768) TRT*time (2) -0.894 (0.758) -0.763 (0.859) -1.054 (0.834) -0.0833 (1.065) -1.478 (1.036) -2.606** (1.135) 0.0734 (0.781) TRT*time (6) -0.894* (0.535) -0.763 (0.678) -1.054* (0.572) -0.0833 (0.879) -1.478** (0.684) -2.606*** (0.734) 0.0734 (0.658) 0.414*** (0.147) TRT (7) Regression Model OLS OLS Indiv RE Indiv RE Time FE Indiv cluster OLS Control Variables No Yes No Yes Yes Yes No Notes: (i) Robust standard errors in parentheses for columns (1)-(5), (7)-(8), and clustered standard errors in parentheses for column (6) *** p<0.01, ** p<0.05, * p<0.1 (ii) More details of regressions available in appendices. All 2nd-4th Qtl Average Score 1st Quintile Average Score Mathematics All Coefficient estimated for: Population Dependent Variable All Average Score Table 3. Regression Retults TRT*time TRT*time TRT*time (3) (4) (5) -0.962** -0.885* -0.880 (0.487) (0.512) (0.736) -0.892 -0.758 -0.754 (0.590) (0.627) (0.822) -1.067* -1.047* -1.044 (0.560) (0.588) (0.821) -0.334 -0.0831 -0.0810 (0.742) (0.771) (1.036) -1.368** -1.460** -1.451 (0.652) (0.690) (1.020) -2.457*** -2.542*** -2.643** (0.904) (0.900) (1.238) -0.0603 0.0725 0.0822 (0.553) (0.589) (0.721) OLS Yes 0.498*** (0.164) TRT (8) School FE Yes 0.565*** (0.173) TRT (8) FE (8) 0.603*** (0.0300) 0.223*** (0.0411) 0.300*** (0.0165) 0.00292 (0.0395) 0.142*** (0.00783) 0.149*** (0.00233) 0.393*** (0.00236) 0.00144 (0.0113) -2.227*** (0.104) Observations 87,730 86,681 86,681 86,681 88,424 87,384 87,384 87,384 R-squared 0.025 0.452 0.456 0.013 0.454 0.456 Number of district 79 79 79 79 Notes: (i) Robust standard errors in parentheses, *** p<0.01, ** p<0.05, * p<0.1 (ii) The baseline lighting source is kerosene candle. (iii) Household expenditure was calculated using the ownership of assets, such as TV/radio, bicycle, motorcycle, and phone. (iv) The unit of random effect and fixed effect is district. Table 4. Learning Assessment Survey Endogenous Regression English Mathematics OLS OLS RE FE OLS OLS RE (1) (2) (3) (4) (5) (6) (7) Electricity 1.253*** 1.056*** 0.749*** 0.736*** 1.014*** 0.836*** 0.618*** (0.0310) (0.0295) (0.0247) (0.0248) (0.0340) (0.0319) (0.0298) Solar lamps 0.354*** 0.241*** 0.221*** 0.221*** 0.369*** 0.240*** 0.224*** (0.0471) (0.0361) (0.0340) (0.0340) (0.0550) (0.0424) (0.0411) Kerosene lantern 0.442*** 0.358*** 0.314*** 0.313*** 0.408*** 0.316*** 0.301*** (0.0182) (0.0143) (0.0137) (0.0137) (0.0212) (0.0164) (0.0165) Other lights -0.171*** -0.0574** 0.0412 0.0472 -0.347*** -0.229*** -0.0225 (0.0357) (0.0289) (0.0324) (0.0327) (0.0441) (0.0362) (0.0388) Log(hh expenditure) 0.126*** 0.140*** 0.140*** 0.143*** 0.143*** (0.00652) (0.00647) (0.00648) (0.00769) (0.00780) Class 0.166*** 0.162*** 0.161*** 0.153*** 0.149*** (0.0176) (0.00193) (0.00193) (0.0172) (0.00233) Age 0.283*** 0.287*** 0.287*** 0.389*** 0.393*** (0.0104) (0.00195) (0.00195) (0.0101) (0.00235) Male 0.0542*** 0.0506*** 0.0504*** 0.00292 0.00160 (0.00982) (0.00933) (0.00933) (0.0116) (0.0113) Constant 2.887*** -2.410*** -2.565*** -2.597*** 4.295*** -2.223*** -2.213*** (0.00721) (0.112) (0.0901) (0.0857) (0.00884) (0.123) (0.106) B. Appendix B1 Correlation between Test Scores and Reported Study Time Although this analysis can only get at correlation, it is important to check how noisy the reported study time may be. Appendix Table 5 presents the regression as in Equation (4): T estScorei = δ0 + δ1 StudyT imei + δ2 Xi + εi (4) The reported study time is positively correlated with test scores, but not statistically significant at 90 percent. Furthermore, adding more controls decreases the coefficient, indicating that omitted variable bias is certainly significant. This shows that, although study time may be somewhat noisy, it is likely still reflective of true study time. 30 Figure 3: (A) A child studying by a kerosene candle / (B) A child studying by a solar lamp 31 Figure 4: Improper charging practice of solar lamps 32 Flow chart of recruitment, eligibility, intervention, dropouts, and inclusion of siblings’ test scores in the randomized evaluation Initial baseline survey at 7 primary schools in Kyannamukaaka: 563 students Exclusion: 408 students Eligible: 155 students Use kerosene candles Report some AQRH symptoms Not have siblings who are also in the study group Parents came to survey Not a boarding student Treatment (solar lamps): 76 students Control (kerosene candles): 79 students Drop-outs: 7 students Drop-outs: 3 students Lighting sources AQRH symptoms Have siblings who are also in the study group Parents’ absence Do not go to boarding section Solar lamp stolen Move-out Treatment (solar lamps): 73 students Tired of study Move-out Control (kerosene candles): 72 students + + 26 siblings’ test scores 23 siblings’ test scores Appendix Table 1. Lighting Sources in Uganda (2011) Individual level Household level Frequency Percentage Frequency Percentage (1) (2) (3) (4) Electricity 12,419 4.82 2,357 5.22 Solar 5,266 2.04 891 1.97 Generator 618 0.24 105 0.23 Lantern 38,244 14.84 6,610 14.64 Tadoba/candle 189,068 73.39 33,137 73.4 Other 12,022 4.67 2,048 4.54 Total 257,637 45,148 Note: (i) Generator is classified under electricity in the regression. (ii) Data are from Uwezo Uganda Learning Assessment Survey 2011. -0.394 (3.050) 38.44*** (2.172) 169 0.000 -3.744 (2.318) -2.369*** (0.684) -2.249 (2.281) 1.642 (1.597) 0.151 (2.168) 28.12*** (3.116) 53.63* (28.00) -1.717 (2.871) 38.89*** (2.126) 201 0.002 -4.949** (2.259) -2.015*** (0.654) -2.362 (2.198) 1.693 (1.583) 1.714 (2.107) 29.98*** (3.117) 30.55 (26.86) -3.011 (4.333) 45.07*** (3.400) 99 0.005 -3.189 (3.222) -1.817* (1.041) -3.016 (3.242) 1.090 (3.347) -1.782 (2.976) 30.07*** (3.393) 71.34* (38.99) -5.859* (3.064) 49.98*** (2.155) 176 0.021 -7.349*** (2.677) -1.846** (0.792) -4.603* (2.633) 12.67*** (1.908) -0.0451 (2.382) 21.97*** (3.257) -0.987 (30.78) 0.815 (3.309) 38.31*** (2.302) 168 0.000 -2.679 (2.788) -2.470*** (0.791) -3.560 (2.688) 2.457 (1.997) -0.860 (2.573) 26.87*** (3.493) 63.73* (33.53) -3.322 (3.060) 40.57*** (2.262) 201 0.006 -7.505*** (2.677) -2.742*** (0.775) -2.826 (2.632) 2.448 (1.910) 0.851 (2.308) 27.45*** (3.444) 49.64* (27.89) -2.004 (4.696) 44.14*** (3.537) 97 0.002 -0.457 (3.987) -2.250** (1.117) 1.424 (4.140) 5.306 (3.989) -1.310 (3.606) 29.04*** (4.070) 45.28 (50.66) -5.450* (3.153) 48.05*** (2.309) 176 0.017 -9.107*** (2.878) -2.238*** (0.810) -5.983** (2.890) 9.867*** (2.215) -2.157 (2.332) 21.95*** (3.574) 45.98 (29.08) -1.501 (3.267) 38.47*** (2.370) 169 0.001 -4.697* (2.541) -2.228*** (0.783) -0.875 (2.604) 0.850 (1.798) 1.151 (2.268) 29.43*** (3.512) 42.88 (29.09) Observations 151 179 88 159 150 179 85 159 151 R-squared 0.450 0.444 0.529 0.375 0.355 0.349 0.443 0.310 0.422 Notes: (i) Robust standard errors in parentheses: *** p<0.01, ** p<0.05, * p<0.1 (ii) Row A presents regression estimates without controls and row B presents one with controls. (iii) Sample size for 3rd mid-term is smaller than others because not all schools had the mid-term arranged. Constant Siblings dummy Log (hh expenditure) Class Male Age Observations R-squared B. TRT Constant A. TRT 179 0.451 -0.111 (3.028) 37.21*** (2.262) 201 0.000 -2.393 (2.371) -1.289* (0.693) -1.899 (2.300) 0.938 (1.594) 2.576 (2.413) 32.51*** (3.269) 11.46 (32.58) 87 0.463 -3.818 (4.709) 46.67*** (3.595) 98 0.007 -6.948* (3.642) -2.112* (1.244) -5.547 (3.889) -2.118 (3.968) -1.873 (3.220) 29.92*** (3.901) 97.77** (42.23) 158 0.367 -6.181* (3.473) 51.91*** (2.347) 175 0.018 -5.534* (3.103) -1.458 (0.924) -3.157 (3.068) 15.48*** (2.169) 2.044 (3.031) 21.96*** (3.465) -47.73 (41.11) Average English Mathematics 1st Final 2nd Final 3rd Mid 3rd Final 1st Final 2nd Final 3rd Mid 3rd Final 1st Final 2nd Final 3rd Mid 3rd Final (1) (2) (3) (4) (5) (6) (7) (8) (9) (10) (11) (12) Appendix Table 2. Summary of Test Scores for Both Boys and Girls Combined Observations 812 696 812 696 696 696 696 696 696 812 696 R-squared 0.471 0.665 0.637 0.471 0.665 Number of groups 131 131 131 131 Number of individual identifiers 203 174 Number of time 4 Notes: (i) Robust standard errors in parentheses for columns (1)-(9), and clustered standard errors in parentheses for columns (10) amd (11) (ii) Coefficient on time variable is dropped in Column (5) due to multicollinearity with the Time Fixed Effect. Indiv Time Mixed Mixed Mixed Mixed Indiv Indiv OLS OLS RE FE Effect Indiv Time Indiv/Time Cluster Cluster (1) (2) (4) (5) (6) (7) (8) (9) (10) (11) TRT 0.440 -2.039 -2.065 -2.083 -1.291 -0.908 -1.291 -0.908 0.440 -2.039 (2.359) (1.957) (2.132) (1.987) (2.211) (2.201) (2.211) (2.201) (2.605) (2.129) Time 2.364*** 1.910*** 1.887*** 1.909*** 1.907*** 1.909*** 1.907*** 2.364*** 1.910*** (0.630) (0.544) (0.376) (0.419) (0.419) (0.419) (0.419) (0.342) (0.392) TRT*Time -1.088 -0.894 -0.885* -0.880 -0.893 -0.892 -0.893 -0.892 -1.088** -0.894* (0.868) (0.758) (0.512) (0.736) (0.570) (0.570) (0.570) (0.570) (0.516) (0.535) Age -1.258*** -1.248** -1.241*** -0.999* -0.984* -0.999* -0.984* -1.258** (0.346) (0.581) (0.357) (0.584) (0.583) (0.584) (0.583) (0.586) Class 3.680*** 3.626** 3.590*** 3.905*** 4.139*** 3.905*** 4.139*** 3.680*** (0.851) (1.416) (0.876) (1.357) (1.348) (1.357) (1.348) (1.161) Male -2.881*** -2.903 -2.917*** -2.357 -2.221 -2.357 -2.221 -2.881* (1.081) (1.821) (1.118) (1.835) (1.821) (1.835) (1.821) (1.693) Siblings dummy 25.03*** 25.18*** 25.28*** 25.81*** 25.83*** 25.81*** 25.83*** 25.03*** (1.602) (2.087) (1.321) (1.166) (1.165) (1.166) (1.165) (2.904) Log(hh expenditure) 0.344 0.336 0.331 0.569 0.395 0.569 0.395 0.344 (0.911) (1.346) (0.825) (1.406) (1.382) (1.406) (1.382) (1.558) Missing -42.13*** -36.28*** -35.52*** -35.60*** -35.14*** -36.24*** -36.18*** -36.24*** -36.18*** -42.13*** -36.28*** (0.858) (1.004) (1.033) (1.090) (1.618) (1.181) (1.179) (1.181) (1.179) (1.435) (1.472) Constant 37.24*** 24.80** 36.38*** 24.96 29.27*** 16.73 16.82 16.73 16.82 37.24*** 24.80 (1.752) (11.87) (1.734) (18.04) (11.05) (18.68) (18.24) (18.68) (18.24) (2.053) (19.44) Indiv RE (3) 0.185 (2.440) 2.122*** (0.347) -0.962** (0.487) Appendix Table 3. Regression of Average Test Scores for All Students Appendix Table 4. Regression on Study Time (hours) Dependent Variable: Regression Form: TRT Age Class Male Log(hh expenditure) Constant Observations R-squared Number of school Study Time at Completion of Study OLS OLS School-RE School-FE (1) (2) (3) (4) 0.414*** 0.498*** 0.498*** 0.565*** (0.147) (0.164) (0.164) (0.173) 0.0414 0.0414 0.0530 (0.0496) (0.0574) (0.0581) 0.220 0.220 0.188 (0.181) (0.169) (0.178) -0.113 -0.113 -0.0917 (0.173) (0.166) (0.179) 0.0608 0.0608 0.0518 (0.129) (0.123) (0.131) 1.419*** -1.084 -1.084 -0.991 (0.0871) (1.553) (1.623) (1.848) 61 53 53 53 0.120 0.207 0.222 4 4 Notes: (i) Robust standard errors in parentheses: *** p<0.01, ** p<0.05, * p<0.1 (ii) There are only four schools reported due to data limitation. Study Time at Baseline OLS OLS (5) (6) 0.024 0.050 (0.131) (0.143) 0.028 (0.049) -0.019 (0.103) 0.046 (0.156) 0.083 (0.112) 1.410*** 0.105 (0.083) (1.526) 129 117 0 0.012 Appendix Table 5. Correlation between Test Scores and Reported Study Time OLS OLS (1) (2) Hours of Study 0.553 2.832 (3.089) (3.509) Age -1.017 (1.114) Class 3.800 (3.921) Male 1.584 (3.316) Log(hh expenditure) 0.733 (3.341) Constant 23.78*** 3.087 (5.108) (39.72) Observations 47 39 R-squared 0.001 0.073 Notes: (i) Robust standard errors in parentheses: *** p<0.01, ** p<0.05, * p<0.1 (ii) The dependent variable is the average test score of 1st Final.


© Copyright 2026