
Computerized interpretation of the prehospital electrocardiogram: predictive value for ST segment
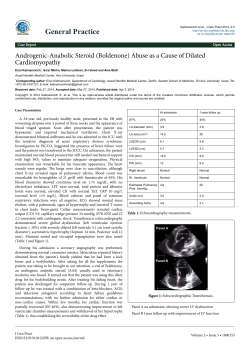
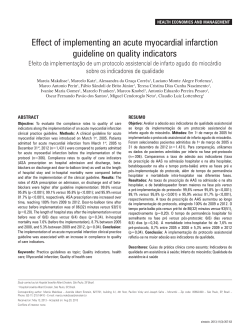
ORIGINAL RESEARCH N RECHERCHE ORIGINALE
Computerized interpretation of the prehospital
electrocardiogram: predictive value for ST segment
elevation myocardial infarction and impact on onscene time
François de Champlain, MD*34; Lucy J. Boothroyd, PhD1"; Alain Vadeboncoeur, MDI;
Thao Huynh, MD, MSc#; Viviane Nguyen, MD#; Mark J. Eisenberg, MD, MPH"**33;
Lawrence Joseph, PhD"44; Jean-François Boivin, MD, ScD"33; Eli Segal, MD3411
ABSTRACT
Introduction: Computerized interpretation of the prehospital
electrocardiogram (ECG) is increasingly being used in the
basic life support (BLS) ambulance setting to reduce delays
to treatment for patients suspected of ST segment elevation
myocardial infarction (STEMI).
Objectives: To estimate 1) predictive values of computerized
prehospital 12-lead ECG interpretation for STEMI and 2)
additional on-scene time for 12-lead ECG acquisition.
Methods: Over a 2-year period, 1,247 ECGs acquired by
primary care paramedics for suspected STEMI were collected. ECGs were interpreted in real time by the GEMarquette 12SL ECG analysis program. Predictive values
were estimated with a bayesian latent class model incorporating the computerized ECG interpretations, consensus ECG
interpretations by study cardiologists, and hospital diagnosis. On-scene time was compared for ambulance-transported
patients with (n 5 985) and without (n 5 5,056) prehospital
ECGs who received prehospital aspirin and/or nitroglycerin.
Results: The computer’s positive and negative predictive
values for STEMI were 74.0% (95% credible interval [CrI]
69.6–75.6) and 98.1% (95% CrI 97.8–98.4), respectively. The
sensitivity and specificity were 69.2% (95% CrI 59.0–78.5) and
98.9% (95% CrI 98.1–99.4), respectively. Prehospital ECGs
were associated with a mean increase in on-scene time of 5.9
minutes (95% confidence interval 5.5–6.3).
Conclusions: The predictive values of the computerized
prehospital ECG interpretation appear to be adequate for
diversion programs that direct patients with a positive result
to hospitals with angioplasty facilities. The estimated 26.0%
chance that a positive interpretation is false is likely too high
for activation of a catheterization laboratory from the field.
Acquiring prehospital ECGs does not substantially increase
on-scene time in the BLS setting.
RÉSUMÉ
Introduction: On a de plus en plus recours à l’interprétation
informatisée de l’électrocardiogramme (ECG) en phase
préhospitalière, dans les ambulances de réanimation cardiorespiratoire (RCR) élémentaire, afin de réduire le temps
d’attente avant le traitement chez les patients souffrant
probablement d’un infarctus du myocarde avec sus-décalage
du segment ST (IM+ST).
Objectifs: L’étude visait à évaluer: 1) les valeurs prévisionnelles de l’interprétation informatisée de l’électrocardiogramme (ECG) à 12 dérivations en phase préhospitalière
dans les cas d’IM+ST; et 2) le temps supplémentaire passé
sur place pour obtenir l’ECG à 12 dérivations.
Méthodes: Sur une période de 2 ans, 1247 ECG ont été
effectués par des ambulanciers paramédicaux en soins
primaires, dans des cas présumés d’IM+ST. Les ECG ont
été interprétés en temps réel, selon le programme d’analyse
GE-Marquette 12SL. L’estimation des valeurs prévisionnelles
reposait sur un modèle de classification bayésienne à
variables latentes, auquel avaient été intégrés les interprétations informatisées de l’ECG, les interprétations consensuelles de l’ECG fournies par les cardiologues participant à
From the *Department of Emergency Medicine, McGill University Health Centre, Montreal General Hospital; 3Department of Family Medicine, McGill
University; 4Corporation d’Urgences-santé; 1Institut national d’excellence en santé et en services sociaux (INESSS); "Department of Epidemiology,
Biostatistics and Occupational Health, McGill University; IDepartment of Emergency Medicine, Montreal Heart Institute; #Department of Cardiology,
McGill University Health Centre; **Division of Cardiology, Jewish General Hospital; 33Centre for Clinical Epidemiology and Community Studies, Lady
Davis Research Institute for Medical Research, Jewish General Hospital; 44Department of Clinical Epidemiology, McGill University Health Centre; and
11Department of Emergency Medicine, Jewish General Hospital, Montreal, QC.
Correspondence to: Dr. François de Champlain, Department of Emergency Medicine, Montreal General Hospital, 1650 Cedar Avenue, Room B2.117,
Montreal, QC H3G 1A4; [email protected]
This article has been peer reviewed.
ß Canadian Association of Emergency Physicians
CJEM 2013:1-12
CJEM N JCMU
DOI 10.2310/8000.2013.131031
2013;0(0)
1
de Champlain et al
l’étude et les diagnostics posés à l’hôpital. Il y a eu aussi une
comparaison du temps passé sur place chez les patients
transportés en ambulance, ayant été soumis (n 5 985) ou
non soumis (n 5 5056) à un ECG en phase préhospitalière et
ayant reçu de l’acide acétylsalicylique (AAS) et/ou de la
nitroglycérine en phase préhospitalière.
Résultats: Les valeurs prévisionnelles informatisées positive
et négative de l’ECG en phase préhospitalière à l’égard de
l’IM+ST se sont établies à 74.0% (intervalle de crédibilité [ICr]
à 95%: 69.6–75.6) et à 98.1% (ICr à 95%: 97.8–98.4),
respectivement. La sensibilité et la spécificité ont atteint
69.2% (ICr à 95%: 59.0–78.5) et 98.9% (ICr à 95%: 98.1–99.4),
respectivement. Les ECG en phase préhospitalière ont été
associés à une augmentation moyenne de 5.9 minutes
(intervalle de confiance à 95%: 5.5–6.3) du temps passé sur
place.
Conclusions: Les valeurs prévisionnelles de l’interprétation
informatisée de l’ECG en phase préhospitalière semblent
adéquates en ce qui concerne les programmes de déroutement des ambulances vers les hôpitaux dotés des installations nécessaires à l’angioplastie pour les patients ayant
obtenu des résultats positifs. Par contre, le risque de fausse
interprétation positive, estimé à 26.0%, est probablement
trop élevé pour justifier la mise en action d’un laboratoire de
cathétérisme, fondée sur les données recueillies sur place.
L’obtention de l’ECG en phase préhospitalière n’a pas pour
effet d’augmenter sensiblement le temps passé sur place
dans le contexte de la RCR.
The prehospital electrocardiogram (ECG) is used to
decrease treatment delays and improve outcomes for
patients with acute ST segment elevation myocardial
infarction (STEMI)1,2 by alerting hospitals from the
field or by directing ambulances to angioplasty
facilities. Although 12-lead ECGs can be acquired by
primary care paramedics providing basic life support
(BLS), interpretation is a more complex issue. Our
Canadian province of Quebec (7.8 million persons) is
almost entirely served by BLS paramedics who do not
interpret ECGs. Quebec has equipped ambulances
with the GE-Marquette 12 SL ECG analysis program
(GE Medical Systems, Milwaukee, WI), one of the
most common diagnostic software programs used by
ambulance operators.3 The criteria for acquiring
prehospital ECGs are fairly broad (not only chest
pain); thus, the prevalence of STEMI is likely to be
low. The predictive values of this software—the
probabilities of a test-positive patient actually having
STEMI and of a test-negative patient not having
STEMI—in such a setting are unclear. Some studies
suggest that a substantial proportion of computerpositive patients may not be later diagnosed with
STEMI.3,4
Another issue is how long it takes to acquire a
prehospital ECG because lengthy ‘‘on-scene’’ time can
be unsafe and potentially outweighs the time savings
from having diagnostic information sooner. Estimates
vary from 1.2 to 7 minutes for advanced life support
(ALS) personnel, combined ALS and BLS teams, or
ambulance physicians,5–12 with one BLS estimate of
5 minutes in the literature.13 Our first objective was to
estimate predictive values of computerized ECG
interpretation for STEMI in the BLS setting. The
second objective was to estimate additional time spent
on scene.
2
2013;0(0)
Keywords: electrocardiogram, on-scene time, predictive value,
prehospital, ST segment elevation myocardial infarction
METHODS
Study design
We collected prehospital ECG tracings acquired by
primary care paramedics and run-time data for the
period January 1, 2005, to December 31, 2006. Study
cardiologists provided retrospective consensus interpretation of the tracings, and we obtained a hospital
diagnosis for each patient, whether or not the patient
was eventually admitted. We focused our test performance analysis on predictive values because these
statistics are more interpretable and less abstract in the
field setting, where the real disease status is unknown.
Predictive values of the computerized ECG interpretation were estimated using a bayesian latent class
model.14,15 In bayesian analysis of a diagnostic test,
‘‘prior’’ information about the test’s performance (e.g.,
from the literature) is combined with observed data to
produce a ‘‘posterior’’ estimate with credible intervals.
Unlike standard confidence intervals, credible intervals
allow direct statements about the probability of values
within a certain range, which is particularly useful for
policy makers.
The Appendix provides further details about our
bayesian analysis. Briefly, our model allowed for
evolution of the ST segment over time using two
latent variables representing the patient’s status in the
field and in hospital. The computerized interpretations, the consensus cardiologist interpretations, and
the hospital diagnoses were considered simultaneously,
CJEM N JCMU
Computerized interpretation of the prehospital ECG
as three tests. There was no comparison against a gold
standard because all tests were considered imperfect.
The model also estimated STEMI prevalence in the
tested population and test sensitivity and specificity, all
of which impact predictive value.3 To address our
second objective, we took advantage of the fact that
during the study period, about one-third of the
ambulance fleet was equipped with ECG machines,
allowing comparison of patients with and without
ECGs. The study was approved by the institutional
ethics board at the Montreal Heart Institute. The
hospital chart data were requested according to
established quality assurance protocol and did not
require patient consent in accordance with the Loi sur
l’accès aux documents des organismes publics (L.R.Q.,
c. A-2.1, a. 125).
Study setting and population
Standard 12-lead ECGs were acquired by primary care
paramedics with Zoll M Series monitor-defibrillators
in metropolitan Montreal-Laval (2.3 million persons
over 744 km2, served by one ambulance operator).
Paramedics (n 5 205) received a 4-hour training
session on ECG acquisition in May–June 2003 and
occasional refresher instruction thereafter on a volunteer basis. Each paramedic was met every 4 months to
see if he or she had questions about the ECG protocol.
Our ECG data collection thus started 18 months after
initial training. ECGs were acquired at the patient
encounter site unless done in a stationary ambulance
for safety or privacy. Tracings were collected at the
ambulance operational centre (the first was used for
analysis, in the case of multiple testing). Although not
all ambulances were equipped with ECG machines, the
emergency call (911) operators did not dispatch
vehicles according to ECG capability.
Inclusion criteria for ECG acquisition were chest
pain of suspected cardiac origin, or anginal equivalents,
for at least 20 minutes and either 1) age 35 years or
older or 2) age 18 years or older with a history of
coronary artery disease. Anginal equivalents were
dyspnea, epigastric pain, or noncontinuous chest pain
for more than 12 hours. Exclusion criteria were 1)
diminished level of consciousness (‘‘V,’’ ‘‘P,’’ or ‘‘U’’
on the AVPU [Alert, responds to Voice, responds to
Pain, Unresponsive] scale); 2) heart rate , 50 or . 150
beats/min; 3) systolic blood pressure , 100 mm Hg;
and 4) oxygen saturation , 92% on room air.
Paramedics were instructed to acquire the ECG before
giving aspirin or sublingual nitroglycerin if possible.
For on-scene time, we selected patients who received
at least one dose of prehospital aspirin or nitroglycerin.
Comparison patients were attended in the same study
period by primary care paramedics and vehicles not
equipped with ECG machines. Only patients transported to hospital were included in our study.
Prehospital ECG interpretation
STEMI was indicated by the computer software as
‘‘***Acute MI***,’’ with an ST segment elevation
defined as at least 0.1 mV in at least two inferior or
lateral leads and at least 0.2 mV in at least two chest
leads.16 Two study cardiologists (T.H. and V.N.)
retrospectively and independently reviewed the prehospital ECGs using a standardized data entry form,
blinded to computerized interpretations and hospital
diagnoses. They were asked whether they observed
‘‘acute ST segment elevation that would have warranted immediate consideration for reperfusion therapy,’’ reflecting the diagnostic process required by a
physician receiving a prehospital ECG from the field.
ST segment elevation was defined as at least 0.1 mV in
at least two contiguous chest leads or at least two
adjacent limb leads,17 not diagnostic of benign early
repolarization, left bundle branch block, left ventricular hypertrophy, or pericarditis. Disagreement between
the cardiologists was resolved by consensus, if possible;
otherwise, a third study cardiologist (M.J.E.) independently interpreted the ECG, and the majority (twothirds) interpretation was used.
Hospital diagnosis
We requested chart information from medical records
departments of the hospitals where patients were
initially received (some patients were subsequently
transferred). Hospital diagnosis was based on 1) the
discharge summary sheet if admitted; 2) the death
certificate if the patient died before admission; and 3)
the emergency department (ED) notes if the patient
was transferred or discharged from the ED. Three
senior medical archivists (. 30 years of experience
each) extracted the diagnostic information, blinded to
the computerized ECG interpretations, using a
Microsoft Access database specifically designed for the
study. The archivists completed 20 hours of training
CJEM N JCMU
2013;0(0)
3
de Champlain et al
with the study database (supervised by L.J.B.) using a
detailed manual.
Figure 1 provides details on the predefined criteria used
to assign a diagnosis of STEMI. The criteria included 1)
an increase in cardiac markers within 24 hours of ED
arrival or 2) ST segment elevation noted in the ED notes
to rule out infarctions occurring later in the hospital stay.
In cases where a patient was sent to a catheterization
laboratory within 4 hours of hospital arrival, without
mention of STEMI or ST segment elevation in the ED
notes or discharge summary, two other study cardiologists,
who were distinct from the three who read the prehospital
ECGs, retrospectively reviewed the first in-hospital ECG.
They were asked to indicate whether ischemic ST segment
elevation was definitely present, possibly present, or not
present. For STEMI to be assigned, both had to specify
‘‘definitely’’ or ‘‘possibly’’ or one had to indicate
‘‘definitely’’ and the other ‘‘possibly.’’
paramedics on the vehicle computers and were later
entered in a secure, internal database containing run
times as part of standard operations. On-scene time thus
included accessing the patient and moving him or her to
the vehicle: these times were assumed not to be systematically different between the patient groups. Multivariate
linear regression (on-scene time as the dependent
variable) was used to adjust for patient age, patient sex,
season (winter or not winter), and number of prehospital
medications (one of aspirin or nitroglycerin, or both).
Winter was December 1 to March 31. Outlier values (less
than 5 or more than 90 minutes) were excluded because
they were likely due to paramedic error. Patients without
time data were also excluded. SPSS Statistics software
version 17.0 (IBM, Armonk, NY) was used.
RESULTS
Predictive values
On-scene time
On-scene time was the period between ambulance arrival
at the patient encounter site and ambulance departure for
the hospital. These time points were recorded by the
From the sample of 1,534 available prehospital ECGs,
1,247 tracings (81.3%) were analyzed (Figure 2). The
vast majority of patients presented with chest pain,
with or without accompanying symptoms (Table 1).
Figure 1. Criteria for assigning a hospital ST segment elevation myocardial infarction (STEMI) diagnosis. AMI 5 acute
myocardial infarction; cath lab 5 catherization laboratory; ECG 5 electrocardiogram; ED 5 emergency department; STE 5 ST
segment elevation. *According to study cardiologists.
4
2013;0(0)
CJEM N JCMU
Computerized interpretation of the prehospital ECG
Figure 2. Exclusions and hospital
data requests for predictive value
analysis. ECG 5 electrocardiogram.
Table 1. Characteristics of patients in analysis of predictive values (N 5 1,247)
Characteristic
n
Mean age, yr (SD)
Male (%)
Prior heart disease (%)*
Principal symptom recorded by paramedics (%)
Chest pain
Weakness/dizziness/fainting
Shortness of breath
Abdominal pain
Palpitations/tachycardia
Other
Delay from symptom onset to prehospital ECG (min) (n 5 731)
Median (10th percentile, 90th percentile)
Outcome of emergency department consultation (%)
Admission to the first hospital
Death before hospital admission
Transfer to second hospital
Discharged home
66.9 (15.3)
670 (53.7)
730 (58.5)
1,071
99
33
12
11
21
(85.9)
(7.9)
(2.6)
(1.0)
(0.9)
(1.7)
88.0 (26.0, 339.4)
430
8
101
708
(34.5)
(0.6)
(8.1)
(56.8)
ECG 5 electrocardiogram.
*Including unstable or stable angina, acute myocardial infarction, acute coronary syndrome, coronary artery disease, previous angioplasty or previous bypass surgery, coronary
atherosclerosis, heart ischemia, cardiac insufficiency, congestive heart failure, acute pulmonary edema, and cardiac arrest.
CJEM N JCMU
2013;0(0)
5
6
2013;0(0)
CJEM N JCMU
98.4 (97.5–99.0)*
69.9 (58.8–79.5)*
ECG 5 electrocardiogram; STE 5 ST segment elevation; STEMI 5 ST segment elevation myocardial infarction.
*Exact binomial confidence intervals from 2 3 2 table analysis.
97.9 (96.9–98.6)*
75.3 (64.2–84.4)*
6.7 (5.3–8.2)*
98.6 (97.7–99.2)*
56.0 (46.1–65.5)*
95.9 (94.6–97.0)*
79.2 (68.5–87.6)*
8.7 (7.2–10.4)*
98.9 (98.1–99.4)
64.7 (54.3–74.2)
97.6 (96.2–98.0)
71.6 (67.4–73.7)
9.8 (7.6–12.4)
98.9 (98.1–99.4)
71.7 (61.4–80.7)
98.2 (97.9–98.4)
76.8 (73.0–78.5)
9.1 (7.1–11.4)
98.9 (98.1–99.4)
69.2 (59.0–78.5)
9.1 (7.0–11.6)
98.1 (97.8–98.4)
74.0 (69.6–75.6)
Base bayesian model 70% of STEMI patients show STE on prehospital
ECG
Sensitivity analysis 1: 80% of STEMI patients show STE on prehospital
ECG (bayesian model)
Sensitivity analysis 2: accuracy of the study cardiologists and hospital
diagnosis is more variable (bayesian model)
Sensitivity analysis 3: computerized interpretation versus consensus
cardiologist interpretation as a gold standard (2 3 2 table)
Sensitivity analysis 4: computerized interpretation versus hospital
diagnosis as a gold standard (2 3 2 table)
Sensitivity
STEMI prevalence
Negative
predictive
value (NPV)
Positive
predictive
value (PPV)
Point estimate, % (95% credible or confidence* interval)
Table 2. Predictive values of computerized prehospital ECG interpretation for STEMI (and associated statistics)
The mean age of the patients was 66.9 years, and
53.7% were male; over half (58.5%) had previous heart
disease. For patients with data, delay from symptom
onset to prehospital ECG varied greatly (see Table 1)
but was skewed to the left (toward shorter values). For
113 (9.1%) patients, more than 6 hours had elapsed
before the ECG. Patients were transported to 21
hospitals; 8 (38.1%) had cardiac catheterization facilities. About one-third of patients were admitted at the
initial receiving hospital, and more than half were
discharged from the ED without an admission (see
Table 1).
The positive predictive value (PPV) of the computerized ECG interpretation was estimated as 74.0%
(95% credible interval [95% CrI] 69.6–75.6) (Table 2).
Thus, when the computerized interpretation was
positive, there was a 26.0% probability that STEMI
was absent (false positive rate). The negative predictive
value (NPV) was estimated as 98.1% (95% CrI 97.8–
98.4), indicating a false negative rate of 1.9% (Table 2).
The prevalence of STEMI in the tested population
was estimated as 9.1% (95% CrI 7.0–11.6), whereas
the underlying sensitivity and specificity of the
computerized interpretation were estimated as 69.2%
(95% CrI 59.0–78.5) and 98.9% (95% CrI 98.1–99.4),
respectively (see Table 2).
In sensitivity analyses, the estimated predictive
values changed only slightly when the proportion of
STEMI patients with an ST segment elevation already
present by the time of the prehospital ECG was
increased (see sensitivity analysis 1, Table 2) or the
accuracy of the study cardiologists and the hospital
diagnoses was made more variable (sensitivity analysis 2).
In 2 3 2 table analysis, the PPV estimate raised to 79.2%
(95% confidence interval [95% CI] 68.5–87.6) when
comparing the computerized interpretation to the study
cardiologists as a gold standard (sensitivity analysis 3).
The initial interobserver agreement (kappa) for the two
principal cardiologist readers (T.H. and V.N.) was 0.67
(95% CI 0.59–0.74). We confirmed that if the cardiologists had used the software’s cutoff of 0.2 mV in the
chest leads (instead of 0.1 mV), the same group of
patients would have been identified as positive by the
physicians. The most notable difference between the
bayesian and 2 3 2 results was the uncertainty around
the estimates. Compared to the 5% variation in the
credible intervals, the confidence intervals had a 20%
spread.
Specificity
de Champlain et al
Computerized interpretation of the prehospital ECG
On-scene time
DISCUSSION
From the sample of 1,534 patient encounters during
which a prehospital ECG was acquired, 985 patients
(64.2%) received aspirin and/or nitroglycerin and had
complete time data (Figure 3). There were 5,056
comparison patients without ECGs (see Figure 3).
The mean times for the largest groups of excluded
patients (442 [80.5% of those excluded] with prehospital ECGs but no documented medications and
402 [51.2% of those excluded] without ECGs but
missing age/sex data) were very similar to the means
for the included patients in both groups (17 seconds
and 4 seconds longer, respectively). Sociodemographic and seasonal data were similar across patient
groups (Table 3). A slightly greater proportion of the
patients without ECGs had received both medications. A prehospital ECG was associated with an
adjusted 5.9 additional minutes of on-scene time (95%
CI 5.5–6.3 minutes).
Our study provides estimates of the predictive values of
computerized prehospital ECG interpretation in the
BLS setting for a commonly used software. Our
analysis of BLS on-scene time using concurrent
controls is, to our knowledge, the largest of its kind
and involved patients who were comparable in terms of
presentation because they had all received prehospital
medications for suspected acute coronary syndrome.
For settings with comparable ECG eligibility
criteria and thus similarly low STEMI prevalence,
our estimated predictive values appear adequate for the
implementation of a strategy to direct patients with a
positive computer result to hospitals with angioplasty
facilities and patients with a negative interpretation to
nonspecialized centres. The approximately 1 in 4
chance that a positive computer result is false, however,
is likely too high for catheterization laboratory
activation from the field. Transmission of computer-
Figure 3. Exclusions of patients for on-scene time analysis. ECG 5 electrocardiogram.
CJEM N JCMU
2013;0(0)
7
de Champlain et al
Table 3. Comparison of patients in analysis of on-scene time
Patients with prehospital
ECG (n 5 985)
Mean age, yr (SD)
Male, n (%)
Patient encounter during winter,* n (%)
Prehospital medication(s) received, n (%)
Nitroglycerin only
Aspirin only
Both aspirin and nitroglycerin
On-scene time
Mean (SD)
Median (10th percentile, 90th percentile)
Minimum, maximum
Unadjusted difference in means (95% confidence interval)
Adjusted* difference in means (95% confidence interval)
Patients without prehospital
ECG (n 5 5,056)
67.4 (14.6)
509 (51.7)
333 (33.8)
69.3 (14.8)
2,561 (50.7)
1,713 (33.9)
122 (12.4)
85 (8.6)
778 (79.0)
575 (11.4)
251 (5.0)
4,230 (83.6)
25.2 (7.1)
24.7 (17.4, 33.4)
5.3, 75.5
19.5 (6.4)
18.8 (12.2, 27.2)
5.0, 64.5
5.8 (5.3–6.2)
5.9 (5.5–6.3)
ECG 5 electrocardiogram.
*Adjusted for patient age, sex, season (winter or not), and prehospital medications (one or two).
positive tracings to physicians for overread or paramedic ECG interpretation is likely to decrease but not
eliminate unnecessary activation: false positive rates of
9 to 14%, based on angiographic findings, have been
documented for physicians,18–22 with similar reported
rates for paramedics (8.3–18%, versus physician reading,23–25 and 12%, versus angiography26). Thus, we
estimate that computerized interpretation is associated
with an excess of 10 to 15% false positives. A policy
maker would have to balance the gain in PPV against
the technological, logistical, and cost implications of
other strategies.27
Policy makers also need to keep in mind that
increasingly broad prehospital ECG eligibility criteria,
incorporating more atypical STEMI presentations, will
decrease PPV and thus increase the false positive rate
of a computerized interpretation as a result of the
lower STEMI prevalence in the tested population.3 On
the other hand, very strict criteria will decrease NPV
and increase the chance that a computer-negative
result is false. Our ECG criteria were between these
extremes, including anginal equivalents of chest pain
and some atypical presentations (the latter for 14% of
our sample). Predictive values are also related to the
underlying sensitivity and specificity of the test. It
should be noted that our estimate of the sensitivity of
the computerized interpretation was moderate. The
estimated 2% chance that a negative computer result
was false is not equivalent to missing 2% of STEMI
cases overall.
8
2013;0(0)
A study of 912 ambulance patients suspected of acute
coronary syndrome found a PPV of 81% and an NPV
of only 89% for the same computer software studied
here.4 Using an earlier version of this software, a study
of 1,189 chest pain patients reported a PPV of 94%
and an NPV of 81%.28 The STEMI prevalence in both
investigations was high, at about 33%, and both studies
used 2 3 2 tables, comparing the computer to hospital
diagnosis. A study of 161 computer-positive tracings
from ALS ambulances29 in a low-prevalence setting
(5% STEMI; 95% CrI 0.7–15.3) found a PPV of only
66% (95% CrI 58–73) when compared to hospital
diagnosis.3 The computer’s estimated PPV for chest
pain patients (74%) was considerably higher than for
those without chest pain (25%).3 Our PPV estimate
should be considered an average across clinical
presentations; for a patient with crushing retrosternal
pain and previous angioplasty, for example, a false
positive computerized interpretation is less likely.
Finally, when we compared the computer to the
consensus study cardiologists considered a gold standard, the chance that a positive computer result was
false was still high, at about 20%.
We found that ECG acquisition by primary care
paramedics did not substantially increase on-scene
time. This is consistent with a prior BLS study, in
which the mean on-scene time was 5.0 minutes longer
(95% CI 3.6–6.4) for 77 ECG patients compared to
100 concurrent controls.13 Our average additional onscene time is sufficiently minor compared to potential
CJEM N JCMU
Computerized interpretation of the prehospital ECG
time savings: prehospital ECG strategies have been
associated with decreased delays from hospital arrival to
reperfusion therapy of about 30 minutes for ED
notification,5,30 30 to 60 minutes for catheterization
laboratory activation (with or without ED bypass),6–8,31,32
and more than 60 minutes for ambulance diversion (if
transport times are less than 30 minutes1).9,33–35
Several study limitations should be noted. Our
sample may not contain some patients due to
misplaced tracings, although such losses are likely to
be random. Paramedics may have acquired ECGs from
patients who were not strictly eligible. We excluded
111 patients from the predictive values analysis for
whom we were unable to request hospital charts.
However, we do not expect results to differ for these
patients because it simply took longer to verify their
identity due to clerical factors, unrelated to clinical
status or receiving centre. Regarding the quality of the
tracings, we excluded 47 ECGs (3.1% of all available)
that were unreadable by study cardiologists; these may
contain a greater proportion of false computer-positive
results.36 Our bayesian model required prior inputs of
diagnostic performance on which subsequent analysis
depended. Sensitivity analyses, however, showed that
the results were quite robust. Since the model allowed
for imperfect tests, the effect of any misclassification of
the hospital diagnoses during chart review was
lessened. Our predictive value results are generalizable
to other settings using the same computer program
only to the extent that STEMI prevalence is similar.
Additional on-scene time could also relate to more
time spent on history taking or acquiring vital signs in
the ECG group. The speed of ECG acquisition may
relate to the level of paramedic experience and the site
(home versus a public space), but we did not collect
these data. Finally, delay associated with ECG
acquisition in our region may have reduced with even
more accumulation of paramedic experience.
CONCLUSION
Our study examined the predictive value of a commonly used software for the interpretation of prehospital ECGs, acquired in a setting where ECG
eligibility criteria were broad and STEMI prevalence
was accordingly low. We found that the computerized
interpretation had high specificity but moderate
sensitivity. PPV was also moderate; the high computer
false positive rate may lead to excessive activation of a
catheterization laboratory. This last finding, which was
robust in our sensitivity analysis, is likely generalizable
to other jurisdictions if similar prehospital ECG
eligibility criteria are used. The acquisition of prehospital ECGs does not substantially increase on-scene
time in the BLS setting.
Acknowledgements: We thank the medical directors at
Urgences-santé who were involved in the study, Drs. Marcel
Boucher and Michel Loyer, as well as Eric Lareau, Patrice
Ruest, Claude Desrosiers, the medical archivists (Christiane
Beauchamp, Francine Ruest-Martel, and Louise St-Onge
Southière), the cardiologists who reviewed in-hospital ECGs
(Drs. Peter Bogaty and James Nasmith), and the dedicated team
of paramedics.
Competing interests: The study received institutional funding
from the Montreal Heart Institute. L.J.B. received financial
support from the Urgences-santé ambulance company and the
Quebec Ministry of Health during the course of the study. The
research archivists were paid with funds from Urgences-santé.
REFERENCES
1. O’Connor RE, Brady W, Brooks SC, et al. Part 10: acute
coronary syndromes: 2010 American Heart Association
Guidelines for Cardiopulmonary Resuscitation and Emergency
Cardiovascular Care. Circulation 2010;122(18 Suppl 3):S787-817,
doi:10.1161/CIRCULATIONAHA.110.971028.
2. Tubaro M, Danchin N, Goldstein P, et al. Pre-hospital
treatment of STEMI patients. A scientific statement of the
Working Group Acute Cardiac Care of the European
Society of Cardiology. Acute Card Care 2011;13:56-67,
doi:10.3109/17482941.2011.581292.
3. Youngquist ST, Kaji AH, Lipsky AM, et al. A bayesian
sensitivity analysis of out-of-hospital 12-lead electrocardiograms: implications for regionalization of cardiac care. Acad
Emerg Med 2007;14:1165-71, doi:10.1111/j.1553-2712.2007.
tb02338.x.
4. Clark EN, Sejersten M, Clemmensen P, et al. Automated
electrocardiogram interpretation programs versus cardiologists’ triage decision making based on teletransmitted data in
patients with suspected acute coronary syndrome. Am J
Cardiol 2010;106:1696-702, doi:10.1016/j.amjcard.2010.07.
047.
5. Morrison LJ, Brooks S, Sawadsky B, et al. Prehospital 12lead electrocardiography impact on acute myocardial infarction treatment times and mortality: a systematic review. Acad
Emerg Med 2006;13:84-9, doi:10.1111/j.1553-2712.2006.
tb00989.x.
6. Brown JP, Mahmud E, Dunford JV, et al. Effect of prehospital
12-lead electrocardiogram on activation of the cardiac
catheterization laboratory and door-to-balloon time in STsegment elevation acute myocardial infarction. Am J Cardiol
2008;101:158-61, doi:10.1016/j.amjcard.2007.07.082.
7. Caudle JM, Piggott Z, Dostaler S, et al. Impact of a rapid
access protocol on decreasing door-to-balloon time in acute
ST elevation myocardial infarction. CJEM 2009;11:29-35.
CJEM N JCMU
2013;0(0)
9
de Champlain et al
8. Hutchison AW, Malaiapan Y, Jarvie I, et al. Prehospital 12lead ECG to triage ST-elevation myocardial infarction and
emergency department activation of the infarct team significantly improves door-to-balloon times: ambulance Victoria
and MonashHEART Acute Myocardial Infarction (MonAMI)
12-lead ECG project. Circ Cardiovasc Interv 2009;2:528-34,
doi:10.1161/CIRCINTERVENTIONS.109.892372.
9. Sejersten M, Sillesen M, Hansen PR, et al. Effect on
treatment delay of prehospital teletransmission of 12-lead
electrocardiogram to a cardiologist for immediate triage and
direct referral of patients with ST-segment elevation acute
myocardial infarction to primary percutaneous coronary
intervention. Am J Cardiol 2008;101:941-6, doi:10.1016/
j.amjcard.2007.11.038.
10. Drew BJ, Sommargren CE, Schindler DM, et al. A simple
strategy improves prehospital electrocardiogram utilization
and hospital treatment for patients with acute coronary
syndrome (from the ST SMART Study). Am J Cardiol 2011;
107:347-52, doi:10.1016/j.amjcard.2010.09.027.
11. Clemmensen P, Sejersten M, Sillesen M, et al. Diversion of
ST-elevation myocardial infarction patients for primary
angioplasty based on wireless prehospital 12-lead electrocardiographic transmission directly to the cardiologist’s
handheld computer: a progress report. J Electrocardiol
2005;38(4 Suppl):194-8.
12. Turnipseed SD, Amsterdam EA, Laurin EG, et al.
Frequency of non-ST-segment elevation injury patterns on
prehospital electrocardiograms. Prehosp Emerg Care 2010;14:
1-5, doi:10.3109/10903120903144924.
13. Provo TA, Frascone RJ. 12-Lead electrocardiograms during
basic life support care. Prehosp Emerg Care 2004;8:212-6.
14. Dendukuri N, Joseph L. Bayesian approaches to modeling
the conditional dependence between multiple diagnostic
tests. Biometrics 2001;57:158-67, doi:10.1111/j.0006-341X.
2001.00158.x.
15. Dendukuri N, Hadgu A, Wang L. Modeling conditional
dependence between diagnostic tests: a multiple latent
variable model. Stat Med 2009;28:441-61, doi:10.1002/
sim.3470.
16. GE Medical Systems. 12SLTM physician’s guide. Milwaukee
(WI): GE Medical Systems Information Technologies; 2000.
17. Antman EM, Anbe DT, Armstrong PW, et al. ACC/AHA
guidelines for the management of patients with ST-elevation
myocardial infarction; a report of the American College of
Cardiology/American Heart Association Task Force on
Practice Guidelines (Committee to Revise the 1999
Guidelines for the Management of Patients with Acute
Myocardial Infarction). J Am Coll Cardiol 2004;44:E1-211,
doi:10.1016/j.jacc.2004.07.014.
18. Larson DM, Menssen KM, Sharkey SW, et al. ‘‘Falsepositive’’ cardiac catheterization laboratory activation among
patients with suspected ST-segment elevation myocardial
infarction. JAMA 2007;298:2754-60, doi:10.1001/jama.298.
23.2754.
19. Barge-Caballero E, Vázquez-Rodrı́guez JM, EstévezLoureiro R, et al. Prevalence, etiology and outcome of
catheterization laboratory false alarms in patients with
suspected ST-elevation myocardial infarction. Rev Esp Cardiol
2010;63:518-27, doi:10.1016/S0300-8932(10)70113-5.
20. Willson AB, Mountain D, Jeffers JM, et al. Door-to-balloon
times are reduced in ST-elevation myocardial infarction by
10
2013;0(0)
21.
22.
23.
24.
25.
26.
27.
28.
29.
30.
31.
32.
emergency physician activation of the cardiac catheterisation
laboratory and immediate patient transfer. Med J Aust 2010;
193:207-12.
Youngquist ST, Shah AP, Niemann JT, et al. A
comparison of door-to-balloon times and false-positive
activations between emergency department and out-ofhospital activation of the coronary catheterization team.
Acad Emerg Med 2008;15:784-7, doi:10.1111/j.1553-2712.
2008.00186.x.
Davis DP, Graydon C, Stein R, et al. The positive predictive
value of paramedic versus emergency physician interpretation of the prehospital 12-lead electrocardiogram. Prehosp
Emerg Care 2007;11:399-402, doi:10.1080/109031207015
36784.
Lee C, Van Gelder CM, Cone DC. Early cardiac
catheterization laboratory activation by paramedics for
patients with ST-segment elevation myocardial infarction
on prehospital 12-lead electrocardiograms. Prehosp Emerg
Care 2010;14:153-8, doi:10.3109/10903120903537213.
Young DR, Murinson M, Wilson C, et al. Paramedics as
decision makers on the activation of the catheterization
laboratory in the presence of acute ST-elevation myocardial
infarction. J Electrocardiol 2010;44:18-22, doi:10.1016/j.
jelectrocard.2010.06.010.
Le May MR, Dionne R, Maloney J, et al. Diagnostic
performance and potential clinical impact of advanced care
paramedic interpretation of ST-segment elevation myocardial infarction in the field. Can J Emerg Med 2006;8:401-7.
Cheskes S, Turner L, Foggett R, et al. Paramedic contact to
balloon in less than 90 minutes: a successful strategy for STsegment elevation myocardial infarction bypass to primary
percutaneous coronary intervention in a Canadian emergency medical system. Prehosp Emerg Care 2011;15:490-8,
doi:10.3109/10903127.2011.598613.
Adams G, Abusaid G, Lee B, et al. From theory to practice:
implementation of pre-hospital electrocardiogram transmission in ST-elevation myocardial infarction - a multicenter
experience. J Invasive Cardiol 2010;22:520-5.
Kudenchuk PJ, Ho MT, Weaver WD, et al. Accuracy of
computer-interpreted electrocardiography in selecting patients
for thrombolytic therapy. MITI Project Investigators.
J Am Coll Cardiol 1991;17:1486-91, doi:10.1016/0735-1097(91)
90636-N.
Eckstein M, Cooper E, Nguyen T, et al. Impact of
paramedic transport with prehospital 12-lead electrocardiography on door-to-balloon times for patients with STsegment elevation myocardial infarction. Prehosp Emerg Care
2009;13:203-6, doi:10.1080/10903120802472020.
Diercks DB, Kontos MC, Chen AY, et al. Utilization and
impact of pre-hospital electrocardiograms for patients with
acute ST-segment elevation myocardial infarction: data from
the NCDR (National Cardiovascular Data Registry)
ACTION (Acute Coronary Treatment and Intervention
Outcomes Network) Registry. J Am Coll Cardiol 2009;53:
161-6, doi:10.1016/j.jacc.2008.09.030.
Rao A, Kardouh Y, Darda S, et al. Impact of the prehospital
ECG on door-to-balloon time in ST elevation myocardial
infarction. Catheter Cardiovas Interv 2010;75:174-8, doi:10.
1002/ccd.22257.
Baran KW, Kamrowski KA, Westwater JJ, et al. Very rapid
treatment of ST-segment-elevation myocardial infarction:
CJEM N JCMU
Computerized interpretation of the prehospital ECG
utilizing prehospital electrocardiograms to bypass the
emergency department. Circ Cardiovasc Qual Outcomes 2010;
3:431-7, doi:10.1161/CIRCOUTCOMES.110.942631.
33. Ortolani P, Marzocchi A, Marrozzini C, et al. Pre-hospital
ECG in patients undergoing primary percutaneous interventions within an integrated system of care: reperfusion
times and long-term survival benefits. EuroIntervention 2011;
7:449-57, doi:10.4244/EIJV7I4A74.
34. Zanini R, Aroldi M, Bonatti S, et al. Impact of prehospital
diagnosis in the management of ST elevation myocardial
infarction in the era of primary percutaneous coronary
intervention: reduction of treatment delay and mortality.
J Cardiovasc Med (Hagerstown) 2008;9:570-5, doi:10.2459/
JCM.0b013e3282f2c9bd.
35. Sivagangabalan G, Ong AT, Narayan A, et al. Effect of
prehospital triage on revascularization times, left ventricular
function, and survival in patients with ST-elevation myocardial infarction. Am J Cardiol 2009;103:907-12, doi:10.
1016/j.amjcard.2008.12.007.
36. Swan PY, Nighswonger B, Boswell GL, et al. Factors
associated with false positive emergency medical services
triage for percutaneous coronary intervention. West J Emerg
Med 2009;10:208-12.
37. Schull MJ, Vermeulen MJ, Stukel TA. The risk of missed
diagnosis of acute myocardial infarction associated with
emergency department volume. Ann Emerg Med 2006;48:
647-55, doi:10.1016/j.annemergmed.2006.03.025.
38. Pope JH, Aufderheide TP, Rothazer R, et al. Missed
diagnoses of acute cardiac ischemia in the emergency
department. N Engl J Med 2000;342:1163-70, doi:10.1056/
NEJM200004203421603.
39. Kudenchuk PJ, Maynard C, Cobb LA, et al. Utility of the
prehospital electrocardiogram in diagnosing acute coronary
syndromes: the Myocardial Infarction Triage and
Intervention (MITI) Project. J Am Coll Cardiol 1998;32:1727, doi:10.1016/S0735-1097(98)00175-2.
40. Feldman JA, Brinsfield K, Bernard S, et al. Real-time
paramedic compared with blinded physician identification of
ST-segment elevation myocardial infarction: results of an
observational study. Am J Emerg Med 2005;23:443-8,
doi:10.1016/j.ajem.2004.10.011.
41. Sejersten M, Young D, Clemmensen P, et al. Comparison of
the ability of paramedics with that of cardiologists in
diagnosing ST-segment elevation acute myocardial infarction in patients with acute chest pain. Am J Cardiol 2002;90:
995-8, doi:10.1016/S0002-9149(02)02685-1.
42. Joseph L, Gyokos T, Coupal L. Bayesian estimation of disease
prevalence and the parameters of diagnostic tests in the
absence of a gold standard. Am J Epidemiol 1995;141:263-72.
43. Verbeek PR, Ryan D, Turner L, et al. Serial prehospital 12lead electrocardiograms increase identification of ST-segment elevation myocardial infarction. Prehosp Emerg Care
2012;16:109-14, doi:10.3109/10903127.2011.614045.
Appendix: Details Regarding the Analysis of Predictive
Values
A bayesian latent class model14,15 was constructed that
incorporated the results of all three tests (i.e.,
computerized prehospital ECG interpretation, consensus cardiologist prehospital ECG interpretation,
and hospital diagnosis), without making any comparisons to a gold standard. This analysis required
specification of prior distributions for the diagnostic
performance of all three tests (in terms of sensitivity
and specificity) and for the prevalence of STEMI in the
tested population. In bayesian analysis, prior information is combined with study data to form overall
(‘‘posterior’’) estimates of parameters of interest, which
account for all inherent uncertainty, including the lack
of a gold standard reference test.
A latent class model was designed to capture the
following elements:
1. Patient status evolves over time; the clinical picture
of developing ST segment changes at the time of
the prehospital ECG can differ from that in
hospital.
2. ECG interpretation by human readers and hospital
diagnoses can be imperfect.
3. Computer and study cardiologist interpretations
were based on the same ECG data.
4. Hospital diagnoses were based on more information than the prehospital ECG, such as physical
examination, symptoms, cardiac enzymes, subsequent ECGs, and diagnostic imaging.
The statistical model was structured to include two
latent variables. A latent variable represents the
unknown true status of each patient (‘‘positive’’ or
‘‘negative’’) for each state of interest. The assumptions
of the model were the following:
1. None of the three tests had perfect sensitivity or
specificity.
2. Since they were both interpreting the prehospital
ECG data, the computer software and the cardiologists were measuring the true prehospital ECG
status (i.e., whether ischemic ST segment elevation
was present or absent at that time), and the true
prehospital ECG status is unknown. This was
latent variable 1.
3. Since the hospital diagnoses were based on more
data, the hospitals were measuring the true disease
status (i.e., whether acute STEMI was present or
absent at the hospital), and the true disease status is
unknown. This was latent variable 2.
4. The probability that a patient presenting with true
STEMI in an ED showed an ischemic ST segment
elevation on a prehospital ECG was 70%.28
CJEM N JCMU
2013;0(0)
11
de Champlain et al
Table A1. Prior distributions for sensitivity and specificity of consensus cardiologist prehospital ECG interpretation and hospital
diagnosis
95% range in sensitivity
95% range in specificity
0.85–0.95
0.80–0.98
0.85–0.97
0.65–0.99
0.80–0.92
0.80–0.99
0.85–0.95
0.70–0.99
Cardiologist interpretation (base model)
Cardiologist interpretation, wider distributions (sensitivity analysis 2)
Hospital diagnosis (base model)
Hospital diagnosis, wider distributions (sensitivity analysis 2)
ECG 5 electrocardiogram.
5. The prior distributions for the sensitivities and
specificities of the cardiologists and the hospitals
for detection of ischemic ST segment elevation and
STEMI, respectively, were as specified in Table A1,
based on literature review37–41 and the expert
opinion, elicited before the analysis, of the three
study cardiologists who were not the principal
readers of the prehospital ECGs. For all analyses,
low-information uniform densities were used for
the prior distributions of the computer’s test
performance, whereby all values of sensitivity and
specificity were a priori equally likely.
6. The prior distribution for the underlying prevalence of STEMI in the tested population was
specified to be in a wide interval of 0.5 to 20%,
based on a published review of the literature.3
The prior information about the diagnostic performance of the cardiologists and the hospitals was
expressed in the form of b distributions.42 The ranges
in sensitivity and specificity were considered to be
equal-tailed 95% probability intervals, with the centre
of the range as the mean of the distribution and onequarter of the total range as the standard deviation.
The a and b parameters for the distributions were
calculated from these means and standard deviations
12
2013;0(0)
using a standard formula. BayesLatentClassModels software version 1.3 was used. This software implements a
Gibbs sampler to generate the posterior estimates; the
first 500 iterations were used as burn-in, and the last
10,000 were used for the analysis.
Sensitivity analyses were performed to examine the
impact of certain assumptions on the predictive value
results. First, we increased the probability of a patient
with true STEMI showing ST segment elevation on a
prehospital ECG from 70 to 80% based on a recent
study of serial prehospital ECGs.43 Next, the prior
distributions for the diagnostic performance of the
cardiologists and the hospitals were widened, as
specified in Table A1. The wider probabilities were
chosen prior to the analysis on the basis of the expert
opinion of the three study cardiologists who were not
the principal prehospital ECG readers. These clinicians were asked for their opinion on the worst and
best possible diagnostic performance of each test in
order to assign a lower and an upper limit, respectively,
for each parameter. Finally, we carried out traditional
2 3 2 table analyses comparing the computerized ECG
interpretations to 1) the consensus cardiologist ECG
interpretations as a gold standard reference and 2) the
hospital diagnoses as a gold standard reference.
CJEM N JCMU


© Copyright 2026