
Document 64565
Institute for Child Health Policy at the University of Florida Texas External Quality Review Organization The Texas Medicaid STAR Program Child Survey Report Fiscal Year 2011 The Institute for Child Health Policy University of Florida The External Quality Review Organization for Texas Medicaid Managed Care and CHIP Submitted: December 22, 2011 Final Submitted: January 23, 2012 Table of Contents 1Executive Summary .................................................................................................................................... 1 Introduction and Purpose .............................................................................................................................. 5 Methodology.................................................................................................................................................. 1 Sample Selection Procedures .................................................................................................................. 6 Survey Instruments................................................................................................................................... 6 Survey Data Collection Techniques ......................................................................................................... 7 Data Analysis ............................................................................................................................................ 8 Survey Results .............................................................................................................................................. 8 Description of Children and Their Caregivers........................................................................................... 8 Child’s Health Status ................................................................................................................................ 9 Body Mass Index ................................................................................................................................ 10 Special Health Care Needs ................................................................................................................ 11 Utilization of Health Care and Services .................................................................................................. 12 Multivariate Analysis – Potentially Preventable ED Visits .................................................................. 13 Access to and Timeliness of Care .......................................................................................................... 13 Timeliness of Getting Care................................................................................................................. 13 Office Wait .......................................................................................................................................... 15 Access to Specialist Care................................................................................................................... 16 Access to specialized services........................................................................................................... 16 Prescription medicines ....................................................................................................................... 17 Caregiver Satisfaction with All Their Child’s Health Care .................................................................. 18 Patient-Centered Medical Home............................................................................................................. 18 Presence of a Usual Source of Care.................................................................................................. 18 Courteous and Helpful Office Staff..................................................................................................... 20 Seeking Help and Advice ................................................................................................................... 20 Caregiver Satisfaction with Doctors’ Communication ........................................................................ 21 Shared Decision-making .................................................................................................................... 22 Well-child, Developmental, and Preventive Care............................................................................... 22 Health Literacy.................................................................................................................................... 24 Care coordination ...............................................................................................................................25 Experiences with Child’s Health Plan ..................................................................................................... 25 Health Plan Information and Materials ............................................................................................... 25 Customer Service ...............................................................................................................................26 Transportation .................................................................................................................................... 27 Caregiver Satisfaction with Child’s STAR Health Plan....................................................................... 27 Prior-year Comparisons.......................................................................................................................... 27 Summary Points and Recommendations.................................................................................................... 28 Recommendations.................................................................................................................................. 32 Appendix A. Detailed Survey Methodology................................................................................................ 34 Appendix B. Supplementary Tables and Figures ....................................................................................... 41 Appendix C. Multivariate Analysis – Potentially Preventable ED Visits ...................................................... 50 Methodology ........................................................................................................................................... 50 Results .................................................................................................................................................... 51 Endnotes ..................................................................................................................................................... 60 List of Tables Table 1. Sociodemographic Characteristics of Child Members and Their Caregivers ................................. 9 Table 2. Health Literacy Promotion by Personal Doctors ........................................................................... 24 Table 3. CAHPS® Composite Measures in 2009 and 2011 ........................................................................ 27 Table 4. HHSC Performance Dashboard Indicators in 2009 and 2011 ...................................................... 28 Table A1. STAR Survey Sampling Strategy ............................................................................................... 34 Table A2. Health Plan Weighting Strategy.................................................................................................. 39 Table B1. STAR Member Obesity Rates by MCO ...................................................................................... 41 Table B2. CAHPS® Health Plan Survey Core Composite Scores by STAR MCO ..................................... 42 Table B3. HHSC Performance Indicator Results by STAR MCO ............................................................... 43 Table B4. CAHPS® Health Plan Core Composite Scores by Demographics ............................................. 44 Table B5. CAHPS® Health Plan Survey Composite Scores by STAR MCO – Chronic Conditions Set ..... 45 Table B6. CAHPS® Health Plan Composite Scores by Demographics – Chronic Conditions Set ............. 46 Table B7. Comparison of CAHPS® Composite Scoring Methods............................................................... 47 Table B8. Survey Items Comprising the CAHPS® Composites .................................................................. 48 Table C1. Multivariate Analysis Simple Model – Influence of Demographics and MCO on PPVs ............. 55 Table C2. Multivariate Analysis Model 1 – Influence of Having a Usual Source of Care on PPVs ............ 56 Table C3. Multivariate Analysis Model 2 – Influence of CAHPS® Personal Doctor PPVs.......................... 57 Table C4. Multivariate Analysis Model 3 – Influence of CAHPS® Doctors’ Communicate on PPVs .......... 58 Table C5. Multivariate Analysis Model 4 – Influence of Caregivers’ Personal Doctor Rating on PPVs ..... 59 List of Figures Figure 1. Caregivers' Ratings of Their Child's Overall Health and Mental Health ...................................... 10 Figure 2. Body Mass Index Classification for Boys..................................................................................... 10 Figure 3. Body Mass Index Classification for Girls ..................................................................................... 11 Figure 4. Children with Special Health Care Needs in STAR ..................................................................... 12 Figure 5. How Often Child Waited for an Appointment.............................................................................. 14 Figure 6. The Percentage of STAR Child Members with a Personal Doctor by MCO................................ 15 Figure 7. How Well Doctors Communicate … ............................................................................................ 17 Figure 8. Developmental Care Issues … .................................................................................................... 23 Figure 9. Child Safety Issues… .................................................................................................................. 24 Executive Summary Purpose This report provides results from the fiscal year 2011 STAR Child Survey for the state of Texas, prepared by the Institute for Child Health Policy (ICHP) at the University of Florida. The STAR Program is administered through 14 managed care organizations (MCOs), providing services in nine urban geographic regions of Texas. Approximately 39 percent of all Texas Medicaid recipients receive their health care and services from a STAR MCO. 1 The Institute for Child Health Policy (ICHP) is contracted by the Texas Health and Human Services Commission (HHSC) to evaluate caregivers’ experiences and satisfaction with their children’s health care while enrolled in the STAR program. The purpose of the fiscal year 2011 STAR Child Survey is to: Describe the demographic and household characteristics of child members and their families. Assess the health status of the population, including children with special health care needs (CSHCN). Document caregiver experiences and general satisfaction with the care their children receive through STAR across four domains of care: o Utilization of health services, particularly emergency department (ED) use o Access to and timeliness of care o Patient-centered medical home o Health plan information and customer service Test the influence of domains of care on member ED use, controlling for demographic and health status variables. Methodology Survey participants were selected from a stratified random sample of children enrolled in STAR for six months or longer between September 2010 and February 2011. The EQRO set a target sample of 4,200 completed telephone interviews with caregivers of sampled children, representing 300 respondents per STAR MCO. The response rate for this survey was 55 percent and the cooperation rate was 75 percent. The SFY 2011 STAR Child Survey included: The Consumer Assessment of Healthcare Providers and Systems (CAHPS®) Health Plan Survey 4.0 for child members Items from the CAHPS® Clinician and Group Surveys The Children With Special Health Care Needs (CSHCN) Screener® Items developed by ICHP pertaining to caregiver and member demographic and household characteristics. Texas Contract Year 2011 STAR Child Survey Report Version: V2.0 HHSC Approval Date: January 23, 2012 Page 1 Summary of Findings Profile of STAR survey child members: Fifty-two percent were male and 48 percent were female. The average age was 8 years old. The majority were Hispanic, primarily of Mexican descent. Forty-four percent of girls and 47 percent of boys were overweight or obese. Eighteen percent had at least one special health care need. Profile of STAR survey participants (caregivers): Ninety-one percent were the biological mothers of STAR members. The average age was 35 years old. The majority were Hispanic, primarily of Mexican descent. Thirty-nine percent did not complete high school. Forty-one percent were married. Positive findings Caregiver Ratings. The majority of caregivers provided high ratings of their child’s health care, doctors, and health plan, indicated by a rating of 9 or 10 on a 10-point scale. These ratings were greater than those published from Medicaid national data. Percent of caregivers rating child's health services a "9" or "10" 100% 80% 60% 67% 75% 81% 70% 70% 61% 66% 64% 40% 20% 0% Child's Health Care STAR Texas Contract Year 2011 STAR Child Survey Report Version: V2.0 HHSC Approval Date: January 23, 2012 Child's Personal Doctor Child's Specialist Child's Health Plan Medicaid national average Page 2 Access to Specialist Referral. The majority of caregivers reported that they were usually or always able to get a referral for their child to see a specialist (69 percent). All MCOs except one met the HHSC Dashboard Standard of 59 percent for good access to specialist referrals. Health Plan Customer Service. Most caregivers reported that they usually or always had positive interactions with customer service at their child’s health plan (84 percent). Percent of caregivers "usually" or "always" having positive experiences (CAHPS®) 100% 90% 80% 83% 79% 70% 87% 88% 92% 84% 80% 72% 60% 50% Getting Needed Care Getting Care Quickly How Well Doctors Communicate STAR Customer Service Medicaid national average Improvement areas Getting Needed Care. Seventy-two percent of STAR caregivers usually or always had positive experiences with Getting Needed Care, compared to the 79 percent reporting for Medicaid plans nationally. Getting Care and Assistance for CSHCN. Caregivers of CSHCN were significantly less likely than caregivers of non-CSHCN to report positive experiences with their child’s health plan and getting needed care for their child, such as appointments with specialists and tests and treatment, through the health plan. Getting Specialized Services. Although less than 10 percent of caregivers reported that their child needed specialized services, access to these services in STAR was lower than reported nationally (66 percent vs. 74 percent). HHSC Performance Dashboard Indicators. Results of the following performance indicators indicate that few health plans are meeting HHSC Dashboard standards for good access to routine care, no delays in health care while waiting for health plan approval, and no exam room wait greater than 15 minutes. Texas Contract Year 2011 STAR Child Survey Report Version: V2.0 HHSC Approval Date: January 23, 2012 Page 3 HHSC Performance Dashboard Indicators STAR HHSC Standard Good access to routine care 79% 84% Good access to urgent care 86% 86% No exam room wait greater than 15 minutes 24% 35% Good access to specialist referral 69% 59% No delays in health care while waiting for health plan approval 63% 65% Good access to behavioral health treatment or counseling 61% - Potentially preventable ED visits. Among caregivers who took their child to the ED, over half said they visited the ED because they could not get an appointment at a doctor’s office or clinic as soon as they thought their child needed care. This type of potentially preventable ED visit was associated with lower personal doctor ratings and lower scores on doctors’ communication, independent of other demographic, health status, and health plan factors. Recommendations The EQRO recommends the following strategies to Texas HHSC for improving the delivery and quality of health care for children in STAR. These strategies are relevant to the reduction of potentially preventable ED visits (PPVs), which is one of HHSC’s over-arching goals for STAR MCOs. Domain Recommendations Rationale HHSC Recommendations/ Strategies Potentially preventable ED use among children in STAR Half of caregivers who took their child to the ED in the past six months said they went because they could not get a routine appointment for their child. MCOs should focus future quality improvement studies and provider education programs on PCPs who are assigned to members associated with or at risk for PPVs. MCOs should ensure that education programs are comprehensive and emphasize both provider and member communication skills. Texas Contract Year 2011 STAR Child Survey Report Version: V2.0 HHSC Approval Date: January 23, 2012 Caregivers who had positive relationships with their child’s personal doctor were less likely to have this type of potentially preventable visit. One of the HHSC 2012 Overarching Goals for STAR MCOs is to reduce emergency department utilization due to acute care sensitive conditions (ACSCs) through improved treatment. As a result, nine health plans included Page 4 Specifically, PIPs addressing this topic should include: (1) key provider communication skills outlined by the Accreditation Council of Graduate Medical Education, and (2) an intervention to help patients improve their ability to share information with providers, using one of the strategies described in the CAHPS® Improvement Guide . 2,3 Potentially Preventable ED Visits (PPVs) in their 2012 PIPs. Introduction and Purpose Nationally, the quality of pediatric health care is suboptimal in many areas, including care for acute medical problems, chronic medical problems, and preventive care. 4,5 Measuring caregivers’ preferences, experiences, and satisfaction is an essential component of assessing the quality of health care for children. 6,7 Caregivers are in a unique position to report on experiences with their children’s personal doctors, clinics, and managed care organizations (MCOs) and to identify the aspects of their children’s health care that need improvement. Furthermore, patients’ satisfaction with their health care is linked with positive health behaviors and outcomes. Caregivers who report they are satisfied with their children’s care have higher rates of treatment adherence. 8 Health care that is patient-centered – that reflects caregivers’ preferences, wants, and needs – is associated with improved health status and fewer diagnostic tests and referrals. 9 In fiscal year 2011, the STAR Program was administered through 14 managed care organizations (MCOs), providing services in nine urban geographic regions of Texas. Approximately 39 percent of all Texas Medicaid recipients receive their health care and services from a STAR MCO. 10 This report presents findings from the STAR Child Survey conducted by the Institute for Child Health Policy – the External Quality Review Organization (EQRO) for Texas Medicaid Managed Care – evaluating caregivers’ experiences and satisfaction with the care their children receive through STAR MCOs. Texas Contract Year 2011 STAR Child Survey Report Version: V2.0 HHSC Approval Date: January 23, 2012 Page 5 The purpose of the SFY 2011 STAR Child Survey is to: Describe the demographic and household characteristics of child members and their families. Assess the health status of the population, including children with special health care needs (CSHCN). Document caregiver experiences and general satisfaction with the care their children receive through STAR MCOs across four domains of care: o Utilization of health care and services, particularly emergency department (ED) use o Access to and timeliness of care o Patient-centered medical home o Health plan information and customer service Test the influence of domains of care on member ED use, controlling for demographic and health status variables. In addition, this report examines trends in caregiver experiences and satisfaction over time, comparing the results of the SFY 2009 and 2011 STAR Child Surveys. Methodology This section provides a brief overview of the methodology used to generate this report. Detailed descriptions of sample selection procedures, survey instruments, data collection, and data analyses are provided in Appendix A. Sample Selection Procedures The EQRO selected a stratified random sample of children in STAR, with a target of 4,200 completed telephone interviews (representing 300 respondents per MCO). STAR members younger than 18 years old were considered for inclusion in the survey sample if they were continuously enrolled in a STAR MCO for at least six months between September 2010 and February 2011 (allowing for one 30-day gap in enrollment). Members who participated in the prior year’s survey (SFY 2009) were excluded. Survey Instruments The SFY 2011 STAR Child Survey included: The Consumer Assessment of Healthcare Providers and Systems (CAHPS®) Health Plan Survey 4.0 (Medicaid module) 11 Texas Contract Year 2011 STAR Child Survey Report Version: V2.0 HHSC Approval Date: January 23, 2012 Page 6 Items from the CAHPS® Clinician and Group Surveys 12 The Children With Special Health Care Needs (CSHCN) Screener® Items developed by ICHP pertaining to caregiver and member demographic and household characteristics. 13 The CAHPS® Health Plan Survey (Version 4.0) is a widely used instrument for measuring and reporting consumer experiences with their or their child’s health plan and providers. The survey includes six questions that function as indicators of health plan performance, as listed on HHSC’s Performance Indicator Dashboard for SFY 2010. 14 It also allows for the calculation and reporting of health care composites, which are scores that combine results for closely related survey items. Composites provide a comprehensive yet concise summary of results for multiple survey questions. The EQRO calculated CAHPS® composite scores in the following domains: Getting Needed Care Getting Care Quickly How Well Doctors Communicate Health Plan Information and Customer Service Prescription Medicines Getting Specialized Services Personal Doctor Shared Decision-Making Getting Needed Information Care Coordination This is the first year that items from the CAHPS® Clinician and Groups Surveys were included in the STAR Child Survey. The selected items assess the quality of pediatric care with regard to health literacy and physician-initiated discussions with caregivers about child development, safety, and prevention. It should be noted that these items were slightly modified to fit the format and six-month time frame of the CAHPS® Health Plan Survey. Survey Data Collection Techniques The EQRO sent letters written in English and Spanish to caregivers of 9,890 sampled STAR members, requesting their participation in the survey. Of the advance letters sent, eight were returned undeliverable. The Survey Research Center (SRC) at the University of Florida conducted the survey using computer-assisted telephone interviewing (CATI) between May 2011 and November 2011. The SRC telephoned caregivers of STAR members seven days a week between 10 a.m. and 9 p.m. Central Time. Up to 30 attempts were made to reach a family, and if the family was not reached Texas Contract Year 2011 STAR Child Survey Report Version: V2.0 HHSC Approval Date: January 23, 2012 Page 7 after that time, the software selected the next individual on the list. If a respondent was unable to complete the interview in English, SRC rescheduled the interview at a later date and time with a Spanish-speaking interviewer. Of 4,208 completed interviews, 709 (17 percent) were conducted in Spanish. Thirty-four percent of families of members could not be located. Among those located, seven percent indicated that their child was not enrolled in STAR, and 14 percent refused to participate. The response rate was 55 percent and the cooperation rate was 75 percent. Data Analysis The EQRO conducted descriptive statistics and statistical tests using SPSS 17.0 (Chicago, IL: SPSS, Inc.). Frequency tables showing descriptive results for each survey question are provided in a separate Technical Appendix. 15 Supplementary tables of results are provided in Appendix B. The statistics presented in this report exclude "do not know" and "refused" responses. Percentages shown in most figures and tables are rounded to the nearest whole number; therefore, percentages may not add up to 100 percent. Analysis of differences in frequencies used the Pearson Chi-square test of independence, and analysis of differences in means used t-tests and analysis of variance (ANOVA). These tests allowed for comparison of frequencies and means between 2009 and 2011 results, among the different MCO groups, and among the demographic sub-groups within the sample. In addition, researchers conducted a multivariate analysis to examine the effects of demographic, health status, and health delivery factors on parent-reported potentially avoidable ED visits. A more detailed description of this analysis is presented in Appendix C. Survey Results This section presents survey findings regarding: 1) The demographic characteristics of caregivers and children; 2) Children’s health status; 3) Utilization of health care and services; 4) Access to and timeliness of care; 5) Presence of a usual source of care and patient-centered medical home; and 6) Comparison of STAR survey results in SFY 2009 and 2011. Description of Children and Their Caregivers Table 1 presents the sociodemographic characteristics of child members and their caregivers participating in the SFY 2011 STAR Child Survey. Child Characteristics Fifty-two percent of children in the sample were male and 48 percent were female. The average age was 8.3 years old. Hispanics were the largest racial-ethnic group, comprising 72 percent of the sample. Texas Contract Year 2011 STAR Child Survey Report Version: V2.0 HHSC Approval Date: January 23, 2012 Page 8 Respondent/Caregiver Characteristics Females comprised 94 percent of all caregivers participating in the survey. Ninety-one percent of caregivers were the biological parent of a child member. Grandparents accounted for 6 percent of all caregivers, and other relatives, including aunts, uncles, and siblings, accounted for 2 percent of all caregivers. The age of caregivers ranged from 18 to 93 years old, with a mean age of 35.4 years. Thirty-nine percent of caregivers had not completed high school. Thirty-six percent had completed high school, and 24 percent had an associate’s degree or bachelor’s degree. Forty-one percent of caregivers were married, 13 percent lived with an unmarried partner, and 46 percent were single, separated, divorced, or widowed. Table 1. Sociodemographic Characteristics of Child Members and Their Caregivers STAR Child Members STAR Caregivers 8.3 (SD = 5.1) 35.4 (SD = 10.9)) Male 52% 6% Female 48% 94% White, Non-Hispanic 12% 14% Black, Non-Hispanic 13% 13% Hispanic 72% 71% Other 4% 3% Mean Age Sex Race/Ethnicity Child’s Health Status Figure 1 presents caregivers' ratings of their child's overall health and mental health. The majority of caregivers provided positive ratings of their child’s overall and mental health. Seventy-one percent of caregivers rated their child’s overall health as very good or excellent, and 72 percent rated their child’s mental health as very good or excellent. Five percent rated their child’s overall health as fair or poor. Texas Contract Year 2011 STAR Child Survey Report Version: V2.0 HHSC Approval Date: January 23, 2012 Page 9 Figure 1. Caregivers' Ratings of Their Child's Overall Health and Mental Health 100% 80% 60% 49% 51% 40% 22% 21% 20% 24% 22% 5% 5% 0% Excellent Very Good Good Overall health Fair 0% 1% Poor Mental health Body Mass Index Figures 2 and 3 provide the Body Mass Index (BMI) results for boys and girls in the sample. Based on height and weight data, 44 percent of girls and 47 percent of boys were classified as overweight or obese. For state-level comparison, the prevalence of overweight and obesity in Texas (in 2003-2004) has been estimated at 42 percent for 4th-graders, 39 percent for 8thgraders, and 36 percent for 11th-graders. 16,17 Figure 2. Body Mass Index Classification for Boys 9% 30% 45% 17% Underweight Texas Contract Year 2011 STAR Child Survey Report Version: V2.0 HHSC Approval Date: January 23, 2012 Healthy Overweight Obese Page 10 Figure 3. Body Mass Index Classification for Girls 7% 26% 49% 18% Underweight Healthy Overweight Obese Table B1 in Appendix B shows rates of obesity (> 95th percentile) by MCO. Obesity rates ranged from 22 percent in AMERIGROUP to 40 percent in Community Health Choice. Differences in obesity rates among the STAR health plans were statistically significant. Special Health Care Needs Using the CSHCN Screener®, children were identified as having “special needs” if they met one or more of the following criteria: 1) Dependence on medications; 2) Greater than routine use of health and educational services; 3) Functional limitations (an inability to do things most children of the same age can do); 4) Need or use of specialized therapies; and 5) Need or use of treatment or counseling for emotional, developmental, or behavioral problems. Based on the CSHCN Screener, 18 percent of children were identified as having special health care needs that have persisted for more than one year. Figure 4 provides the percentage of children who met the criteria for each of the five CSHCN categories. Texas Contract Year 2011 STAR Child Survey Report Version: V2.0 HHSC Approval Date: January 23, 2012 Page 11 Figure 4. Children with Special Health Care Needs in STAR 20% 16% 15% 12% 12% 8% 8% 5% 4% 3% 0% Dependence on Above routine medications need/use of services Activity limitations Need/use of special therapies Need/use of counseling The most common special health care need among children in the sample was dependence on medications (15 percent), followed by the need for or use of mental health treatment or counseling (12 percent). In addition, eight percent of children used more medical care, mental health, or education services than their caregiver thought was typical for most children. Five percent reported their child experienced activity limitations, and three percent reported their child needed or received special therapy, such as physical, occupational, or speech therapy. Utilization of Health Care and Services Seventy-eight percent of caregivers participating in the STAR Child Survey reported their child went to a doctor’s office or clinic to get health care in the past six months: 46 percent of children went to a doctor’s office or clinic 1 or 2 times. 20 percent of children went to a doctor’s office or clinic 3 or 4 times. 12 percent of children went to a doctor’s office or clinic 5 or more times. 22 percent of children did not go to a doctor’s office or clinic to get health care. Twenty-two percent of caregivers reported they took their child to the emergency department (ED) for care at least once in the past six months. Among these caregivers, slightly more than half said they took their child to the ED because they could not get an appointment at a doctor’s office or clinic as soon as they thought their child needed care (52 percent). This follow-up question was used as the outcome of interest in the multivariate analysis discussed below. Texas Contract Year 2011 STAR Child Survey Report Version: V2.0 HHSC Approval Date: January 23, 2012 Page 12 On a scale of 0 to 10, caregivers rated the ED care their children received an average of 8.2 (SD = 2.4). Fifty-eight percent rated the care their child received in the emergency department as 9 or 10. Multivariate Analysis – Potentially Preventable ED Visits Appendix C presents the methodology and findings of a multivariate analysis, testing the relative influence of various elements of the patient-centered medical home model on the likelihood of potentially preventable ED visits, controlling for demographic factors, health status, and MCO membership. This analysis found significant associations between the likelihood of potentially preventable ED visits and the following factors: Child’s sex. Female members were approximately 1.5 times more likely than male members to have had a potentially preventable ED visit. Child’s MCO. Compared with members of Molina (who had the lowest rate overall of potentially preventable ED visits), members of Community First were approximately 2.4 times more likely to have had a potentially preventable ED visit. Members of Community Health Choice and UniCare were approximately twice as likely to have had a potentially preventable ED visit. CAHPS® How Well Doctors Communicate. Caregivers with high scores on the CAHPS® composite How Well Doctors Communicate (> 75) were about half as likely as caregivers with lower scores to have taken their child to the ED because they could not get an appointment for ambulatory care as soon as they thought it was needed. Personal doctor rating. Caregivers who rated their child’s personal doctor a 9 or 10 were 37 percent less likely than those who gave their child’s personal doctor a lower rating to have taken their child to the ED because they could not get an appointment for ambulatory care as soon as they thought it was needed. These findings suggest that high parental satisfaction with their child’s usual source of care – in particular, doctors’ communication – can help to reduce the occurrence of potentially preventable ED visits among children in the STAR program. Access to and Timeliness of Care This section provides caregiver’s reports of access to and timeliness of care for their child enrolled in STAR. Timeliness of Getting Care Caregivers were asked, “Not counting the times your child needed care right away, how many days did you usually have to wait between making an appointment and your child actually seeing a health provider?” The majority of caregivers said they were able to get an appointment for their child with a health provider within three days (78 percent). One in 10 caregivers said they had to wait longer than one week to get an appointment for their child (10 percent). Texas Contract Year 2011 STAR Child Survey Report Version: V2.0 HHSC Approval Date: January 23, 2012 Page 13 For some caregivers, access to providers was hampered by provider hours and availability (see Figure 5). When asked how often they had to wait for an appointment for their child because the provider worked limited hours or had few appointment slots available, 53 percent of caregivers said they never had to wait for an appointment, 26 percent said they sometimes had to wait for an appointment, and 21 percent said they usually or always had to wait. Figure 5. How Often Child Waited for an Appointment Because Health Provider Worked Limited Hours or Had Few Available Appointments 53% 0% 20% Never 26% 40% Sometimes 60% Usually 7% 14% 80% 100% Always Two CAHPS® survey questions comprise the composite Getting Care Quickly, assessing how often caregivers were able to get routine and urgent care for their child. Overall, 83 percent of caregivers “usually” or “always” had positive experiences with Getting Care Quickly. This is slightly below the 87 percent reported for this composite measure in Medicaid plans nationally. The mean score for the CAHPS® composite Getting Care Quickly was 2.54 out of 3.00, following NCQA specifications. Differences between health plans on this composite were not statistically or meaningfully significant (Table B2 in Appendix B). The two survey items that make up the CAHPS® composite Getting Care Quickly are also HHSC Performance Dashboard Indicators (Table B3 in Appendix B). Good access to urgent care. Eighty-six percent of caregivers whose child needed care right away for an illness, injury, or condition reported the child usually or always received care as soon as needed. The percentage of STAR members with good access to urgent care ranged from 83 percent in AMERIGROUP, Cook Children’s, El Paso First, and Parkland Community to 94 percent in Driscoll. Eight MCOs performed at or above the Dashboard standard for good access to urgent care. Good access to routine care. Seventy-nine percent of caregivers reported that they usually or always were able to make a routine appointment as soon as they thought their child needed. The percentage of members with good access to routine care ranged from 71 percent in Parkland Community to 82 percent in Community First, Driscoll, FirstCare, Texas Contract Year 2011 STAR Child Survey Report Version: V2.0 HHSC Approval Date: January 23, 2012 Page 14 and Superior. None of the MCOs met the Dashboard standard for good access to routine care. Receiving care in a timely manner often depends on approval from the health plan. Sixty-three percent of caregivers reported they never experienced delays in getting health care for their child due to waiting on health plan approval for that care. The percentage of STAR members who had no delays in getting health plan approval for their child’s care ranged from 54 percent in Molina to 73 percent in El Paso First (Table B3 in Appendix B). Five STAR MCOs met the Dashboard standard for members experiencing no delays in health plan approval. In addition, caregivers were asked about their experiences seeking after-hours care for their child. Eighteen percent of caregivers said their child needed to visit a doctor’s office or clinic for after-hours care. Among these caregivers, 66 percent said it was usually or always easy to get after-hours care for their child. Eleven percent reported it was never easy and 23 percent reported it was only sometimes easy to get after hours care for their child. Office Wait Caregivers were asked how often their child was seen within 15 minutes of his or her appointment in the past 6 months. Figure 7 provides the results for how often caregivers reported they waited less than 15 minutes before their child was seen for an appointment. Office wait time in the STAR program is below HHSC’s Dashboard Standard (35 percent), with only 24 percent of caregivers reporting that their child was always seen within 15 minutes of his or her appointment. The percentage of caregivers who reported waiting no more than 15 minutes for their child to be taken to the exam room ranged from 20 percent in Aetna and El Paso First to 29 percent in Community First and UnitedHealthcare-Texas (Table B3 in Appendix B). None of the STAR MCOs met the Dashboard standard for this measure. Figure 7. How Often Caregivers Waited Less Than 15 Minutes for Their Child's Appointment 33% 0% 20% Never Texas Contract Year 2011 STAR Child Survey Report Version: V2.0 HHSC Approval Date: January 23, 2012 27% 40% Sometimes 16% 60% Usually 24% 80% 100% Always Page 15 Access to Specialist Care Fifteen percent of caregivers reported that they tried to make an appointment for their child to see a specialist. Among these caregivers, 68 percent indicated that it was usually or always easy to get appointments for their child with specialists, and 32 percent indicated it was sometimes or never easy to get appointments for their child with specialists. Having good access to specialist referrals is an HHSC Performance Dashboard Indicator. Sixtynine percent of caregivers reported it was usually or always easy to get a referral to a specialist their child needed to see. The percentage of STAR members who had good access to specialist referrals ranged from 58 percent in AMERIGROUP to 85 percent in FirstCare (Table B3 in Appendix B). Thirteen STAR MCOs met the Dashboard standard for this survey item. When asked to rate their child’s specialist on a scale of 0 to 10, 70 percent of caregivers gave a rating of 9 or 10. The mean specialist rating for STAR was 8.7 (SD = 2.4). The CAHPS® composite Getting Needed Care is based on two survey items that assess: (1) How often it was easy for caregivers to get appointments for their child with specialists, and (2) How often it was easy for caregivers to get care, tests and treatment for their child through their child’s health plan. Seventy-two percent of caregivers “usually” or “always” had positive experiences with Getting Needed Care, compared to the 79 percent reporting for Medicaid plans nationally. The mean score for the CAHPS® composite Getting Needed Care was 2.28 out of 3.00, following NCQA specifications. Differences between health plans on this composite were statistically significant (Table B2 in Appendix B). In addition, CSHCN were significantly less likely to get needed care than their non-CSHCN counterparts (Table B4 in Appendix B). Access to specialized services The percentage of STAR Members needing specialized services in each of following four service categories was relatively low (as reported by caregivers): 1 percent needed home health care or assistance. 5 percent needed special medical equipment or devices. 6 percent needed special therapies, such as physical, occupation, or speech therapy. 8 percent needed treatment or counseling for an emotional, behavioral, or developmental problem. Figure 8 provides the percentage of caregivers who said it was usually or always easy to get specialized services for their child. The service with the lowest access was home health care or assistance (59 percent). The service with the highest access was special medical equipment and devices (74 percent). Good access to the most commonly utilized special service – behavioral health treatment and counseling – was reported by 61 percent of caregivers. This Texas Contract Year 2011 STAR Child Survey Report Version: V2.0 HHSC Approval Date: January 23, 2012 Page 16 measure is an HHSC Performance Dashboard Indicator, although there is no specified standard for performance. Figure 8. The Percentage of STAR Members with Good Access to Specialized Services 100% 80% 60% 74% 64% 59% 61% 40% 20% 0% Home health care / assistance Special medical equipment / devices Special therapies Treatment / counseling The CAHPS® composite, Getting Specialized Services assesses how often it was easy for caregivers to get special medical equipment or devices, special therapies, and behavioral health treatment or counseling for their child. The mean score for Getting Specialized Services following NCQA specifications was 2.19 out of 3.00 for children in STAR. Overall, 66 percent of caregivers “usually” or “always” had positive experiences with Getting Specialized Services for their child, which is below the 75 percent reported for Medicaid plans nationally. Prescription medicines The CAHPS® composite Prescription Medicines consists of a single item assessing how often it was easy for parents to get prescription medicines for their child. Among the 42 percent of caregivers who reported getting or refilling a prescription medicine for their child in the past 6 months, the vast majority said it was usually or always easy to get prescription medicines for their child through his or her health plan (88 percent). This is comparable to the national Medicaid mean of 91 percent. Slightly more than half of caregivers reported that someone at their child’s health plan, doctor’s office, or clinic helped them to get their child’s prescription medicine (56 percent). Texas Contract Year 2011 STAR Child Survey Report Version: V2.0 HHSC Approval Date: January 23, 2012 Page 17 Caregiver Satisfaction with All Their Child’s Health Care When asked to rate all of their child’s health care in the past 6 months on a scale of 0 to 10, 67 percent of caregivers gave a rating of 9 or 10. The mean caregiver rating for all health care their child received in STAR was 8.9 (SD = 1.6). Patient-Centered Medical Home This section examines caregiver experiences receiving care for their child from a patientcentered medical home model. The American Academy of Pediatrics (AAP) in its 2002 policy statement defined the medical home concept as a model for delivering primary care that is “accessible, continuous, family-centered, coordinated, compassionate, and culturally effective” for families and children. 18 More recently, the AAP, the American Academy of Family Physicians, the American College of Physicians (ACP), and the American Osteopathic Association (AOA) issued a joint statement identifying seven principles of the medical home model: 19 Personal physician Physician-directed medical practice Whole person orientation Care that is coordinated and/or integrated across settings and providers Quality and safety Enhanced Access (e.g. open scheduling, extended hours) Payment This survey addressed different components of the medical home model, specifically whether members have an ongoing relationship with a personal doctor, have access to advice and care during and after regular business hours, and receive high quality, patient-centered, and compassionate care from their personal doctor and office staff. Presence of a Usual Source of Care Figure 6 presents the percentage of STAR members who had a personal doctor for each MCO. Overall, 84 percent of caregivers reported their child had a personal doctor. The percentage of members with a personal doctor ranged from 78 percent in Molina to 92 percent in Driscoll. Texas Contract Year 2011 STAR Child Survey Report Version: V2.0 HHSC Approval Date: January 23, 2012 Page 18 Figure 6. The Percentage of STAR Child Members with a Personal Doctor by MCO STAR overall 84% Aetna 86% AMERIGROUP 84% Community First 87% Community Health Choice 86% Cook Children's 86% Driscoll 92% El Paso First 86% FirstCare 87% Molina 78% Parkland 83% Superior 82% Texas Children's 85% UniCare 82% UnitedHealthcare‐Texas 81% 0% 20% 40% 60% 80% 100% Half of caregivers reported that their child had been going to his or her personal doctor for more than three years (51 percent). Approximately 19 percent of children had been going to their personal doctor for less than one year, suggesting the absence of a continuous, long-term relationship with their personal doctor. Fifty-five percent of caregivers said their child had the same personal doctor before joining their health plan. This suggests a need for improved continuity of care for the 45 percent of children who did not have the same personal doctor before joining their health plan. When asked to rate their child’s personal doctor on a scale of 0 to 10, 75 percent of caregivers gave a rating of 9 or 10, compared to 70 percent who gave their child’s personal doctor a rating of 9 or 10 in Medicaid plans nationally. The mean personal doctor rating for STAR was 9.1 (SD = 1.6). Several survey items assessed caregivers’ experiences with their child’s personal doctor in the clinical setting, for which the CAHPS® Personal Doctor composite provides an overall score. Texas Contract Year 2011 STAR Child Survey Report Version: V2.0 HHSC Approval Date: January 23, 2012 Page 19 This composite uses three CAHPS® survey questions to assess whether personal doctors discussed developmental issues with caregivers and were able to understand how medical or behavioral health conditions affect the child’s and family’s day-to-day life. The composite score for positive experiences with personal doctors in STAR was 86 percent, which is comparable to the Medicaid national rate of 88 percent. The NCQA mean for Personal Doctor was 0.86 on a scale from 0 to 1. Differences between health plans on the Personal Doctor composite were statistically significant, with performance ranging from 0.74 in AMERIGROUP to 0.98 in Community Health Choice (Table B5 in Appendix B). Courteous and Helpful Office Staff Caregivers were asked about their experiences with clerks and receptionists at their child’s doctor’s office. Most provided positive evaluations of their experiences with office staff at their child’s doctor’s office: 78 percent reported that the office staff was usually or always helpful. 88 percent reported that the office staff usually or always treated them with courtesy and respect. Seeking Help and Advice Thirty-six percent of caregivers called their child’s personal doctor’s office during regular office hours to get help or advice for their child. Among these caregivers, 83 percent said they usually or always were able to get the help or advice for their child they needed. Caregivers were also asked if they sought help or advice for their child after regular office hours. Fourteen percent reported seeking after-hours help or advice from their child’s personal doctor. Three out of four caregivers said they usually or always were able to get help or advice from their child’s personal doctor after regular business hours (76 percent). The remaining one out of four caregivers reported some difficulty seeking help or advice from their child’s personal doctor after regular office hours, suggesting the need for many STAR providers to improve access to their offices after hours and/or establish 24-hour medical advice lines. The CAHPS® composite Getting Needed Information assesses how often caregivers had their questions answered by their child’s doctors or other health care providers. Ninety-two percent of caregivers stated that they usually or always had their questions answered by their child’s doctors or other health care providers. This percentage is slightly higher than the 89 percent reported for Medicaid plans nationally. The mean score for Getting Needed Information following NCQA specifications was 2.77 out of 3.00. Texas Contract Year 2011 STAR Child Survey Report Version: V2.0 HHSC Approval Date: January 23, 2012 Page 20 Caregiver Satisfaction with Doctors’ Communication Five CAHPS® survey questions comprise the composite How Well Doctors Communicate. This composite assesses how often a child’s personal doctor explains things well, listens carefully, shows respect, and spends enough time with the family. Results are based on the percentage of caregivers who report they usually or always had positive communication experiences with their child’s personal doctor (See Figure 7). The majority of caregivers were highly satisfied with the quality of communication they had with their child’s personal doctor. Combining responses to all five questions, 88 percent of caregivers usually or always had positive experiences with How Well Doctors Communicate. However, this percentage is slightly lower than the 92 percent reported for Medicaid plans nationally. The mean score for How Well Doctors Communicate following NCQA specifications was 2.69 out of 3.00. In addition, performance on this composite was significantly different across STAR MCOs (Table B2 in Appendix B). Among the items in this composite, the lowest caregiver satisfaction was for the amount of time the personal doctor spent with the child. One in four caregivers indicated that their child’s personal doctor never or only sometimes spent enough time with their child. Figure 7. How Well Doctors Communicate - The Percentage of Caregivers Who Reported Their Child’s Doctor Usually or Always… Listened carefully 93% Explained things well to parent 91% Explained things well to child 86% Showed respect 95% Spent enough time w/child 77% 0% 20% 40% 60% 80% 100% In addition to items that comprise the CAHPS® composite, caregivers were asked additional questions about their relationship with their child’s personal doctor. The results of these items also indicate a high level of satisfaction with their child’s personal doctor and his or her communication skills and ability to provide patient-centered care: 92 percent reported that they felt that their child’s personal doctor usually or always cared about their child and family. Texas Contract Year 2011 STAR Child Survey Report Version: V2.0 HHSC Approval Date: January 23, 2012 Page 21 91 percent reported their child’s personal doctor usually or always showed interest in their questions and concerns. 92 percent reported their child’s personal doctor never interrupted them when they were talking. 96 percent reported their child’s personal doctor never used a condescending, sarcastic, or rude tone or manner with them. Shared Decision-making Slightly more than half of the caregivers (51 percent) said their child’s provider informed them there was more than one choice for their child’s treatment or health care. Among these caregivers: 91 percent said the provider informed them about the pros and cons of each choice for their child’s treatment or health care. 84 percent said the provider asked them which choice they thought was best for their child. Together, these CAHPS® survey items comprise the composite Shared Decision-Making, for which 88 percent of caregivers had positive experiences. Well-child, Developmental, and Preventive Care Caregivers of children younger than two years of age were asked if they received reminders to bring their child in for shots and other health care services. The vast majority said they had received reminders about their child’s check-ups (89 percent), and 92 percent said they were able to schedule check-ups for their child as soon as they thought he or she needed to be seen by a provider. A supplemental set of CAHPS® survey items from the Clinician and Group Surveys were included in the fiscal year 2011 STAR Child Survey to assess caregiver experiences with their child’s personal doctor in discussing developmental and preventive care issues. Although national Medicaid comparative data is not available for these survey items, the results are useful in evaluating aspects of the medical home model, and the extent to which primary care providers (PCPs) take a “whole-person” approach to providing care. This approach includes discussing with caregivers the child’s developmental milestones; emotional, psychological, and social functioning; and safety and prevention. Figure 8 provides the percentage of caregivers whose child had a visit with their personal doctor in the past six months, and who reported their child’s personal doctor had a discussion with them about their child’s growth, moods and emotions, behavior, social functioning, and learning ability. Texas Contract Year 2011 STAR Child Survey Report Version: V2.0 HHSC Approval Date: January 23, 2012 Page 22 Figure 8. Developmental Care Issues - The Percentage of Caregivers Who Reported That Their Child’s Personal Doctor Discussed… 76% How child's body is growing 61% Child's moods and emotions 70% Behaviors that are normal for a child at this age 58% How child gets along with others 64% Child's learning ability 0% 20% 40% 60% 80% 100% The majority of caregivers reported that they had a discussion about aspects of their child’s development with their child’s personal doctor. Three-quarters of caregivers reported that their child’s personal doctor had a discussion with them regarding their child’s growth and physical development during an office visit (76 percent), and 70 percent reported their child’s personal doctor had a discussion with them about age-appropriate, normative behavior among children. A smaller percentage of caregivers said that their child’s personal doctor talked with them about their child’s learning ability (64 percent), moods and emotions (61 percent), and how well the child gets along with others (58 percent). Figure 9 provides the percentage of caregivers whose child had a visit with their personal doctor in the past 6 months, and who reported their child’s personal doctor had a discussion with them about their child’s safety, their child’s diet and exercise, and family problems that may affect their child’s well-being. Texas Contract Year 2011 STAR Child Survey Report Version: V2.0 HHSC Approval Date: January 23, 2012 Page 23 Figure 9. Child Safety Issues - The Percentage of Caregivers Who Reported That Their Child’s Personal Doctor Discussed… 74% How much child eats 63% How much child exercises 51% Problems in household that may affect child 62% Things to do to keep child from getting injured 44% Provided written materials on injury prevention 0% 20% 40% 60% 80% 100% Health Literacy For fiscal year 2011, the EQRO also added a series of supplemental CAHPS® items addressing health literacy and the efforts of providers in recognizing the health literacy of their patients. Among these items are five types of practices that personal doctors can do in the clinical setting to address health literacy. Table 2 shows the percentage of caregivers who reported their child’s personal doctor usually or always used these positive practices. Table 2. Health Literacy Promotion by Personal Doctors The child’s personal doctor… Percent of caregivers who answered “usually” or “always” Used pictures, drawings, or models to explain things. 15% Gave the caregiver easy-to-understand instructions about how the caregiver’s child should take his/her medication. 95% Explained the possible side effects of the child’s medicines in a way that was easy to understand. 95% Gave the caregiver written information about how the child should take medication that was easy to understand. 93% Suggested ways to help the caregiver and child remember to take the child’s medicine. 65% Texas Contract Year 2011 STAR Child Survey Report Version: V2.0 HHSC Approval Date: January 23, 2012 Page 24 Although most caregivers reported their child’s personal doctor generally provided them with verbal and written instructions that were easy to understand, 1 in 3 also reported that their child’s personal doctor had used medical terms in the past six months that they did not understand (32 percent). Care coordination One-third of caregivers (31 percent) stated their child received care from another doctor or provider who was not their child’s personal doctor. Among these caregivers: 70 percent said their child’s personal doctor seemed informed and up-to-date about the care their child received through these other providers. 60 percent said that someone from their child’s doctor’s office or clinic helped them coordinate their child’s care among these other health providers. Two CAHPS® survey items comprise the composite Care Coordination, which assesses whether caregivers received help: (1) from their child’s health plan, doctor’s office, or clinic in coordinating care among different providers and services; and (2) from doctors or providers in contacting their child’s school or daycare. Combining responses to both questions, 71 percent of caregivers had positive experiences with Care Coordination. This percentage is slightly lower than the 75 percent reported for Medicaid plans nationally. The NCQA mean for Care Coordination was 0.71 on a scale of 0 to 1. Statistical comparison of racial-ethnic groups in the STAR Program revealed that white, nonHispanic children were significantly less likely to receive care coordination than children of other racial-ethnic groups (Table B6 in Appendix B). Eighteen percent of caregivers reported receiving help from a case manager or care coordinator who was not from their child’s health plan, doctor’s office, or clinic. The vast majority of respondents (98 percent) stated they were “satisfied” or “very satisfied” with the care coordination their children received. Experiences with Child’s Health Plan Health Plan Information and Materials Having control over which health plan a child can have and which providers a child can see is associated with caregiver satisfaction. Seventy-eight percent of caregivers reported they chose their child’s health plan, while 22 percent were told which plan their child was in. Fourteen percent of caregivers said they looked for information in written materials or on the Internet about how their child’s health plan works. Among those who looked for information, 70 percent said the materials usually or always provided the information they needed. Texas Contract Year 2011 STAR Child Survey Report Version: V2.0 HHSC Approval Date: January 23, 2012 Page 25 Before enrolling their child in the health plan, 65 percent of caregivers said they received information about the health plan in writing, by telephone, on the Internet, or in person. Among these caregivers, 66 percent said that all the information they were given about the health plan was correct, while 25 percent said that most of the information was correct. The amount and complexity of paperwork required for enrollment, renewal, or other reasons may also be associated with caregiver satisfaction with their child’s health plan. Twenty-nine percent of caregivers said their child’s health plan had given them forms to fill out. Among these caregivers, 84 percent said that the forms were usually or always easy to fill out, compared with 82 percent nationally. Customer Service Eighteen percent of caregivers reported that they tried to get information or help from customer service at their child’s health plan in the past six months. Among caregivers who contacted customer service in the past six months: 80 percent reported that they usually or always received the information or help they needed from customer service at their child’s health plan. 88 percent reported that the customer service staff at their child’s health plan usually or always treated them with courtesy and respect. The above items comprise the composite Health Plan Information and Customer Service. Combining responses to both questions, 84 percent of STAR caregivers “usually” or “always” had positive experiences with Health Plan Information and Customer Service, which is higher than the 80 percent reported for Medicaid plans nationally. The mean score for this composite, following NCQA specifications, was 2.55 out of 3.00. Caregivers of CSHCN were significantly less likely to have positive experiences with their child’s health plan than caregivers of nonCSHCN (Table B4 in Appendix B). Caregivers also reported the number of calls it took to customer service at their child’s health plan to get the information or help they needed: 46 percent reported making 1 call 27 percent reported making 2 calls 18 percent reported making 3 or 4 calls 7 percent reported making 5 or more calls 3 percent reported they were still waiting for help. Texas Contract Year 2011 STAR Child Survey Report Version: V2.0 HHSC Approval Date: January 23, 2012 Page 26 Transportation Eight percent reported phoning their child’s health plan to get help with transportation for their child’s appointments. Among those who needed help with transportation, 65 percent usually or always were able to get the transportation help they needed. Nineteen percent reported they never received help with transportation from their child’s health plan, and 16 percent reported they only sometimes received help with transportation. When asked whether the transportation met their needs, 83 percent indicated these needs were usually or always met by the health plan. Caregiver Satisfaction with Child’s STAR Health Plan When asked to rate their child’s STAR health plan on a scale of 0 to 10, 81 percent of caregivers gave a rating of 9 or 10. The mean caregiver rating for their child’s health plan was 9.3 (SD = 1.3). Prior-year Comparisons Table 3 shows scaled results for the 10 CAHPS® Composite measures for STAR in SFY 2009 and SFY 2011, using modified NCQA specifications. 20 Since 2009, performance was significantly better for How Well Doctors Communicate, Customer Service, and Getting Needed Information. Table 3. CAHPS® Composite Measures in 2009 and 2011 2009 mean 2011 mean F p-value Getting Needed Care 2.325 2.305 0.45 0.5033 Getting Care Quickly 2.482 2.469 0.49 0.4830 How Well Doctors Communicate 2.670 2.694 4.79 0.0287 Customer Service 2.393 2.506 13.90 0.0002 Prescription Medicines 2.703 2.678 1.78 0.1824 Getting Specialized Services 2.256 2.220 0.69 0.4061 Personal Doctor 0.857 0.871 3.47 0.0626 Shared Decision-Making 0.889 0.897 0.83 0.3615 Getting Needed Information 2.634 2.766 80.37 <0.0001 Care Coordination 0.680 0.667 0.47 0.4943 Table 4 shows results for the six HHSC Performance Dashboard Indicators for STAR in fiscal year 2009 and fiscal year 2011, as well as the HHSC performance standards (which remained the same for both years). Since 2009, significantly fewer caregivers reported that their child was usually or always taken to the exam room within 15 minutes of their appointment. Texas Contract Year 2011 STAR Child Survey Report Version: V2.0 HHSC Approval Date: January 23, 2012 Page 27 Table 4. HHSC Performance Dashboard Indicators in 2009 and 2011 2009 2011 Good access to routine care 80.1% 78.8% Good access to urgent care 87.3% Good access to specialist referral Chisquare p-value HHSC standard 1.704 0.1918 84% 87.4% 0.002 0.9653 86% 69.2% 71.1% 0.655 0.4185 59% No delays for an approval 61.0% 63.3% 1.194 0.2746 65% No exam room wait greater than 15 minutes 30.3% 24.5% 34.108 <0.0001 35% Good access to BH treatment or counseling 62.4% 60.8% 0.222 0.6374 - Summary Points and Recommendations This report provides results from the SFY 2011 STAR Child Enrollee Survey regarding: (1) demographic and household characteristics of STAR enrollees and their caregivers; (2) the health status of STAR enrollees, including body mass index and special health care needs; and (3) caregiver experiences and satisfaction with the access and timeliness of their child's routine, urgent, and specialized care; elements of the patient-centered medical home, such as doctor's communication, shared decision-making, and care coordination; and experiences with their child’s health plan, including customer service and transportation. Demographic and household characteristics Enrollee Characteristics. Approximately half of STAR enrollees were male, and half were female. The average age of enrollees was 8 years old. Hispanic enrollees represented the largest racial/ethnic group in STAR (72 percent), followed by Black, nonHispanics (13 percent), and White, non-Hispanics (12 percent). Caregiver Characteristics. Survey respondents were predominantly female and Hispanic, with an average age of 35 years old. Thirty-nine percent of respondents had less than a high school education. Nearly half of respondents were single or unmarried. Child’s health status Overall Health and Mental Health. Nearly three-quarters of caregivers reported that their child’s overall health was “excellent” or “very good” and that their child’s mental health was “excellent” or “very good.” Approximately one-half of children were overweight or obese. Special Health Care Needs. Nearly one-fifth of children in STAR were identified as having at least one special health care need that persisted for more than one year. The most common special health care need was dependence on medications (15 percent), followed by need or use of behavioral health treatment or counseling (12 percent), and above-routine need or use of services (8 percent). Texas Contract Year 2011 STAR Child Survey Report Version: V2.0 HHSC Approval Date: January 23, 2012 Page 28 Utilization of Health Care and Services Doctor’s Office or Clinic Use. About half of children in STAR went to a doctor’s office one or two times within the past 6 months to get health care. Emergency Department Use. Approximately one-fifth of caregivers took their child to the emergency department (ED) at least once in the past six months. Fifty-eight percent of caregivers rated the care their child received at the ED as 9 or 10. Preventable ED Visits. Among caregivers who took their child to the ED, over half said they visited the ED because they could not get an appointment at a doctor’s office or clinic as soon as they thought their child needed care. This type of potentially preventable ED visit was associated with lower personal doctor ratings and lower scores on doctors’ communication, independent of other demographic, health status, and health plan factors. Access to and timeliness of care Timeliness of Getting Care. Seventy-eight percent of caregivers were able to get an appointment for their child with a health care provider within three days. Over half of caregivers reported that they never had to wait for an appointment because the provider worked limited hours or had few appointment slots available. Getting Care Quickly. Eighty-three percent of caregivers usually or always had positive experiences with Getting Care Quickly, which is slightly below the Medicaid national average of 87 percent. Good Access to Urgent Care. Eighty-six percent of caregivers reported that they received care for an illness, injury, or condition as soon as they needed, which meets the HHSC Dashboard standard of 86 percent for STAR. Good Access to Routine Care. Approximately four-fifths (79 percent) of caregivers were usually or always able to make a routine appointment as soon as they thought their child needed, which fell below the HHSC Dashboard standard of 84 percent. No Delays for Health Plan Approval. Sixty-three percent of caregivers reported that they never experienced delays in health care for their child due to waiting for approval from their health plan, which is comparable to the HHSC Dashboard Standard of 65 percent. Office Wait. Nearly one quarter of patients reported that their child was seen within 15 minutes of his or her appointment. This is below the HHSC Dashboard standard of 35 percent. Access to Specialist Care. Fifteen percent of caregivers tried to make a specialist appointment for their child. Among these caregivers, 68 percent reported that it was usually or always easy to see a specialist. Good access to specialist referral was 69 percent, which is considerably higher than the HHSC Dashboard standard of 59 percent for STAR. The percentage of caregivers who rated their child’s specialist a 9 or 10 was Texas Contract Year 2011 STAR Child Survey Report Version: V2.0 HHSC Approval Date: January 23, 2012 Page 29 70 percent, compared to the Medicaid national average of 66 percent. Seventy-two percent of caregivers had positive experiences with Getting Needed Care, which is slightly below the national average of 79 percent. Access to Specialized Services. The most needed specialized service reported by caregivers was treatment or counseling for an emotional, behavioral, or developmental problem (8 percent). Thirty-nine percent of caregivers reported that access to behavioral treatment was “sometimes” or “never easy” to get for their child. Specialized medical equipment and devices was the easiest type of specialized service to receive (74 percent). Caregivers reported positive experiences with Getting Specialized Services 66 percent of the time, which is below the national average of 75 percent. Prescription Medicines. Forty-two percent of caregivers reported having filled or refilled a prescription for their child during the six months prior to the survey. Among these 42 percent of caregivers, 88 percent said that it was usually or always easy to get prescription medicines through their health plan. The CAHPS® Prescription Medicines composite result was comparable to the Medicaid national average (88 percent vs. 91 percent). Caregiver Satisfaction with All Their Child’s Care. Sixty-seven percent of caregivers rated their child’s health care in the past six months as 9 or 10, on a scale from 0 to 10. The mean caregiver rating was 8.9. Patient-Centered Medical Home Presence of a Usual Source of Care. Eighty-four percent of STAR enrollees had a personal doctor. Among these enrollees, half of caregivers reported that their child had been going to his or her personal doctor for more than three years. The percentage of caregivers who rated their child’s personal doctor a 9 or 10 was greater than the Medicaid national average (75 percent vs. 70 percent). The CAHPS® Personal Doctor composite result was comparable to the Medicaid national average (86 percent vs. 88 percent). The majority of personal doctors discussed child development concerns with caregivers. Courteous and Helpful Office Staff. Seventy-eight percent of caregivers reported that the office staff was usually or always helpful, and 88 percent reported that the office staff usually or always treated them with courtesy and respect. Seeking Help and Advice. Caregivers of STAR enrollees reported good access to help or advice when calling their child’s personal doctor during normal office hours (83 percent) and slightly lower access when calling after normal office hours (76 percent). The CAHPS® Getting Needed Information composite result was slightly higher than the Medicaid national average (92 percent vs. 89 percent). Satisfaction with Doctors’ Communication. The CAHPS® How Well Doctors Communicate composite result was slightly lower than the Medicaid national average (88 percent vs. 92 percent). The mean score following NCQA specifications was 2.69 out of 3.00. Texas Contract Year 2011 STAR Child Survey Report Version: V2.0 HHSC Approval Date: January 23, 2012 Page 30 Shared decision-making. The CAHPS® Shared Decision-Making composite result was 88 percent. Although no national comparisons were available, this high percentage is an indication of good performance for shared decision-making in the STAR Program. Well-Child, Developmental, and Preventive Care. A majority (92 percent) of caregivers were able to schedule check-ups for their child as soon as they thought they needed to be seen by a provider. Caregivers reported that child’s growth (76 percent) was the most common development care issue that their doctors discussed with them. Child’s diet was the most common child safety issue that doctors discussed with caregivers (74 percent). Most personal doctors practiced good promotion of health literacy, although few caregivers reported their child’s personal doctor used pictures, drawings, and models to explain things (15 percent). Care Coordination. One-third of STAR child enrollees received care from a health provider besides their personal doctor. Among caregivers of these children, approximately three-quarters said their child’s personal doctor seemed informed and upto-date about the care their child received from these other providers. The CAHPS® Care Coordination composite result was slightly lower than the Medicaid national average (71 percent vs. 76 percent). Experiences with Child’s Health Plan Health Plan Information, Materials, and Paperwork. More than three-quarters of caregivers reported that they chose their child’s health plan. Eighty-four percent of caregivers said that forms given to them by their child’s health plan were usually or always easy to fill out, which is slightly above the Medicaid national average (82 percent). Customer Service. The CAHPS® Health Plan Information and Customer Service composite result was 84 percent, which is higher than the Medicaid national average of 80 percent. The majority of caregivers who called to get help or information from STAR customer service “usually” or “always” got the help or information they needed (80 percent), with 46 percent getting the help or information they needed in one call. Transportation. Sixty-five percent of caregivers reported that they usually or always received help with transportation. Eighty-three percent reported that their transportation needs were usually or always met by their health plan. Caregiver Satisfaction with Child’s STAR Health Plan. The percent of caregivers who rated the STAR Program a 9 or 10 was 81 percent. The mean caregiver rating was 9.3. Texas Contract Year 2011 STAR Child Survey Report Version: V2.0 HHSC Approval Date: January 23, 2012 Page 31 Recommendations The EQRO recommends the following strategies to Texas HHSC for improving the delivery and quality of health care for children in STAR. These strategies are relevant to the reduction of potentially preventable ED visits (PPVs), which is one of HHSC’s over-arching goals for STAR MCOs. Domain Potentially preventable ED use among children in STAR Recommendations For members with high ED utilization, STAR MCOs should ensure not only that they have a personal doctor, but also that they have a positive relationship with their personal doctor. MCOs should focus future quality improvement studies and provider education programs on PCPs who are assigned to members associated with or at risk for PPVs. In cases where poor patient-provider communication is evident, MCOs should ensure that education programs are comprehensive and emphasize both provider and member communication skills. Specifically, PIPs addressing this topic should include: Five key communication skills for PCPs recommended by the Accreditation Council of Graduate Medical Education: (1) listening effectively; (2) effective questioning skills; (3) effective explanatory skills; (4) counseling and educating patients; and (5) making informed decisions based on patient information and preference. 21 Rationale Half of caregivers who took their child to the ED in the past six months said they went because they could not get a routine appointment for their child. Caregivers who had positive relationships with their child’s personal doctor were less likely to have this type of potentially preventable visit. Specifically, personal doctor ratings and satisfaction with doctors’ communication were associated with lower rates of PPVs. Rates of parent-reported PPVs were significantly higher in Community First (63 percent) and UniCare (61 percent). An intervention to help patients improve their ability to share information with providers, using one of many strategies described in the CAHPS® Improvement Guide, including: record sharing, patient question lists, and coached care. 22 Texas Contract Year 2011 STAR Child Survey Report Version: V2.0 HHSC Approval Date: January 23, 2012 Page 32 The EQRO also recommends that HHSC and STAR MCOs monitor the following areas, based on findings of low caregiver satisfaction in domains that do not directly address the over-arching goals. Continued issues with quality of care in these domains may warrant additional studies and their eventual inclusion in MCO performance improvement projects. Getting Needed Care. Results on the CAHPS® Getting Needed Care composite show that children in STAR have more difficulty getting specialist care and health plan approval for their child than Medicaid members nationally. One in three caregivers reported having difficulty getting an appointment for their child with a specialist. One in four reported difficulty getting approval for tests and treatment for their child through his or her health plan. The CAHPS® Improvement Guide describes a number of strategies for increasing access to care at the provider level, including rapid referral programs and streamlined or improved patient flow. 23 Texas Contract Year 2011 STAR Child Survey Report Version: V2.0 HHSC Approval Date: January 23, 2012 Page 33 Appendix A. Detailed Survey Methodology Sample Selection Procedures Survey participants were selected from a stratified random sample of children who were enrolled in STAR in Texas for six months or longer between September 2010 and February 2011. These criteria ensured that families would have sufficient experience with the program to respond to the survey questions. Members whose caregivers had participated in the prior year’s survey (SFY 2009) were excluded from the sample. The sample was stratified to include representation from the 14 health plans participating in STAR during SFY 2011. A target sample of 4,200 completed telephone interviews was set, representing 300 respondents per health plan. This sample size was selected to: (1) provide a reasonable confidence interval for the survey responses; and (2) ensure there was a sufficient sample size to allow for comparisons among health plans. Table A1 presents the stratification strategy by health plan, showing both the number of targeted interviews (N = 4,200) and the number of completed interviews (N = 4,208). Table A1. STAR Survey Sampling Strategy Health Plan Targeted Interviews (N = 4,200) Completed Interviews Aetna 300 301 AMERIGROUP 300 300 Community First 300 301 Community Health Choice (CHC) 300 300 Cook Children’s 300 300 Driscoll 300 300 El Paso First 300 302 FirstCare 300 301 Molina 300 301 Parkland Community 300 302 Superior 300 300 Texas Children’s 300 300 UniCare 300 300 UnitedHealthcare-Texas 300 300 Using a 95 percent confidence interval, the responses provided in the tables and figures are within ± 1.5 percentage points of the “true” responses in the STAR member population and ± 5.7 percentage points of “true” responses at the MCO level. Texas Contract Year 2011 STAR Child Survey Report Version: V2.0 HHSC Approval Date: January 23, 2012 Page 34 Enrollment data were used to identify the members who met the sample selection criteria and to obtain their contact information. Member names, mailing addresses, and telephone contact information for 9,890 eligible STAR members were collected and provided to interviewers. For households with multiple children enrolled in STAR, one child from the household was randomly chosen as the member for whom the caregiver would respond to the survey. Member age, sex, and race/ethnicity were also collected for the enrollment data to allow for comparisons between respondents and non-respondents and identify any participation biases in the final sample. Survey instruments The SFY 2011 STAR Child Survey is comprised of: The Consumer Assessment of Healthcare Providers and Systems (CAHPS®) Health Plan Survey 4.0 (Medicaid module). 24 Items from the CAHPS® Clinician and Group Surveys. 25 The Children With Special Health Care Needs (CSHCN) Screener®. 26 Items developed by ICHP pertaining to caregiver and member demographic and household characteristics. The CAHPS® Health Plan Survey is a widely used instrument for measuring and reporting consumer experiences with their or their child’s health plan and providers. The STAR Child Member Survey uses the Medicaid module of the CAHPS® survey and includes both the core questionnaire and supplemental items. The survey instrument is divided into sections that assess health care experiences within the past six months specific to a child’s personal doctor, well-child care, specialist care and specialized services, care coordination, dental care, and communication with the health plan. The CAHPS® Health Plan Survey allows for the calculation and reporting of health care composites, which are scores that combine results for closely related survey items. Composites provide a comprehensive yet concise summary of results for multiple survey questions. For the present survey, CAHPS® composite scores were calculated in the following ten domains: Getting Needed Care Getting Care Quickly How Well Doctors Communicate Health Plan Information and Customer Service Prescription Medicines Getting Specialized Services Personal Doctor Shared Decision-Making Getting Needed Information Care Coordination Texas Contract Year 2011 STAR Child Survey Report Version: V2.0 HHSC Approval Date: January 23, 2012 Page 35 Scores for the core composite measures were calculated using both AHRQ and NCQA specifications. Specifications by AHRQ produce scores that represent the percentage of caregivers who “usually” or “always” had positive experiences in the given domain. These percentage-based scores can be compared with Medicaid national data found in the CAHPS® Benchmarking Database. 27 Composite scores were calculated following AHRQ specifications for all domains except Shared Decision-Making. One item in the specifications for Shared Decision-Making, which assesses whether the child's doctor or provider told the caregiver there was more than one choice for their child's treatment, was dropped from composite calculations for this survey. In many health care decisions, there may only be one choice for treatment. In these situations, neglecting to tell caregivers of other choices does not reflect poor shared decision-making on the part of providers. Specifications by NCQA produce scaled scores, rather than percentage-based scores. These scores range from 0 to 3 for most composites. For the Personal Doctor and Care Coordination composites, scores range from 0 to 1. For scoring Shared Decision-Making, NCQA specifications use a different response set than that used in the CAHPS® Health Plan Survey 4.0 for Medicaid. The response set for individual items in the Medicaid version is yes/no. The scaled scores for Shared Decision-Making presented in this report follow NCQA specifications for Personal Doctor and Care Coordination (0 to 1), which also have yes/no response sets. It should be noted that analyses comparing CAHPS® composite scores across different demographic groups and MCOs used a modified version of NCQA specifications. In order to permit statistical comparisons, a separate score was calculated for each member, and then averaged. This differs from NCQA specifications, in which means are calculated by averaging the aggregate scores on a composite’s individual items. As a result, individual item responses in the means calculated for statistical comparison are weighted according to their frequency, and overall scores may vary slightly from those presented on Table B7 in Appendix B. The EQRO also calculated CAHPS® composites on the 100-point scale used in prior years’ survey reports. Results of CAHPS® composites on the 100-point scale are shown in Table B7 in Appendix B, for the purposes of comparison with the other two scoring methods. The 100-point scale was also used for the Personal Doctor and How Well Doctors Communicate composites in the multivariate analysis presented in this report. Scores range from 0 to 100, with higher scores indicating more positive health care experiences. A score of 75 or higher generally indicates that caregiver experiences in a composite domain were usually or always positive. In addition, items from the CAHPS® Clinician and Groups Surveys were included in the STAR Child Survey. The selected items assess the quality of pediatric care with regard to health literacy and physician-initiated discussions with caregivers about child development, safety, and prevention. It should be noted that these items were slightly modified to fit the format and sixmonth time frame of the CAHPS® Health Plan Survey 4.0. The CSHCN Screener® consists of five sequences of questions for identifying children with special health care needs based upon the Federal Maternal and Child Health Bureau definition Texas Contract Year 2011 STAR Child Survey Report Version: V2.0 HHSC Approval Date: January 23, 2012 Page 36 of CSHCN. The screener asks caregivers about five particular health consequences their child may experience: Needing or using medication prescribed by a doctor Having above-routine need for or use of medical, mental health, or educational services Having limitations that result in an inability to do things most children of the same age can do Needing or using specialized therapies such as physical, occupational, or speech therapy Needing or receiving treatment or counseling for emotional, behavioral, or developmental problems To qualify as CSHCN, the child must have at least one of the five screening criteria as a result of a medical, behavioral, or health condition that has lasted or is expected to last for at least 12 months. Six items from the National Survey of CSHCN (NS-CSHCN) are included in this survey to assess issues related to transition of care (e.g., finding a new doctor, insurance eligibility) that may arise when a child with special health care needs reaches adulthood. The NS-CSHCN is a national telephone survey of randomly selected households in the United States that examines children’s health status, particularly as it relates to health care coverage, access to care, and other quality of care indicators for both CSHCN and children with no special health care needs. 28 The six questions pertaining to transitional issues are only answered by a caregiver if their child is 11 years of age or older and has met one or more of the CSHCN Screener® criteria. The survey also includes questions regarding the demographic and household characteristics of caregivers and their children. These questions were developed by ICHP and have been used in surveys with more than 25,000 Medicaid and CHIP members in Texas and Florida. The items were adapted from questions used in the National Health Interview Survey, the Current Population Survey and the National Survey of America’s Families. 29,30,31 Respondents were also asked to report their child’s height and weight. These questions allow calculation of the child’s body mass index (BMI), a common population-level indicator of overweight and obesity. Survey data collection The EQRO sent letters written in English and Spanish to caregivers of 9,890 sampled STAR members requesting their participation in the survey. Of the advance letters sent, eight were returned undeliverable. The Survey Research Center (SRC) at the University of Florida conducted the survey using computer-assisted telephone interviewing (CATI) between May 2011 and November 2011. The SRC telephoned parents and caregivers of STAR members seven days a week between 10 Texas Contract Year 2011 STAR Child Survey Report Version: V2.0 HHSC Approval Date: January 23, 2012 Page 37 a.m. and 9 p.m. Central Time. The Sawtooth Software System was used to rotate calls in the morning, afternoon, and evening to maximize the likelihood of reaching potential survey respondents. If a respondent was unable to complete the interview in English, SRC rescheduled the interview at a later date and time with a Spanish-speaking interviewer. Of 4,208 completed interviews, 709 (17 percent) were conducted in Spanish. Up to 30 attempts were made to reach a family, and if the family was not reached after that time, the software selected the next individual on the list. No financial incentives were offered to participate in the surveys. Thirty-four percent of families could not be located. Among those located, seven percent indicated that their child was not enrolled in STAR and 14 percent refused to participate. The response rate was 55 percent and the cooperation rate was 75 percent. To test for participation bias, the distributions of child's age, sex, and race/ethnicity were collected from the enrollment data and compared between caregivers who responded to the survey and caregivers who did not participate. Compared with children of caregivers who responded to the survey, children of caregivers who did not participate were slightly younger (7.7 vs. 7.2 years). Fifty-two percent of caregivers who participated had male children, while 51 percent of caregivers who did not participate had male children. Children of caregivers who participated were significantly more likely than those who did not participate to be Hispanic (66 percent vs. 59 percent), and were significantly less likely than those who did not participate to be Black, non-Hispanic (14 percent vs. 18 percent). 32 While the differences in child’s age and sex between respondents and non-respondents were small, differences in the distribution of child’s race/ethnicity suggest that a participation bias may be present in the survey data. When interpreting results of this report, it should be taken into account that those who participated were more likely to have Hispanic children and less likely to have Black, non-Hispanic children. The respondent was selected by asking to speak to the person in the household who was most knowledgeable about the child’s health and health care. The respondent was also asked to confirm that the child was presently enrolled in STAR in Texas. For most survey items, caregivers had the option of stating they did not know the answer to a question. They also were given the choice to refuse to answer a particular question. If a respondent refused to answer an individual question or series of questions but completed the interview, their responses were used in the analyses. If the respondent ended the interview before all questions had been asked, her or his responses were not included in the analyses. Data analysis Descriptive statistics and statistical tests were performed using SPSS 17.0 (Chicago, IL: SPSS, Inc). Frequency tables showing descriptive results for each survey question are provided in a separate Technical Appendix. The statistics presented in this report exclude “do not know” and “refused” responses. Percentages shown in figures and tables are rounded to the nearest whole number; therefore, percentages may not add up to 100 percent. Texas Contract Year 2011 STAR Child Survey Report Version: V2.0 HHSC Approval Date: January 23, 2012 Page 38 To facilitate inferences from the survey results to the STAR member population, results were weighted to the full set of eligible beneficiaries in the enrollment dataset. Because sampling for STAR was stratified by MCO, a separate weight was calculated for each MCO, in which frequencies were multiplied by the inverse probability of inclusion in the sample (the total number of eligible MCO members in the dataset divided by the number of MCO members with completed surveys). Table A2 provides the weights for each of the 14 MCO groups. The frequencies and means presented in this report and the technical appendix that accompanies this report incorporate survey weights. Table A2. Health Plan Weighting Strategy Population of eligible members (N) Number of completed surveys (n) 16,629 301 55.25 AMERIGROUP 147,341 300 491.14 Community First 30,996 301 102.98 Community Health Choice 47,077 300 156.92 Cook Children's 21,168 300 70.56 Driscoll 15,899 300 53.00 El Paso First 17,536 302 58.07 FirstCare 10,078 301 33.48 3,687 301 12.25 Parkland Community 54,932 302 181.89 Superior 86,692 300 288.97 Texas Children's 77,222 300 257.41 UniCare 5,908 300 19.69 UnitedHealthcare-Texas 4,384 300 14.61 Health plan Aetna Molina Weight Analysis of differences in frequencies used the Pearson Chi-square test of independence, and analysis of differences in means used t-tests and analysis of variance (ANOVA). To prevent overestimation of statistical significance resulting from sample size inflation, all tests were performed without weighting. These tests allowed comparison of frequencies and means between 2009 and 2011 results, among the 14 MCO groups, and among different demographic sub-groups within the sample Body mass index (BMI) was calculated by dividing the child’s weight in kilograms by their height in meters squared. BMI could be calculated for 2,404 children in the sample (57 percent) for whom height and weight data were complete. Height data were missing for 1,682 children (40 percent), and weight data were missing for 473 children (11 percent). Texas Contract Year 2011 STAR Child Survey Report Version: V2.0 HHSC Approval Date: January 23, 2012 Page 39 For children, the clinical relevance of BMI values varies by sex and age. Using sex-specific BMIfor-age growth charts from the National Center for Health Statistics (NCHS), children with valid BMI data were classified into one of four categories: 33 1) Underweight (less than 5th percentile) 2) Healthy (5th percentile to less than 85th percentile) 3) Overweight (85th to less than 95th percentile) 4) Obese (> 95th percentile) These standardized BMI categories for children may be used for comparison with national and state averages. Analyses of child BMI excluded children younger than two years old, for whom data are not provided on NCHS BMI-for-age growth charts. Also excluded were 423 children whose BMI deviated considerably from age- and sex-specific child growth standards provided by the World Health Organization. 34,35 By these standards, any BMI value that exceeded five standard deviations below or above the age- and sex-specific median BMI was considered biologically implausible and likely the result of errors in data collection. Lastly, the EQRO conducted a multivariate analysis to examine the effects of demographic, health status, and health delivery factors on parent-reported potentially preventable ED visits (PPVs). Four models were tested – each testing a different element of the patient-centered medical home model. Controlling for child’s race/ethnicity, sex, age, health status, and MCO membership, these models assessed whether PPVs were associated with: (1) The presence of a usual source of care; (2) CAHPS® Personal Doctor; (3) CAHPS® How Well Doctors Communicate; and (4) Caregivers’ ratings of their child’s personal doctor. The detailed methodology and results for these analyses can be found in Appendix C of this report. Texas Contract Year 2011 STAR Child Survey Report Version: V2.0 HHSC Approval Date: January 23, 2012 Page 40 Appendix B. Supplementary Tables and Figures Table B1. STAR Member Obesity Rates by MCO Health Plan Obesity rate (% of members in survey sample) a Aetna 26.7% AMERIGROUP 22.2% Community First 28.9% Community Health Choice 40.2% Cook Children's 26.3% Driscoll 29.7% El Paso First 26.1% FirstCare 32.8% Molina 35.9% Parkland Community 28.7% Superior 27.4% Texas Children's 31.1% UniCare 24.6% UnitedHealthcare-Texas 29.6% Χ2 test for significant differences a 55.939 (p = 0.039) Obesity defined as BMI-for-age > the 95th percentile on WHO growth charts Texas Contract Year 2011 STAR Child Survey Report Version: V2.0 HHSC Approval Date: January 23, 2012 Page 41 Table B2. CAHPS® Health Plan Survey Core Composite Scores by STAR MCO Health Plan Getting Needed Care Getting Care Quickly How Well Doctors Communicate Customer Service STAR overall a 2.30 2.47 2.69 2.54 Aetna 2.12 2.46 2.69 2.30 AMERIGROUP 2.39 2.49 2.66 2.66 Community First 2.31 2.48 2.68 2.45 CHC 2.22 2.48 2.72 2.69 Cook Children’s 2.20 2.43 2.65 2.45 Driscoll 2.46 2.58 2.78 2.58 El Paso First 2.43 2.37 2.69 2.55 FirstCare 2.57 2.54 2.76 2.31 Molina 2.20 2.50 2.74 2.56 Parkland Community 2.22 2.34 2.62 2.46 Superior 2.23 2.50 2.73 2.49 Texas Children’s 2.33 2.43 2.70 2.53 UniCare 2.44 2.54 2.61 2.53 UHC-Texas 2.16 2.41 2.68 2.51 = 0.006 N.S. = 0.001 N.S. F significance b a The method of calculation follows NCQA specifications, with the exception that a separate score is calculated for each member and then averaged. As a result, individual item responses are weighted according to their frequency and overall scores may vary slightly from those presented on Table B7. This method of scoring permits statistical comparisons. b Analyses performed on unweighted data. Texas Contract Year 2011 STAR Child Survey Report Version: V2.0 HHSC Approval Date: January 23, 2012 Page 42 Table B3. HHSC Performance Indicator Results by STAR MCO HHSC Performance Dashboard Indicator a #> Std. 1 2 3 4 5 6 STAR overall 79% 86% 69% 63% 24% 61% 2 Aetna 77% 92% 64% 62% 20% 50% 2 AMERIGROUP 81% 83% 58% 63% 22% 62% 0 Community First 82% 85% 72% 63% 29% 65% 0 Community Health Choice 78% 93% 60% 67% 28% 68% 3 Cook Children's 78% 83% 72% 63% 25% 61% 1 Driscoll 82% 94% 69% 62% 25% 64% 2 El Paso First 76% 83% 79% 73% 20% 68% 2 FirstCare 82% 92% 85% 65% 28% 80% 3 Molina 81% 89% 71% 54% 25% 47% 2 Parkland Community 71% 83% 64% 66% 26% 56% 2 Superior 82% 89% 75% 55% 22% 55% 2 Texas Children's 77% 87% 84% 62% 23% 71% 2 UniCare 81% 88% 69% 68% 24% 44% 3 UnitedHealthcare - Texas 76% 85% 71% 62% 29% 48% 1 HHSC Standard 84% 86% 59% 65% 35% - - 0 8 13 5 0 - - N.S. N.S. N.S. N.S. N.S. N.S. - Health Plan # MCOs > Standard Χ2 significance b a Percentage of members who… 1. Had good access to routine care 2. Had good access to urgent care 3. Had good access to specialist referral 4. Had no delays for an approval 5. Had no exam room wait greater than 15 minutes 6. Had good access to behavioral health treatment or counseling b Analyses performed on unweighted data. Texas Contract Year 2011 STAR Child Survey Report Version: V2.0 HHSC Approval Date: January 23, 2012 Page 43 Table B4. CAHPS® Health Plan Core Composite Scores by Gender, Race/Ethnicity and Health Status Getting Needed Care Getting Care Quickly How Well Doctors Communicate Customer Service Female 2.28 2.47 2.70 2.52 Male 2.32 2.47 2.69 2.49 T-test significance a N.S. N.S. N.S. N.S. Hispanic 2.33 2.43 2.69 2.58 White, NH 2.21 2.59 2.74 2.23 Black, NH 2.24 2.56 2.68 2.45 2.43 2.44 2.76 2.37 = 0.118 < 0.001 = 0.057 < 0.001 2.25 2.52 2.70 2.39 2.35 2.45 2.70 2.56 = 0.040 = 0.059 N.S. = 0.001 Child gender Child race/ ethnicity Other, NH F significance a Health status CSHCN No special need T-test significance a a Analyses performed on unweighted data. Texas Contract Year 2011 STAR Child Survey Report Version: V2.0 HHSC Approval Date: January 23, 2012 Page 44 Table B5. CAHPS® Health Plan Survey Composite Scores by STAR MCO – Chronic Conditions Set Health Plan Prescription Medicines Getting Specialized Services Personal Doctor Shared Decisionmaking a Getting needed information Care coordination STAR overall 2.68 2.22 0.87 0.89 2.76 0.67 Aetna 2.62 2.13 0.87 0.93 2.66 0.55 AMERIGROUP 2.64 2.19 0.80 0.84 2.77 0.63 Community First 2.70 2.45 0.88 0.94 2.74 0.56 CHC 2.65 2.15 0.88 0.88 2.77 0.73 Cook Children’s 2.66 2.11 0.86 0.89 2.70 0.60 Driscoll 2.78 2.23 0.91 0.92 2.83 0.71 El Paso First 2.66 2.47 0.85 0.93 2.77 0.76 FirstCare 2.77 2.72 0.93 0.94 2.84 0.70 Molina 2.67 1.86 0.86 0.90 2.83 0.71 Parkland Community 2.79 2.07 0.85 0.82 2.80 0.69 Superior 2.62 2.06 0.90 0.90 2.82 0.67 Texas Children’s 2.65 2.20 0.86 0.87 2.73 0.65 UniCare 2.70 2.25 0.86 0.88 2.68 0.67 UHC-Texas 2.53 1.92 0.85 0.89 2.74 0.61 F significance b N.S. < 0.001 = 0.015 = 0.004 = 0.005 N.S. a For scoring Shared Decision-Making, NCQA specifications use a different response set than that used in the CAHPS® Health Plan Survey 4.0 for Medicaid. The response set for individual items in the Medicaid version is yes/no. The scores for Shared Decision-Making shown here follow NCQA specifications for Personal Doctor and Care Coordination, which also have yes/no response sets. b Analyses performed on unweighted data. Texas Contract Year 2011 STAR Child Survey Report Version: V2.0 HHSC Approval Date: January 23, 2012 Page 45 Table B6. CAHPS® Health Plan Composite Scores by Gender, Race/Ethnicity, and Health Status – Chronic Conditions Set Prescription Medicines Getting Specialized Services Personal Doctor Shared Decisionmaking a Getting needed information Care coordination Female 2.68 2.23 0.87 0.90 2.79 0.66 Male 2.68 2.21 0.87 0.90 2.75 0.67 T-test significance b N.S. N.S. N.S. N.S. = 0.073 N.S. Hispanic 2.70 2.26 0.87 0.91 2.79 0.70 White, NH 2.69 2.26 0.89 0.89 2.76 0.50 Black, NH 2.62 2.00 0.86 0.86 2.72 0.72 2.57 2.23 0.87 0.87 2.65 0.60 N.S. = 0.111 N.S. = 0.068 = 0.013 < 0.001 2.69 2.17 0.90 0.93 2.75 0.70 2.67 2.28 0.86 0.89 2.77 0.66 N.S. = 0.109 = 0.017 = 0.010 N.S. N.S. Child gender Child race/ethnicity Other, NH F significance b Health status CSHCN No special need T-test significance b a For scoring Shared Decision-Making, NCQA specifications use a different response set than that used in the CAHPS® Health Plan Survey 4.0 for Medicaid. The response set for individual items in the Medicaid version is yes/no. The scores for Shared Decision-Making shown here follow NCQA specifications for Personal Doctor and Care Coordination, which also have yes/no response sets. b Analyses performed on unweighted data. Texas Contract Year 2011 STAR Child Survey Report Version: V2.0 HHSC Approval Date: January 23, 2012 Page 46 Table B7. Comparison of CAHPS® Composite Scoring Methods CAHPS® Composite Global proportion a 3-point mean b 100-point mean c Getting Needed Care 72% 2.28 73.4 Getting Care Quickly 83% 2.54 80.7 How Well Doctors Communicate 88% 2.69 88.8 Health Plan Information and Customer Service 84% 2.55 81.9 Personal Doctor 86% N/A d 87.1 Prescription Medicines 88% 2.66 88.6 Getting Specialized Services 66% 2.19 68.5 Shared Decision-Making 88% N/A e 89.7 Getting Needed Information 92% 2.77 91.8 Care Coordination 71% N/A d 66.7 a The percentage of respondents who “usually” or “always” had positive health care experiences, following AHRQ specifications. b Mean ranging from 0 to 3, following NCQA specifications. Means differ slightly from those on Table B2 because they follow strict NCQA specifications, calculated by averaging the aggregate scores on a composite’s individual items. c Mean ranging from 0 to 100, developed and used by the EQRO in prior year survey reports. d NCQA specifications use a 0 to 1 scale for scoring Personal Doctor (STAR mean = 0.86) and Care Coordination (STAR mean = 0.71). e For scoring Shared Decision-Making, NCQA specifications use a different response set than that used in the CAHPS® Health Plan Survey 4.0 for Medicaid. Therefore, an NCQA mean could not be calculated for this composite. Texas Contract Year 2011 STAR Child Survey Report Version: V2.0 HHSC Approval Date: January 23, 2012 Page 47 Table B8. Survey Items Comprising the CAHPS® Composites Core CAHPS® Composites Getting Needed Care CAHPS 20. How often was it easy to get appointments for your child with specialists? CAHPS 24. How often was it easy to get the care, tests, or treatment you thought your child needed through his or her health plan? Getting Care Quickly CAHPS 4. When your child needed care right away for an illness, injury or condition, how often did you get care as soon as you needed? CAHPS 6. Not counting the times your child needed care right away, how often did you get an appointment for health care as soon as you thought your child needed? How Well Doctors Communicate CAHPS 11. How often did your child’s personal doctor explain things in a way that was easy to understand? CAHPS 12. How often did your child’s personal doctor listen carefully to you? CAHPS 13. How often did your child’s personal doctor show respect for you? CAHPS 15. How often did your child’s personal doctor explain things in a way that was easy for your child to understand? CAHPS 16. How often did your child’s personal doctor spend enough time with you? Health Plan Information and Customer Service CAHPS 26. How often did customer service at your child’s health plan give you the information or help you needed? CAHPS 27. How often did customer service staff at your child’s health plan treatment you with courtesy and respect? CAHPS® Composites – Chronic Conditions Set Parents’ Experience with Child’s Personal Doctor Q17. Did your child’s personal doctor talk to you about how your child is feeling, growing, or behaving? CC20. Does your child’s personal doctor understand how these medical, behavioral, or other health conditions affect your day-to-day life? CC21. Does your child’s personal doctor understand how your child’s medical, behavioral, or other health conditions affect your family’s day-to-day life? Texas Contract Year 2011 STAR Child Survey Report Version: V2.0 HHSC Approval Date: January 23, 2012 Page 48 Parents’ Experience with Shared Decision Making CC2. Did you child’s doctor or other health provider tell you there was more than one choice for your child’s treatment or health care? CC3. Did your child’s doctor or other health provider talk with you about the pros and cons of each choice for your child’s treatment or health care? CC4. When there was more than one choice for your child’s treatment or health care, did your child’s doctor or other health provider ask you which choice was best for your child? Parents’ Experience with Getting Needed Information about Their Child’s Care CC1. How often did you have your questions answered by your child’s doctors or other health care providers? Parents’ Experience with Coordination of Their Child’s Care CC7. Did anyone from your child’s health plan, doctor's office, or clinic help coordinate your child’s care among these different providers or services? CC18. Did you get the help you needed from your child’s doctors or other health providers in contacting your child’s school or daycare? Parents’ Experience Getting Specialized Services for Their Child CC9. How often was it easy to get special medical equipment or devices for your child? CC12. How often was it easy to get special therapy for your child? CC15. How often was it easy to get behavioral health treatment or counseling for your child? Parents’ Experience with Prescription Medicine CC23. How often was it easy to get prescription medicines for your child through his or her health plan? Texas Contract Year 2011 STAR Child Survey Report Version: V2.0 HHSC Approval Date: January 23, 2012 Page 49 Appendix C. Multivariate Analysis – Potentially Preventable ED Visits Twenty-four percent of caregivers responding to the SFY 2011 STAR Child Survey (approximately 1,000 respondents) reported they had taken their child to the emergency department (ED) at least once in the past six months. Among these caregivers, 52 percent said they took their child to the ED at least once because they could not get an appointment at a doctor’s office or clinic as soon as they thought it was needed. This follow-up question addresses the concept of potentially preventable ED visits, defined as emergency department visits that may result from lack of adequate access to primary care or ambulatory care coordination. 36 The EQRO used this question as an outcome in multivariate analyses, assessing the relative influence of various elements of the patient-centered medical home on reducing the likelihood of potentially preventable ED use among children in STAR. Methodology The multivariate analysis was conducted using unconditional logistic regression, with the outcome dichotomized – coded as 1 for caregivers who took their child to the ED at least once because they could not get an ambulatory health care appointment, and 0 for caregivers who took their child to the ED, but not because of poor access to ambulatory care. The EQRO tested four models predicting the odds of a child having a potentially preventable ED visit, controlling for sociodemographic factors, health status, and MCO membership. The four models each tested the influence of a different element of the patient-centered medical home, grouped roughly into presence of a usual source of care and parental satisfaction with their child’s usual source of care: 1) Presence of a usual source of care. The model testing the influence of having a usual source of care – the most basic element of the patient-centered medical home – compared caregivers whose children had a personal doctor whom they had been seeing for at least six months with caregivers whose children did not have a personal doctor whom they had been seeing for at least six months. Children in the latter category included both those who had a personal doctor they had been seeing for less than six months, and those who did not have a personal doctor at all. 2) CAHPS® Personal Doctor. This composite score combines responses to three questions about caregivers’ experiences with their child’s personal doctor in the clinical setting. Specifically, caregivers were asked whether their child’s personal doctor talked with them about how their child is feeling, growing, or behaving; and whether their child’s personal doctor understood how their child’s medical, behavioral, and other health conditions affect the child’s and the family’s day-to-day life. When calculated on a 100point scale, this composite can be dichotomized with a score of 75 as the threshold – with children having a Personal Doctor score of 75 or greater coded as 1 (indicating positive caregiver experiences), and children having a score less than 75 coded as 0. Texas Contract Year 2011 STAR Child Survey Report Version: V2.0 HHSC Approval Date: January 23, 2012 Page 50 3) CAHPS® How Well Doctors Communicate. This composite score combines responses to five questions about caregivers’ experiences communicating with their child’s personal doctor. Specifically, caregivers were asked how often their child’s personal doctor listened carefully to them, showed respect for what they had to say, explained things in a way that was easy for them to understand, explained things in a way that was easy for their child to understand, and spent enough time with their child. When calculated on a 100-point scale, this composite can be dichotomized with a score of 75 as the threshold – with children having a How Well Doctors Communicate score of 75 or greater coded as 1 (indicating positive caregiver experiences), and children having a score less than 75 coded as 0. 4) Caregiver rating of their child’s personal doctor. Overall satisfaction was assessed by asking caregivers to rate their child’s personal doctor on a scale of 0 to 10. Following specifications for CAHPS® reporting by the Agency for Healthcare Research and Quality (AHRQ), children with personal doctor ratings of 9 or 10 were coded as 1 (indicating high satisfaction), and children with personal doctor ratings of 8 or less were coded as 0. The EQRO used the following covariates in all four logistic regression models: Child’s race/ethnicity – categorized as White, non-Hispanic; Hispanic; Black, nonHispanic; or Other, non-Hispanic. The reference group was White, non-Hispanic children. Child's sex. The reference group was male. Child’s age – categorized into three age cohorts: Birth to 5 years old, 6 to 11 years old, and 12 to 18 years old. The reference group was adolescents 12 to 18 years old. The presence of a special health care need, as determined by the CSHCN screener®. Children without special health care needs (Non-CSHCN) were the reference group. Child’s MCO. For each of the multivariate models, the top-performing MCO was used as the reference group. Among the 14 STAR MCOs, the reference group was Molina for three of the four models – chosen because it had the lowest rate of parent-reported potentially preventable ED visits, and was therefore the best-performing MCO on the outcome measure. Results Results of the multivariate analysis are presented in Table C1 through Table C5 as odds ratios. The odds ratios represent the likelihood of a caregiver reporting at least one potentially preventable ED visit for their child in the past six months, compared to caregivers who took their child to the ED, but not because of poor access. For any particular test variable or covariate, an odds ratio above 1.0 suggests that children in the specified category were more likely to have had a potentially preventable ED visit than children in the reference group. Conversely, an odds Texas Contract Year 2011 STAR Child Survey Report Version: V2.0 HHSC Approval Date: January 23, 2012 Page 51 ratio below 1.0 suggests that children in the specified category were less likely to have had a potentially preventable ED visit than children in the reference group. The tables also provide 95 percent confidence intervals for the odds ratios, which function as an indicator of statistical significance. An odds ratio with a confidence interval that includes 1.00 in its range is not considered statistically significant at p < 0.05. Table C1 presents the simple model, which includes only the child's race, sex, age, health status, and MCO. The only demographic or health status covariate that was significantly associated with the likelihood of potentially preventable ED visits was gender. Fifty-six percent of caregivers of female members reported taking their child at least once to the ED because they could not get an appointment for ambulatory care, compared to 46 percent of caregivers of male members. Controlling for race/ethnicity, age, health status, and MCO membership, female members were approximately 1.5 times more likely than male members to have had a potentially preventable ED visit. Children in a number of MCOs had significantly increased odds of having a potentially preventable ED visit, compared to the Molina reference group: Community First. In the simple model, 63 percent of caregivers of children in Community First reported taking their child at least once to the ED because they could not get an appointment for ambulatory care. Controlling for demographic and health status covariates, children in Community First were 2.4 times more likely than children in Molina to have had a potentially preventable ED visit. The increase in odds was statistically significant in all five models. Community Health Choice. In the simple model, 57 percent of caregivers of children in Community Health Choice reported taking their child at least once to the ED because they could not get an appointment for ambulatory care. Controlling for demographic and health status covariates, children in Community Health Choice were 2.1 times more likely than children in Molina to have had a potentially preventable ED visit. The increase in odds was statistically significant not only in the simple model but also in Model 1, which considered the influence of having a usual source of care on the likelihood of PPVs. UniCare. In the simple model, 58 percent of caregivers of children in UniCare reported taking their child at least once to the ED because they could not get an appointment for ambulatory care. Controlling for demographic and health status covariates, children in UniCare were 2.2 times more likely than children in Molina to have had a potentially preventable ED visit. The increase in odds was statistically significant not only in the simple model but also in Model 1, which considered the influence of having a usual source of care on the likelihood of PPVs. Texas Contract Year 2011 STAR Child Survey Report Version: V2.0 HHSC Approval Date: January 23, 2012 Page 52 Among the four test factors, neither having a usual source of care nor having a high Personal Doctor score were significantly associated with the likelihood of having a potentially preventable ED visit. Caregivers who reported positive experiences communicating with their child’s personal doctor (How Well Doctors Communicate) and those who rated their child’s personal doctor highly were significantly less likely to have taken their child to the ED because they could not get an appointment for ambulatory care. How Well Doctors Communicate. In the Model 3 subsample, 49 percent of caregivers with a score of 75 or greater on the CAHPS® composite How Well Doctors Communicate (indicating positive experiences) reported taking their child at least once to the ED because they could not get an appointment for ambulatory care, compared to 64 percent of caregivers with a score of less than 75. Controlling for demographic factors, health status, and MCO membership, children with high scores on this composite were nearly 50 percent less likely than those with lower scores to have had a potentially preventable ED visit. Personal doctor rating. In the Model 4 subsample, 49 percent of caregivers who rated their child’s personal doctor a 9 or 10 reported taking their child at least once to the ED because they could not get an appointment for ambulatory care, compared to 59 percent of caregivers who rated their child’s personal doctor at 8 or below. Controlling for demographic factors, health status, and MCO membership, children with high personal doctor ratings were 37 percent less likely than those with lower personal doctor ratings to have had a potentially preventable ED visit. The EQRO used the likelihood-ratio test to determine the relative fit of each of the four models, and identify which model had the greatest predictive value with regard to the outcome of potentially preventable ED visits. For each of the four models, model fit statistics were compared to model fit statistics of a simpler model, which contained only demographic factors, health status, and MCO membership. This test permits an assessment of the increase in predictive value due to the addition of a test factor. Results of the likelihood-ratio tests are shown in the table below. Model Type Test factor Having a usual source of care CAHPS® Personal Doctor CAHPS® How Well Doctors Communicate Personal doctor rating Full (χ2, df) Simple (χ2, df) Difference (χ2, df) p-value 33.1755, df = 21 32.3095, df = 20 0.8660, df = 1 0.352 22.9093, df = 21 21.9889, df = 20 0.9204, df = 1 0.337 32.8070, df = 21 23.2328, df = 20 9.5742, df = 1 0.002 34.1580, df = 21 27.0000, df = 20 7.1580, df = 1 0.007 Texas Contract Year 2011 STAR Child Survey Report Version: V2.0 HHSC Approval Date: January 23, 2012 Page 53 Among the four models, only Models 3 and 4 predicted the likelihood of potentially preventable ED visits significantly better than their respective simple models. Overall, the findings of this multivariate analysis suggest that parental satisfaction with their child’s usual source of care has a greater influence than the simple presence of a usual source of care on reducing the likelihood of potentially preventable ED visits in the STAR program. These findings are particularly useful for STAR MCOs working to reduce rates of potentially preventable ED visits, which is one of the over-arching goals for STAR MCOs in SFY 2012. All MCOs – and in particular, Community First, Community Health Choice, and UniCare – should work toward improving the quality of communication between members and personal doctors in their networks. At the program- and MCO-levels, scores for CAHPS® How Well Doctors Communicate are generally high. Therefore, efforts toward improving communication should focus on members at high risk of ED use and those with a history of frequent ED use. Until more studies are conducted to explore these associations in more detail, the EQRO recommends a comprehensive approach to improvement, covering aspects of communication such as listening, respect, and attention to health literacy and culturally competent care. Furthermore, efforts toward improving communication should focus not only on personal doctors, but also on other clinical and support staff in the offices of personal doctors. Texas Contract Year 2011 STAR Child Survey Report Version: V2.0 HHSC Approval Date: January 23, 2012 Page 54 Table C1. Simple Model – Influence of Demographic Factors, Health Status, and MCO on Likelihood of Potentially Preventable ED Visits (PPV) Factor Percent with > 1 PPV Odds Ratio 95% CI White, non-Hispanic 51% REF - Black, non-Hispanic 42% 0.75 (0.46 - 1.21) Hispanic 53% 1.07 (0.73 - 1.56) Other, non-Hispanic 55% 1.15 (0.56 - 2.37) Male 46% REF - Female 56% 1.45 (1.12 - 1.88) Child's Race/Ethnicity Child's Sex Child's Age 0 to 5 years old 53% 1.14 (0.83 - 1.57) 6 to 11 years old 52% 1.12 (0.78 - 1.62) 12 to 18 years old 47% REF - Non-CSHCN 52% REF - CSHCN 48% 0.94 (0.69 - 1.28) Health Status MCO 56% 1.89 (0.97 - 3.69) AMERIGROUP 43% 1.12 (0.53 - 2.36) Community First 63% 2.38 (1.20 - 4.74) Community Health Choice 57% 2.06 (1.01 - 4.24) Cook Children's 45% 1.29 (0.66 - 2.52) Driscoll 48% 1.31 (0.68 - 2.51) El Paso First 57% 1.84 (0.92 - 3.68) FirstCare 44% 1.20 (0.61 - 2.38) Molina 39% REF - Parkland Community 56% 2.01 (0.95 - 4.25) Superior 54% 1.70 (0.87 - 3.31) Texas Children's 52% 1.62 (0.79 - 3.32) UniCare 58% 2.22 (1.10 - 4.48) UnitedHealthCare-Texas 44% 1.31 (0.64 - 2.65) Aetna Texas Contract Year 2011 STAR Child Survey Report Version: V2.0 HHSC Approval Date: January 23, 2012 Page 55 Table C2. Multivariate Analysis Model 1 – Influence of Having a Usual Source of Care on the Likelihood of Potentially Preventable ED Visits (PPV) Factor Percent with > 1 PPV Odds Ratio 95% CI White, non-Hispanic 51% REF - Black, non-Hispanic 42% 0.78 (0.48 - 1.26) Hispanic 53% 1.08 (0.74 - 1.59) Other, non-Hispanic 56% 1.25 (0.60 - 2.60) Male 46% REF - Female 56% 1.48 (1.14 - 1.93) 0 to 5 years old 53% 1.19 (0.86 - 1.65) 6 to 11 years old 52% 1.16 (0.80 - 1.68) 12 to 18 years old 47% REF - Non-CSHCN 52% REF - CSHCN 49% 0.99 (0.72 - 1.36) Child's Race/Ethnicity Child's Sex Child's Age Health Status MCO Aetna 56% 2.04 (1.03 - 4.06) AMERIGROUP 43% 1.18 (0.55 - 2.52) Community First 63% 2.50 (1.24 - 5.04) Community Health Choice 56% 2.09 (1.00 - 4.36) Cook Children's 46% 1.38 (0.69 - 2.74) Driscoll 48% 1.36 (0.69 - 2.67) El Paso First 57% 2.03 (1.00 - 4.14) FirstCare 44% 1.26 (0.63 - 2.52) Molina 38% REF - Parkland Community 55% 2.03 (0.95 - 4.38) Superior 54% 1.79 (0.90 - 3.56) Texas Children's 52% 1.71 (0.83 - 3.54) UniCare 59% 2.40 (1.17 - 4.92) UnitedHealthCare-Texas 43% 1.30 (0.63 - 2.70) No 54% REF - Yes 50% 0.86 (0.62 - 1.19) Child has personal doctor Texas Contract Year 2011 STAR Child Survey Report Version: V2.0 HHSC Approval Date: January 23, 2012 Page 56 Table C3. Multivariate Analysis Model 2 – Influence of CAHPS® Personal Doctor on Likelihood of Potentially Preventable ED Visits (PPV) Factor Percent with > 1 PPV Odds Ratio 95% CI White, non-Hispanic 53% REF - Black, non-Hispanic 45% 0.81 (0.47 - 1.41) Hispanic 52% 0.95 (0.63 - 1.46) Other, non-Hispanic 52% 0.88 (0.39 - 1.98) Male 48% REF - Female 55% 1.33 (0.99 - 1.79) 53% 1.30 (0.90 - 1.89) 6 to 11 years old 54% 1.34 (0.88 - 2.05) 12 to 18 years old 45% REF - Non-CSHCN 52% REF - CSHCN 49% 0.93 (0.66 - 1.31) Aetna 55% 1.84 (0.86 - 3.92) AMERIGROUP 41% 1.02 (0.44 - 2.39) Community First 61% 2.34 (1.07 - 5.13) Community Health Choice 57% 1.98 (0.87 - 4.48) Cook Children's 50% 1.56 (0.72 - 3.36) Driscoll 49% 1.43 (0.68 - 2.99) El Paso First 57% 2.04 (0.92 - 4.50) FirstCare 45% 1.29 (0.60 - 2.79) Molina 38% REF - Parkland Community 54% 1.73 (0.73 - 4.05) Superior 53% 1.76 (0.82 - 3.78) Texas Children's 53% 1.68 (0.75 - 3.79) UniCare 62% 2.43 (1.10 - 5.36) UnitedHealthCare-Texas 42% 1.19 (0.52 - 2.71) Score < 75 56% REF - Score > 75 51% 0.82 (0.54 - 1.24) Child's Race/Ethnicity Child's Sex Child's Age 0 to 5 years old Health Status MCO CAHPS® Personal Doctor Texas Contract Year 2011 STAR Child Survey Report Version: V2.0 HHSC Approval Date: January 23, 2012 Page 57 Table C4. Multivariate Analysis Model 3 – Influence of CAHPS® How Well Doctors Communicate on Likelihood of Potentially Preventable ED Visits (PPV) Percent with > 1 PPV Odds Ratio 95% CI White, non-Hispanic 54% REF - Black, non-Hispanic 44% 0.70 (0.40 - 1.22) Hispanic 52% 0.88 (0.57 - 1.35) Other, non-Hispanic 52% 0.85 (0.38 - 1.92) Male 48% REF - Female 55% 1.38 (1.02 - 1.86) 53% 1.23 (0.84 - 1.79) 6 to 11 years old 55% 1.40 (0.91 - 2.15) 12 to 18 years old 45% REF - Non-CSHCN 53% REF - CSHCN 49% 0.94 (0.66 - 1.33) Aetna 54% 1.77 (0.82 - 3.81) AMERIGROUP 41% 0.91 (0.39 - 2.16) Community First 61% 2.26 (1.02 - 4.99) Community Health Choice 58% 2.12 (0.92 - 4.87) Cook Children's 51% 1.58 (0.72 - 3.44) Driscoll 49% 1.42 (0.68 - 3.00) El Paso First 57% 2.00 (0.90 - 4.44) FirstCare 45% 1.25 (0.58 - 2.73) Molina 39% REF - Parkland Community 54% 1.53 (0.64 - 3.63) Superior 52% 1.56 (0.72 - 3.39) Texas Children's 54% 1.69 (0.74 - 3.86) UniCare 62% 2.21 (0.99 - 4.90) UnitedHealthCare-Texas 42% 1.14 (0.49 - 2.64) Score < 75 64% REF - Score > 75 49% 0.52 (0.34 - 0.79) Factor Child's Race/Ethnicity Child's Sex Child's Age 0 to 5 years old Health Status MCO CAHPS® Doctors’ Communication Texas Contract Year 2011 STAR Child Survey Report Version: V2.0 HHSC Approval Date: January 23, 2012 Page 58 Table C5. Multivariate Analysis Model 4 – Influence of Caregivers’ Personal Doctor Rating on Likelihood of Potentially Preventable ED Visits (PPV) Factor Percent with > 1 PPV Odds Ratio 95% CI White, non-Hispanic 51% REF - Black, non-Hispanic 43% 0.77 (0.45 - 1.32) Hispanic 53% 1.12 (0.74 - 1.69) Other, non-Hispanic 52% 1.00 (0.46 - 2.19) Male 47% REF - Female 56% 1.47 (1.11 - 1.96) 53% 1.16 (0.81 - 1.66) 6 to 11 years old 54% 1.26 (0.84 - 1.88) 12 to 18 years old 46% REF - Non-CSHCN 52% REF - CSHCN 48% 0.93 (0.66 - 1.30) Child's Race/Ethnicity Child's Sex Child's Age 0 to 5 years old Health Status MCO Aetna 54% 1.81 (0.85 - 3.86) AMERIGROUP 43% 1.13 (0.49 - 2.59) Community First 62% 2.33 (1.05 - 5.15) Community Health Choice 56% 2.15 (0.95 - 4.84) Cook Children's 48% 1.48 (0.69 - 3.17) Driscoll 47% 1.35 (0.64 - 2.87) El Paso First 56% 1.80 (0.82 - 3.95) FirstCare 44% 1.35 (0.62 - 2.94) Molina 42% 1.16 (0.52 - 2.56) Parkland Community 56% 1.95 (0.84 - 4.53) Superior 56% 1.89 (0.87 - 4.08) Texas Children's 54% 1.83 (0.82 - 4.08) UniCare 61% 2.37 (1.07 - 5.22) UnitedHealthCare-Texas 39% REF - 0 to 8 59% REF - 9 or 10 49% 0.63 (0.45 - 0.89) Personal Doctor Rating Texas Contract Year 2011 STAR Child Survey Report Version: V2.0 HHSC Approval Date: January 23, 2012 Page 59 Endnotes 1 HHSC (Texas Health and Human Services Commission). 2011. Texas Medicaid and CHIP in Perspective, 8th Edition (The “Pink Book”). 2 Travaline, J.M., R. Ruchinskas, G.E. D’Alonzo, Jr. 2005. “Patient-Physician Communication: Why and How.” Clinical Practice 105(1): 13-18. 3 AHRQ (Agency for Healthcare Research and Quality). 2011a. “Tools to Help Patients Communicate Their Needs.” Available at: https://www.cahps.ahrq.gov/Quality-Improvement/ImprovementGuide/Browse-Interventions/Communication/Patient-Comm-Tools.aspx 4 Mangione-Smith, R., DeCristofaro, A.H., Setodji, C.M., Keesey, J., Klein, D.J., Adams, J.L., Schuster, M.A., & McGlynn, E.A. 2007. “The Quality of Ambulatory Care Delivered to Children in the United States.” The New England Journal of Medicine 357(15): 1515-1523. 5 Homer, C.J., Kleinman, L.C., Goldmann, D.A. 1998. “Improving the Quality of Care for Children in Health Systems.” Health Services Research 33(4), 1091-1109. 6 Darby, C. 2002. “Patient/Parent Assessment of the Quality of Care.” Ambulatory Pediatrics 2(suppl.): 345-348. 7 Seid, M., Varni, J.W., Bermudez, L.O., Zivkovic, M., Far, M.D., Nelson, M., & Kurtin, P.S. 2001. “Parents’ Perceptions of Primary Care: Measuring Parents’ Experiences of Pediatric Primary Care Quality.” Pediatrics 108(2): 264-270. 8 Lochman, J.E. 1983. “Factors Related to Patients’ Satisfaction with their Medical Care.” Journal of Community Health 9: 91-109. 9 Stewart, M., Brown, J.B., Donner, A., McWhinney, I.R., Oates, J., Weston, W.W., & Jordan, J. 2000. “The Impact of Patient-Centered Care on Outcomes.” The Journal of Family Practice. 49(9), 796-804. 10 HHSC. 2011. 11 Consumer Assessment of Healthcare Providers and Systems (CAHPS®). 2011a. “CAHPS® Health Plan Survey 4.0, Child Medicaid Questionnaire.” Available at: https://www.cahps.ahrq.gov/SurveysGuidance/HP.aspx. 12 CAHPS®. 2011b. “CAHPS® Clinician and Group Surveys.” Available at: https://www.cahps.ahrq.gov/Surveys-Guidance/CG.aspx. 13 The Child and Adolescent Health Measurement Initiative (CAHMI). 2008. “Children with Special Health Care Needs (CSHCN) Screener.” Available at http://cahmi.org. 14 HHSC. 2010. “Performance Indicator Dashboard for Administrative and Financial Measures.” Available at: http://www.hhsc.state.tx.us/Medicaid/UMCM/Chp10/10_1_1.pdf. 15 Frequencies in the Technical Appendix are weighted to the probability of inclusion in the sample by MCO. Texas Contract Year 2011 STAR Child Survey Report Version: V2.0 HHSC Approval Date: January 23, 2012 Page 60 16 Ogden C.L., M. D. Carroll, L. R. Curtin, M. A. McDowell, C. J. Tabak, and K. M. Flegal. 2006. “Prevalence of Overweight and Obesity in the United States, 1999 – 2004.” JAMA 295(13): 1549-1555. 17 Hoelscher D.M., R. S. Day, E. S. Lee, R. F. Frankowski, S. H. Kelder, J. L. Ward, and M. E. Scheurer. 2004. “Measuring the Prevalence of Overweight in Texas Schoolchildren.” American Journal of Public Health 94(6): 1002-1008. 18 AAP (American Academy of Pediatrics). 2011. “Medical Home: What is a family-centered medical home?” Available at: http://www.aap.org/healthtopics/medicalhome.cfm. 19 ACP (American College of Physicians). 2007. Joint Principles of the Patient-Centered Medical Home. Available at: http://www.acponline.org/running_practice/pcmh/demonstrations/jointprinc_05_17.pdf. 20 The method of calculation follows NCQA specifications, with the exception that a separate score is calculated for each member and then averaged. As a result, individual item responses are weighted according to their frequency. This method of scoring permits statistical comparisons. 21 Travaline et al. 2005. 22 AHRQ. 2011a. 23 AHRQ. 2011b. “Getting Needed Care: Improvement Interventions.” Available at: https://www.cahps.ahrq.gov/Quality-Improvement/Improvement-Guide/Browse-Interventions/HPInterventions/Getting-Needed-Care.aspx. 24 CAHPS® 2011a. 25 CAHPS® 2011b. 26 CAHMI. 2008. 27 AHRQ. 2011c. CAHPS® Comparative Data. Available at: https://www.cahps.ahrq.gov/CAHPSDatabase/Comparative-Data.aspx. 28 National Survey of Children with Special Health Care Needs (NS-CSHCN). 2006. Available at: http://cshcndata.org. 29 National Center for Health Statistics. 2008. National Health Interview Survey. Available at: http://www.cdc.gov/nchs/nhis.htm. 30 U.S. Census Bureau. 2008. Current Population Survey. Available at: http://www.census.gov/cps. 31 Urban Institute. 2008. National Survey of America’s Families. Available at: http://www.urban.org/center/anf/nsaf.cfm. 32 Chi-square = 72.01, p < 0.001. 33 National Center for Health Statistics (NCHS). 2000. “Clinical Growth Charts: BMI-for-Age.” Available at: http://www.cdc.gov/growthcharts/. Texas Contract Year 2011 STAR Child Survey Report Version: V2.0 HHSC Approval Date: January 23, 2012 Page 61 34 World Health Organization. 2008. “WHO Child Growth Standards.” Available at: http://www.who.int/childgrowth/software/en/. 35 World Health Organization. 2008. “Growth Reference Data for 5 – 19 Years.” Available at: http://www.who.int/growthref/en. 36 3M HIS (3M Health Information Systems). 2011. Potentially Preventable Events. Murray, UT: 3M HIS. Texas Contract Year 2011 STAR Child Survey Report Version: V2.0 HHSC Approval Date: January 23, 2012 Page 62


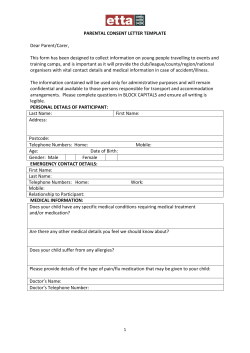

© Copyright 2026