
Cohort Profile: The ‘Children of the 90s’—the
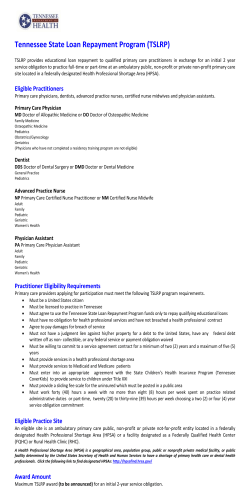
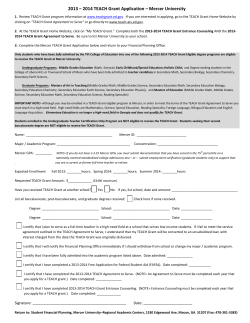
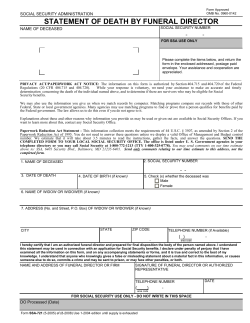
Int. J. Epidemiol. Advance Access published April 16, 2012
This is an Open Access article distributed under the terms of the Creative Commons Attribution Non-Commercial License (http://creativecommons.org/licenses/
by-nc/3.0), which permits unrestricted non-commercial use, distribution, and reproduction in any medium, provided the original work is properly cited.
Published by Oxford University Press on behalf of the International Epidemiological Association
International Journal of Epidemiology 2012;1–17
ß The Author 2012; all rights reserved.
doi:10.1093/ije/dys064
COHORT PROFILE
Cohort Profile: The ‘Children of the 90s’—the
index offspring of the Avon Longitudinal
Study of Parents and Children
Andy Boyd,1* Jean Golding,2 John Macleod,1 Debbie A Lawlor,3 Abigail Fraser,3 John Henderson,1
Lynn Molloy,1 Andy Ness,4 Susan Ring1 and George Davey Smith3
1
*Corresponding author. School of Social and Community Medicine, University of Bristol, Oakfield House, Oakfield Grove, Bristol
BS8 2BN, UK. E-mail: [email protected]
Accepted
21 March 2012
The Avon Longitudinal Study of Parents and Children (ALSPAC) is a
transgenerational prospective observational study investigating influences on health and development across the life course. It considers
multiple genetic, epigenetic, biological, psychological, social and other
environmental exposures in relation to a similarly diverse range of
health, social and developmental outcomes. Recruitment sought to
enrol pregnant women in the Bristol area of the UK during 1990–92;
this was extended to include additional children eligible using the
original enrolment definition up to the age of 18 years. The children
from 14 541 pregnancies were recruited in 1990–92, increasing to
15 247 pregnancies by the age of 18 years. This cohort profile describes
the index children of these pregnancies. Follow-up includes 59 questionnaires (4 weeks–18 years of age) and 9 clinical assessment visits
(7–17 years of age). The resource comprises a wide range of phenotypic
and environmental measures in addition to biological samples, genetic
(DNA on 11 343 children, genome-wide data on 8365 children, complete genome sequencing on 2000 children) and epigenetic (methylation sampling on 1000 children) information and linkage to health
and administrative records. Data access is described in this article and
is currently set up as a supported access resource. To date, over 700
peer-reviewed articles have been published using ALSPAC data.
Why was the cohort set up?
methodology1 for the European Longitudinal Study of
Pregnancy and Childhood (ELSPAC),2 a panEuropean series of longitudinal birth cohorts. The
Avon Longitudinal Study of Parents and Children,
centred on the city of Bristol in the South West of
England, was one of these cohorts. The ALSPAC acronym originally denoted the ‘Avon Longitudinal Study
of Pregnancy and Childhood’ reflecting the original
The Avon Longitudinal Study of Parents and Children,
known to its participants as ‘Children of the 90s’
(Figure 1), originated in a WHO Europe sponsored
meeting held in Moscow in 1985 recommending the
establishment of birth cohort studies across Europe to
investigate modifiable influences on child health and
development. Jean Golding subsequently designed the
1
Downloaded from http://ije.oxfordjournals.org/ by guest on August 22, 2014
School of Social and Community Medicine, University of Bristol, Bristol, UK, 2Centre for Child and Adolescent Health, School of
Social and Community Medicine, University of Bristol, Bristol, UK, 3MRC Centre for Causal Analyses in Translational
Epidemiology, School of Social and Community Medicine, University of Bristol, Bristol, UK and 4School of Oral and Dental
Sciences, University of Bristol, Bristol, UK
2
INTERNATIONAL JOURNAL OF EPIDEMIOLOGY
1990
2001
90s’, i.e. the children of the mothers eligible for recruitment during 1990–92. Recruitment and follow-up
of the mothers is described in a companion article.4
Participants are now in early adulthood; however, the
intention is for follow-up to be lifelong. The transgenerational and family-based nature of ALSPAC is
being consolidated through the ALSPAC ‘Focus on
Mothers’ mothers study, the ‘Focus on Fathers’
fathers study and follow-up of the next ALSPAC generation (ALSPAC-G2 study) through ‘COCO90s’
(Children of Children of the 90s). These initiatives
are not described further here.
2008
Who is in the cohort?
Figure 1 The life course of the ALSPAC Study Logo
study focus. As follow-up beyond early childhood was
developed, ALSPAC was renamed the ‘Avon
Longitudinal Study of ‘‘Parents and Children’’ ’ to reflect the continuing importance of the parents as well
as the children.
WHO Europe provided seed funding to develop the
common ELSPAC methodology and to undertake
pilots of the questionnaires in the UK, Russia and
Greece. Subsequently, early funding for ALSPAC was
obtained from various sources, including UK
Government Departments, the UK Medical Research
Council (MRC) and various charities such as the
Wellcome Trust, British Heart Foundation, British
Lung Foundation and Action Research among many
others. North American funding was also obtained,
including from several of the National Institutes of
Health, and the March of Dimes. The University of
Bristol has provided continual support for ALSPAC
from soon after the onset of the study; since 2000,
this support has been augmented by substantial strategic funding jointly from the Wellcome Trust and the
MRC. Additional support for ALSPAC has come
through programme and project grant funding from
many sources,3 and is listed along with other study
information on the ALSPAC website—http://www
.bristol.ac.uk/alspac/.
This cohort profile describes recruitment and the
first 18 years of follow-up of the ‘Children of the
ALSPAC recruitment campaign
Recruitment to ALSPAC was opportunistic and aimed
to recruit women as early in pregnancy as possible.
ALSPAC attempted to make contact with eligible
women through media information encouraging
study contact and recruitment staff visiting community locations. In parallel, routine antenatal and maternity health services were used to promote the study
and distribute an ‘expression of interest’ card.
Through returning this card, women were able to request further information on the study or to decline
participation. Completed cards contained sufficient
detail (address and EDD) to allow ALSPAC staff to
determine eligibility. Women requesting further information were sent a study information booklet followed by an initial questionnaire 1 week later.
Invitation cards indicated that study consent was
Downloaded from http://ije.oxfordjournals.org/ by guest on August 22, 2014
2011
All pregnant women residents in that part of the old
administrative county of Avon comprising the three
Health Districts shown in Figure 2 were eligible to
participate in ALSPAC if their estimated delivery
date (EDD) fell between 1 April 1991 and 31
December 1992 inclusive. Any resulting child from
these pregnancies is considered eligible. The catchment area covered the three health administration
districts within the South-West Regional Health
Authority that became the ‘Bristol & District Health
Authority’. This area (1991 total population 0.9 million) includes the City of Bristol (1991 population
0.5 million) and surrounding urban and rural
areas, including towns, villages and farming communities; but excludes the area of Avon around the City
of Bath. Pregnant women migrating into the catchment area were eligible up to the point of delivery;
pregnant women originally resident in Avon but
migrating out of the catchment area prior to delivery
were excluded unless they had completed the questionnaire scheduled for the third trimester of pregnancy. A small number of women and their
children falling outside the above strict definition of
eligibility contributed data and have been included in
ALSPAC. This is discussed below.
CHILDREN OF THE 90S: THE ALSPAC INDEX OFFSPRING
3
‘opt out’, i.e. women not actively declining participation would be included in future data collection
follow-up.
ALSPAC eligible sample
During the 1990–92 recruitment campaign, the
ALSPAC target sample was a dynamic population for
whom no convenient sampling frame to support systematic invitation of all eligible individuals was available. The eligible study sample has been defined
retrospectively, based on ALSPAC recruitment records
and maternity, birth and child health records.5
Comparing these health records with ALSPAC study
records, we are able to describe study recruitment
(Figure 3). Recruitment was not complete, which is
unsurprising given its opportunistic nature. It is
impossible to fully ascertain retrospectively where
non-recruitment represents failure to invite as
opposed to active non-response. Records of the returned expression of interest cards and the proportion
of these women declining participation are known
(Figure 3); however, the number of invitation cards
distributed is unknown. The methods used in
retrospectively defining the cohort allowed the use
of more accurate geocoding resources, unavailable to
recruiters in the early 1990s. These resources identified 229 pregnancies (233 children), living on the geographical periphery of the study area, that were
incorrectly assumed to be eligible in 1990–92. As
these individuals enrolled and contributed data, we
have continued to include them in both the ‘eligible
sample’ and the ‘enrolled sample’; as such they are
eligible for continuing follow-up and are included in
all figures provided in this article.
Recruitment outwith the period 1990–92
The substantial majority (82.6%) of women are
known to have been invited to enrol during the
1990–92 recruitment campaign. Subsequent work to
define the ‘eligible sample’ identified additional pregnancies where the offspring were eligible for recruitment, but no replies to recruitment in 1990–92 had
been received (either positive or negative). With funding to complete a ‘Focus@7’ follow-up assessment of
all of the participants at 7 years of age, the opportunity was taken to attempt to recruit all known eligible
Downloaded from http://ije.oxfordjournals.org/ by guest on August 22, 2014
Figure 2 The ALSPAC Eligible Study Area; the study area within the UK and details illustrating the three eligible NHS
District Health Authorities (DHAs). ß Crown Copyright/database right 2011. An Ordnance Survey/EDINA supplied service
4
INTERNATIONAL JOURNAL OF EPIDEMIOLOGY
Downloaded from http://ije.oxfordjournals.org/ by guest on August 22, 2014
Figure 3 The ALSPAC enrolment campaign flow diagram
CHILDREN OF THE 90S: THE ALSPAC INDEX OFFSPRING
5
Table 1 ALSPAC eligible sample pregnancy size and birth outcomes
ALSPAC enrolled pregnancies n ¼ 15 247
ALSPAC eligible sample n ¼ 20 248 pregnancies
Non-enrolled pregnancies n ¼ 5001
Pregnancy size n (%)
Singletons
Sets of Twins
14 971 (98.2)a
204 (1.3)
Sets of Triplets
Sets of Quads
No known birth outcome
a
4909 (98.2)b
43 (0.9)b
3 (<0.1)a
1 (<0.1)b
a
0 (<0.1)b
1 (<0.1)
68 (0.4)a
48 (1.0)b
547 (3.6)c
138 (2.8)d
68 (0.4)c
37 (0.7)d
c
11 (0.2)d
ALSPAC eligible sample n ¼ 20 390 children/fetuses
Outcomes (numbers of fetuses/offspring) n (%)
Fetal loss <20 weeks
Fetal death/sb 20þ weeks
Neonatal death <7 days
45 (0.3)
Post-neonatal death 28 days–1 year
Alive 4 1 year
Total
21 (0.1)
c
14 701 (95.5)c
e
15 390 (100)
c
2 (<0.1)d
15 (0.3)d
4797 (96.0)d
5000e (100)d
a
Percentage of 15 247 enrolled pregnancies.
Percentage of 5001 non-enrolled pregnancies.
c
Percentage of 15 390 enrolled children (fetuses).
d
Percentage of 5000 non-enrolled children (fetuses).
e
The sample contains two twin pregnancies where only one child enrolled (recruitment phases II and III). These are reported as an
enrolled twin pregnancy with birth outcomes of a single enrolled and a single non-enrolled child.
b
children who would have fitted the original eligibility
criteria, excluding those who had previously refused
enrolment. Invitations describing the study were sent
to this group, inviting the mothers to enrol (recruitment Phase II in Figure 3). In addition to this systematic recruitment, ALSPAC made subsequent
opportunistic contact with additional families who
were ‘eligible’ but not ‘enrolled’ (recruitment Phase
III in Figure 3). Contact was initiated by eligible
families seeking enrolment or during ALSPAC community outreach and promotion activities. Due to
the nature of these recruitment methods, it is not
possible to determine how many individuals were
‘invited’ during recruitment Phases II and III. Where
recruitment occurred in Phases II and III, ALSPAC
have not been able to collect the pregnancy, infancy
and early childhood data that were collected from
parental self-completed questionnaires from the
sample recruited during pregnancy (Phase I).
ALSPAC recruitment rates
The ‘eligible sample’ comprises 20 248 pregnancies.
The mothers of 14 541 (71.8%) pregnancies were recruited antenatally during 1990–92 (recruitment
Phase I). Of these 14 541 pregnancies, 68 have no
known birth outcome; of the remaining 14 472 pregnancies, 195 were twin, 3 were triplet and 1 was quadruplet, meaning that there are 14 676 known fetuses.
These pregnancies resulted in 14 062 live-born children
of whom 13 988 were alive at 1 year of age. Post-natal
recruitment to the ‘Focus@7’ clinical assessment at
the age of 7 years recruited a further 456 children
from 452 (2.2% of eligible) pregnancies (Phase II).
Recruitment during Phase III (ages 8–18 years)
added a further 257 children from 254 (1.2% of eligible) pregnancies, giving an overall total of 15 247
(75.3% of eligible) enrolled pregnancies; from these
pregnancies there were 14 775 live-born children of
which 14 701 were alive at one year of age (Table 1).
The birth outcomes of the 20 248 eligible pregnancies
are detailed in Table 1; this information is based on
ALSPAC recruitment records and maternity, birth and
child health records. The full extent of miscarriage
(fetal loss prior to 20 weeks of gestation) is likely
to be under-represented in both the 1990–92 ALSPAC
recruitment records and the records used to identify
the eligible sample. Of the 20 390 known fetuses, the
birth outcomes include 19 600 (96.1%) live births, 685
(3.4%) miscarriages and 105 (0.5%) stillbirths (defined
as fetal loss after 20 weeks of gestation and stillborn
deliveries). There are an additional 116 pregnancies
with no known birth outcome. The ‘Children of the
90s’ ‘enrolled sample’ consists of 14 775 (75.7% of the
19 600 eligible live births) live-born children from
the 15 247 pregnancies (15 458 fetuses) where an individual, either the mother/primary caregiver or the
Downloaded from http://ije.oxfordjournals.org/ by guest on August 22, 2014
8 (<0.1)c
Neonatal death 7–27 days
6
INTERNATIONAL JOURNAL OF EPIDEMIOLOGY
child, has provided data. Of these enrolled participants,
ALSPAC has collected data relating directly to 14 009
(71.5% of 19 600 eligible live births) children, through
self-reported data from the child or data provided
about the child by the biological mother/primary caregiver. The ‘eligible sample’ remains eligible regardless
of their participation history or movement away
from the study area (questionnaires and invitation to
clinical assessments are sent worldwide); if participants withdraw from the study, they remain eligible
and are free to re-enrol into the study if they wish
(32 families re-joined the study in this way by the
age of 18 years).
Table 2 A comparison of academic attainment between the national NPDa sample and ALSPAC children who have
enrolled, have recently participated or are lost to follow-up
ALSPAC enrolment and current participation status
National NPD
Enrolled in
Comparative
KS4 GMEa
ALSPACc
indicator
sampleb
Academic attainmentat the age of 16 yearse
n
Mean score
IQR (25–75)
1 759 174
11 008
No recent
participation
5473
Recently
participatedd
5535
Eligible for
future follow-up
9452
Lost to attrition
1556
308
317
287
347
324
278
266–374
280–380
242–350
314–398
290–380
224–350
a
NPD KS4 GME: The National Pupil Database (NPD) ‘Key Stage 4’ (KS4) dataset records, pupil census and assessment data for all
pupils in English schools at the mean age of 16 years. ALSPAC has linked 14 878 ‘eligible’ children to a subset of the NPD KS4
records that relate to government-maintained establishments (GME). This NPD KS4 GME sample has a 89.5% coverage of all
English pupils nationally and 84.3% regionally (the area including and surrounding the cities of Bristol and Bath). The NPD GME
excludes privately funded and specialist care establishments and as such offers the best available, yet not complete, comparison
group. The majority of the remaining ALSPAC ‘eligible sample’ whom we have not linked to the NPD KS4 GME are thought to live
outside England or relate to individuals where there is insufficient information to establish accurate linkage.
b
All pupils, excluding those in ALSPAC, from English GMEs who sat their KS4 assessments during the same academic years as the
ALSPAC cohort (academic years 2007–09).
c
All pupils, from English GMEs, who are from families that have enrolled in ALSPAC by completing an ALSPAC questionnaire or
clinical assessment.
d
All pupils, from English GMEs, who completed an ALSPAC assessment in the ‘transition to adulthood’ phase (completed a ‘CCS’
or ‘CCXC’ questionnaire or attended the TF17 Focus clinical assessment).
e
Academic attainment at the age of 16 years (total points score for the pupils eight highest scoring assessments).
Downloaded from http://ije.oxfordjournals.org/ by guest on August 22, 2014
External validity and possible participation
biases
The regional basis of ALSPAC has brought advantages
both in logistics and in the creation and maintenance
of a study identity; however, these advantages may
have been offset by limitations in external validity
when generalizing ALSPAC findings to the national
population. Moreover, as recruitment of eligible
mothers to ALSPAC was incomplete, it is possible
that systematic differences between those recruited
and those not recruited may introduce bias to subsequent estimates based on participants.
In the companion article based on ALSPAC mothers,
comparisons
of
socio-economic
characteristics
between the original recruited ALSPAC mothers,
mothers of a child of similar age living in Avon at
the time of ALSPAC initiation and mothers living anywhere in the UK are shown.4 Here we present comparisons of demographic and standard school
assessment data, typically taken at 16 years of age,
between a national sample, the ALSPAC ‘enrolled
sample’ and individuals with different enrolment,
participation and study attrition histories (Tables
2–5). The data are taken from the National Pupil
Database (NPD) ‘Key Stage 4’ (KS4) dataset, recording pupil census and assessment data for all pupils in
English schools. Of these, 14 878 ‘eligible’ children
have been linked to a subset of the NPD KS4 records
that relate to government-maintained establishments
(GMEs). As such, this offers the best available, yet
not complete, comparison group (see footnotes in
Table 2).
Comparisons (Table 2) show that those children in
the ALSPAC ‘enrolled sample’ have a higher educational attainment at the age of 16 years than the NPD
KS4 GME national sample, a difference that is not
present when comparing the ALSPAC ‘eligible
sample’ (mean attainment score of 309, data not
shown) with the NPD KS4 GME national sample.
This difference in mean attainment increases with
increasing completeness of participation in ALSPAC;
conversely children who have not recently participated or are lost to follow-up through study attrition
have a lower educational attainment than the national average. The ALSPAC ‘enrolled sample’
(Table 3) are more likely to be White and less likely
to be eligible for free school meals than the NPD KS4
GME national sample. Recent responders (Table 4)
are more likely to be female, White and less likely
to be eligible for free school meals, whereas those
lost to attrition (Table 5) are more likely to be male
and eligible for free school meals.
To an extent the differences in ethnic composition
identified in the comparison between the ALSPAC
CHILDREN OF THE 90S: THE ALSPAC INDEX OFFSPRING
7
Table 3 A comparison of socio-demographic characteristics between the National NPD sample and children who have
completed any ALSPAC questionnaire or clinical assessment
Enrolled in
ALSPACb
n/n (%)
5470/11 008 (49.69)
OR (95% CI)
1.02 (0.98–1.06)
P4chi2z
0.313
Characteristic
Child sex
Category
Female
National NPD KS4
GME samplea
n/n (%)
871 375/1 770 654 (49.21)
Child ethnicity
White
1 508 926/1 744 429 (86.50)
10 505/10 933 (96.09)
3.85 (3.50–4.24)
<0.001
218 033/1 745 353 (12.49)
682/10 959 (6.22)
0.46 (0.43–0.50)
<0.001
Low household income
FSM
c
Odds ratio
a
All pupils, excluding those in ALSPAC, from English GMEs who sat their KS4 assessments during the same academic years as the
ALSPAC cohort (academic years 2007–09).
b
All pupils, from English GMEs, who are from families that have enrolled in ALSPAC by completing an ALSPAC questionnaire or
clinical assessment.
c
Eligible for ‘free school meals’ (FSM), indicating a joint parental income of 4£16 000.7
z
Chi-squared test for homogeneity (equal odds).
Table 4 A comparison of socio-demographic characteristics between those children who did and did not participate in the
16–18-year data collection assessments
Characteristic
Child sex
Category
Female
Child ethnicity
White
10 505/10 933 (96.09)
5322/5508 (96.62)
1.34 (1.10–1.62)
0.004
682/10 959 (6.22)
240/5519 (4.35)
0.51 (0.44–0.60)
<0.001
Low household income
FSM
b
Recently participated
n/n (%)
3181/5535 (57.47)
OR (95% CI)
1.88 (1.74–2.03)
P4chi2z
<0.001
a
All pupils, from English GMEs, who are from families that have enrolled in ALSPAC by completing an ALSPAC questionnaire or
clinical assessment.
b
Eligible for ‘free school meals’ (FSM), indicating a joint parental income of 4£16 000.7
z
Chi-squared test for homogeneity (equal odds).
Table 5 A comparison of socio-demographic characteristics between those children lost to attrition and those who remain
eligible for future follow-up
Category
Female
Enrolled in
ALSPACa
n/n (%)
5 470/11 008 (49.69)
Ineligible for future
follow-up due to
study attrition
n/n (%)
726/1556 (46.66)
OR (95% CI)
0.86 (0.77–0.96)
Child ethnicity
White
10 505/10 933 (96.09)
1473/1545 (95.34)
0.81 (0.62–1.05)
0.103
Low household income
FSMb
682/10 959 (6.22)
177/1544 (11.46)
2.28 (1.91–2.74)
<0.001
Characteristic
Child sex
Odds ratio
P4chi2z
0.010
a
All pupils, from English GMEs, who are from families that have enrolled in ALSPAC by completing an ALSPAC questionnaire or
clinical assessment.
b
Eligible for ‘free school meals’ (FSM), indicating a joint parental income of 4£16 000.7
z
Chi-squared test for homogeneity (equal odds).
‘enrolled sample’ and the national NPD KS4 GME
sample can be attributed to regional differences and
demographic changes within the UK since the birth of
the cohort. The 1991 census data report that 4.1% of
mothers with infants <1 year of age resident in Avon,
described themselves as ‘non-White’, compared with
7.6% of mothers across the whole of Britain.
Nationally, 14.0% of pupils in the NPD KS4 GME data
are described as non-White compared with 8.0% of
pupils regionally. In economic terms, the South West
of England, which incorporates the ALSPAC catchment
area, has a similar gross disposable household income
per head (£13 300) to the English average (£13 500).
This, however, masks regional differences; using the
same measure, the South West ranks fourth highest
of the 12 UK regions.6
Although these data are accurate at the time of writing ALSPACs, initiatives to address incomplete participation, described later in the article, are intended to
address these biases and may result in changes in
these results.
How often have they been
followed up?
Assessments have been administered frequently, with
68 data collection time points between birth and 18
Downloaded from http://ije.oxfordjournals.org/ by guest on August 22, 2014
Odds ratio
Enrolled in ALSPACa
n/n (%)
5470/11 008 (49.69)
8
INTERNATIONAL JOURNAL OF EPIDEMIOLOGY
Additional follow-up of the ‘eligible sample’ has been
made through school-administered questionnaires and
assessments completed by the child’s teacher. There
have been numerous subpopulation studies using quantitative and qualitative methodologies that are
described later in this article. The ‘eligible sample’
have been linked to National Health Service (NHS)
death and cancer registries (99% linkage match rate)
and education attainment and school census data
(82% linkage match rate, reflecting that only English
GME schools are available; this excludes private education that has a 15.7% coverage locally). Both the participant’s home and school addresses have been geocoded
to a national reference table,8 which allows onward
linkage to neighbourhood socio-demographic and environmental exposure indicators.
What is attrition like?
Response rates to each data collection are summarized
in
Supplementary
Table
S1
(available
as
Supplementary data at IJE online) and Figures 4
and 5. Attrition rates were at their greatest when
the child was in infancy and are increasing again as
the children enter adulthood. The response rates suggest selective participation among respondents with a
larger group of ‘active’ participants than the response
to any single data collection would suggest; e.g. the
average response rate to the 12 measures during the
‘adolescence’ phase is 6155 (48.2% of the 12 776 eligible for follow-up during this phase); however, 9600
(75% of 12 776) individuals responded at least once
Figure 4 Response rates to mother/primary carer completed questionnaires about the child (assessments from 4 weeks old
to 18 years of age)
Downloaded from http://ije.oxfordjournals.org/ by guest on August 22, 2014
years of age (Supplementary Table S1, available as
Supplementary data at IJE online). These include 34
child-completed questionnaires (CCQs, 25 including
multiple domains and 9 focusing on pubertal development), 9 ‘focus’ clinical assessments and 25 questionnaires about the child completed by the mother or
other main caregiver (MCQs). To aid the clarity of our
reporting, we have retrospectively allocated each data
collection into six phases (Supplementary Table S1a–f,
available as Supplementary data at IJE online); ‘infancy’ (54 weeks and 42 years of age), ‘early childhood’ (42 years and <7 years), ‘childhood’ (7 years of
age), ‘late childhood’ (47 years and <13 years), ‘adolescence’ (513 years and <16 years) and ‘transition
to adulthood’ (416 years and 418 years). The ‘infancy’ phase included four MCQs and a subsample,
selected from the past 6 months of ALSPAC births,
who were invited to the first four ‘Children in
Focus’ (CiF) study assessment clinics. ‘Early childhood’ included 11 MCQs, 6 CCQs and the CiF subsample who were invited to a further 6 clinical
assessments. ‘Childhood’ included the first focus
(‘Focus@7’) study assessment clinic and one CCQ.
‘Late childhood’ included six MCQs, nine CCQs and
four ‘Focus’ clinics. ‘Adolescence’ included three
MCQs, seven CCQs and two ‘Focus’ clinics and finally
‘transition to adulthood’ included one MCQ, two
CCQs and the latest clinic assessment visit
(‘Focus@17’). The enrolled sample was increased in
‘childhood’ through recruitment Phase II, and recruitment Phase III ran from ‘late childhood’ through
‘transition to adulthood’ inclusive.
CHILDREN OF THE 90S: THE ALSPAC INDEX OFFSPRING
9
during this phase (Supplementary Table S1, available
as Supplementary data at IJE online).
A defining feature of the ALSPAC data set is the
breadth of repeat measures taken at frequent intervals
across the life course. Loss to follow-up caused by
permanent attrition to the study (Figure 6) reduces
the proportion of the sample who are eligible for
follow-up at each time point. In addition, the fluctuations in response described previously decreases the
participating sample that consistently responds
(Figure 7). While these factors impact on the availability of repeat measures across all time points, a
core sub-sample of over 3000 families have responded
to all the 55 assessments open to the ‘full’ sample
(defined in the footnotes to Figure 7) and 5777
have responded to 75% or more of these assessments
(541 individual assessments).
We are addressing incomplete participation in several ways. We are conducting a postal campaign seeking consent to collect data from health and
administrative sources (described later) and inviting
re-enrolment in ALSPAC by participants who have
now reached the age of 18 years. We plan to extend
this campaign to eligible individuals who have never
previously participated. We are currently seeking support under Section 251 of the NHS Act (2006) to collect routine data on non-responders to this campaign.
Through data linkage, we can increase the completeness of the study data set in participants and better
characterize non-participants in order to investigate
possible participation biases. Linkage offers additional
benefits through providing data to inform ALSPAC’s
efforts to fully trace all enrolled participants. We continue to engage the sample through new media,
including a study children’s Facebook page, and
through targeted community engagement and data
collection. These initiatives and key ALSPAC developments are developed in consultation with cohort participants through an advisory committee (ALSPAC
Teenage Advisory Panel, TAP), participant representation on the ALSPAC Ethics and Law Committee and
participant focus groups.
What has been measured?
The ALSPAC resource has a scale and richness that is
unprecedented in epidemiological studies. The resource contains key phenotypes, genetic and biological
samples collected at multiple time points allowing the
assessment of developmental trajectories and critical
periods of development. Current data collection
focuses on the children’s transition into adulthood,
obtaining measures as the children reach their physical maxima and observing emerging patterns in risk
Downloaded from http://ije.oxfordjournals.org/ by guest on August 22, 2014
Figure 5 Response rates to child study clinical assessments (excluding CiF sub-sample clinics) and self-completed questionnaires (assessments from 65 months to 18 years). aCCXB questionnaire was administered to a subsample of the cohort.
b
CCXC questionnaire piloted a new internet-based data collection and did not receive the normal reminder follow-up
procedure
10
INTERNATIONAL JOURNAL OF EPIDEMIOLOGY
Downloaded from http://ije.oxfordjournals.org/ by guest on August 22, 2014
Figure 6 ALSPAC Study attritiona flow diagram. aIndividuals excluded from follow-up due to a ‘permanent’ status change
that remained in place up to the age of 18 years (e.g. individuals became untraceable and were not found again before the
age of 18 years). Individuals for whom a change in status meant they were temporarily excluded from follow-up are not
included and, therefore, this diagram under-represents attrition at individual data collection time points. bPost-18-year age
tracing and recruitment initiatives in ALSPAC may result in some individuals being included in future follow-up
taking and anti-social behaviour. Measures have been
selected to record the antecedent exposures of future
health and psychosocial outcomes. A comprehensive
guide can be found on our website.9 Key measures are
summarized in Tables 6 and 7.
The ALSPAC phenotype resource
The phenotype resource (Table 6) and environmental
data (Table 7) comprise self-completed child, mother
and teacher questionnaires as well as clinical
assessments.
CHILDREN OF THE 90S: THE ALSPAC INDEX OFFSPRING
11
The ALSPAC biobank
Since early pregnancy, mothers and children have
provided biological samples including blood, urine,
hair, toenails, teeth, saliva and placenta. To ensure
maximum efficiency of sample use, each sample has
been divided into small aliquots and stored to ensure
long-term preservation. The biobank is summarized in
Supplementary Table S2 (available as Supplementary
data at IJE online); full details of the ALSPAC biobank including a list of child samples and the assayed
results are available on the study website.9
The ALSPAC genetic resource
DNA samples for 11 343 of the children have been
collected, and 6902 of these have had a lymphoblastoid cell line transformed to date. The intention is to
collect buccal saliva samples from children with no
existing DNA data. Genome-wide data have been obtained for 8365 of the children. A list of 700 genotypes assayed on the available 410 000 participants
with DNA samples are on the ALSPAC website.10
Most of these were obtained before genomewide data became available, but some represent variants not included or imputable from genome-wide
data.
A subsample of 2000 of the most heavily phenotyped participants will have complete genome sequencing to 6-fold depth (UK10K and Sanger Institute).
For 1000 participants, ALSPAC has obtained gene expression data (Illumina 48 k chip) and copy number
variation data (custom 105 k Agilent CGH chip from
the WTCCC). DNA methylation data sampling
(Illumina HumanMethylation450 BeadChip) is being
run on 1000 mother and child pairs (where mother
and child DNA is available from all of the following:
child DNA at birth, 7 or 9 mean years of age and 15
or 17 mean years of age and mother DNA from pregnancy and child aged 15–17 years); and also
whole-methylome sequencing is currently being
piloted.
Downloaded from http://ije.oxfordjournals.org/ by guest on August 22, 2014
Figure 7 ALSPAC assessment response across multiple data collection time points. (a) Response to all 55* child-based
questionnaires and ‘Focus’ clinical assessments across multiple time points. Number of questionnaires about the child
(completed by the child or by the child’s mother/carer) or Focus clinical assessments completed by the child (excludes CiF
sub-sample clinics and the puberty, CCXB and CCXC subsample questionnaire assessments). (b) Response to 25* CCQs
across multiple time points. Number of questionnaires completed by the child (excludes the puberty, CCXB and CCXC
subsample questionnaires). (c) Attendance at 9* child ‘Focus’ clinical assessment visits. Number of ‘Focus’ clinical assessments attended by the child (excludes the CiF sub-sample clinics)
12
INTERNATIONAL JOURNAL OF EPIDEMIOLOGY
Table 6 ALSPAC phenotype measures
Self-reported questionnaire measures (from pregnancy to the age of 18 years)
Demographics: ethnicity
Health: morbidity, accidents and injuries, medication
Psychological and social: alcohol, smoking and illicit drug use, sexual behaviour, depression, significant life events,
parent peer and sibling relationships, peer networks, temperament and behaviour
Development: puberty and menstruation, speech and language, fine and gross motor coordination
Education questionnaires and tests administered in school
Understanding of mathematics and science (age 8, 11 and 14 years)
Spelling
School experiences and aspirations
Teacher assessment of the child (age 8 and 11 years)
‘CiF’ clinical assessment measures [10 clinics (Supplementary Table S1, available as Supplementary data at IJE online),
10% subsample]
‘Focus’ clinical assessment measures [nine clinics from the age of 7–17 years (Supplementary Table S1, available as
Supplementary data at IJE online), full ‘eligible sample’ invited, see recruitment earlier in this article]
Physiological: anthropometry, blood pressure, bone mineralization, fat and lean mass using DXAa whole body and hip
scans, pQCTa leg scan, audiometry and tympanometry, lung function, vision, taste and smell, atopy (skin prick test)
Cognitive: IQ (WISCa), motor skills, memory, reading ability
Psychological and social: depression (CIS-Ra), gender behaviour, self-esteem, peer relationships, antisocial activities,
romantic relations (ESYTCa), alcohol and drug use, eating disorders
a
WPPSI: Wechsler Preschool and Primary Scale of Intelligence, DXA: Dual-emission X-ray Absorptiometry bone mineral scan, pQCT:
Peripheral Quantitative Computed Tomography bone mineral scan, WISC: Wechsler Intelligence Scale for Children, CIS-R: Clinical
Interview Schedule Revised symptom score, ESYTC: Edinburgh Study of Youth Transitions and Crime questionnaire assessment
ALSPAC linkage to routine health and
administrative records
Information on individuals eligible to participate in
ALSPAC is currently available through linkage to the
ONS (deaths and cancer registrations, 99% coverage
of the ‘eligible sample’), the National Pupil Database
(82% coverage of the ‘eligible sample’ depending on
time point) and the General Practice Research
Database11 (4% coverage of the ‘eligible sample’).
The Project to Enhance ALSPAC through Record
Linkage (PEARL) is extending the use of linkage to
administrative data to enhance the ALSPAC data resource and address issues of possible participation
bias. Existing or intended administrative data sources
used by ALSPAC are listed in Table 8.
The use of ALSPAC as a sampling frame
The ALSPAC cohort has frequently been used to study
subpopulations and controls identified in a variety of
ways, including by genotype (e.g. smoking-related
genotypes used for recall of sample for detailed assessment of smoking style), environment and/or phenotype. These have included qualitative projects (young
people’s views on record linkage, drug use in teenagers)
and quantitative projects (e.g. bone fractures,12 physical exercise13 and diet, children and siblings in families
with parental separation14). The ALSPAC sample has
also been used to select cases for inclusion in randomized control trials including the value of thermometers in a child’s nursery and comparisons between
two designs of orthoptic screening for visual defects
(as part of the CiF 4–37-month clinics).15
What has it found? Key findings
and publications
There have been 4700 articles published by February
2012; details of these can be found on the ALSPAC
study website.16 A summary of some of the key
ALSPAC findings has recently been published elsewhere.17 Notable examples of how ALSPAC findings
have informed health and social policy include the
following: (i) providing evidence to help persuade
policy makers to support the ‘back to sleep’ policy
change. This campaign started in the UK prior to
ALSPAC’s initiation, and initially advised parents
not to place their babies to sleep in the prone position
to reduce the risk of cot death. ALSPAC reassured
sceptical health professionals and policy makers to
proceed to recommending the supine position by
demonstrating that this position was not associated
Downloaded from http://ije.oxfordjournals.org/ by guest on August 22, 2014
Physiological: anthropometry, blood pressure and pulse rate, lung function, fitness, skin, eye and dental observations,
allergy testing, vision, tympanometry and hearing, speech and language
Cognitive: speech and language, cognition (Griffiths test and WPSSIa)
CHILDREN OF THE 90S: THE ALSPAC INDEX OFFSPRING
13
Table 7 ALSPAC environmental measures
Self-reported questionnaire measures (from pregnancy to the age of 18 years)
Diet: food frequency questions
Housing: type of home, tenure, number of rooms, availability of facilities such as hot running water and central
heating
Social background: social class based on parental occupations, parental educational level, type of neighbourhood, use
of car
Household composition: with changes over time, crowding (person/room), pets
Stressors: acute (measured with life events), conflict in the home, bullying/victimization at school, parental anxiety
and depression
Medications, supplements and treatments
Air pollutants: exposure to cigarette smoking, use of chemicals in the home, proximity to heavy traffic, types of
heating and cooking at home, ventilation
Noise: exposure at home and at school
Physical environment: time spent outdoors, methods of getting to school, time spent on various activities including
watching TV
Safety equipment and measures taken in the home
Type of school: school environment, day care, out of school care, school choice
Physical activity: ‘actigraph’ activity accelerometers and ‘G4’ impact monitors
Diet: using 3-day dietary diary
Type of day care
Special studies of subsamples of homes
Air pollutants within and outside the home
Noise levels within the home
Using available census and local authority data
Classification of housing band (for council tax)
Proximity of home to power lines
Linkage to deprivation level of neighbourhood
with factors detrimental to child health.18,19
This finding also helped to persuade the US
National Institutes of Health to carry out their own
‘Back to Sleep’ campaign that started in 2004. (ii) The
finding that the application of skin creams containing
peanut oil as a base ingredient to broken skin20,21
sensitized children to peanut allergy has led to some
manufacturers altering the composition of the creams
and the Committee on Safety in Medicines recommending that warning labels be included on all medicinal products containing peanut oil. (iii) ALSPAC
has contributed to the debate on the consumption of
fish during pregnancy. Established advice in the UK
and USA was that on balance the risks of consuming
toxins while eating more than two portions of fish per
week outweighed the known benefits of eating fish.
ALSPAC findings have influenced UK and US guidelines concerning fish consumption in pregnancy by
demonstrating that benefits to child behaviour and
verbal IQ,22 early development23 and visual stereoacuity24 outweigh potential harm of neurotoxicity
from mercury and other sources of contamination.
(iv) Evidence from ALSPAC including the influence
of socio-economic position on life chances and aspirations were used to support the Independent Review
on Poverty and Life Chances by Frank Field MP ‘The
Foundation Years: Preventing Poor Children becoming
Poor Adults’25 and the Marmot Review Fair Society,
Healthy Lives.26
Genetic investigations using the candidate approach
to studying gene variation and phenotypic outcome
have described the influence of the filaggrin gene
(FLG)27 on child susceptibility to atopic eczema and
asthma. ALSPAC was the largest follow-up sample in
the discovery that variation at the FTO28,29 gene is
associated with increased adiposity and predisposition
to obesity; using DXA assessment measures ALSPAC
showed that the association was only present for fat
mass and not lean mass. ALSPAC holds DNA collected at multiple time points, allowing researchers
to explore DNA methylation and epigenetics.30,31 To
realize the full potential of the resource ALSPAC is
involved in genetic consortium studies including
UK10K and EGG (early growth genetics).
Environmental studies have explored the antecedents of asthma where environmental exposures
Downloaded from http://ije.oxfordjournals.org/ by guest on August 22, 2014
‘Focus’ clinical assessment measures (nine clinics from the age of 7–17 years (Supplementary Table S1, available as
Supplementary data at IJE online), full ‘eligible sample’ invited, see recruitment earlier in this article)
14
INTERNATIONAL JOURNAL OF EPIDEMIOLOGY
Table 8 ALSPAC linkage to health and administrative records
Health records
a
Primary care electronic patient records
The General Practice Research Database (GPRD)
a
Hospital Episodes Statistics (HES), bCancer and Deaths Registry, NHS Information Centre and Office for National
Statistics
bAd hoc data extraction from hospitals, bgeneral practice, bopticians and records of other health care providers (e.g.
records of childhood seizures)
b
Education records
b
School records; NPD schools data, Department for Education
Further education and work-based learning; Individual Learner Record (ILR) database, Department for Business,
Innovations and Skills
bHigher education; Higher Education Statistics Agency (HESA), Department for Business, Innovations and Skills
b
Economic, employment and social support (benefits) records
Criminal convictions and cautions
Criminal conviction or police cautions; aPolice National Computer (PNC) database, Ministry of Justice
Neighbourhood data
Indices of Multiple Deprivation (of home residence)
Townsend Score
a
Either linkage, data owner approval and/or data collection mechanisms in development. bLinkage and data owner approvals in
place and data collected
including prenatal maternal anxiety and paracetamol
use,32–34 exposure to a range of cleaning products35,36
and excessive hygiene regimens37 have been found to
influence the development of asthma in the child.
Analysis of early life influences including maternal
age, diet and smoking do not appear to influence
blood pressure in the child38–41 although maternal
weight gain in pregnancy is associated with
increased risk of child adiposity and adverse cardiovascular risk factors.42 ALSPAC has also shown that
fat mass contributes to higher bone mineral
density.43,44
What are the main strengths and
weaknesses?
The main strengths of ALSPAC are its general population base and sample size, the breadth and frequency of data collection and the availability of
repeat measures, the extensive biobank, the breadth
of genetic sampling and the ongoing support and
commitment from the study families.
ALSPAC also has some weaknesses. Despite its size,
it lacks power to study rarer exposures and outcomes.
Although ALSPAC has collected repeat measures
across frequent time points, the early (up to the age
of 5 years) collection of data at study assessment
clinics was limited to a 10% subsample.
Nevertheless, the data collected have been very informative in regards to early growth and development. Collecting data from young adults is
notoriously difficult and it is no surprise that
ALSPACs response rates have decreased over time.
To address this, ALSPAC is investing resources into
collecting data from health and administrative records
as well as participation initiatives aimed at increasing
response. Incomplete recruitment and subsequent attrition have further reduced power and the availability
of repeat measures across multiple time points and
may have introduced bias in relation to estimation
of some effects. Moreover, the demographic profile
of the catchment area population and the effects of
subsequent differential attrition have led to an overrepresentation of more affluent groups and an
under-representation of non-White minority ethnic
groups compared with the national population. This
may influence external validity of some study findings
based on prevalence, although it should not influence
adversely the longitudinal results provided the features affecting bias are included. An advantage of current analyses is the relatively new statistical
techniques for taking account of missing data, and
these are being used increasingly.45
Downloaded from http://ije.oxfordjournals.org/ by guest on August 22, 2014
Tax receipts and income; aWork and Pensions Longitudinal Survey (WPLS) database, Her Majesty’s Revenue and
Customs
Receipt of benefits and pension provision; aWork and Pensions Longitudinal Survey (WPLS) database, Department for
Work and Pensions
CHILDREN OF THE 90S: THE ALSPAC INDEX OFFSPRING
Can I get hold of the data? Where
can I find out more?
The ALSPAC executive plan to move towards more
open access collaboration in the future and details of
this will appear on the website. It is likely that access
to genetic (particularly GWAS) and molecular data
will have some supported access rather than being
completely open access. The access requirements and
use of external data collected through record linkage
will be determined by the contractual agreements
ALSPAC has with the data owners. Access to these
linkage data will be supported by ALSPAC.
Supplementary Data
Supplementary Data are available at IJE online.
Funding
The UK Medical Research Council (MRC), the
Wellcome Trust and the University of Bristol currently
provide core funding support for ALSPAC
(WT092731). Data collection is funded from a wide
range of sources, which are detailed on the ALSPAC
website: http://www.bristol.ac.uk/alspac/participants/
ethics/funding/. AB is funded by the Wellcome Trust
(WT086118/Z/08/Z) and the MRC/Wellcome Trust
strategic support. AF is funded by an MRC Research
Fellowship (G0701594). DAL, AF and GDS work in a
Centre that receives funding from the MRC
(G0600705).
Acknowledgements
We are extremely grateful to all the families who took
part in this study, the midwives for their help in recruiting them, and the whole ALSPAC team, which
includes interviewers, computer and laboratory technicians, clerical workers, research scientists, volunteers, managers, receptionists and nurses.
Conflict of interest: None declared.
KEY MESSAGES
ALSPAC evidence provided reassurance that the supine sleeping position in babies, recommended in
the ‘back to sleep’ campaign, did not appear to be detrimental to child health.18,19
ALSPAC evidence on the influence of socio-economic position on life chances and aspirations has
contributed to reviews of UK national policy.25,26
ALSPAC data combining a wide range of phenotypic and environmental data with genetic information collected across multiple time points have allowed important contributions to genetic27–29 and
epigenetic epidemiology.30,31
ALSPAC has provided important evidence on the influence of environmental exposures, such as
prenatal maternal paracetamol use and household cleaning products and hygiene regimens, on the
risk of asthma in the child.32–37
Downloaded from http://ije.oxfordjournals.org/ by guest on August 22, 2014
Further details can be found on the ALSPAC website:
http://www.bristol.ac.uk/alspac/, including the full
ALSPAC collaboration policy (http://www.bristol.ac
.uk/alspac/documents/alspac-policy.pdf). This resource
also details all ALSPAC data (on mothers, index children and other relatives) that are currently available
to external collaborators. At the present time, the
ALSPAC resource is set up as a supported access
resource rather than as an open access resource. In
brief, any researcher wanting to use ALSPAC data
must complete an ALSPAC Research Proposal Form
describing the proposed collaboration and send it to
the ALSPAC Executive ([email protected]). The
ALSPAC executive will reply, usually within 2 weeks,
to inform the applicant of the outcome and provide
advice on the next stages. The vast majority of requests are approved as the system only checks availability of data and whether a cost will need to be
charged (in most cases <£1000) to cover the staff
resources required to put together a data set for collaborators. We do not police overlaps between requests, but since July 2011 all approved projects are
detailed on the website (address as above), so potential collaborators can see what is already being done
with the resource. We also do not police the scientific
quality of projects, which is the responsibility of the
investigators, but we do ensure that the study is correctly described in articles/other reports going for publication. Once a project has been agreed, the
researchers are assigned a data buddy to support collaboration. The data buddy will provide the data set
and advice on analysis of the data set. Any newly
derived variables (including new assays on stored
bloods) by the collaborator will be put into the
main ALSPAC database and made available to other
researchers once the collaborator has completed their
project. As part of the collaborative agreement, we
expect collaborators to produce appropriately detailed
information about such new variables.
15
16
INTERNATIONAL JOURNAL OF EPIDEMIOLOGY
References
1
2
3
4
5
7
8
9
10
11
12
13
14
15
16
17
18
19
20
21
22
23
24
25
26
27
28
29
30
31
32
33
34
35
36
Downloaded from http://ije.oxfordjournals.org/ by guest on August 22, 2014
6
Golding J. Research protocol. European Longitudinal
Study of Pregnancy and Childhood (ELSPAC). Paediatr
Perinat Epidemiol 1989;3:460–69.
The ELSPAC website. http://ivdmr.fss.muni.cz/english/
view.php?cisloclanku¼2005050401 (29 February 2012,
date last accessed).
ALSPAC Funders. http://www.bristol.ac.uk/alspac/partici
pants/ethics/funding/ (29 February 2012, date last
accessed).
Fraser A, Macdonald-Wallis C, Tilling K et al. Cohort
Profile: The Avon Longitudinal Study of Parents and
Children: ALSPAC mothers. Int J Epidemiol 2012;
doi:10.1093/ije/dys066.
Boyd A, Golding J, Macleod JAA. Using linkage to health
and social administrative records to quantify the response
rate to initial recruitment in the Avon Longitudinal Study
of Parents and Children (ALSPAC) and assess possible
bias associated with non-response (Abstract). Scottish
Health Informatics Programme (SHIP) Bi-annual Conference.
UK: St. Andrews, 2011.
Marais J, Schuster S. Regional Household Income. London:
Office for National Statistics, 2007. http://www.ons.gov.
uk/ons/rel/regional-accounts/regional-household-income/
march-2007/regional-household-income.pdf (29 February
2012, date last accessed).
Hobbs G, Vignoles A. Is free school meal status a valid
proxy for socio-economic status (in schools research)?
CEE Discussion Papers, Centre for the Economics of
Education, LSE, 2007.
The Office of National Statistics (ONS). National
Statistics Postcode Directory. http://www.census.ac.uk/
guides/Lookup_tables.aspx (29 February 2012, date last
accessed).
The ALSPAC Resource. http://www.bristol.ac.uk/alspac/
sci-com/resource/ (29 February 2012, date last accessed).
ALSPAC Genotype Data. http://www.bristol.ac.uk/alspac/
documents/genotypes-feb-2010.pdf (29 February 2012,
date last accessed).
The General Practice Research Database (GPRD). http://
www.gprd.com/home/ (29 February 2012, date last
accessed).
Clark EC, Ness AR, Tobias JH. Bone fragility contributes
to the risk of fracture in children, even after moderate
and severe trauma. J Bone Miner Res 2008;23:173–79.
Mattocks C, Ness A, Leary S et al. Use of accelerometers
in a large field based study of children: protocols, design
issues and effects on precision. J Phys Act Health 2008;
5(Suppl 1):S98–111.
Gass K, Jenkins J, Dunn J. Are sibling relationships protective? A longitudinal study. J Child Psychol Psychiatry
2007;48:167–75.
Williams C, Harrad RA, Harvey I, Frankel S, Golding J.
Methodology for a randomized controlled trial of preschool vision screening: a new approach with the
‘ALSPAC’ project. Opthalmic Epidemiol 1996;3:63–76.
ALSPAC Peer-Reviewed Publications. http://www.bristol
.ac.uk/alspac/sci-com/pubs/ (29 February 2012, date last
accessed).
Golding J. Determinants of child health and development: the contribution of ALSPAC—a personal view of
the birth cohort study. Arch Dis Child 2010;95:319–22.
Hunt L, Fleming P, Golding J. Does the supine sleeping
position have any adverse effects on the child? I: health
in the first 6 months. The ALSPAC Study Team. Pediatrics
1997;100:E11.
Dewey C, Fleming P, Golding J. Does the supine sleeping
position have any adverse effects on the child? II: development in the first 18 months. ALSPAC Study Team.
Pediatrics 1998;101:E5.
Lack G, Fox D, Northstone K et al. Factors associated with
the development of peanut allergy in childhood. N Engl J
Med 2003;348:977–85.
Khakoo A, Lack G. Preventing food allergy. Curr Allergy
Asthma Rep 2004;4:36–42.
Hibbeln JR, Davis JM, Steer C et al. Maternal seafood
consumption in pregnancy and neurodevelopmental outcomes in childhood (ALSPAC study): an observational
cohort study. Lancet 2007;369:578–85.
Daniels JL, Longnecker MP, Rowland AS et al. Fish intake
during pregnancy and early cognitive development of offspring. Epidemiology 2004;15:394–402.
Williams C, Birch EE, Emmett PM et al. Stereoacuity at
age 3.5 y in children born full-term is associated with
prenatal and postnatal dietary factors: a report from a
population-based cohort study. Am J Clin Nutr 2001;73:
316–22.
Field F. The Foundation Years: Preventing Poor Children
Becoming Poor Adults. The Report of the Independent
Review on Poverty and Life Chances. London: Cabinet
Office, 2010.
Patel C, North F, Head J et al. Fair Society, Healthy Lives:
Strategic Review of Health Inequalities in England Post 2010
(The Marmot Review). London: University College
London, 2010.
Henderson J, Northstone K, Lee SP et al. The burden of
disease associated with filaggrin mutations: a populationbased longitudinal birth cohort study. J Allergy Clin
Immunol 2008;121:872–77.
Frayling TM, Timpson NJ, Weedon MN et al. A common
variant in the FTO gene is associated with body mass
index and predisposes to childhood and adult obesity.
Science 2007;316:889–94.
Timpson NJ, Emmett PM, Frayling TM et al. The fat
mass- and obesity-associated locus and dietary intake in
children. Am J Clin Nutr 2008;88:971–78.
Relton CL, Groom A, Elliot HR et al. Epigenetic epidemiology: evidence for the role of epigenetic variation in
complex disease. Ann Nutr Metab 2009;55(Suppl 1):165.
Relton CL, Davey Smith G. Epigenetic epidemiology of
common complex disease: prospects for prediction, prevention, and treatment. PLoS Med 2010;7:e1000356.
Shaheen SO, Newson RB, Sherriff A et al. Paracetamol
use in pregnancy and wheezing in early childhood.
Thorax 2002;57:958–63.
Shaheen SO, Newson RB, Henderson AJ et al. Prenatal
paracetamol exposure and risk of asthma and elevated
immunoglobulin E in childhood. Clin Exp Allergy 2005;
35:18–25.
Cookson H, Granell R, Joinson C, Ben-Shlomo Y,
Henderson AJ. Mothers’ anxiety during pregnancy is
associated with asthma in their children. J Allergy Clin
Immunol 2009;123:847–53.
Sherriff A, Farrow A, Golding J et al. Frequent use of chemical
household products is associated with persistent wheezing in
pre-school age children. Thorax 2005;60:45–49.
Henderson J, Sherriff A, Farrow A et al. Household chemicals, persistent wheezing and lung function: effect modification by atopy? Eur Respir J 2008;31:547–54.
CHILDREN OF THE 90S: THE ALSPAC INDEX OFFSPRING
37
38
39
40
41
Sherriff A, Golding J. Hygiene levels in a contemporary population cohort are associated with wheezing and atopic
eczema in preschool infants. Arch Dis Child 2002;87:26–29.
Leary SD, Ness AR, Emmett PM, Davey Smith G,
Headley JE. Maternal diet in pregnancy and offspring
blood pressure. Arch Dis Child 2005;90:492–93.
Roberts RJ, Leary SD, Davey Smith G, Ness AR; the
ALSPAC Study Team. Maternal age in pregnancy and offspring blood pressure in childhood in the Avon
Longitudinal Study of Parents and Children (ALSPAC).
J Hum Hypertens 2005;19:893–900.
Brion MJ, Leary SD, Davey Smith G, Ness AR. Similar
associations of parental prenatal smoking suggest child
blood pressure is not influenced by intrauterine effects.
Hypertension 2007;49:1422–28.
Brion MJ, Leary SD, Lawlor DA, Davey Smith G,
Ness AR. Modifiable maternal exposures and offspring
42
43
44
45
17
blood pressure: a review of epidemiological studies of
maternal age, diet and smoking. Pediatr Res 2008;63:
593–98.
Fraser A, Tilling K, Macdonald-Wallis C et al. Association
of maternal weight gain in pregnancy with offspring
obesity and metabolic and vascular traits in childhood.
Circulation 2010;121:2557–64.
Timpson NJ, Sayers A, Davey Smith G, Tobias JH. How
does body fat influence bone mass in childhood? A
Mendelian randomization approach. J Bone Miner Res
2009;24:522–33.
Sayers A, Tobias JH. Fat mass exerts a greater effect on
cortical bone mass in girls than boys. J Clin Endocrinol
Metab 2010;95:699–706.
Steer CD, Golding J, Bolton PF. Traits contributing to the
autistic spectrum. PLoS One 2010;5:e12633.
Downloaded from http://ije.oxfordjournals.org/ by guest on August 22, 2014


© Copyright 2026