
The Effect of Disintegrin–Metalloproteinase ADAM9 in Gastric
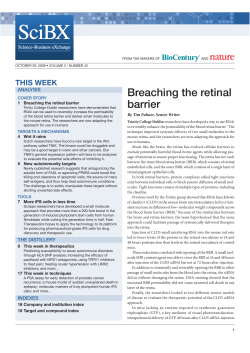
Published OnlineFirst October 24, 2014; DOI: 10.1158/1535-7163.MCT-13-1001
Molecular
Cancer
Therapeutics
Cancer Biology and Signal Transduction
The Effect of Disintegrin–Metalloproteinase ADAM9 in
Gastric Cancer Progression
Jeong Min Kim1,2, Hei-Cheul Jeung1,3, Sun Young Rha1,2,3, Eun Jeong Yu1,4, Tae Soo Kim1,
You Keun Shin1, Xianglan Zhang1, Kyu Hyun Park1, Seung Woo Park2,3, Hyun Cheol Chung1,2,3, and
Garth Powis5
Abstract
Advanced gastric cancer is one of the most aggressive gastrointestinal malignancies, and ADAM (A
disintegrin and metalloproteinase)-9 is a cell-surface membrane glycoprotein with oncogenic properties that
is overexpressed in several cancers. Herein, we investigated the biologic mechanism of ADAM9 in the
progression, proliferation, and invasion of gastric cancer. First, we detected ADAM’s expression, processing, and protease activity in gastric cancer cells. Protease activity was moderately correlated with ADAM9
protein expression, but was better related to a processed smaller molecular weight (84 kDa) form of
ADAM9. Knockdown of ADAM9 or specifically targeted monoclonal antibody (RAV-18) suppressed cancer
cell proliferation and invasion in high ADAM9-expressing cells, not in low ADAM9-expressing cells. RAV18 showed in vivo antitumor activity in a gastric cancer xenograft model. Hypoxia (1% oxygen) induced
ADAM9 expression and functional activity in low ADAM9-expressing gastric cancer cells that was inhibited
by siRNA knockdown or RAV-18 antibody to levels in normoxic cells. Overall, our studies show that
ADAM9 plays an important role in gastric cancer proliferation and invasion, and that while expressed in
some gastric cancer cells at high levels that are responsive to functional inhibition and antitumor activity of a
catalytic site–directed antibody, other gastric cancer cells have low levels of expression and only when
exposed to hypoxia do ADAM9 levels increase and the cells become responsive to ADAM9 antibody
inhibition. Therefore, our findings suggest that ADAM9 could be an effective therapeutic target for
advanced gastric cancer. Mol Cancer Ther; 13(12); 1–12. 2014 AACR.
Introduction
Gastric cancer is the second leading cause of cancerrelated mortality worldwide with a median survival of
only around a year after diagnosis of advanced disease.
This dismal prognosis mainly results from early invasion and high metastatic activity with an unknown
molecular basis. Cancer metastasis is a complex, multistep process involving the interplay between cancer
cells and surrounding components of extracellular
1
Cancer Metastasis Research Center, Institute for Cancer Research,
Yonsei Cancer Center, Yonsei University College of Medicine, Seoul,
Republic of Korea. 2Brain Korea 21 Projects for Medical Science, Yonsei
University College of Medicine, Seoul, Republic of Korea. 3Department of
Internal Medicine, Yonsei University College of Medicine, Seoul, Republic
of Korea. 4Department of Biology, Baylor University, Waco, Texas. 5Sanford-Burnham Research Institute Cancer Center, La Jolla, California.
Note: Supplementary data for this article are available at Molecular Cancer
Therapeutics Online (http://mct.aacrjournals.org/).
Corresponding Author: Hei-Cheul Jeung, Department of Internal Medicine, Gangnam Severance Hospital, Yonsei University College of Medicine,
211 Eonju-Ro (146-92 Dogok-Dong), Gangnam-Gu, Seoul 135-720, Korea.
Phone: 82-2-2019-1242; Fax: 82-2-362-5592; E-mail:
[email protected]
doi: 10.1158/1535-7163.MCT-13-1001
2014 American Association for Cancer Research.
matrix (ECM), and "invasion" is the first step by which
cancer cells break away from the primary tumor and
infiltrate surrounding stoma (1). Proteolysis has
emerged as a key posttranslational regulator of invasion in gastric cancer (2, 3). However, the mechanism
and major players in invasion have not yet been fully
elucidated.
A disintegrin and metalloproteases (ADAM) are
modular type I transmembrane proteins that contain a
metalloprotease and a disintegrin-like domain, and recent studies have demonstrated a relationship between
increased ADAMs and cancer progression (4). Twentyone members of ADAM family have been identified in
humans, 13 of which have functional proteases. ADAM9
is shown to possess potent biologic activities and is
highly expressed in cancers, including prostate, pancreas, breast, and colon, associated with cancer progression
and poor clinical outcome (5–9). In prostate cancer,
microenvironmental stress on tumor cells leads to shedding of proheparin-binding epidermal growth factor
(EGF), which is processed by ADAM9. The metalloprotease domain of ADAM9 also cleaves the insulin b-chain,
tumor necrosis factor (TNF)-a, transforming growth
factor (TGF)-a, gelatin, b-casein, and so on, and induces
the shedding of EGF, fibroblast-growth factor receptor
www.aacrjournals.org
Downloaded from mct.aacrjournals.org on December 22, 2014. © 2014 American Association for Cancer
Research.
OF1
Published OnlineFirst October 24, 2014; DOI: 10.1158/1535-7163.MCT-13-1001
Kim et al.
2IIIB, and heparin-binding EGF-like growth factor
(10, 11). Therefore, the abilities of ADAM9 to degrade
specific ECM substrates, release active growth factors,
interact with key regulatory factors, and its expression at the invasion edges of several cancer metastases
suggest that ADAM9 regulates several cancer-related
processes—including cell growth and invasion.
A previous report has shown that the transcription
of ADAM9 is upregulated in gastric cancer (12); however, its biologic function and potential as a therapeutic target are largely unknown. In this study, we
investigated the biologic role of ADAM9 in gastric
cancer invasion, and explored a therapeutic approach
of antimetastasis treatment for high ADAM9-expressing cancers using an ADAM9-specific inhibitory
antibody.
Materials and Methods
Reagents and antibodies
Matrigel was supplied by BD Biosciences. Recombinant
ADAM9 protein was from R&D Systems Inc. ADAM9
antibodies were from Cell Signaling Technology for
immunoblot and GeneTex for immunohistochemistry.
Antibodies of hypoxia-inducible factor-1a (HIF1a) and
total/phospho forms of EGFR and ERK were obtained
from Santa Cruz Biotechnology. Antibodies against
GAPDH and a-tubulin were purchased from Abcam and
Sigma-Aldrich. Total and phospho-Akt antibodies were
purchased from Cell Signaling Technology. RAV-18, an
anti-ADAM9-specific blocking antibody, was kindly provided by Macrogenics Inc.
Cell culture
The human gastric cancer cell lines AGS, NCI-N87,
Hs746T, and KATO-III and the cervical cancer cell line
HeLa, positive control of ADAM9, were purchased from
the American Type Culture Collection (ATCC) in 2012.
SNU-1, -5, and -16 in 2006, SNU-216, -638, and -668 in
2007, SNU-484 in 2008, MKN-1, -28, -45, and -74 were
supplied from the Korean Cell Line Bank (KCLB).
Above cell lines were authenticated by standard short
tandem repeat (STR) DNA typing methodology before
being purchased from the ATCC and KCLB. YCC-1, -2,
and -3 were established in 1989, YCC-6 and -7 were
established in 1994, and YCC-9, -10, -11, and -16 were
established in 2000 by the Cancer Metastasis Research
Center at Yonsei University College of Medicine (Seoul,
Korea) from the ascites or peripheral blood (YCC-16) of
patients with advanced gastric cancer. YCC cell lines
were authenticated by STR in July 20, 2012, that had
been outsourced to the KCLB. All cells were maintained
in RPMI-1640 (Nissui) and supplemented with 10%
FBS (Omega Scientific, Inc.), 100 U/mL ampicillin,
100 mg/mL streptomycin, and 2 mmol/L glutamine
(Gibco) in 5% CO2 humidified atmosphere at 37 C. All
cell lines were expanded and cryopreserved in liquid
nitrogen in our laboratory.
OF2
Mol Cancer Ther; 13(12) December 2014
RNA extraction and RT-PCR
Total RNA was extracted using TRizol reagent
(Qiazen Science) according to the manufacturer’s protocol. Briefly, 500 mL of TRizol was added to 1 107
cells, and after adding 200 mL chloroform, cell homogenates were centrifuged at 13,200 rpm for 25 minutes at
4 C, and the aqueous phases were collected. Total RNA
was precipitated with the same volume of isopropanol
for 60 minutes at 20 C and centrifuged for 30 minutes.
The pellets were washed once with 70% ethanol and
suspended in RNase-free water. The quantity of total
RNA was measured using a NanoDrop spectrophotometer (Thermo Scientific).
To synthesize the cDNA, 4 mg of total RNA from
each cell line was mixed with the oligo-dT primer and
incubated at 65 C for 10 minutes. After adding the SuperScript II, 5 first strand buffer, 100 mmol/L DTT, and
10 mmol/L dNTP mix to the RNA/oligo-dT mixture, a
reverse transcription process was performed at 42 C
for 90 minutes. The remaining RNA was hydrolyzed
by incubation at 65 C for 15 minutes in 0.1 N NaOH. The
reaction was then neutralized by the addition of an equal
volume of 0.1 N HCl.
Amplification reactions were performed in an Eppendorf Mastercycler Grandient (Eppendorf). PCR was performed using 1 mg of cDNA, 2.5 mmol/L dNTPs, 1.5
mmol/L 10 PCR buffer with MgCl2, and 5 U Taq polymerase (Invitrogen) to total 50 mL of reaction volume. The
primer sequences used were as follows: ADAM9 (forward: 50 -AGT GGC GGG AAA AGT TTC TT-30 ; reverse:
50 -CCA GCG TCC ACC AAC TTA TT-30 ). The conditions
for PCR amplification were as follows: 94 C for 2 minutes
followed by 94 C for 40 seconds, 60 C for 50 seconds and
72 C for 1 minutes, then 72 C for 2 minutes, and repeated
for 30 cycles. PCR products were separated on ethidium
bromide gels containing 1.2% agarose.
Exposure to hypoxic conditions
When cells reached 80% confluence in a 25 cm2 flask,
the flask was placed in a hypoxic chamber (Personal
O2/CO2 Incubator; Aspect). Cells were exposed to 1%
O2, 5% CO2, and 37 C for 24 hours. After that, cells were
collected and transferred to a Matrigel-coated 24-well
plate for invasion assay. Invaded cells were stained
using 0.5% crystal violet and counted after 24 hours.
Protease activity assay, immunobloting, and proliferation assay were conducted using cells exposed to
hypoxic conditions in the same way.
Immunoblotting
Subconfluent cells were harvested and suspended in a
whole cell lysis buffer [50 mmol/L Tris (pH 8.0), 10%
glycerol, 2 mmol/L EDTA, 5 mmol/L NaF, 1% NP-40,
150 mmol/L NaCl, 1 mmol/L sodium orthovanadate,
1 mmol/L NaF, 10 mg/mL aprotinin, 10 mg/mL leupeptin,
and 1 mmol/L phenyl-methyl-sulfonyl fluoride]. The
lysates were subjected to SDS-PAGE and blotted onto
the polyvinylidenedifluoride (PVDF) membrane. The
Molecular Cancer Therapeutics
Downloaded from mct.aacrjournals.org on December 22, 2014. © 2014 American Association for Cancer
Research.
Published OnlineFirst October 24, 2014; DOI: 10.1158/1535-7163.MCT-13-1001
ADAM9 in Gastric Cancer
membrane was then incubated with the appropriately
diluted primary antibody overnight at 4 C, followed by
a horseradish peroxidase (HRP)–conjugated secondary
antibody for 60 minutes at room temperature. The membrane was visualized with an ECL Western blotting
reagent kit (Amersham Bioscience).
Measurement of ADAM9 protease activity
Protease activity of ADAM9 was measured by a modification of the method of Cisse and colleagues (13).
Briefly, 5 104 cells were seeded in each well of a 96well plate (BD Falcon) and cultured for 1 day. The cells
were rinsed with PBS twice, and 100 mL PBS containing
1 mmol/L ADAM9 substrate (R&D Systems Inc.) was
added and incubated at 37 C for 8 hours. Supernatant
was transferred to a black 96-well plate and the fluorescence activity was measured at 320/405 nm using a
Spectrophotometer (PerkinElmer). To normalize the fluorescent activity to cell number, the cells remained in the
plate and were treated with a MTT (3-(4,5-dimethylthiazol-2-yl)-2,5-diphenyltetrazolium bromide; Sigma) solution. After incubation for 4 hours, the MTT solution was
discarded and the MTT-formazan crystals were dissolved
in 150-mL DMSO. The absorbance was measured at 570 nm
using a multiwell ELISA automatic Spectrometer (Behring ELISA Processor II). The protease activity was calculated using the following equation: protease activity ¼
(fluorescence at 320/405 nm)/absorbance of MTT.
ADAM and HIF1a knockdown experiment
Small interfering RNA (siRNA) against ADAM9 was
purchased from Origene and was also independently
designed using the Genescript siRNA Finder (https://
www.genscript.com/ssl-bin/app/rnai). HIF1a siRNA
was designed by Genescript siRNA Finder. The ADAM9
and HIF1a siRNA target sequence are as follows:
ADAM9, 50 -GACTGTCGGTTCCTTCCAG-30 and HIF1a,
50 -GTCTGCAACATGGAAGGTA-30 . ADAM-10 and -17
siRNA were supplied from Bioneer Corporation. Cells
were transfected with Lipofectamine MAX (Invitrogen)
mixed with 50 nmol/L siRNA. After 48 hours, cells were
harvested for further analysis.
Matrigel Transwell assay
The lower side of an insert (diameter, 6.5 mm; pore
size, 8 mm; Becton Dickinson) was coated with 8 mg/mL
Matrigel. Filters were placed on a 24-well containing
media supplemented with 0.1% bovine serum albumin
(BSA). Cells were harvested with a cell dissociation
solution (Sigma) and suspended in a medium with
3% BSA. Cells (1 105) were then placed in the upper
part of a Transwell chamber and allowed to migrate for
24 hours.
For ADAM9 inhibitor treatment, RAV-18 was added
to the upper compartment in serial doses. After 24
hours, noninvaded cells were swabbed off, and invaded
cells on the lower side of the membrane were fixed in 4%
paraformaldehyde in PBS and stained with 0.5% crystal
www.aacrjournals.org
violet at room temperature for 10 minutes. Invasion
activity was quantified by counting the cells on three
inserts. The data are expressed as the average number of
cells per insert.
Adhesion assay
Harvested cells were suspended in media containing
0.1% BSA, and 1 105 cells were seeded into 8 mg/mL
Matrigel-precoated 96-well plates that were then incubated for 2 hours with or without RAV-18. Media was
removed and the attached cells were stained with 0.5%
crystal violet at room temperature for 10 minutes. Stained
cells were dissolved in 0.1 mol/L sodium citrate and
measured by using ELISA reader at 570 nm.
Survival assay
Cells were seeded into a 96-well plate and incubated
at 37 C for 24 hours. RAV-18 was serially diluted with
media and added to each well. Following 72 hours of
incubation, 50 mL (2 mg/mL) of the MTT solution was
added and incubated for an additional 4 hours. After
centrifugation at 400 g for 10 minutes, the media and
MTT were removed from the wells and the remaining
MTT-formazan crystals were dissolved by addition of
150 mL of DMSO. Following 10 minutes of shaking
incubation, the absorbance at 570 nm was measured
with multiwell ELISA automatic spectrometer. Results
were expressed as percentage cell survival, which was
calculated using the following formula: %survival ¼
[(mean absorbance of test wells standard absorbance)/(mean absorbance of control wells standard
absorbance)] 100. Control wells were treated with the
medium alone (without the drug).
Proliferation assay
Cells (5 104) were seeded in a 24-well plate with or
without treatment of RAV-18. Cells were counted every
day for 7 days. Cellular doubling time (DT) was calculated
by the following equation: DT ¼ (time after cell growth time before cell growth)/log2 (number of cells after
growth/number of cells before growth).
In vivo xenograft model
BALB/c nu/nu mice (female, 7-weeks old; SLC Inc.)
were housed under specific pathogen-free conditions.
Experiments were performed according to the standard
guidelines for animal experiments of Yonsei University
College of Medicine. The effect of RAV-18 on the xenograft model was examined as follows: 1 107 MKN-28
cells were inoculated subcutaneously (s.c.) in the flank
of the mouse or injected intraperitoneally (IP). The
mice were divided into four groups: a control group
of s.c. (PBS i.p.; n ¼ 7), a RAV-18–treated group of s.c.
(50 mg/kg i.p., five times for 2 weeks; n ¼ 7), a control
group of IP (PBS i.p.; n ¼ 7), and a RAV-18–treated
group of IP (50 mg/kg i.p., five times for 2 weeks; n ¼ 7).
The treatment was started on day 21 after cell inoculation and mice were sacrificed after 8 weeks. Tumor
Mol Cancer Ther; 13(12) December 2014
Downloaded from mct.aacrjournals.org on December 22, 2014. © 2014 American Association for Cancer
Research.
OF3
Published OnlineFirst October 24, 2014; DOI: 10.1158/1535-7163.MCT-13-1001
Kim et al.
volume and body weight were measured twice weekly.
The tumor volume was calculated using the formula:
volume ¼ length width width 0.5. At the end of
the experiment, tumors and peritoneal nodules were
collected. The weights of collected samples were measured and the peritoneal nodules were counted.
Immunohistochemistry
Tumor specimens were fixed in 10% formaldehyde
and embedded in paraffin. All samples were cut into
5-mm-thick sections for immunohistochemistry (IHC).
The sections were stained with H&E and immunostained with anti-ADAM9 (1:100), anti-pEGFR (1:200),
and anti-pERK (1:100) antibodies at room temperature
for 90 minutes. The sections were reacted with an EnVision reagent (Dako Co.) for visualization. The results of
immunostaining were categorized as follows: staining in
less than 10% of the tumor cells was scored as 0; staining
in more than 10% of the tumor cells was scored as 1þ;
weak to moderate staining in more than 10% of the
tumor cells was scored as 2þ; and strong staining in
more than 10% of the tumor cells was scored as 3þ.
Statistical analysis
Quantitative data were represented as the mean standard deviation (SD) of at least three independent
experiments. Statistical comparison between groups was
done using the Student t test. Differences were regarded
as statistically significant when the P < 0.05.
Results
Screening of ADAM9 expression and protease
activity in the gastric cancer cell panel
We first carried out immunohistochemistry on paraffin-embedded tumor sections from 10 patients with
gastric cancer with tumor infiltrating beyond subserosa
(T3). Four of 10 (40%) cancers expressed ADAM9,
whereas no expression was found in adjacent noncancerous tissue. ADAM9 expression was highest in cells
along infiltrating margins bordering noncancerous epithelium, and was located at the membrane and in the
cytoplasm (Fig. 1A).
Then, we screened for ADAM9 expression in 24
gastric cancer cell lines. The mRNA levels varied (Supplementary Fig. S1) and did not correlate with ADAM9protein expression in the cell lines (R2 ¼ 0.106; P ¼
0.203). In immunoblots, ADAM9 was detected as two
bands: a proform (110 kDa) and mature form (84
kDa; Fig. 1B; ref. 14). For further experiments, we
selected four cells with high ADAM9 protein expression
and protease activity (SNU-638, YCC-1, MKN-74, and
MKN-28) and three cells with low ADAM9 protein
expression and protease activity (YCC-6, YCC-7, and
Hs746T) as being outside of 1-SD of the mean value of
protease activity tested (Fig. 1C). Protease activity and
protein expression of the mature form were correlated
each other (Fig. 1D; R2 ¼ 0.493; P < 0.01).
OF4
Mol Cancer Ther; 13(12) December 2014
Effect of ADAM9 suppression in gastric cancer cells
First, we screened four siRNA against ADAM9 and
selected the most efficient one for further experiment
(Supplementary Fig. S2). In cells with high ADAM9
expression, protein levels were reduced, and its protease activity was also decreased significantly by 61.8% 3.9% in SNU-638 and 42.7% 4.5% in MKN-28 (Fig. 2A
and B; P < 0.01). The knockdown of ADAM9 led to
decline in phospho-EGFR and phospho-ERK (Fig. 2A),
Then, we examined the invasion after siADAM9 transfection. Cells transfected with siADAM9 showed a
reduced invasion activity through Matrigel compared
with control cells by 71.4% 2.2% in SNU-638 and by
53.0% 3.9% in MKN-28 (Fig. 2C; P < 0.01), which
suggests that the decreased invasion may be a consequence of inhibited EGFR/ERK signaling.
Effect on the proliferation and invasion by inhibiting
protease activity of ADAM9
ADAM9 is a proteolytically active enzyme and the
protease activity is currently the well-defined function of
ADAMs, with most of the putative substrates being transmembrane proteins. Therefore, we focused on the proteolytic domain of ADAM9 as a biomarker and therapeutic target using RAV18, an ADAM9-specific blocking
antibody, for our studies. Dastric cancer cells with high
expression of ADAM9 treated with RAV-18 showed a
dose-dependent decrease in ADAM9 protease activity
(Fig. 3A; 68.7% 0.8% in SNU-638, 62.1% 2.6% in
MKN-28, and 50.3% 2.1% in MKN-74 at 20 mg/mL
RAV-18; P < 0.05); however, there was no decrease in
ADAM9 protease activity in cells with low expression of
ADAM9.
Next, we investigated the effect of RAV-18 on cell
proliferation. For SNU-638 cells, whose baseline doubling
time was 22.6 0.1 hours, after treatment with 20 mg/mL
RAV-18, doubling time was prolonged to 32.3 0.5 hours
(P < 0.01). Similarly, proliferation was significantly
delayed with other cells (YCC-1: 25.4 0.2 vs. 33.9 0.4 hours; MKN-28: 27.4 0.1 vs. 36.3 0.5 hours; MKN74: 27.7 0.2 vs. 39.3 0.8 hours; P < 0.05). However,
RAV18 did not affect proliferation in cells with low
ADAM9 expression (Fig. 3B).
We investigated the effect of RAV-18 on cell adhesion. At a dose of 20 mg/mL RAV-18, adhesion to
Matrigel was unchanged in any of cells tested (Supplementary Fig. S3). However, high ADAM9-expressing
cells demonstrated reduced invasion by 60% in SNU638, 47% in YCC-1, 31% in MKN-74, and 51% in MKN28 (Fig. 3C; P < 0.05); however, there was no effect of
RAV-18 in the low ADAM9-expressing cells. These
findings can transfer that ADAM9 regulates cancer
proliferation and invasion, which is dependent on its
protease activity.
Phospho-EGFR and phospho-ERK were decreased in
cells that responded to RAV18, which accords to the
results of siADAM9 transfection. There was no effect of
RAV-18 on phospho-EGFR and phospho-ERK signaling
Molecular Cancer Therapeutics
Downloaded from mct.aacrjournals.org on December 22, 2014. © 2014 American Association for Cancer
Research.
Published OnlineFirst October 24, 2014; DOI: 10.1158/1535-7163.MCT-13-1001
ADAM9 in Gastric Cancer
A
HeLa
Hs746T
MKN-74
MKN-45
MKN-28
MKN-1
SNU-668
SNU-638
SNU-484
SNU-216
SNU-16
SNU-5
SNU-1
KATOIII
NCI-N87
×1,000
AGS
YCC-11
YCC-10
YCC-9
YCC-7
YCC-16
YCC-3
YCC-2
YCC-1
YCC-6
×400
B
IB:
ADAM9
36 kDa
GAPDH
C
D
800
600
400
HeLa
YCC-7
HS-746T
YCC-6
NCI-N87
SNU-5
KATOIII
YCC-11
SNU-668
MKN-1
SNU-216
YCC-9
SNU-1
SNU-16
SNU-484
AGS
YCC-2
YCC-3
YCC-10
YCC-16
MKN-45
MKN-28
YCC-1
0
MKN-74
200
SNU-638
Fluorescence, arbitrary units
1,000
Expression (mature form/GAPDH density)
P, 110 kDa
M, 84 kDa
2.5
R 2 = 0.49, P < 0.01
2
1.5
1
0.5
0
0
200
400
600
800
1,000
Protease activity (arbitary unit)
Cell lines
Figure 1. ADAM9 protease activity and expression in gastric cancer. A, ADAM9 expression is shown in the cell membrane and cytoplasm in gastric
cancer tissues. B, protein levels of ADAM9 varied in gastric cancer cell lines (P, proform; M, mature form). HeLa cell lysates were used in positive
control. C, ADAM9 protease activities varied in gastric cancer cell lines. D, ADAM9 protease activities were correlated with protein expressions of
2
ADAM9 mature form in gastric cancer cell lines (R ¼ 0.49; P < 0.01). High and low activities were distinguished as being outside one SD of the mean
of all cell lines' protease activity.
in the low-ADAM9 cells that did not respond to RAV-18
(Fig. 3D).
Effect of hypoxia on ADAM9 protease activity and
cancer invasion
Our hypothesis is that the effect of RAV-18 depends
on its inhibition of ADAM9 proteolytic activity and if so,
cells with low ADAM9 should respond to RAV-18 if
ADAM9 is induced. We investigated the influence of
hypoxia on the constitutively low ADAM9-expressing
cells and found that exposure to 1% O2 for 24 hours
increased ADAM9 protease activity in YCC-6, YCC-7,
and Hs746T cells, and this was returned to nonhypoxia
levels by RAV-18 treatment in a dose-dependent manner (Fig. 4A).
We also found that the invasiveness of cells with low
ADAM9 cells was increased under hypoxic conditions (by
24% in YCC-7 and 13% in Hs746T; P < 0.05). RAV-18
www.aacrjournals.org
treatment significantly reduced the invasiveness in hypoxia (by 30% in YCC-7 and 14% in Hs746T at 20 mg/mL
RAV-18; P < 0.05; Fig. 4B).
When these cells were incubated under hypoxic conditions, phospho- and total EGFR and ERK expressions
were, as expected, induced. In addition, treatment of
RAV-18 abrogated the EGFR and ERK phosphorylation
(Fig. 4C). Taken together, these findings suggest that
hypoxia, a feature present in many solid tumors, including gastric cancer, increases ADAM9 expression and
activity, together with an increased invasion, that may
contribute to the growth and spread of gastric cancer.
Relationship with ADAM9 and hypoxia
To obtain further information on the relationship
between ADAM9 and hypoxia, we treated low ADAM9
cells with HIF1a siRNA under hypoxic condition.
ADAM9 protease activity was significantly decreased
Mol Cancer Ther; 13(12) December 2014
Downloaded from mct.aacrjournals.org on December 22, 2014. © 2014 American Association for Cancer
Research.
OF5
Published OnlineFirst October 24, 2014; DOI: 10.1158/1535-7163.MCT-13-1001
Kim et al.
A
SNU-638
C
N
B
MKN-28
R
C
N
R
IB:
ADAM9
173 kDa
pEGFR
EGFR
173 kDa
44/42 kDa
pERK
44/42 kDa
ERK
36kDa
Protease activity (%)
100
P; 110 kDa
M; 84 kDa
C
120
si_Scramble
Control
*
60
si_Scramble
si_ADAM9
*
40
20
0
GAPDH
Control
80
SNU-638
MKN-28
si_ADAM9
120
MKN-28
Invasiveness (%)
100
SNU-638
80
60
*
40
Control
si_Scramble
si_ADAM9
*
20
0
SNU-638
MKN-28
(*, P < 0.01)
Figure 2. Effects of ADAM9 expression modulation by transient ADAM9 inhibition to protease activity and cell invasiveness. A, when siADAM9 was
transfected to high ADAM9 cell lines, SNU-638 and MKN-28, ADAM9 expression was decreased. Phospho-EGFR and phospho-ERK expression also
decreased when siADAM9 was transfected to high ADAM9 cell lines (C, control; N, scrambled siRNA; and R, siADAM9). B, protease activity
was significantly decreased in siADAM9-transfected cells (62.9% 3.9%; SNU-638 and 43.7% 0.5%; MKN-28 at siADAM9 transfection; P < 0.001).
C, when high ADAM9 cells were transfected with siRNA to ADAM9, invasiveness decreased (71% 2.2%; SNU-638 and 53% 3.9%; MKN-28
at siADAM9 transfection; P < 0.01).
when HIF1a was suppressed, and on double siRNA
inhibition of HIF1a and ADAM9, there was an additional
effect in suppressing ADAM9 activity to normoxic levels
(Fig. 5A; P < 0.05). Under hypoxic conditions, cell proliferation was also increased and this effect was prevented
with the treatment RAV-18 and HIF1a siRNA (Fig. 5B).
In immunoblots, we detected that ADAM9 and HIF1a
expression in the cells were increased under hypoxic
condition. When HIF1a siRNA were transfected, ADAM9
expression and EGFR and ERK activity was decreased,
while AKT activity was unchanged. On double inhibition
of HIF1a and ADAM9, these effects were pronounced,
while HIF1a expression was not different compared with
HIF1a siRNA alone (Fig. 5C). Thus, hypoxia and HIF1a
induction may be a factor that regulates the ADAM9
expression and its downstream signaling that lead to
cancer progression.
In vivo experiment of RAV-18 for therapeutic effect
To investigate whether ADAM9 protease activity was
related to cancer progression in vivo, we conducted a
OF6
Mol Cancer Ther; 13(12) December 2014
xenograft study using BALB/c nu/nu mice. Mice were
inoculated s.c. with MKN-28 (high ADAM9 protease
activity) cells. At 3 weeks after inoculating the cells, when
the tumor volumes reached around 100 mm3, mice were
split into two groups and treated with either saline or
50 mg/kg RAV-18 intraperitoneally for 2 weeks. The
RAV-18–treated group showed suppressed tumor growth
compared with the saline-treated group (mean tumor
volume: 692 219 vs. 1,568 557 mm3; P < 0.01; Fig. 6A).
Subsequently, MKN-28 cells were inoculated intraperitoneally into mice. After 3 weeks, saline and RAV18 were administered as above. At 5 weeks of treatment,
tumor nodules were significantly smaller in the RAV-18
group compared with the control group; the average
tumor nodules in RAV-18–treated group were 58.3 17.8, while those of the control were 96.3 19.6, indicating a 40% reduction of tumor formation (Supplementary Fig. S4; P ¼ 0.0001). Immunoblot showed a decrease
of phospho-EGFR and phospho-ERK expression following RAV-18 treatment as had been seen in vitro
studies. The average p-EGFR histoscore of the control
Molecular Cancer Therapeutics
Downloaded from mct.aacrjournals.org on December 22, 2014. © 2014 American Association for Cancer
Research.
Published OnlineFirst October 24, 2014; DOI: 10.1158/1535-7163.MCT-13-1001
ADAM9 in Gastric Cancer
A
D
140
Protease activity (%)
120
*
*
*
*
100
*
*
*
High ADAM9
SNU-638
0 0.2 2 20
Low ADAM9
YCC-1
MKN-28
MKN-74
0 0.2 2 20
0 0.2 2 20
0 0.2 2 20
YCC-6
YCC-7
Hs746T
0 0.2 2 20 0 0.2 2 20 0 0.2 2 20
RAV-18
(µg/mL)
pEGFR
(170 kDa)
*
EGFR
(170 kDa)
80
0 μg/mL
0.2 μg/mL
60
pERK
(42/44 kDa)
2 μg/mL
20 μg/mL
40
ERK
(42/44 kDa)
20
GAPDH
(36 kDa)
0
SNU-638
YCC-1
MKN-74
MKN-28
YCC-6
YCC-7
Cell lines
B
(*, P < 0.05)
140
SNU-638
200
120
YCC-1
120
*
100
150
*
100
50
*
*
*
0
1
2
70
3
4
60
*
40
6
0
*
*
*
*
20
5
1
2
3
4
100
*
80
80
*
60
60
*
40
*
20
5
100
MKN-74
0
6
2
3
*
40
*
20
*
*
*
*
1
MKN-28
*
*
0
4
5
6
1
2
3
4
5
YCC-7
120
HS-746T
60
0 μg/mL
50
100
50
40
80
40
30
60
30
0.2 μg/mL
2 μg/mL
20
40
20
20 μg/mL
10
20
10
0
0
0
1
2
3
4
5
6
1
2
3
4
5
6
1
2
3
4
5
6
(*, P < 0.05)
Days
High ADAM-9
C
SNU-638
YCC-1
MKN-74
6
70
140
YCC-6
60
*
80
*
120
140
160
250
No. of cells
HS-746T
140
Low ADAM-9
MKN-28
YCC-7
Hs746T
120
*
*
*
*
*
*
*
*
0
0.2
2
Invasiveness (%)
RAV-18 conc. (mg/mL)
100
0 μg/mL
80
0.2 μg/mL
60
2 μg/mL
40
20 μg/mL
20
20
0
SNU-638 YCC-1 MKN-74 MKN-28 YCC-7 HS-746T
Cell lines
Figure 3. Changes in ADAM9 protease activities, invasion, and proliferation with treatment of RAV-18. A, when cells with high ADAM9 protease activity
were treated with RAV-18, a dose-dependent decrease in protease activity was seen (from SNU-638 to MKN-28). However, cell lines with low ADAM9
protease activity showed no change in protease activities (from YCC-6 to Hs746T). B, cell lines with high ADAM9 activity treated with RAV-18
showed dose-dependent inhibition of proliferation. However, the proliferation of cell lines with low ADAM9 activity was not inhibited. C, RAV-18 also
dose-dependently reduced invasiveness in cell lines with high ADAM9 activity, but did not influence invasiveness of low activity cells ( , P < 0.05).
D, when cell lines were treated with RAV-18, pEGFR, and pERK, expression was dose-dependently decreased in cell lines expressing high ADAM9;
low ADAM9-expressing cell lines did not demonstrate a change.
www.aacrjournals.org
Mol Cancer Ther; 13(12) December 2014
Downloaded from mct.aacrjournals.org on December 22, 2014. © 2014 American Association for Cancer
Research.
OF7
Published OnlineFirst October 24, 2014; DOI: 10.1158/1535-7163.MCT-13-1001
Kim et al.
A
B
350
*
*
*
160
250
Control
HPX + 0 μg/mL
HPX + 0.2 μg/mL
HPX + 2 μg/mL
HPX + 20 μg/mL
200
150
100
*
180
*
*
300
*
*
*
200
Invasiveness (%)
ADAM-9 protease activity
(arbitrary unit)
400
*
*
*
*
140
120
NMX
HPX
HPX + 0.2 μg/mL
HPX + 2 μg/mL
HPX + 20 μg/mL
100
50
80
60
40
0
YCC-6
YCC-7
Cell lines
20
HS-746T
0
YCC-7
HS-746T
Cell lines
C
YCC-6
Hypoxia
RAV-18 (mg/mL)
YCC-7
–
+
+
+
+
– +
0
0
0.2
2
20
0
0
Hs746T
+
+
+
–
+
+
+
+
0.2
2
20
0
0
0.2
2
20
pEGFR
(170 kDa)
EGFR
(170 kDa)
pERK
(42/44 kDa)
ERK
(42/44 kDa)
α-Tubulin
(52 kDa)
Figure 4. Modulation of ADAM9 protease activity, invasion, and downward signaling in gastric cancer cells under hypoxic condition. A, ADAM9 protease
activities were increased in hypoxic conditions. When treated with RAV-18, ADAM9 protease activities were dose-dependently decreased. B,
invasiveness also increased in hypoxia and was decreased following RAV-18 treatment ( , P < 0.05). C, after exposure to hypoxia, EGFR and ERK
expression was increased in all low ADAM9 cell lines. In addition, phospho-EGFR and phospho-ERK expressions were dose-dependently decreased
when cells received RAV-18 treatment.
group was 188.1 68.4, while that of the RAV-18 group
was 98.6 34.9 (P ¼ 0.018). The average p-ERK histoscore was 139.3 35.7 in the control group and 63.4 21.2 in the RAV-18 group (P ¼ 0.002; Fig. 6B and C).
These findings suggest that ADAM9 protease activity
regulates gastric cancer tumorigenesis, including in a
model for intraperitoneal tumor spread, and may be a
therapeutic target in gastric cancer.
Discussion
In this study, we have demonstrated that ADAM9 is
expressed in gastric cancer cells, which is related to cancer
proliferation and invasion. In addition, using the protease
domain-specific blocking antibody RAV-18, we showed
that this effect depends on the protease activity of
ADAM9. The level of the ADAM9 enzymatic activity in
cells with low ADAM9 expression is induced by hypoxia,
and inhibited by RAV-18. We further showed that
ADAM9 protease activity regulates gastric cancer tumorigenesis, including intraperitoneal metastatic spread.
OF8
Mol Cancer Ther; 13(12) December 2014
Taken together, these findings suggest that inhibition of
ADAM9 activity is a rational therapeutic approach to
suppress gastric cancer progression and metastasis.
There has been an earlier report demonstrating that
ADAM9 transcription is increased in gastric cancer (12).
Although little is known about the regulatory mechanism of ADAM9, some recent evidences suggest that a
role for posttranslational modification is more important. In one prostate cancer model, induction of ADAM9
is regulated by stress through the accumulation of reactive oxygen species (ROS) as a common mediator,
and removing ROS, or the use of antioxidants resulted
in a marked reduction of ADAM9 (11). These findings
suggest a link between stress-induced signaling and
ADAM9, with ROS serving as a common mediator
(15). We have shown that another stress factor, hypoxia,
a common feature found in many solid tumors, leads to
an increase in the expression of ADAM9 protein alongside enzymatic activity in HIF1-dependent way. We
found that posttranslational modification and processing to a "mature" cleaved (84 kDa) form, is correlated
Molecular Cancer Therapeutics
Downloaded from mct.aacrjournals.org on December 22, 2014. © 2014 American Association for Cancer
Research.
Published OnlineFirst October 24, 2014; DOI: 10.1158/1535-7163.MCT-13-1001
ADAM9 in Gastric Cancer
*
A
ADAM9 protease activity
(arbitrary unit)
*
*
*
*
350
*
*
300
NMX
250
HPX
200
HPX + negative siRNA
150
HPX + siHIF
100
HPX + siHIF + RAV
50
0
YCC-6
YCC-7
Cell lines
HS-746T
B
Absorbance (at 570 nm)
Figure 5. HIF1a regulates the
ADAM9 expression under hypoxic
condition. A, hypoxia-dependent
ADAM9 protease activity was
decreased when cells were treated
with HIF1a siRNA under hypoxic
condition. HIF1a siRNA and RAV18 combined to inhibit ADAM9
protease activity more than HIF1a
siRNA treatment alone ( , P < 0.05).
NMX, normoxia; HPX, hypoxia;
siHIF, siRNA against HIF1a; and
RAV, RAV-18. B, cell proliferation
was increased in low ADAM9 cells
under hypoxic condition and
decreased by HIF1a siRNA
transfection of cells ( , P < 0.05). NC, control on normoxia; H-C,
control on hypoxia; H-N, negative
siRNA on hypoxia; H-H, siRNA
against HIF1a on hypoxia; H-R,
RAV-18 on hypoxia; and H-H-R,
combination of siHIF1a and RAV18 on hypoxia. C, increased
expression of HIF1a as well as
ADAM9 and its downstream
signaling was inhibited by HIF1a
siRNA transfection. When HIF1a
siRNA and RAV-18 were used in
combination, HIF1a expression
was not changed compared with
HIF1a siRNA treatment alone.
However, phospho-EGFR and
phospho-ERK expression was
decreased more than HIF1a siRNA
treatment alone. Phospho-AKT
expression was not changed when
HIF1a siRNA, with or without RAV18, was used. N. negative siRNA;
H, siRNA against HIF1a.
*
*
400
1
0.9
0.8
0.7
0.6
0.5
0.4
0.3
0.2
0.1
0
0.8
YCC-6
0.9
YCC-7
* 0.6
**
0.5
0.4
0.4
0.3
2
3
0.3
0.2
0.2
0.1
0.1
0
1
4
*
*
0.7
* 0.6
* 0.5
1
Hs746T
0.8
0.7
2
3
0
1
4
2
3
N-C
H-C
H-N
H-H
H-R
H-H-R
4
Days
C
YCC-6
RAV-18 (20 mg/mL)
Hypoxia
-
+
1
3.6
N
+
YCC-7
H
+
H
+
+
2.7 0.7
0.7
-
Hs746T
+
N
+
H
+
H
+
+
-
+
N
+
H
+
H
+
+
1
5.8
5.3
1.3
1.2
1
2.6
2.6
0.7
0.7
4.1
4.1
1.2
1.1
1
1.9
1.2
1
HIF1α
ADAM9
1
1.8
0.7
0.2
0.2
1
1
2.3
2.1
1.5
0.4
1
3.7
2.4
1
1.8
1.9
2.0
2.0
1
2.9
3.0
2.7
2.8
1
1.6
1.7
1.7
1.5
1
1.4
1.4
1.3
1
1.3
1.3
1.3
1.3
1
1.1
1.1
1.1
1.9
0.4
0.2
1
3.8
7.8
7.8
5.9
1
2.2
7.8
8.4
7.5
7.6
3.1
3.0
2.3
1.1
1
1.2
1.2
1.2
1.2
1.3
1
1.4
1.5
1.3
1.3
1.0
1
1.2
1.1
1.2
1.2
pEGFR
EGFR
pAKT
AKT
pERK
1
1.9
3.9
1.0
0.0
1
1.4
1.3
1.2
1.1
ERK
1
7.7
1.7
1.8
1.6
1
37.6
41.9 41.9 37.2
α-Tubulin
with its enzymatic activity. Although all ADAMs possess the matrix metalloproteinase (MMP)–like domain
adjacent to the prodomain, only 50% exhibit protease
activity. Currently, protease activity is the best-defined
function of ADAMs, with most putative substrates currently identified as being transmembrane proteins (16).
One of the limitations of our study is the substrate
we used for ADAM9 protease activity is not only specific
to ADAM9, but also reactive to other ADAMs—especially
ADAM10 and ADAM17 (17–21). As in Supplementary
Fig. S5, (i) changes of protease activity after siRNA knockdown is dependent on basal expression level of each
www.aacrjournals.org
ADAM, and (ii) when cotreated with RAV-18, additive
effect is prominent only in high ADAM9-expressing
cells, implying that RAV-18 works specifically to ADAM9.
Several explanations are possible about how ADAM9
plays a role in cancer progression. There is evidence that
ADAM9 mediates the release of growth factor ligands,
which regulate EGFR signaling. In the stomach, transactivation of the EGFR by peptides, such as gastrin,
angiotensin II, bradykinin, bombesin, or substance P,
is mediated by shedding of EGFR ligands by ADAMs
(22, 23). ADAM9 also releases some transmembrane
protein-derived ligands, such as heparin-binding EGF,
Mol Cancer Ther; 13(12) December 2014
Downloaded from mct.aacrjournals.org on December 22, 2014. © 2014 American Association for Cancer
Research.
OF9
Published OnlineFirst October 24, 2014; DOI: 10.1158/1535-7163.MCT-13-1001
Kim et al.
A
2,100
Tumor volume (mm3)
Control
RAV-18
1,800
1,500
*
1,200
Control
RAV-18 treat.
900
600
300
0
D1
B
Control
D4
D7
D11
D14 D18
RAV-18 treat.
Control
RAV-18 treat.
P = 0.018
250
P = 0.002
Histoscore
200
EGFR
(170 kDa)
100
pERK
(42/44 kDa)
50
ERK
(42/44 kDa)
0
p-EGFR
p-ERK
C
Control
C
RAV-18 treat.
pEGFR
(170 kDa)
150
pEGFR
pERK
D35
(*, P < 0.01)
C
300
H&E
ADAM9
D21 D25 D28 D32
Days after RAV-18 treatment
GAPDH
(36 kDa)
Figure 6. In vivo xenograft model of ADAM9. A, photographs of tumors from control and RAV-18–treated groups. Tumor volumes increased in both
control and RAV-18–treated groups; however, the tumor volumes of the control group were larger than in the RAV-18–treated group (P < 0.01). B,
representative phospho-EGFR and phospho-ERK immunostaining (original images were captured at 400 magnification) and H&E staining.
Average of phospho-EGFR histoscores in the control group was approximately two times higher than in the RAV-18–treated group (P ¼ 0.018).
Furthermore, the average phospho-ERK histoscores in controls was approximately three times higher than in RAV-18–treated groups (P ¼ 0.002).
C, Western blot analysis showed that phospho-EGFR and phospho-ERK expressions were lower in the RAV-18–treated group. C, MKN-28 cell
whole lysate.
amphiregulin, TGFa, and TNFa (24, 25). We herein
found that ADAM9 knockdown blocks EGFR phosphorylation and downstream ERK activation, and that
RAV-18 inhibited tumor growth, in line with EGFR and
ERK phosphorylation in vivo. Thus, inhibition of EGFR
ligand shedding by ADAM9 with subsequent decreased
EGFR activation and downstream signaling could be a
mechanism for the antitumor activity of RAV-18.
It is intriguing that hypoxia induces ADAM9 activity,
relating to cancer cell proliferation and invasion, which
is reversed by RAV-18 although not beyond the levels in
normoxia. This does not appear to be related to the
processing of ADAM9 to the cleaved form as this was
detected in both low and high ADAM9-expressing cell
lines. We speculate that there are two forms of ADAM9,
one not responsive to inhibition by RAV-18, which is
perhaps intracellular located or masked, and another
induced by hypoxia that is accessible to inhibition by
RAV-18, that is responsible for the growth stimulatory
and invasive effects of ADAM9. Another point is that
ADAM9 was induced by hypoxia in Hs746T cells but its
OF10
Mol Cancer Ther; 13(12) December 2014
downstream signaling was not altered by HIF1a knockdown or RAV-18 treatment. It is possible that Hs746T
is more dependent on other ADAM proteins—such as
ADAM10 and ADMA17—rather than ADAM9 for its
biologic activity, as shown in Supplementary Fig. S2.
We have shown that proliferation and invasion is
affected by RAV18, but not adhesion. The disintegrin
domain is found in all ADAMs and is located downstream of the metalloproteinase domain. We believe
that adhesion proteins are important for cellular adhesion, migration, and signal transduction (26). However,
most information on the binding of disintegrin to integrin comes from in vitro studies using recombinant disintegrin domains (16). Thus, the biologic relevance of
our finding that RAV-18 does not alter adhesion is
unclear at this time.
Our in vivo studies demonstrate that ADAM9-targeting
antibody is a reasonable option for treatment of gastric
cancer. One limitation is lack of information on the actual
incidence of ADAM9 expression in large-scale clinical
samples. Our results suggest that only high-level
Molecular Cancer Therapeutics
Downloaded from mct.aacrjournals.org on December 22, 2014. © 2014 American Association for Cancer
Research.
Published OnlineFirst October 24, 2014; DOI: 10.1158/1535-7163.MCT-13-1001
ADAM9 in Gastric Cancer
ADAM9-expressing tumors, and those where ADAM9 is
induced in response to hypoxia, will be responsive to
ADAM9 antibody. The subcellular location of ADAM9
could also play a role in the response to antibody
treatment.
Collectively, our work shows that ADAM9 plays an
important role in gastric cancer proliferation and invasion, and that while expressed at high levels in some
cancer cells that are responsive to functional inhibition
and antitumor activity of a catalytic site–directed antibody, other gastric cancer cells have low levels of expression and only when exposed to hypoxia do ADAM9 levels
increase and the cells become responsive to anti-ADAM9
treatment. These finding suggest that ADAM9 could be
an effective therapeutic target for therapy of metastatic
gastric cancer.
Disclosure of Potential Conflicts of Interest
No potential conflicts of interest were disclosed.
Authors' Contributions
Conception and design: J.M. Kim, H.-C. Jeung, S.Y. Rha, E.J. Yu, K.H. Park,
H.C. Chung
Development of methodology: J.M. Kim, T.S. Kim, K.H. Park
Acquisition of data (provided animals, acquired and managed
patients, provided facilities, etc.): J.M. Kim, H.-C. Jeung, S.Y. Rha,
Y.K. Shin, K.H. Park
Analysis and interpretation of data (e.g., statistical analysis, biostatistics, computational analysis): J.M. Kim, H.-C. Jeung, S.Y. Rha,
T.S. Kim, Y.K. Shin, X. Zhang, H.C. Chung, G. Powis
Writing, review, and/or revision of the manuscript: J.M. Kim, H.-C. Jeung,
G. Powis
Administrative, technical, or material support (i.e., reporting or organizing data, constructing databases): J.M. Kim, H.-C. Jeung, S.Y. Rha
Study supervision: H.-C. Jeung, S.Y. Rha, S.W. Park, H.C. Chung
Acknowledgments
The authors thank Macrogenics Incorporation for generously supporting the ADAM9 inhibitor RAV-18.
Grant Support
For this study, H.C. Jeung received a grant from the National R&D
Program for Cancer Control, Ministry of Health & Welfare, Republic
of Korea (1420060). G. Powis was supported by grants CA163541 and
CA172670 from the National Cancer Institute. J.M. Kim, H.C. Jeung,
S.Y. Rha, T.S. Kim, K.H. Park, and H.C. Chung received the Public Welfare
and Safety Research Program through the National Research Foundation
of Korea (NRF) funded by the Ministry of Education, Science and Technology (2010-0020841).
The costs of publication of this article were defrayed in part by the
payment of page charges. This article must therefore be hereby marked
advertisement in accordance with 18 U.S.C. Section 1734 solely to indicate
this fact.
Received December 13, 2013; revised September 16, 2014; accepted
September 21, 2014; published OnlineFirst October 24, 2014.
References
1.
Albelda SM. Role of integrins and other cell adhesion molecules in
tumor progression and metastasis. Lab Invest 1993;68:4–17.
2. Nicolson GL. Tumor and host molecules important in the organ
preference of metastasis. Semin Cancer Biol 1991;2:143–54.
3. Hanahan D, Weinberg RA. The hallmarks of cancer. Cell 2000;100:
57–70.
4. Becherer JD, Blobel CP. Biochemical properties and functions of
membrane-anchored metalloprotease-disintegrin proteins (ADAMs).
Curr Top Dev Biol 2003;54:101–23.
€tzmann R, Lu
€ttges J, Sipos B, Ammerpohl O, Dobrowolski F,
5. Gru
Alldinger I, et al. ADAM9 expression in pancreatic cancer is associated
with tumour type and is a prognostic factor in ductal adenocarcinoma.
Br J Cancer 2004;90:1053–8.
6. Hirao T, Nanba D, Tanaka M, Ishiguro H, Kinugasa Y, Doki Y, et al.
Overexpression of ADAM9 enhances growth factor-mediated recycling of E-cadherin in human colon cancer cell line HT29 cells. Exp Cell
Res 2006;312:331–9.
€ cken C.
7. Lendeckel U, Kohl J, Arndt M, Carl McGrath S, Donat H, Ro
Increased expression of ADAM family members in human breast
cancer and breast cancer cell lines. J Cancer Res Clin Oncol
2005;131:41–8.
8. Yamada D, Ohuchida K, Mizumoto K, Ohhashi S, Yu J, Egami T, et al.
Increased expression of ADAM 9 and ADAM 15 mRNA in pancreatic
cancer. Anticancer Res 2007;27:793–9.
9. Edwards DR, Handsley M, Pennington CJ. The ADAM metalloproteinases. Mol Aspects Med 2008;29:258–89.
10. Fischer OM, Hart S, Gschwind A, Prenzel N, Ullrich A. Oxidative and
osmotic stress signaling in tumor cells is mediated by ADAM proteases
and heparin-binding epidermal growth factor. Mol Cell Biol 2004;24:
5172–83.
11. Sung SY, Kubo H, Shigemura K, Arnold RS, Logani S, Wang R, et al.
Oxidative stress induces ADAM9 protein expression in human prostate
cancer cells. Cancer Res 2006;66:9519–26.
12. Carl-McGrath S, Lendeckel U, Ebert M, Roessner A, Rcken C. The
disintegrin-metalloproteinases ADAM9, ADAM12, and ADAM15 are
upregulated in gastric cancer. Int J Oncol 2005;26:17–24.
www.aacrjournals.org
13. Cisse MA, Gandreuil C, Hernandez J, Martinez J, Checler F, Vincent B.
Design and characterization of a novel cellular prion-derived quenched
fluorimetric substrate of alpha-secretase. Biochem Biophys Res Commun 2006;347:254–60.
14. Roghani M, Becherer JD, Moss ML, Atherton RE, Erdjument-Bromage
H, Arribas J, et al. Metalloprotease–disintegrin MDC9: intracellular
maturation and catalytic activity. J Biol Chem 1999;274:3531–40.
15. Shigemura K, Sung SY, Kubo H, Arnold RS, Fujisawa M, Gotoh A, et al.
Reactive oxygen species mediate androgen receptor- and serum
starvation-elicited downstream signaling of ADAM9 expression in
human prostate cancer cells. Prostate 2007;67:722–31.
16. Duffy MJ, Mullooly M, O'Donovan N, Sukor S, Crown J, Pierce A, et al.
The ADAMs family of proteases: new biomarkers and therapeutic
targets for cancer? Clin Proteomics 2011;8:9.
~
17. Canault M, Leroyer AS, Peiretti F, LesAche
G, Tedgui A, Bonardo B,
et al. Microparticles of human atherosclerotic plaques enhance the
shedding of the tumor necrosis factor-alpha converting enzyme/
ADAM17 substrates, tumor necrosis factor and tumor necrosis factor
receptor-1. Am J Pathol 2007;171:1713–23.
18. Reiss K, Cornelsen I, Husmann M, Gimpl G, Bhakdi S. Unsaturated
fatty acids drive disintegrin and metalloproteinase (ADAM)-dependent
cell adhesion, proliferation, and migration by modulating membrane
fluidity. J Biol Chem 2011;286:26931–42.
19. Barsoum IB, Hamilton TK, Li X, Cotechini T, Miles EA, Siemens DR,
et al. Hypoxia induces escape from innate immunity in cancer cells via
increased expression of ADAM10: role of nitric oxide. Cancer Res
2011;71:7433–41.
20. Guo J, He L, Yuan P, Wang P, Lu Y, Tong F, et al. ADAM10 overexpression in human non-small cell lung cancer correlates with cell
migration and invasion through the activation of the Notch1 signaling
pathway. Oncol Rep 2012;28:1709–18.
21. Shou Z, Jin X, Zhao Z. Upregulated expression of ADAM17 is a
prognostic marker for patients with gastric cancer. Ann Surg 2012;
256:1014–22.
22. Miyazaki Y, Shinomura Y, Tsutsui S, Zushi S, Higashimoto Y,
Kanayama S, et al. Gastrin induces heparin-binding epidermal growth
Mol Cancer Ther; 13(12) December 2014
Downloaded from mct.aacrjournals.org on December 22, 2014. © 2014 American Association for Cancer
Research.
OF11
Published OnlineFirst October 24, 2014; DOI: 10.1158/1535-7163.MCT-13-1001
Kim et al.
factor-like growth factor in rat gastric epithelial cells transfected with
gastrin receptor. Gastroenterology 1999;116:78–89.
23. Park JW, Baek NS, Lee SC, Oh SJ, Jang SH, Kim IH, et al. Preclinical
efficacy testing for stomach and liver cancers. Cancer Res Treat
2014;46:186–93.
24. Izumi Y, Hirata M, Hasuwa H, Iwamoto R, Umata T, Miyado K, et al.
A metalloprotease-disintegrin, MDC9/meltrin-gamma/ADAM9 and
OF12
Mol Cancer Ther; 13(12) December 2014
PKCdelta are involved in TPA-induced ectodomain shedding of membrane-anchored heparin-binding EGF-like growth factor. EMBO J
1998;17:7260–72.
25. Schfer B, Gschwind A, Ullrich A. Multiple G-protein–coupled receptor
signals converge on the epidermal growth factor receptor to promote
migration and invasion. Oncogene 2004;23:991–9.
26. Stupack DG. The biology of integrins. Oncology 2007;21:6–12.
Molecular Cancer Therapeutics
Downloaded from mct.aacrjournals.org on December 22, 2014. © 2014 American Association for Cancer
Research.
Published OnlineFirst October 24, 2014; DOI: 10.1158/1535-7163.MCT-13-1001
The Effect of Disintegrin−Metalloproteinase ADAM9 in
Gastric Cancer Progression
Jeong Min Kim, Hei-Cheul Jeung, Sun Young Rha, et al.
Mol Cancer Ther Published OnlineFirst October 24, 2014.
Updated version
Supplementary
Material
E-mail alerts
Reprints and
Subscriptions
Permissions
Access the most recent version of this article at:
doi:10.1158/1535-7163.MCT-13-1001
Access the most recent supplemental material at:
http://mct.aacrjournals.org/content/suppl/2014/10/24/1535-7163.MCT-13-1001.DC1.html
Sign up to receive free email-alerts related to this article or journal.
To order reprints of this article or to subscribe to the journal, contact the AACR Publications
Department at [email protected].
To request permission to re-use all or part of this article, contact the AACR Publications
Department at [email protected].
Downloaded from mct.aacrjournals.org on December 22, 2014. © 2014 American Association for Cancer
Research.


© Copyright 2026