
Author Manuscript Published OnlineFirst on March 16, 2012; DOI: 10.1158/1078-0432.CCR-12-0455
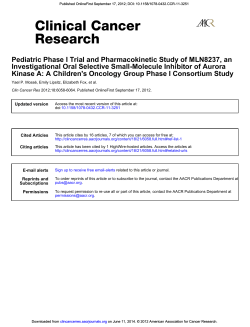
Author Manuscript Published OnlineFirst on March 16, 2012; DOI: 10.1158/1078-0432.CCR-12-0455
Author manuscripts have been peer reviewed and accepted for publication but have not yet been edited.
Competing risk analyses: how are they different and why should
you care?
Richard J. Chappell
Clin Cancer Res Published OnlineFirst March 16, 2012.
Updated version
Supplementary
Material
Author
Manuscript
E-mail alerts
Reprints and
Subscriptions
Permissions
Access the most recent version of this article at:
doi:10.1158/1078-0432.CCR-12-0455
Access the most recent supplemental material at:
http://clincancerres.aacrjournals.org/content/suppl/2012/04/11/1078-0432.CCR-12-0455.DC1.html
Author manuscripts have been peer reviewed and accepted for publication but have not yet been
edited.
Sign up to receive free email-alerts related to this article or journal.
To order reprints of this article or to subscribe to the journal, contact the AACR Publications
Department at [email protected].
To request permission to re-use all or part of this article, contact the AACR Publications
Department at [email protected].
Downloaded from clincancerres.aacrjournals.org on October 1, 2014. © 2012 American Association for Cancer
Research.
Author Manuscript Published OnlineFirst on March 16, 2012; DOI: 10.1158/1078-0432.CCR-12-0455
Author manuscripts have been peer reviewed and accepted for publication but have not yet been edited.
Competing risk analyses: how are they different and why should you care?
Rick Chappell, Ph.D.
Department of Biostatistics and Medical Informatics
University of Wisconsin School of Medicine and Public Health
600 Highland Avenue
Madison, WI 53792-4675
(608) 263-5572
[email protected]
Running title: A competing risks primer
Summary/Abstract
Competing risks are events in which at least one precludes the observation of the
other, such as toxicity and death. This Commentary discusses and distinguishes
between the two common types of competing risk analyses, the Kaplan-Meier and
Cumulative Incidence curves.
In this issue of Clinical Cancer Research, Dignam et al. [1] discussed how to choose
competing risks regression models to evaluate the association between predictors
and cause-specific failures of interest. They differentiate the situations in which this
choice is important from those where it makes little difference using an RTOG trial
of prostate cancer as a nice example. The point of this commentary is to present
some background to the issue and, as its title implies, to show how the two principle
types of competing risks analysis' interpretations differ from each other. I restrict
myself to the one-sample case, and conclude that though each analysis can be the
right thing to do, they answer different questions. This conclusion also extends to
the multivariable models which are the subject of Dignam, et al.'s investigations.
Consider a treatment failure associated with a time such as late toxicity due to
radiation or death in remission after bone marrow transplant in acute
lymphoblastic leukemia (ALL) patients, both discussed below. Each failure is
subject to a so-called competing risk, or censoring, meaning that some other event
interferes with our observation of it. The competing risk may be the happy
circumstance of the study ending with a patient lacking evidence of toxicity or
death, or it may a different failure such as death in the first case or recurrence in the
second. Regardless, it must be accounted for in estimating failure rates. The first
way of doing so, in terms of priority and popularity, is the traditional Kaplan-Meier
1
Downloaded from clincancerres.aacrjournals.org on October 1, 2014. © 2012 American Association for Cancer
Research.
Author Manuscript Published OnlineFirst on March 16, 2012; DOI: 10.1158/1078-0432.CCR-12-0455
Author manuscripts have been peer reviewed and accepted for publication but have not yet been edited.
(KM) estimate [2]. It estimates the probability of a failure in the absence of the
competing risk - it mathematically factors it out. The second and increasingly
common method of assessing failure rates is by using the cumulative incidence (CI)
curve to estimate the probability of failures actually observed in patients who are
subject to censoring by the competing risk [3]. The crux of the distinction between
the italicized phrases lies in the effect of the competing risk on the estimates: it
doesn't change the Kaplan-Meier curve (besides reducing the effective sample size);
but by removing patients from being subject to failure, it will lower the cumulative
incidence. Two examples should render this point intelligible.
The first example consists of what academics prefer to call a “spirited discussion” in
the pages of the Red Journal. In 1994 Caplan, et al. [4] launched a firm critique of
the Kaplan-Meier (KM) curve for estimating rates of cause-specific failures such as
late complications of radiation. They point out that the KM estimates of component
causes of failure would sum to more than the KM estimate of any cause. This is
correct: to take an extreme example, with sufficient follow-up the KM estimate of
cause of death due to heart disease would eventually equal one, or nearly so, as
would the estimates of death due to cancer, kidney disease, etc. These clearly sum
to more than unity, the all cause long-term probability of death [5]. This is because
the KM curve estimates probabilities of one failure in the absence of any others. On
the other hand, the CI curves of each of these causes of death will sum to the CI of
any death. Caplan, et al. concluded that KM analysis of cause-specific failure “should
be avoided … in favor of appropriate methods [CI curves].” Bentzen, et al. [6] and
Denham, et al. [7] equally strongly endorsed KM in their rebuttal. Their logic,
summarized by Bentzen et al., was that “The reason is that this type of estimate [the
CI function] is not specific for the endpoint of interest but is affected by the risk of
the competing events as well.” That is, if a late complication is uncommon because
most patients die of their disease then the cumulative incidence will be low while
the KM could be high: remember, KM estimates late complication rates only among
survivors. (The only point which all authors held in common was their dislike of
giving crude proportions, that is the total fraction of patients who had late toxicities.
These figures are not adjusted for follow-up in any way; thus shorter studies have
lower rates.)
Which method is preferable? It depends on the use to which the results are to be
put. Chappell [8], in an attempt to get in the last word, asked readers to consider a
nonce example in which a population of patients has an 80% mortality rate during
the first year of disease with no subsequent events. Suppose also that all survivors
exhibit complications by three years. Then CI would give a 20% estimate of gross
toxicity at three years along with an 80% estimate of death. That is, only 20% of
patients will have toxicities because the rest died too soon. KM, on the other hand,
would estimate a 100% toxicity rate among patients who survive three years as well
as the 80% mortality. This is no contradiction – the choice depends on the status of
the competing risk, death. To a radiation biologist or other theorist seeking to
characterize the toxicity process (perhaps out of interest in applying the same
regimen to a different group of patients with better prognoses), death is a nuisance
2
Downloaded from clincancerres.aacrjournals.org on October 1, 2014. © 2012 American Association for Cancer
Research.
Author Manuscript Published OnlineFirst on March 16, 2012; DOI: 10.1158/1078-0432.CCR-12-0455
Author manuscripts have been peer reviewed and accepted for publication but have not yet been edited.
to be factored out and KM would be the right method. But to a patient or physician,
death is a quite relevant event and the low chance of toxicity as estimated by CI
might be worth possibly extending quality or quantity of life.
I end with a numerical example taken from Klein & Moeschberger [9], to whom I
recommend the reader who wants a more thorough explanation of the data and
calculations. They consider outcomes among 38 patients who received bone
marrow transplant for ALL. The time scale is days after transplant, and one quantity
of interest is the chance of a patient dying in remission. The opportunity for this
failure to occur is clearly obviated by recurrence as a competing risk. The KM and CI
estimates are plotted in the Figure (because KM curves traditionally start at one and
decrease to zero, one minus KM is shown here for comparability). We see that, as
is generally the case, KM exceeds CI. This is because KM estimates the probability of
death in remission assuming no relapse occurs, and CI estimates the probability of
death in remission among all patients whose pattern of relapses is similar to that
observed in our data. The CI curve is naturally lower because relapsed patients
count as a “success” (in terms of death in relapse), while for the KM curve they are
eliminated from consideration. The preference again depends upon the question
which is being asked and the purposes to which the answer will be put. CI gives the
“real-world” chances of an event and KM is more informative about the medical
processes involved in treatment-related mortality.
Dignam, et al. extend the KM and CI methods to include covariates with what they
label the “Cox CHR” and “Fine-Gray SHR” models, respectively. I hope that the
reader has survived this commentary with some intuition about the Kaplan-Meier
and cumulative incidence forms of survival curve estimation and, thus enlightened,
proceeds to read Dignam et al.’s important work on the topic.
[1]
Dignam JJ, Zhang Q, Kocherginsky MN. The use and interpretation of
competing risks regression models. Clin Cancer Res 2012;18.
[2]
Kaplan EL, Meier P. Nonparametric estimation from incomplete observations. J
Am Stat Assoc 1958; 53:457-481.
[3]
Satagopan JM, Ben-Porat L, Berwick M, Robson M, Kutler D, Auerbach AD. A
note on competing risks in survival data analysis. Br J Cancer 2004; 91:1229-1235.
[4]
Caplan RJ, Pajak TF, Cox JD. Analysis of the probability and risk of causespecific failure. Int J Radiat Oncol Biol Phys 1994; 29:1183-1186.
[5]
http://en.wikiquote.org/wiki/John_Maynard_Keynes , accessed 3/2/2012: “In the
long run, we are all dead.”
3
Downloaded from clincancerres.aacrjournals.org on October 1, 2014. © 2012 American Association for Cancer
Research.
Author Manuscript Published OnlineFirst on March 16, 2012; DOI: 10.1158/1078-0432.CCR-12-0455
Author manuscripts have been peer reviewed and accepted for publication but have not yet been edited.
[6]
Bentzen SM, Vaeth M, Pedersen, DE, Overgaard, J. Why actuarial estimates
should be used in reporting late normal-tissue effects of cancer treatment … now! Int J
Radiat Oncol Biol Phys 1995; 32:1531-1534.
[7]
Denham JW, Hamilton CS, O’Brien P. Regarding actuarial late effect analyses:
Bentzen et al., IJROBP 32:1531-1534; 1995 and Caplan et al., IJFROBP 32:1547; 1995.
[8]
Chappell, R. Regarding actuarial late effect analyses: Bentzen et al., IJROBP
32:1531-1534; 1995 and Caplan et al., IJFROBP 36:988-989; 1996.
[9]
Klein J., Moeschberger, ML. Survival analysis: techniques for censored and
truncated data, 2nd ed. 2003. Springer-Verlag: New York, NY.
Caption to Figure
Figure 1. Estimated probability of death in remission via CI and KM method
ALL transplant data of Klein and Moeschberger. Cumulative incidence (dashed)
and one minus Kaplan-Meier (solid) curves for the probability of death in remission
using the bone marrow transplant in acute lymphoblastic leukemia data of Klein and
Moeschberger [9].
4
Downloaded from clincancerres.aacrjournals.org on October 1, 2014. © 2012 American Association for Cancer
Research.
0.1
Probability of death in remission
0.2
1 - Kaplan-Meier
Cumulative incidence
0.0
600
500
400
300
200
100
0
Days after transplant
© 2012 American Association for Cancer Research
Author Manuscript Published OnlineFirst on March 16, 2012; DOI: 10.1158/1078-0432.CCR-12-0455
Author manuscripts have been peer reviewed and accepted for publication but have not yet been edited.
0.3
Downloaded from clincancerres.aacrjournals.org on October 1, 2014. © 2012 American Association for Cancer
Research.
0.4


© Copyright 2026