
Rapid, transient, and frequency-specific topological
bioRxiv preprint first posted online December 19, 2014; doi: http://dx.doi.org/10.1101/012922; The copyright
holder for this preprint is the author/funder. All rights reserved. No reuse allowed without permission.
Rapid, transient, and frequency-specific topological
reorganization of cognitive networks
Authors: Michał Bola*, Bernhard A. Sabel
Institute of Medical Psychology, Medical Faculty, Otto-von-Guericke University of
Magdeburg, Magdeburg, Germany.
*Correspondence to:
Michał Bola
Otto von Guericke University
Institute of Medical Psychology
Leipziger Str. 44
Magdeburg, 39120, Germany
Email: [email protected]
Phone: +49 391 672 1800
Fax: +49 391 672 1803
Conflict of interest: The authors declare no competing financial interests.
Acknowledgements: The study was supported
by Otto-von-Guericke University of
Magdeburg, and by the BMBF network ERA-net Neuron “Restoration of Vision after Stroke
(REVIS)” (Grant nr 01EW1210).
bioRxiv preprint first posted online December 19, 2014; doi: http://dx.doi.org/10.1101/012922; The copyright
holder for this preprint is the author/funder. All rights reserved. No reuse allowed without permission.
Abstract
Cognition emerges from interactions within spatially distributed but synchronized brain networks. Such
networks are transient and dynamic, established on the timescale of milliseconds in order to perform specific
cognitive operations. But it is not known whether topological features of transient cognitive networks
contribute to cognitive processing. Cognition might merely change weights of intrinsic functional networks
or, conversely, cognitive processing might require qualitatively new topological arrangements. To address
this question, we recorded high-density EEG when subjects performed a visual discrimination task and
characterized source-space weighted functional networks with graph measures. We revealed rapid, transient,
and frequency-specific reorganization of the network’s topology during cognition. Specifically, cognitive
networks were characterized by strong clustering, low modularity, and strong interactions between hubnodes. Our findings suggest that dense and clustered connectivity between the hub nodes belonging to
different modules is the “network fingerprint” of cognition. Such reorganization patterns might facilitate
global integration of information and provide a substrate for a “global workspace” necessary for cognition
and consciousness to occur. Thus, characterizing topology of the event-related networks opens new vistas to
interpret cognitive dynamics in the broader conceptual framework of graph theory.
bioRxiv preprint first posted online December 19, 2014; doi: http://dx.doi.org/10.1101/012922; The copyright
holder for this preprint is the author/funder. All rights reserved. No reuse allowed without permission.
Introduction
Studying the brain “connectome” is an interdisciplinary and rapidly developing field with the premise that
understanding organization of brain networks will lead to a major leap forward in basic and clinical
neuroscience. Brain connectivity networks exhibit complex structure and emergent topological properties
which cannot be reduced to just the sum of pairwise interactions. Rather these topological features constitute
a whole new level of brain analysis. Therefore, patterns of anatomical and functional connectivity have been
extensively studied with measures developed within graph theory (review: Sporns et al., 2004; Bassett and
Bullmore, 2006; Stam, 2010; Park and Friston, 2013).
In graph theory topological arrangements are thought to facilitate or hamper the network’s information
processing capabilities (Newman, 2003; Sporns, 2013). Neuroscience provides support for this hypothesis
as, indeed, topology of brain resting-state functional networks predicts individual cognitive performance
(van den Heuvel et al., 2009; Langer et al., 2012). Further, functional networks reorganize towards more
advantageous arrangements during development (Boersma et al., 2011) but shift back towards a less optimal
structure in aging (Wang et al., 2010). Disrupted network organization is also a hallmark of numerous
pathological conditions including Alzheimer’s disease (Stam et al.,
2009), traumatic brain injury
(Caeyenberghs et al., 2012), unipolar depression (Lord et al., 2012), and vision loss (Bola et al., 2014).
Dynamics of brain network reorganization can be studied on multiple time-scales (Kopell et al., 2014).
Recognizing that steady, long-lasting changes in networks’ topology are related to changing cognitive
capabilities has greatly advanced our understanding of development and neurodegeneration. But transient
cognitive networks, established and dissolved on the timescale of milliseconds, are typically not
characterized in terms of topological arrangements. It is not clear whether networks’ structure reorganizes
during cognitive processing and, if it does, what is the specific reorganization pattern. Two scenarios might
be considered. Cognitive operations might merely change the weights of connections with networks’ global
topology remaining fixed, not modifiable on the fast time-scale. Several neurophysiological (Bassett et al.,
2006; Nicol et al., 2012; Betti et al., 2012; Jin et al., 2012) and fMRI studies (Cole et al., 2014) lend support
to this hypothesis. The second possibility is that cognition might involve qualitatively new topological
arrangements of networks. Such reorganization was already postulated by the global workspace theory
(Baars, 2002; Baars et al., 2013; Dehaene and Changeux, 2011) and observed in a number of M/EEG
(Valencia et al., 2008; Doron et al., 2012; Palva et al., 2010; Kitzbichler et al., 2011; de Vico Fallani et al.,
2008) and fMRI studies (Bassett et al., 2011, 2013; Ekman et al., 2012; Mennes et al., 2013).
Discovering the pattern of cognition-related reorganization would open new vistas to interpret cognitive
operations within the conceptual framework of graph theory and network science. We therefore set out to
study topological properties of brain functional networks during visual perception and cognition. We
recorded EEG during performance of a visual oddball task and conducted an event-related network analysis
bioRxiv preprint first posted online December 19, 2014; doi: http://dx.doi.org/10.1101/012922; The copyright
holder for this preprint is the author/funder. All rights reserved. No reuse allowed without permission.
(ERNA) where topology of source-space phase-synchronized networks was characterized with graph
measures on a millisecond timescale. We hypothesized that cognitive processing is related to rapid,
transient, and frequency-specific topological reorganization of brain functional networks.
Methods
Subjects
We tested 18 right-handed subjects without any neurological or neuropsychiatric disorders, with normal or
corrected-to-normal visual acuity. All subjects gave informed consent before the experiment. Data of 2
subjects were discarded due to poor EEG quality (i.e. excessive number of electrodes recording artefacts due
to poor contact with the scalp); thus data of 16 subjects (8 female; 25±0.7 years old) were included in the
analysis.
Experimental setting
Participants performed a classic visual oddball task. The experiment comprised two conditions: presentation
of frequent distractors (DIST; 1180 trials; 90% probability) and rare targets (TARG; 120 trials; 10%
probability). Subjects were instructed to ignore distractors and to only press a space key on a keyboard as
fast as possible in response to targets. Gabor patches, created by multiplying a 2D Gaussian (SD=2deg. of
visual angle) and 2D sinusoidal grating (contrast=70%, spatial frequency=1cycle/deg), were used as stimuli.
They were presented in the center of the screen and orientation of a patch (vertical vs. horizontal)
distinguished distractors from targets. The orientation of targets was counterbalanced across subjects.
Subjects viewed stimuli binocularly from the distance of 57cm on a gamma corrected monitor (EIZO,
CG241W). In total, 1200 stimuli presentations were given, grouped into 4 blocks of 300 stimuli, with short
breaks in between. A red fixation point (size 0.25deg) was present on the screen all the time except for the
stimulus presentation and the subject was asked not to move the eyes away from it. The stimuli were
presented for 200ms and the maximum allowable response time was 1200ms. After the response time a
random inter-trial interval was started (range 200-800ms). Each subject performed a few practice trials
before commencing the data collection.
EEG acquisition
Dense array EEG was recorded using a HydroCell GSN 128-channel net and Net Amps 300 amplifier (EGI
Inc., Eugene, Oregon, USA). The signal was sampled with 500Hz frequency, referenced to Cz (ground
electrode between Cz and Pz), and digitalized with 24 bit precision. Impedance was ascertained to be below
100kΩ throughout the recording.
EEG preprocessing
bioRxiv preprint first posted online December 19, 2014; doi: http://dx.doi.org/10.1101/012922; The copyright
holder for this preprint is the author/funder. All rights reserved. No reuse allowed without permission.
Continuous EEG signal was re-referenced to the linked mastoids, filtered with high-pass (1Hz) finite
impulse response (FIR) filter, low-pass (100Hz) FIR filter, notch (50Hz) FIR filter, and down-sampled to
250Hz. The EEG signal was divided into epochs time locked to the stimuli [-0.8s to 1.7s] which were
baseline [-0.2s to 0s] corrected. Epochs were screened for non-stereotypical artefacts e.g. excessive
myographic activity (on average 50±9 epochs per subject discarded). Noisy channels were discarded (6±1.9
channels per subject discarded) and interpolated based on the activity of surrounding channels. Independent
component analysis was performed. Topographic maps, power spectra, and time-domain activity was
evaluated visually for each component and based on these features each component was classified as
representing either brain activity or artefacts e.g. eyeblinks or cardiac activity. Components representing
artefacts were discarded. On average 15.8±1.3 components were retained and back-projected into sensor
space.
Target trials not followed by a response (omissions), and distractor trials followed by a response (false
positives) were discarded. To exclude any bias from the unequal number of trials in both experimental
conditions only a subset of distractor trials, for each subject equal to the number of target trials, was
randomly chosen for further analysis. On average 117±1 trials per subject/condition were analyzed.
The frequency bands were defined as follows: theta (4-7Hz), alpha (7-14Hz), beta (14-30Hz).
Source-reconstruction procedure
The forward model and the inverse model were calculated with an open access software Brainstorm (Tadel
et al., 2011). The forward model, which describes the signal pattern generated by a unit dipole at each
allowed location on the surface, was calculated using the symmetric boundary element method (BEM)
(Gramfort et al., 2010, Kybic et al., 2005) and default MNI MRI template (Colin 27). Preprocessed, ICA
pruned, stimulus-locked single-trial data were used to calculate the inverse model, which was estimated
using the weighted Minimum Norm Estimate (wMNE) (Hämäläinen and Ilmoniemi, 1994). wMNE is wellsuited for estimation of large-scale functional connectivity networks as it addresses the volume conduction
and thus reduces spurious signal correlations (Hassan et al., 2014; Palva and Palva, 2012). When computing
the inverse operator (a) the source orientations were constrained to be normal to the cortical surface; (b) a
depth weighting algorithm was used to compensate for any bias affecting the superficial sources calculation
(Lin et al., 2006); and (c) a regularization parameter, λ2 = 0.1 was used to minimize numerical instability,
reduce the sensitivity of the wMNE to noise, and to effectively obtain a spatially smoothed solution
(Hämäläinen and Ilmoniemi, 1994). In this way, activation time-courses at 15002 vertices (an equilateral
triangle in the tessellation of the cortical surface) were estimated. The cortical surface was divided into 68
anatomical regions of interest (ROI; 34 in each hemisphere) based on the Desikan–Killiany atlas (Desikan et
al., 2006) and activity of a seed voxel of each area was used to calculate functional connectivity.
bioRxiv preprint first posted online December 19, 2014; doi: http://dx.doi.org/10.1101/012922; The copyright
holder for this preprint is the author/funder. All rights reserved. No reuse allowed without permission.
Spectral decomposition
The main steps of the conducted analysis are presented in Figure 1. Spectral decomposition of EEG from
single trials (both, sensor-space and source-space) was conducted with Morlet wavelet (EEGlab newtimef
function) and 200 linearly spaced time points and 40 linearly spaced frequencies were estimated. The
window size used for decomposition was 211 data points (844ms). The wavelet contained 3 cycles at the
lowest frequency (3.9Hz) and the number of cycles was increasing up to 11.4 cycles at highest frequency
(30Hz) and 40 frequency points linearly spaced between 3.9Hz and 30Hz were estimated. Therefore, for
every subject, condition, and channel/ROI, we obtained a 3D matrix of 40 (frequency points) X 200 (time
points) X ‘number of trials’ (which varied between participants). Absolute values of the decomposed sensorspace signals were analyzed to investigate event-related changes in oscillatory power.
Functional connectivity estimation
Two measures of coupling were calculated for each frequency- and time-point between all pairs of ROIs.
Phase Locking Value (PLV; Lachaux et al., 1999) measures variability of phase between two signals is
classically defined as,
1
𝑛
𝑛
𝑃𝑃𝑃(𝑓,𝑡) = |∑𝑁
𝑛=1 exp (𝑖(𝜑1 (𝑓, 𝑡 ) − 𝜑2 (𝑓, 𝑡 )))|,
𝑁
(1)
where 𝜑1𝑛 (𝑓, 𝑡) and 𝜑2𝑛 (𝑓, 𝑡) denotes phase from ROI 1 and 2 respectively, from trial n and for frequency-
point f and time-point t. N denotes the number of trials, and i is the imaginary unit. In the present study PLV
was implemented as,
𝑃𝑃𝑃(𝑓,𝑡) =
1
𝑁
�∑𝑁
𝑛=1
〈𝑆1𝑛 (𝑓,𝑡) 𝑆2𝑛∗ (𝑓,𝑡)〉
�𝑆1𝑛 (𝑓,𝑡)𝑆2𝑛 (𝑓,𝑡) �
�,
(2)
where 𝑆1𝑛 (𝑓, 𝑡) and 𝑆2𝑛 (𝑓, 𝑡) are wavelet-decomposed EEG signals from ROIs 1 and 2 respectively, and *
indicates the complex conjugate. Both implementations give exactly the same estimates.
Imaginary part of coherence (iCoh; Nolte et al., 2004), which is a conservative measure of functional
coupling insensitive to volume conduction, was calculated as,
𝑖𝑖𝑖ℎ(𝑓,𝑡) = �𝐼𝐼(
𝑛
𝑛∗
∑𝑁
𝑛=1〈 𝑆1 (𝑓,𝑡)𝑆2 (𝑓,𝑡)〉
2
2
〈 𝑛 ( )〉
�∑𝑁
〈 𝑛 ( )〉 ∑𝑁
𝑛=1� 𝑆1 𝑓,𝑡 �
𝑛=1� 𝑆2 𝑓,𝑡 �
)�.
(3)
For every subject, condition, and all pairs of ROIs (2278 pairs) we obtained PLV and iCoh matrices 40
(frequency points) X 200 (time points). In other words, for every subject (n=16), condition (2), and time(200), and frequency point (40) we obtained a full 68 X 68 adjacency matrix.
Weighted graphs
The main aim of the study was to analyze topology of the event-related functional networks. To this end we
converted full PLV adjacency matrices into sparse, undirected, weighted graphs which can be analyzed with
bioRxiv preprint first posted online December 19, 2014; doi: http://dx.doi.org/10.1101/012922; The copyright
holder for this preprint is the author/funder. All rights reserved. No reuse allowed without permission.
graph measures.
Graphs comprise of nodes,
being systems’ elements (here brain areas),
and
edges/connections, indicating interactions between elements (here phase synchronization). In order to obtain
a sparse, weighted, undirected graph/network A(f,t), a full adjacency matrices were thresholded, so that all the
values below the threshold were set to 0. The values above the threshold retained original values (weights).
For each matrix the threshold was individually adjusted, so that the density, defined as the proportion of
existing edges out of all possible edges, was equal for each graph. Density can be also represented as degree
(K), which is defined as average number of edges coupled to a node. The main analysis was conducted with
networks of density=0.29 (K = 10). Yet, the control analyses indicated that the main effects found in the
study are independent of networks’ density.
The basic parameter which can be calculated for weighted networks is networks’ strength defined as an
average over weights of all connections within a network. Further nodal strength can be calculated for each
node defined as sum of weights of all edges coupled to a node.
Graph measures
Weighted networks
Weighted graphs A(f,t) were characterized with several graph measures generalized for analysis of weighted
networks as implemented in Brain Connectivity Toolbox. Formal definitions of all measures can be found in
(Rubinov and Sporns, 2010). Clustering Coefficient (CC(f,t)) and Characteristic Path Length (CPL(f,t)) were
calculated with functions clustering_coef_wu and charpath/distance_wei, respectively. Three surrogate
random graphs with the same number of nodes and edges, and preserved weight, degree, and strength
distributions were created
for every original graph by reshuffling edges of the original graph
(null_model_und_si). Three surrogate lattice networks with the same number of nodes and edges were also
created for each original graph (makelatticeCIJ). CC and CPL were calculated for each surrogate graph,
averaged to obtain CCrand(f,t), CPLrand(f,t) , CClatt(f,t), CPLlatt(f,t) , and used to calculate two measures of “smallworldness”: Sigma and Omega.
Sigma (Humphries and Gurney, 2008), which evaluates whether a network can be considered “small-world”
(if Sigma>1), was defined as,
𝑆𝑆𝑆𝑆𝑆(𝑓,𝑡) =
𝐶𝐶( 𝑓,𝑡)
�𝐶𝐶
𝑟𝑟𝑟𝑟 ( 𝑓,𝑡)
.
𝐶𝐶𝐶 ( 𝑓,𝑡)
�𝐶𝐶𝐶
𝑟𝑟𝑟𝑟 ( 𝑓,𝑡)
(4)
Omega (Telesford et al., 2011) takes values between -1 (for lattice-like, clustered network) and 1 (for
random network). Omega≈0 indicates “small-world” structure of a network. Omega was defined as,
𝑂𝑂𝑂𝑂𝑂(𝑓,𝑡) =
𝐶𝐶𝐶𝑟𝑟𝑟𝑟 ( 𝑓,𝑡)
𝐶𝐶𝐶 ( 𝑓,𝑡)
−
𝐶𝐶 ( 𝑓,𝑡)
𝐶𝐶𝑙𝑙𝑙𝑙 ( 𝑓,𝑡)
.
(5)
bioRxiv preprint first posted online December 19, 2014; doi: http://dx.doi.org/10.1101/012922; The copyright
holder for this preprint is the author/funder. All rights reserved. No reuse allowed without permission.
Further, we calculated the weighted Rich Club Coefficient (RCC). Many systems exhibit so called rich-club
organization, meaning that nodes with high degree (i.e. network hubs) are more strongly interconnected
among themselves than nodes of a low degree (Colizza et al., 2006). The anatomical networks of the human
brain were shown to exhibit the rich-club topology (van den Heuvel and Sporns, 2011). RCC quantifies how
strong the interactions among networks’ hubs are. To calculate RCC all edges of the analyzed graphs were
ranked by weight, resulting in a vector Wranked . RCC is typically calculated for a range of rcK values and for
each value of rcK, a group of nodes with degree>rcK belongs to a rich-club. The number of edges Erc
between the rich-club nodes was counted, together with their collective weight Wrc calculated as the sum of
weights of all rich-club edges. The weighted RCC was then calculated as the ratio between Wrc and the sum
of weights of the strongest Erc edges of the whole graph, given by the top Erc number of edges of the
collection of ranked edges in Wranked . RCC was formally was defined as follows (Opsahl et al., 2008):
𝑅𝑅𝑅 (𝑟𝑟𝑟 ) = ∑𝐸𝑟𝑟
𝑙=1
𝑊𝑟𝑟
𝑊𝑙𝑟𝑟𝑟𝑟𝑟𝑟
.
(6)
The main analysis was conducted with rcK=25 but all the individual rich-club curves are also presented.
RCC was calculated with the Brain Connectivity Toolbox function rich_club_wu.
Finally, k-core decomposition of graphs was calculated with a kcore_bu function. For this analysis weighted
graphs were binarized, as otherwise the network strength would affect results to a great extent. K-core
decomposition defines maximal connected sub-graphs in which all nodes have degree>k. K-core
decomposition is implemented in steps. In each step nodes (together with their edges) with degree<k are
pruned. Then k is increased and again the nodes with degree<k are pruned, until all nodes are removed. For
each step removed nodes have the value k assigned as the nodal k-core value. A high nodal k-core indicates
a more central role of a node in a network. The subset of nodes pruned in the last step (i.e. set of nodes with
highest nodal k-core) constitute the k-core of a network.
Binary graphs
The same procedures were followed to create binary graphs. Full adjacency matrices were thresholded to
obtain graphs with the same density (0.29) as the weighted graphs, but now all the preserved entries (i.e.
above the threshold) were set to 1. To analyze binary graphs the same graph measures (but implemented
specifically for analysis of binary graphs) were used. Clustering coefficient and characteristic path length
were calculated with functions clustering_coef_bu and charpath/distance_bin respectively. Binary RCC was
calculated with the rich_club_bu function. Three surrogate random graphs with preserved number of nodes,
edges, and degree distribution, were created with randmio_und function. Three surrogate lattice networks
with preserved number of nodes and edges were created with makelatticeCIJ function. Sigma and Omega
were calculated according to the same definitions.
Modularity
bioRxiv preprint first posted online December 19, 2014; doi: http://dx.doi.org/10.1101/012922; The copyright
holder for this preprint is the author/funder. All rights reserved. No reuse allowed without permission.
A module (community) is defined as a group of nodes which are more strongly connected among each other
than with nodes in other modules. Typically a quality function Q is used to evaluate modularity of a network
(Newman and Girvan, 2004). In binary networks Q quantifies the number of intra-modular connections
relative to the inter-modular connections. In weighed networks Q quantifies the weights of intra-modular
connections relative to the inter-modular connections. Therefore, maximization of Q allows partitioning a
network into the most optimal community structure.
Uni-layer and multi- layer networks
We firstly studied modularity of uni-layer weighted networks. Each network A (f,t) represents one time- and
frequency-point thus modularity at each time-point was evaluated independently from modularity at other
time-points. A(f,t) is a 68 X 68 matrix whose elements Aij specific weights of edge between nodes i and j.
Suppose that node i is assigned to community gi and node j is assigned to community gj. The quality
function Quni evaluating modularity of a uni-layer network can be defined as:
𝑄𝑢𝑢𝑢 = ∑𝑖𝑖�𝐴𝑖𝑖 − 𝛾𝛾𝑖𝑖 �𝛿�𝑔𝑗 𝑔𝑖 �,
(7)
where 𝛿�𝑔𝑗 𝑔𝑖 � = 1 if 𝑔𝑗 = 𝑔𝑖 and 0 otherwise, and 𝛾(gamma) is a resolution parameter. 𝑃𝑖𝑖 is the expected
weight of the edge connecting node i and node j under the Newman-Girvan null model, which was defined
as,
𝑃𝑖𝑖 =
𝑘𝑖 𝑘𝑗
2 ∑𝑖𝑖 𝐴 𝑖𝑖
,
(8)
where k i is the strength of node i and k j is the strength of node j. The resolution parameter 𝛾 was set to 1 in
the main analysis but we repeated the analysis with different values of gamma to demonstrate robustness of
the results.
Further, for each frequency we created multilayer networks B(f) where each layer (“slice”) of a network
represented networks’ state at one time point. Each layer was linked to proceeding (t-1) and subsequent
(t+1) layers. The temporal links allowed estimating evolution of the community structure in the time
domain. Neuroimaging data have been already studied as multilayer networks (Basset et al., 2011, 2013;
Doron et al., 2012). To ensure that mainly the evoked component is represented, and not the pre-stimulus
activity, only the time-points from 0ms to 800ms after the stimulus onset were included in the multi-layer
networks. Thus each multilayer network comprised 96 layers (time-points). The quality function Qml
evaluating modularity of a multilayer network can be defined as,
𝑄𝑚𝑚 =
1
2𝜇
∑𝑖𝑖𝑖𝑖��𝐵𝑖𝑖𝑖 − 𝛾𝑙 𝑃𝑖𝑖𝑖 �𝛿𝑙𝑙 + 𝛿𝑖𝑖 𝜔𝑗𝑗𝑗 �𝛿�𝑔𝑖𝑖 𝑔𝑗𝑗 �,
(9)
where the adjacency matrix of layer l has components Bijl, the element Pijl gives the components of the
corresponding null model matrix, and 𝛾𝑙 is the structural resolution parameter of layer l, gil gives the
community assignment of node i in layer l, gjr, gives community assignment of node j in layer r, the
parameter 𝜔𝑗𝑗𝑗 (omega) is the interlayer coupling strength between node j in layer r and node j in layer l,
bioRxiv preprint first posted online December 19, 2014; doi: http://dx.doi.org/10.1101/012922; The copyright
holder for this preprint is the author/funder. All rights reserved. No reuse allowed without permission.
1
𝜇 = 2 ∑𝑗𝑗 𝐾𝑗𝑗 , the strength of node j in layer l is 𝐾𝑗𝑗 = 𝑘𝑗𝑗 + 𝑐𝑗𝑗 , the intra-layer strength of node j in layer l is
k jl, and the inter-layer strength of node j in layer l is 𝑐𝑗𝑗 = ∑𝑟 𝜔𝑗𝑗𝑗 . The Newman-Girvan null model was
employed within each layer and defined as,
1
𝑃𝑖𝑖 =
𝑘𝑖𝑖 𝑘𝑗𝑗
2𝑚𝑙
,
(10)
where 𝑚𝑚 = 2 ∑𝑖𝑖 𝐵𝑖𝑖𝑖 is the total edge weight in layer l. The resolution parameter 𝛾𝑙 (gamma) was set to 1
and all non-zero 𝜔𝑗𝑗𝑗 were set to 1 in the main analysis. The multilayer analysis was repeated with different
values of gamma and omega to demonstrate robustness of results.
Analysis of networks partitions
We used a Louvain greedy community detection algorithm (Mucha et al., 2010) to optimize Quni and Qml.
Networks were partitioned into non-overlapping communities, i.e. each node belonged to one community
only. Importantly, algorithms partitioning networks by optimization of modularity function tend to produce
many near-optimal partitions which form the so called high-modularity plateau. Hence, two partitions
optimizing the function Q to the same degree might indicate different community structure. To deal with this
problem the high-modularity plateau is typically extensively sampled, i.e. that same network is partitioned a
number of times. Having several degenerate partitions of the same network there are two possibilities: (i) a
single “representative” partition might be chosen and analyzed (e.g. Doron et al., 2012); (ii) measures of
interest (e.g. number of modules) might be calculated from every obtained partition and then averaged over
all partitions to give a representative value for the underlying network (e.g. Bassett et al., 2011). Here we
chose the latter approach. Thus, each uni-layer and multi-layer network was partitioned 25 times, features of
interest were calculated from each partition and averaged over all 25 degenerate partitions to obtain the
representative value for the network. The averaged features were then compared statistically.
The features of partitions analyzed in the uni-layer networks were: (i) Quni and (ii) number of modules. The
number of modules was calculated separately for each time point. The features of partitions analyzed in
multilayer networks were: (i) Qml, (ii) number of modules, and (iii) flexibility. Here the number of modules
reflected the number of modules throughout the temporal network. Flexibility was defined as number of the
times a node changes community assignment divided the number of all possible changes (Bassett et al.,
2011).
Null network models
Importantly, investigating qualities of the community structure is of relevance only if the analyzed network
is indeed modular. Therefore, before comparing modularity between experimental conditions we tested
whether event-related networks exhibit modular structure by comparing them to null (surrogate) networks.
Null networks were created by destroying the possible modular structure of original networks by
randomization.
bioRxiv preprint first posted online December 19, 2014; doi: http://dx.doi.org/10.1101/012922; The copyright
holder for this preprint is the author/funder. All rights reserved. No reuse allowed without permission.
For each uni-layer network A(t,f) we created 25 null networks by randomizing edges of the original network
but preserving weight, degree, and strength distributions (function: null_model_und_si). See Rubinov and
Sporns (2011) for details of the algorithm
When analyzing multilayer networks we used three different null models proposed by Bassett et al., (2011):
(i) we randomized edges in each layer, but preserved weight, degree, and strength distributions (function:
null_model_und_si; the same procedure as for static networks); (ii) we randomized nodes in each slice so
that node A in slice t was not linked to node A in slice t+1 but to some other node; (iii) we randomized
slices, so that slice t+1 did not follow slice t. For each multilayer network B (f) we created 25 instantiations of
each null model. Each null network was partitioned into communities using the same procedure as for the
original networks. From each partition network features were calculated and averaged over 25 null
networks. Difference between features of original networks and null networks was calculated and tested
against 0.
Due to high computational time needed to calculate numerous network partitions we limited the community
structure analysis to three frequencies representing 3 frequency bands (3.9Hz – theta; 10.6Hz – alpha; and
20.6Hz – beta).
Analysis of community structure in binary graphs was conducted according to the same procedures.
Control analyses
When analyzing topology of sparse networks one has to define a number of parameters which might
influence the result of the analysis. The most important parameter is density of analyzed graphs. When
estimating modularity a resolution parameter gamma has to be defined and when estimating multi-layer
modularity also a between-layer coupling also a parameter omega needs to be set. Thus, to demonstrate the
main results were robust against varying these three parameters we conducted a number of control analyses.
We focused on the main effects found between conditions which were: (i) reorganization of the theta-band
network around 350-550ms shown by Sigma, Omega, CPL, CC; (ii) decrease of modularity of the theta
network around 350-500ms and beta network around 600-700ms in uni-layer networks. Alpha network 300500ms was also included in the control analysis although there was no effect in the alpha band; (iii)
reorganization of theta and beta multi-layer networks (alpha network also included in the control analyses).
For each value of the parameter the difference (Δ) between conditions (i.e. TARG-DIST) calculated for each
subject and tested statistically against 0.
Statistical analysis
bioRxiv preprint first posted online December 19, 2014; doi: http://dx.doi.org/10.1101/012922; The copyright
holder for this preprint is the author/funder. All rights reserved. No reuse allowed without permission.
In the present study we sought to characterize event-related changes in network topology. Thus, the EEG
measures (PLV/iCoh, graph measures) were compared: (i) against baseline which was defined as time
window [-200ms – 0ms] with respect to the stimulus onset (measures of the “baseline state” were calculated
for each frequency separately); and (ii) between conditions (DIST vs. TARG). The comparisons involving
multiple time-points (ERP) or multiple time-frequency points (PLV/iCoh, graph measures) were conducted
using repeated measures cluster mass permutation test to deal with the problem of multiple comparisons
(Bullmore et al., 1999; Maris and Oostenveld, 2007).
When studying networks modularity we additionally conducted comparisons between original networks and
surrogate (random) networks. Here for each subject a difference (REAL-SURROGATE) was calculate and
tested against zero with a two-tailed repeated-measures t-test. The difference between conditions was
considered significant when p<0.05
Cluster mass permutation test allows controlling for the false positive rate when multiple comparisons are
conducted. It is especially useful when there is no a priori hypothesis as to when, where, and in which
frequencies the effect might occur. When testing ERP time points from 0 ms to 1000 ms were included in
the test (251 total comparisons). When testing time frequency maps, time points from 0ms to 1000ms and all
frequency points were included (i.e. 4840 total comparisons). Repeated measures t-tests were performed for
each comparison using the original data and 5000 random within-participant permutations of the data. For
each permutation, all t-scores corresponding to uncorrected p-values below the threshold of 0.025 were
formed into clusters. The sum of the t-scores in each cluster is the "mass" (t mass) of that cluster. The most
extreme cluster mass in each of the 5001 sets of tests was recorded and used to estimate the distribution of
the null hypothesis. The family-wise alpha level was set to 0.05. The relatively conservative threshold of
0.025 was chosen to further minimize the likelihood of false positive findings. It is important to note that in
the cluster mass permutation test the most extreme t mass value, likely corresponding to the largest cluster, is
used to create a null distribution. Therefore, cluster mass permutation test are useful to capture the broad
changes which form large clusters (i.e. span many time- and frequency-points) as these likely have high
t mass. But the cluster mass permutation test might miss focal effects forming clusters of small t mass, even if
specific comparisons within a cluster are highly significant (see: Groppe et al., 2011). We found significant
effects mainly in the theta band, but it is possible that significant effects occurred also in other frequencies,
but they were not considered significant by the cluster mass permutation procedure because of the high t mass
of the theta-band cluster.
We did not correct for the multiple comparisons across measures, since due to different nature of
comparisons (e.g. against baseline, between conditions, with null models) it would not be clear how to
define a correction. Yet the reported p values were typically low (<0.001), thus additional correction is
unlikely to change the study’s results.
bioRxiv preprint first posted online December 19, 2014; doi: http://dx.doi.org/10.1101/012922; The copyright
holder for this preprint is the author/funder. All rights reserved. No reuse allowed without permission.
The following notation was used to indicate p values in all figures: *p<0.05 **p<0.01 ***p<0.001
****p<1x10⁻⁷
Software
The experiment was written and conducted in Matlab Psychotoolbox (Brainard, 1997; Pelli, 1997) running
under Matlab 2013. Data analysis was conducted using Matlab 2013 and the following open-access
toolboxes: EEGlab (Delorme and Makeig, 2004), Brainstorm (Tadel et al., 2011), Brain Connectivity
Toolbox (Rubinov and Sporns, 2010), and Mass Univariate ERP Toolbox (Groppe et al., 2011)
Results
Behavioral results, ERP, and event-related spectral power
The mean detection rate of targets in the visual oddball task was 97±0.009 % and the mean reaction time
was 579±16ms. In response to targets ERPs exhibited stronger N1 and N2 peaks (tmass=153.6, p=0.0016;
Figure 2A) and higher amplitude of the P3 peak (tmass=376.8, p<0.001) than in response to distractors.
Spectral power changes also exhibited the expected pattern (Mazaheri and Picton, 2005). Processing of both
distractors and targets led to increase of theta power over baseline (DIST: tmass=1861, p<0.001; TARG:
tmass=2373, p=0.004; Figure 2B). Similarly in both conditions alpha/beta desynchronization occurred (DIST:
tmass=4867, p<0.001; TARG: t=4042, p<0.001) but only after presentation of a distractor there was a beta
power increase with onset around 600ms after the stimulus (tmass=2162, p<0.001), which is the well-known
“beta
rebound” phenomenon.
Comparisons
between conditions indicate that theta synchronization
(tmass=1658, p=0.006) and alpha desynchronization (t=3648, p<0.001) were stronger during targets
processing.
Event-related network: network strength
The main aim of the present study was to characterize weighted networks during a cognitive task. Firstly, we
analyzed strength of interactions within weighted ERNs. Strength was calculated as average over weights of
all edges in a network. Both, distractors and targets resulted in a network-wide increase of theta band
strength (DIST: tmass=1811, p<0.001 TARG: tmass=3245, p<0.001; Figure 3A, B) which was stronger during
target processing than during distractor processing (tmass=2407, p<0.001). Analysis of the nodal strength
(Figure 3C) revealed that initially (around 200ms) only occipital nodes increased strength, but during
cognition also parietal and frontal areas are included in the strongly connected task-relevant network.
Interestingly, after the manual response only the nodes of the left hemisphere motor areas exhibit higher
strength, what would be expected after execution of a right-hand finger movement (e.g. Nolte et al., 2004).
bioRxiv preprint first posted online December 19, 2014; doi: http://dx.doi.org/10.1101/012922; The copyright
holder for this preprint is the author/funder. All rights reserved. No reuse allowed without permission.
To further support our conclusions we created weighted networks using imaginary part of coherence (iCoh;
Nolte et al., 2004) - a conservative measure of functional connectivity insensitive to volume conduction.
Processing of both, targets and distractors, led to an increase of theta-band iCoh network strength (DIST:
tmass=1049, p=0.004; TARG: tmass=2568, p<0.001). Again, the difference between conditions was apparent,
with greater theta strength increase during target processing (tmass=1524, p<0.001). This provides strong
evidence for a network-wide increase of functional coupling during cognitive operations.
Event-related network: graph measures
Further, we analyzed topology of the weighted event-related PLV networks with a number of graph
measures (Rubinov and Sporns, 2010; 2011). Cognitive processing was related to rapid and transient
reorganization of the theta band network towards more clustered topology. Specifically, cognitive
processing after target presentation led to a decrease of the small-world index sigma in the theta band
(tmass=1072, p=0.0075) and in the beta band (tmass=2310, p<0.001). Decrease of sigma was stronger during
target processing (theta: tmass=1336, p<0.001; beta: tmass=1762, p<0.001; Figure 4A). Further, we used
Omega which takes values between -1 and 1, indicating lattice network and random network respectively.
Omega decreased during both, distractor and target processing (DIST: tmass=396, p=0.029; TARG:
tmass=2255, p<0.001; Figure 4B) indicating that the network shifted towards a more clustered, lattice-like
topology. This shift was, in fact, stronger after target presentation (tmass=1753, p<0.001).
Topological reorganization of the theta band network was confirmed by the characteristic path length (CPL;
Figure 4C) and clustering coefficient (CC; Figure 4D). Both, distractor and target processing increased path
length (DIST: tmass=1461, p=0.0015; TARG: tmass=2817, p<0.001) and clustering of the network (DIST:
tmass=968, p=0.006; TARG: tmass=2725, p=0.008). But both, path length (tmass=2290, p<0.001) and clustering
(tmass=1941, p<0.001), increased more during cognitive processing than during distractor processing.
Inspecting the nodal CC (Figure 4E) we observed an increase of nodal CC in a great majority of nodes
during cognition which shows that the effect was rather network-wide and not driven by an increase in CC
in one specific location.
Event-related network: modularity
Further, we analyzed dynamic modularity of the event-related networks. A module (community) can be
understood as a set of highly inter-connected nodes which are relatively sparsely connected to nodes in other
modules. In the present study modularity was studied in two ways (Figure 5A). Firstly, we investigated
modularity of uni-layer networks where each network represented one time- and frequency-point. Secondly,
we studied community structure in the multilayer (temporal) networks where each layer (“slice”)
corresponded to one time-point and subsequent layers were linked to each other (Mucha et al., 2010; Bassett
et al., 2011, 2013; Doron et al., 2012). In this way we were able to capture not only spatial but also temporal
aspects (i.e. temporal evolution) of the community structure.
bioRxiv preprint first posted online December 19, 2014; doi: http://dx.doi.org/10.1101/012922; The copyright
holder for this preprint is the author/funder. All rights reserved. No reuse allowed without permission.
Yet, analysis and interpretation of the community structure is non-pertinent if a network does not exhibit
modular topology. Therefore, we firstly tested whether the analyzed event-related networks are modular by
comparing original networks to random null-models. This initial analysis established that both, uni- and
multi-layer event-related networks indeed exhibit modular structure. The uni-layer event-related networks
were characterized by higher Quni and smaller number of modules than random networks (Figure 5B). The
multi-layer networks exhibited higher Qml, smaller number of modules, and lower flexibility when compared
to the three null models (Figure 5D).
Results of both analyses, uni- and multi-layer networks, indicates that cognitive processing reduces
modularity of functional brain networks. The uni-layer theta band network became transiently less modular
around 400-500ms after the target presentation, as indicated by lower Quni (tmass=184, p<0.001; Figure 5C).
Modularity of the beta band network decreased as well, but later, around 600-700ms after the stimulus onset
(tmass=85, p=0.0016). Further, analysis of modular structure in the multi-layer networks confirmed that
cognition is related to lower modularity of the theta (t(1,15)=5.94, p<0.001) and beta networks
(t(1,15)=3.27, p=0.005; Figure 5E). In multi-layer networks we found that during cognitive processing the
number of modules in theta network (t(1,15)=2.18, p=0.045), and flexibility of the alpha (t(1,15)=2.61,
p=0.019) and beta networks (t(1,15)=2.31, p=0.034) were higher than during distractor processing. Thus,
both analyses demonstrate that cognitive processing is related to changes in the spatio-temporal patterns of
networks’ community structure. During cognition we found that networks topology shifts towards less
modular arrangements which indicates extensive integration of information between local modules.
Event-related network: network hubs
The initial findings - namely an increase of clustering and a decrease of modularity - seemed contradictory
at first sight, as more modular networks are typically also more clustered. Yet, we hypothesized that dense
connectivity among hub-nodes belonging to different modules might, at the same time, increase nodal
clustering of hub-nodes (thus, drive the global clustering increase) and make borders between modules less
clear-cut (thus decrease modularity). To test whether cognition is related to greater inter-connectivity
between hubs we calculated the Rich Club Coefficient (RCC). RCC quantifies weights of inter-connections
between the rich-club nodes (i.e. nodes with highest degree) in relation to general strength of the network.
During cognitive processing RCC increased over baseline in the theta (tmass=1793, p=0.0064; Fig. 6A) and
beta bands (tmass=762, p=0.034). In both bands RCC increase was in fact stronger after target presentation
than after distractor presentation (theta: tmass=1601, p=0.0014; beta: tmass=404, p=0.045). RCC increase was
found for a wide range of rcK cut-off values, i.e. in rich-clubs comprising more or less nodes (Fig. 6B).
Results of the k-core decomposition (Fig. 6C) provide further support for the role of extensively connected
set of hub-nodes in cognitive processing. The k-core subgraphs found during cognition were characterized
bioRxiv preprint first posted online December 19, 2014; doi: http://dx.doi.org/10.1101/012922; The copyright
holder for this preprint is the author/funder. All rights reserved. No reuse allowed without permission.
by higher k-core values (i.e. included nodes had higher degree) and at the same time were sparser (i.e. less
nodes were included) than k-core subgraphs found at baseline. Thus a sub-network comprising few
interconnected high-degree nodes emerges during cognition. Altogether, our findings support the hypothesis
that inter-connectivity among the hub-nodes becomes denser during cognitive processing.
Control analyses
Graph theory has only recently been introduced to neuroscience, thus no well-established preprocessing and
analysis pipelines exist. In addition, there are still numerous caveats related to the application of graph
measures to neuroscience data (recently reviewed in: Fornito et al., 2013; Papo et al., 2014). When
analyzing topology of sparse networks one has to define a number of parameters which might influence the
final result. Thus, to demonstrate that the main effects of the study are robust we conducted several control
analyses. Specifically, we showed that (i) event-related theta band network reorganization can be found in
weighted networks across a wide range of densities (Figure 7A, G); (ii) varying network density, resolution
parameter gamma, and coupling parameter omega does not change the main results of the community
structure analysis (Figure 7B-F); and (iii) analysis of binary (un-weighted) networks leads to the same
conclusions as analysis of weighted networks (Figure 8). Thus, the topological effects cannot be ascribed to
the mere increase in network strength during stimulus processing.
Discussion
Cognition and consciousness are believed to emerge from activity of widespread brain areas coordinated by
phase synchronization (Gaillard et al., 2009; Hipp et al., 2011; review: Varela et al., 2001; Siegel et al.,
2012). Such interactions are highly dynamic with functional networks established and dissolved on the time
scale of tens of milliseconds. Yet, not much is known about the topological arrangements of transient
cognitive networks, as graph theory has been employed predominantly to study time-invariant anatomical
and functional “connectomes”. Using the excellent temporal resolution of EEG we revealed that cognitive
processing is related to rapid, transient, and frequency-specific reorganization of functional networks’
topology as demonstrated by our event related network analysis (ERNA). Specifically, cognitive networks
were characterized by three features: (i) strong clustering, (ii) low modularity, and (iii) strong interactions
between the hub-nodes. Our findings suggest that dense and highly clustered connectivity among hub-nodes
belonging to different modules is established during cognition. Such inter-modular connections might be a
substrate of the “global workspace” necessary for the emergence of conscious perception (Baars, 2002;
Baars et al., 2013; Dehaene and Changeux, 2011).
Global topology of brain networks: fixed or flexible?
The majority of hitherto conducted studies on the brain functional connectivity aimed to map the spatial
profile of spontaneous brain networks by assuming their temporal invariance. Yet, recently, it was
bioRxiv preprint first posted online December 19, 2014; doi: http://dx.doi.org/10.1101/012922; The copyright
holder for this preprint is the author/funder. All rights reserved. No reuse allowed without permission.
demonstrated that the functional networks are highly dynamic and exhibit meta-stable temporal patterns
(MEEG: Betzel_2012; Baker_2014; fMRI: Allen et al., 2014; Zalesky et al., 2014). Nevertheless, it is not
clear whether such dynamics supports cognition and whether topology of intrinsic networks reorganizes
during cognition to give rise to a qualitatively new topological pattern. Hitherto conducted studies on taskrelated network reorganization were sparse and inconclusive. A number of reports concluded that cognitive
processes merely change weights or local (nodal) features of intrinsic functional networks but not the global
topological structure (Bassett et al., 2006; Nicol et al., 2012; Betti et al., 2012; Jin et al., 2012; Crossley et
al., 2013; Cole et al., 2014). Yet, others observed task-related topological reorganization of large-scale
networks on a time-scale of seconds (Valencia et al., 2008; Doron et al., 2012; Palva et al., 2010; Kitzbichler
et al., 2011; de Vico Fallani et al., 2008; Ekman et al., 2012). On a longer time scale of minutes/hours, fMRI
network’s rearrangements are related to plasticity, e.g. motor learning (Bassett et al., 2011; 2013).
Results of the present study reveal that not only the strength of functional coupling, but also reorganization
of network’s topology might contribute to cognitive processing. The key role of brain functional networks’
topology in cognition has already been postulated by the global workspace theory (GWT; Baars, 2002). The
assumption of GWT is that after local processing within specific modules (e.g. visual, auditory, motor
systems) the information needs to be integrated within a global workspace, which can be identified with a
network comprising hub-nodes and inter-modular connections. Hence, according to GWT, it is not the
strength of pairwise connections but rather the topological arrangement of a network which gives rise to
perception, cognition, and consciousness. The reorganization pattern observed in the present study, namely a
decrease of modularity and strong interactions between hubs, is in good agreement with the predictions of
GWT. Interestingly, a decrease of modularity and shift towards global integration were also observed in the
previous studies analyzing task-related network reorganization (Kitzbichler et al., 2011; Kinnison et al.,
2012; Ekman et al., 2012). Thus, the application of graph theory to neuroimaging data provides a growing
body of evidence in favor of the GWT.
When interpreting results of this and previous studies and pondering the aforementioned discrepancies and
similarities it is important to keep in mind that functional connectivity is a broad concept including various
types
of interactions
(Friston,
2011).
Recently,
it was proposed
that two
different functional
coupling/connectivity modes exist: (i) slow envelope coupling captured by correlations between BOLD
signals and (ii) dynamic phase coupling captured by phase locking (Engel et al., 2013; Mehrkanoon et al.,
2014). While the envelope coupling has a “modulatory” influence on cognition, the phase coupling is
identified with cognitive processing itself. Therefore, the networks representing phase coupling are more
likely to dynamically adjust topology during cognition, which is what we observed. Yet, it is important to
note that also fMRI studies found task-related changes in global topology (Ekman et al., 2012; Bassett et al.,
2011) hence the relationship between the coupling modes and the task-related reorganization might be far
from obvious.
bioRxiv preprint first posted online December 19, 2014; doi: http://dx.doi.org/10.1101/012922; The copyright
holder for this preprint is the author/funder. All rights reserved. No reuse allowed without permission.
Notably, the modules we found in the event-related EEG networks (both uni- and multi-layer) were not
spatially coherent, i.e. distant nodes often belong to the same module while adjacent nodes belong to
different modules (see: Figure 9). This is in sharp contrast to previous studies of anatomical networks and
fMRI functional networks where spatially coherent modules were found (review: Meunier et al., 2010). Yet,
this discrepancy might in fact be explained by the two aforementioned modes of coupling. Actually, the
postulated mechanism of cognition is transient phase-synchronization of “neural coalitions” comprising
spatially distributed neural assemblies (Crick and Koch, 2003), and in the graph theory framework such
“coalitions” might be identified with spatially widespread, incoherent modules.
The architecture of cognitive networks
We revealed reorganization of functional large-scale networks’ during cognition but two questions remain.
Firstly, what is the exact pattern of network reorganization, and secondly, what is the functional role of the
reorganization pattern in cognition (i.e. how can it support information processing). A wide range of graph
measures used in our study provided a comprehensive picture of the cognition-related reorganization and
thus allowed us to propose a specific “fingerprint” of event-related reorganization.
Network clustering is typically strong in modular networks where modules comprise highly interconnected
nodes. Thus, the two simultaneous occurring effects - increase of clustering and decrease of modularity seem to be at odds with each other. Yet, it is the case only if one assumes that the increase of clustering must
take place within modules. Conversely, we hypothesized that an increase in clustering is driven by
connections established between modules, i.e. between the hub-nodes. If this is the case, then such intermodular connections cause also decrease of modularity, as the initially clear-cut borders between modules
become vague (Fig. 10). The analysis of RCC seems to confirm this hypothesis as inter-connectivity
between rich-club nodes increased during cognition. Therefore, although increased clustering is typically
interpreted as a shift towards local segregation of information within modules, here we view increasing
clustering as indicative of dense, clustered connectivity between hub-nodes which allows extensive global
integration of information (Sporns, 2013). Importantly, previous studies investigating cognitive networks
across a range of tasks and using different analysis methods found a similar decrease of modularity and shift
towards global integration of information (Kitzbichler et al., 2011; Kinnison et al., 2012; Ekman et al.,
2012). This raises the possibility that this particular reorganization pattern accompanies different cognitive
processes and is a genuine network “fingerprint” of cognition. This hypothesis needs to be tested by future
studies.
The hypothesis that inter-modular connections are dynamically established between hub-nodes is in line
with recent fMRI studies. The most dynamic connections in the resting-state are indeed the inter-modular
connections (Zalesky et al. 2014) and flexibility of the inter-modular connectivity of hub-nodes is crucial for
bioRxiv preprint first posted online December 19, 2014; doi: http://dx.doi.org/10.1101/012922; The copyright
holder for this preprint is the author/funder. All rights reserved. No reuse allowed without permission.
task execution (Cole et al. 2013, 2014) and for the self-generated thoughts (Schaefer et al. 2014). The intermodular connections are also most costly in terms of energy (Bullmore and Sporns, 2012), and thus might
be established primarily during execution of a demanding task, but to a lesser extent at rest. Importantly,
disruption of the hub-nodes is believed to be the common mechanism of neurological and neuropsychiatric
disorders affecting cognition (Crossley et al., 2014).
Changes in clustering of event-related networks might also inform us whether cognitive networks exhibit
rather “hierarchical” or rather “parallel” architecture. In the hierarchical architecture one hub-area is
essential for processing and all other brain areas involved are coupled to the hub but not to each other.
Conversely, in a flexible and parallel architecture several regions might exchange information but none of
them plays the central or “lead” role. Hierarchical and parallel architecture would be characterized by low or
high clustering coefficient, respectively. Thus, the observed increase in clustering lends support to the model
of parallel architecture of the task-related networks. The strong k-cores provide further evidence for strong,
parallel sub-network linking nodes most important to the task. Interestingly, a parallel, small-world
architecture with strong interactions between core and periphery present at the stimulus onset facilitates
stimulus processing and task performance (Ekman et al. 2012; Weisz et al., 2014). Yet, it is also important
to consider the transitivity of correlation measures (i.e. if A is correlated with B, and A is correlated with C,
then B is likely correlated with C) which is one of the limitations of functional connectivity analysis (see:
Zalesky et al., 2012; Fornito et al., 2013). Due to this property functional networks are by definition
clustered, and that might lead to overestimation of the “parallel” network circuits.
Methodological considerations and limitations
Although the majority of neuroscience studies employed binary (un-weighted) graphs, here we focused on
the weighted graphs which contain more information and thus might ensure greater sensitivity (e.g. Rubinov
et al., 2009). Indeed, weighted networks seem to be more sensitive as they indicate topological changes also
in response to distractors (Fig. 4), while binary networks did not capture this effect (Fig. 8). We also noticed
that results of the analysis of weighted networks depend to a lesser extent on chosen parameters (e.g. density
of the networks). But importantly, analyses of weighted and binary graph were in good agreement with
respect to the main effects of the study (i.e. theta-band network reorganization).
When analyzing large-scale neurophysiological networks using M/EEG the common problem is nonphysiological spread of electrical activity through volume conduction causing spurious correlations between
signals. Here, the wMNE algorithm was used to address this problem. wMNE is believed to be an optimal
source reconstruction methods for large-scale functional connectivity analysis (Hassan et al., 2014; Palva
and Palva, 2012). Yet, it is important to keep in mind that the source reconstruction algorithms can only
reduce the volume conduction problem, not address it completely.
bioRxiv preprint first posted online December 19, 2014; doi: http://dx.doi.org/10.1101/012922; The copyright
holder for this preprint is the author/funder. All rights reserved. No reuse allowed without permission.
Another issue to consider is that common feed-forward input and stimulus-locked transients might cause
phase-reset in a number of areas, which will artificially increase phase-synchronization among them despite
absence of genuine functional interactions. This problem actually occurs in all studies investigating eventrelated connectivity, and even in the resting-state input from area A might simultaneously phase-reset areas
B and C resulting in detection of functional connectivity between B and C without any true interaction. Yet,
the key contrast in the present study was between conditions (i.e. DIST vs. TARG) and the stimulus-related
transients were present in both conditions making it unlikely that they can account for the observed betweenconditions differences. Further, our analysis was focused on the “cognitive” period (300-600ms after
stimulus onset) and activity within this time-window is rather not caused by the initial feed-forward sweep
of activity. One of the proposed methods to address the stimulus-transient problem is to subtract the average
stimulus- locked response (i.e. ERP) from each single trial. But we did not use this method here as such
ERP-subtracted signals exhibit unknown properties, particularly in the “cognitive” time-window where brain
responses exhibit significant latency- and amplitude-variability (Truccolo et al., 2002). Therefore,
developing new (possibly multivariate) analysis techniques more reliably detecting genuine interactions is
required to ultimately address this problem.
Finally, in our study we define “cognition” in a broad and unspecific manner, as numerous basic cognitive
operations are likely to be performed during target detection in the oddball task (Polich, 2007). Yet, here we
decided to use the oddball task as it is a well-known model to study cognitive processing, often employed in
the clinical setting. Future studies are needed to reveal network correlates of more specific cognitive
processes.
Conclusions
The brain functional networks are highly dynamic and able to adjust topology on a very fine time-scale.
Here we propose that dense and clustered connectivity between hub-nodes belonging to different modules is
the network “fingerprint” of cognition. Such rearrangement might support global integration of information
among specific subsystems and provide network substrate for the global workspace (Baars, 2002). It remains
to be studied whether the same “network fingerprint” is common to all cognitive operations and whether its’
disruption can be observed in pathological states where cognitive processing is impaired.
bioRxiv preprint first posted online December 19, 2014; doi: http://dx.doi.org/10.1101/012922; The copyright
holder for this preprint is the author/funder. All rights reserved. No reuse allowed without permission.
References
Allen EA, Damaraju E, Plis SM, Erhardt EB, Eichele T, Calhoun VD (2014) Tracking whole-brain
connectivity dynamics in the resting state. Cerebral Cortex 24:663-676.
Baars BJ (2002) The conscious access hypothesis: origins and recent evidence. Trends Cogn Sci 6:47-52.
Baars BJ, Franklin S, Ramsoy TZ (2013) Global workspace dynamics: cortical “binding and propagation”
enables conscious contents. Front Psychology 4.
Baker AP, Brookes MJ, Rezek IA, Smith SM, Behrens T, Smith PJP, Woolrich M (2014) Fast transient
networks in spontaneous human brain activity. Elife 3.
Bassett DS, Bullmore ED (2006) Small-world brain networks. Neuroscientist 12:512-523.
Bassett DS, Meyer-Lindenberg A, Achard S, Duke T, Bullmore E (2006) Adaptive reconfiguration of fractal
small-world human brain functional networks. Proc Natl Acad Sci USA 103:19518-19523.
Bassett DS, Wymbs NF, Rombach MP, Porter MA, Mucha PJ, Grafton ST (2013) Task-based coreperiphery organization of human brain dynamics. PLoS Comput Biol 9:e1003171.
Betti V, Della Penna S, de Pasquale F, Mantini D, Marzetti L, Romani GL, Corbetta M (2013) Natural
scenes viewing alters the dynamics of functional connectivity in the human brain. Neuron 79:782-797.
Betzel RF, Erickson MA, Abell M, O'Donnell BF, Hetrick WP, Sporns O (2012) Synchronization dynamics
and evidence for a repertoire of network states in resting EEG. Frontiers in Computational Neuroscience 6
Boersma M, Smit DJ, de Bie H, Van Baal GCM, Boomsma DI, de Geus EJ, Delemarre-van de Waal HA,
Stam CJ (2011) Network analysis of resting state EEG in the developing young brain: structure comes with
maturation. Hum Brain Mapp 32:413-425.
Bola M, Gall C, Moewes C, Fedorov A, Hinrichs H, Sabel BA (2014) Brain functional connectivity network
breakdown and restoration in blindness. Neurology 83:542-551.
Brainard DH (1997) The psychophysics toolbox. Spatial Vision 10:433-436.
Bullmore E, Sporns O (2012) The economy of brain network organization. Nat Rev Neurosci 13:336-349.
Bullmore ET, Suckling J, Overmeyer S, Rabe-Hesketh S, Taylor E, Brammer MJ (1999) Global, voxel, and
cluster tests, by theory and permutation, for a difference between two groups of structural MR images of the
brain. Med Imag IEEE Trans 18:32-42.
Caeyenberghs K, Leemans A, Heitger MH, Leunissen I, Dhollander T, Sunaert S, Dupont P, Swinnen SP
(2012) Graph analysis of functional brain networks for cognitive control of action in traumatic brain injury.
Brain 135:1293-1307.
Cole MW, Bassett DS, Power JD, Braver TS, Petersen SE (2014) Intrinsic and task-evoked network
architectures of the human brain. Neuron 83:238-251.
Cole MW, Reynolds JR, Power JD, Repovs G, Anticevic A, Braver TS (2013) Multi-task connectivity
reveals flexible hubs for adaptive task control. Nat Neurosci 16:1348-1355.
Colizza V, Flammini A, Serrano MA, Vespignani A (2006) Detecting rich-club ordering in complex
networks. Nat Phys 2:110-115.
bioRxiv preprint first posted online December 19, 2014; doi: http://dx.doi.org/10.1101/012922; The copyright
holder for this preprint is the author/funder. All rights reserved. No reuse allowed without permission.
Crick F, Koch C (2003) A framework for consciousness. Nat Neurosci 6:119-126.
Crossley NA, Mechelli A, Scott J, Carletti F, Fox PT, McGuire P, Bullmore ET (2014) The hubs of the
human connectome are generally implicated in the anatomy of brain disorders. Brain 137:2382-2395.
Crossley NA, Mechelli A, Vértes PE, Winton-Brown TT, Patel AX, Ginestet CE, McGuire P, Bullmore ET
(2013). Cognitive relevance of the community structure of the human brain functional coactivation network.
Proc Natl Acad Sci USA 110:11583-11588.
De Vico Fallani F, Astolfi L, Cincotti F, Mattia D, Tocci A, Salinari S, Marciani MG, Witte H, Colosimo A,
Babiloni F (2008) Brain network analysis from high-resolution EEG recordings by the application of
theoretical graph indexes. Neural Systems Rehab Eng IEEE Trans 16:442-452.
Dehaene S, Changeux JP (2011) Experimental and theoretical approaches to conscious processing. Neuron
70:200-227.
Delorme A, Makeig S (2004) EEGLAB: an open source toolbox for analysis of single-trial EEG dynamics
including independent component analysis. J Neurosci Meth 134:9-21.
Desikan RS, Ségonne F, Fischl B, Quinn BT, Dickerson BC, Blacker D, Buckner RL, Dale AM, Maguire
RP, Hyman BT, et al (2006) An automated labeling system for subdividing the human cerebral cortex on
MRI scans into gyral based regions of interest. Neuroimage 31:968-980.
Doron KW, Bassett DS, Gazzaniga MS (2012) Dynamic network structure of interhemispheric coordination.
Proc Natl Acad Sci USA 109:18661-18668.
Ekman M, Derrfuss J, Tittgemeyer M, Fiebach CJ (2012) Predicting errors from reconfiguration patterns in
human brain networks. Proc Natl Acad Sci USA 109:16714-16719.
Engel AK, Gerloff C, Hilgetag CC, Nolte G (2013) Intrinsic coupling modes: multiscale interactions in
ongoing brain activity. Neuron 80:867-886.
Fornito A, Zalesky A, Breakspear M (2013) Graph analysis of the human connectome: promise, progress,
and pitfalls. Neuroimage 80:426-444.
Friston KJ (2011) Functional and effective connectivity: a review. Brain Conn 1:13-36.
Gaillard R, Dehaene S, Adam C, Clémenceau S, Hasboun D, Baulac M, Cohen L, Naccache L (2009)
Converging intracranial markers of conscious access. PLoS Biol 7:e1000061.
Gramfort A, Papadopoulo T, Olivi E, Clerc M (2010) OpenMEEG: opensource software for quasistatic
bioelectromagnetics. Biomed Eng Online 9:45.
Groppe, DM, Urbach, TP, and Kutas, M (2011) Mass univariate analysis of event‐related brain
potentials/fields I: A critical tutorial review. Psychophysiology 48:1711-1725.
Hämäläinen MS, Ilmoniemi RJ (1994) Interpreting magnetic fields of the brain: minimum norm estimates.
Med Biol Eng Comput 32:35-42.
Hassan M, Dufor O, Merlet I, Berrou C, Wendling, F (2014) EEG source connectivity analysis: from dense
array recordings to brain networks. PloS One 9:e105041.
Hipp JF, Engel AK, Siegel M (2011) Oscillatory synchronization in large-scale cortical networks predicts
perception. Neuron 69:387-396.
bioRxiv preprint first posted online December 19, 2014; doi: http://dx.doi.org/10.1101/012922; The copyright
holder for this preprint is the author/funder. All rights reserved. No reuse allowed without permission.
Humphries MD, Gurney K (2008) Network ‘small-world-ness’: a quantitative method for determining
canonical network equivalence. PloS One 3:e0002051.
Jin SH, Lin P, Hallett M (2012) Reorganization of brain functional small‐world networks during finger
movements. Hum Brain Mapp 33:861-872.
Kitzbichler MG, Henson RN, Smith ML, Nathan PJ, Bullmore ET (2011) Cognitive effort drives workspace
configuration of human brain functional networks. J Neurosci 31:8259-8270.
Kopell NJ, Gritton HJ, Whittington MA, Kramer MA (2014) Beyond the Connectome: The Dynome.
Neuron 83:1319-1328.
Kybic J, Clerc M, Abboud T, Faugeras O, Keriven R, Papadopoulo T (2005) A common formalism for the
integral formulations of the forward EEG problem. Med Imag IEEE Trans 24:12-28.
Lachaux JP, Rodriguez E, Martinerie J, Varela FJ (1999) Measuring phase synchrony in brain signals. Hum
Brain Mapp 8:194-208.
Langer N, Pedroni A, Gianotti LR, Hänggi J, Knoch D, Jäncke L (2012) Functional brain network efficiency
predicts intelligence. Hum Brain Mapp 33:1393-1406.
Lin FH, Belliveau JW, Dale AM, Hämäläinen MS (2006) Distributed current estimates using cortical
orientation constraints. Hum Brain Mapp 27:1-13.
Lord A, Horn D, Breakspear M, Walter M (2012) Changes in community structure of resting state functional
connectivity in unipolar depression. PloS One 7:e41282.
Maris E, Oostenveld R (2007) Nonparametric statistical testing of EEG-and MEG-data. J Neurosci Meth
164:177-190.
Mazaheri A, Picton TW (2005) EEG spectral dynamics during discrimination of auditory and visual targets.
Cogn Brain Res 24:81-96.
Mehrkanoon S, Breakspear M, Britz J, Boonstra TW (2014) Intrinsic Coupling Modes in SourceReconstructed Electroencephalography. Brain Conn, Ahead of print, doi:10.1089/brain.2014.0280:
Mennes M, Kelly C, Colcombe S, Castellanos, FX, Milham, MP (2013) The extrinsic and intrinsic
functional architectures of the human brain are not equivalent. Cereb Cortex 23:223-229.
Meunier D, Lambiotte R, Bullmore ET (2010) Modular and hierarchically modular organization of brain
networks. Front Neurosci 4.
Mucha PJ, Richardson T, Macon K, Porter MA, Onnela JP (2010) Community structure in time-dependent,
multiscale, and multiplex networks. Science 328:876-878.
Newman ME (2003) The structure and function of complex networks. SIAM Rev 45:167-256.
Newman ME, Girvan M (2004) Finding and evaluating community structure in networks. Phys Rev E
69:026113.
Nicol RM, Chapman SC, Vértes PE, Nathan PJ, Smith ML, Shtyrov Y, Bullmore ET (2012) Fast
reconfiguration of high-frequency brain networks in response to surprising changes in auditory input. J
Neurophysiol 107:1421-1430.
bioRxiv preprint first posted online December 19, 2014; doi: http://dx.doi.org/10.1101/012922; The copyright
holder for this preprint is the author/funder. All rights reserved. No reuse allowed without permission.
Nolte G, Bai O, Wheaton L, Mari Z, Vorbach S, Hallett M (2004) Identifying true brain interaction from
EEG data using the imaginary part of coherency. Clin Neurophysiol 115:2292-2307.
Opsahl T, Colizza V, Panzarasa P, Ramasco JJ (2008) Prominence and control: The weighted rich-club
effect. Phys Review Lett 101:168702.
Palva S, Monto S, Palva, JM (2010) Graph properties of synchronized cortical networks during visual
working memory maintenance. Neuroimage 49:3257-3268.
Palva S, Palva JM (2012) Discovering oscillatory interaction networks with M/EEG: challenges and
breakthroughs. Trends Cogn Sci 16:219-230.
Papo D, Zanin M, Pineda-Pardo JA, Boccaletti S, Buldú JM (2014) Functional brain networks: great
expectations, hard times and the big leap forward. Philos T Roy Soc B 369:20130525.
Park HJ, Friston K (2013) Structural and functional brain networks: from connections to cognition. Science
342:1238411.
Pelli DG (1997) The VideoToolbox software for visual psychophysics: Transforming numbers into movies.
Spatial Vision 10:437-442.
Polich J (2007) Updating P300: an integrative theory of P3a and P3b. Clin Neurophysiol 118:2128-2148.
Rubinov M, Knock SA, Stam CJ, Micheloyannis S, Harris AW, Williams LM, Breakspear, M (2009) Small‐
world properties of nonlinear brain activity in schizophrenia. Hum Brain Mapp 30:403-416.
Rubinov M, Sporns O (2010) Complex network measures of brain connectivity: uses and interpretations.
Neuroimage 52:1059-1069.
Rubinov M, Sporns O (2011) Weight-conserving characterization of complex functional brain networks.
Neuroimage 56:2068-2079.
Schaefer A, Margulies DS, Lohmann G, Gorgolewski KJ, Smallwood J, Kiebel SJ, Villringer A (2014)
Dynamic network participation of functional connectivity hubs assessed by resting-state fMRI. Front Human
Neurosci 8.
Siegel M, Donner TH, Engel AK (2012) Spectral fingerprints of large-scale neuronal interactions. Nat Rev
Neurosci 13:121-134.
Sporns O (2013) Network attributes for segregation and integration in the human brain. Curr Opin Neurobiol
23:162-171.
Sporns O, Chialvo DR, Kaiser M, Hilgetag CC (2004) Organization, development and function of complex
brain networks. Trends Cogn Sci 8:418-425.
Stam CJ (2010) Characterization of anatomical and functional connectivity in the brain: a complex networks
perspective. Int J Psychophysiol 77:186-194.
Stam CJ, De Haan W, Daffertshofer A, Jones BF, Manshanden I, Van Walsum AVC, Montez T, Verbunt
JPA, de Munck JC, van Dijk BW, et al (2009) Graph theoretical analysis of magnetoencephalographic
functional connectivity in Alzheimer's disease. Brain 132:213-224.
Tadel F, Baillet S, Mosher JC, Pantazis D, Leahy RM (2011) Brainstorm: a user-friendly application for
MEG/EEG analysis. Comput Intell Neurosci 8.
bioRxiv preprint first posted online December 19, 2014; doi: http://dx.doi.org/10.1101/012922; The copyright
holder for this preprint is the author/funder. All rights reserved. No reuse allowed without permission.
Telesford, Q K, Joyce, K E, Hayasaka, S, Burdette, J H, and Laurienti, P J (2011) The ubiquity of smallworld networks. Brain Conn 1:367-375.
Truccolo WA, Ding M, Knuth KH, Nakamura R, Bressler SL (2002) Trial-to-trial variability of cortical
evoked responses: implications for the analysis of functional connectivity. Clin Neurophysiol, 113:206-226.
Valencia M, Martinerie J, Dupont S, Chavez M (2008) Dynamic small-world behavior in functional brain
networks unveiled by an event-related networks approach. Physical Rev E 77:050905.
van den Heuvel MP, Sporns O (2011) Rich-club organization of the human connectome. J Neurosci
31:15775-15786.
van den Heuvel MP, Stam CJ, Kahn RS, Pol HEH (2009) Efficiency of functional brain networks and
intellectual performance. J Neurosci 29:7619-7624.
Varela F, Lachaux JP, Rodriguez E, Martinerie J (2001) The brainweb: phase synchronization and largescale integration. Nat Rev Neurosci 2:229-239.
Wang L, Li Y, Metzak P, He Y, Woodward TS (2010) Age-related changes in topological patterns of largescale brain functional networks during memory encoding and recognition. Neuroimage 50:862-872.
Weisz N, Wühle A, Monittola G, Demarchi G, Frey J, Popov T, Braun, C (2014) Prestimulus oscillatory
power and connectivity patterns predispose conscious somatosensory perception. Proc Natl Acad Sci USA
111:E417-E425.
Zalesky A, Fornito A, Bullmore E (2012) On the use of correlation as a measure of network
connectivity. Neuroimage 60:2096-2106.
Zalesky A, Fornito A, Cocchi L, Gollo LL, Breakspear M (2014) Time-resolved resting-state brain
networks. Proc Natl Acad Sci USA 111:10341-10346.
bioRxiv preprint first posted online December 19, 2014; doi: http://dx.doi.org/10.1101/012922; The copyright
holder for this preprint is the author/funder. All rights reserved. No reuse allowed without permission.
Fig 1. Analysis pipeline. Data are preprocessed, divided into stimulus-locked epochs, and projected into the
source-space using the weighted MNE algorithm. Signals of the seed voxels of 68 anatomical brain regions
are decomposed with a Morlet wavelet. For each time- and frequency-point a full adjacency matrix
containing PLV estimates is created (in the figure color represents coupling strength). Each PLV matrix is
thresholded to create sparse, weighted, undirected graph. Topology of each graph is characterized with
graph measures. Graph measures are then represented in the time-frequency space and tested statistically.
bioRxiv preprint first posted online December 19, 2014; doi: http://dx.doi.org/10.1101/012922; The copyright
holder for this preprint is the author/funder. All rights reserved. No reuse allowed without permission.
Fig 2. Event-related potentials (ERP) and spectral power in response to distractors (DIST) and targets
(TARG) in the oddball task. (A) ERPs averaged over 5 parietal electrodes and presented as mean (solid
lines) ± SEM (shaded regions). Black bars below ERPs represent time points with significant difference
between conditions. Yellow vertical line represents mean reaction time (RT) to targets. (B) Spectral power
changes averaged over all channels and plotted as 10log10 change over baseline. Two panels below and the
panel on the right side show results of the statistical comparisons. Red color indicates time-frequency
regions significantly different from baseline (panels below) or between conditions (right side). Blue color
indicates no significant difference.
bioRxiv preprint first posted online December 19, 2014; doi: http://dx.doi.org/10.1101/012922; The copyright
holder for this preprint is the author/funder. All rights reserved. No reuse allowed without permission.
Fig 3. Strength of weighted event-related networks. Results obtained with two connectivity measures are
presented: phase locking value (PLV; A, C) and imaginary part of coherence (iCoh; B). (A, B) Network
strength defined as average over weights of all connections is plotted as change over baseline in timefrequency plot (upper panel) and in time for the theta band (lower panel). The panels depict results of
statistical comparisons organized as in Fig 2B with red indicating statistically significant difference. (C)
Change over baseline of nodal strength in the theta-band PLV network defined as sum of weights of all
connections coupled to a node.
bioRxiv preprint first posted online December 19, 2014; doi: http://dx.doi.org/10.1101/012922; The copyright
holder for this preprint is the author/funder. All rights reserved. No reuse allowed without permission.
bioRxiv preprint first posted online December 19, 2014; doi: http://dx.doi.org/10.1101/012922; The copyright
holder for this preprint is the author/funder. All rights reserved. No reuse allowed without permission.
Fig 4. Reorganization of the weighted event-related networks quantified with graph measures. Graph
measures plotted in time-frequency plots (upper panels) and in time for the theta band (lower panels). Panels
depicting results of statistical comparisons organized in the same manner as in Fig 2 and 3. (E) Change over
baseline in theta-band nodal CC.
Fig. 5. Reorganization of modular structure in the weighted event-related networks. (A) Modularity was
studied in two types of networks crated from the same data. In uni-layer networks parameters (Quni and
number of modules) were calculated for each time point separately while in multi-layer networks Qml,
number of modules, and flexibility were calculated for the whole multilayer network. (B, D) The difference
(Δ) between features of real uni-layer (B) and multilayer (D) networks and null networks were calculated for
each subject. Both uni-layer and multi-layer networks exhibited modular structure as indicated by higher
Quni/ml and smaller number of modules than in null models. (C, E) Further, to test modularity during
cognitive processing network features were compared between conditions. Absolute values are plotted for
uni-layer networks and time-points where significant difference between conditions was found are marked
with a black bar (C). For multi-layer networks the difference between targets and distractors is plotted for
each subject (E). Result of statistical comparisons: *p<0.05 **p<0.01 ***p<0.001 ****p<1x10⁻⁷
bioRxiv preprint first posted online December 19, 2014; doi: http://dx.doi.org/10.1101/012922; The copyright
holder for this preprint is the author/funder. All rights reserved. No reuse allowed without permission.
Fig. 6. Reorganization of the network core in the event-related networks. (A) Rich-Club Coefficient (RCC;
rcK=25) plotted in the time-frequency plots (upper panel) and in time for the theta band (lower panel).
Panels depicting results of statistical comparisons organized in the same manner as in Fig 2 and 3. (B) The
RCC difference between conditions in the theta band at 500ms plotted as a function of rcK. Each subject is
plotted in one color and yellow vertical line indicated rcK for RCC plotted in A. Higher RCC during target
processing can be found across wide range of rcK. (C) K-core of the theta band network at baseline and at
500ms after target presentation plotted for each subject.
bioRxiv preprint first posted online December 19, 2014; doi: http://dx.doi.org/10.1101/012922; The copyright
holder for this preprint is the author/funder. All rights reserved. No reuse allowed without permission.
Fig. 7.
Control analyses of the weighted event-related networks. The yellow vertical line indicates the value
of each parameter in the main analysis. In all plots the difference between conditions (TARG-DIST) for
each subject (different colors) is depicted. (A) Graph measures plotted against network density. (B, C) Unilayer modularity was calculated across range of densities and resolution parameter gamma values. (D-F)
Multi-layer modularity was calculated across range of densities, resolution parameter gamma, and betweenlayer coupling parameter omega. Results of statistical comparisons: *p<0.05 **p<0.01 ***p<0.001
****p<1x10⁻⁷
bioRxiv preprint first posted online December 19, 2014; doi: http://dx.doi.org/10.1101/012922; The copyright
holder for this preprint is the author/funder. All rights reserved. No reuse allowed without permission.
Fig. 8. Reorganization of event-related binary networks quantified with graph measures. (A-B) Graph
measures plotted in time-frequency plots. Panels organized as in Fig. 4. Modularity of uni-layer (C) and
multi-layer binary networks (D) plotted as in Fig. 5. (E) Rich-Club Coefficient (RCC). Results of statistical
comparisons: *p<0.05 **p<0.01 ***p<0.001 ****p<1x10⁻⁷
bioRxiv preprint first posted online December 19, 2014; doi: http://dx.doi.org/10.1101/012922; The copyright
holder for this preprint is the author/funder. All rights reserved. No reuse allowed without permission.
Fig. 9. Weighted event-related networks of cognitive processing: a single-subject analysis. (A) Network
strength and (B) clustering coefficient plotted in time-frequency plots. (C) Snapshots of the theta-band
weighted network (density=0.12) at two time-points. The difference plot depicts edges present at baseline
but missing during cognitive processing (in red), and edges present during cognitive processing but missing
at baseline (in green). (D) Spatio-temporal dynamics of community structure in the theta band network
(multi-layer analysis). Each module is represented by one color. Below, snapshots of the community
structure at two time-points.
bioRxiv preprint first posted online December 19, 2014; doi: http://dx.doi.org/10.1101/012922; The copyright
holder for this preprint is the author/funder. All rights reserved. No reuse allowed without permission.
Fig. 10. The proposed network topological “fingerprint” of cognition. In this scheme baseline network is
characterized by modular structure (with four modules here) and high clustering within modules, in
agreement with the literature. Hub-nodes (in magenta) exhibit high degree and transfer information across
modules. We propose that dense and clustered inter-modular connectivity (in green) among hub-nodes is
established during cognition. Such reorganization pattern accounts for the three findings of the present
study, namely: (i) increase in clustering; (ii) decrease in modularity; (iii) increase in Rich-Club Coefficient.


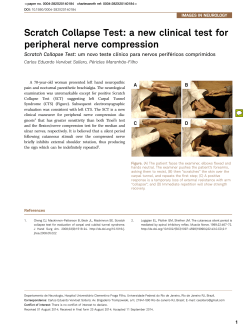
© Copyright 2026