
Provisional PDF - BioMed Central
BMC Genomics
This Provisional PDF corresponds to the article as it appeared upon acceptance. Fully formatted
PDF and full text (HTML) versions will be made available soon.
The use of genome wide association methods to investigate pathogenicity,
population structure and serovar in Haemophilus parasuis
BMC Genomics 2014, 15:1179
doi:10.1186/1471-2164-15-1179
Kate J Howell ([email protected])
Lucy A Weinert ([email protected])
Roy R Chaudhuri ([email protected])
Shi-Lu Luan ([email protected])
Sarah E Peters ([email protected])
Jukka Corander ([email protected])
David Harris ([email protected])
Øystein Angen ([email protected])
Virginia Aragon ([email protected])
Albert Bensaid ([email protected])
Susanna M Williamson ([email protected])
Julian Parkhill ([email protected])
Paul R Langford ([email protected])
Andrew N Rycroft ([email protected])
Brendan W Wren ([email protected])
Matthew T Holden ([email protected])
Alexander W Tucker ([email protected])
Duncan J Maskell ([email protected])
ISSN
Article type
1471-2164
Research article
Submission date
30 June 2014
Acceptance date
12 December 2014
Publication date
24 December 2014
Article URL
http://www.biomedcentral.com/1471-2164/15/1179
Like all articles in BMC journals, this peer-reviewed article can be downloaded, printed and
distributed freely for any purposes (see copyright notice below).
Articles in BMC journals are listed in PubMed and archived at PubMed Central.
© 2014 Howell et al.
This is an Open Access article distributed under the terms of the Creative Commons Attribution License (http://creativecommons.org/licenses/by/4.0), which
permits unrestricted use, distribution, and reproduction in any medium, provided the original work is properly credited. The Creative Commons Public Domain
Dedication waiver (http://creativecommons.org/publicdomain/zero/1.0/) applies to the data made available in this article, unless otherwise stated.
BMC Genomics
For information about publishing your research in BMC journals or any BioMed Central journal, go to
http://www.biomedcentral.com/info/authors/
© 2014 Howell et al.
This is an Open Access article distributed under the terms of the Creative Commons Attribution License (http://creativecommons.org/licenses/by/4.0), which
permits unrestricted use, distribution, and reproduction in any medium, provided the original work is properly credited. The Creative Commons Public Domain
Dedication waiver (http://creativecommons.org/publicdomain/zero/1.0/) applies to the data made available in this article, unless otherwise stated.
The use of genome wide association methods to
investigate pathogenicity, population structure and
serovar in Haemophilus parasuis
Kate J Howell1*
*
Corresponding author
Email: [email protected]
Lucy A Weinert1
Email: [email protected]
Roy R Chaudhuri2
Email: [email protected]
Shi-Lu Luan1
Email: [email protected]
Sarah E Peters1
Email: [email protected]
Jukka Corander3
Email: [email protected]
David Harris4
Email: [email protected]
Øystein Angen5
Email: [email protected]
Virginia Aragon6
Email: [email protected]
Albert Bensaid6
Email: [email protected]
Susanna M Williamson7
Email: [email protected]
Julian Parkhill4
Email: [email protected]
Paul R Langford8
Email: [email protected]
Andrew N Rycroft9
Email: [email protected]
Brendan W Wren10
Email: [email protected]
Matthew T G Holden11
Email: [email protected]
Alexander W Tucker1
Email: [email protected]
Duncan J Maskell1
Email: [email protected]
on behalf of the BRADP1T Consortium
1
Department of Veterinary Medicine, University of Cambridge, Madingley Road,
Cambridge CB3 0ES, UK
2
Department of Molecular Biology and Biotechnology, University of Sheffield,
Firth Court, Western Bank, Sheffield S10 2TN, UK
3
Department of Mathematics and Statistics, University of Helsinki, Helsinki
00100, Finland
4
The Wellcome Trust Sanger Institute, Wellcome Trust Genome Campus,
Hinxton, Cambridge CB10 1SA, UK
5
Norwegian Veterinary Institute, N-0106 Oslo, Norway
6
Centre de Recerca en Sanitat Animal (CReSA), UAB-IRTA, Campus de la
Universitat Autònoma de Barcelona, 08193, Bellaterra, and Institut de Recerca i
Tecnologia Agroalimentàries (IRTA), Barcelona, Spain
7
Animal Health and Veterinary Laboratories Agency (AHVLA), Rougham Hill,
Bury St Edmunds, Suffolk IP33 2RX, UK
8
Department of Medicine, Section of Paediatrics, Imperial College London, St.
Mary’s Campus, London W2 1PG, UK
9
The Royal Veterinary College, Hawkshead Campus, Hatfield AL9 7TA,
Hertfordshire, UK
10
Faculty of Infectious & Tropical Diseases, London School of Hygiene &
Tropical Medicine, Keppel Street, London WC1E 7HT, UK
11
School of Medicine, University of St. Andrews, St Andrews KY16 9TF, UK
Abstract
Background
Haemophilus parasuis is the etiologic agent of Glässer’s disease in pigs and causes
devastating losses to the farming industry. Whilst some hyper-virulent isolates have been
described, the relationship between genetics and disease outcome has been only partially
established. In particular, there is weak correlation between serovar and disease phenotype.
We sequenced the genomes of 212 isolates of H. parasuis and have used this to describe the
pan-genome and to correlate this with clinical and carrier status, as well as with serotype.
Results
Recombination and population structure analyses identified five groups with very high rates
of recombination, separated into two clades of H. parasuis with no signs of recombination
between them. We used genome-wide association methods including discriminant analysis of
principal components (DAPC) and generalised linear modelling (glm) to look for genetic
determinants of this population partition, serovar and pathogenicity. We were able to identify
genes from the accessory genome that were significantly associated with phenotypes such as
potential serovar specific genes including capsule genes, and 48 putative virulence factors
that were significantly different between the clinical and non-clinical isolates. We also show
that the presence of many previously suggested virulence factors is not an appropriate marker
of virulence.
Conclusions
These genes will inform the generation of new molecular diagnostics and vaccines, and
refinement of existing typing schemes and show the importance of the accessory genome of a
diverse species when investigating the relationship between genotypes and phenotypes.
Keywords
Genome wide association study, Pan-genome, Recombination, DAPC, Virulence factors,
Population structure, Haemophilus parasuis
Background
Haemophilus parasuis is an important pathogen of pigs [1,2] but is also a frequent
commensal of their upper respiratory tracts. It causes polyserositis, meningitis and
septicaemia (known as Glässer’s disease) as well as pneumonia and pleurisy [3]. Historically,
H. parasuis caused disease in recently weaned piglets, but with the intensification of
production it now affects a wide age-range [4,5]. H. parasuis is the leading cause of
mortality, alongside the PRRS virus, in nursery herds in the USA, and is the third-most
important bacterial pathogen affecting finisher herds [6]. H. parasuis also contributes to
multi-factorial porcine respiratory disease complex, the leading cause of mortality in growerfinisher pigs in the USA [7]. H. parasuis is endemic in all pig farming countries and has a
major economic impact on the global pig industry, with costs including those for production
and stock losses, carcass disposal, and vaccination, as well as requiring antibiotic therapy [810].
The study of H. parasuis to date has classified the bacterium, originally using a gel immunodiffusion assay and more commonly now an indirect haemagglutination assay, into 15
different serovars with non-typeable isolates also frequently found [11,12]. The designation
of serovar in H. parasuis is thought to be predominantly due to the presence of a particular
polysaccharide capsule which is specific to each serovar (based on the reference strains) [1316]. Some serovars, especially 4, 5 and 13, cause disease more commonly than others [1720]. However, no absolute relationship between virulence and serovar has been found
[21,22]. The onset of disease has been linked to many factors, including physiological stress
and immune status, but the current study focuses on understanding the bacterial genetic
factors that might correlate with the establishment of disease.
Several experiments have tried to associate the bacterium’s genotype with phenotype, but
with limited success [23-29]. Experimental evidence to support definitive virulence factors in
H. parasuis is sparse and most studies have been limited to small numbers of isolates or
serovars. It is likely that the relationship between genotype and virulence phenotype is
complex [2,30-39]. The first H. parasuis genome to be sequenced was in 2010 [40], with
several further sequences released since then [41,42]. These have been used to design several
experiments, including searches for novel immunogenic proteins [43] and virulence factors
[38,44], but these few strains may not be reflective of the wider diversity of isolates that exist
in pig populations. Previous studies show that the pan-genome of a bacterial species can be
vast [45-49]. Recombination and lateral transfer are involved in creating the pan-genome,
which can be resolved into the core and accessory genomes. The boundaries of the core
genome can be extrapolated from a small number of genomes, but it is preferable to analyse a
large number of isolates for a more comprehensive definition [50-52]. An extensive amount
of variation can often be found within the accessory genome of a species and it is important
to investigate this source of variation to understand the adaptive potential of a given species
[48,53]. Reductions in cost have allowed the whole genome sequencing of many strains of
the same species, and this can provide the necessary statistical power required to find
associations between genotypes and phenotypes such as virulence. This variation is now
being explored in many pathogens including Campylobacter jejuni [54], Escherichia coli
[48,55,56], Haemophilus influenzae [57], Staphylococcus aureus [58] and Streptococcus
pneumoniae [59]. Such studies seek associations between phenotypes and genotypes that
would inform surveillance efforts, improve diagnostics, and aid understanding of the
pathogen, potentially yielding new treatments of the associated diseases.
In order to disentangle the genetic and environmental bases of Glässer’s disease, we
undertook a pan-genome analysis of 212 isolates of H. parasuis with high quality clinical
metadata, covering all serovars and isolates from disease- and non-disease-causing
backgrounds. We have investigated the key features of the pan-genome and assessed the
relationship between the genetics of this bacterium and collated metadata, using statistical
analyses of single nucleotide polymorphisms (SNPs) in the core genome, and the presence of
genes in the accessory genome. We compared our analyses to the distribution of previously
published virulence factors of H. parasuis within our collection of isolates. We found that the
composition of the accessory genome was a significant factor in determining whether isolates
were likely to cause disease. Our findings emphasise the importance of describing the pangenome of a bacterial species in order to understand pathogenesis, and to underpin a new
generation of vaccine and diagnostic candidates for endemic bacterial pathogens.
Results and discussion
Epidemiology of the isolate collection
The 212 isolates in the collection originate from the UK (n = 121 from 70 geographically
dispersed farms), Argentina (n = 1), Belgium (n = 1), China (n = 2), Denmark (n = 29),
Germany (n = 6), Greece (n = 1), Italy (n = 2), Japan (n = 7), Spain (n = 21), Sweden (n = 4),
Switzerland (n = 2) and the USA (n = 6), with nine isolates of unknown origin. Our analysis
included the reference strains of the 15 serovars and the published genomes of the US strain
29755, and the Chinese strains SH0165 and ZJ0906 [40,41,60]. The dates of collection
ranged between 1991–2008 for European isolates and 1955–1992 for the reference strains
[61]. For the UK isolates, we collected clinical metadata including veterinary diagnostic
information from necropsy, the tissue of isolation and details of any other signs of disease in
the pig. Clinical metadata for the other strains included tissue of origin, clinical signs and, for
a subset of strains, experimental reproduction of disease. We used this information to
categorise the isolates into clinical and non-clinical categories. A non-clinical isolate was an
isolate identified in the upper respiratory tract in the absence of any signs of respiratory or
systemic disease typical of infection with H. parasuis. A clinical isolate was an isolate
identified from an animal displaying signs of H. parasuis-related disease and isolated from a
respiratory or a systemic site. We divided the clinical isolates further into respiratory and
systemic, to reflect disease severity. Respiratory isolates were obtained from the lung without
signs of systemic disease elsewhere in the animal. Systemic isolates were obtained from a
systemic site e.g. brain, joint or blood which are sites typically affected in Glässer’s disease.
Isolates that were taken from the lung of an animal that also showed signs of systemic disease
were first tested in the statistical analyses as respiratory isolates and then as systemic. This
was to allow for the possibility of these isolates being from a co-infection in the same animal
or where the same isolate caused disease elsewhere in the same animal.
One hundred and seventeen of the isolates had been previously serotyped (including 15 that
were deemed non-typeable) and these included examples of all fifteen known serovars. For
details of the isolate collection including disease categories and serotyping results see
Additional file 2: Table S1. Analysis of the distribution of isolates by serovar and disease
association (Figure 1) showed that the most prevalent serovar in this collection was serovar 5,
followed by non-typeables (NT) and serovars 4 and 7, which fits with global prevalence data
[17-19]. Our data support the previous limited studies that show that certain serovars,
particularly 4 and 5, were more strongly linked to disease [18,61]. While serovar is still
important for the formulation of vaccine strategy against this bacterium, its relationship with
virulence has long been discussed but never proven [29,61]. The fact that there are nonclinical isolates within the same serovars highlights the limitation and uncertainty of
serotyping as a technique for predicting disease potential. We expect that there are isolates
amongst the non-clinical collection that will have the potential to cause clinical disease given
a different host or environment, and also that some of the clinical isolates caused disease due
to other environmental factors or co-infections. The main reason for this study was to
investigate the balance between the host, environment and genotypes for example serovar
determining factors, predicted virulence genes and to discover new gene associations with
phenotypes such as virulence. We propose that molecular epidemiological markers that relate
to severity of disease would be more useful for H. parasuis surveillance now that rapid
genome sequencing of isolates is possible. To achieve this goal we undertook pan-genome
and statistical analyses with the two-fold aim of identifying genes that correlate with
virulence and so could be worth investigating as markers of disease-causing potential, and
with serovar to allow the design of a molecular-based serotyping technique.
Figure 1 H. parasuis isolate collection displayed by serovar and disease. Each serovar
includes those found with cross-reactions. NT denotes ‘non-typeable’ by serotyping either
due to no reaction or due to more than three reactions to the serotyping antisera. Strains
without serotyping data are excluded.
The pan-genome of H. parasuis
We use the term pan-genome to refer to the set of all of the genes predicted from every
isolate in the collection. The pan-genome comprised homology groups encoding 7,431 genes
from the OrthoMCL analysis of the 212 isolates. Of these, 1,049 genes were found within all
isolates and so were designated as the core genome. This core genome is approximately 0.9
Mb of the 2.2 Mb average genome size with 65,137 SNPs identified. The accessory genome
was made up of 6,382 homology groups that varied between isolates. 329 of these homology
groups were classed as pseudogenes (with a minimum of 18 pseudogenes identified per
isolate), and 28.9% of these homology groups were identified in less than 1% of the isolates
in the collection. For details of the COG functional classification of the pan- genome see
Additional file 1.
Synteny of the pan-genome
The syntenic pan-genome of H. parasuis is the pan-genome reordered to reflect the
chromosomal location of each gene based on the SH0165 strain [40]. Genes were inserted
from contigs in descending size order, based on their order along each contig. As an iterative
process not all genes could be assigned to a location in the syntenic pan-genome. Therefore
the syntenic pan-genome of H. parasuis represents the 5,574 genes out of the total genes
where the position could be identified in the pan-genome order, and is shown in Additional
file 7: Figure S1. Several regions of variation can be seen within Additional file 7: Figure S1
with the location of many phage genes, highly variable regions and antibiotic resistance genes
denoted by colouring of the heat-map. The capsule genes did not cluster in one location in the
syntenic pan-genome, which may be due to recombination in the genomes, and so the synteny
of the capsule locus was established separately and can be seen in Additional file 8: Figure
S2. Several phages were identified within this collection including the Mu phage (regions 2,
3, 4 and 6), a siphovirus (which is predominantly found in the reference strains) as well as
other phage genes throughout the pan-genome. For details of genes identified within these
variable regions see Additional file 1. Briefly, within these regions we identified many phage
genes, two conjugal transfer operons, adhesins, toxins, iron-sulphur binding proteins and
many proteins of unknown function. Based on the similarity of the G + C content to the
average for this bacterium, many of the genes in region 1 appear to be from H. parasuis
genes that have yet to be characterised and submitted to NCBI. Regions 2, 3 and 4 contained
some genes of relatively high G + C content (40-50%) but no hits were found when BLAST
analysis was performed for these encoded proteins using the NCBI non-redundant protein
database (nr). Only region 6 contained multiple proteins with hits from nr to other bacterial
species including Actinobacillus, Gallibacterium, Klebsiella and Mannhaimia. The average G
+ C content of the pan-genome was 39.4% G + C content (±5.4%, which is the standard
deviation), ranging between 17.8-67.1% G + C content for all isolates, which is discussed
further in Additional file 1.
Population structure of H. parasuis
Identification of two divergent clades of H. parasuis
Analyses of the population structure of this isolate collection was performed using Bayesian
analysis of population structure (BAPS) [62,63] on the core genome. Five BAPS populations
were identified from these analyses, these represented groups within the overall population
that share similar SNPs and indicate a common ancestry with similar amounts of admixture.
The BAPS plot shown in Additional file 9: Figure S3 demonstrates the within-cluster and
between-cluster variation for the five BAPS populations based on the core genome. While the
partitioning of population structure in other bacteria has been reported before [64-66], further
analysis of the causes of the partitioning usually leads to an explanation dependent on
ecological separation e.g. due to geographical separation or restriction to different hosts or
tissues [56,66,67]. H. parasuis has only been identified in pigs and wild boar, and the route of
infection is via the nose and the upper respiratory tract and so are all able to inhabit the same
niche [3,68]. Furthermore, the global nature of the pig industry means that import and export
of stock occurs worldwide and so we did not expect that geographical separation would have
much influence on the population structure. We began our investigation into the population
structure by checking these potential ecological barriers by comparing our clinical metadata
(country, disease association and serovar) to the phylogenetic tree of the H. parasuis core
genome built from the concatenated core genes (Figure 2) [69,70]. The topology of the
phylogeny shows the segregation of the tree into two clades, which fits with the separation of
the BAPS populations with BAPS populations 3 and 5 found in clade 1 and groups 1, 2 and 4
in clade 2. We also investigated the correlation between the BAPS populations (level 1) and
the clinical metadata (Figure 3). When both the core genome and BAPS populations (Figures
2 and 3) were compared to the metadata, some separation of the serovars can be seen between
the two clades, with serovars 5, 12 and 13 identified predominantly in clade 1. Serovar 4 is
the only serovar to be found in equal proportions in both the clades. Serovar 7 is mostly
found in clade 2. For the remainder of the serovars, the number of isolates was too low to be
able to restrict them to one clade. In comparison, no influence of disease association on
population structure was observed, as the clinical isolates were found throughout the tree and
the BAPS populations (Figure 2). This is contradictory to the population grouping predicted
by the multi-locus sequence typing (MLST) scheme [27], which showed six main subgroups
on the MLST phylogeny; one predominantly clinical, one mostly non-clinical and four mixed
clades. Analysis of the individual BAPS populations in Figure 3, showed that BAPS
populations 4 and 5 contained very few non-clinical isolates (5.9% and 2.4% respectively).
Some geographic structure can be seen in Figure 2, with a greater proportion of the UK
isolates (n = 121) in clade 2 which is likely to be due to the large proportion of UK isolates in
the collection. With the global nature of the pig market it is not unexpected that isolates from
different geographic locations or serovars would be found in each of the BAPS populations.
Indeed, populations 2 and 5 are very mixed; indicating only limited separation by a
geographic barrier. The BAPS populations are also very mixed by tissue of isolation and so
no tissue tropism can be seen based on the population structure. Of the categories of
metadata, only serovar shows some association with the BAPS populations and the
differences in recombination. Therefore we conducted a second level BAPS analysis which
split the current five BAPS populations into more defined populations; however the second
level BAPS analysis still did not explain the population structure (Additional file 1).
Figure 2 Core genome Neighbor-joining tree (with areas of recombination included) of
H. parasuis (500 bootstraps). Trees are overlaid with the populations from the Bayesian
analysis of population structure (BAPS), which represent isolates with similar rates of
homologous recombination. Further metadata including disease association, serovar and
country of origin are also shown. BAPS populations explain the separation of the isolates on
the tree into two main clades.
Figure 3 The BAPS populations defined using Bayesian analysis of population structure
represent isolates with similar rates of homologous recombination. The BAPS
populations have been compared to serovar, disease association and country of origin. Some
similarity in the BAPS populations 3 and 5 can be seen based on serovar distribution. Very
little difference can be seen between BAPS population when disease association is
considered. UK isolates are overrepresented in BAPS populations 1, 3 and 4, while 2 and 5
are of mixed geographic origin.
High rates of recombination were identified in H. parasuis
Analysis of the regions undergoing recombination in the core genome was performed using
Bayesian recombination tracker (BratNextGen) [71] on the two separate clades present in
Figure 2. We decided to perform separate analyses because the long-branch separating clades
1 and 2 would reduce the statistical power to detect recombination in either clade in a joint
analysis. The recombination analysis was also performed using gubbins [59,72], which was
performed on the alignment for all isolates. We were able to calculate the recombination rate
relative to the mutation rate (r/m) or homologous recombination rate for the individual BAPS
populations using the output from gubbins; BAPS 1 had the highest r/m of 660, followed by
BAPS 5 (395), BAPS 3 (268), BAPS 4 (144) and finally BAPS 2 (87.9). However, each
BAPS population contained isolates with a range of recombination rates, with multiple
isolates with a r/m of 0. When the second level BAPS populations were considered, some
clusters of isolates with r/m of 0 were identified but the majority of these isolates were still
separated between the 18 groups identified in the second level analysis. Even with these
isolates with low estimates of recombination rates, the r/m for each BAPS population is very
high compared to published recombination rates in bacteria and is far higher than previously
estimated for H. parasuis. One previous study calculated the r/m for H. parasuis based on the
genes involved in the MLST scheme [73], and identified higher rates for the clinical isolates
(r/m 5.5) compared with the non-clinical isolates (r/m 2.7). Our estimates for the rates of
homologous recombination in H. parasuis far exceed the estimates based on the MLST
housekeeping genes. This may be due to purifying selection that is likely to be affecting
housekeeping genes and so the estimate based on the core genome, which contains far more
genetic information, should give a more informative estimate of recombination across the
genome [59,73].
The values of r/m of the two clades of H. parasuis estimated using both recombination
analysis methods were within an order of magnitude. The r/m for the first clade was 663 and
707.7, while the r/m for the second clade was estimated at 892.2 and 575.1, using gubbins
and BratNextGen respectively. While both methods yielded comparable estimates of
homologous recombination rates, the diversity in this H. parasuis population is greater than is
usually included in the analysis using gubbins and so care should be taken when interpreting
the results. Gubbins was designed to identify recombinations from distant sources within very
clonal populations and so these r/ms may even be an under-estimation. In comparison
BratNextGen identifies recombination by finding patterns of shared SNPs and so should
perform better on this diverse dataset, but did require the analysis of the clades separately.
Search for the cause of the population partition in H. parasuis
Evidence of different restriction modification systems modulating homologous recombination
has been associated with clades of Neisseria meningitidis but evidence of recombination
between the clades was still found in this bacterium [74]. Several methods were used to try to
elucidate the differences between the BAPS populations and the two clades of H. parasuis
using genome wide association methods (GWAS), applied to both the core and the accessory
genomes. As we have seen some separation of serovars between these clades (Figure 2), it is
possible that differences in the expression patterns of the capsule between serovars may
present a recombination barrier [72]. However, recombination within the clades is still
occurring between isolates of different serovars. The differences between the clades based on
the accessory genome and the phylogeny (Figure 4) was visualised by creating heat-maps of
the shared accessory genes between isolates. The heat-map is ordered based on the phylogeny
which was built using the SNPs from the core genome (rows), and a dendrogram built based
on the similarity in the accessory genome or shared genes (columns). Clear separation can be
seen in the accessory genome between the two clades, shown in Figure 4, with only an
additional 500–600 accessory genes shared between the two clades aside from the 1049 genes
from the core genome.
Figure 4 Heat-map of the shared accessory genes between strains. The plot is ordered by
the phylogeny based on the SNPs within the core genome (rows). While the columns are
ordered based on the similarity in the presence and absence pattern of accessory genes
between isolates, which is represented by a dendrogram along the top of the heat-map. A
clear separation can be seen between the clades, and it appears that both the phylogeny and
the dendrogram split the population into the two clades, suggesting little recombination
occurs between the two clades, but there is recombination within them both.
Additionally, the separation of two clades based on the accessory genome strongly suggests
that horizontal transfer occurs in both clades, but that transfer of genetic material is restricted
between these groups. This plot allowed us to identify several areas of high similarity
between strains, for example isolates HS0001, HS0006, HS0008, HS0009, HS043, HS047
and HS061 share five intact phage regions that were previously identified in Aeromonas
[GenBank:
NC_019541],
Burkholderia
[Genbank:NC_005882],
Mannheimia
[Genbank:NC_008201],
Salmonella
[Genbank:NC_010495]
and
Shigella
[Genbank:NC_022749] based on their hits from the PHAST database. Furthermore, a
plasmid with similarity to one isolated from Haemophilus influenzae (ICEhin1056) was
identified in nine isolates using ICEberg. In addition, we were able to identify an integrated
antibiotic resistance gene element with greater than 99% identity to one identified in Vibrio
cholera [GenBank: AB114188], in the two strains possessing multiple antibiotic resistance
genes (F9 and HS033).
A BLAST analysis of all known H. parasuis genes involved in recombination, competence
and restriction modification genes was performed using the isolate collection, but the only
difference found was an overrepresentation of transposases in clade 1 compared to clade 2.
Experimental data on the natural competence of isolates in this collection are sparse. We have
tested a small number of isolates to date, including strains 174 (BAPS 1), HS061 (BAPS 3)
and HS069 (BAPS 3), which have been classed as naturally transformable, while 29755 is not
transformable (BAPS 5). The presence of naturally competent isolates in both clades suggests
that the partition between the two clades is not due to differences in competency genes.
Therefore, to investigate this separation between the clades, we performed a GWAS using
discriminant analysis of principal components (DAPC) on the BAPS populations. This
allowed us to identify genotypes (either SNPs or gene presence/absence) associated with
population structure (either based on the two clades or BAPS populations) within our isolate
collection. We also used generalised linear modelling (glm) to test if these genotypes were
significantly different between the BAPS populations (p < 0.05), whether SNP-based or
based on gene presence/absence. We varied the quantities of PCA eigen-values (between 6090%) included in the DAPC as a cross-validation technique to allow for comparison of the
candidates that correlated with population structure.
The DAPC analysis of the core genome showed a clear separation between the BAPS
populations (Additional file 10: Figure S4a), and this is also evident between the two clades
(Additional file 10: Figure S4b). Similarly, separation of the BAPS populations and clades
can be seen based on the accessory genome (Additional file 10: Figure S4c and d) although to
a lesser extent than from the core genome. Due to the large separation between the BAPS
populations and the clades, a large number of genes and SNPs were identified from this
analysis. Even with the top 10% of the loadings from the DAPC (representing the importance
of each gene or SNP in the analysis); the numbers of genotypes identified from the DAPC
cross-validation was greater than 30 for both SNPs and the accessory genome. The shortlist
of 33 SNPs identified from the DAPC of the core genome is shown in Additional file 3:
Table S2. However, only 6 SNPs were identified as significantly different between BAPS
populations or the two clades and they did not result in a predicted amino acid change in the
encoded protein (p < 0.10). Two SNPs were identified within the Holliday junction ATPdependent DNA helicase (RuvB) and resulted in amino acid changes. It is interesting to
speculate that these SNPs may explain the difference in recombination rates between the two
clades.
The shortlist of 39 genes identified from the DAPC of the accessory genome is shown in
Additional file 4: Table S3, with only four genes identified as significantly different between
BAPS populations (p < 0.05). Of the genes in the shortlist, there are several genes encoding
outer membrane proteins and potential capsule polysaccharide proteins, two transcriptional
regulators, and genes of unknown function (n = 10) that may potentially play a role in the
uptake or exchange of DNA. PFAM analysis [75] of the proteins of unknown function
(Additional file 4: Table S3) identified domains involved in transporter-associated domains, a
helix-turn-helix domain and a lipoprotein domain, and three domains of unknown function,
which are not obviously associated with the separation of the two clades.
Based on the heat-map (Figure 4) and the DAPC plots (Additional file 10: Figure S4), we
suggest that there are a greater number of genes that are contributing to this separation but
they are not found exclusively in particular BAPS populations or clades. This analysis has
helped to understand some of the differences between the groups, and the SNPs within the
Holliday junction helicase are worth investigating further. The pronounced difference
between the two clades of H. parasuis warrants further investigation to help us to understand
the separation of the two lineages in H. parasuis at both a genomic and functional level and
their potential involvement in the barrier to recombination between these two clades.
Genomic differences between serovars
Historically, serotyping has been the main basis of subcategorising H. parasuis, and the
currently available vaccines are serovar-specific. Although surveillance is not carried out
routinely in many countries, it appears that the epidemiological profile of the serovars has
been fairly stable throughout the last 30 years [17,18,76]. Multiple sets of reference strains of
H. parasuis are currently in use around the world, and so we have sequenced these strains and
confirmed that those with the same name are identical, with the exception of D74 (serovar 9).
The two strains labelled D74 shared only 1713 genes of 2123 genes (average number of
genes predicted per isolate) and differ by 58 SNPs in the core genome, which places them
within the same clade but they belong to different BAPS populations. Reference strains that
differed between sets were found to possess the same capsule locus but were otherwise
distantly related based on the core and accessory genome. We have found a high association
between the capsule locus types and the serotyped isolate collection and propose that the
capsule locus is the main determinant of serovar as has been previously assumed [16] (for
details see Additional file 1). This association was also evident from capsule locus synteny
(Additional file 8: Figure S2) when the organisation of the capsule locus of the reference
strains was compared by BLASTn to the remainder of the isolate collection [16]. We have
also examined the serotyped isolate collection using DAPC and glm to try to identify genes
involved in serovar designation, this being detailed in Additional file 1. Briefly, based on the
prevalent serovars in the isolate collection we were able to identify twenty-three potential
serovar-specific genes, five of these candidates were previously identified capsule genes,
three phage genes, a transposase, a filamentous haemagglutinin and 13 have unknown
functions. This is the first time that a GWAS method has been used to try understand an
existing typing scheme. This analysis was based on a relatively small subset of strains when
considering the number of isolates of each individual serovar, and so with a greater number
of the less prevalent serovars, these methods have a higher likelihood of finding further
serovar-specific gene markers. This would allow for the refinement of the typing scheme to a
molecular based test, which could have higher turn-around time, better sensitivity and
specificity, and maximal reproducibility between laboratories through not depending on
antibody reagents and the technical prowess of the laboratory worker.
Genomic differences in the pan-genome by disease association
Putative virulence factors are mostly found in the core genome
The majority of studies proposing virulence factors for this bacterium have focused on a
subset of the most prevalent serovars or on a small number of isolates, and so we investigated
the distribution of these suggested virulence factors within our more diverse isolate
collection. A survey of the literature produced a list of 189 putative virulence factors that
were retrievable from NCBI as either a nucleotide or protein sequence (Additional file 5:
Table S4) [28-31,37,38,44,77-79]. This included the vtaA genes, which are some of the best
characterized virulence markers for H. parasuis identified to date [32,33], but which were
found at low frequency in this isolate collection. This may be due to the repetitive nature of
the nucleotide sequences of trimeric auto-transporters, which means that these may not have
assembled well in our draft genome data. Instead we used the translocator and leader
sequences of these genes and identified the group 1, 2 and 3 translocator domains in all
isolates. Of these proposed virulence factors, 123 were present at greater than 80% identity in
all of our isolates and so were present in the core genome. There is the possibility that
variation within these genes may contribute to differences in virulence but this analysis was
beyond the scope of this study. The distribution of the putative virulence factors from the
accessory genome was examined with respect to disease association (clinical or non-clinical)
and disease phenotypes (systemic, respiratory and non-clinical) by the calculation of their
relative proportions. Five virulence factors were over-represented in the non-clinical isolates
(cjrA, K756_04470, K756_03455, yfeA, and the leader sequence for non-virulent vtaA) and
under-represented in the clinical isolates. Conversely, 10 virulence factors were overrepresented in the clinical isolates (bioB, cirA, fimB, hicA, hicB, hhdB, F357_gp34,
K756_02745, K756_06920, and leader sequence of vtaAs denoted VIR1). When considering
the disease phenotypes, no virulence factors were over-represented in only the respiratory
population and only hsdR and F357_gp36 were over-represented in systemic isolates. We
also looked into the differences in genome size and number of genes between the disease
associated isolates, as a proxy for evidence of reductive evolution [80,81]. No evidence of
reductive evolution was found based on our isolate collection; details can be found in
Additional file 1.
A high number of genes from the accessory genome were linked to differences in
clinical phenotype
While we were able to find some associations between existing putative virulence factors for
H. parasuis and clinical phenotype, there is also a large amount of data from the pan-genome
that could yield new important SNPs or genes that are associated with pathogenicity.
Therefore, we used the methods of DAPC and glm to assess the relationship between the pangenome and virulence based on the clinical metadata. From this analysis we have identified
both SNPs and genes that allow us to separate the isolate collection into disease categories.
All of the candidates were added into the glm with clinical disease as the factor in the model,
and those that were significantly different between the clinical and non-clinical isolates (p <
0.05) were considered as potential markers for virulence. We also performed analyses of
disease phenotypes for both the core and the accessory genome, but very little difference
between the respiratory and systemic isolates was identified using DAPC (data not shown).
This occurred whether isolates from the lung with signs of systemic disease were classed as
either respiratory or systemic strains. This suggests that the difference between respiratory or
systemic outcome of disease may be dependent on additional host factors such as welfare and
host immune response rather than genetic differences between the isolates or particular tissue
tropisms. The discriminant function of the disease association is shown in Figures 5a and b
for the core and accessory genomes respectively (with 80% of the PCA eigen-values
retained). This shows separation between the clinical and non-clinical isolates to a similar
extent for both the core and the accessory genome. Some overlap was seen between these
categories (Figures 5a and b), but this is not unexpected as some isolates may be capable of
causing disease but were not doing so at the time of isolation. We also considered the
influence of geography and the separation of the strains into populations with different
recombination rates (based on the BAPS populations) on the pan-genome and saw that both
showed separation in the discriminant functions of the core and accessory genomes (Figures
5c, d, e and f).
Figure 5 Discriminant analysis of principal components applied to clinical strains of H.
parasuis by disease categories. 80% eigenvalues were retained for the PCA and all
eigenvalues were retained for the discriminant analysis. Plots a and b show the first axis of
the discriminant function while c, d, e and f show the first two axes. Separation along the
axes suggests that genetic differences are present between the phenotypic groups of clinical
and non-clinical isolates that are being compared; however the presence of overlap shows
that some strains are intermediates. Plots c and d show that geographic origin, do not show
much separation of the isolates by geography, those that have separated are only represented
by a couple of isolates. On the other hand, the discriminant function based on the BAPS
populations shows a lot of separation and so the population structure does have an influence
on these isolates genetic content.
When we consider the candidate markers for virulence from the DAPC and the glm, a greater
number of candidates were significantly different between the clinical and non-clinical
isolates from the glm of the accessory genome (48 candidates from the accessory genome,
which are listed in Table 1) over the core (12 SNPs in the core genome). Of the SNPS
identified as being statistically significant, seven resulted in predicted amino acid changes.
However, only four predicted the change of amino acid type, which may influence the
structure of the protein. For example, two SNPs identified in a long chain fatty acid CoA
ligase (1186G/T) and in a transcriptional regulatory protein (1384G/T), which would result in
an A/S amino acid change and a change from hydrophobic to polar. A SNP in a fatty acid
oxidation complex subunit alpha (1789A/G) was predicted changing the amino acid from
hydrophobic to polar and finally a aromatic to hydrophobic change at holo-acyl carrier
protein synthase (435C/A). A gene involved in fatty acid degradation (fadA) was previously
suggested as having a role in virulence in H. parasuis [34]. Furthermore, the association of
fatty acid metabolism and virulence has been previously identified in Mycobacterium
tuberculosis [82]. Of the genes yielded from the accessory genome analysis nine were
putative virulence factors from the previous analysis of published virulence factors (Table 1).
From the DAPC pathogenicity candidates we identified genes encoding four adhesins, ABC
transporters, an antirepressor, an aspartokinase, two cytolethal distending toxins, enoyl-CoA
hydratase/carnithine racemase-like protein, ferric uptake proteins, glycerol uptake facilitator
protein, a hemolysin transporter, a methylase, an N-acetylmuramoyl-L-alanine amidase, a
nucleoside symporter, an outer membrane protein, four phage proteins, an RNA helicase, a
putative serine protease, a tonB dependent receptor, another toxin (PezT), a transcriptional
activator, two transposases, a xylose import ATP-binding protein and nineteen proteins of
unknown function. The genes of unknown function were run through the PFAM database
(Finn et al. [75]) to try to elucidate any further details about their function, but only three had
any hits to known domains, one with a phage domain (evalue 7 × 10⁻⁵), one with an ABC
transporter and membrane domains (evalue 1 × 10−48) and another with a YadA adhesin
domain (evalue 1.5 × 10⁻⁴).
Table 1 Significantly different genes identified from H. parasuis between clinical and
non-clinical isolates using DAPC
Predicted function of gene
Adhesins, yadA family
antirepressor
Aspartokinase lysC
ATPdependent RNA helicase hrpA
cytolethal distending toxin protein A
cytolethal distending toxin protein B
DNA binding domain, excisionase family
enoyl-CoA hydratase/carnithine racemase-like protein
Ferric hydroxamate uptake
Gene 25like lysozyme
glycerol uptake facilitator protein
Modification methylase hpaII
MuF Haemophilus phage SuMu
N-acetylmuramoyl-L-alanine amidase
phage tail sheath family protein
putative 3-phenylpropionic acid transporter
Putative NADH flavin reductase/short chain dehydrogenase
putative outer membrane usher protein htrE
putative serine protease
Number of genes
4
1
1
1
2
1
1
1
1
1
1
1
1
1
1
1
1
1
1
Existing virulence factor for H. parasuis
Yes
Yes
Yes
Yes
tonB-dependent receptor plug domain protein
Trans-2,3-dihydro-3-hydroxyanthranilate isomerase
Transcriptional activator prtR
transposase
UDP3O [3hydroxymyristoyl] glucosamine N-acyltransferase
unknown function
Xylose import ATPbinding protein xylG
1
1
1
1
1
19
1
Yes
All genes were identified as significant using generalised linear modelling of different DAPC
iterations using between 60-90% of the principal components (p < 0.05). The phenotypic data
used in the model was whether isolates were clinical or non-clinical compared to the presence
or absence of the genes.
These genes are in the same families as other common virulence determinants in other betterstudied pathogens. For example, adhesins are commonly regarded as virulence factors as they
allow adhesion to the host cell, and depending on their specificity may be required for the
progression of disease in particular tissues [83]. While cytolethal distending toxins have been
previously studied in H. parasuis [35,84], there appear to be multiple, divergent copies within
the isolate collection. Variation in these cdt genes has previously been found between
different strains of E. coli at as little at 39% amino acid identity, and so the presence of
multiple copies of this family of toxins may impact the virulence of isolates of H. parasuis
[85]. In addition, glycerol uptake facilitators have been implicated in virulence and growth in
Mycoplasma pneumoniae [86]; N-acetylmuramoyl-L-alanine amidases play a role in the
conversion of the Streptococcus mitis autolysin [87]; serine proteases are regarded as
virulence factors in enterohemorrhagic E. coli [88] and Streptococcus pneumoniae [89] and
the tonB-dependent receptors are involved in iron acquisition, which is important in
pathogens such as Neisseria meningitidis [90] and Vibrio cholera [91] . In summary, the
DAPC and glm analyses of the isolate collection have yielded a short-list of new putative
virulence factors for further investigation in this pathogen and their use as epidemiological
markers will be considered further.
Conclusion
We have investigated the composition of the pan-genome of the major pig pathogen H.
parasuis with respect to detailed metadata in order to investigate associations between
genotype and phenotype. We have found that this is a diverse bacterial species, comprised of
two main lineages, exhibiting very high rates of recombination, which appears to be restricted
within one or other of the two clades. Using DAPC as the GWAS method, we were able to
identify SNPs within a Holliday junction ATP-dependent DNA helicase (RuvB) that may be
involved in the partitioning of this species into two clades. We have found genetic differences
with regard to serovar based on the capsule loci and further potential serovar-specific genes
from the accessory genome, which is the first time that a GWAS method has been used to try
to refine an existing typing method. We have also identified genetic differences in the clinical
and non-clinical isolates from 48 genes, nine of which were also identified by DAPC and glm
analyses. The discriminant power of the accessory genome over the core genome provides a
better list of candidate virulence genes that will be invaluable for investigating the
pathogenesis of H. parasuis and how it causes Glässer’s disease. The accessory genome is
therefore an important source for understanding the pathogenesis of diverse species of
bacteria, particularly in combination with detailed metadata. These methods are applicable to
any pathogen where detailed clinical metadata can be obtained and analysed in combination
with next generation sequencing, which could identify genotypes (both SNPs and genes) that
may be useful in the generation of new molecular diagnostic and vaccine candidates that can
aid surveillance and prevention of disease.
Methods
Isolate collection
The table describing the isolate collection and metadata (including accession numbers for the
isolates) can be found in Additional file 2: Table S1. This collection includes the reference
strains currently used in the serotyping scheme and three published genomes of 29755,
SH0165 and ZJ0906 in the analyses [40,41,60]. There are currently multiple isolates used as
reference strains for the same serovar in different serotyping laboratories, and so we have
sequenced 27 reference strains from three different laboratories [61]. UK isolates were
obtained from the Animal Health Veterinary Laboratories Agency (AHVLA) and were
identified as H. parasuis on the basis of minimum biochemical tests for differentiating H.
parasuis (haemolysis, CAMP, urease, indole and catalase) and purified in the UK [92]. The
remainder of the isolate collection was provided by Centre de Recerca en Sanitat Animal
(Spain), National Veterinary Institute, Technical University of Denmark and Patrick Blackall
(University of Queensland, Australia). Metadata for these isolates includes: veterinary
investigation diagnostic analysis codes used in the UK (VIDA), tissue origin of isolate, age of
pig, ante and post-mortem findings and for a subset of isolates serotyping results (117/212
isolates). Serotyping for the UK isolates was performed by indirect haemagglutination
[11,93] by Innovative Veterinary Diagnostics, Germany. Historical isolates obtained with
serotyping information, including the reference strains, were serotyped by both gel diffusion
and indirect haemagglutination by a variety of laboratories [11,61,93].
Metadata for the strains was used to classify the isolates with clear diagnostic information (n
= 186) and were separated into clinical (n = 143) and non-clinical isolates (n = 43). The
clinical isolates were then separated further into disease phenotypes of respiratory (n = 76)
and systemic (n = 49), with 18 isolates that we were not able to classify as respiratory or
systemic based on the diagnostic information and which were excluded from the disease
phenotype analysis.
Basic descriptive epidemiological analyses of this isolate collection were performed
including assessment of the relationship between serovar and virulence in our dataset, as this
is a commonly assumed relationship. Of our dataset, 20 isolates (14.5%) with an assigned
serovar also had cross-reactions; we have chosen to ignore the cross-reactions for the
statistical analysis as it reduces the number of isolates in each group, reducing the power of
the statistical analyses.
Genome sequencing and assembly
Isolates were sequenced using published methods [16]. Draft genome sequences were
assembled using a custom-made bioinformatics pipeline, detailed in Additional file 1.
Assembly statistics were checked to see if any isolates required repeat sequencing. The final
assemblies ranged in size between 2,192,774 and 2,254,362 bp, with 39.48-39.94% average
G + C content, which was comparable to the publicly available draft and complete genomes
of H. parasuis [40,41].
Construction of the pan-genome
The pan-genome of H. parasuis was investigated using OrthoMCL [94], The amino acid
sequences of predicted proteins were obtained through prodigal analysis of the isolates [95],
and were used to represent the coding sequences (CDSs) of all of the isolates. The homology
groups represent the unique proteins amongst the pooled proteins predicted from all isolates,
which can then be used to infer the pan-genome. The MCL parameters were varied to create
the optimum core genome, using the lowest inflation parameter possible to get the highest
number of homology groups that can be identified in every isolate, maximising the core
genome. The final inflation parameter used was 2.0, and while this low value may produce
more false positives, we also added a series of manual checks on the homology groups after
the OrthoMCL analyses to further ensure the accuracy of the pan-genome. This was
necessary because of the large number of draft genome sequences used and allowed us to
account for sequencing errors and pseudogenes. It also allowed us to minimise the number of
homology groups with duplicates from the same isolate. For details of the homology group
checks that have been performed see the Additional file 1. Automated genome annotation
was performed using Prokka using the rfam option [96].
Custom python scripts were used to recreate the MCL table of the homology groups based on
the altered groups and to convert the homology groups to a presence and absence matrix
across the isolates. Homology groups found in every isolate were treated as the core genome
and a Fasta file of the gene sequences from all isolates was produced for each homology
group. These Fasta files were aligned to confirm the core genome, enabling exclusion of any
genes that aligned with less than 80% identity. The remainder of the homology groups were
regarded as the accessory genome. The alignments of the core genes were combined to create
a concatenated alignment of the core genome. MEGA was used to create a Neighbor-joining
core genome tree using 500 bootstraps [97]. A subset of individual core gene trees were also
built and bootstrapped (100 times) using MEGA to facilitate the comparison of the
relationship between the isolates across the genome as well as for the concatenated alignment
[97]. COG information for the homology groups was obtained using the protocol detailed in
Additional file 1. Heat-maps of the shared accessory between isolates, were created using R
and the R libraries vegan [98], gplots [99] and Heatplus [100].
Recombination analyses of the core genome
Recombination and population genetic analyses of the concatenated core genome was
performed using Bayesian analysis of population structure (BAPS) [62,63] and Bayesian
Recombination Tracker (BratNextGen) [71]. BAPS clusters were estimated using 10
independent runs of the stochastic optimization algorithm with the a priori upper bound of
the number of clusters varying over the interval 50–100 across the runs and using two levels
of hierarchical analysis. All runs converged to the same posterior estimate of the population
structure with 5 and 18 clusters at the nested first and second levels of hierarchy,
respectively. All clusters in the two estimates were significantly supported when compared
against alternative partitions (posterior probability of any cluster at least 100-fold higher than
for the alternative). The BratNextGen estimation of genomic locations of recombination was
performed with the hidden Markov model hyperparameter alpha set to 1 and using 20
iterations of the estimation algorithm, which was assessed to be sufficient since changes in
the hidden Markov model parameters were already negligible over the last 60% of the
iterations. The significance of a recombining region was determined using a permutation test
with 100 permutations executed in parallel on a cluster with a threshold of 5% to conclude
significance for each region. The ratio of the recombination rate relative to the mutation rate
(r/m) was calculated using custom scripts based on the BratNextGen output [56,65]. This
procedure was used for the two separate clades of H. parasuis. Recombination analysis was
also performed using gubbins as detailed in [59]. As recombination can heavily influence the
population structure [101,102], an alignment with the areas of recombination masked as
missing data was attempted create a recombination-free core genome. However, only 425 bp
were retained and so a recombination free core genome phylogeny could not be computed.
Synteny analysis of the pan-genome
Synteny of the homology groups based on the published isolates was examined by using the
contig numbering within the accession numbers of the genes (as those created by prodigal
include the contig number as well as the position of the CDS). Firstly the order of genes
within all of the individual contigs (largest to smallest) of all isolates was established,
followed by finding the corresponding homology groups. We used the complete genome
SH0165 as the reference for the syntenic pan-genome [40]. If a gene was located next to one
already included in the pan-genome then it was inserted into the pan-genome relative to this
position. This was converted to an ordered matrix of homology groups within the contigs
using custom python and R scripts. The functions of the homology groups were identified by
using BLASTp searches of the individual homology groups against the NCBI nr database
(updated December 2013). This process was repeated using the just the capsule genes to
establish the synteny of the capsule loci, based on the organisation of the capsule loci of the
15 reference strains [16].
The %G + C content average of homology groups was calculated using a custom python
script. Mobile elements were investigated using BLAST analysis of the sequences from the
ICEberg database [103] against a database of the isolate collection with no filters or e-values
defined and phage were investigated using the PHAST database [104]. This was then
combined with predicted Prokka functions and BLASTp hits against nr to build a map of the
key features and areas of variation within the pan-genome..
Statistical analysis of the pan-genome with metadata
We used the R package adegenet to analyse the pan-genome of H. parasuis [105,106].
Discriminant analysis of principal components (DAPC) allowed us to analyse both SNPs of
the core genome, and of the accessory genome, based on presence and absence of the
homology groups throughout (with pseudogenes excluded). SNPs were extracted from the
core genome, and rare alleles (found in <1% of the isolates) were excluded to lessen the
influence of sequencing errors on the analyses. Principal component analysis (PCA) was
performed on both the core and the accessory genome, and cross-validation was performed
by varying numbers of eigen-values (60-90%) in the analysis to capture the variance in the
data and all eigen-values from the discriminant analysis were included, after which metadata
was chosen for inclusion in the DAPC. DAPC allows the plotting of the discriminant
function, which shows the separation between the defined groups (based on the clinical
metadata). SNPs or homology groups that contribute most to these differences between
groups can be identified and tested for their significance in comparison to the metadata. Stepwise model selection (in both directions) was used to produce a binomial generalised linear
model (glm) that allowed the identification of statistically significant SNPs or genes (p <
0.05) in association with the clinical metadata for each round of DAPC [107].
Proportions of genes of interest in the pan-genome
The presence and absence of genes of interest were assessed using BLAST searches
(tBLASTn or BLASTn) of sequences against a BLAST database of the isolate collection.
Presence of the gene was defined as above using cutoffs of >80% identity over >80% of the
length of the alignment unless otherwise stated, and the proportion of the sequenced isolates
which contained each individual gene was determined.
Association between capsule locus and serovar
The sequences and gene composition of the capsule loci for the 15 reference strains of H.
parasuis have been published but no comparison to other isolates of the same serovar has
been performed. Therefore we compared the capsule loci from isolates of the same serovar in
search of an association between the genotype of the capsule loci and the phenotype of
serovar. Initial BLAST searches (BLASTn) of the capsule loci (funA to iscR) of each
reference strain, were performed on the BLAST database of all isolates. Isolates that had the
same serovar as the reference strain based on a blast match of greater than 90% of the length
of the capsule locus and greater than 80% of the identity were considered as a match. Isolates
that did not meet these criteria were compared to the capsule loci of the other reference
strains using ACT [108]. The reference strain with the best match was based on highest
visible identity in ACT across the entirety of the capsule locus. If less than 80% identity at
nucleotide level was found to any of the reference capsule loci then we considered there to be
no match to existing capsule loci. The isolates with the same capsule loci were then aligned
using muscle [109], and the average identity across the capsule locus (funA to iscR) was
calculated using alistat [110].
Accession numbers
Accession numbers of isolates included in this analysis are available on Genbank [Genbank:
ABKM00000000, CP001321, CP005384].
Accession numbers of isolates included in the analysis in the European Nucleotide Archive:
[ENA: ERS131963-ERS131990, ERS131992-ERS132006, ERS132009-ERS132069,
ERS132072,ERS132073, ERS132075-ERS132090, ERS132095-ERS132117, ERS132119ERS132123, ERS132125-ER132127, ERS132129, ERS132132-ERS132147, ERS132150ERS132151, ERS132161, ERS132168, ERS132171, ERS13217-ERS132183, ERS132188,
ERS132189, ERS132191-ERS132199, ERS193695-ERS193698, ERS214842-ERS214848
and ERS134375].
Ethics
Isolates from the UK were obtained from the Animal Health Veterinary Laboratories Agency
as part of routine diagnostic investigations upon submitted post mortem material. The isolates
provided by CReSA were field isolates obtained from nasal swabs and from clinical
diagnostic materials provided by Department of Infectious Diseases of the Veterinary School
of the Universitat Autònoma de Barcelona (Spain). Danish isolates originated from pigs
showing clinical signs that were submitted to the Laboratory for Swine Diseases (Kjellerup,
Denmark) for post-mortem examination. Sources of isolates were anonymised.
Abbreviations
ACT, Artemis comparison tool; AHVLA, Animal health veterinary laboratories agency;
BAPS, Bayesian analysis of population structure; BLAST, Basic local alignment search tool;
BratNextGen, Bayesian recombination tracker; CAMP, Cyclic adenosine monophosphate;
CDS, Coding sequence; COG, Clusters of orthologous groups; DAPC, Discriminant analysis
of principal components; glm, Generalised linear model; GWAS, Genome wide association
study; H. parasuis, Haemophilus parasuis; MCL, Markov cluster algorithm; MLST, Multilocus sequence typing; NCBI, National center for biotechnology information; nr, Nonredundant' database; NT, Non-typeable; PCA, Principal components analysis; PHAST, Phage
search tool; PRRS, Porcine reproductive and respiratory syndrome virus; r/m, Recombination
rate relative to mutation rate; SNP, Single nucleotide polymorphism; VIDA, Veterinary
investigation diagnosis analysis
Competing interests
The authors declare that they have no competing interests.
Authors’ contributions
DM and AT contributed equally to this study. DM, AT, AR, PL, BW, MH, JP conceived the
study. KH, SP, SL, DH, AB, AT, SW produced the data. KH, LW, RC, MH, JC analyzed the
data. KH, LW, AT, SP, MH, RC, VA, ØA wrote the paper. VA, AB, ØA contributed isolates.
All authors read and approved the final manuscript.
Acknowledgements
We thank several people for their valued help with this study, these include: Patrick Blackall
of the University of Queensland, Australia for the provision of copies of the Australian
reference strain set; Gemma Murray for the use of the R script that allowed us to analyze the
COG functional groups of the homology groups; Simon Harris for the useful discussion about
Gubbins and the issues surrounding the prediction of recombination; Feifei Shen for
assistance in the purification and DNA preparation of the isolates that were sent for
sequencing; Brian Hunt, Jon Rogers and Sarah Howie of the Animal Health and Veterinary
Laboratories Agency for collection and biochemical profiling of UK isolates; and TJ
McKinley for his advice on the statistical analysis.
This work was supported by a BPEX PhD studentship and a Longer and Larger (LoLa) grant
from the Biotechnology and Biological Sciences Research Council (grant numbers
BB/G020744/1, BB/G019177/1, BB/G019274/1 and BB/G003203/1), the UK Department for
Environment, Food and Rural Affairs and Zoetis, awarded to the Bacterial Respiratory
Diseases of Pigs-1 Technology (BRaDP1T) consortium. The funders had no role in study
design, data collection and analysis, decision to publish, or preparation of the manuscript.
List of consortium members: University of Cambridge: Duncan J. Maskell, Alexander W.
(Dan) Tucker, Sarah E. Peters, Lucy A.Weinert, Jinhong (Tracy) Wang, Shi-Lu Luan, §Roy
R. Chaudhuri. §Present address: Department of Molecular Biology and Biotechnology,
University of Sheffield, Firth Court, Western Bank, Sheffield, S10 2TN, UK.
Royal Veterinary College: Andrew N. Rycroft, Gareth A. Maglennon, Dominic Matthews.
Imperial College London: Paul R. Langford, Janine T. Bossé, Yanwen Li. London School
of Hygiene and Tropical Medicine: Brendan W. Wren, Jon Cuccui, Vanessa S. Terra.
References
1. Olvera A, Cerdà-Cuéllar M, Nofrarías M, Revilla E, Segalés J, Aragon V: Dynamics of
Haemophilus parasuis genotypes in a farm recovered from an outbreak of Glässer’s
disease. Vet Microbiol 2007, 123:230–237.
2. Metcalf DS, MacInnes JI: Differential expression of Haemophilus parasuis genes in
response to iron restriction and cerebrospinal fluid. Can J Vet Res 2007, 71:181–188.
3. Rapp-Gabrielson V, Oliveira S, Pijoan C: Haemophilus parasuis. In B Swine. Volume
Section II. 9th edition. Blackwell; 2006:681–690.
4. Vahle JL, Haynes JS, Andrews JJ: Interaction of Haemophilus parasuis with nasal and
tracheal mucosa following intranasal inoculation of cesarean derived colostrum
deprived (CDCD) swine. Can J Vet Res 1997, 61:200–206.
5. Kirkwood RN, Rawluk SA, Cegielski AC, Otto AJ: Effect of pig age and autogenous
sow vaccination on nasal mucosal colonization of pigs by Haemophilus parasuis. J Swine
Heal Prod 2001, 9:77–79.
6. Rotto H: Economic Cost of Major Health Challenges in Large US Swine Production
Systems. ; 2013:4–7.
7. Brockmeier S, Halbur P, Thacker E: Porcine respiratory disease complex. In Polymicrob
Dis. Edited by Brogden K, Guthmiller J. Washington (DC): ASM Press; 2002.
8. DEFRA: Emerging Threats Quarterly Report - Pig Diseases: January to March 2013
(Q1). Volume 2013. ; 2013:1–9.
9. APHIS: Disease in Nursery and Grower / Finisher Pigs in 2000 and 2006 — and Vaccine
and Antimicrobial Use in 2006. ; 2008:1–4.
10. White M: NADIS Pig Health – March 2010 Glässers Disease. In BPEX Knowledge
Transfer. ; 2010:1–3.
11. Turni C, Blackall PJ: Comparison of the indirect haemagglutination and gel diffusion
test for serotyping Haemophilus parasuis. Vet Microbiol 2005, 106:145–151.
12. Morozumi T, Nicolet J: Some antigenic properties of Haemophilus parasuis and a
proposal for serological classification. J Clin Microbiol 1986, 23:138–142.
13. Boyce JD, Chung JY, Adler B: Genetic organisation of the capsule biosynthetic locus
of Pasteurella multocida M1404 (B:2). Vet Microbiol 2000, 72:121–134.
14. Boulnois G, Roberts I, Hodge R: Analysis of the K1 capsule biosynthesis genes of
Escherichia coli: definition of three functional regions for capsule production. Mol Gen
1987, 242–246.
15. Salter SJ, Hinds J, Gould KA, Lambertsen L, Hanage WP, Antonio M, Turner P,
Hermans PWM, Bootsma HJ, O’Brien KL, Bentley SD: Variation at the capsule locus, cps,
of mistyped and non-typable Streptococcus pneumoniae isolates. Microbiology 2012,
158(Pt 6):1560–1569.
16. Howell KJ, Weinert LA, Luan S-L, Peters SE, Chaudhuri RR, Harris D, Angen O,
Aragon V, Parkhill J, Langford PR, Rycroft AN, Wren BW, Tucker AW, Maskell DJ: Gene
content and diversity of the loci encoding biosynthesis of capsular polysaccharides of the
fifteen serovar reference strains of Haemophilus parasuis. J Bacteriol 2013, 195:4264–
4273.
17. Castilla KS, de Gobbi DDS, Moreno LZ, Paixão R, Coutinho TA, dos Santos JL, Moreno
AM: Characterization of Haemophilus parasuis isolated from Brazilian swine through
serotyping, AFLP and PFGE. Res Vet Sci 2012, 92:366–371.
18. Cai X, Chen H, Blackall PJ, Yin Z, Wang L, Liu Z, Jin M: Serological characterization
of Haemophilus parasuis isolates from China. Vet Microbiol 2005, 111:231–236.
19. Angen O, Svensmark B, Mittal KR: Serological characterization of Danish
Haemophilus parasuis isolates. Vet Microbiol 2004, 103:255–258.
20. Tadjine M, Mittal KR, Bourdon S, Gottschalk M: Development of a new serological test
for serotyping Haemophilus parasuis isolates and determination of their prevalence in
North America. J Clin Microbiol 2004, 24:839–840.
21. Aragon V, Cerdà-Cuéllar M, Fraile L, Mombarg M, Nofrarías M, Olvera A, Sibila M,
Solanes D, Segalés J: Correlation between clinico-pathological outcome and typing of
Haemophilus parasuis field strains. Vet Microbiol 2010, 142:387–393.
22. Bouchet B, Vanier G, Jacques M, Gottschalk M: Interactions of Haemophilus parasuis
and its LOS with porcine brain microvascular endothelial cells. Vet Res 2008, 39–42.
23. Oliveira S, Pijoan C: Computer-based analysis of Haemophilus parasuis protein
fingerprints. Can J Vet Res 2004, 68:71–75.
24. Rafiee M, Bara M, Stephens CP, Blackall PJ: Application of ERIC PCR for the
comparison of isolates of Haemophilus parasuis. Aust Vet J 2008, 78:846–849.
25. Blackall PJ, Trott DJ, Rapp-Gabrielson V, Hampson DJ: Analysis of Haemophilus
parasuis by multilocus enzyme electrophoresis. Vet Microbiol 1997, 56:125–134.
26. Mullins MA, Register KB, Brunelle BW, Aragon V, Galofré-Mila N, Bayles DO, Jolley
KA: A curated public database for multilocus sequence typing (MLST) and analysis of
Haemophilus parasuis based on an optimized typing scheme. Vet Microbiol 2012,
162:899–906.
27. Olvera A, Cerdà-Cuéllar M, Aragon V: Study of the population structure of
Haemophilus parasuis by multilocus sequence typing. Microbiology 2006, 152:3683–
3690.
28. Boerlin P, Poljak Z, Gallant J, Chalmers G, Nicholson V, Soltes GA, Macinnes JI:
Genetic diversity of Haemophilus parasuis from sick and healthy pigs. Vet Microbiol
2013, 167:459–467.
29. Lancashire JF, Turni C, Blackall PJ, Jennings MP: Rapid and efficient screening of a
representational difference analysis library using reverse Southern hybridisation:
identification of genetic differences between Haemophilus parasuis isolates. J Microbiol
Methods 2007, 68:326–330.
30. Martínez-Moliner V, Soler-Llorens P, Moleres J, Garmendia J, Aragon V: Distribution
of genes involved in sialic acid utilization in strains of Haemophilus parasuis.
Microbiology 2012, 158:2117–2124.
31. Xu C, Zhang L, Zhang B, Feng S, Zhou S, Li J, Zou Y, Liao M: Involvement of
lipooligosaccharide heptose residues of Haemophilus parasuis SC096 strain in serum
resistance, adhesion and invasion. Vet J 2013, 195:200–204.
32. Olvera A, Pina S, Macedo N, Oliveira S, Aragon V, Bensaid A: Identification of
potentially virulent strains of Haemophilus parasuis using a multiplex PCR for
virulence-associated autotransporters (vtaA). Vet J 2012, 191:213–218.
33. Pina S, Olvera A, Barceló A, Bensaid A: Trimeric autotransporters of Haemophilus
parasuis: generation of an extensive passenger domain repertoire specific for pathogenic
strains. J Bacteriol 2009, 191:576–587.
34. Hill C, Metcalf D, MacInnes J: A search for virulence genes of Haemophilus parasuis
using differential display RT-PCR. Vet Microbiol 2003, 96:189–202.
35. Zhou M, Zhang Q, Zhao J, Jin M: Haemophilus parasuis encodes two functional
cytolethal
distending
toxins:
CdtC
contains
an
atypical
cholesterol
recognition/interaction region. PLoS One 2012, 7:e32580.
36. Sack M, Baltes N: Identification of novel potential virulence-associated factors in
Haemophilus parasuis. Vet Microbiol 2009, 136:382–386.
37. Melnikow E, Dornan S, Sargent C, Duszenko M, Evans G, Gunkel N, Selzer PM, Ullrich
HJ: Microarray analysis of Haemophilus parasuis gene expression under in vitro growth
conditions mimicking the in vivo environment. Vet Microbiol 2005, 110:255–263.
38. Wang X, Xu X, Zhang S, Guo F, Cai X, Chen H: Identification and analysis of
potential virulence-associated genes in Haemophilus parasuis based on genomic
subtraction. Microb Pathog 2011, 51:291–296.
39. Jin H, Wan Y, Zhou R, Li L, Luo R, Zhang S, Hu J, Langford PR, Chen H: Identification
of genes transcribed by Haemophilus parasuis in necrotic porcine lung through the
selective capture of transcribed sequences (SCOTS). Environ Microbiol 2008, 10:3326–
3336.
40. Xu Z, Yue M, Zhou R, Jin Q, Fan Y, Bei W, Chen H: Genomic characterization of
Haemophilus parasuis SH0165, a highly virulent strain of serovar 5 prevalent in China.
PLoS One 2011, 6:e19631.
41. Mullins MA, Register KB, Bayles DO, Dyer DW, Kuehn JS, Phillips GJ: Genome
sequence of Haemophilus parasuis strain 29755. Stand Genomic Sci 2011, 5:61–68.
42. Li J, Peng H, Xu L, Xie Y, Xuan X, Ma C, Hu S, Chen Z, Yang W: Draft genome
sequence of Haemophilus parasuis gx033, a serotype 4 strain isolated from the swine
lower respiratory tract. Genome Announc 2013, 1:3–4.
43. Hong M, Ahn J, Yoo S, Hong J, Lee E, Yoon I, Jung J, Lee H: Identification of novel
immunogenic proteins in pathogenic Haemophilus parasuis based on genome sequence
analysis. Vet Microbiol 2011, 148:89–92.
44. Zhou H, Yang B, Xu F, Chen X, Wang J, Blackall PJ, Zhang P, Xia Y, Zhang J, Ma R:
Identification of putative virulence-associated genes of Haemophilus parasuis through
suppression subtractive hybridization. Vet Microbiol 2010, 144:377–383.
45. Schoen C, Blom J, Claus H, Schramm-Glück A, Brandt P, Müller T, Goesmann A,
Joseph B, Konietzny S, Kurzai O, Schmitt C, Friedrich T, Linke B, Vogel U, Frosch M:
Whole-genome comparison of disease and carriage strains provides insights into
virulence evolution in Neisseria meningitidis. Proc Natl Acad Sci U S A 2008, 105:3473–
3478.
46. Lefébure T, Stanhope MJ: Evolution of the core and pan-genome of Streptococcus:
positive selection, recombination, and genome composition. Genome Biol 2007, 8:R71.
47. Donati C, Hiller NL, Tettelin H, Muzzi A, Croucher NJ, Angiuoli SV, Oggioni M,
Dunning Hotopp JC, Hu FZ, Riley DR, Covacci A, Mitchell TJ, Bentley SD, Kilian M,
Ehrlich GD, Rappuoli R, Moxon ER, Masignani V: Structure and dynamics of the pangenome of Streptococcus pneumoniae and closely related species. Genome Biol 2010,
11:R107.
48. Rasko DA, Rosovitz MJ, Myers GSA, Mongodin EF, Fricke WF, Gajer P, Crabtree J,
Sebaihia M, Thomson NR, Chaudhuri R, Henderson IR, Sperandio V, Ravel J: The
pangenome structure of Escherichia coli: comparative genomic analysis of E. coli
commensal and pathogenic isolates. J Bacteriol 2008, 190:6881–6893.
49. Bentley S: Sequencing the species pan-genome. Nat Rev Microbiol 2009, 7:258–259.
50. Lukjancenko O, Wassenaar TM, Ussery DW: Comparison of 61 sequenced Escherichia
coli genomes. Microb Ecol 2010, 60:708–720.
51. Tettelin H, Masignani V, Cieslewicz MJ, Donati C, Medini D, Ward NL, Angiuoli SV,
Crabtree J, Jones AL, Durkin AS, Deboy RT, Davidsen TM, Mora M, Scarselli M, Margarit
Y, Ros I, Peterson JD, Hauser CR, Sundaram JP, Nelson WC, Madupu R, Brinkac LM,
Dodson RJ, Rosovitz MJ, Sullivan SA, Daugherty SC, Haft DH, Selengut J, Gwinn ML,
Zhou L, et al: Genome analysis of multiple pathogenic isolates of Streptococcus
agalactiae: implications for the microbial “pan-genome”. Proc Natl Acad Sci U S A 2005,
102:13950–13955.
52. Lefébure T, Bitar PDP, Suzuki H, Stanhope MJ: Evolutionary dynamics of complete
Campylobacter pan-genomes and the bacterial species concept. Genome Biol Evol 2010,
2:646–655.
53. Laing C, Villegas A, Taboada EN, Kropinski A, Thomas JE, Gannon VPJ: Identification
of Salmonella enterica species- and subgroup-specific genomic regions using Panseq 2.0.
Infect Genet Evol 2011, 11:2151–2161.
54. Sheppard SK, Didelot X, Meric G, Torralbo A, Jolley KA, Kelly DJ, Bentley SD, Maiden
MCJ, Parkhill J, Falush D: Genome-wide association study identi fi es vitamin B 5
biosynthesis as a host specificity factor in Campylobacter. Proc Natl Acad Sci U S A 2013,
1–5.
55. Grad YH, Godfrey P, Cerquiera GC, Mariani-Kurkdjian P, Gouali M, Bingen E, Shea TP,
Haas BJ, Griggs A, Young S, Zeng Q, Lipsitch M, Waldor MK, Weill F-X, Wortman JR,
Hanage WP: Comparative genomics of recent Shiga toxin-producing Escherichia coli
O104:H4: short-term evolution of an emerging pathogen. MBio 2013, 4:e00452–12.
56. McNally A, Cheng L, Harris SR, Corander J: The evolutionary path to extraintestinal
pathogenic, drug-resistant Escherichia coli is marked by drastic reduction in detectable
recombination within the core genome. Genome Biol Evol 2013, 5:699–710.
57. De Chiara M, Hood D, Muzzi A, Pickard DJ, Perkins T, Pizza M, Dougan G, Rappuoli R,
Moxon ER, Soriani M, Donati C: Genome sequencing of disease and carriage isolates of
nontypeable Haemophilus influenzae identifies discrete population structure. Proc Natl
Acad Sci 2014.
58. Laabei M, Recker M, Rudkin JK, Aldeljawi M, Gulay Z, Sloan TJ, Williams P, Endres
JL, Bayles KW, Fey PD, Yajjala VK, Widhelm T, Hawkins E, Lewis K, Parfett S, Scowen L,
Peacock SJ, Holden M, Wilson D, Read TD, van den Elsen J, Priest NK, Feil EJ, Hurst LD,
Josefsson E, Massey RC: Predicting the virulence of MRSA from its genome sequence.
Genome Res 2014, 24:839–849.
59. Croucher NJ, Harris SR, Fraser C, Quail MA, Burton J, van der Linden M, McGee L, von
Gottberg A, Song JH, Ko KS, Pichon B, Baker S, Parry CM, Lambertsen LM, Shahinas D,
Pillai DR, Mitchell TJ, Dougan G, Tomasz A, Klugman KP, Parkhill J, Hanage WP, Bentley
SD: Rapid pneumococcal evolution in response to clinical interventions. Science 80- )
2011, 331:430–434.
60. Li Y, Kwok AHY, Jiang J, Zou Y, Zheng F, Chen P, Hou C, Leung FC, Jiang P:
Complete genome analysis of a Haemophilus parasuis serovar 12 strain from China.
PLoS One 2013, 8:e68350.
61. Kielstein P, Rapp-Gabrielson VJ: Designation of 15 serovars of Haemophilus parasuis
on the basis of immunodiffusion using heat-stable antigen extracts. J Clin Microbiol
1992, 30:862–865.
62. Cheng L, Connor TR, Siren J, Aanensen DM, Corander J: Hierarchical and spatially
explicit clustering of DNA sequences with BAPS software. Mol Biol Evol 2013, 30:1224–
1228.
63. Tang J, Hanage WP, Fraser C, Corander J: Identifying currents in the gene pool for
bacterial populations using an integrative approach. PLoS Comput Biol 2009, 5.
64. Den Bakker HC, Didelot X, Fortes ED, Nightingale KK, Wiedmann M: Lineage specific
recombination rates and microevolution in Listeria monocytogenes. BMC Evol Biol 2008,
8:277.
65. Castillo-ramírez S, Corander J, Marttinen P, Aldeljawi M, Hanage WP, Westh H, Boye
K, Gulay Z, Bentley SD, Parkhill J, Holden MT, Feil EJ: Phylogeographic variation in
recombination rates within a global clone of methicillin-resistant Staphylococcus aureus.
Genome Biol 2012, 13:R126.
66. De Been M, van Schaik W, Cheng L, Corander J, Willems RJ: Recent recombination
events in the core genome are associated with adaptive evolution in Enterococcus
faecium. Genome Biol Evol 2013, 5:1524–1535.
67. Sheppard SK, Cheng L, Meric G, de Haan CP, Llarena A-K, Marttinen P, Vidal A, Ridley
A, Clifton-Hadley F, Connor TR, Strachan NJ, Forbes K, Colles FM, Jolley KA, Bentley SD,
Maiden MC, Hanninen M-L, Parkhill J, Hanage WP, Corander J: Cryptic ecology among
host generalist Campylobacter jejuni in domestic animals. Mol Ecol 2014.
68. Olvera A, Cerdà-Cuéllar M, Mentaberre G, Casas-Diaz E, Lavin S, Marco I, Aragon V:
First isolation of Haemophilus parasuis and other NAD-dependent Pasteurellaceae of
swine from European wild boars. Vet Microbiol 2007, 125:182–186.
69. Letunic I, Bork P: Interactive Tree Of Life v2: online annotation and display of
phylogenetic trees made easy. Nucleic Acids Res 2011, 39(Web Server issue):W475–W478.
70. Letunic I, Bork P: Interactive Tree Of Life (iTOL): an online tool for phylogenetic
tree display and annotation. Bioinformatics 2007, 23:127–128.
71. Marttinen P, Hanage WP, Croucher NJ, Connor TR, Harris SR, Bentley SD, Corander J:
Detection of recombination events in bacterial genomes from large population samples.
Nucleic Acids Res 2012, 40:e6.
72. Chewapreecha C, Harris SR, Croucher NJ, Turner C, Marttinen P, Cheng L, Pessia A,
Aanensen DM, Mather AE, Page AJ, Salter SJ, Harris D, Nosten F, Goldblatt D, Corander J,
Parkhill J, Turner P, Bentley SD: Dense genomic sampling identifies highways of
pneumococcal recombination. Nat Genet 2014, 46:305–309.
73. Vos M, Didelot X: A comparison of homologous recombination rates in bacteria and
archaea. ISME J 2009, 3:199–208.
74. Budroni S, Siena E, Dunning Hotopp JC, Seib KL, Serruto D, Nofroni C, Comanducci M,
Riley DR, Daugherty SC, Angiuoli SV, Covacci A, Pizza M, Rappuoli R, Moxon ER,
Tettelin H, Medini D: Neisseria meningitidis is structured in clades associated with
restriction modification systems that modulate homologous recombination. Proc Natl
Acad Sci U S A 2011, 108:4494–4499.
75. Finn RD, Bateman A, Clements J, Coggill P, Eberhardt Y, Eddy SR, Heger A,
Hetherington K, Holm L, Mistry J, Sonnhammer ELL, Tate J, Punta M, Eberhardt RY:
Pfam: the protein families database. Nucleic Acids Res 2014, 42(Database issue):D222–
D230.
76. Angen O, Oliveira S, Ahrens P, Svensmark B, Leser TD: Development of an improved
species specific PCR test for detection of Haemophilus parasuis. Vet Microbiol 2007,
119:266–276.
77. Mullins MA, Register KB, Bayles DO, Butler JE: Haemophilus parasuis exhibits IgA
protease activity but lacks homologs of the IgA protease genes of Haemophilus
influenzae. Vet Microbiol 2011, 153:407–412.
78. Zhang B, Tang C, Liao M, Yue H: Update on the pathogenesis of Haemophilus
parasuis infection and virulence factors. Vet Microbiol 2013.
79. Costa-Hurtado M, Ballester M, Galofré-Milà N, Darji A, Aragon V: VtaA8 and VtaA9
from Haemophilus parasuis delay phagocytosis by alveolar macrophages. Vet Res 2012,
43:57.
80. Bliven KA, Maurelli AT: Antivirulence genes: insights into pathogen evolution
through gene loss. Infect Immun 2012, 80:4061–4070.
81. Merhej V, Georgiades K, Raoult D: Postgenomic analysis of bacterial pathogens
repertoire reveals genome reduction rather than virulence factors. Brief Funct Genomics
2013, 12:291–304.
82. Cole S, Brosch R, Parkhill J, Garnier T: Deciphering the biology of Mycobacterium
tuberculosis from the complete genome sequence. Nature 1998, 393:537–544.
83. Kline KA, Fälker S, Dahlberg S, Normark S, Henriques-Normark B: Bacterial adhesins
in host-microbe interactions. Cell Host Microbe 2009, 5:580–592.
84. Zhang B, He Y, Xu C, Xu L, Feng S, Liao M, Ren T: Cytolethal distending toxin
(CDT) of the Haemophilus parasuis SC096 strain contributes to serum resistance and
adherence to and invasion of PK-15 and PUVEC cells. Vet Microbiol 2012, 157:237–242.
85. Pickett CL, Whitehouse CA: The cytolethal distending toxin family. Trends Microbiol
1999, 7:292–297.
86. Großhennig S, Schmidl SR, Schmeisky G, Busse J, Stülke J: Implication of glycerol and
phospholipid transporters in Mycoplasma pneumoniae growth and virulence. Infect
Immun 2013, 81:896–904.
87. Romero P, López R, García E, Lo R: Characterization of LytA-Like N Acetylmuramoyl-l-alanine amidases from two new Streptococcus mitis bacteriophages
provides insights into the properties of the major pneumococcal autolysin. J Bacteriol
2004, 186:8229–8239.
88. Weiss A, Brockmeyer J: Prevalence, biogenesis, and functionality of the serine
protease autotransporter EspP. Toxins (Basel) 2013, 5:25–48.
89. Bethe G, Nau R, Wellmer A, Hakenbeck R, Reinert RR, Heinz HP, Zysk G: The cell
wall-associated serine protease PrtA: a highly conserved virulence factor of
Streptococcus pneumoniae. FEMS Microbiol Lett 2001, 205:99–104.
90. Perkins-Balding D, Ratliff-griffin M, Stojiljkovic I: Iron Transport Systems in
Neisseria meningitidis. Microbiol Mol Biol Rev 2004, 68.
91. Goldberg MB, Boyko SA, Butterton JR, Stoebner JA, Payne SM, Calderwood SB:
Characterization of a Vibrio cholerae virulence factor homologous to the family of
TonB-dependent proteins. Mol Microbiol 1992, 6:2407–2418.
92. Oliveira BS: Haemophilus parasuis diagnostics. J Swine Heal Prod 2007, 15:99–103.
93. Ferri EFR, Del Río ML, Gutiérrez CB, Rodríguez Ferri EF: Value of indirect
hemagglutination and coagglutination tests for serotyping Haemophilus parasuis. J Clin
Microbiol 2003, 41:880.
94. Fischer S, Brunk BP, Chen F, Gao X, Harb OS, Iodice JB, Shanmugam D, Roos DS,
Stoeckert CJ: Using OrthoMCL to assign proteins to OrthoMCL-DB groups or to cluster
proteomes into new ortholog groups. Curr Protoc Bioinformatics 2011, Chapter 6:Unit
6.12.1–19.
95. Hyatt D, Chen G-L, Locascio PF, Land ML, Larimer FW, Hauser LJ: Prodigal:
prokaryotic gene recognition and translation initiation site identification. BMC
Bioinformatics 2010, 11:119.
96. Seemann T: Prokka: rapid prokaryotic genome annotation. Bioinformatics 2014, 1–2.
97. Tamura K, Stecher G, Peterson D, Filipski A, Kumar S: MEGA6: Molecular
Evolutionary Genetics Analysis version 6.0. Mol Biol Evol 2013, 30:2725–2729.
98. Oksanen J, Blanchet FG, Kindt R, Legendre P, Minchin PR, O’Hara RB, Simpson GL,
Solymos P, Stevens MHH, Wagner H: Vegan: Community Ecology Package. ; 2013.
99. Warnes GR, Bolker B, Bonebakker L, Gentleman R, Huber W, Liaw A, Lumley T,
Magnusson A, Maechler M, Moeller S, Schwartz M, Venables B: gplots: Various R
Programming Tools for Plotting Data. ; 2014.
100. Ploner A: Heatplus: Heatmaps with Row and/or Column Covariates and Colored
Clusters. ; 2011.
101. Schierup MH, Hein J: Consequences of recombination on traditional phylogenetic
analysis. Genetics 2000, 156:879–891.
102. Hernández-López A, Chabrol O, Royer-Carenzi M, Merhej V, Pontarotti P, Raoult D:
To tree or not to tree? genome-wide quantification of recombination and reticulate
evolution during the diversification of strict intracellular bacteria. Genome Biol Evol
2013, 5:2305–2317.
103. Bi D, Xu Z, Harrison EM, Tai C, Wei Y, He X, Jia S, Deng Z, Rajakumar K, Ou H-Y:
ICEberg: a web-based resource for integrative and conjugative elements found in
Bacteria. Nucleic Acids Res 2012, 40(Database issue):D621–D626.
104. Zhou Y, Liang Y, Lynch KH, Dennis JJ, Wishart DS: PHAST: a fast phage search
tool. Nucleic Acids Res 2011, 39(Web Server issue):W347–W352.
105. Jombart T: Analysing Genome-Wide SNP Data using Adegenet. ; 2012:1–37.
106. Jombart T, Devillard S, Balloux F: Discriminant analysis of principal components: a
new method for the analysis of genetically structured populations. BMC Genet 2010,
11:94.
107. Venables WN, Ripley BD: Modern Applied Statistics with S. Fourth. New York:
Springer; 2002.
108. Carver T, Berriman M, Tivey A, Patel C, Böhme U, Barrell BG, Parkhill J, Rajandream
M-A: Artemis and ACT: viewing, annotating and comparing sequences stored in a
relational database. Bioinformatics 2008, 24:2672–2676.
109. Edgar RC: MUSCLE: multiple sequence alignment with high accuracy and high
throughput. Nucleic Acids Res 2004, 32:1792–1797.
110. Eddy SR: SQUID - C Function Library for Sequence Analysis. ; 2005.
Additional files
Additional_file_1 as DOCX
Additional file 1 Is the supplemental information accompanying this paper including 1) COG
functional classification of the homology groups, 2) variable regions in the synteny of the
pan-genome, 3) G + C content of the pan-genome, 4) second level BAPS analysis, 5)
correlation between the capsule loci and serotyping results, 6) identification of potential
serovar-specific markers from the pan-genome, 7) limited evidence of reductive evolution in
H. parasuis, 8) genome assembly, 9) homology group checks.
Additional_file_2 as CSV
Additional file 2: Table S1 Is the table describing the H. parasuis isolate collection
including accession numbers, country of origin, clinical data and serotyping results.
Additional_file_3 as TXT
Additional file 3: Table S2 Lists the single nucleotide polymorphisms identified as
significant from the BAPS populations and clades.
Additional_file_4 as TXT
Additional file 4: Table S3 Is the table detailing the accessory genes that are significantly
different between BAPS populations and clades.
Additional_file_5 as CSV
Additional file 5: Table S4 Is the table listing the putative virulence factors for H. parasuis
that were investigated in this isolate collection.
Additional_file_6 as CSV
Additional file 6: Table S5 Is the table detailing the association between the capsule loci and
serotyping results.
Additional_file_7 as PDF
Additional file 7: Figure S1 Synteny of the pan-genome created based on the SH0165
complete genome, with black areas showing presence of a gene, and white areas absence.
Areas of variation in the synteny with predicted phage genes are highlighted in red, areas
with high levels of genes of unknown function in green. Numbers indicate regions of
variation. Antibiotic resistance gene locations are represented by orange lines.
Additional_file_8 as PDF
Additional file 8: Figure S2 Synteny of the capsule loci of Haemophilus parasuis. Rows
represent the isolates from the collection and black diamonds represent the presence of genes.
Each isolate was found to possess a capsule locus, isolates have been ordered by their
similarity in the pattern. The beginning and end of the locus are conserved but a lot of
variation can be seen within the locus.
Additional_file_9 as PNG
Additional file 9: Figure S3 Bayesian Analysis of Population Structure of 212 isolates of H.
parasuis. Each row in the figure is a strain and each column is a SNP with sites ordered to
maximize visual separation of the five distinct clusters. Horizontal black lines are drawn to
separate the clusters obtained in the first level of clustering.
Additional_file_10 as PNG
Additional file 10: Figure S4 Discriminant analysis of principal components applied to the
BAPS populations and two clades of H. parasuis (80% eigenvalues retained for the PCA), all
eigenvalues were retained for the discriminant analysis. Plots a and c show the first two axes
of the discriminant function while b and d show the first axis only. Separation along the axes
suggests that genetic differences are present between the BAPS populations and clades. A
large degree of separation can be seen from the both accessory genome and the core genome,
and is far more pronounced for the two clades of H. parasuis.
Additional_file_11 as PNG
Additional file 11: Figure S5 Comparison of the COG functional groups found in the core
and accessory genome of H. parasuis found at greater than 1%. Several differences in
proportions of COG groups can be seen between the core and the accessory genome. The
core genome shows a greater proportion of proteins involved in translation, coenzyme
metabolism as well as post translational modification over the accessory genome. A greater
proportion of cell wall/membrane biogenesis transcription, replication and repair and cell
motility, defence mechanisms as well as proteins of unknown function were identified in the
accessory genome. CELLULAR PROCESSES AND SIGNALING -[D] Cell cycle control,
cell division, chromosome partitioning, [M] Cell wall/membrane/envelope biogenesis, [O]
Post-translational modification, protein turnover, and chaperones, [T] Signal transduction
mechanisms, [U] Intracellular trafficking, secretion, and vesicular transport, [V] Defense
mechanisms, [W] Extracellular structures. INFORMATION STORAGE AND
PROCESSING - [J] Translation, ribosomal structure and biogenesis, [K] Transcription, [L]
Replication, recombination and repair. METABOLISM- [C] Energy production and
conversion, [E] Amino acid transport and metabolism, [F] Nucleotide transport and
metabolism, [G] Carbohydrate transport and metabolism, [H] Coenzyme transport and
metabolism, [I] Lipid transport and metabolism, [P] Inorganic ion transport and metabolism,
[Q] Secondary metabolites biosynthesis, transport, and catabolism. POORLY
CHARACTERIZED - [R] General function prediction only, [S] Function unknown. If a gene
cannot be classified by a singular COG category then multiple categories can be used, e.g.
UW represents proteins involved in intracellular trafficking [U] and extracellular structures
[W].
Additional_file_12 as PDF
Additional file 12: Figure S6 G+C content of the H. parasuis pan-genome. Plot a) shows the
variation of the G+C content based on the syntenic order of the pan-genome, while plot b)
shows a histogram of the variation in all predicted genes.
Additional_file_13 as PNG
Additional file 13: Figure S7 BAPS populations level 2 comparison to clinical metadata
including serovar, disease association and country. Greater separation of serovars
(particularly for serovar 5), disease association and geography (for the UK and Denmark) can
be seen based on these more refined populations.
Additional_file_14 as PNG
Additional file 14: Figure S8 Synteny of the capsule loci of Haemophilus parasuis. Rows
represent the isolates from the collection, coloured diamonds represent the presence of genes.
Each isolate was found to possess a capsule locus, isolates have been ordered by their
predicted serovar. The beginning and end of the locus are conserved but a lot of variation can
be seen within the locus. The pattern based on the predicted serovars does fit with the
presence and absence of the genes for the majority of isolates.
Additional_file_15 as PNG
Additional file 15: Figure S9 Discriminant Analysis of Principal Components applied to the
core genome and accessory for H. parasuis serotyped strains, retaining 80% of the PCA
eigenvalues. A) Separation of the serovars into two main groups can be seen based on the
first two axes of the discriminant function. B) Greater separation of the discriminant function
of serotyped strains by serovar can be seen from the core in comparison to the accessory.
However these serovars have a low number of strains within these groups.
Additional_file_16 as PNG
Additional file 16: Figure S10 Comparison of genome size (based on the number of
homology groups and pseudogenes) using box and whisker plots. No difference can be seen
in either genome size or number of pseudogenes for disease association, serovar or BAPS
populations.
Figure 1
Figure 2
Figure 3
Figure 4
Figure 5
Additional files provided with this submission:
Additional file 1: 1237392396134299_add1.docx, 45K
http://www.biomedcentral.com/imedia/1011620951154704/supp1.docx
Additional file 2: 1237392396134299_add2.csv, 11K
http://www.biomedcentral.com/imedia/9139614921547048/supp2.csv
Additional file 3: 1237392396134299_add3.txt, 2K
http://www.biomedcentral.com/imedia/1956534031547048/supp3.txt
Additional file 4: 1237392396134299_add4.txt, 3K
http://www.biomedcentral.com/imedia/1806514438154704/supp4.txt
Additional file 5: 1237392396134299_add5.csv, 14K
http://www.biomedcentral.com/imedia/1772153764154704/supp5.csv
Additional file 6: 1237392396134299_add6.csv, 1K
http://www.biomedcentral.com/imedia/1402632002154704/supp6.csv
Additional file 7: 1237392396134299_add7.pdf, 732K
http://www.biomedcentral.com/imedia/1447566375154704/supp7.pdf
Additional file 8: 1237392396134299_add8.pdf, 13K
http://www.biomedcentral.com/imedia/2080649814154704/supp8.pdf
Additional file 9: 1237392396134299_add9.png, 115K
http://www.biomedcentral.com/imedia/1682763419154704/supp9.png
Additional file 10: 1237392396134299_add10.png, 200K
http://www.biomedcentral.com/imedia/2039297216154704/supp10.png
Additional file 11: 1237392396134299_add11.png, 142K
http://www.biomedcentral.com/imedia/1853449881547048/supp11.png
Additional file 12: 1237392396134299_add12.pdf, 168K
http://www.biomedcentral.com/imedia/1243800081547048/supp12.pdf
Additional file 13: 1237392396134299_add13.png, 317K
http://www.biomedcentral.com/imedia/2128356289154704/supp13.png
Additional file 14: 1237392396134299_add14.png, 156K
http://www.biomedcentral.com/imedia/1485353982154704/supp14.png
Additional file 15: 1237392396134299_add15.png, 179K
http://www.biomedcentral.com/imedia/1779797152154704/supp15.png
Additional file 16: 1237392396134299_add16.png, 132K
http://www.biomedcentral.com/imedia/2414692641547048/supp16.png


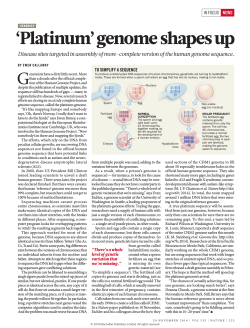
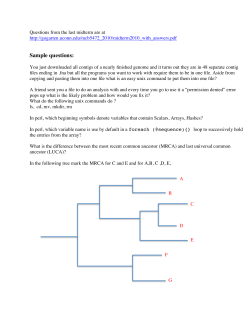

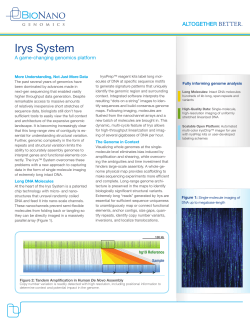


© Copyright 2026