
Document
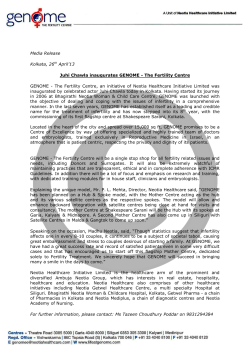
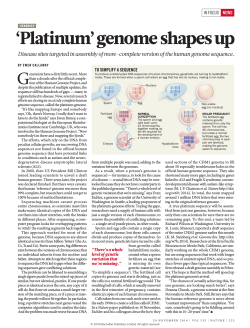
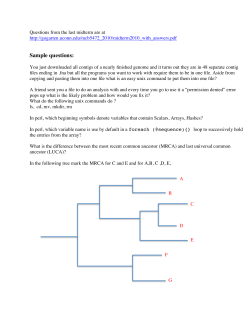
Resource
Insights into the Evolution of Longevity from the
Bowhead Whale Genome
Graphical Abstract
Authors
Michael Keane, Jeremy Semeiks, ...,
Bo Thomsen, Joa˜o Pedro de Magalha˜es
Correspondence
[email protected]
In Brief
The bowhead whale is the longest-lived
mammal, possibly living over 200 years.
Keane et al. sequence the bowhead
genome and transcriptome and perform a
comparative analysis with other
cetaceans and mammals. Changes in
bowhead genes related to cell cycle, DNA
repair, cancer, and aging suggest
alterations that may be biologically
relevant.
Highlights
d
Genome and two transcriptomes of the bowhead whale, the
longest-lived mammal
d
Bowhead-specific mutations in genes associated with cancer
and aging (e.g., ERCC1)
d
Duplications in genes associated with DNA repair, cell cycle,
and aging (e.g., PCNA)
d
Changes in genes related to thermoregulation (UCP1) and
other bowhead traits
Keane et al., 2015, Cell Reports 10, 112–122
January 6, 2015 ª2015 The Authors
http://dx.doi.org/10.1016/j.celrep.2014.12.008
Cell Reports
Resource
Insights into the Evolution of Longevity
from the Bowhead Whale Genome
Michael Keane,1,18 Jeremy Semeiks,2,18 Andrew E. Webb,3,18 Yang I. Li,4,18,19 Vı´ctor Quesada,5,18 Thomas Craig,1
Lone Bruhn Madsen,6 Sipko van Dam,1 David Brawand,4 Patrı´cia I. Marques,5 Pawel Michalak,7 Lin Kang,7 Jong Bhak,8
Hyung-Soon Yim,9 Nick V. Grishin,2 Nynne Hjort Nielsen,10 Mads Peter Heide-Jørgensen,10 Elias M. Oziolor,11
Cole W. Matson,11 George M. Church,12 Gary W. Stuart,13 John C. Patton,14 J. Craig George,15 Robert Suydam,15
Knud Larsen,6 Carlos Lo´pez-Otı´n,5 Mary J. O’Connell,3 John W. Bickham,16,17 Bo Thomsen,6
and Joa˜o Pedro de Magalha˜es1,*
1Integrative
Genomics of Ageing Group, Institute of Integrative Biology, University of Liverpool, Liverpool L69 7ZB, UK
Hughes Medical Institute and Departments of Biophysics and Biochemistry, University of Texas Southwestern Medical Center,
Dallas, TX 75390-9050, USA
3Bioinformatics and Molecular Evolution Group, School of Biotechnology, Dublin City University, Glasnevin, Dublin 9, Ireland
4MRC Functional Genomics Unit, University of Oxford, Oxford OX1 3QX, UK
5Departamento de Bioquı´mica y Biologı´a Molecular, Instituto Universitario de Oncologı´a (IUOPA), Universidad de Oviedo, 33006 Oviedo,
Spain
6Department of Molecular Biology and Genetics, Aarhus University, 8830 Tjele, Denmark
7Virginia Bioinformatics Institute, Virginia Tech, Blacksburg, VA 24061, USA
8Personal Genomics Institute, Genome Research Foundation, Suwon 443-270, Republic of Korea
9KIOST, Korea Institute of Ocean Science and Technology, Ansan 426–744, Republic of Korea
10Greenland Institute of Natural Resources, 3900 Nuuk, Greenland
11Department of Environmental Science, Center for Reservoir and Aquatic Systems Research (CRASR) and Institute for Biomedical Studies,
Baylor University, Waco, TX 76798, USA
12Department of Genetics, Harvard Medical School, Boston, MA 02115, USA
13The Center for Genomic Advocacy (TCGA) and Department of Biology, Indiana State University, Terre Haute, IN 47809, USA
14Department of Forestry and Natural Resources, Purdue University, West Lafayette, IN 47907, USA
15North Slope Borough, Department of Wildlife Management, Barrow, AK 99723, USA
16Battelle Memorial Institute, Houston, TX 77079, USA
17Department of Wildlife and Fisheries Sciences, Texas A&M University, College Station, TX 77843, USA
18Co-first author
19Present address: Department of Genetics, Stanford University, Stanford, CA 94305, USA
*Correspondence: [email protected]
http://dx.doi.org/10.1016/j.celrep.2014.12.008
This is an open access article under the CC BY license (http://creativecommons.org/licenses/by/3.0/).
2Howard
SUMMARY
The bowhead whale (Balaena mysticetus) is estimated to live over 200 years and is possibly
the longest-living mammal. These animals should
possess protective molecular adaptations relevant
to age-related diseases, particularly cancer. Here,
we report the sequencing and comparative analysis
of the bowhead whale genome and two transcriptomes from different populations. Our analysis
identifies genes under positive selection and bowhead-specific mutations in genes linked to cancer
and aging. In addition, we identify gene gain and
loss involving genes associated with DNA repair,
cell-cycle regulation, cancer, and aging. Our results
expand our understanding of the evolution of
mammalian longevity and suggest possible players
involved in adaptive genetic changes conferring cancer resistance. We also found potentially relevant
changes in genes related to additional processes,
112 Cell Reports 10, 112–122, January 6, 2015 ª2015 The Authors
including thermoregulation, sensory perception,
dietary adaptations, and immune response. Our
data are made available online (http://www.
bowhead-whale.org) to facilitate research in this
long-lived species.
INTRODUCTION
The lifespan of some animals, including quahogs, tortoises, and
certain whale species, is far greater than that of humans (Austad,
2010; Finch, 1990). It is remarkable that a warm-blooded species
such as the bowhead whale (Balaena mysticetus) has not only
been estimated to live over 200 years (estimated age of one
specimen 211 SE 35 years), suggesting it is the longest-lived
mammal, but also exhibits very low disease incidence until an
advanced age compared to humans (George et al., 1999; Philo
et al., 1993). As in humans, the evolution of longevity in whales
was accompanied by low fecundity and longer developmental
time (Tacutu et al., 2013), as predicted by evolutionary theory.
The cellular, molecular, and genetic mechanisms underlying
longevity and resistance to age-related diseases in bowhead
Table 1. Statistics of the Bowhead Whale Genome Sequencing
Sequence Data Generated
Sequence Coverage
(for 2.91 Gb)
Libraries
Total Data (Gb)
200 bp paired-end
149.1
500 bp paired-end
141.7
48.73
3 kb mate-paired
57.3
19.73
5 kb mate-paired
72.5
24.93
10 kb mate-paired
28.5
9.83
449.1
154.33
Total
51.23
Genome Assembly Statistics
Assembly
Contigs
Scaffolds
N50 (kb)
34.8
877
Number
Total Size (Gb)
113,673
2.1
7,227
2.3
See also Figures S1 and S2.
whales are unknown, but it is clear that, in order to live so long,
these animals must possess preventative mechanisms against
cancer, immunosenescence, and neurodegenerative, cardiovascular, and metabolic diseases. In the context of cancer,
whales, and bowhead whales, in particular, must possess effective antitumor mechanisms. Indeed, given their large size (in
extreme cases adult bowhead whales can weigh up to 100
tons and are therefore among the largest whales) and exceptional longevity, bowhead whale cells must have a significantly
lower probability of neoplastic transformation relative to humans
(Caulin and Maley, 2011; de Maga˜lhaes, 2013). Therefore, studying species such as bowhead whales that have greater natural
longevity and resistance to age-related diseases than humans
may lead to insights on the fundamental mechanisms of aging.
Here, we report the sequencing and analysis of the genome of
the bowhead whale, a species of the right whale family Balaenidae that lives in Arctic and sub-Arctic waters. This work provides
clues regarding mechanisms underlying mammalian longevity
and will be a valuable resource for researchers studying the evolution of longevity, disease resistance, and basic bowhead whale
biology.
RESULTS
Sequencing and Annotation of the Bowhead Whale
Genome
We sequenced the nuclear genome of a female bowhead whale
(Balaena mysticetus) using the Illumina HiSeq platform at 1503
coverage. We followed established standards in the field in
terms of sequencing paired-end libraries at high coverage
plus mate-paired libraries of varying (3, 5, and 10 kb) insert
sizes (Table 1). Contigs and scaffolds were assembled with
ALLPATHS-LG (Gnerre et al., 2011). In line with other genomes
sequenced with second-generation sequencing platforms, the
contig N50 was 34.8 kb and scaffold N50 was 877 kb (Table 1);
the longest scaffold in our assembly was 5,861 kb. In total, our
assembly is 2.3 Gb long. Genome size was estimated experimentally to be 2.91 Gb in another female and 2.87 Gb averaged
with one male (see Supplemental Results and Figure S1), but this
discrepancy likely reflects highly repetitive regions, as observed
for the genomes of other species with similar reported sizes such
as the minke whale (Yim et al., 2014).
The full and partial completeness of the bowhead whale draft
genome assembly was evaluated as 93.15% and 97.18%,
respectively, by the CEGMA pipeline (Parra et al., 2007), which
is comparable to the minke whale genome assembly (Yim
et al., 2014). We also generated RNA sequencing (RNA-seq)
data from seven adult bowhead whale tissues (cerebellum, kidney, muscle, heart, retina, liver, and testis) from specimens
from Greenland and Alaska, resulting in two transcriptome assemblies (see Experimental Procedures) and annotated the
genome using MAKER2, which combines ab initio methods, homology-based methods, and transcriptome data to derive gene
models (Holt and Yandell, 2011). Our annotation contains 22,672
predicted protein-coding genes with an average length of 417
(median 307) amino acid residues. In addition, based on transcriptome data from two Alaskan individuals (Table S1), we estimated 0.5–0.6 SNPs per kilobase of RNA (Table S2). To begin
annotation of the bowhead genome, we identified orthologs
based on similarity with cow, human, and mouse genes/proteins
(see Experimental Procedures), which allowed us to assign predicted gene symbols to 15,831 bowhead genes.
Moreover, to annotate microRNAs in the bowhead genome,
we sequenced small RNA libraries prepared from kidney and
skeletal muscle. The miRDeep algorithm (Friedla¨nder et al.,
2008, 2012) was used to integrate the sequencing data into a
model of microRNA biogenesis by Dicer processing of predicted
precursor hairpin structures in the genome, thus identifying 546
candidate microRNA genes. Of the 546 candidate miRNAs identified in the bowhead, 395 had seed sequences previously identified in miRNAs from human, cow, or mouse, whereas 151 did
not. All of our data are available online from our Bowhead Whale
Genome Resource portal (http://www.bowhead-whale.org).
Analysis of the Draft Bowhead Whale Genome
Repeat sequences make up 41% of the bowhead genome
assembly, most of which (78%) belong to the group of transposable elements (TEs). Although long interspersed nuclear elements (LINEs), such as L1, and short interspersed nuclear
elements (SINEs) are widespread TEs in most mammalian
lineages, the bowhead genome, similar to other cetacean genomes—minke, orca, and common bottlenose dolphin—is virtually devoid of SINEs (Supplemental Folder 1). LINE-1 (L1) is the
most abundant TE, particularly in orca (90%) and minke whale
(89%) (Figure S2). In comparison, TE diversity (measured with
Shannon’s index) in the bowhead genome (0.947) is higher
than in orca (0.469) and minke whale (0.515) but lower than in
dolphin (1.389) and cow (Bovine Genome Sequencing and Analysis Consortium et al., 2009) (1.534).
As a first assessment of coding genes that could be responsible for bowhead whale adaptations, we used bowhead coding
sequences to calculate pairwise dN/dS ratios for 9,682, 12,685,
and 11,158 orthologous coding sequences from minke whale
(Balaenoptera acutorostrata), cow (Bos taurus), and dolphin (Tursiops truncatus), respectively. It is interesting to note that there
are high levels of sequence conservation in the protein coding
regions between bowhead and these species: 96% (minke),
Cell Reports 10, 112–122, January 6, 2015 ª2015 The Authors 113
Figure 1. Phylogeny of Mammals Used in
Codon-Based Maximum Likelihood Comparison of Selective Pressure Variation
The number of candidate genes under positive
selection on each lineage is indicated.
92% (dolphin), and 91% (cow). This is not surprising, however,
given the long generation time of cetaceans and of the bowhead
whale, in particular, with animals only reaching sexual maturity
at >20 years (Tacutu et al., 2013).
Because the minke whale is the closest relative to the bowhead (divergence time 25–30 million years ago [Gatesy et al.,
2013]) with a sequenced genome and is smaller (<10 tons) and
probably much shorter lived (maximum lifespan 50 years)
(Tacutu et al., 2013), comparisons between the bowhead and
minke whale genomes may provide insights on the evolution of
bowhead traits and of longevity, in particular. A number of agingand cancer-associated genes were observed among the 420
predicted bowhead-minke orthologs with dN/dS exceeding 1,
including suppressor of cytokine signaling 2 (SOCS2), aprataxin
(APTX), noggin (NOG), and leptin (LEP). In addition, the top 5%
genes with high dN/dS values for bowhead-minke relative to
the values for minke-cow and minke-dolphin orthologs included
forkhead box O3 (FOXO3), excision repair cross-complementing
rodent repair deficiency, complementation group 3 (ERCC3),
and fibroblast growth factor receptor 1 (FGFR1). The data on
dN/dS ratios are also available on our portal to allow researchers
to do their own analysis and quickly retrieve gene(s) of interest.
In a complementary and more detailed analysis of selective
pressure variation, we used codon-based models of evolution
(Yang, 2007) to identify candidate genes with evidence of lineage-specific positive selection (see Experimental Procedures).
Using bowhead, minke, and orca protein-coding data along
with a variety of available high-quality completed genomes
from Laurasiatheria, Euarchontoglires, marsupial, and monotreme species, we identified a total of 866 single-gene ortholog
families (SGOs) (i.e., these gene families have no more than
114 Cell Reports 10, 112–122, January 6, 2015 ª2015 The Authors
one copy in each species). We tested
each of the extant whale lineages, the
ancestral baleen whale, and the most
recent common ancestor (MRCA) of
bowhead, minke, and orca, a total of
five lineages (Figure 1), for evidence
of lineage-specific positive selection.
Of the two extant whales analyzed, the
number of SGOs exhibiting signatures of
lineage-specific positive selection were
as follows: bowhead (15 gene families)
and minke (ten gene families). The small
number of candidates under positive selection likely reflects the high level of protein conservation between bowhead and
other cetaceans as well as the stringent
filtering of candidates due to data-quality
concerns; all results and alignments are
provided in Supplemental Folder 1. A
few genes associated with disease were
identified, including BMP and activin membrane-bound inhibitor
(BAMBI), which has been associated with various pathologies,
including cancer, and also poorly studied genes of potential
interest like GRB2-binding adaptor protein, transmembrane
(GAPT).
In addition to the codon-based models of evolution, we
wished to identify bowhead whale specific amino acid replacement substitutions. To this end, we aligned orthologous
sequences between the bowhead whale and nine other mammals—a total of 4,358 alignments (see Experimental Procedures). Lineage-specific residues identified in this way have
previously been shown to be indicative of significant changes
in protein function (Tian et al., 2013). Our analysis revealed
several proteins associated with aging and cancer among the
top 5% of unique bowhead residues by concentration (i.e.,
normalized by protein length), including ERCC1 (excision repair
cross-complementing rodent repair deficiency, complementation group 1), HDAC1 (histone deacetylase 1), and HDAC2 (Figure 2A). ERCC1 is a member of the nucleotide excision repair
pathway (Gillet and Scha¨rer, 2006), and disruption results in
greatly reduced lifespan in mice and accelerated aging (Weeda
et al., 1997). Histone deacetylases play an important role in the
regulation of chromatin structure and transcription (Lee et al.,
1993) and have been associated with longevity in Drosophila
(Rogina et al., 2002). As such, these represent candidates
involved in adaptive genetic changes conferring disease resistance in the bowhead whale. The full results are available in Supplemental Folder 1.
In addition to genes related to longevity, several interesting
candidate genes emerged from our analysis of lineage-specific
residues of potential relevance to other bowhead traits. Of
Figure 2. Multiple Protein Sequence Alignments of HDAC2 and UCP1
(A) Partial alignment of bowhead HDAC2 with mammalian orthologs. Unique bowhead residues are highlighted at human positions 68, 95, and 133.
(B) Partial alignment of whale UCP1 with mammalian orthologs. Conserved regions involved in UCP1 are marked in red.
note, a number of proteins related to sensory perception of
sound were also identified with bowhead-specific mutations,
including otoraplin (OTOR) and cholinergic receptor, nicotinic,
alpha 10 (CHRNA10), which could be relevant in the context of
the bowhead’s ability to produce high- and low-frequency tones
simultaneously (Tervo et al., 2011). In addition, many proteins
must play roles in the large differences in size and development
between the bowhead and related species and our results reveal
possible candidates for further functional studies; for example, in
the top ten proteins, SNX3 (sorting nexin 3) has been associated
in one patient with eye formation defects and microcephaly (Vervoort et al., 2002), and WDR5 (WD repeat-containing protein 5)
has been associated with osteoblast differentiation and bone
development (Gori et al., 2006).
In the naked mole rat, a poikilotherm with a low metabolic rate
and body temperature when compared to other mammals,
unique changes in uncoupling protein 1 (UCP1), which is used
to generate heat, have been previously found (Kim et al.,
2011). Because the specific metabolic power output of cells
in vivo for large whales must be much less than for smaller mammals (West et al., 2002), it is interesting to note that UCP1 of
whales has a premature stop codon in C-terminal region, which
is functionally important and conserved in other mammals (Figure 2B). It is tempting to speculate that these changes are related
Cell Reports 10, 112–122, January 6, 2015 ª2015 The Authors 115
A
B
C
Figure 3. Gene Family Expansion and PCNA
(A) Gene family expansion. Numbers in red correspond to the predicted number of gene expansion events during mammalian evolution. Mean divergence time
estimates were used from TimeTree (Hedges et al., 2006) for scaling.
(B) Multiple sequence alignment of PCNA residues 28–107, showing bowhead whale-specific duplication (gene IDs: bmy 16007 and bmy 21945). Lineage-specic
amino acids in the duplicated PCNA of bowhead whales are highlighted in red.
(C) Crystal structure of the PCNA (green) and FEN-1 (yellow) complex. Lineage-specific residues on the PCNA structure are colored in red. A zoom in on the
structures reveals a putative interaction between two b sheets, one within PCNA and another within FEN-1. This interaction may be altered through a second
interaction between the PCNA b sheet and a lineage-specic change from glutamine to histidine within PCNA. Distance measurements between pairs of atoms are
marked in black. PDB accession number: 1UL1.
See also Table S3 and Figure S3.
to differences in thermoregulation between whales and smaller
mammals.
Potential Gene Duplications and Gene Losses
Gene duplication is a major mechanism through which phenotypic innovations can evolve (Holland et al., 1994; Kaessmann,
2010). Examples of mammalian phenotypic innovations associated to gene duplication include duplication of RNASE1, a
pancreatic ribonuclease gene, in leaf-eating monkeys that
contributed to adaptative changes in diet and digestive physiology (Zhang et al., 2002), a duplication of GLUD1 in hominoids
that subsequently acquired brain-specific functions (Burki and
Kaessmann, 2004), and domestication of two syncytin gene
copies that contributed to the emergence of placental development in mammals (Dupressoir et al., 2009). We surveyed the
bowhead whale genome for expanded gene families that may
reflect lineage-specific phenotypic adaptations and traits.
In the bowhead whale lineage, 575 gene families were predicted to have expanded (Figure 3). However, because gene
expansion predictions are susceptible to false-positives owing
to pseudogenes and annotation artifacts among other biases,
116 Cell Reports 10, 112–122, January 6, 2015 ª2015 The Authors
we applied a stringent filter based on percentage of identity
(Experimental Procedures) that reduced the number of candidate expansions to 41 (see Supplemental Folder 1 for the
complete list). A functional enrichment analysis of these gene
families, using default parameters in DAVID (Huang et al.,
2009), only revealed a statistically significant enrichment (after
correction for multiple hypothesis testing; Bonferroni <0.001)
for genes associated with translation/ribosome. Given the association between translation and aging, for instance, in the
context of loss of proteostasis (Lo´pez-Otı´n et al., 2013), it is
possible that these results reflect relevant adaptations in the
bowhead whale.
Upon manual inspection of the gene expansion results, we
found several duplicates of note. For instance, proliferating cell
nuclear antigen (PCNA) is duplicated in bowhead whales with
one copy harboring four lineage-specific residue changes (Figure 3B). Based on our RNA-seq data mapped to the genome
(see Experimental Procedures and full results in Supplemental
Folder 1), both PCNA copies are expressed in bowhead whale
muscle, kidney, retina, and testis. By mapping the lineagespecific residues onto the structure of PCNA in complex with
FEN-1, we uncovered one amino acid substitution (Q38H), which
may affect the interaction between PCNA and FEN-1 (Figure 3C).
A subsequent branch-site test for selective pressure variation
(see Experimental Procedures and Table S3) revealed that one
substitution, D58S, may have undergone positive selection in
the bowhead-whale lineage (with a posterior probability score
of 0.983). The duplication of PCNA during bowhead-whale evolution is of particular interest due to its involvement in DNA damage repair (Hoege et al., 2002) and association with aging in that
its levels in aged rat liver seem to relate to the decrease in the
rate of cell proliferation (Tanno et al., 1996).
Another notable duplicated gene is late endosomal/lysosomal
adaptor, MAPK and MTOR activator 1 (LAMTOR1), in which six
bowhead-specific amino acid changes were identified (Figure S3). LAMTOR1 is involved in amino acid sensing and activation of mTORC1, a gene strongly associated with aging and
cancer (Cornu et al., 2013). The original LAMTOR1 copy was expressed in all bowhead whale adult tissues for which we have
data, with the duplicate having much lower (but detectable)
expression in heart and retina. Also of note, putative duplications
of 26S proteasome non-ATPase regulatory subunit 4 (PSMD4)
and ubiquitin carboxyl-terminal esterase L3 (UCHL3) were identified with evidence of expression, which is intriguing considering
the known involvement of the proteasome-ubiquitin system in
aging (Lo´pez-Otı´n et al., 2013) and given previous evidence
that this system is under selection specific to lineages where
longevity increased (Li and de Magalha˜es, 2013); UCHL3 has
also been involved in neurodegeneration (Kurihara et al., 2001).
Other gene duplications of potential interest for their role in
mitosis, cancer, and stress response include cAMP-regulated
phosphoprotein 19 (ARPP19), which has three copies even
though we only detected expression of two copies, stomatinlike 2 (STOML2), heat shock factor binding protein 1 (HSBP1)
with four copies of which two appear to be expressed, spermine
synthase (SMS) and suppression of tumorigenicity 13 (ST13).
Similar to previous genome characterizations, we chose the
complete set of known protease genes for a detailed supervised
analysis of gene loss (Quesada et al., 2009). This procedure highlighted multiple gene loss events potentially related to the evolution of several cetacean traits, including adaptations affecting
the immune system, blood homeostasis, digestive system, and
dentition (Figure S4). Thus, the cysteine protease CASP12, a
modulator of the activity of inflammatory caspases, has at least
one conserved premature stop codon in bowhead and minke
whales. Interestingly, whereas this protease is conserved and
functional in almost all of the terrestrial mammals, most human
populations display different deleterious variants (Fischer et al.,
2002), presumably with the same functional consequences as
the premature stop codons in whales. Likewise, two paralogues
of carboxypeptidase A (CPA2 and CPA3) have been pseudogenized in bowhead and minke whales. Notably, CPA variants have
been associated with increased risk for prostate cancer in humans (Ross et al., 2009), which could be of interest in the context
of reduced cancer susceptibility in whales compared with humans (de Magalha˜es, 2013).
Additionally, we found that multiple coagulation factors have
been lost in bowhead and minke whales. The finding of bowhead
whale-specific changes is also noteworthy because it could be
related to the special characteristics of this mammal. For
example, OTUD6A, a cysteine protease with a putative role in
the innate immune system (Kayagaki et al., 2007), is specifically
lacking in the assembled genome and expressed sequences of
the bowhead whale. In addition, whereas the enamel metalloprotease MMP20 has been lost in bowhead and minke whales (Yim
et al., 2014), our analysis suggests that these genomic events
happened independently (see alignments in Supplemental
Folder 1). Finally, as aforementioned, the cysteine protease
UCHL3 seems to have been duplicated through a retrotranscription-mediated event in a common ancestor to bowhead and
minke whales, although only the genome of the bowhead whale
shows a complete, putatively functional open reading frame for
this extra copy of the gene. UCHL3 may play a role in adipogenesis (van Beekum et al., 2012), which indicates that this duplication might be related to the adaptation of the bowhead whale to
the challenging arctic environment. These results suggest
specific scenarios for the role of proteolysis in the evolution of
Mysticetes. Specifically, given the relationship between immunity and aging (Lo´pez-Otı´n et al., 2013), some of these findings
might open new approaches for the study of this outstanding
cetacean.
DISCUSSION
The genetic and molecular mechanisms by which longevity
evolves remain largely unexplained. Given the declining costs
of DNA sequencing, de novo genome sequencing is rapidly
becoming affordable. The sequencing of genomes of long-lived
species allows comparative genomics to be employed to study
the evolution of longevity and has already provided candidate
genes for further functional studies (de Magalha˜es and Keane,
2013). Nonetheless, deciphering the genetic basis of species differences in longevity has major intrinsic challenges (de Magalha˜es and Keane, 2013), and much work remains to uncover
the underlying mechanisms by which some species live much
longer than others. In this context, studying a species so long
lived and with such an extraordinary resistance to age-related
diseases as the bowhead whale will help elucidate mechanisms
and genes conferring longevity and disease resistance in mammals. Remarkably, large whales with over 1,000 times more cells
than humans do not exhibit an increased cancer risk (Caulin and
Maley, 2011), suggesting the existence of natural mechanisms
that can suppress cancer more effectively in these animals. Having the genome sequence of the bowhead whale will allow
researchers to study basic molecular processes and identify
maintenance mechanisms that help preserve life, avoid entropy,
and repair molecular damage. When compared to transcriptome
data (Seim et al., 2014), the genome’s greater completeness and
quality permits additional (e.g., gene loss and duplication) and
more thorough analyses. Besides, whereas the genomes of
many commercially important agricultural species have been reported, the bowhead genome sequence is the first for a species
key to a subsistence diet of indigenous communities. One of the
outputs of this project will be to facilitate and drive research in
this long-lived species. Data and results from this project are
thus made freely available to the scientific community on an
online portal (http://www.bowhead-whale.org/). We provide
Cell Reports 10, 112–122, January 6, 2015 ª2015 The Authors 117
this key resource for studying the bowhead whale and its various
traits, including its exceptional longevity and resistance to
diseases.
EXPERIMENTAL PROCEDURES
DNA and RNA Sampling in Greenland
Bowhead (Balaena mysticetus) DNA used for genome sequencing was isolated from muscle tissue sampled from a 51-year-old female (ID no. 325)
caught in the Disko Bay, West Greenland in 2009 (Heide-Jørgensen et al.,
2012). Tissue samples were stored at –20 C immediately after collection.
Age estimation was performed using the aspartic acid racemization technique
(Garde et al., 2007). CITES no. 12GL1003387 was used for transfer of biological material. Bowhead RNA used for RNA-seq and small RNA analysis
was isolated from two different individuals: kidney samples were from a
44-year-old female (ID no. 500) and muscle samples were isolated from a
44-year-old male (ID no. 322). For more details of the individual whales, see
Heide-Jørgensen et al. (2012).
Genome Sequencing
DNA was extracted following standard protocols, quantified using Qubit and
run on an agarose gel to ensure no degradation had occurred. We then generated 1503 coverage of the genome using the Illumina HiSeq 2000 platform
with 100 bp reads, sequencing paired-end libraries, and mate-paired libraries
with insert sizes of 3, 5, and 10 kb (Table 1). Sequencing was performed at
the Liverpool Centre for Genomic Research (CGR; http://www.liv.ac.uk/
genomic-research/).
Genome Assembly
Libraries were preprocessed in-house by the CGR to remove adaptor sequences. The raw fastq files were trimmed for the presence of the Illumina
adaptor sequence using Cutadapt and then subjected to window-based quality trimming using Sickle with a minimum window quality score of 20. A minimum read-length filter of 10 bp was also applied. Libraries were then assembled with ALLPATHS-LG (Gnerre et al., 2011), which performed all assembly
steps including read error correction, initial read alignment, and scaffolding.
ALLPATHS-LG build 43762 was used with the default input parameters,
including K = 96. Several build parameters were automatically determined by
the software at run time per its standard algorithm. Of 2.88 3 109 paired fragment reads and 1.87 3 109 paired jumping reads, 0.015% were removed as
poly(A) and 1.5% were removed due to low-frequency kmers; 54% of jumping
read pairs were error-corrected, and overall 33% of jumping pairs were redundant. In total, we used 216 Gbp for the 2.3 Gb assembly, meaning that coverage
retained for the assembly was 953. Full assembly and read usage data are
shown in Supplemental Folder 2. Assembly completeness was assayed with
CEGMA by searching for 248 core eukaryotic genes (Parra et al., 2007).
Genome Size Determination
To determine the genome size for bowhead whale, spleen tissues were
acquired from one male (10B17) and one female (10B18). Both whales were
harvested in 2010 as part of the native subsistence hunt in Barrow, Alaska.
Sample processing and staining followed the methods of Vindeløv and Christensen (1994). Instrument description and additional methodological details
are provided in Oziolor et al. (2014). Briefly, flow cytometric genome size determination is based on propidium iodide fluorescent staining of nuclear DNA.
Mean fluorescence is calculated for cells in the G0 and G1 phases of the cell
cycle. This method requires direct comparison to known standards to convert
measured fluorescence to pg of DNA. The primary standard used in this study
was the domestic chicken (Gallus gallus domesticus). Chicken red blood cells
are widely used as a genome size standard, with an accepted genome size of
C = 1.25 pg. Chicken whole blood was purchased from Innovative Research.
Mouse (Mus musculus) and rat (Rattus norvegicus) were included as internal
checks, with estimates for both falling within 3% of previously published
genome size estimates (Vinogradov, 1998). Spleen tissues from three male
129/SvEvTac laboratory mice and a single male Harlan SD Sprague-Dawley
laboratory rat were used.
118 Cell Reports 10, 112–122, January 6, 2015 ª2015 The Authors
Transcriptome Sequencing and Assembly: Greenland Samples
Total RNA was extracted from the kidney and muscle employing the
mirVanaTM RNA extraction kit (Ambion). RNA integrity of the individual RNA
samples was assessed on a 1% agarose gel using an Agilent 2100 Bioanalyzer
(Agilent Technologies). Library preparation was performed using the
ScriptSeqTM mRNA-seq library preparation kit from Epicenter according to
the manufacturer’s protocol (Epicenter) and sequenced (100 bp paired end)
as multiplexed samples using the Illumina HiSeq 2000 analyzer. Fastq generation and demultiplexing were performed using the CASAVA 1.8.2 package
(Illumina). The fastq files were filtered for adapters, quality, and length using
Trimmomatic (v.0.27), with a window size of 4, a base quality cutoff of 20,
and a minimum length of 60 (Lohse et al., 2012). De novo transcriptome assembly was performed using the short read assembler software Trinity (release
2013-02-25), which is based on the de Bruijn graph method for assembly, with
default settings (Grabherr et al., 2011).
Transcriptome Sequencing and Assembly: Alaskan Samples
Tissue biopsies were obtained from two male bowhead whales harvested by
Inupiat hunters at Barrow, Alaska during the Fall hunt of 2010; heart, cerebellum, liver, and testes were biopsied from male bowhead number 10B16,
and retina from male bowhead 10B20. Samples were immediately placed in
liquid nitrogen and transported in a dry shipper to Purdue University. RNA
was extracted using TRIZOL reagent (Invitrogen) following the manufacturer’s
protocol. RNA was purified using an Invitrogen PureLink Micro-to-Midi columns from the Total RNA Purification System using the standard protocol.
RNA quantity and quality was estimated with a spectrophotometer (Nanodrop)
and by gel electrophoresis using an Agilent model 2100 Bioanalyzer. cDNA
libraries were constructed by random priming of chemically sheared poly A
captured RNA. Randomly primed DNA products were blunt ended. Products
from 450–650 bp were then isolated using a PippenPrep. After the addition
of an adenine to the fragments, a Y primer amplification was used to produce
properly tailed products. Paired-end sequences of 100 bp per end were generated using the Illumina HiScan platform. Sequences with primer concatamers,
weak signal, and/or poly A/T tails were culled. The Trinity software package for
de novo assembly (Grabherr et al., 2011) was used for transcript reconstruction (Table S1).
Small RNA Sequencing and Annotation
To annotate microRNA genes in the bowhead genome, we conducted deep
sequencing of two small RNA libraries prepared from muscle and kidney tissues (Greenland samples). Total RNA was isolated using mirVana miRNA
Isolation Kit (Ambion). Small RNA in the 15-40 nucleotides range was gel purified and small RNA libraries were prepared for next-generation sequencing
using the ScriptMiner Small RNA-Seq Library Preparation Kit (Epicenter). The
two libraries were sequenced on an Illumina Hi-Seq 2000 instrument to
generate single end sequences of 50 nucleotides. Primary data analysis
was done using the Illumina CASAVA Pipeline software v.1.8.2, and the
sequence reads were further processed by trimming for adapters and
filtering for low quality using Trimmomatic (Lohse et al., 2012). Identification
of conserved and novel candidate microRNA genes in the bowhead genome
was accomplished by applying the miRDeep2 algorithm (Friedla¨nder et al.,
2008, 2012).
Evaluation of Repeat Elements
To evaluate the percentage of repeat elements, RepeatMasker (v.4.0.3; http://
www.repeatmasker.org/) was used to identify repeat elements, with parameters set as ‘‘-s -species mammal.’’ RMBlast was used as a sequence search
engine to list out all types of repeats. Percentage of repeat elements was
calculated as the total number of repeat region divided by the total length of
the genome, excluding the N-region. Genomes of minke whale (Balaenoptera
acutorostrata), orca (Orcinus orca), common bottlenose dolphin (Tursiops truncates), and cow (Bos taurus) were downloaded from NCBI and run in parallel
for comparison with the bowhead genome.
Genome Annotation
Putative genes were located in the assembly by structural annotation with
MAKER2 (Holt and Yandell, 2011), which combined both bowhead
transcriptomes with comparative and de novo prediction methods including
BLASTX, Exonerate, SNAP, Genemark, and Augustus. In addition to the
RNA-seq data, the entire SwissProt database and the draft proteome of dolphin were used as input to the comparative methods. Repetitive elements
were found with RepeatMasker (http://www.repeatmasker.org/). The complete set of MAKER input parameters, including training sets used for the
de novo prediction methods, are listed in Supplemental Folder 2. In total,
22,672 protein-coding genes were predicted with an average length of 417
(median 307) amino acid residues.
The RNA-seq data from seven adult bowhead tissues described above
were then mapped to the genome: FastQC (http://www.bioinformatics.
babraham.ac.uk/projects/fastqc/) was used for quality control to make sure
that data of all seven samples was of acceptable quality. STAR (Dobin
et al., 2013) was used to generate genome files from the bowhead assembly
and to map the reads to the bowhead genome with 70.3% of reads mapping,
which is in line with other results including those in the minke whale (Yim
et al., 2014). To count the reads overlapping genes, we used ReadCounter
(van Dam et al., 2015). The results obtained from all seven samples were
combined into a single file describing the number of nonambiguously mapping reads for each gene (full results in Supplemental Folder 1). Of the
22,672 predicted protein-coding genes, 89.5% had at least ten reads mapping and 97.5% of predicted genes had at least one read mapping to them,
which is again comparable to other genomes like the minke whale genome
(Yim et al., 2014).
To allow the identification of orthologous relationships with bowhead proteins, all cow protein sequences were downloaded from Ensembl (Flicek
et al., 2013). Cow was initially used because it is the closest relative to the bowhead with a high-quality annotated genome available. First, BLASTP (105)
was used to find the best hit in the cow proteome for every predicted bowhead
protein, and then the reciprocal best hit for each cow protein was defined as an
ortholog. In addition, human and mouse orthologs from the OPTIC pipeline
(see below) were used to assign predicted gene symbols to genes and proteins. A total of 15,831 bowhead genes have a putative gene symbol based
on these predictions. Homologs in minke whale and dolphin were also derived
and are available on our bowhead genome portal.
Genome Portal
To facilitate further studies of these animals, we constructed an online genome
portal: The Bowhead Whale Genome Resource (http://www.bowhead-whale.
org/). Its database structure, interface, and functionality were adapted from
our existing Naked Mole Rat Genome Resource (Keane et al., 2014). Our
data and results are available from the portal, and supplemental methods
and data files are also available on GitHub (https://github.com/maglab/
bowhead-whale-supplementary).
Pairwise dN/dS Analysis
The CodeML program from the PAML package was used to calculate
pairwise dN/dS ratios (Yang, 2007). This is done using the ratio of nonsynonymous substitutions per nonsynonymous site (dN) to synonymous substitutions per synonymous site (dS), dN/dS, or u (Yang, 2007). Specifically, these
pairwise dN/dS ratios were calculated for bowhead coding sequences and
orthologous sequences from minke, cow, and dolphin, excluding coding sequences that were less than 50% of the length of the orthologous sequence.
The results were then ranked by decreasing dN/dS and are available on our
bowhead genome portal. In addition, the ratio of the bowhead-minke dN/dS
value to the higher of the dN/dS values for minke-cow and minke-dolphin
was calculated to identify genes that evolved more rapidly on the bowhead
lineage.
Assessment of Selective Pressure Variation across Single-Gene
Orthologous Families Using Codon-Based Models of Evolution
To accurately assess variation in selective pressure on the bowhead, minke,
and orca lineages in comparison to extant terrestrial mammals, we created
a protein-coding database spanning the placental mammals. Along with the
orca (http://www.ncbi.nlm.nih.gov/bioproject/189949), minke (Yim et al.,
2014), and bowhead data described above, we extracted protein coding
sequences from Ensembl Biomart v.73 (Flicek et al., 2013) for the following
18 genomes: chimpanzee, cow, dog, elephant, gibbon (5.63 coverage),
gorilla, guinea pig, horse, human, macaque, marmoset, microbat, mouse,
opossum, orangutan, platypus, rabbit, and rat. These genomes were all high
coverage (mostly >63 coverage) with the exception of gibbon (Supplemental
Folder 2). Sequence similarity searches were performed using mpi-BLAST
(v 1.6.0) (Altschul et al., 1990) (http://www.mpiblast.org/) on all proteins using
a threshold of 107. Gene families were identified using in-house software that
clusters genes based on reciprocal BLAST hits (Altschul et al., 1990). We identified a total of 6,630 gene families from which we extracted the single-gene
orthologous families (SGOs). Families were considered SGOs if we identified
a single-gene representative in each species (one-to-one orthologs), and to
account for lower coverage genomes and missing data we also considered
cases where a specific gene was not present in a species, i.e., one-to-zero orthology. SGOs were only considered for subsequent analysis if they contained
more than seven species in total and if they contained no internal stop codons
(indicative of sequencing errors). In total, we retained 866 SGOs for further
analysis. Multiple sequence alignments (MSAs) were generated using default
parameters in PRANK (v.100802) (Lo¨ytynoja and Goldman, 2008). To minimize
potential false-positives due to poor sequence quality, the MSAs of the 866
SGOs underwent strict data-quality filtering. The first filter prohibited the
presence of gaps in the MSA if created by unique insertions (>12 bp) in either
bowhead or minke sequences. The second filter required unaligned bowhead
or minke sequences to be at least half the length of their respective MSA.
These two filters refined the number of testable SGOs to 319. The gene phylogeny of each SGO was inferred from the species phylogeny (Morgan et al.,
2013). CodeML from the PAML software package (v.4.4e) (Yang, 2007) was
employed for our selective pressure variation analyses. We analyzed each of
the 319 refined SGOs using the nested codon-based models of evolution under a maximum likelihood framework. We employed the likelihood ratio test
(LRT) using nested models of sequence evolution to evaluate a variety of
models of codon sequence evolution (Yang, 2007). In general, these codon
models allow for variable dN/dS ratios (referred to as u throughout) among
sites in the alignment, along different lineages on our phylogenetic tree, or a
combination of both variations across lineages and sites. To assess the significance of fit of each model to the data, we used the recommended LRTs
in CodeML (Yang, 2007) for comparing nested models (see Supplemental
Folder 2). The LRT test statistic approximates the chi-square (c2) distribution
critical value with degrees of freedom equal to the number of additional free
parameters in the alternative model. The goal of the codon-based modeling
is to determine the selective pressures at work in a lineage and site-specific
manner.
The models applied follow the standard nomenclature (i.e., model M1, M2,
A, and A null) (Yang, 2007). Model M1 assumes that there are two classes of
sites—those with an u value of zero and those with an u value of 1. Model
M2 allows for three classes of sites—one with an u value of zero, one with
an u value of one and one with an u value that is not fixed to any value. Given
the relationship between M1 and M2, they can be tested for the significance of
the difference of the fit of these two models using an LRT with df = 2. Finally, we
used model A that allows the u value to vary across sites and across different
lineages in combination. With model A, we can estimate the proportion of sites
and the dN/dS ratio in the foreground lineage of interest in comparison to the
background lineages and the estimated dN/dS ratio is free to vary above 1 (i.e.,
positive selection). Model A can be compared with its site-specific counterpart
(model M1) using the LRT with df = 2. In addition, the lineage and site-specific
model model A null was applied as a second LRT with model A. In model A null,
the additional site category is fixed at neutral rather than being estimated from
the data, and this LRT provides an additional test for model A (Zhang et al.,
2005). In this way, we performed independent tests on each of the extant cetacean lineages (orca, minke, and bowhead), as well as testing each ancestral
cetacean branch (the MRCA of the two baleen whales and the MRCA of all
three cetaceans), to determine if there were signatures of positive selection
that are unique to each lineage (Yang and dos Reis, 2011). Using empirical
Bayesian estimations, we identified the specific residues that are positively
selected in each lineage tested. Positive selection was inferred if all of the
following criteria were met: (1) if the LRT was significant, (2) if the parameters
estimated under that model were concurrent with positive selection, and (3) if
the alignment in that region was of high quality (as judged by alignment
Cell Reports 10, 112–122, January 6, 2015 ª2015 The Authors 119
completeness and quality in that region). The posterior probability (PP) of a
positively selected site is estimated using two calculations: Naive Empirical
Bayes (NEB) or Bayes Empirical Bayes (BEB) (Yang, 2007). If both NEB and
BEB are predicted, we reported the BEB results as they have been shown to
be more robust under certain conditions (Yang et al., 2005). For all models
used in the analysis where u is estimated from the data, a variety of starting
u values was used for the calculation of likelihood estimates. This ensures
that the global minimum is reached.
AUTHOR CONTRIBUTIONS
Identification of Proteins with Bowhead-Unique Residues
An in-house Perl pipeline was used to align each bowhead protein with orthologs from nine other mammals: human (Homo sapiens), dog (Canis familiaris),
mouse (Mus musculus), rat (Rattus norvegicus), minke whale (Balaenoptera
acutorostrata), cow (Bos taurus), dolphin (Tursiops truncatus), horse (Equus
caballus), and elephant (Loxodonta africana) and then identify the unique bowhead amino acid residues. Gaps were excluded from the analysis, and a
maximum of one unknown residue was allowed in species other than the bowhead. The results were ranked by the number of unique residues normalized by
the protein length (full results in Supplemental Folder 1).
ACKNOWLEDGMENTS
Gene Expansion Analysis, Filtering, and Expression
Human, mouse, dog, cow, dolphin, and platypus genomes and gene annotations were obtained from Ensembl (Flicek et al., 2013), the genome and gene
annotation of minke whale were obtained from Yim et al. (2014). In total,
21,069, 22,275, 19,292, 19,988, 15,769, 17,936, 20,496, and 22,733 human,
mouse, dog, cow, dolphin, platypus, minke whale, and bowhead whale genes,
respectively, were used to construct orthology mappings using OPTIC (Heger
and Ponting, 2007). Briefly, OPTIC builds phylogenetic trees for gene families
by first assigning orthology relationships based on pairwise orthologs
computed using PhyOP (Goodstadt and Ponting, 2006). Then, a tree-based
method, PhyOP, is used to cluster genes into orthologous groups, and, last,
gene members are aligned and phylogenetic trees built with TreeBeST (Vilella
et al., 2009). Further details are available in the OPTIC paper (Heger and Ponting, 2007). Predicted orthology groups can be accessed at http://genserv.
anat.ox.ac.uk/clades/vertebrates_bowhead.
To identify gene families that underwent expansion, gene trees were
reconciled with the consensus species tree, and duplicated nodes were
identified. The tree used, derived from TimeTree (Hedges et al., 2006), was:
(mm_oanatinus5, ((mm_cfamiliaris3, (mm_btaurus, (mm_ttruncatus, (mm_
balaenoptera, mm_bmysticetus)))), (mm_hsapiens10, mm_mmusculus5))).
The following algorithm was used to reconcile gene and species trees.
A stringent filter was applied to the data so that gene duplicates in bowhead whales were required to differ by at most 10% in protein sequence
from a cognate copy but were also required to differ by at least 1% to avoid
assembly artifacts and to remove recently duplicated copies with no function. Further manual inspection of the alignments was performed. Gene
expression inferred from our RNA-seq data was used to check the expression of duplicates.
An in-house peptide-sensitive approach was used to align the PCNA cDNA
into codons, and CodeML/PAML was used to test M0, a one-rate model that
assumes the same rate of evolution in all branches against M2^a, a branch site
test with one rate for the background and one rate for the bowhead whale
branch (Yang, 2007).
ACCESSION NUMBERS
Our data and results can be downloaded from the Bowhead Whale Genome
Resource (http://www.bowhead-whale.org/downloads/). In addition, data
are available at the NCBI BioProject PRJNA194091 with raw sequencing reads
in the Sequence Read Archive (SRP050351).
G.M.C., J.C.G., R.S., J.W.B., B.T., and J.P.M. conceived and designed the
study; L.B.M., E.M.O., and C.W.M. performed the experiments; M.K., J.S.,
A.E.W., Y.I.L., V.Q., L.B.M., S.v.D., D.B., P.I.M., P.M., L.K., J.B., H.-S.Y.,
G.W.S., J.C.P., C.L.-O., M.J.O., J.W.C., and J.P.M. analyzed the data; T.C.,
N.V.G., N.H.N., M.P.H.-J., R.S., and K.L. contributed reagents/materials/analysis tools; and M.K. and J.P.M. wrote the paper.
This project was supported by grants from the Life Extension Foundation and
the Methuselah Foundation to J.P.M. We thank the Inuit whaling captains of
the Alaska Eskimo Whaling Commission and the Barrow Whaling Captains’
Association for allowing us to sample their whales and their willingness to support the transcriptome study. This study was also partly funded by the Augustinus Foundation to K.L. T.C. was supported by a Wellcome Trust grant
(WT094386MA) to J.P.M. and M.K. was supported by a studentship from the
University of Liverpool’s Faculty of Health and Life Sciences. J.S. was supported by grants from the NIH (GM094575 to N.V.G.) and the Welch
Foundation (I-1505 to N.V.G.). Y.I.L. was supported by a Nuffield Department
of Medicine Prize studentship from the University of Oxford. C.L.-O. is an
Investigator of the Botin Foundation also supported by grants from Ministerio
de Economı´a y Competitividad-Spain and Instituto de Salud Carlos III (RTICC)Spain. M.J.O. and A.E.W. are funded by Science Foundation Ireland Research
Frontiers Programme Grant (EOB2763) to M.J.O. M.J.O. would also like to
acknowledge the Fulbright Commission for the Fulbright Scholar Award
2012-2013. M.J.O. and A.E.W. thank the SFI/HEA Irish Centre for High-End
Computing (ICHEC) for processor time and technical support. This work was
also supported by the Korea Institute of Ocean Science and Technology
(KIOST) in-house program (PE99212). Further thanks to Prof. Chris Ponting
and Dr. Andreas Heger for hosting gene orthology predictions from OPTIC,
the University of Liverpool High Performance Computing facilities for processor time, Eric de Sousa for help with RNA-seq data analysis, and to Louise
Crompton for assistance in compiling and formatting the bibliography. Last,
we are grateful to the staff at the Liverpool Centre for Genomic Research for
advice during this project.
Received: September 7, 2014
Revised: November 21, 2014
Accepted: December 3, 2014
Published: December 24, 2014
REFERENCES
Altschul, S.F., Gish, W., Miller, W., Myers, E.W., and Lipman, D.J. (1990). Basic
local alignment search tool. J. Mol. Biol. 215, 403–410.
Austad, S.N. (2010). Methusaleh’s Zoo: how nature provides us with clues for
extending human health span. J. Comp. Pathol. 142 (Suppl 1), S10–S21.
Burki, F., and Kaessmann, H. (2004). Birth and adaptive evolution of a
hominoid gene that supports high neurotransmitter flux. Nat. Genet. 36,
1061–1063.
Caulin, A.F., and Maley, C.C. (2011). Peto’s Paradox: evolution’s prescription
for cancer prevention. Trends Ecol. Evol. 26, 175–182.
Bovine Genome Sequencing and Analysis Consortium, Elsik, C.G., Tellam,
R.L., Worley, K.C., Gibbs, R.A., Muzny, D.M., Weinstock, G.M., Adelson,
D.L., Eichler, E.E., Elnitski, L., et al. (2009). The genome sequence of taurine
cattle: a window to ruminant biology and evolution. Science 324, 522–528.
Cornu, M., Albert, V., and Hall, M.N. (2013). mTOR in aging, metabolism, and
cancer. Curr. Opin. Genet. Dev. 23, 53–62.
SUPPLEMENTAL INFORMATION
de Magalha˜es, J.P. (2013). How ageing processes influence cancer. Nat. Rev.
Cancer 13, 357–365.
Supplemental Information includes Supplemental Results, four figures, three
tables, and two supplemental data files and can be found with this article
online at http://dx.doi.org/10.1016/j.celrep.2014.12.008.
de Magalha˜es, J.P., and Keane, M. (2013). Endless paces of degeneration—
applying comparative genomics to study evolution’s moulding of longevity.
EMBO Rep. 14, 661–662.
120 Cell Reports 10, 112–122, January 6, 2015 ª2015 The Authors
Dobin, A., Davis, C.A., Schlesinger, F., Drenkow, J., Zaleski, C., Jha, S., Batut,
P., Chaisson, M., and Gingeras, T.R. (2013). STAR: ultrafast universal RNA-seq
aligner. Bioinformatics 29, 15–21.
Holt, C., and Yandell, M. (2011). MAKER2: an annotation pipeline and genomedatabase management tool for second-generation genome projects. BMC
Bioinformatics 12, 491.
Dupressoir, A., Vernochet, C., Bawa, O., Harper, F., Pierron, G., Opolon, P.,
and Heidmann, T. (2009). Syncytin-A knockout mice demonstrate the critical
role in placentation of a fusogenic, endogenous retrovirus-derived, envelope
gene. Proc. Natl. Acad. Sci. USA 106, 12127–12132.
Huang, W., Sherman, B.T., and Lempicki, R.A. (2009). Systematic and integrative analysis of large gene lists using DAVID bioinformatics resources. Nat.
Protoc. 4, 44–57.
Finch, C. (1990). Longevity, Senescence, and the Genome (Chicago: University of Chicago Press).
Fischer, H., Koenig, U., Eckhart, L., and Tschachler, E. (2002). Human caspase
12 has acquired deleterious mutations. Biochem. Biophys. Res. Commun.
293, 722–726.
Flicek, P., Ahmed, I., Amode, M.R., Barrell, D., Beal, K., Brent, S., CarvalhoSilva, D., Clapham, P., Coates, G., Fairley, S., et al. (2013). Ensembl 2013.
Nucleic Acids Res. 41, D48–D55.
Kaessmann, H. (2010). Origins, evolution, and phenotypic impact of new
genes. Genome Res. 20, 1313–1326.
Kayagaki, N., Phung, Q., Chan, S., Chaudhari, R., Quan, C., O’Rourke, K.M.,
Eby, M., Pietras, E., Cheng, G., Bazan, J.F., et al. (2007). DUBA: a deubiquitinase that regulates type I interferon production. Science 318, 1628–1632.
Keane, M., Craig, T., Alfo¨ldi, J., Berlin, A.M., Johnson, J., Seluanov, A., Gorbunova, V., Di Palma, F., Lindblad-Toh, K., Church, G.M., and de Magalha˜es, J.P.
(2014). The Naked Mole Rat Genome Resource: facilitating analyses of cancer
and longevity-related adaptations. Bioinformatics 30, 3558–3560.
Friedla¨nder, M.R., Chen, W., Adamidi, C., Maaskola, J., Einspanier, R., Knespel, S., and Rajewsky, N. (2008). Discovering microRNAs from deep
sequencing data using miRDeep. Nat. Biotechnol. 26, 407–415.
Kim, E.B., Fang, X., Fushan, A.A., Huang, Z., Lobanov, A.V., Han, L., Marino,
S.M., Sun, X., Turanov, A.A., Yang, P., et al. (2011). Genome sequencing reveals insights into physiology and longevity of the naked mole rat. Nature
479, 223–227.
Friedla¨nder, M.R., Mackowiak, S.D., Li, N., Chen, W., and Rajewsky, N. (2012).
miRDeep2 accurately identifies known and hundreds of novel microRNA
genes in seven animal clades. Nucleic Acids Res. 40, 37–52.
Kurihara, L.J., Kikuchi, T., Wada, K., and Tilghman, S.M. (2001). Loss of UchL1 and Uch-L3 leads to neurodegeneration, posterior paralysis and dysphagia.
Hum. Mol. Genet. 10, 1963–1970.
Garde, E., Heide-Jorgensen, M.P., Hansen, S.H., Nachman, G., and Forchhammer, M.C. (2007). Age-specific growth and remarkable longevity in narwhals (Monodon monoceros) from West Greenland as estimated by aspartic
acid racemization. J. Mammal. 88, 49–58.
Lee, D.Y., Hayes, J.J., Pruss, D., and Wolffe, A.P. (1993). A positive role for histone acetylation in transcription factor access to nucleosomal DNA. Cell 72,
73–84.
Gatesy, J., Geisler, J.H., Chang, J., Buell, C., Berta, A., Meredith, R.W.,
Springer, M.S., and McGowen, M.R. (2013). A phylogenetic blueprint for a
modern whale. Mol. Phylogenet. Evol. 66, 479–506.
George, J.C., Bada, J., Zeh, J., Scott, L., Brown, S.E., O’Hara, T., and Suydam,
R. (1999). Age and growth estimates of bowhead whales (Balaena mysticetus)
via aspartic acid racemization. Can. J. Zool. 77, 571–580.
Gillet, L.C.J., and Scha¨rer, O.D. (2006). Molecular mechanisms of mammalian
global genome nucleotide excision repair. Chem. Rev. 106, 253–276.
Gnerre, S., Maccallum, I., Przybylski, D., Ribeiro, F.J., Burton, J.N., Walker,
B.J., Sharpe, T., Hall, G., Shea, T.P., Sykes, S., et al. (2011). High-quality draft
assemblies of mammalian genomes from massively parallel sequence data.
Proc. Natl. Acad. Sci. USA 108, 1513–1518.
Goodstadt, L., and Ponting, C.P. (2006). Phylogenetic reconstruction of orthology, paralogy, and conserved synteny for dog and human. PLoS Comput. Biol.
2, e133.
Gori, F., Friedman, L.G., and Demay, M.B. (2006). Wdr5, a WD-40 protein, regulates osteoblast differentiation during embryonic bone development. Dev.
Biol. 295, 498–506.
Grabherr, M.G., Haas, B.J., Yassour, M., Levin, J.Z., Thompson, D.A., Amit, I.,
Adiconis, X., Fan, L., Raychowdhury, R., Zeng, Q., et al. (2011). Full-length
transcriptome assembly from RNA-seq data without a reference genome.
Nat. Biotechnol. 29, 644–652.
Li, Y., and de Magalha˜es, J.P. (2013). Accelerated protein evolution analysis
reveals genes and pathways associated with the evolution of mammalian
longevity. Age (Dordr.) 35, 301–314.
Lohse, M., Bolger, A.M., Nagel, A., Fernie, A.R., Lunn, J.E., Stitt, M., and Usadel, B. (2012). RobiNA: a user-friendly, integrated software solution for RNAseq-based transcriptomics. Nucleic Acids Res. 40, W622–W627.
Lo´pez-Otı´n, C., Blasco, M.A., Partridge, L., Serrano, M., and Kroemer, G.
(2013). The hallmarks of aging. Cell 153, 1194–1217.
Lo¨ytynoja, A., and Goldman, N. (2008). A model of evolution and structure for
multiple sequence alignment. Philos. Trans. R. Soc. Lond. B Biol. Sci. 363,
3913–3919.
Morgan, C.C., Foster, P.G., Webb, A.E., Pisani, D., McInerney, J.O., and
O’Connell, M.J. (2013). Heterogeneous models place the root of the placental
mammal phylogeny. Mol. Biol. Evol. 30, 2145–2156.
Oziolor, E.M., Bigorgne, E., Aguilar, L., Usenko, S., and Matson, C.W. (2014).
Evolved resistance to PCB- and PAH-induced cardiac teratogenesis, and
reduced CYP1A activity in Gulf killifish (Fundulus grandis) populations from
the Houston Ship Channel, Texas. Aquat. Toxicol. 150, 210–219.
Parra, G., Bradnam, K., and Korf, I. (2007). CEGMA: a pipeline to accurately
annotate core genes in eukaryotic genomes. Bioinformatics 23, 1061–1067.
Philo, L.M., Shotts, E.B., and George, J.C. (1993). Morbidity and mortality. In
The Bowhead Whale, J.J. Burns, J.J. Montague, and C.J. Cowles, eds. (Lawrence, Kansas: Allen Press), pp. 275–312.
Hedges, S.B., Dudley, J., and Kumar, S. (2006). TimeTree: a public knowledgebase of divergence times among organisms. Bioinformatics 22, 2971–2972.
Quesada, V., Ordo´n˜ez, G.R., Sa´nchez, L.M., Puente, X.S., and Lo´pez-Otı´n, C.
(2009). The Degradome database: mammalian proteases and diseases of proteolysis. Nucleic Acids Res. 37, D239–D243.
Heger, A., and Ponting, C.P. (2007). Evolutionary rate analyses of orthologs
and paralogs from 12 Drosophila genomes. Genome Res. 17, 1837–1849.
Rogina, B., Helfand, S.L., and Frankel, S. (2002). Longevity regulation by
Drosophila Rpd3 deacetylase and caloric restriction. Science 298, 1745.
Heide-Jørgensen, M.P., Garde, E., Nielsen, N.H., Andersen, O.N., and Hansen, S.H. (2012). A note on biological data from the hunt of bowhead whales
in West Greenland 2009-2011. J. Cetacean Res. Manag. 12, 329–333.
Ross, P.L., Cheng, I., Liu, X., Cicek, M.S., Carroll, P.R., Casey, G., and Witte,
J.S. (2009). Carboxypeptidase 4 gene variants and early-onset intermediateto-high risk prostate cancer. BMC Cancer 9, 69.
Hoege, C., Pfander, B., Moldovan, G.L., Pyrowolakis, G., and Jentsch, S.
(2002). RAD6-dependent DNA repair is linked to modification of PCNA by ubiquitin and SUMO. Nature 419, 135–141.
Seim, I., Ma, S., Zhou, X., Gerashchenko, M.V., Lee, S.G., Suydam, R.,
George, J.C., Bickham, J.W., and Gladyshev, V.N. (2014). The transcriptome
of the bowhead whale Balaena mysticetus reveals adaptations of the
longest-lived mammal. Aging (Albany, N.Y. Online) 6, 879–899.
Holland, P.W., Garcia-Ferna`ndez, J., Williams, N.A., and Sidow, A. (1994).
Gene duplications and the origins of vertebrate development. Dev. Suppl.,
125–133.
Tacutu, R., Craig, T., Budovsky, A., Wuttke, D., Lehmann, G., Taranukha, D.,
Costa, J., Fraifeld, V.E., and de Magalha˜es, J.P. (2013). Human Ageing
Cell Reports 10, 112–122, January 6, 2015 ª2015 The Authors 121
Genomic Resources: integrated databases and tools for the biology and genetics of ageing. Nucleic Acids Res. 41, D1027–D1033.
Vinogradov, A.E. (1998). Genome size and GC-percent in vertebrates as determined by flow cytometry: the triangular relationship. Cytometry 31, 100–109.
Tanno, M., Ogihara, M., and Taguchi, T. (1996). Age-related changes in proliferating cell nuclear antigen levels. Mech. Ageing Dev. 92, 53–66.
Weeda, G., Donker, I., de Wit, J., Morreau, H., Janssens, R., Vissers, C.J.,
Nigg, A., van Steeg, H., Bootsma, D., and Hoeijmakers, J.H.J. (1997). Disruption of mouse ERCC1 results in a novel repair syndrome with growth failure,
nuclear abnormalities and senescence. Curr. Biol. 7, 427–439.
Tervo, O.M., Christoffersen, M.F., Parks, S.E., Kristensen, R.M., and Madsen,
P.T. (2011). Evidence for simultaneous sound production in the bowhead
whale (Balaena mysticetus). J. Acoust. Soc. Am. 130, 2257–2262.
Tian, X., Azpurua, J., Hine, C., Vaidya, A., Myakishev-Rempel, M., Ablaeva, J.,
Mao, Z., Nevo, E., Gorbunova, V., and Seluanov, A. (2013). High-molecularmass hyaluronan mediates the cancer resistance of the naked mole rat. Nature
499, 346–349.
van Beekum, O., Gao, Y., Berger, R., Koppen, A., and Kalkhoven, E. (2012). A
novel RNAi lethality rescue screen to identify regulators of adipogenesis. PLoS
ONE 7, e37680.
West, G.B., Woodruff, W.H., and Brown, J.H. (2002). Allometric scaling of
metabolic rate from molecules and mitochondria to cells and mammals.
Proc. Natl. Acad. Sci. USA 99 (Suppl 1), 2473–2478.
Yang, Z. (2007). PAML 4: phylogenetic analysis by maximum likelihood. Mol.
Biol. Evol. 24, 1586–1591.
Yang, Z., and dos Reis, M. (2011). Statistical properties of the branch-site test
of positive selection. Mol. Biol. Evol. 28, 1217–1228.
van Dam, S., Craig, T., and de Magalha˜es, J.P. (2015). GeneFriends: a human
RNA-seq-based gene and transcript co-expression database. Nucleic Acids
Res. http://dx.doi.org/10.1093/nar/gku1042
Yang, Z., Wong, W.S.W., and Nielsen, R. (2005). Bayes empirical bayes inference of amino acid sites under positive selection. Mol. Biol. Evol. 22, 1107–
1118.
Vervoort, V.S., Viljoen, D., Smart, R., Suthers, G., DuPont, B.R., Abbott, A., and
Schwartz, C.E. (2002). Sorting nexin 3 (SNX3) is disrupted in a patient with a
translocation t(6;13)(q21;q12) and microcephaly, microphthalmia, ectrodactyly, prognathism (MMEP) phenotype. J. Med. Genet. 39, 893–899.
Yim, H.S., Cho, Y.S., Guang, X., Kang, S.G., Jeong, J.Y., Cha, S.S., Oh, H.M.,
Lee, J.H., Yang, E.C., Kwon, K.K., et al. (2014). Minke whale genome and
aquatic adaptation in cetaceans. Nat. Genet. 46, 88–92.
Vilella, A.J., Severin, J., Ureta-Vidal, A., Heng, L., Durbin, R., and Birney, E.
(2009). EnsemblCompara GeneTrees: Complete, duplication-aware phylogenetic trees in vertebrates. Genome Res. 19, 327–335.
Zhang, J., Zhang, Y.P., and Rosenberg, H.F. (2002). Adaptive evolution of a
duplicated pancreatic ribonuclease gene in a leaf-eating monkey. Nat. Genet.
30, 411–415.
Vindeløv, L.L., and Christensen, I.J. (1994). Detergent and proteolytic enzymebased techniques for nuclear isolation and DNA content analysis. Methods
Cell Biol. 41, 219–229.
Zhang, J., Nielsen, R., and Yang, Z. (2005). Evaluation of an improved branchsite likelihood method for detecting positive selection at the molecular level.
Mol. Biol. Evol. 22, 2472–2479.
122 Cell Reports 10, 112–122, January 6, 2015 ª2015 The Authors


© Copyright 2026