
Towards an AIDS-free generaTion
Towards an
AIDS-free
generation
Children and AIDS
Sixth Stocktaking Report, 2013
UNITE FOR CHILDREN
UNITE AGAINST AIDS
Stocktaking reports on children and AIDS are the flagship publications of the Unite for Children, Unite against AIDS
campaign. The United Nations Children’s Fund (UNICEF) leads the development of these publications as part of its commitment to the Joint United Nations Programme on HIV/AIDS (UNAIDS), in collaboration with the 10 other UNAIDS co-sponsors.
UNAIDS brings together the resources of the UNAIDS Secretariat and 11 United Nations system organizations for
coordinated and accountable efforts to unite the world against AIDS. The division of labour is as follows:
Convening agencies and partners
Division of labour
WHO, UNICEF, ILO, UNDP, UNESCO, UNFPA, UNHCR,
WFP, World Bank.
Prevent mothers from dying and babies
from becoming infected with HIV.
WHO, ILO, UNDP, UNHCR, UNICEF, WFP.
Ensure that people living with HIV receive treatment.
WHO, ILO, UNICEF, WFP.
Prevent people living with HIV from dying of tuberculosis.
UNODC, UNDP, UNESCO, UNFPA, UNICEF,
Protect drug users from becoming infected with HIV and ensure
access to comprehensive HIV services in prisons and closed settings.
WHO, World Bank.
UNDP, UNFPA, UNESCO,
WHO, World Bank.
Empower men who have sex with men, sex workers and transgender
people to protect themselves and to fully access antiretroviral therapy.
UNDP, ILO, UNESCO, UNFPA, UNHCR, UNICEF,
UNODC, UN Women, WHO.
Remove punitive laws, policies, practices, stigma and
discrimination that block effective responses to AIDS.
UNDP, UNFPA, UN Women, ILO, UNESCO, UNHCR,
UNICEF, UNODC, WFP, WHO.
Meet the HIV needs of women and girls,
and stop sexual and gender-based violence.
UNICEF, UNFPA, ILO, UNESCO, UNHCR, WFP, WHO.
Empower young people to protect themselves from HIV.
UNICEF, World Bank, ILO, UNDP, UNHCR, WFP.
Enhance social protection for people affected by HIV.
UNHCR, WFP, UNDP, UNFPA, UNICEF, UNODC, WHO.
Address HIV in humanitarian emergencies.
WFP, UNHCR, UNICEF, WHO.
Integrate food and nutrition within the HIV response.
UNESCO, ILO, UNFPA, UNICEF, WHO.
Ensure high-quality education for a more effective HIV response.
World Bank, ILO, UNDP, UNESCO, UNFPA, UNHCR,
Support strategic, prioritized and costed multi-sectoral AIDS plans.
UNICEF, UNODC, WHO, WFP.
The findings, interpretations, quotations, conclusions and opinions expressed within this report and/or on the <www.childrenandaids.org>
website cannot necessarily be attributed to any individual organization involved in the production of this report.
Because HIV-related stigma persists, UNICEF takes steps to safeguard the identities of children and their mothers in accordance with
their wishes and with global standards of child rights and protection. UNICEF obtains written consent from people living with the virus
before identifying them as such in photographs and other media. Unless otherwise stated, people depicted in this publication, and in the
accompanying materials online, should not be assumed to be living with HIV.
© United Nations Children’s Fund (UNICEF), 2013
Permission to reproduce any part of this publication will be freely granted to educational and non-profit organizations.
Suggested citation: United Nations Children’s Fund, Towards an AIDS-Free Generation – Children and AIDS: Sixth Stocktaking Report,
2013, UNICEF, New York, 2013.
upporting materials and data are available at: <www.childrenandaids.org>.
S
For any corrigenda subsequent to printing, please visit the UNICEF website at <www.unicef.org/publications>.
Cover photo: In northern Rwanda, children run home after school. Students took part in a discussion group that was organized to raise
awareness of important social issues such as health, hygiene, sanitation and HIV. © UNICEF/RWAA2011-00631/Noorani
Towards an AIDS-Free Generation
Children and AIDS: Sixth Stocktaking Report, 2013
contents
ii
About this report
1
Executive summary:
Towards an AIDS-free generation
4
Chapter 1
Responding to HIV in
the first decade of life
24 Chapter 2
Responding to HIV in the
second decade of life
6
15
The first decade: Progress and challenges
New paradigms, opportunities and innovations
17 Strategies to accelerate progress in the first decade of life
26
The second decade: Transition and vulnerability
29
Inequities and barriers to services
32 Strategies to accelerate progress in the second decade of life
39 Sustaining the gains achieved in the first decade of life
40 Chapter 3
Partnerships for an
AIDS-free generation
42 Two decades, many sectors
44 A ddressing HIV among children in emergency situations:
A case for enhanced partnership
45 Towards an AIDS-free generation:
Addressing gaps, sustaining gains
46 References
53 Annex:
Statistical tables
53
Notes on the data
54 S tatistical table 1: Elimination of new HIV infections among
children by 2015 and keeping their mothers alive
58 Statistical table 2: Providing paediatric HIV care and treatment
66 Statistical table 3: Demography and epidemiology of HIV
among adolescents
70 S tatistical table 4: Knowledge, HIV testing and sexual behaviour
among adolescents
74 S tatistical table 5: Epidemiology, knowledge, HIV testing and
sexual behaviour among key affected populations aged below
25 years
78 Statistical table 6: Protection, care and support for children
affected by HIV and AIDS
82 Photo captions and credits
83 Acronyms
about this report
This Sixth Stocktaking Report focuses on the response
to HIV and AIDS among children in low- and
middle-income countries.1 It is structured around the
first and second decades of a child’s life, and has the
following objectives:
•
to review the HIV burden among children and
adolescents and the progress being made in
addressing it
•
to identify key strategies to accelerate access to
HIV prevention, treatment, protection, care and
support for children and adolescents
•
to summarize opportunities arising from recent
scientific advances, new technology and
emerging practice innovations
•
to mobilize national and international efforts
to keep children HIV-free and ensure that those
living with HIV remain AIDS-free.
While national governments are ultimately
accountable for their international and domestic
commitments, this report is intended to inform the
coordinated efforts of all stakeholders striving
to achieve the goal of an AIDS-free generation,
including donors, technical experts, United Nations
organizations, implementing partners, civil society
and communities in diverse settings worldwide. The
involvement of adults and adolescents living with HIV
is essential for the success of the strategies described
in this report. Responding to HIV is a shared responsibility, and achieving an AIDS-free generation will be
a shared triumph.
Throughout this report, the term ’children‘ applies
to all children below the age of 18 years, including
adolescents, as defined in the Convention on the
Rights of the Child. The United Nations defines
adolescents as persons aged 10–19 years, and
young people as persons aged 15–24 years.
Major global commitments and
strategies relating to children and AIDS
Getting to Zero:
2011–2015 Strategy
Scaling Up Nutrition (SUN):
A Framework for Action
Millennium Development
Goals (MDGs)
United Nations
Millennium Declaration
2000
ii
Declaration
of Commitment
on HIV/AIDS
2001
Political Declaration
on HIV and AIDS
2006
United Nations Secretary-General’s Global
Strategy for Women’s and Children’s
Health and the Every
Woman Every Child movement
Global Commission on HIV and the Law
2010
Executive summary
TOWARDS AN
AIDS-FREE GENERATION
An AIDS-free generation begins
in the first decade of life
The major components of the HIV response for young
children – elimination of mother-to-child transmission (EMTCT) of HIV, treatment of children living
with HIV and mitigation of the social and economic
”
An AIDS-free generation means a generation in
which all children are born free of HIV and remain
so for the first two decades of life, from birth through
adolescence. It also means that children living
with and affected by HIV have access to the treatment, care and support they need to remain alive
and well. For the first time in the history of the HIV
epidemic, the global community has accumulated
the knowledge, experience and tools to achieve an
AIDS-free generation.
Children should be the first
to benefit from our successes
in defeating HIV, and the last
to suffer from our failures.”
Anthony Lake, Executive Director, UNICEF
impact of HIV and AIDS on children – are well
established. The challenge today is to apply existing
knowledge and pursue new opportunities and innovations – while using finite resources as efficiently and
effectively as possible – to ensure that children survive
and thrive in their first decade of life.
Political Declaration on HIV and
AIDS: Intensifying Our Efforts to
Eliminate HIV and AIDS
Global Plan Towards the
Elimination of New HIV
Infections Among Children
by 2015 and Keeping
Their Mothers Alive
Investment Approach for an
Effective Response to HIV/AIDS
2011
Committing to Child Survival:
A Promise Renewed
Global Plan target year
Family Planning 2020
MDG deadline
2012
2015
1
Towards an AIDS-Free Generation – Children and AIDS: Sixth Stocktaking Report, 2013
© UNICEF Malawi/2013/Marinovich
© UNICEF/NYHQ2012-1507/Jayasuriya
More progress has been made between 2009 and
2012 than during the previous decade, according
to 2012 data, which show a 35 per cent decline in
new HIV infections among children under the age of
15 years, compared with 2009.2 In 2012, coverage
of antiretroviral drugs (ARVs) for pregnant women
living with HIV reached 62 per cent in the 22 priority
countries in the Global Plan Towards the Elimination
of New HIV Infections Among Children by 2015 and
Keeping Their Mothers Alive (the ‘Global Plan’).3
Yet, approximately 230,000 (180,000–300,000)
children – or 630 (540–760) per day – were newly
infected with HIV in these countries during 2012.4
While the world is currently reducing new HIV infections among children faster than at any other time
in history, the pace will have to be accelerated even
more to achieve the Global Plan 2015 target.
Ensuring the health of pregnant
and breastfeeding women living
with HIV is central to achieving an
AIDS-free generation
In the past three years, countries have begun moving
towards early initiation of triple-drug regimens and
simplified programming for eliminating mother-to-child
transmission of HIV. This approach emphasizes the
long-term health of pregnant and breastfeeding
women living with HIV as well as the prevention of
HIV infection among their children. The World Health
Organization’s 2013 Consolidated Guidelines on
2
© UNICEF/ZIMA2011-00003/Pirozzi
the Use of Antiretroviral Drugs for Treating and
Preventing HIV Infection recommend initiating
antiretroviral therapy (ART), either lifelong or during
the mother-to-child transmission risk period, for all
pregnant and breastfeeding women living with HIV.
All children under 5 years of age diagnosed with HIV
should also be provided with lifelong ART, regardless
of their CD4 count.5 The move to providing ART for
all pregnant and breastfeeding women represents an
important paradigm shift that places women’s health
and well-being at the centre of preventing HIV in children. Keeping mothers alive and healthy is one of the
most important factors for early child survival.
Preventing HIV infection among women and girls of
childbearing age and helping women and girls who
are living with HIV to avoid unwanted pregnancies
remain priorities towards preventing HIV infections
among children.
More children are accessing ART,
but progress for children lags
behind progress for adults
Overall, ART coverage for children under 15 years
old living with HIV in low- and middle-income
countries has consistently been around half that for
adults – 34 per cent of children in 2012 compared
with 64 per cent of adults in 2012.6 Children under
15 years old who need ART to survive are significantly less likely than adults to receive it. In the
absence of HIV testing and timely ART initiation, one
third of infants living with HIV die before their first
birthday, and more than half die before the age of
2 years.7 A huge effort will therefore be needed to
reach the global goal of providing ART to all eligible
children by 2015.
Much more attention is needed to prevent
and treat HIV during adolescence, so that
children remain AIDS-free in the second
decade of life
As the international community reflects on the gains
made in the first decade of a child’s life, it cannot
continue to neglect the crucial second decade of
childhood. Approximately 2.1 million (1.7 million–
2.8 million) adolescents were living with HIV globally
at the end of 2012,8 and approximately two thirds of
new HIV infections in adolescents aged 15–19 years
were among girls.9 Adolescents experience a second
wave of vulnerability to HIV that is driven by many
factors, and they encounter numerous barriers to
accessing services. As children living with HIV grow
older, their treatment, care and support needs also
change, and they face new challenges in adhering
to medications, taking greater responsibility for their
own health and accessing the services and information they need to lead healthy and productive lives.
Worldwide, disproportionately high HIV prevalence
is reported among key adolescent populations –
males who have sex with males, adolescents who
inject drugs and sexually exploited adolescents.10
A comprehensive strategy is needed to address
these diverse needs.
Social protection and child protection, care
and support must underpin efforts to scale
up high-impact interventions through the
first two decades of life
Creating an AIDS-free generation is more than a
biomedical endeavour. Economic and social drivers
of HIV – such as poverty, food insecurity, drug
and alcohol use, social marginalization, gender
inequality, violence and sexual exploitation, and
lack of access to education, including comprehensive sexuality education – need to be addressed
concurrently as part of a multi-sectoral approach
to HIV among children.
Efforts to address the needs of children living with HIV,
or in households affected by HIV, through comprehensive protection, care and support interventions
have not achieved broad coverage.11 Much greater
collaboration across sectors is required. Economic
and psychosocial support is particularly important for
the estimated 17.8 million (16.1 million–21.6 million)
children who have lost one or both parents to AIDS.12
These measures not only alleviate hardship but can
help reduce the risk of HIV infection and support longterm adherence to medication and continuity of care
for children and their families.13
Two decades, many sectors
This report highlights both gains and gaps in the
response to HIV among children in the first and
second decades of life and stresses the urgency of
achieving results more quickly with the resources available. While it emphasizes high-prevalence settings,
there is no less concern for lower-prevalence settings
and the clear challenge to maintain and expand upon
progress made. To this end, innovations and new
paradigms are presented along with key strategies
designed to accelerate the pace of progress.
An AIDS-free generation will only be achieved
through strong leadership from government, with
partners aligning their support to common objectives. The wholehearted participation of civil society
and affected communities will also be required, not
only as implementing partners but also in planning,
decision-making, awareness raising, advocacy and
strengthening accountability.
The path to an AIDS-free generation is clear. The
world must now strongly commit to sustaining the
hard-won gains and to addressing the remaining
inequities and gaps in the response to HIV
among children.
3
chapter 1
Responding
to HIV in the
first decade
of lifE
Eliminating new HIV infections
”
Towards an AIDS-Free Generation – Children and AIDS: Sixth Stocktaking Report, 2013
among children is an ambitious
but achievable goal. With the
support of the Every Woman
Every Child movement, an AIDSfree generation can be ours. There
is no better investment than the
health of women and children.”
© UNICEF Malawi/2013/Marinovich
Ban Ki-moon,
Secretary-General of the United Nations
4
5
The first decade:
progress and challenges
Plan.16 This means reaching an estimated 1.5 million
(1.4 million–1.7 million) pregnant women living
with HIV annually, based on 2012 estimates (see
Figure 1.1).17 Without any interventions, between
15 per cent and 45 per cent of infants born to these
women will acquire HIV: 5–10 per cent during pregnancy, 10–20 per cent during labour and delivery,
and 5–20 per cent through breastfeeding.18
Towards an AIDS-Free Generation – Children and AIDS: Sixth Stocktaking Report, 2013
Since the first effective ARV regimen for the
prevention of mother-to-child transmission (PMTCT)
of HIV was reported in 1994, the outlook for children born to mothers living with HIV has improved
dramatically. In high-income countries, mother-to-child
transmission of HIV has been virtually eliminated.14
Today, steadily expanding coverage of the most
effective ARVs, together with new approaches to
providing them, offer hope that mother-to-child HIV
transmission can also be virtually eliminated in
low- and middle-income countries.
Significant progress is being made in
expanding access to ARVs for PMTCT
Encouraging progress has been made in scaling up
and improving the quality of programmes. In 2012,
approximately 900,000 pregnant women living with
HIV in low- and middle-income countries received
ARVs to prevent mother-to-child transmission – either
ART primarily for their own health or the most efficacious antiretroviral prophylaxis.19 This represents
one third more than the number who received it in
2009. While the world is currently reducing new HIV
infections among children faster than at any other
time in history, the pace will have to be accelerated
even more to achieve the 2015 target of 90 per cent
reduction (see Figure 1.2 ).
The Global Plan Towards the Elimination of New HIV
Infections Among Children by 2015 and Keeping
Their Mothers Alive (‘the Global Plan’) identifies
22 priority countries where almost 90 per cent of
all new HIV infections among children occur. Of
these countries, 21 are in sub-Saharan Africa; the
other country is India.15 Reducing mother-to-child
transmission to less than 5 per cent of breastfeeding
infants and to less than 2 per cent of non-breastfeeding infants is an important target of the Global
figure 1.1
Estimated number of pregnant women living with HIV in low- and middle-income countries, 1990–2012
1.5 million pregnant women
living with HIV (2012)
2,000,000
1,500,000
1,000,000
500,000
0
1990
1995
2000
Note: The area in blue indicates the uncertainty ranges around the estimates.
Source: UNAIDS 2012 HIV and AIDS estimates.
6
2005
2010
2012
box
The Global Plan Towards the Elimination of New HIV Infections
Among Children by 2015 and Keeping their Mothers Alive
Since its launch in 2011, the Global Plan has helped to catalyse efforts to tackle HIV in children and
their mothers across Millennium Development Goals 4 (reduce child mortality), 5 (improve maternal
health) and 6 (combat HIV, tuberculosis and malaria). While covering all low- to middle-income countries, it focuses on the 22 priority countries that account for almost 90 per cent of the world’s pregnant
women living with HIV as well as almost 90 per cent of new infections among children. The Global
Plan focuses on achieving two global targets:
• Target 1: Reduce the number of new HIV infections among children by 90 per cent
• Target 2: Reduce the number of AIDS-related maternal deaths by 50 per cent.
In 2011, the cost of achieving the Global Plan targets for 17 of the 22 priority countries was estimated
at around US$1 billion per year over five years, 43 per cent of which is for providing PMTCT services
to pregnant women living with HIV and treatment for their own health, 37 per cent for the prevention
of primary HIV infection, 12 per cent for paediatric ART and 8 per cent for family planning.20 Several
countries – including Botswana, Namibia and South Africa – are making substantial domestic investments towards achieving the goals of the Global Plan. Major international donors to this effort include
the Global Fund to Fight AIDS, Tuberculosis and Malaria and the United States President’s Emergency
Plan for AIDS Relief (PEPFAR).
figure 1.2
Estimated number of new HIV infections in children (aged 0–14): Global trend and projections, 2001–2015
600,000
Estimated trend
Projected trend
500,000
400,000
26% decline over 8 years
(average 18,000 per
year), 2001–2009
300,000
Global Plan
target:
90% reduction
by 2015
35% decline over 3 years
(average 47,000 per year),
2009–2012
200,000
100,000
85% decline needed over 3 years
(average 74,000 per year),
2012–2015
0
2001
2002
2003
2004
2005
2006
2007
2008
2009
2010
2011
2012
2013
2014
2015
Source: UNICEF analysis of UNAIDS 2012 HIV and AIDS estimates.
7
While the overall coverage of ARVs for PMTCT
for low- and middle-income countries reached
62 per cent in 2012, there was considerable variation across regions (see Figure 1.3). In Eastern and
Southern Africa, where the HIV burden is greatest,
three quarters of pregnant women have access
(66–85 per cent). In Central and Eastern Europe
and the Commonwealth of Independent States
(CEE/CIS), coverage is reported as very high (greater
than 95 per cent), as it is in Latin America and the
Caribbean (88 per cent; 58–95 per cent). All other
regions have estimated coverage below half.21
One of the core targets of the Global Plan is to
provide ARVs to 90 per cent of the world’s pregnant
women living with HIV by the end of 2015. This
is now within reach. In the 22 Global Plan priority
countries, 62 per cent of pregnant women living with
HIV received ARV prophylaxis in 2012, compared
with 57 per cent in 2011 and 49 per cent in 2010.22
Since 2009, most countries have shifted their policies
away from the use of single-dose nevirapine to more
effective regimens for PMTCT.
Four priority countries of the Global Plan – Botswana,
Ghana, Namibia and Zambia – have already met the
90 per cent target, while Mozambique, South Africa,
Swaziland and Zimbabwe are close to it. However,
five countries – Kenya, Lesotho, Nigeria, South Africa
and Swaziland – have experienced declines in
PMTCT coverage in the last year, and four countries –
Angola, Chad, the Democratic Republic of the Congo
and Nigeria – had national ARV coverage for PMTCT
of less than 20 per cent in 2012.23
The 2013 World Health Organization (WHO)
guidelines on ART recommend universal HIV testing
for all pregnant women as part of the basic package
of services for antenatal care in all settings. In
some countries with concentrated or low-prevalence
Towards an AIDS-Free Generation – Children and AIDS: Sixth Stocktaking Report, 2013
figure 1.3
Estimated percentage of pregnant women living with HIV receiving the most effective antiretroviral medicines for PMTCT,
in UNICEF regions, all low- and middle-income countries and the 22 Global Plan priority countries, 2005–2012
2005*
2010
2011
2012
100%
90%
80%
70%
60%
50%
40%
30%
20%
10%
0%
Eastern and
Southern
Africa
West and
Central Africa
Middle East
and
North Africa
East Asia and
the Pacific
South Asia
Latin America
and the
Caribbean
CEE/CIS
All low- and
middle-income
countries
22 Global
Plan priority
countries
Note: The vertical lines indicate the uncertainty ranges around the estimates. Coverage values for 2005–2009 are not comparable with those for
2010–2012 because they are based on previous WHO treatment guidelines and include single-dose nevirapine.
Source: UNAIDS, UNICEF and WHO, 2013 Global AIDS Response Progress Reporting, and UNAIDS 2012 HIV and AIDS estimates.
8
© UNICEF/NYHQ2011-0238/Asselin
epidemics, the offer of routine HIV testing for all
pregnant women may be considered prohibitive when
assessed against the number of cases detected.24
In Viet Nam and other countries with concentrated
epidemics, HIV testing is being incorporated into a
standard list of tests during pregnancy.25 Adequate
referral and linkage to follow-up services is critical.
In India, where overall numbers are large but the
population of women living with HIV is spread out
across the country, the initiation and maintenance
of ARVs in women and children living with HIV in
maternal and child health settings is recommended as
part of antenatal care.26 Cambodia has also demonstrated that this approach can not only increase
access to treatment at the level of primary care but
also lead to reductions in loss to follow-up of women
and children diagnosed with HIV.
Access to ART for pregnant women for
their own health is increasing, but is still
lower than for other adults
The percentage of pregnant women living with HIV
(with CD4 levels less than 350 cells per cubic millimetre) who received ART for their own health in
2012 in low- and middle-income countries was only
58 per cent, compared with 64 per cent for all adults
(with CD4 levels less than 350 cells/mm3) estimated
to have received ART that year.27
By 2012, several priority countries of the Global
Plan – including Botswana, Ghana, Malawi,
Namibia, South Africa, Swaziland and Zambia –
reported that more than 75 per cent of pregnant
women eligible for ART under WHO’s 2010 criteria
received it, while more than 50 per cent were
receiving it in Kenya, Lesotho, the United Republic of
Tanzania and Zimbabwe.28 As more countries adopt
the use of ART for all pregnant and breastfeeding
women living with HIV, in line with WHO’s 2013
guidelines on ARVs,29 this upward trend for ART
coverage is expected to continue.
Increasing impact: New infections among
children are falling
As a result of recent progress in EMTCT, fewer
infants are acquiring HIV. In low- and middle-income
countries, about 260,000 new infections among
children occurred in 2012,30 but between 2005 and
2012, more than 850,000 HIV infections in children
were prevented in low- and middle-income countries.31
The vast majority of new HIV infections among children
aged 0–14 years were in Eastern and Southern Africa
(130,000) and West and Central Africa (98,000),
followed a long way behind by South Asia (15,000)
and East Asia and the Pacific (7,900), and then
by all other regions, which reported fewer than
3,000 new infections each in 2012.32
9
figure 1.4
Country progress in reducing new HIV infections among children aged 0–14 in the 21 Global Plan priority countries
in Africa, 2009–2012
Rapid decline (50 per cent or more)
Moderate decline (30–49 per cent)
Slow decline (less than 30 per cent)
Ghana (76%)
United Republic of Tanzania (49%)
Cameroon (29%)
Namibia (58%)
South Africa (46%)
Côte d’Ivoire (27%)
Zimbabwe (55%)
Mozambique (45%)
Lesotho (17%)
Malawi (52%)
Uganda (45%)
Democratic Republic of the Congo (15%)
Botswana (52%)
Kenya (44%)
Nigeria (10%)
Zambia (50%)
Swaziland (38%)
Chad (9%)
Ethiopia (50%)
Burundi (31%)
Angola (9% increase)
Source: UNICEF update to a table published in the Joint United Nations Programme on HIV/AIDS, Global Report: UNAIDS report on the global AIDS
epidemic 2013, UNAIDS, Geneva, 2013, p. 9.
However, much remains to be done. The CEE/CIS
region reports the most favourable transmission rate
(6 per cent), followed by Latin America and the
Caribbean (10 per cent) and Eastern and Southern
Africa (13 per cent). All other regions report
worrying transmission rates higher than 20 per cent
(East Asia and the Pacific, 22 per cent; West and
Central Africa, 28 per cent; Middle East and
North Africa, 34 per cent; South Asia, 38 per cent).34
The rate of HIV transmission from mother to child
has been steadily improving in most regions.
BOX
Towards an AIDS-Free Generation – Children and AIDS: Sixth Stocktaking Report, 2013
In the 22 priority countries of the Global Plan, overall
mother-to-child transmission rates have declined, from
an estimated 26 per cent in 2009 to 17 per cent in
2012. The number of children under 15 who were
newly infected in these countries fell by 36 per cent,
from 360,000 in 2009 to 230,000 in 2012. In this
period, seven countries halved new HIV infections
among children (see Figure 1.4).33
Validation of countries achieving elimination of mother-to-child transmission
Countries beyond the scope of the Global Plan are also making progress towards EMTCT. For
example, Cuba and Panama,35 Thailand36 and several countries in Eastern Europe, including Armenia,
Belarus, Georgia, Kazakhstan and the Republic of Moldova,37 report that they are approaching transmission rates of 2 per cent. Regional initiatives are building momentum – for example, the European
Action Plan for HIV/AIDS 2012–2015 was established in 2011,38 and elimination initiatives on
paediatric HIV infections and congenital syphilis exist in East Asia and the Pacific and in Latin America
and the Caribbean.39 In recognition of this trend, WHO has established criteria and processes for validating country reports of the elimination of new HIV infections among children. Countries will apply to
WHO, and the process of validation will be supported by regional and country-level bodies set up for
this purpose. These criteria and processes were established for validating the elimination of both HIV
and congenital syphilis.40
10
More children are accessing ART,
but progress for children lags
behind progress for adults
In the absence of HIV testing and timely ART
initiation, one third of infants living with HIV die
before their first birthday, and half die before the age
of 2 years.41 Globally, the pace of scale-up of ART for
children under 15 years is only half that of adults. For
children, an increase in ART access of 14 per cent
was registered from 2011 to 2012, compared to
an increase of 20 per cent for adults over the same
period.42 In low- and middle-income countries,
overall ART coverage for children under the age of
15 years has consistently been around half that for
adults – 34 per cent compared to 64 per cent for
adults in 2012 (see Figure 1.5).43
The CEE/CIS region reports the highest ART coverage
for children younger than 15 years: at 85 per cent
(80–89 per cent), followed by Latin America and the
Caribbean at 67 per cent (50–83 per cent). East Asia
and the Pacific reported 53 per cent (41–72 per cent)
coverage, whereas South Asia reported 39 per cent
(30–49 per cent) coverage. The region with the
figure 1.5
Percentage of adults (aged 15+) and children (aged 0–14)
living with HIV receiving antiretroviral therapy in low- and
middle-income countries, 2012
64%
34%
Adults
(aged 15+)
Children
(aged 0–14)
Source: Joint United Nations Programme on HIV/AIDS, Global Report:
UNAIDS report on the global AIDS epidemic 2013, UNAIDS, Geneva,
2013, pp. A87, A94.
greatest need, Eastern and Southern Africa, reported
40 per cent (35–46 per cent) coverage. The lowest
coverage was registered in West and Central Africa,
15 per cent (13–18 per cent), and in the Middle East
and North Africa, 7 per cent (4–10 per cent).44
ART coverage for children younger than 15 years
in the 22 Global Plan priority countries increased
from 29 per cent (500,000 children) in 2011 to
34 per cent (560,000 children) in 2012, but the pace
of scale-up across low- and middle-income countries
lags behind that of adults.45 Four of the Global
Plan priority countries had greater than 50 per cent
ART coverage among eligible children – Botswana
(>95 per cent), Namibia (88 per cent), South Africa
(63 per cent) and Swaziland (54 per cent) – and
coverage has doubled in nine other countries in the
last three years.46 Other priority countries have very
low coverage, and on average, only one in three
eligible children have access to ART in the 22 priority
countries (see Figure 1.6 ). A huge effort therefore will
be needed to reach the global goal of providing ART
to all eligible children by 2015.
Providing paediatric ART presents a number of unique
and complex challenges. Among them are the limited
availability of fixed-dose combinations, poor palatability of currently recommended paediatric drug
formulations for infants, and the need to use virological testing to determine HIV infection in children
under the age of 18 months. However, new drugs
such as granular ’sprinkles‘ and new technologies for
performing virological testing at the point of care are
expected to help overcome the challenges and may
facilitate improved uptake and adherence.
Timely diagnosis of HIV in pregnant women
and children is crucial, but coverage
of testing varies widely and linkages to
treatment and care are still inadequate
Significant proportions of pregnant women and
children living with HIV remain undiagnosed or, if
diagnosed, are not adequately enrolled into care.
11
figure 1.6
Percentage of ART coverage among eligible adults (aged 15+),
children (aged 0–14) and all ages in the 22 Global Plan
priority countries, 2012
Adults (aged 15+)
Children (aged 0–14)
All ages
<95
Botswana
88
Namibia
85
81
38
76
36
Malawi
33
Uganda
United Rep.
of Tanzania
70
68
26
68
24
Ethiopia
21
Burundi
Towards an AIDS-Free Generation – Children and AIDS: Sixth Stocktaking Report, 2013
81
63
South Africa
Kenya
25
Lesotho
25
59
40
Cameroon
15
56
55
49
48
27
Mozambique
15
Angola
48
29
Chad
9
43
38
12
36
34
67
0% 10% 20% 30% 40% 50% 60% 70% 80% 90% 100%
Note: Some numbers do not add up due to rounding. The coverage
estimate is based on the estimated unrounded number of children
receiving and eligible for ART.
Source: UNAIDS, UNICEF and WHO, 2013 Global AIDS Response
Progress Reporting.
12
WHO recommends that infants exposed to HIV be
tested at 4 to 6 weeks of age, using a virological
test.49 ART should be started as soon as an infant
is diagnosed with HIV, regardless of clinical and
immune system status. Some countries are considering even earlier testing, at birth, especially for
children born to mothers who have not received
PMTCT services.
While early infant diagnosis (EID) is expanding
in many countries, overall testing rates for infants
remain low. Only 39 per cent of children in lowand middle-income countries were estimated to
have access to HIV testing within the recommended
2 months of birth in 2012 (see Figure 1.7 ).50
62
India
16
Early infant diagnosis remains low
67
Ghana
Côte d’Ivoire
Four of the 22 Global Plan priority countries
(Botswana, Mozambique, South Africa and Zambia)
exceeded 95 per cent coverage for testing pregnant women in 2012, but coverage was less than
25 per cent in three others (Chad, the Democratic
Republic of the Congo and Nigeria).48
86
45
Zimbabwe
Total priority
countries
87
38
Zambia
Nigeria
91
54
Swaziland
Dem. Rep. of
the Congo
>95
An estimated 40 per cent of pregnant women in
low- and middle-income countries received HIV
testing and counselling in 2012, up from 26 per cent
in 2009.47 Coverage varies widely by country
and region.
The CEE/CIS region had the highest coverage of
EID of all regions reported, at 72 per cent (although
the uncertainty range around the estimates is very
wide: from 49 per cent to greater than 95 per cent),
followed by Eastern and Southern Africa at
51 per cent (45–57 per cent), Latin America and
the Caribbean at 42 per cent (27–57 per cent)
and East Asia and the Pacific at 30 per cent
(20–45 per cent). In West and Central Africa, EID
is at 9 per cent (8–11 per cent). South Asia stands
at only 2 per cent (1–3 per cent) coverage.51
figure 1.7
Estimated percentage of infants born to women living with HIV receiving a virological test by 2 months of age, by UNICEF region,
all low- and middle-income countries and the 22 Global Plan priority countries, 2010–2012
2010
2011
2012
100%
90%
80%
70%
60%
50%
40%
30%
20%
10%
0%
Eastern and
Southern
Africa
West and
Central Africa
Middle East
and
North Africa
East Asia and
the Pacific
South Asia
Latin America
and the
Caribbean
CEE/CIS
All low- and
middle-income
countries
22 Global
Plan countries
Note: The vertical lines indicate the uncertainty ranges around the estimates.
Initiatives
Source: UNAIDS, UNICEF, WHO, 2013 Global AIDS Response Progress Reporting, and UNAIDS 2012 HIV and AIDS estimates.
Presumptive diagnosis in Lesotho
Where early infant diagnosis is weak, severe illness can progress quickly in children with HIV.
Presumptive diagnosis allows health workers to offer immediate ART to infants showing signs of
HIV-related disease. In some areas of Lesotho, for example, difficult terrain leads to long waits for the
return of HIV test results, and also makes it difficult to keep test kits in stock. Delivery of infant HIV
test results can take 6 to 12 weeks, delaying the start of life-saving treatment for infants who need it.
Presumptive diagnosis eliminates this wait by relying on immediate assessment rather than laboratory
test outcomes as the basis for ART initiation.
In 2010, the Elizabeth Glaser Pediatric AIDS Foundation (EGPAF) supported Lesotho’s Ministry of
Health in training maternal and child health nurses at three hospitals in presumptive diagnosis. Between
January 2010 and December 2011, the specially trained nurses diagnosed 48 infants with severe HIV
disease and started ART promptly. Of these 48 children, 43 received a test for HIV. When their test
results arrived, 42 of them proved to be living with HIV and 1 was HIV-negative.
EGPAF intends to train more health-care workers in the WHO presumptive diagnosis criteria. A
recommendation for scale-up in Lesotho has been made, while efforts to improve routine systems for
EID are also intensifying.
13
Among the 22 Global Plan priority countries, only
two were providing EID for more than 80 per cent of
infants in need in 2012: South Africa (85 per cent)
and Swaziland (81 per cent). They were followed by
Namibia (74 per cent), Lesotho (69 per cent52) and
Zambia (61 per cent). Coverage of EID is less than
10 per cent in five of the priority countries: Angola,
Chad, the Democratic Republic of the Congo, Malawi
and Nigeria.53
In low- and middle-income countries, the vast majority
of children diagnosed with HIV do not begin ART in a
timely manner; in 2012, only 34 per cent of children
under 15 years diagnosed with HIV received treatment.
As a result, an estimated 210,000 (190,000–250,000)
children died from AIDS-related illnesses that year.54
Special attention is needed to ensure that
women have access to ARVs and are retained
in care during the breastfeeding period
Breastfeeding is critical for child survival and growth.
WHO recommends that mothers living with HIV who
are taking ART and breastfeeding should exclusively
box
Towards an AIDS-Free Generation – Children and AIDS: Sixth Stocktaking Report, 2013
Current service delivery models rely heavily on the
provision of paediatric HIV treatment at specialized
paediatric HIV clinics or adult HIV clinics, whereas task
shifting or task sharing with health-care workers other
than medical doctors – to facilitate care to decentralized levels, including through community-based
services – should be a priority to improve access.55
While global data on ARV coverage during the
breastfeeding period are limited, it is estimated that,
in 2012, nearly half of mothers in the 21 Global
Plan priority countries in Africa did not receive
ARVs during the breastfeeding period. Up to about
half of all new infections in children in sub-Saharan
Africa are estimated to have occurred as a result.57
Special attention is therefore needed in all countries to ensure access to, and retention on, ART for
breastfeeding mothers.
Primary prevention needs for women and
family planning services for women living
with HIV remain inadequate
Provision of ARVs to pregnant women and mothers
living with HIV to prevent mother-to-child transmission (identified as Prong 3 of PMTCT in the Global
Plan) and of treatment of mothers and children
living with HIV for their own health (Prong 4) has
been substantial. However, progress in primary
Progress on reducing new HIV infections among children has been faster than ever before.
But to meet the 2015 target, the pace of progress will have to accelerate.
850,000
new HIV infections
among children (0–14 years) in lowand middle-income countries were
prevented between 2005 and 2012.
14
breastfeed their infants for the first six months of life,
introducing appropriate complementary foods thereafter, while continuing to breastfeed until the child is
12 months old. Breastfeeding should then stop only
when a nutritionally adequate and safe diet without
breast milk can be provided. Infants of mothers who
are receiving ART and breastfeeding should receive
6 to 12 weeks of infant prophylaxis with daily nevirapine. Alternatives exist for women living with HIV
who do not breastfeed.56
39%
Only
of children in low- and
middle-income countries were estimated
to have access to HIV testing within the
recommended 2 months of birth in 2012.
prevention among women and girls of childbearing
age (Prong 1) and in reducing unmet need for family
planning by women living with HIV (Prong 2) has
not been as impressive. In the Global Plan priority
countries in Africa, the number of women becoming
newly infected declined 10 per cent between 2009
and 2012. Ghana reported the greatest decline, at
44 per cent, during the same period, and South Africa
reported a 21 per cent decline.58 This trend highlights
the need for innovation in following up with pregnant
women who test HIV-negative at their first antenatal
visit and the importance of broader primary prevention (outside of antenatal settings) among women and
girls to achieving the goal of an AIDS-free generation.
Unmet need for family planning services among
women living with HIV continues to undermine efforts
to eliminate new infections among children.59 For
women in low- and middle-income countries, unmet
need for family planning declined only slightly, from
15 per cent in 1990 to 12 per cent in 2010.60
UNAIDS reports that in East Africa and West Africa,
the unmet need for family planning services for more
than 20 per cent of women did not change between
1990 and 2010.61 This means that more than one
in five women in stable relationships expressing
the desire to delay or stop childbearing were not
using contraception.
Renewed commitment and resources for family
planning from the global community, including
through the Family Planning 2020 initiative, are
260,000
new HIV
infections occurred among
children (0–14 years) in low- and
middle-income countries in 2012.
one third
welcome.62 Family planning services for women living
with HIV must be voluntary and non-coercive. Reports
of forced sterilization and other coercive attempts to
prevent women living with HIV from having children
underscore the importance of a human rights–based
approach, including for family planning services.63
New paradigms, opportunities
and innovations
The WHO guidelines on ARVs released in 201364
provide important opportunities to simplify and
further scale up interventions among children and
their mothers. They include recommendations in the
following six areas:
•
Offering ART to all pregnant and breastfeeding
women living with HIV, regardless of CD4 count,
to protect their health, protect their babies from
HIV and protect their sexual partners from HIV.
This approach emphasizes the importance of
pregnant and breastfeeding women living with
HIV beginning treatment without delay. It also
reduces the risk of HIV transmission during breastfeeding as long as mothers continue to take
ART. Simplifying ART for pregnant and breastfeeding women through the use of a standardized
one-pill-daily, fixed-dose combination of three
ARVs should also facilitate further decentralization
and integration of HIV services to the primary-care
level, including maternal and child health services.
62%
of pregnant women living
with HIV in 22 Global Plan priority
countries received ARVs to prevent
mother-to-child transmission in 2012.
Without treatment,
of infants living with HIV will
die before their first birthday, and half will die before their second birthday.
34%
of children
(0–14 years) received
the life-saving ART they
needed in 2012 versus
64%
of adults.
15
Initiatives
Lifelong ART for pregnant women: Malawi blazes the trail
In 2011, the Government of Malawi pioneered offering lifelong simplified treatment for all pregnant
and breastfeeding women (previously known as Option B+) using a provider-initiated (not mandatory)
‘test and treat approach’, regardless of CD4 count or any other preconditions. Children under 5 years
of age are also prioritized in this way, without preconditions. For pregnant women living with HIV,
simplified treatment, which consists of a fixed-dose, single-pill, triple-drug regimen taken once per day,
was made widely available, including through lower-level health-care facilities. The number of pregnant and breastfeeding women living with HIV started on ART had increased from 1,257 in the second
quarter of 2011, to 10,663 in the third quarter of 2012.65 By June 2013, 13 of the 22 Global Plan
priority countries had adopted the same policy of offering lifelong ART for all pregnant and breastfeeding women living with HIV, and Lesotho and Uganda (besides Malawi) had already started to
implement the approach.
Further country progress details are available from the website of the Inter-Agency Task Team on
the Prevention and Treatment of HIV Infection in Pregnant Women, Mothers and Children:
<www.emtct-iatt.org>.
Towards an AIDS-Free Generation – Children and AIDS: Sixth Stocktaking Report, 2013
•
•
16
Harmonizing ARV drug regimens for pregnant
and breastfeeding women, and other adults
and adolescents, living with HIV: Previous WHO
guidelines recommended different adult ARV
regimens for PMTCT and for treatment. The 2013
WHO guidelines on ARVs recommend the same,
fixed-dose, single-pill, triple-drug regimen for
all adults and adolescents as first-line therapy.
This approach will simplify the delivery of ART
for both treatment and prevention and enable
pregnant women living with HIV to continue on
the same drug regimen for their own health. The
experience of Malawi suggests that the simplified
regimen is easier to take and that it improves
adherence, while also aligning PMTCT and ART
services and promoting access to these services
in primary-care facilities.66
Expanding ART delivery in antenatal, maternal
and child health settings: The 2013 WHO
guidelines on ARVs67 include a specific recommendation that, in generalized epidemics, ART
should be initiated and maintained in eligible
pregnant and post-partum women and infants
in maternal and child health-care settings,
with linkage and referral to ongoing HIV care
and ART where appropriate. Governments
are responding by implementing task-shifting
measures to enable midwives and other cadres
to initiate and follow up on ART.68
•
Making use of new technologies for infant
testing: Diagnostic technologies are now
advancing rapidly. In the coming years,
point-of-care virological tests for early infant
diagnosis should become available, which will
allow nurses and other non-physician health
workers to test infants at lower-level health facilities, without the need to send samples to central
laboratories for processing. This important
advance should enable more timely identification
of HIV-infected infants and promote more rapid
linkage to treatment and care.
•
Recommending lifelong ART for all children
under 5 years of age, regardless of CD4: Infants
and children are vulnerable to rapid progression of HIV-related disease. Left untreated, half
of children born with HIV will die before their
second birthday. In order to facilitate rapid
access to treatment for children diagnosed with
HIV infection, the 2013 WHO ARV guidelines
have recommended immediate treatment without
the need for CD4 testing for children up to
5 years of age.69
Addressing the needs of HIV-exposed but
uninfected infants: An increasing amount of
evidence suggests that all children born to
women living with HIV – whether the children are HIV-infected or not – have poorer
health outcomes than children born to HIV-free
mothers.70 This evidence underscores the
importance of early identification and linkage
to care and treatment for pregnant women
living with HIV. It also highlights the need for
increased emphasis on early identification of all
HIV-exposed children and linking these mothers
and their children to care and support through a
wide range of settings.
To build upon the progress made in recent years and
take advantage of new opportunities to address HIV
among children in the first decade of childhood, the
following 11 strategies need to be pursued:
1. Put the health of women at the centre
of the response to HIV among children
The shift to provide ART to all pregnant and
breastfeeding women living with HIV, regardless
of CD4 count (previously known as Options B
and B+), means that the past distinction between
ARVs as prophylaxis to prevent HIV transmission to
children and ART for the health of pregnant women
is becoming obsolete. The 2013 WHO guidelines
on ARVs71 and emerging practice in countries now
Innovation
Combined technology, treatment and programming innovations are expanding access to HIV
services and increasing the speed of service
delivery – and such improvements are often
more cost-effective than before. They include:
• SMS technology, delivering test results
and reminders to patients in Malawi
and Zambia
• Point-of-care machines and communication
technology in decentralized settings, speeding
up diagnoses in Eastern and Southern Africa
(supported by UNITAID, the Clinton Health
Access Initiative and UNICEF)
• ‘Telemedicine’, a decentralized approach
to HIV testing, treatment and care in
India (supported by the MAC AIDS Fund
and UNICEF).
© UNITAID/2013/Giulio Donini
Initiatives
•
Strategies to accelerate
progress in the first decade
of life
17
© UNICEF South Africa/2013/Marinovich
Towards an AIDS-Free Generation – Children and AIDS: Sixth Stocktaking Report, 2013
strongly support the integration of PMTCT and ART
programmes by emphasizing that HIV outcomes in
children are inextricably linked to the health of their
mothers. Furthermore, increasing evidence of poorer
health outcomes for infants born to mothers living with
HIV, regardless of the HIV status of the infants, points
to the importance of early treatment for women living
with HIV to protect their own health and that of their
babies. The provision of ARV prophylaxis only during
pregnancy and breastfeeding for women living with
HIV with higher CD4 counts (the approach previously
known as Option A) is no longer recommended by
WHO and should be phased out as soon as possible.
2. Prevent mother-to-child transmission
among women from key populations
Outside sub-Saharan Africa, the majority of cases of
mother-to-child transmission are occurring among key
populations, including women who inject drugs and
female partners of men who inject drugs, sex workers,
female partners of men who also have sex with men,
and other marginalized groups such as women in
prisons. For example, in Ukraine, where the epidemic is
driven by injecting drug use, a study in 2010 showed
mother-to-child transmission rates of 11 per cent in
women who injected drugs versus 6 per cent in women
who did not.72 Scaling up harm reduction programmes
and integration with sexual and reproductive health
and maternal and child health services has led to
substantial increases in coverage of HIV testing and
ART for pregnant women injecting drugs. To achieve
elimination of mother-to-child transmission in this population wherever they may live, further action is needed
to ensure early access to services that can address both
18
drug dependency and HIV-related issues, including
provision of medication-assisted substitution treatment
for women with opioid drug dependence.73
Women represent 5–10 per cent of the over 30 million
people in prisons each year, but this proportion is
increasing and women in prisons are at higher risk
for HIV than their male counterparts.74 Women can
be pregnant, give birth and breastfeed while in prison
and other closed settings. The isolation of prison health
services from general health services and the substandard conditions and services, including HIV and
reproductive health services, means access to PMTCT
can be limited. It should be a priority for countries to
include populations in closed settings in their efforts
to prevent transmission of HIV through comprehensive
services equivalent to those in the community.
3. Integrate TB prevention, diagnosis and
treatment as a core component of the
PMTCT package of care in high TB
prevalence settings
Active tuberculosis (TB) has been diagnosed at rates
up to 10 times higher in pregnant women living with
HIV than in women without HIV infection.75 There is
also increasing evidence to show that untreated TB in
pregnant women living with HIV is associated with a
higher risk of poor obstetric and perinatal outcomes,
including the death of both the infant and mother. TB in
pregnant women living with HIV is also associated with
more than double the risk of transmission of HIV to the
unborn child.76 It is therefore vital that collaborative TB/
HIV activities be incorporated as part of the package
of care at all stages of pregnancy and neonatal, postpartum and post-natal care, particularly in high HIV and
TB burden settings. The inclusion of regular TB symptom
screening, as recommended by WHO, will help
ensure early diagnosis and treatment of TB and also
identify women who do not have active TB and are
eligible for isoniazid preventive TB therapy. 77 Should
full integration of TB diagnostic, prevention and treatment services in maternal, newborn and child health
services not be possible, effective patient-centred referral
mechanisms with TB services need to be established.
4. Accelerate the introduction of
new technologies for diagnostics
and medicines
Implementing the 2013 WHO guidelines on ARVs78
should be a priority for countries in order to streamline PMTCT and ART programming and simplify the
provision and procurement of ARVs.
Improved ARV formulations for children under the
age of 3 years, such as ‘sprinkles’, are likely to
be available in the near future and will need to be
scaled up to help overcome the current limitations of
paediatric HIV treatment. More effort is also needed
to develop ART regimens that could be harmonized
for use by infants and older children as well as
adolescents and adults, such as scored dispersible
fixed-dose combinations.
Introducing new technologies that enable point-of-care
virological testing for early infant diagnosis should
also be a high priority. Innovations in the use of
mobile phone technology are increasing efficiency
by providing appointment reminders and health
information and reducing turnaround time for
laboratory results.
5. Decentralize and integrate family-centred
HIV services, including task shifting
Initiatives
In many countries ART services are provided at
locations separate from those where maternal and
child health, family planning and other sexual
and reproductive health services are provided.
Improved integration of these services, including by
decentralizing HIV testing, treatment and care to
the primary-care level, is essential to strengthen the
continuum of HIV care for women and children.
WHO recommends task shifting as a critical tool to
allow decentralization of treatment and care, and
comparable clinical outcomes can be achieved when
appropriate training and supervision are provided
to non-physician health-care providers. Task shifting
and task sharing are important strategies to optimize human resource capacity in settings with weak
health systems.79
In particular, the initiation and maintenance of ARVs
in women and children living with HIV in maternal
and child health settings should contribute to
increased access to treatment at the level of primary
care and reduce loss to follow-up of women and
children diagnosed with HIV in these settings.80
Integration through non-traditional channels such as
the employment sector increasingly offers opportunities to reach more women through their participation
in the workforce. With the wider backing of the
International Labour Organization’s Convention
No. 183 on maternity protection, 57 countries
have national HIV workplace policies providing
a potential platform to facilitate PMTCT and other
HIV-related services.81
Integrating PMTCT with maternal and child health services
In Rwanda, the integration of the national PMTCT programme into the country’s existing maternal and
child health services has helped ensure that virtually all women receive their test results and doubled the
proportion of HIV-exposed infants receiving ARV prophylaxis. Studies in some areas show that this figure
increased from 47 per cent in 2007 to 96 per cent in 2011. Male involvement increased as well.82
In South Africa, where HIV testing was linked to an immunization programme, mothers involved in the
programme reported feeling comfortable with having their infants tested at immunization clinics, and
most would recommend it to others.83
19
© UNICEF/NYHQ2011-2151/Esteve
coverage in low- and middle-income countries is
low (44 per cent).87 Eastern and Southern Africa
reported coverage of 56 per cent, and CEE/CIS
reported 69 per cent in 2012; however, all other
regions report very low coverage (3–43 per cent).88
Better integration and decentralization of such simple
interventions as part of the broader management
of childhood illness can significantly improve child
health outcomes.89
Towards an AIDS-Free Generation – Children and AIDS: Sixth Stocktaking Report, 2013
6. A
lign programming for all HIV-exposed
children with broader efforts to promote
child survival, growth and development
Major progress in reducing maternal and child
mortality has been made in the past 20 years:
Between 1990 and 2010, maternal mortality in
sub-Saharan Africa dropped by 41 per cent,84 and
between 1990 and 2012, the under-five mortality
rate declined by 47 per cent.85 The Countdown to
2015: Accountability for Maternal, Newborn and
Child Survival report launched in 2013 recognized
that HIV cannot be ignored in making progress
on maternal mortality.86 The continuing global
drive for accelerated and improved maternal and
child survival – through routine child immunization
programmes and initiatives such as Committing to
Child Survival: A Promise Renewed – provides opportunities to create new entry points to HIV testing and
enhanced care for both HIV-infected and uninfected
children born to women living with HIV, especially in
high HIV burden settings.
Weaknesses in systems and services can mean that
even where the effective course of action is clear,
the intervention may not reach the child in time.
Research has shown that mortality in children diagnosed with HIV can be reduced by 67 per cent with
cotrimoxazole – an antibiotic – as prophylaxis, yet
20
Provider-initiated HIV testing also needs to be more
widely available in other services for children, such
as routine immunization and early child health or
nutrition programmes, as well as community-based
and health facility-based services for infants. These
services can play an especially important role in
identifying children whose mothers did not access
antenatal and PMTCT services during pregnancy.
7. Strengthen linkages between HIV
programming and national social welfare
and community-based support systems
HIV has broad social and economic consequences
for children and their families, but orphans and
vulnerable children, including those living in families
affected by HIV, frequently do not receive any type
of support.90 Mitigating the impact of HIV on the estimated 17.8 million (16.1 million–21.6 million) of the
world’s children who have lost one or both parents
to AIDS91 – 85 per cent of whom live in sub-Saharan
Africa92 – is a particularly formidable task.
While comprehensive social support for children and
families affected by HIV is an essential element of
the response to HIV, it is frequently an afterthought
in many HIV-specific programmes. Stronger linkages
between HIV programming and broader national
social protection efforts and community-based
services are needed to ensure that more children and
families receive the support they need. Such social
protection programmes, particularly cash transfers,
appear to be rapidly expanding, with some estimates suggesting they have doubled in Africa – from
8. Reinforce safer breastfeeding
efforts and messaging
120 programmes implemented between 2000 and
2009 to about 245 programmes in 2012 – with an
estimated US$10 billion supporting cash transfer
programmes in 2012 alone.93
The 2013 WHO guidelines on ARVs emphasize
that the risk of post-natal HIV transmission through
breastfeeding will be minimized as countries transition towards offering ART to all pregnant women
living with HIV, as long as they continue on treatment
without any lapses. Women who are breastfeeding
should do so exclusively – giving their infants only
breast milk, without any other kind of food or
liquid, up to 6 months of age.98 Women need to be
supported in doing this, and these messages should
be reinforced in all breastfeeding programming.
Social protection has already proven to have an
impact not only in support for children and families
already affected by HIV, but also in preventing HIV
and improving treatment and care outcomes.94 The
opportunity exists now to tailor these programmes
to include HIV-affected populations, extending the
support they offer to include transportation to clinics,
nutrition support, cash transfers for poor households,
psychosocial support and palliative care services.
In Zambia, the inclusion of early childhood
development in the Education Sector Plan (2012–
2015) seeks to expand access to schooling and
improve educational quality and equity, especially
for orphans and vulnerable children and children
affected by HIV and AIDS.95
9. Strengthen primary HIV prevention
and family planning services
Every new HIV infection in a child also represents
a failure of primary HIV prevention for women and
girls. Pregnant women may be at increased risk
of HIV acquisition and transmission, and rates of
sero-conversion (the development of antibodies)
during pregnancy can be significant, particularly
in high HIV prevalence settings. Comprehensive
HIV prevention programming for women and girls,
including pregnant women in antenatal care, needs
to be reinforced.
Community- and faith-based services have a
long tradition of providing HIV-related (health,
social and economic) services in rural and remote
areas. In Malawi, for example, case management performed by community health workers has
resulted in improved retention in care and higher
utilization of antenatal and post-natal services for
mother-baby pairs. While these approaches have
not been brought to scale in many settings,97 their
value is increasingly recognized, especially in rural
areas. However, over-reliance on volunteers cannot
adequately compensate for a lack of government
infrastructure and services. Building effective and
sustainable community systems requires human
and financial resources, and partnerships between
community members and the health, social welfare,
child protection, legal and political systems.
© UNICEF/NYHQ2011-1692/Pirozzi
In India, mechanisms are being put in place to
reduce out-of-pocket expenses for people affected
by HIV and support access to primary health care,
including through call centres coordinating free and
low-cost transport.96
21
© UNICEF/NYHQ2010-2928/Nesbitt
It is estimated that if the unmet need for family
planning among women living with HIV was
addressed in the 22 countries with the highest burden
of HIV, there would be 61,000 fewer children with
HIV in 2015 alone.99 Rights-based, non-coercive
family planning for women living with HIV needs to
become more widely available, particularly through
box
Towards an AIDS-Free Generation – Children and AIDS: Sixth Stocktaking Report, 2013
The target of halving new HIV infections among
women of reproductive age is integral to the overall
goal of eliminating new HIV infections among
children by 2015 and keeping their mothers alive.
under-utilized entry points, such as maternal and child
health and sexual and reproductive health services, in
addition to primary health-care services.
10. Address stigma and discrimination,
including through strong
community engagement
Women living with HIV may face a complex mix
of stigma and gender-based inequities, including
judgemental attitudes among health-care providers.
The challenges may be even greater for young
Comprehensive HIV prevention and family planning for women and girls
It has been estimated that deploying comprehensive PMTCT could avert nearly 80 per cent of child HIV
infections by 2015 in 25 high HIV burden countries.100 Effective delivery of ARVs to pregnant women
living with HIV would account for 60 per cent of averted infections among their infants. Reducing new
HIV infections in women of reproductive age and responding to unmet need for family planning would
account for 13 per cent, while another 6 per cent would be attributable to limiting the duration of
breastfeeding to 12 months.101
Couples testing and counselling is also an important intervention for strengthening HIV prevention,
including by making ART available to sero-discordant couples (in which one partner is HIV-positive
and the other is not). In 2013, WHO recommended offering ART to all people living with HIV in
sero-discordant relationships. Studies suggest that providing HIV testing and counselling for both
partners together can result in reduced new infections among such couples.102 In some locations in
Rwanda, rates of HIV testing of male partners during antenatal care are now over 80 per cent.103
22
women, women living with disabilities, mothers or
pregnant women who inject drugs, and women and
their accompanying children in prisons. In addition to the challenge of discrimination from service
providers, these women may have fears regarding
child custody. Fear of disclosing their own status
may inhibit mothers from enrolling children in HIV
treatment programmes, especially when there is an
obligation to consult other family members about
health-care decisions.104
Strengthening monitoring and evaluation will require
more focused data-driven planning and analysis of
results with equity in mind. Multi-partner support will
be not only desirable, but a prerequisite for achieving
results that combine to serve the most disadvantaged
and excluded. More effective monitoring and evaluation of programmes at the primary health-care
level will also help local decision makers improve
programme performance. For example, bottleneck
analyses were conducted in each of the 22 Global
Plan priority countries to identify specific entry points
for improvements and to inform costed EMTCT plans
for each country. This is a good example of how
partnerships and tailored tools can add value and
accelerate the pace of progress.
Community engagement is a key approach to
tackling HIV-related stigma and discrimination while
providing support to children and families living
with HIV. An eight-country analysis found that in
nearly all settings, community-driven advocacy helps
identify and publicize obstacles to HIV treatment
access, addresses stigma and discrimination, and
promotes human rights and changes to obstructive
and discriminatory laws and practices.105 Leadership
at all levels is essential to promote law reform and
put in place supportive policies that contribute to an
enabling environment for the response to HIV among
women and children.
As the new approaches described in this section are
scaled up, operational research is essential to guide
implementation, especially to identify best practices
for the delivery of HIV interventions for women
and children in primary-care and community-based
settings, and to optimize synergies between HIV
programming and child and social protection efforts.
Answering questions regarding overall transmission
rates and the impact of HIV-related programming on
maternal and infant morbidity and mortality should be
high priorities, along with continuing research on the
safety of lifelong ART for pregnant and breastfeeding
women. Clinical research can also lead to expanding
the range of available interventions for women and
children, including improved paediatric treatment
options, microbicides and vaccines.
© UNICEF/NYHQ2011-0268/Nesbitt
11. Expand the knowledge base through
research, monitoring and evaluation
23
chapter 2
New infections among adolescents
could be halved by 2020 by scaling
up high-impact interventions and
working across sectors.
© UNICEF/NYHQ2012-1507/Jayasuriya
Towards an AIDS-Free Generation – Children and AIDS: Sixth Stocktaking Report, 2013
Responding
to HIV in
the second
decade
of lifE
24
The second decade:
Transition and vulnerability
A good start in life has a clear influence on later
development. And adolescence provides an opportunity to reinforce health, nutrition and education bases,
and the social and economic drivers that contribute to
a healthy and productive adult life.
Numbering an estimated 1.2 billion globally,
adolescents (aged 10–19 years) comprise almost one
fifth of the world’s population.106 Almost a quarter of
all adolescents live in sub-Saharan Africa, and the
number of adolescents in that region is expected to
double by 2050.107
Adolescence is recognized as a period of life
involving significant physical, physiological and
psychological changes that mark the transition to
adulthood. This is also the period of life when social
and gender roles are reinforced, and adolescents
face increasing pressure to assume adult roles and
responsibilities, often before they are physically and
psychologically mature. Healthy passage through the
second decade of life is profoundly dependent on
effective education, health care, support, protection
and nurturing from family, peers and communities.
As adolescents experience the many social and
economic pressures that come with transitioning to
adulthood, they can become especially vulnerable
to HIV. They may become sexually active or begin to
experiment with drugs and alcohol, which puts them
at risk. But very often adolescents do not perceive
themselves as vulnerable to HIV.
Approximately 2.1 million (1.7 million–2.8 million)
adolescents were estimated to be living with HIV
figure 2.1
Estimated number of adolescents aged 10–19 living with HIV, by country, and male/female percentages, by UNICEF region, 2012
Total adolescents: 2.1 million (1.7 million–2.8 million). Females: 1.2 million; males: 930,000
CEE/CIS
Total: 22,000
Towards an AIDS-Free Generation – Children and AIDS: Sixth Stocktaking Report, 2013
Female
Male
Latin America
and the Caribbean
Total: 82,000
48% 52%
Middle East and
North Africa
Total: 17,000
East Asia and
the Pacific
Total: 110,000
48% 52%
49% 51%
57% 43%
51% 49%
44% 56%
Less than 10,000
10,001–50,000
50,001–100,000
100,001–150,000
150,001 and above
Data unavailable
1–999
1,000–9,999
10,000–49,999
50,000–99,999
100,000–149,999
150,000–311,,385
West and
Central Africa
Total: 390,000
41%
South Asia
Total: 130,000
59%
Eastern and
Southern Africa
Total: 1,300,000
Note: This map is stylized and not to scale. It does not reflect a position by UNICEF on the legal status of any country or territory or the delimitation of
any frontiers. The dotted line represents approximately the Line of Control in Jammu and Kashmir agreed upon by India and Pakistan. The final status
of Jammu and Kashmir has not yet been agreed upon by the Parties. The final boundary between the Republic of the Sudan and the Republic of South
Sudan has not yet been determined. The final status of the Abyei area has not yet been determined.
Data unavailable
Source: UNICEF analysis of UNAIDS 2012 HIV and AIDS estimates.
26
figure 2.2
Estimated number of AIDS-related deaths among children aged 0–4, younger adolescents aged 10–14, older adolescents
aged 15–19 and young people aged 20–24, 2000–2012
Children aged 0–4
Younger adolescents aged 10–14
Older adolescents aged 15–19
Young people aged 20–24
250,000
200,000
150,000
100,000
50,000
0
2000
2001
2002
2003
2004
2005
2006
2007
2008
2009
2010
2011
2012
Source: UNICEF analysis of UNAIDS 2012 HIV and AIDS estimates.
globally in 2012, more than 80 per cent of them
in sub-Saharan Africa (see Figure 2.1). While the
number of global AIDS-related deaths for all ages fell
by 30 per cent between 2005 and 2012, among
adolescents they increased by 50 per cent in that
period (see Figure 2.2).108
While declines in new infections among infants have
been marked, due to progress in preventing motherto-child HIV transmission, the decline in new infections
among adolescents has been much more modest. In
2012, about one third of all new infections occurred
among young people aged 15–24 years (780,000;
(670,000–960,000). Of these, about 300,000
(250,000–390,000) were among adolescents aged
15–19 years (see Figure 2.3).109
Recent data suggest that behaviour change among
these age groups is making a difference, although
not as quickly as is needed. Globally, boys tend to
report higher condom use than girls. In sub-Saharan
Africa, only about one in three adolescent girls
(15–19 years) who reported multiple partners in
the last 12 months reported using a condom at last
sex.110 Although still at low levels, condom usage has
increased in most regions, while the number of sexual
partners among adolescents aged 15–19 years has
decreased and adolescents have been initiating
sexual activity at a later age than in the past.111
CEE/CIS appears to depart from this trend. Recent
studies in several countries of this region suggest that
the age of initiation of sexual activity is decreasing,
with the median age of first sex being 15–17 years
or below among adolescents.112
Voluntary medical male circumcision (VMMC) is
supported by compelling evidence from three separate clinical trials that demonstrated a 60 per cent
reduction in the risk of female-to-male sexual transmission of HIV.113 WHO and UNAIDS recommendations
emphasize that male circumcision should be considered an effective intervention for HIV prevention in
countries with high HIV burden and low male circumcision prevalence.114 Some of the 14 priority countries
in Africa meeting these criteria are beginning to
show results.115 There is evidence in Kenya that
27
figure 2.3
Estimated number of new HIV infections among children aged 0–14, adolescents aged 15–19 and young people
aged 20–24, 2000–2012
Children aged 0–14
Older adolescents aged 15–19
Young people aged 20–24
800,000
700,000
600,000
500,000
400,000
300,000
200,000
100,000
0
2000
2001
2002
2003
2004
2005
2006
2007
2008
2009
2010
2011
2012
programmes have had much greater success in
reaching males younger than 25 years.116 Shifting
social norms will be key to accelerating progress in
cultures that do not practice male circumcision.
VMMC. Although the cumulative number of men
circumcised in 2012 was nearly double what it was
in 2011 (1.5 million), the target of 20 million men
circumcised by 2015 is unlikely to be met.117
According to UNAIDS, 3.2 million African men
had been circumcised through specific services for
Countries in sub-Saharan Africa are now considering
expanding early infant male circumcision as a
box
Towards an AIDS-Free Generation – Children and AIDS: Sixth Stocktaking Report, 2013
Source: UNICEF analysis of UNAIDS 2012 HIV and AIDS estimates.
Adolescent girls and HIV118
40%
of women who sell sex in North America, East Asia
and South Asia began to do so before the age of 18.i
one third
In 35 countries,
more than
of women aged 20–24 were married
or in union by the age of 18.iii
80%
In 3 countries in Africa, more than
of the adolescents
aged 15–19 years who were newly infected with HIV in 2012
were girls: South Africa (82%), Sierra Leone (85%), Gabon (89%).
17%
In South Asia, comprehensive knowledge of HIV is low –
only for girls and for boys aged 15–19 years.ii
34%
28
15 million
More than
adolescent girls between the ages of
15 and 19 give birth every year.iv
strategy for HIV prevention in the long term. UNICEF
and partners are assessing early experiences of
delivering early infant medical male circumcision
using maternal, newborn and child health platforms
that may lead to an expansion of this intervention in
high HIV prevalence countries.
Adolescents face many barriers to accessing health and
support services, and they are routinely neglected in
national and global AIDS strategies. This must change.
Without increased attention to the needs of adolescents,
an AIDS-free generation cannot be achieved.
Inequities and
barriers to services
Three broad groups of adolescents face major
barriers accessing prevention, treatment and care
interventions: adolescent girls, adolescent key populations and adolescents living with HIV. The core
vulnerability of these groups lies in structural, socioeconomic and gender inequality, including failures
in child protection and social protection. This can
be exacerbated where providers lack skills or are
unwilling to work with at-risk and vulnerable adolescents, which too often results in limiting their access to
accurate information and the services they need.
1 in 5
women
globally has had a child
by the age of 18.v
In 2012, approximately two thirds of new HIV infections
in adolescents aged 15–19 years were among girls,
mainly in sub-Saharan Africa.119 In three countries in
this region more than 80 per cent of the adolescents
aged 15–19 years who were newly infected with
HIV in 2012 were adolescent girls – South Africa
(82 per cent female), Sierra Leone (85 per cent
female) and Gabon (89 per cent female).120
Social and economic inequalities play a marked role
in the vulnerability of adolescent girls and the disproportionate levels of HIV among them. Low social status,
household poverty and food insecurity, poor-quality
education and violence all limit opportunities for girls.
The death of caregivers and the caregiving role that is
so often assumed by women and girls can be limiting.
The promise of gifts and other financial and social
benefits, including the potential for upward social
mobility, can affect early sexual debut and motivate
girls to engage in age-disparate sexual relationships,
transactional sex or marriage at a young age. Where
HIV prevalence is high, these factors combine with
increased biological vulnerability, limited knowledge
about HIV and low risk perception to enhance the risks
and limit the choices girls and their families make.121
29%
20%
In UNICEF’s Eastern and Southern Africa region,
of females and
of males aged 15–19 years have ever tested for HIV and received their results.vi
210,000
An estimated
children under 15 died from
AIDS-related illnesses in 2012.
Social and economic inequities
drive HIV in adolescent girls
150 million
73 million
girls and
boys
vii
under the age of 18 have experienced sexual violence.
13%
9%
In sub-Saharan Africa, where HIV prevalence is high,
of girls and
of boys aged 15–19 years
reported sexual debut before the age of 15. Slightly higher rates are reported for adolescent girls in West and
Central Africa (16%).viii
29
© UNICEF Serbia/2010/Maccak
Key populations: Excluded, stigmatized
and criminalized
Towards an AIDS-Free Generation – Children and AIDS: Sixth Stocktaking Report, 2013
Worldwide, disproportionately high HIV prevalence
is reported among adolescent males who have
sex with males, adolescents who inject drugs and
sexually exploited adolescents.122 In one of the few
reports on the subject, more than 95 per cent of new
HIV infections in adolescents in Asia and the Pacific
were reported to occur in adolescents belonging to
‘key populations’ – people whose behaviours put
them at considerable risk of HIV infection and whose
young age renders them particularly vulnerable.123
In selected countries in Asia, the limited data available suggest that over 60 per cent of young key
populations initiate sexual activity early in life (by
15–19 years old) and that HIV testing is low.124
Prevention programmes in Asia have been credited
with containing HIV transmission resulting from sexual
exploitation and commercial sex, although hot spots
of concern persist.125 However, HIV transmission
during unprotected sex between males appears to
be an increasingly powerful driver of the epidemics
in several countries. Where HIV incidence among
men who have sex with men has been measured,
it has been found to be very high. HIV prevalence
exceeding 10 per cent has been found in cities in
China,126 India,127 Thailand128 and Viet Nam.129
Epidemics driven by unprotected sex between males
also predominate in the smaller Pacific nations, but
HIV prevalence there is still low. Studies tend to be
limited in scope and may include, but are not limited
to, young men.
Sharing contaminated injection equipment is an
extremely efficient mode of HIV transmission, and
the risk of infection increases dramatically the
longer injecting continues. In a 2012 survey in
30
Myanmar, HIV prevalence was 7 per cent among
15–19-year-olds injected drugs, and more than
double that (15 per cent) among 20–24-year-olds.130
Studies suggest that injecting drug use accounts for
more than two thirds of all new infections in Iran,
40 per cent of new infections in Eastern Europe
and more than one third in the Philippines.131 In
Pakistan, where injecting drug use is a key driver of
the epidemic, studies indicate HIV prevalence more
than tripled, from 11 per cent in 2005 to 38 per cent
in 2011.132 Emerging evidence from Eastern Europe
suggests that a small but important proportion of
injecting drug use begins during adolescence.133
In addition to the factors that increase vulnerability
for all adolescents, the vulnerability of adolescents
in these key populations is profoundly compounded
by severe social stigma, as well as harsh legal and
policy settings and law enforcement practices that
criminalize their behaviours and foster discrimination
and violence, thereby hindering access to the few
health services and other HIV prevention, treatment,
protection, care and support interventions that target
the needs of these populations.
Adolescents living with HIV: Shut out from
testing, treatment and care
Coverage of HIV testing and counselling is low
among adolescents and especially low among key
populations in most parts of the world. While access
and coverage vary greatly by country, survey data
from 2008 to 2012 in sub-Saharan Africa indicated
that fewer than one in five adolescent girls aged
15–19 years were aware of their HIV status (see
Figure 2.4).134 Guidance that testing should be strictly
voluntary is clear. However, there are reports that
testing of key populations in some settings is mandatory or coerced, and this is of great concern.135
Only a small proportion of adolescents who are
long-term survivors born with HIV have access to
ART, and most receive it through limited numbers
of specialized centres in urban and peri-urban
settings.136 Retention rates are also poor.
figure 2.4
Percentage of adolescent girls and boys aged 15–19 and young women and men aged 20–24 who have ever been tested for HIV
and received results, in selected sub-Saharan African countries
Togo
Central African
Republic
Senegal
Adolescent girls and young women
Aged 15–19
Aged 20–24
Adolescent boys and young men
Aged 15–19
Aged 20–24
Burkina Faso
Côte d’Ivoire
Zambia
Ethiopia
Burundi
Mozambique
Cameroon
Namibia
Zimbabwe
Kenya
Gabon
United Rep.
of Tanzania
Lesotho
Rwanda
Uganda
80%
70%
60%
50%
40%
30%
20%
10%
0%
0%
10%
20%
30%
40%
50%
60%
70%
Note: Countries were selected on the basis of data availability.
© UNICEF/NYHQ2011-2154/Esteve
Source: UNICEF global databases, 2013, based on Demographic and Health Surveys (DHS), Multiple Indicator Cluster Surveys (MICS) and other
national surveys, 2006–2012.
31
In general, HIV programmes struggle to reach
and retain adolescents, and incentives to attract
adolescents to services are rare. On the contrary,
age-of-consent laws frequently limit access to testing
and other interventions, leading to delayed diagnosis of HIV in adolescents and late entry to care
in many countries.137 A lack of adolescent-friendly
services plays an important role in the poorer ART
treatment outcomes for adolescents than for adults
receiving ART.138
Initiatives
Towards an AIDS-Free Generation – Children and AIDS: Sixth Stocktaking Report, 2013
Providing lifelong treatment to adolescents, who
may not be adequately served by either paediatric
or adult HIV treatment programmes, presents unique
challenges. Whether they acquired HIV as infants,
due to mother-to-child transmission, or later, through
sexual transmission or injecting drug use, poor
adherence to ART and questions surrounding disclosure of their HIV status are key issues for this age
group.139 In some cases, adolescents may not know
that they are living with HIV, although they may have
been diagnosed and may even be on treatment. For
adolescents who were infected through mother-to-child
transmission, a parent’s concerns about revealing her
or his own HIV status can affect the decision to tell
the adolescent. Navigating sexuality as it unfolds is
challenging for most adolescents, but to also be living
with HIV adds additional complexity and potential
consequences. Aggravating all of these scenarios
is stigma.
Strategies to accelerate
progress in the second
decade of life
Opportunities for greater success in reducing the
impact of HIV on adolescents lie in increasing
demand for, access to and uptake of key interventions, while also addressing the social and economic
factors that heighten adolescents’ vulnerability to
HIV and limit their access to the services they need.
The following five strategies present opportunities for
greater impact among adolescents:
Finding persuasive ways to engage adolescents
When UNICEF, MTV and the United States President’s Emergency Plan for AIDS Relief (PEPFAR) joined
forces to find persuasive ways to engage adolescents and young people on how to protect themselves
from HIV and AIDS, they chose one of the world’s oldest delivery systems: a compelling story. Shuga,
a video and radio drama series that follows young people in both urban and rural settings in Africa
as they go about their daily lives navigating the challenge of HIV risk, soon became the basis for a
multimedia HIV-prevention campaign.
Launched on TV in Kenya in 2009, by 2012 Shuga had been joined by Shuga: Love, Sex, Money,
a radio series heard in six countries – Cameroon, the Democratic Republic of the Congo, Kenya,
Lesotho, South Africa and the United Republic of Tanzania – with a collective audience of young
people estimated at 45 million.
The Shuga radio series has already had an impact on health-seeking behaviours among the young.
While it was being broadcast in the Democratic Republic of the Congo, for instance, eight selected
government and NGO-funded HIV testing and counselling sites in Kinshasa, the largest urban area,
were monitored. Data collected over 12 months showed that the number of adolescents and young
people aged 10–24 receiving voluntary HIV testing and counselling increased 50 per cent following
the launch of the Shuga radio series and its related magazines.
32
© UNICEF/INDA2011-00068/Crouch
1. Scale up HIV testing and counselling for
adolescents and strengthen linkages to
prevention, treatment, care and support
Scaling up HIV testing and counselling services
for adolescents through a variety of testing modalities – such as mobile HIV testing and other forms
of outreach, community-based approaches and
provider-initiated testing and counselling – is essential to addressing late diagnosis and late entry to
care. There are encouraging signs that countries are
reviewing laws related to age of consent for HIV
testing to enable adolescents to come forward. In
Ukraine in 2010, a parental consent law governing
age of consent for HIV testing was lowered from 18 to
14 years, and in Bosnia and Herzegovina, the age
when adolescents can independently provide consent
to HIV testing or seek HIV prevention and care services
has been lowered from 18 to 15. Belarus has lowered
the age to 16 years, with further consideration being
given to lowering it to 14 years. Simultaneously,
existing care and treatment services must be strengthened to ensure that adolescents manage the transition
from paediatric to adult services, adhere to medications and are retained in lifelong care.
The 2013 WHO guidelines on HIV testing and
counselling and care for adolescents living with HIV
propose a comprehensive range of strategies for
scaling up HIV testing and counselling for adolescents
and strengthening linkages to care.140 They include
the recommendation that HIV testing and counselling with linkages to prevention, treatment and care
be offered to adolescents from key populations in
concentrated or low epidemic settings, and to all
adolescents in generalized epidemic settings.
33
Initiatives
Tailoring high-impact interventions to adolescents most in need
The health sector has a particular responsibility to make services more adolescent-friendly. Paediatric
and adult HIV treatment providers need to work together more closely to help adolescents transition
between these services and to link them to long-term treatment, care and support in appropriate
settings, such as primary-care and community-based services.
Many adolescent girls learn their HIV status through testing linked to a pregnancy. Integrating PMTCT
into maternal and child health services is therefore essential to the well-being of adolescent girls living
with HIV, particularly as countries move towards offering lifelong treatment for all pregnant women
living with HIV. Sexual and reproductive health services are important to help prevent unplanned
pregnancies among adolescent girls, and they are also an important platform for the integration of
PMTCT programming. However, more attention is needed to address the quality and acceptability of
HIV-related care for adolescent clients in these settings.
Towards an AIDS-Free Generation – Children and AIDS: Sixth Stocktaking Report, 2013
Initiatives such as the introduction of vaccination for the human papillomavirus (HPV) targeting
adolescent girls aged 9–13 in schools and community settings provide an opportunity for integration
with other sexual and reproductive health interventions for adolescents.
Key populations face discrimination, violence and a wide range of barriers to accessing health
services. Efforts are needed to address low levels of awareness and negative attitudes about these
groups among service providers in health facilities. Community outreach and localized interventions, including targeted approaches to raise awareness and demand for services, are likely to be
more effective and more acceptable to these groups. For instance, Child Helpline International, a
phone-in counselling and referral service operational in more than 140 countries, supports children
and adolescents from a wide range of backgrounds and situations, including key populations, on a
range of health and social issues.141 While the information and referral it provides are critical, the
non-judgemental contact is a service in itself.
2. S
cale up high-impact interventions based
on an investment approach and tailor
them to the needs of adolescents at
highest risk
the structural drivers of HIV vulnerability. Innovative
approaches that increase demand for interventions
and allow for tailoring them effectively to the unique
needs and cultural contexts of adolescents are needed.
The UNAIDS Investment Approach proposes focusing
HIV investments on six high-impact interventions:
condoms, medical male circumcision, targeted
prevention for key populations, PMTCT, ART and
behaviour change communications.142 Investments in
these high-impact interventions should be balanced
with investments in social and programmatic ’critical
enablers‘ to enhance outcomes and in synergistic
development activities that can have an effect on
National AIDS Spending Assessment reports
compiled by UNAIDS in high-burden countries
suggest that overall investment in HIV prevention
for adolescents should be more systematic and
sustained over time.143 New modelling by UNICEF
and Futures Institute to assess the impact of the
UNAIDS Investment Approach on adolescents shows
that substantial gains can be achieved by increasing
spending for this age group in a targeted manner.144
34
Four scenarios were modelled (see Figure 2.5 ).
Scenario 1 is the base scenario and assumes constant
coverage for prevention and treatment through
2020; Scenario 2 is the ideal investment approach
and assumes scale-up of services through 2015;
Scenario 3 is the delayed investment approach and
assumes that coverage targets will be achieved –
but with a five-year delay (i.e., not until 2020); and
Scenario 4 is the poor implementation scenario,
or low investment approach, and assumes lowerthan-ideal coverage targets, achievement of targets
delayed until 2020 and low intervention impact.
The modelling shows that Scenario 2 (the ideal
investment approach) could avert 2 million new
adolescent infections by 2020, half the number of
new infections that would occur in adolescents if
country investment and programme focus remained
unchanged between 2011 and 2020. In addition,
it would reduce the population of adolescents living
with HIV from approximately 2.1 million in 2011 to
about 1.6 million in 2020. The majority of infections
averted would be among females.145
An effective, adolescent-specific HIV response based
on the investment approach would account for
approximately one quarter of any total global AIDS
resource need. Achieving this optimal investment level
would involve increasing adolescent HIV funding in
low- and middle-income countries from slightly more
than US$3.8 billion in 2010 to almost US$5.5 billion
by 2014. After 2015, reductions in new infections
would somewhat reduce the overall funding need.
In addition to the urgent need to scale up highimpact interventions, the modelling suggests that
programming for adolescents requires a stronger
emphasis on critical enablers and development
synergies than programming for adults. Key development synergies for adolescents would come from
the education, child protection, social protection,
justice and health sectors. Following Scenario 2, it
is estimated that 25 per cent of the resources would
need to be allocated for high-impact interventions,
50 per cent for critical enablers and 25 per cent for
development synergies.
figure 2.5
Projected number of new HIV infections among adolescents
aged 10–19 by epidemic type, 2000–2020
S cenario 1 (base): Base projection with constant coverage
of all interventions
S cenario 2 (ideal): All countries scale up services to reach
target levels by 2015
S cenario 3 (delayed): Countries do not achieve coverage
targets until 2020
S cenario 4 (low): Countries do not invest adequately in
adolescent interventions
Hyper-epidemic countries
300,000
250,000
200,000
150,000
100,000
50,000
0
2000
2005
2010
2015
2020
Concentrated epidemic countries
300,000
250,000
200,000
150,000
100,000
50,000
0
2000
2005
2010
2015
2020
Generalized EPIDEMIC countries
300,000
250,000
200,000
150,000
100,000
50,000
0
2000
2005
2010
2015
2020
Source: UNICEF and Futures Institute, ‘The Impact and Cost
of the HIV/AIDS Investment Framework for Adolescents’
(unpublished document).
35
As progress is made, the allocation would shift
to 33 per cent, 25 per cent and 40 per cent,
respectively, by 2020.
Scenario 3 of the modelling, the delayed investment
approach, suggests that a five-year delay in implementation would reduce impact by one third. Poor
implementation, Scenario 4, would result in little
decline in the annual number of new infections.
Striving for the ideal outcomes of Scenario 2 will
require strong leadership and sustained political
commitment to more effective and efficient responses
for adolescents as a priority.
Towards an AIDS-Free Generation – Children and AIDS: Sixth Stocktaking Report, 2013
3. A
ddress root causes of HIV vulnerability
through critical enablers of highimpact HIV services and synergies
with development sectors
The UNAIDS Investment Approach emphasizes
the importance of addressing critical enablers and
engaging and investing strategically across the
development sectors in order to support and sustain
HIV-specific investments. These activities can help
to reduce the legal, social and economic drivers of
adolescent vulnerability to HIV, and they need to
be included in national plans and other strategies
alongside the high-impact interventions.
Critical enablers are activities that optimize
the delivery of high-impact, HIV-specific, basic
programme activities.146 They include implementing
laws and policies to protect human rights and
engaging communities in service delivery and
demand creation. Key critical enablers for adolescents include activities that enhance child rights
consistent with the Convention on the Rights of
the Child and its Optional Protocols, that promote
equality and strengthen laws and law enforcement
practices to reduce stigma and discrimination and
that enhance access to services for key populations.
The interests of other marginalized groups, such as
indigenous, minority or immigrant communities, or
children and adolescents living with disabilities or
36
in institutions or criminal justice settings, can also be
served by attention to critical programme enablers.
Strategies to promote gender equality are essential to
the fight against HIV in adolescents.
Social norms can promote educational advancement,
social engagement and employment, but they can
also limit opportunities for adolescents to thrive and
reach their full potential. Sexual violence, often a
manifestation of gender-related power imbalances,
is directly linked with HIV risk. Research also shows
a correlation between childhood experiences of
violence and later risk behaviours associated with
the acquisition of HIV.147 Intimate partner violence
is also associated with HIV risk.148 A recent global
review found that women who had experienced
intimate partner violence were 50 per cent more
likely to have acquired HIV than women who had
not experienced such violence.149 Social norms also
shape the strategies that girls choose – or that families impose – for coping with poverty, early marriage
and transactional sex.
Human rights-based approaches are essential to
preventing HIV among adolescents from key population groups. These include decriminalization of
homosexuality and emphasizing a public health –
rather than criminal justice – approach to illicit drug
use, including through harm reduction programmes.
Collaboration between the criminal justice and public
health sectors is crucial to supporting the rights of
adolescents who are sexually exploited.
Development synergies are defined as investments
across sectors that can have a positive effect on HIV
outcomes.150 For adolescents, the child protection,
social protection and education sectors present
specific, key opportunities to leverage HIV results
more effectively.
Economic vulnerability and food insecurity are both
causes and consequences of negative outcomes
related to HIV and sexual and reproductive health for
adolescents. Social protection programmes provide
Initiatives
opportunities to address some of the economic drivers
of vulnerability to HIV for children, including adolescents. Cash transfers, food, transport allowances and
other microcredit and savings programmes have been
effective in mitigating the impact of HIV on children and families affected by HIV, and in reducing
HIV-related risk.151 Impacts include better negotiation
skills, increased condom use, a reduction in the
number of sexual partners, delayed sexual debut
in girls and increased uptake of testing, as well as
improved school attendance.152 Rather than concentrating efforts in one sector or another, an integrated
approach is needed to improve health and social
outcomes for adolescents.
Education has sometimes been described as a ‘social
vaccine’, particularly for girls, and there are associations between increased educational access and
reductions in early marriage and pregnancy.153 While
schools offer a key platform for the HIV response in
many countries,154 education systems have not fulfilled
their potential to equip adolescents with the knowledge and skills or the linkages to services that could
help them reduce their risk of acquiring HIV.
Education: A critical part of the enabling environment
The Global School-based Student Health Surveys conducted by WHO with school-aged children in
more than 51 countries to date show that initiation of sexual behaviour commonly happens during
adolescence.155 While school-based programmes alone are not sufficient to prevent new HIV infections
and related risks, they can be a cost-effective way to influence vulnerability.156
Research suggests that HIV education programmes delivered through schools have the potential to
influence determinants of behaviour, children and young peoples’ social networks and, over time,
their socio-economic status.157 Attending school is also related to increased self-confidence that can
enhance children’s ability to protect themselves, as seen in programmes in South Africa and Uganda.
Furthermore, increasing access to and retention in schooling helps prevent HIV infection; this is
especially evident for girls, orphans and other vulnerable children.158
The United Nations Educational, Scientific and Cultural Organization (UNESCO) and other UNAIDS
co-sponsors conducted a review of more than 87 studies globally on the impact of sexuality education programmes.159 More than a third of the programmes reviewed resulted in delayed initiation of
sexual intercourse; about a third decreased the frequency of sexual intercourse; and more than a third
decreased the number of sexual partners, either among the entire sample or in important sub-samples.
While some programmes had little or no effect, notably, none of the programmes hastened the
initiation of sexual intercourse.
The UNAIDS Inter-Agency Task Team on Education’s Accelerate Initiative, led by the World Bank and
technical partners such as the Partnership for Child Development, has supported national government
efforts in 37 sub-Saharan African countries,160 and after more than a decade, in 2010, reached an
important benchmark: all of its countries had national school health policies, with 76 per cent of them
working from education-specific HIV strategies and plans.161
By 2012, an in-depth analysis of 39 countries around the world showed that 74 per cent of them had
included a response to HIV in both education management and planning processes at the national level.162
Advocacy tools and further information on this initiative are available at:
<www.schoolsandhealth.org>.
37
Towards an AIDS-Free Generation – Children and AIDS: Sixth Stocktaking Report, 2013
4. Increase demand for sexual and
reproductive health and HIV-related
services by engaging and
empowering adolescents
The Convention on the Rights of the Child recognizes
the evolving capacities of children in the first and
second decades of life and endorses the principle
that children should participate in decisions affecting
them, in accordance with their evolving capacities.
These sentiments are echoed in a number of forums
and are repeated in Health in the Post-2015 Agenda:
Report of the Global Thematic Consultation on
Health, which states that “adolescents are the next
generation of adults and will have a major influence on the achievement of the post-2015 agenda.
Empowering adolescents in their health development,
including healthy sexual and reproductive health
practices … will enable them to enter adulthood
with stronger overall capabilities, better equipped
to make informed choices for themselves and
their communities.”163
From both a rights and a public health perspective, programmes are more effective when the
intended beneficiaries participate in their design,
implementation and evaluation. All adolescent
programming, as well as activities to support critical enablers and development synergies, needs to
more actively engage and empower adolescents as
38
box
In addition, schools, already faced with the
challenges of keeping adolescents from dropping
out, have typically lacked the policies, trained staff
and necessary engagement with parents and communities to provide sexual and reproductive health
education that is of high quality, age-appropriate
and gender-sensitive. UNESCO, UNICEF, UNAIDS,
WHO and other partners have called for stronger,
practical linkages across sectors to provide sexual
and reproductive health education that addresses
a number of related issues, including harmful social
and gender norms, HIV prevention and prevention
of adolescent pregnancy.
Political Declaration on HIV and AIDS:
United Nations General Assembly, 2011
The United Nations General Assembly’s 2011
Political Declaration on HIV and AIDS calls
on countries to “reaffirm the central role of
the family, bearing in mind that in different
cultural, social and political systems various
forms of the family exist, in reducing vulnerability to HIV, inter alia in educating and
guiding children, and take account of cultural,
religious and ethical factors to reduce the
vulnerability of children and young people
by ensuring access of both girls and boys to
primary and secondary education, including
HIV and AIDS in curricula for adolescents,
ensuring safe and secure environments,
especially for young girls, expanding good
quality youth-friendly information and sexual
health education and counselling services,
strengthening reproductive and sexual health
programmes, and involving families and
young people in planning, implementing and
evaluating HIV and AIDS prevention and
care programmes.”164
full participants in the response to HIV. In 2012, the
Bali Global Youth Forum Declaration placed special
emphasis on marginalized and vulnerable groups
and on creating an enabling environment for their
meaningful participation, in addition to a call for
stronger partnership.165
All over the world, various forms of media are
having a huge impact on social norms, particularly
for adolescents. Across health and development
sectors, new linkages and partnerships are needed
to capitalize on the appeal of media to adolescents,
particularly social media platforms. Technology
and social media offer great potential for engaging
adolescents and empowering them in ways that will
support HIV prevention and treatment objectives.
5. Improve data and strategic information
to inform programming, including
disaggregation by age, sex and
risk behaviours
Because of ethical issues concerning research with
children, most countries do not capture comparable
data for the 10–14 year age group, and data on key
populations of adolescents are even more difficult to
obtain. Similarly, even where they exist, data from
service delivery sites are not always disaggregated
by adolescent age groups, data collection methods
and indicators vary, and the standardization needed
to compare data across countries is lacking.
Sustaining the gains achieved
in the first decade of life
As the international community reflects on the gains
made in the first decade of life – increasing coverage
of interventions to address HIV among infants and
their mothers, and significant results from broader
investments in child survival, growth and development – it cannot continue to neglect the crucial second
decade of life. As adolescents navigate the transition to adulthood, they face unique challenges that
are profoundly linked to their social and economic
vulnerability, unwelcoming health services and the
risks associated with HIV that can only be met through
effective inter-sectoral approaches. A new commitment
to addressing the challenges of the second decade
of life is needed, so that all children – infants, young
children and adolescents alike – have the opportunity
to become healthy, secure and productive adults.
© UNICEF/NYHQ2011-0759/Asselin
Age-, sex- and risk-disaggregated strategic
information is urgently needed in order to capitalize
on the approaches described in this chapter and
respond more effectively to the needs of adolescents. Planning for the scale-up of adolescent ART,
for example, requires an accurate, disaggregated
estimate of the number of adolescents eligible for
treatment, based on the latest WHO guidelines,
as well as actual coverage data from services and
accurate estimates of the costs of services and
commodities. Similar estimates need to be generated
for the numbers of adolescent key populations and
other core interventions. This requires epidemiological, programmatic and operational research to make
service delivery as effective and acceptable for as
many adolescent communities as possible.
39
chapter 3
An AIDS-free generation will be
achieved only with strong leadership
from government and strong
participation from civil society.
© UNICEF/ZIMA2011-00003/Pirozzi
Towards an AIDS-Free Generation – Children and AIDS: Sixth Stocktaking Report, 2013
Partnerships
for an
AIDS-free
generation
40
41
Two decades, many sectors
Shaping and driving the HIV response for children
is not the responsibility of any one actor. Working
across the first two decades of life with strong partnerships within and between sectors has never been
more critical.
An AIDS-free generation will be achieved only
with strong leadership from government, particularly national AIDS commissions and ministries of
health, as well as parliamentarians, law enforcement authorities and child protection agencies. It
requires the active involvement of other ministries
(such as finance, social welfare, education and
youth) and local government, and strong participation from civil society, including non-governmental,
faith-based and community-based organizations.
Working with affected communities, including
people living with HIV, women, young people and
their advocates, these partnerships will be central
not only to implementation but also to advocacy,
awareness raising and shared accountability. At the
local level, community compacts and charters are
useful mechanisms.
Regional bodies have been very active in most parts
of the world, and regional initiatives have introduced new ways of doing business. For instance,
the Laços Sul-Sul (South-South Ties) initiative has a
strong human rights focus, uniting eight participant
countries (Bolivia, Brazil, Cabo Verde, Guinea-Bissau,
Nicaragua, Paraguay, Sao Tome and Principe,
and Timor-Leste) towards the goal of halting the
”
This report reminds us that an AIDS-free generation is one in which all
children are born free of HIV and remain so – from birth and throughout
Towards an AIDS-Free Generation – Children and AIDS: Sixth Stocktaking Report, 2013
their lives – and it means access to treatment for all children living with
HIV. It also reminds us that women’s health and well-being should be at
the centre of the AIDS response. I have no doubt that we will achieve
these goals. The well-being of children does not end with stopping
AIDS, but includes protecting children from the factors that make them
vulnerable, such as poverty, discrimination and social marginalization,
and violations of their human rights, including sexual violations. HIV
is fuelled by a variety of factors that are acute during childhood and
adolescence, and children need information and opportunities to allow
them the best possible start in life.”
Michel Sidibé, Executive Director, UNAIDS
42
strengthened domestic allocations for programming,
will be central to future success, as will expanded
partnership with health-care providers, researchers
and the private sector, all of whom have critical roles
to play.
At the international level, reporting requirements often
provide the most powerful advocacy material. At
all levels, transparency around data and financing
can help to create and sustain commitments and
shared responsibility. Ongoing commitment from key
partners such as the Global Fund and PEPFAR, and
The Interagency Task Team on the Prevention and
Treatment of HIV Infection in Pregnant Women,
Mothers and Children167 plays a leading role in
supporting country-led implementation of the Global
Plan. The core mandate of the group is to coordinate technical assistance, develop and disseminate
box
AIDS epidemic by sharing information, strategies
and action plans, and fostering solidarity. In Africa a
new Roadmap on Shared Responsibility and Global
Solidarity for AIDS, TB and Malaria in Africa was
endorsed at the 19th Summit of the African Union in
2012. Developed by the African Union Commission
and the New Partnership for Africa’s Development
(NEPAD) Planning and Coordinating Agency, the
roadmap is structured around three strategic pillars –
health governance, diversified financing and access
to medicines. It offers a set of practical and Africanowned solutions to enhance sustainable responses
to AIDS, TB and Malaria, with goals, expected
results, roles and responsibilities to hold stakeholders
accountable over a three-year time frame, through
2015; and it emphasizes finding new partnerships,
new financing arrangements and new ways to
strengthen sustainable African institutions.
All UNAIDS co-sponsoring agencies, spanning
multiple sectors, have significant responsibilities
across the first and second decades, both in directly
supporting the implementation of high-impact interventions and in helping to create enabling legal,
social and economic environments for children and
their families.
Several interagency task teams (IATTs) are operational
to support progress in countries.166 These task teams
consist of UNAIDS co-sponsor organizations as well
as policy and technical partner organizations.
Global Commission on HIV and the Law
In its Risks, Rights and Health report, the Global Commission on HIV and the Law, facilitated by the
United Nations Development Programme (UNDP), calls for the removal of discriminatory laws, policies
and practices affecting people living with HIV and for the promotion of laws grounded in human rights
and backed by evidence. The report, released in 2012, outlines how laws that protect human rights
save lives, save money and lead to effective HIV responses. The report includes specific recommendations for children and adolescents. Responding to this call entails helping countries implement laws that
prohibit discrimination against children affected by AIDS at school, at home and in their communities;
promote appropriate family-centred care models for children orphaned by AIDS; promote access to
comprehensive sexuality health education for children in and out of school; and ensure that sexually
active young people have confidential and independent access to health services. Working with a
range of partners, UNICEF helps countries align this work with their reporting obligations as States
Parties to the Convention on the Rights of the Child.168
Risks, Rights and Health, Global Commission on HIV and the Law, July 2012,
<www.hivlawcommission.org> and <www.undp.org>.
43
© UNICEF Mozambique/2013
Towards an AIDS-Free Generation – Children and AIDS: Sixth Stocktaking Report, 2013
guidance and tools, and track progress towards
the targets of the Global Plan. While the Global
Plan is chaired by UNAIDS and PEPFAR, the IATT
is co-convened by UNICEF and WHO. Established
in 1998, it comprises 32 multilateral, government
and non-governmental organizations working
towards strengthening global, regional and national
partnerships and programmes that address the
survival of pregnant women, mothers and children
living with HIV.
Addressing HIV among
children in emergency
situations: a case for
enhanced partnership
In 2012, children younger than 18 years constituted
46 per cent of the 45.2 million people who were
forcibly displaced worldwide as a result of persecution, conflict, generalized violence and human rights
violations. Over the past decade, this proportion has
ranged from a low of 41 per cent in 2009 to a high
of 50 per cent in 2004.169
As social structures break down in emergency and
humanitarian situations, food insecurity, violence,
sexual assault, poverty and issues related to protection exacerbate existing risks and vulnerabilities to
44
HIV, particularly for adolescent girls and women.
In many emergency settings, substantial challenges
also exist in sustaining access to information – such
as health records – and health services, including
ART, PMTCT and maternal and child health services.
Ensuring continuity of ARVs and other commodities
in unstable situations is of peak concern, as are
efforts to sustain HIV prevention, including access to
condoms and post-exposure prophylaxis. Given the
uncertainty of the duration of most emergencies and
the propensity for protracted humanitarian situations,
HIV prevention, treatment and care for both younger
children and adolescents should be included in emergency risk assessment, preparedness and training
from the very beginning.
Disruptions in HIV treatment are a clear risk in
emergency situations. In Mozambique, for example,
flooding in Gaza Province in early 2013 left more
than 12,000 people at risk of losing access to
treatment.170 As a result of the flooding, health
centres closed and stocks of medication were ruined;
transportation routes became inaccessible, initially
resulting in a temporary shortage of commodities
such as ARVs, post-exposure prophylaxis kits and
condoms. Through partnerships between government
ministries – including the National Institute of Disaster
Management, the Ministry of Health, the National
AIDS Commission, NGOs and United Nations agencies – routine services were restored. Looking to the
future, specific training sessions are being carried
out in the two provinces with the highest risk of
natural disasters and a high HIV burden (Gaza and
Zambezia), and contingency plans are being developed to prepare the government and partners for an
adequate HIV response in future emergencies.
The recent escalation of conflict in the Central African
Republic, resulting in insecurity, violence, looting and
robberies, is the latest in a serious of crises that have
affected the country since the mid-1990s. Since early
2013, tens of thousands of people have fled into the
bush or been further displaced. Several hospitals and
health posts have been looted and many have been
abandoned. Displacement and disruption of health
Initiatives
Adolescents and HIV in emergencies
Emergency situations can both increase the
factors that make young people vulnerable
to HIV and disrupt vital HIV prevention,
treatment and care services.
Although Haiti and Côte d’Ivoire are
thousands of miles apart and faced emergencies with very different causes – one
geological, the other political – a retrospective analysis of these two emergencies found
that the outcomes for adolescents and young
people were virtually the same. Among the
lessons learned were the necessity of:
• ensuring a focus on adolescents when
directing interventions, and including
younger adolescent girls
• involving adolescents and youth as
participants in interventions, to ensure
that their ideas and perspectives are
given adequate consideration
• understanding the ways in which
emergencies increase the factors that
make young people vulnerable to HIV.
The analysis underscores the urgency of
putting interventions for adolescents in
place long before actual emergencies occur.
Preparation is crucial; without it, countries
risk rushing to catch up to the needs of
adolescents and young people amid the
challenges of an emergency setting.
services has left many people living with HIV without
access to ARVs. Before the recent crisis, up to 15,000
people living with HIV were on ART and an estimated
further 50,000 eligible for treatment could not be
covered. The number of patients whose antiretroviral therapy was interrupted by the crisis has been
estimated in the thousands by the Comité national
de lutte contre le SIDA. A well-coordinated response
by humanitarian and health actors is under way to
retrace patients lost to ART and ensure the provision
of the minimum package for HIV as outlined by the
Inter-Agency Standing Committee’s (IASC) Guidelines
for HIV Interventions in Humanitarian Settings.171
Towards an
AIDS-free generation:
Addressing gaps,
sustaining gains
Children did not feature prominently on the global
AIDS agenda in 2001 when the MDGs were established and the first United Nations General Assembly
Special Session on HIV/AIDS was held. Both of
those events have since served as a major driver
of change, leading to the creation of the Global
Fund and PEPFAR and an extraordinary global
effort to mount a more effective response to the HIV
pandemic. Significant gains have been made in
reducing new infections among infants and keeping
their mothers alive and healthy. However, similar
dynamism must be applied to narrow the persistent
gaps in programmes for orphans and vulnerable
children, in care and treatment for children and
adolescents, and in wider adolescent programming.
This report describes the substantial challenges
that persist in addressing HIV among children, as
well as important new opportunities to tackle them.
As the international community begins to coalesce
around a new development agenda beyond 2015,
an enhanced response to HIV among children
can help to serve as a driver of further gains and
more effective collaborations in child rights, health,
survival and development.
The path to an AIDS-free generation is clear. If it is to
be successfully travelled, the world must now strongly
commit to sustaining the hard-won gains and to
addressing the remaining inequities and gaps in the
response to HIV for children.
45
references
Country economies are classified according to per capita gross
national income, calculated using the World Bank Atlas method.
The classifications as at 1 July 2013 were: low income, $1,035
or less; lower middle income, $1,036 to $4,085; and upper
middle income, $4,086 to $12,615.
United Nations Children’s Fund and Economic Policy Research
Institute, New York and Cape Town, July 2012.
1
2
3
Joint United Nations Programme on HIV/AIDS, Global Report:
UNAIDS report on the global AIDS epidemic 2013, UNAIDS,
Geneva, 2013, pp. 6, 39.
The 22 priority countries of the Global Plan are: Angola,
Botswana, Burundi, Cameroon, Chad, Côte d’Ivoire, Democratic
Republic of the Congo, Ethiopia, Ghana, India, Kenya, Lesotho,
Malawi, Mozambique, Namibia, Nigeria, South Africa,
Swaziland, Uganda, United Republic of Tanzania, Zambia and
Zimbabwe. India is the only priority country outside Africa. Joint
United Nations Programme on HIV/AIDS, Countdown to Zero:
Global Plan Towards the Elimination of New HIV Infections
Among Children by 2015 and Keeping Their Mothers Alive,
UNAIDS, Geneva, 2011; and UNICEF analysis of UNAIDS
2012 HIV and AIDS estimates.
Joint United Nations Programme on HIV/AIDS, Countdown to
Zero: Global Plan Towards the Elimination of New HIV Infections
Among Children by 2015 and Keeping Their Mothers Alive,
UNAIDS, Geneva, 2011; and UNICEF analysis of UNAIDS
2012 HIV and AIDS estimates. The numbers in parentheses
indicate the uncertainty ranges around the estimates.
4
World Health Organization, Consolidated Guidelines on the Use
of Antiretroviral Drugs for Treating and Preventing HIV Infection:
Recommendations for a public health approach, WHO,
Geneva, 2013.
Towards an AIDS-Free Generation – Children and AIDS: Sixth Stocktaking Report, 2013
5
6
Joint United Nations Programme on HIV/AIDS, Global Report:
UNAIDS report on the global AIDS epidemic 2013, UNAIDS,
Geneva, 2013, pp. A87, A94.
7
Newell, Marie Louise, et al., ‘Mortality of Infected and
Uninfected Infants Born to HIV-Infected Mothers in Africa:
A pooled analysis’, The Lancet, vol. 364, no. 9441,
2 October 2004, pp. 1236–1243.
14
Joint United Nations Programme on HIV/AIDS, Countdown to
Zero: Global Plan towards the Elimination of New HIV Infections
among Children by 2015 and Keeping Their Mothers Alive,
UNAIDS, Geneva, 2011, p. 6.
15
The 22 priority countries of the Global Plan are: Angola,
Botswana, Burundi, Cameroon, Chad, Côte d’Ivoire, Democratic
Republic of the Congo, Ethiopia, Ghana, India, Kenya, Lesotho,
Malawi, Mozambique, Namibia, Nigeria, South Africa,
Swaziland, Uganda, United Republic of Tanzania, Zambia and
Zimbabwe. India is the only priority country outside Africa. Joint
United Nations Programme on HIV/AIDS, Countdown to Zero:
Global Plan Towards the Elimination of New HIV Infections
Among Children by 2015 and Keeping Their Mothers Alive,
UNAIDS, Geneva, 2011.
16
World Health Organization, Rapid Advice: Use of antiretroviral
drugs for treating pregnant women and preventing HIV infection
in infants, WHO, Geneva, June 2010, p. 4.
17
UNAIDS 2012 HIV and AIDS estimates.
18
De Cock, Kevin M., et al., ‘Prevention of Mother-to-Child HIV
Transmission in Resource Poor Countries: Translating research
into policy and practice’, Journal of the American Medical
Association, vol. 283, no. 9, 1 March 2000, pp. 1175–1182.
19
Joint United Nations Programme on HIV/AIDS, Global Report:
UNAIDS report on the global AIDS epidemic 2013, UNAIDS,
Geneva, 2013, p. 38.
20
Interagency Task Team on the Prevention and Treatment of HIV
Infection in Pregnant Women, Mothers and Children, ‘Regional
Workshops on Costing of National Plans to Eliminate Motherto-Child Transmission of HIV (eMTCT): Technical report and
workshop recommendations’, Interagency Task Team on the
Prevention and Treatment of HIV Infection in Pregnant Women,
Mothers and Children, New York, 30 November 2012.
21
UNAIDS, UNICEF, WHO, 2013 Global AIDS Response Progress
Reporting, and UNAIDS 2012 HIV and AIDS estimates.
8
UNAIDS 2012 HIV and AIDS unpublished estimates.
22
9
UNICEF analysis of UNAIDS 2012 HIV and AIDS estimates.
Ibid.
23
Joint United Nations Programme on HIV/AIDS, Global Report:
UNAIDS report on the global AIDS epidemic 2013, UNAIDS,
Geneva, 2013. See country annexes.
24
United Nations Children’s Fund, Children and AIDS: A profile
of UNICEF’s response in East Asia and Pacific, 2007, UNICEF,
Bangkok, 2010; Pan American Health Organization, 2012
Progress Report: Elimination of mother-to-child transmission
of HIV and congenital syphilis in the Americas, PAHO,
Washington, D.C., 2013; and unpublished 2012 UNAIDS data.
25
National Committee for AIDS, Drugs, and Prostitution Prevention
and Control, Viet Nam AIDS Response Progress Report 2012:
Following up the 2011 Political Declaration on HIV/AIDS –
Reporting period: January 2010–December 2011, Government
of Viet Nam, Hanoi, March 2012, p. 43.
26
Ministry of Health & Family Welfare, ‘A Strategic Approach
to Reproductive, Maternal, Newborn, Child and Adolescent
Health (RMNCH+A) in India: For healthy mother and child’,
Government of India, New Delhi, February 2013, p. 18.
10
11
Baral, Stefan, et al., ‘HIV Risk and Associations of HIV Infection
among Men Who Have Sex with Men in Peri-Urban Cape Town,
South Africa’, BMC Public Health, vol. 11, no. 1, 5 October
2011, pp. 766–773; and Fay, Heather, et al., ‘Stigma, Health
Care Access, and HIV Knowledge among Men Who Have Sex
with Men in Malawi, Namibia, and Botswana’, AIDS Behaviour,
vol. 15, no. 6, August 2011, pp. 1088–1097.
Institute of Medicine of the National Academies, ‘Summary
Evaluation of PEPFAR’, Report brief, National Academies Press,
Washington, D.C., February 2013; and Miller, Elizabeth,
and Michael Samson, ‘HIV-Sensitive Social Protection: State of
the evidence 2012 in Sub-Saharan Africa’, United Nations
Children’s Fund and Economic Policy Research Institute,
New York and Cape Town, July 2012.
12
UNAIDS 2012 HIV and AIDS unpublished estimates.
13
Miller, Elizabeth, and Michael Samson, ‘HIV-Sensitive Social
Protection: State of the evidence 2012 in Sub-Saharan Africa,
46
27
Joint United Nations Programme on HIV/AIDS, Global Report:
UNAIDS report on the global AIDS epidemic 2013, UNAIDS,
Geneva, 2013, pp. 42, A87.
28
Joint United Nations Programme on HIV/AIDS, 2013 Progress
Report on the Global Plan Towards the Elimination of New HIV
Infections Among Children by 2015 and Keeping Their Mothers
Alive, UNAIDS, Geneva, June 2013, pp. 12–13.
World Health Organization, Consolidated Guidelines on the
Use of ARV Drugs for Treating and Preventing HIV Infection:
Recommendations for a public health approach, WHO,
Geneva, June 2013.
29
30
Joint United Nations Programme on HIV/AIDS, Global Report:
UNAIDS report on the global AIDS epidemic 2013, UNAIDS,
Geneva, 2013, p. 38.
UNAIDS 2012 HIV and AIDS estimates.
31
32
Ibid.
33
UNICEF analysis of UNAIDS 2012 HIV and AIDS estimates.
34
Ibid.
35
Pan American Health Organization, 2012 Progress Report:
Elimination of mother-to-child transmission of HIV and congenital
syphilis in the Americas, PAHO, Washington, D.C., 2013.
36
37
Thai National Coalition on AIDS, Ministry of Public Health and
Thai Department of Disease Control, ‘Thailand AIDS Progress
Report 2012: Status at a glance’, Government of Thailand,
Bangkok, March 2012.
Joint United Nations Programme on HIV/AIDS, ‘2012 Progress
Reports Submitted by Countries’, UNAIDS, Geneva,
<www.unaids.org/en/dataanalysis/knowyourresponse/
countryprogressreports/2012countries>, accessed
27 August 2013.
38
World Health Organization Regional Office for Europe,
European Action Plan for HIV/AIDS 2012–2015, WHO Europe,
Copenhagen, 2011.
39
Srikantiah, Padmini, Elimination of New Paediatric HIV
Infections and Congenital Syphilis in Asia-Pacific 2011–
2015: Conceptual framework – Monitoring and evaluation
guide, United Nations Children’s Fund East Asia and Pacific
Regional Office, Bangkok, Thailand, August 2011; and World
Health Organization, ‘Elimination of Congenital Syphilis:
Regional updates’, WHO, Geneva, 2013, <www.who.int/
reproductivehealth/topics/rtis/cs_regional_updates/en/index.
html>, accessed 20 August 2013.
40
International AIDS Society, ‘Measuring Effectiveness of
the National PMTCT Programme and Validating EMTCT:
Towards elimination of mother-to-child transmission of HIV’,
XIX International AIDS Conference, Washington, D.C.,
22–27 July 2012, <http://pag.aids2012.org/session.
aspx?s=50>, accessed 20 August 2013.
41
Newell, Marie Louise, et al., ‘Mortality of Infected and
Uninfected Infants Born to HIV-Infected Mothers in Africa:
A pooled analysis’, The Lancet, vol. 364, no. 9441,
2 October 2004, pp. 1236–1243.
42
World Health Organization, United Nations Children’s Fund and
Joint United Nations Programme on HIV/AIDS, Global Update
on HIV Treatment 2013: Results, impact and opportunities,
WHO, Geneva, June 2013, p. 13.
43
Joint United Nations Programme on HIV/AIDS, Global Report:
UNAIDS report on the global AIDS epidemic 2013, UNAIDS,
Geneva, 2013, pp. A87, A94.
44
UNAIDS, UNICEF, WHO, 2013 Global AIDS Response Progress
Reporting and UNAIDS 2012 HIV and AIDS estimates.
45
UNAIDS, UNICEF, WHO, 2013 Global AIDS Response Progress
Reporting and UNAIDS 2012 HIV and AIDS estimates.
46
Joint United Nations Programme on HIV/AIDS, 2013 Progress
Report on the Global Plan Towards the Elimination of New HIV
Infections among Children by 2015 and Keeping Their Mothers
Alive, UNAIDS, Geneva, June 2013. See country annexes.
47
World Health Organization, United Nations Children’s Fund and
Joint United Nations Programme on HIV/AIDS, Global Update
on HIV Treatment 2013: Results, impact and opportunities,
WHO, Geneva, June 2013, p. 60.
48
Ibid., p. 30.
49
World Health Organization, WHO Recommendations on the
Diagnosis of HIV Infection in Infants and Children, WHO,
Geneva, 2010.
50
UNAIDS, UNICEF, WHO, 2013 Global AIDS Response Progress
Reporting, and UNAIDS 2012 HIV and AIDS estimates.
51
Ibid.
52
Lesotho data are for 2011; 2012 data were unavailable.
UNAIDS, UNICEF, WHO, 2013 Global AIDS Response Progress
Reporting, and UNAIDS 2012 HIV and AIDS estimates.
53
54
Joint United Nations Programme on HIV/AIDS, Global Report:
UNAIDS report on the global AIDS epidemic 2013, UNAIDS,
Geneva, 2013, pp. 48, A94.
55
The World Health Organization defines task shifting or task
sharing as “the rational re-distribution of tasks among health
workforce teams. Specific tasks are moved, where appropriate,
from highly qualified health workers to health workers who
have fewer qualifications in order to make more efficient use
of the available human resources for health.” World Health
Organization, Task Shifting: Rational redistribution of tasks
among health workforce teams – Global recommendations and
guidelines, WHO, Geneva, 2008.
56
World Health Organization, Consolidated Guidelines on the
Use of ARV Drugs for Treating and Preventing HIV Infection:
Recommendations for a public health approach, WHO,
Geneva, June 2013.
57
Joint United Nations Programme on HIV/AIDS, 2013 Progress
Report on the Global Plan Towards the Elimination of New HIV
Infections by 2015 and Keeping Their Mothers Alive, UNAIDS,
Geneva, June 2013, p. 9.
58
Joint United Nations Programme on HIV/AIDS, Global Report:
UNAIDS report on the global AIDS epidemic 2013, UNAIDS,
Geneva, 2013, p. 41.
United Nations Population Fund, Preventing HIV and Unintended
Pregnancies: Strategic framework 2011–2015 – In support of
the Global Plan Towards the Elimination of New HIV Infections
Among Children by 2015 and Keeping Their Mothers Alive,
UNAIDS, New York, 2012.
59
60
Alkema, Leontine, et al., ‘National, Regional and Global Rates
and Trends in Contraceptive Prevalence and Unmet Need
for Family Planning between 1990 and 2015: A systematic
and comprehensive analysis’, The Lancet, vol. 11, no. 381,
11 May 2013, pp. 1642–1652.
61
Joint United Nations Programme on HIV/AIDS, Global Report:
UNAIDS report on the global AIDS epidemic 2013, UNAIDS,
Geneva, 2013, pp. 41–42.
47
62
Family Planning 2020, ‘Family Planning 2020’, Bill &
Melinda Gates Foundation, Seattle (WA), 2012,
<www.familyplanning2020.org>, accessed 16 August 2013.
63
Nair, Pooja, ‘Litigating against the Forced Sterilization of
HIV-Positive Women: Recent developments in Chile and
Namibia’, Harvard Human Rights Journal, vol. 23, no. 1, 2010,
pp. 223–231; and Center for Reproductive Rights and Vivo
Positivo, ‘Dignity Denied: Violations of the right to HIV-positive
women in Chilean health facilities’, Center for Reproductive
Rights, New York, 2010, <www.genderandaids.org/index
.php?option=com_content&view=article&id=861:
dignity-denied-violations-of-the-rights-of-hiv-positive-womeninchilean-health-facilities&catid=38:latin-america-and-thecaribbean&Itemid=118>.
64
65
66
Using Injecting Drugs in Ukraine, 2000–10’, Addiction,
vol. 107, no. 1, 1 January 2012, pp. 118–128.
73
Ibid; and Adelekan, Moruf L., ‘Substance Use, HIV Infection
and the Harm Reduction Approach in Sub-Saharan
Africa’, International Journal of Drug Policy, vol. 9, no. 5,
1 October 1998, pp. 315–323.
74
United Nations Office on Drugs and Crime, ‘Women and HIV
in Prison Settings’, Policy brief, UNODC, Vienna, Austria,
2008, p. 1; and United Nations Office on Drugs and Crime,
International Labour Organization, United Nations Development
Programme, World Health Organization and United Nations
Joint Programme on HIV/AIDS, ‘Policy Brief: HIV prevention,
treatment, and care in prisons and other closed settings –
A comprehensive package of interventions’, UNODC, Vienna,
June 2013, p. 1.
75
Chimbwandira, Frank, et al., ‘Impact of an Innovative Approach
to Prevent Mother-to-Child Transmission of HIV: Malawi,
July 2011 to September 2012’, Morbidity and Mortality Weekly
Report, vol. 62, no. 8, 1 March 2013, pp. 148–151.
Kali, Paula B. N., et al., ‘Combining PMTCT with Active Case
Finding for Tuberculosis’, Journal of Acquired Immune Deficiency
Syndromes, vol. 42, no. 3, July 2006, pp. 379–381; and
World Health Organization, WHO Policy on Collaborative TB/
HIV Activities: Guidelines for national programmes and other
stakeholders, WHO, Geneva, 2012.
76
Ibid; and World Health Organization, United Nations Children’s
Fund and Joint United Nations Programme on
HIV/AIDS, Global Update on HIV Treatment 2013: Results,
impact and opportunities, WHO, Geneva, June 2013, p. 27.
Gupta, Amita, et al., ‘Maternal Tuberculosis: A risk factor
for mother-to-child transmission of human immunodeficiency
virus’, Journal of Infectious Diseases, vol. 203, no. 3,
1 February 2011, pp. 358–362.
77
World Health Organization, Guidelines for Intensified
Tuberculosis Case-Finding and Isoniazid Preventive Therapy
for People Living with HIV in Resource-Constrained Settings,
WHO, Geneva, 2011; and Patel, M. R., et al., ‘Outcomes of
Integrated Treatment for Tuberculosis and HIV in Children at the
Primary Health Care Level’, International Journal of Tuberculosis
and Lung Disease, vol. 17, no. 9, 1 September 2013,
pp. 1206–1211.
78
World Health Organization, Consolidated Guidelines on the Use
of Antiretroviral Drugs for Treating and Preventing HIV Infection:
Recommendations for a public health approach, WHO,
Geneva, 2013.
79
Weigel, Ralf, et al., ‘Managing HIV-Infected Children in a
Low-Resource, Public Clinic: A Comparison of Nurse vs. Clinical
Officer Practices in ART Refill, Calculation of Adherence and
Subsequent Appointments’, Journal of the International AIDS
Society, vol. 15, no. 2, 17 August 2012; Cohen, Rachel, et
al., ‘Antiretroviral Treatment Outcomes from a Nurse-Driven,
Community-Supported HIV/AIDS Treatment Programme in Rural
Lesotho: Observational cohort assessment at two years’, Journal
of the International AIDS Society, vol. 12, 8 October 2009;
and Van Griensven, Johan, et al., ‘Success with Antiretroviral
Treatment for Children in Kigali, Rwanda: Experience with health
center/nurse-based care’, BMC Pediatrics, vol. 8, no. 1, 2
October 2008.
80
Kredo, Tamara, et al., ‘Decentralising HIV Treatment in
Lower- and Middle-Income Countries’, Cochrane Database
of Systematic Reviews, no. 6, 27 June 2013; Government of
Rwanda, International Planned Parenthood Federation, Joint
United Nations Programme on HIV/AIDS, United Nations
Population Fund and World Health Organization, ‘Linking
Sexual and Reproductive Health and HIV: Gateways to integration – A case study from Rwanda – A glimpse of the future
– Eliminating new HIV infections among children and keeping
their mothers alive’, Government of Rwanda, IPPF, UNAIDS,
UNFPA and WHO, Rwanda, 2013, p. 13; Ong’ech, John O.,
et al., ‘Provision of Services and Care for HIV-Exposed Infants:
World Health Organization, Consolidated Guidelines on the Use
of Antiretroviral Drugs for Treating and Preventing HIV Infection:
Recommendations for a public health approach, WHO,
Geneva, 2013.
World Health Organization, Consolidated Guidelines on
the Use of Antiretroviral Drugs for Treating and Preventing
HIV Infection: Recommendations for a public health approach,
WHO, Geneva, 2013, p. 35.
67
Towards an AIDS-Free Generation – Children and AIDS: Sixth Stocktaking Report, 2013
68
Ministry of Health & Family Welfare, ‘A Strategic Approach
to Reproductive, Maternal, Newborn, Child and Adolescent
Health (RMNCH+A) in India: For healthy mother and child’,
Government of India, New Delhi, February 2013, p. 21;
and Government of Rwanda, International Planned
Parenthood Federation, Joint United Nations Programme on
HIV/AIDS, United Nations Population Fund and World Health
Organization, ‘Linking Sexual and Reproductive Health and HIV:
Gateways to integration – A case study from Rwanda –
A glimpse of the future – Eliminating new HIV infections among
children and keeping their mothers alive’, Government of Rwanda,
IPPF, UNAIDS, UNFPA and WHO, Rwanda, 2013, p. 13.
69
World Health Organization, Consolidated Guidelines on the Use
of Antiretroviral Drugs for Treating and Preventing HIV Infection:
Recommendations for a public health approach, WHO,
Geneva, 2013, p. 108.
70
Filteau, Suzanne, ‘The HIV-Exposed, Uninfected African Child’,
Tropical Medicine & International Health, vol. 14, no. 3,
March 2009, pp. 276–287; Marinda, Edmore, et al., ‘Child
Mortality according to Maternal and Infant HIV Status in
Zimbabwe’, Pediatric Infectious Disease Journal, vol. 26, no. 6,
June 2007, pp. 519–526; and Landes, Megan, et al., ‘Mortality
and Health Outcomes of HIV-Exposed and Unexposed Children
in a PMTCT Cohort in Malawi’, PloS One, vol. 7, no. 10,
October 2012, pp. 1–7.
71
World Health Organization, Consolidated Guidelines on the Use
of Antiretroviral Drugs for Treating and Preventing HIV Infection:
Recommendations for a public health approach, WHO,
Geneva, 2013.
72
Thorne, Claire, et al., ‘Prevention of Mother-to-Child Transmission
of Human Immunodeficiency Virus among Pregnant Women
48
A comparison of maternal and child health clinic and HIV
comprehensive care clinic models’, Journal of Acquired Immune
Deficiency Syndromes, vol. 61, no. 1, 1 September 2012,
pp. 83–89; and Bolton-Moore, Carolyn, et al., ‘Clinical
Outcomes and CD4 Cell Response in Children Receiving
Antiretroviral Therapy at Primary Health Care Facilities in
Zambia’, Journal of the American Medical Association,
vol. 298, no. 16, 24 October 2007, pp. 1888–1899.
81
International Labour Organization, ‘Outcome 8: The world
of work responds effectively to the HIV/AIDS epidemic’,
ILO, Geneva, 2012, <www.ilo.org/public/english/bureau/
program/download/pdf/10-11/iroutcome8.pdf>, accessed
22 August 2013; and International Labour Organization,
Report of the Director-General: ILO programme implementation
2008–2009, ILO, Geneva, 2012, pp. 85–86.
82
Government of Rwanda, International Planned Parenthood
Federation, Joint United Nations Programme on HIV/AIDS,
United Nations Population Fund and World Health Organization,
‘Linking Sexual and Reproductive Health and HIV: Gateways to
integration – A case study from Rwanda – A glimpse of the
future – Eliminating new HIV infections among children and
keeping their mothers alive’, Government of Rwanda, IPPF,
UNAIDS, UNFPA and WHO, Rwanda, 2013, p. 13.
83
Rollins, Nigel, et al., ‘Universal HIV Testing of Infants at
Immunization Clinics: An acceptable and feasible approach for
early infant diagnosis in high HIV prevalence settings’, AIDS,
vol. 23, no. 14, 10 September 2009, pp. 1851–1857.
84
World Health Organization, United Nations Children’s Fund,
United Nations Population Fund and World Bank, Trends in
Maternal Mortality: 1990 to 2010 – WHO, UNICEF, UNFPA
and the World Bank estimates, WHO, Geneva, 2012, p. 25.
85
United Nations Children’s Fund, Committing to Child Survival:
A promise renewed – Progress report 2013, UNICEF, New York,
September 2013, p. 7.
86
World Health Organization, Accountability for Maternal,
Newborn & Child Survival: The 2013 update, WHO, Geneva,
2013, p. 7.
87
UNAIDS, UNICEF, WHO, 2013 Global AIDS Response Progress
Reporting, and UNAIDS 2012 HIV and AIDS estimates.
Children’s Fund and Economic Policy Research Institute,
New York and Cape Town, July 2012.
91
UNAIDS 2012 HIV and AIDS unpublished estimates.
92
UNICEF analysis of UNAIDS 2012 HIV and AIDS estimates.
93
Garcia, Marito, and Charity M. T. Moore, The Cash Dividend:
The rise of cash transfer programs in Sub-Saharan Africa, World
Bank Publications, Washington D.C., February 2012.
94
Miller, Elizabeth, and Michael Samson, ‘HIV-Sensitive Social
Protection: State of the evidence 2012 in Sub-Saharan Africa’,
United Nations Children’s Fund and Economic Policy Research
Institute, New York and Cape Town, July 2012; United Nations
Development Programme and Joint United Nations Programme
on HIV/AIDS, Understanding and Acting on Critical Enablers and
Development Synergies for Strategic Investments, UNDP, New
York, 2012, pp. 5, 19; United Nations Educational, Scientific
and Cultural Organization, Good Policy and Practice in HIV and
Health Education: Booklet 7 – Gender equality, HIV and education, UNESCO, Paris, 2012, pp. 35–43; Erulkar, Annabel, et al.,
‘Tap and Reposition Youth (TRY): Providing social support, savings,
and microcredit opportunities for young women in areas with
high HIV prevalence’, SEEDS Pamphlet Series, vol. 23, Population
Council, New York, 23 November 2006; Vincent, Katharine,
and Tracy Cull, ‘Impacts of Social Cash Transfers: Case study
evidence from across southern Africa’, Second Conference of
the IESE: Poverty Dynamics and Economic Accumulation Patterns
in Mozambique, Maputo, 22–23 April 2009, Regional Hunger
and Vulnerability Program, Johannesburg, South Africa, 2009;
and Baird, Sarah J., et al., ‘Effect of a Cash Transfer Programme
for Schooling on Prevalence of HIV and Herpes Simplex Type
2 in Malawi: A cluster randomised trial, The Lancet, vol. 379,
no. 9823, 7 April 2012, pp. 1320–1329.
95
This work is supported by the Hilton Foundation and UNICEF.
96
Ministry of Health and Family Welfare. ‘A Strategic Approach
to Reproductive, Maternal, Newborn, Child and Adolescent
Health (RMNCH+A) in India: For healthy mother and child’,
Government of India, New Delhi, February 2013, p. 21.
97
Kim, Maria H., et al., ‘The Tingathe Program: A pilot intervention
using community health workers to create a continuum of care
in the prevention of mother to child transmission of HIV (PMTCT)
cascade of services in Malawi’, Journal of the International AIDS
Society, vol. 15, supplement 2, 11 July 2012, doi: 10.7448/
IAS.15.4.17389.
98
World Health Organization, Joint United Nations Programme on
HIV/AIDS, United Nations Population Fund and United Nations
Children’s Fund, Guidelines on HIV and infant feeding 2010:
Principles and recommendations for infant feeding in the context
of HIV and a summary of evidence, WHO, Geneva, 2010.
99
Stover, John, and Mary Mahy, ‘The Cost-Effectiveness of
Family Planning in Reducing the Number of Children with HIV
Infection’, Presentation at the sixteenth International Conference
on AIDS and STIs in Africa, Addis Ababa, 4–8 December 2011.
Ibid.
88
89
90
World Health Organization, United Nations Children’s Fund and
Joint United Nations Programme on HIV/AIDS, Global Update
on HIV Treatment 2013: Results, impact and opportunities,
WHO, Geneva, June 2013; Ong’ech, John O., et al., ‘Provision
of Services and Care for HIV-Exposed Infants: A comparison
of maternal and child health clinic and HIV comprehensive
care clinic models’, Journal of Acquired Immune Deficiency
Syndromes, vol. 61, no. 1, 1 September 2012, pp. 83–89;
Fayorsey Ruby, N., et al., ‘Decentralization of Pediatric HIV Care
and Treatment in Five Sub-Saharan African Countries’, Journal of
Acquired Immune Deficiency Syndromes, vol. 62, no. 5, 15 April
2013, pp. 124–130; and Bolton-Moore, Carolyn, et al., ‘Clinical
Outcomes and CD4 Cell Response in Children Receiving
Antiretroviral Therapy at Primary Health Care Facilities in
Zambia’, Journal of the Medical American Association, vol. 298,
no. 16, 24 October 2007, pp. 1888–1899.
Institute of Medicine of the National Academies, ‘Summary
Evaluation of PEPFAR’, Report brief, National Academies Press,
Washington, D.C., February 2013; and Miller, Elizabeth,
and Michael Samson, ‘HIV-Sensitive Social Protection: State
of the evidence 2012 in Sub-Saharan Africa’, United Nations
100
Those countries include Angola, Botswana, Burkina Faso,
Burundi, Cameroon, Chad, Côte d’lvoire, Democratic Republic
of the Congo, Ethiopia, Ghana, India, Kenya, Lesotho, Malawi,
Mozambique, Namibia, Nigeria, Rwanda, South Africa, Sudan,
Swaziland, Uganda, United Republic of Tanzania, Zambia
and Zimbabwe; and Mahy, Mary, et al., ‘What Will it Take
to Achieve Virtual Elimination of Mother-to-Child Transmission
of HIV? An assessment of current progress and future needs’,
Sexually Transmitted Infections, vol. 86, supplement 2,
December 2010, pp. ii48–ii55.
49
Towards an AIDS-Free Generation – Children and AIDS: Sixth Stocktaking Report, 2013
101
Ibid.
102
World Health Organization, Male Involvement in the Prevention
of Mother-to-Child Transmission of HIV, WHO, Geneva, 2012.
103
Government of Rwanda, International Planned Parenthood
Federation, Joint United Nations Programme on HIV/AIDS,
United Nations Population Fund and World Health Organization,
‘Linking Sexual and Reproductive Health and HIV: Gateways
to integration – A case study from Rwanda – A glimpse of the
future – Eliminating new HIV infections among children and
keeping their mothers alive’, Government of Rwanda, IPPF,
UNAIDS, UNFPA and WHO, Rwanda, 2013, p. 13.
104
Thorne, Claire, et al., ‘Prevention of Mother-to-Child Transmission
of Human Immunodeficiency Virus among Pregnant Women
Using Injecting Drugs in Ukraine, 2000–10’, Addiction, vol.
107, no. 1, 1 January 2012, pp. 118–128.
105
International Treatment Preparedness Coalition, ‘Missing the
Target 10: Communities and the Treatment 2.0 initiative –
Delivering on the next treatment scale-up’, ITPC, Bangkok and
New York, October 2012.
106
United Nations Department of Economic and Social Affairs,
Population Division, ‘World Population Prospects: The 2012
revision’, CD-ROM, DESA, June 2013.
107
United Nations Children’s Fund, Progress for Children:
A report card on adolescents, Number 10, UNICEF, New York,
April 2012, p. 9.
108
UNICEF analysis of UNAIDS 2012 HIV and AIDS estimates.
109
UNAIDS 2012 HIV and AIDS unpublished estimates.
110
UNICEF global databases, 2013, based on DHS, MICS and
other national surveys, 2008–2012.
111
Ibid; and Mahy, Mary, Jesus Maria Garcia-Calleja and Kimberly
Anne Marsh, ‘Trends in HIV Prevalence among Young People
in Generalised Epidemics: Implications for monitoring the HIV
epidemic’, Sexually Transmitted Infections, vol. 88, 2012,
pp. i65–i75.
112
Eurasian Harm Reduction Network, Young People and Injecting
Drug Use in Selected Countries of Eastern and Central Europe,
EHRN, Vilnius, 2009.
Joint United Nations Programme on HIV/AIDS and World Health
Organization, Joint Strategic Action Framework to Accelerate
the Scale-Up of Voluntary Male Medical Circumcision for
HIV Prevention in Eastern and Southern Africa, 2012–2016,
UNAIDS and WHO, Geneva, November 2011, p. 7.
113
national surveys, 2006–2012. (iii) United Nations Children’s
Fund, The State of the World’s Children 2014 (forthcoming).
(iv) United Nations, The Millenium Development Goals Report
2013, United Nations, New York, June 2013, p. 33. (v) World
Health Organization, ‘Adolescent Pregnancy: Fact sheet number
364’, WHO, Geneva, May 2012, <http://www.who.int/
mediacentre/factsheets/fs364/en>, accessed 23 October
2013. (vi) UNICEF global databases, 2013, based on DHS,
MICS and other national surveys, 2006–2012. (vii) Pinheiro,
Paulo Sérgio, World Report on Violence Against Children,
United Nations, Geneva, 2006, p. 12. (viii) UNICEF global
databases, 2013, based on DHS, MICS and other national
surveys, 2006–2012.
119
UNICEF analysis of UNAIDS 2012 HIV and AIDS estimates.
120
Ibid.
121
Leclerc-Madlala, Suzanne, ‘Age-Disparate and Intergenerational
Sex in Southern Africa: The dynamics of hypervulnerability’,
AIDS, vol. 22, supplement 4, December 2008, pp. S17–S25;
Leclerc-Madlala, Suzanne, ‘Cultural Scripts for Multiple and
Concurrent Partnerships in Southern Africa: Why HIV prevention
needs anthropology’, Sexual Health, vol. 6, no. 2, May 2009,
pp. 103–110; Stroeken, Koen, et al., ‘HIV among Out-of-School
Youth in Eastern and Southern Africa: A review’, AIDS Care,
vol. 24, no. 2, February 2012, pp. 186–194; and Cluver,
Lucie, et al., ‘Transactional Sex amongst AIDS-Orphaned and
AIDS-Affected Adolescents Predicted by Abuse and Extreme
Poverty’, Journal of Acquired Immune Deficiency Syndromes,
vol. 58, no. 3, 1 November 2011, pp. 336–343.
122
Baral, Stefan, et al., ‘HIV Risk and Associations of HIV Infection
among Men Who Have Sex with Men in Peri-Urban Cape Town,
South Africa’, BMC Public Health, vol. 11, no. 1, 5 October
2011, pp. 766–773; and Fay, Heather, et al., ‘Stigma, Health
Care Access, and HIV Knowledge Among Men Who Have Sex
with Men in Malawi, Namibia, and Botswana’, AIDS Behaviour,
vol. 15, no. 6, August 2011, pp. 1088–1097.
123
Commission on AIDS in Asia, Redefining AIDS in Asia: Crafting
an effective response, Oxford University Press, New Delhi, 2008.
124
United Nations Children’s Fund, Living in Harm’s Way: Young
key populations in Asia Pacific’s HIV epidemic (forthcoming).
125
National AIDS Control Organisation India, Ministry of Health
and Family Welfare and Government of India, ‘HIV Sentinel
Surveillance 2010–11: A technical brief’, Government of
India, New Delhi, September 2012; and Thailand Bureau of
Epidemiology, ‘HIV Serological Surveillance Report: 2011
Thailand – 29th Round’, Thailand Bureau of Epidemiology,
Bangkok, 2012.
126
Chengdu MSM HIV/AIDS Prevention Team, ‘Chengdu MSM
HIV/AIDS Prevention Situation and Response Analysis’,
Presentation by Chengdu MSM HIV/AIDS Prevention Team
at the Men Who Have Sex with Men and Transgender
Populations Multi-City HIV Initiative Meeting, Hong Kong,
7–9 December 2010.
127
National AIDS Control Organisation India, Ministry of Health
and Family Welfare and Government of India, ‘HIV Sentinel
Surveillance 2010–11: A technical brief’, Government of India,
New Delhi, September 2012.
128
Joint United Nations Programme on HIV/AIDS, UNAIDS
Report on the Global AIDS Epidemic: Annexes, UNAIDS,
Geneva, 2012.
129
Socialist Republic of Viet Nam, ‘Fourth Country Report
on Following Up the Implementation to the Declaration of
Ibid.
114
115
The 14 priority countries in Africa are: Botswana, Ethiopia,
Kenya, Lesotho, Malawi, Mozambique, Namibia, Rwanda,
Swaziland, South Africa, United Republic of Tanzania, Uganda,
Zambia and Zimbabwe.
116
Cherutich, Peter, et al., ‘Progress in Voluntary Medical
Male Circumcision Service Provision: Kenya, 2008–2011’,
Morbidity and Mortality Weekly Report, vol. 61, no. 47,
30 November 2012, pp. 957–961.
Joint United Nations Programme on HIV/AIDS, Global Report:
UNAIDS report on the global AIDS epidemic 2013, UNAIDS,
Geneva, 2013, p. 18.
117
(i) Silverman, Jay G., ‘Adolescent Female Sex Workers:
Invisibility, violence and HIV’, Archives of Disease in Childhood,
vol. 96, no. 5, 28 February 2011, pp. 478–481. (ii) UNICEF
global databases, 2013, based on DHS, MICS and other
118
50
Commitment on HIV and AIDS: Reporting period: January 2008–
December 2009’, Government of Viet Nam, Hanoi, March 2010.
National AIDS Programme (Myanmar), Department of Health
and Ministry of Health, HIV Sentinel Sero-Surveillance Survey
Report 2012, National AIDS Programme, Naypyidaw
(Myanmar), February 2013, p. 33.
141
Child Helpline International, Annual Report 2012: Giving a
voice to children and young people worldwide, Child Helpline
International, Amsterdam, June 2013.
142
Schwartländer, Bernhard, et al., ‘Towards an Improved
Investment Approach for an Effective Response to
HIV/AIDS’, The Lancet, vol. 377, no. 9782, 11 June 2011,
pp. 2031–2041.
143
Birdthistle, Isolde, et al., ‘Investing in Young People: A review of
national-level spending on HIV prevention for young people in
16 countries with generalized HIV epidemics’, Presented at the
nineteenth International AIDS Conference, Washington, D.C.,
22–27 July 2012; and UNICEF analysis of unpublished data
from the Joint United Nations Programme on HIV/AIDS database
of all National AIDS Spending Assessments, February 2013.
144
United Nations Children’s Fund and Futures Institute, The
Impact and Cost of the HIV/AIDS Investment Framework for
Adolescents, UNICEF, New York, 2013 (unpublished document).
145
At the time this modelling exercise was conducted, only 2011
data and estimates were available. The model and the results
were validated by programme experts before the release of
the new UNAIDS 2012 country estimates in September 2013.
The figures on new HIV infections among adolescents, numbers
of adolescents living with HIV and AIDS deaths in adolescents
reported here in relation to the modelling may therefore differ
from new 2012 country estimates used elsewhere in this report.
146
Joint United Nations Programme on HIV/AIDS and United
Nations Development Programme, Understanding and Acting
on Critical Enablers and Development Synergies for Strategic
Investments, UNDP, New York, 2012.
147
Anderson, Mark, et al., ‘Violence against Children in
Swaziland: Findings from a national survey on violence against
children in Swaziland – May 15–June 16, 2007’, United
Nations Children’s Fund and United States Centers for Disease
Control and Prevention, Swaziland and Atlanta, October 2007;
and United Nations Children’s Fund, United States Centers
for Disease Control and Prevention and Muhimbili University
of Health and Allied Sciences, ‘Violence against Children in
Tanzania: Findings from a national survey 2009’, UNICEF,
Dar es Salaam, August 2011.
148
Jewkes, Rachel K., et al., ‘Intimate Partner Violence, Relationship
Power Inequity, and Incidence of HIV Infection in Young Women
in South Africa: A cohort study’, The Lancet, vol. 376, no.
9734, 3 July 2010, pp. 41–48; and Kouyoumdjian, Fiona, et
al., ‘Intimate Partner Violence Is Associated with Incident HIV
Infection in Women in Uganda’, AIDS, vol. 27, no. 8, 15 May
2013, pp. 1331–1338.
149
World Health Organization, Global and Regional Estimates of
Violence against Women, WHO, Geneva, 2013, p. 22.
150
Joint United Nations Programme on HIV/AIDS and
United Nations Development Programme, ‘Understanding and
Acting on Critical Enablers and Development Synergies for
Strategic Investments’, UNDP, New York, 2012.
151
Interagency Youth Working Group, ‘The Intersection of Economic
Empowerment and Youth Sexual and Reproductive Health’,
Youth Lens on Reproductive Health and HIV/AIDS research
brief, no. 37, FHI 360, Washington, D.C., May 2013; Joint
United Nations Programme on HIV/AIDS and United Nations
Development Programme, ‘Understanding and Acting on Critical
Enablers and Development Synergies for Strategic Investments’,
UNDP, New York, 2012; and Lutz, Brian, ‘Can (Conditional)
Cash Transfers Contribute to HIV Prevention for Girls?’,
130
131
Joint United Nations Programme on HIV/AIDS, UNAIDS Report on
the Global AIDS Epidemic, 2012, UNAIDS, Geneva, 2013, p. 30.
132
Emmanuel, Faran, et al., ‘Second-Generation Surveillance for
HIV/AIDS in Pakistan: Results from the 4th round of Integrated
Behavior and Biological Survey 2011–2012’, Sexually
Transmitted Infections, published online first: 2 August 2013,
doi:10.1136/sextrans-2013-051161.
133
Busza, J., et al., ‘Injecting Behaviour and Service Use among
Young Injectors in Albania, Moldova, Romania and Serbia’,
International Journal of Drug Policy, vol. 24, no. 5, September
2013, pp. 423–431; and United Nations Regional Office for
Central and Eastern Europe/Commonwealth of Independent
States, Experiences from the Field: HIV prevention among
most at-risk adolescents in Central and Eastern Europe and the
Commonwealth of Independent States, UNICEF Regional Office
for CEE/CIS, Geneva, 2013.
134
UNICEF global databases, 2013, based on DHS, MICS and
other national surveys, 2006–2012.
135
World Health Organization, ‘Statement on HIV Testing and
Counselling: WHO, UNAIDS re-affirm opposition to mandatory
HIV testing’, WHO, Geneva, 28 November 2012,
<www.who.int/hiv/events/2012/world_aids_day/hiv_testing_
counselling/en/index.html>, accessed 3 June 2013.
136
Kasedde, Susan, et al., ‘Reducing HIV and AIDS in Adolescents:
Opportunities and challenges’, Current HIV/AIDS Reports,
vol. 10, no. 2, June 2013, pp. 159–168.
137
United Nations Development Programme, Global Commission
on HIV and the Law: Risks, rights & health, UNDP, New York,
July 2012.
138
Evans, Denise, et al., ‘Treatment Outcomes of HIV-Infected
Adolescents Attending Public-Sector HIV Clinics across Gauteng
and Mpumalanga, South Africa’, AIDS Research and Human
Retroviruses, vol. 29, no. 6, June 2013, pp. 892–900; and
Shroufi, Amir, et al., ‘HIV-Infected Adolescents in Southern
Africa Can Achieve Good Treatment Outcomes: Results from a
retrospective cohort study’, AIDS, vol. 27, no. 12, 31 July 2013,
pp. 1971–1978.
139
140
Ferrand, Rashida A., et al., ‘Survey of Children Accessing HIV
Services in a High HIV Prevalence Setting: Time for adolescents
to count?’, Bulletin of the World Health Organization, vol. 88,
no. 6, June 2010, pp. 428–434; Ferrand, Rashida A., et al.,
‘Causes of Acute Hospitalization in Adolescence: Burden
and spectrum of HIV-related morbidity in a country with an
early-onset and severe HIV epidemic – A prospective survey’,
PLoS Medicine, vol. 7, no. 2, 2 February 2010, pp. 1–11;
Ferrand, Rashida A., et al., ‘Undiagnosed HIV Infection among
Adolescents Seeking Primary Health Care in Zimbabwe’,
Clinical Infectious Diseases, vol. 51, no. 7, 2010, pp. 844–851;
and Arrivé, Elise, et al., ‘HIV Status Disclosure and Retention in
Care in HIV-Infected Adolescents on Antiretroviral Therapy (ART)
in West Africa’, PLoS One, vol. 7, no. 3, 21 March 2012.
Ferguson, Jane, et al., ‘WHO Guidelines on HIV Testing and
Counselling for Adolescents and Care for Adolescents Living
with HIV’, Conference poster, World Health Organization,
Geneva, 2013.
51
Discussion paper in Good Policy and Practice in HIV and Health
Education: Booklet 7 – Gender equality, HIV and education,
UNESCO, Paris, France, 2012, p. 38.
152
Erulkar, Annabel, et al., ‘Tap and Reposition Youth (TRY):
Providing social support, savings, and microcredit opportunities
for young women in areas with high HIV prevalence’, SEEDS
pamphlet series, vol. 23, Population Council, New York, 2006;
and Baird, Sarah J., et al., ‘Effect of a Cash Transfer Programme
for Schooling on Prevalence of HIV and Herpes Simplex Type
2 in Malawi: A cluster randomised trial’, The Lancet, vol. 379,
no. 9823, 7 April 2012, pp. 1320–1329.
153
Rijsdijk, Liesbeth E., et al., ‘The World Starts with Me: A
multilevel evaluation of a comprehensive sex education
programme targeting adolescents in Uganda’, BMC Public
Health, vol. 11, 18 May 2011, pp. 334–346; Inter-Agency
Task Team on Education, Communication and Advocacy Tools
User’s Guide, American Institutes for Research, Washington,
D.C., January 2013, pp. 18–22; Jukes, Matthew, Stephanie
Simmons and Donald Bundy, ‘Education and Vulnerability: The
role of schools in protecting young women and girls from HIV in
southern Africa’, AIDS, vol. 22, supplement 4, December 2008,
pp. S41–S56; and Baird, Sarah J., et al., ‘Effect of a Cash
Transfer Programme for Schooling on Prevalence of HIV and
Herpes Simplex Type 2 in Malawi: A cluster randomised trial’,
The Lancet, vol. 379, no. 9823, 7 April 2012, pp. 1320–1329.
154
155
Towards an AIDS-Free Generation – Children and AIDS: Sixth Stocktaking Report, 2013
156
Jukes, Matthew, Stephanie Simmons and Donald Bundy,
‘Education and Vulnerability: The role of schools in protecting
young women and girls from HIV in southern Africa’, AIDS,
vol. 22, supplement 4, December 2008, pp. S41–S56.
Multiple countries’ data available at World Health Organization,
‘Global School-Based Student Health Surveys’, WHO, Geneva,
<www.who.int/chp/gshs/en/index.html>.
United Nations Educational, Scientific and Cultural
Organization, International Technical Guidance on Sexuality
Education: An evidence-informed approach for schools, teachers
and health educators, UNESCO, Paris, December 2009; and
Kivela, Jari, Evert Ketting and Rob Baltussen, ‘Cost Analysis of
School-Based Sexuality Education Programs in Six Countries’,
Cost Effectiveness and Resource Allocation, vol. 11, no. 17,
1 August 2013, pp. 1–7.
and HIV/AIDS: A sourcebook of HIV/AIDS prevention programs
– Education sector-wide approaches, vol. 2, World Bank,
Washington, D.C., 2008; United Nations Children’s Fund,
Partnership for Child Development and World Bank, Promoting
Quality Education for Orphans and Vulnerable Children: A
sourcebook of programme experiences in Eastern and Southern
Africa, UNICEF, New York, November 2009; and O’Connell,
Tara, Mohini Venkatesh and Donald Bundy, eds., Strengthening
the Education Sector Response to School Health, Nutrition and
HIV/AIDS in the Caribbean Region: A rapid survey of 13 countries, World Bank, Washington, D.C., March 2009.
161
Bundy, Donald, Rethinking School Health: A key component of
education for all, Directions in Development Series, World Bank,
Washington, D.C., 2011.
162
United Nations Educational, Scientific and Cultural Organization
and Joint United Nations Programme on HIV/AIDS Inter-Agency
Task Team on Education, 2011–2012 Education Sector HIV/
AIDS Global Progress Survey: Progression, regression or
stagnation?, UNESCO, Paris, 2013.
163
Task Team for the Global Thematic Consultation on Health in
the Post-2015 Development Agenda, ‘Health in the Post-2015
Agenda: Report of the global thematic consultation on health’,
The World We Want, April 2013, p. 65.
164
United Nations, Political Declaration on HIV/AIDS: Intensifying
our efforts to eliminate HIV and AIDS, A/RES/65/277,
United Nations, New York, 10 June 2011.
165
International Conference on Population and Development
Beyond 2014, ‘Bali Global Youth Forum Declaration’, ICPD,
New York, December 2012.
166
‘About Us’, 2010, <www.iattcaba.org/web/guest/about-us>,
accessed 18 September 2013; and Inter-Agency Task Team
for HIV Prevention and Young People, ‘About the IATT’, 2013,
<www.youngpeopleandhiv.org/iatt_about.html>, accessed
18 September 2013.
167
Inter-Agency Task Team on the Prevention and Treatment of
HIV Infection in Pregnant Women, Mothers and Children, ‘The
Inter-Agency Task Team on the Prevention and Treatment of HIV
Infection in Pregnant Women, Mothers and Children’, New York,
2013, <www.emtct-iatt.org>, accessed 18 September 2013.
157
Jukes, Matthew, Stephanie Simmons and Donald Bundy,
‘Education and Vulnerability: The role of schools in protecting
young women and girls from HIV in southern Africa’, AIDS, vol.
22, supplement 4, December 2008, pp. S41–S56.
168
Office of the United Nations High Commissioner for Human
Rights, ‘Committee on the Rights of the Child’, OHCHR,
Geneva, <www2.ohchr.org/english/bodies/crc/>, accessed
20 August 2013.
158
United Nations Educational, Scientific and Cultural Organization
and Joint United Nations Programme on HIV/AIDS Inter-Agency
Task Team on Education, 2011–2012 Education Sector HIV and
AIDS Global Progress Survey: Progression, regression or stagnation?, UNESCO, Paris, 2013; and United Nations Educational,
Scientific and Cultural Organization, International Technical
Guidance on Sexuality Education: An evidence-informed
approach for schools, teachers and health educators, UNESCO,
Paris, December 2009.
169
United Nations High Commissioner for Refugees, Displacement:
The new 21st-century challenge – UNHCR global trends 2012,
UNHCR, Geneva, June 2013.
170
Government of Mozambique, ‘Ministry of Health Reports: ART’,
Ministry of Health Mozambique, 2013, <www.misau.gov.mz/
index.php/hiv-sida/cat_view/82-hivsida/89-informacaoestrategica-relatorios/90-relatorios-tarv>, accessed
2 October 2013.
171
Inter-Agency Task Team to Address HIV in Humanitarian
Emergencies, ‘Interrupted HIV Treatment in a Forgotten
Conflict: The Central African Republic’, United Nations
High Commissioner for Refugees and United Nations World
Food Programme, August 2013; and Inter-Agency Standing
Committee, IASC Guidelines for Addressing HIV interventions
in Humanitarian settings, IASC, Geneva, September 2010.
159
United Nations Educational, Scientific and Cultural
Organization, International Technical Guidance on Sexuality
Education: An evidence-informed approach for schools, teachers
and health educators, UNESCO, Paris, December 2009.
160
Valerio, Alexandria, et al., ‘Education and HIV/AIDS: A
sourcebook of HIV/AIDS prevention programmes’, Working
paper, World Bank, Washington, D.C., 2003; Beasley, Michael,
Alexandria Valerio and Donald A. P. Bundy, eds., Education
52
annex: statistical tables
Notes on the data
Data sources and compilation
The data and analyses presented in this Sixth
Stocktaking Report are derived from information in
UNICEF global databases that are compiled from
various sources. These include nationally representative data collected from household surveys – e.g.,
Demographic and Health Surveys, Multiple Indicator
Cluster Surveys and Reproductive Health Surveys;
national programme service statistics collected annually
by UNAIDS, UNICEF and WHO through the Global
AIDS Response Progress Reporting (GARPR) process:
country estimates of HIV care and treatment needs
modelled by UNAIDS and WHO in collaboration with
countries; and the United Nations Population Division
country estimates of the number of annual births.
In 2013, UNAIDS, UNICEF and WHO collected HIV
coverage data from national programmes worldwide,
through the 2013 GARPR process, a reporting tool
used to monitor and report on their national progress towards HIV and AIDS goals and targets. The
tool typically comprises indicators to track progress
towards universal access to HIV prevention, treatment
and care, including HIV interventions for women and
children such as preventing mother-to-child transmission and paediatric HIV care. The tool also collated
updated household survey data on HIV knowledge
and sexual behaviour. The GARPR replaces the Joint
Reporting Tool on the health-sector response to HIV
and AIDS and collected HIV programme data for
the 12-month period of January–December 2013.
Estimates on HIV care and treatment
needs of children and pregnant women
In 2013, UNAIDS and WHO refined the HIV and AIDS
estimation methodology to reflect more reliable data
available from population-based surveys, expanded
national sentinel surveillance systems and programme
service statistics in a number of countries. As a result,
UNAIDS has retrospectively generated new estimates
for HIV prevalence, numbers of people living with
HIV, paediatric HIV treatment needs and children
whose parents have died due to all causes or AIDS
for past years based on the refined methodology.
To achieve consistency and establish a comparative
measurement of progress, trend analyses must be
recalculated using only the newly generated estimates.
Similarly, global estimates of the number of children
in need of antiretroviral therapy and the number of
pregnant women living with HIV have been refined,
and the coverage rates for 2005–2011 have thus
been recalculated using the newly generated estimates. These estimates included the most recent
country-reported data from 2012. The methods
and assumptions of the UNAIDS and WHO estimation model continue to evolve and are regularly
updated as new data become available.
As a result, the estimated proportion of children
(aged 0–14) who received antiretroviral therapy
in 2012 is 34 per cent. It is not very different from
the estimated coverage published in previous stocktaking reports. Any change in estimated coverage
is not related to an increase or a decrease in the
number of children in need of antiretroviral therapy
receiving treatment, but to changes in the estimation
methodology and in coverage of key HIV and AIDS
programme interventions, particularly PMTCT. In light
of these changes, 2012 coverage rates should not be
compared with coverage figures published in previous
versions of progress reports including the same data.
For this reason, all estimates of paediatric antiretroviral
therapy and antiretrovirals for PMTCT for previous
years have been back-calculated for this year’s report.
Overall, the differences between the newly generated
estimates and previously published estimates are
not related to trends over time, and are therefore
not comparable. Nor are other revised estimates
comparable to estimates published in previous years.
Trends over time may be assessed, however, using
new UNAIDS methodological revisions applied
retrospectively to earlier HIV and AIDS data.
More details about the data, reporting by specific
countries and the methodology for HIV estimates can
be found at <www.unaids.org>.
53
TABLE 1
Elimination of new HIV infections among children by 2015 and keeping their mothers alive
Towards an AIDS-Free Generation – Children and AIDS: Sixth Stocktaking Report, 2013
Countries and areas
Afghanistan
Albania
Algeria
Andorra
Angola
Antigua and Barbuda
Argentina
Armenia
Australia
Austria
Azerbaijan
Bahamas
Bahrain
Bangladesh
Barbados
Belarus
Belgium
Belize
Benin
Bhutan
Bolivia (Plurinational State of)
Bosnia and Herzegovina
Botswana
Brazil
Brunei Darussalam
Bulgaria
Burkina Faso
Burundi
Cabo Verde
Cambodia
Cameroon
Canada
Central African Republic
Chad
Chile
China
Colombia
Comoros
Congo
Cook Islands
Costa Rica
Côte d’Ivoire
Croatia
Cuba
Cyprus
Czech Republic
Democratic People’s
Republic of Korea
Democratic Republic of the Congo
Denmark
Djibouti
Dominica
Dominican Republic
Ecuador
Egypt
El Salvador
Equatorial Guinea
Eritrea
Estonia
Ethiopia
Fiji
54
Estimated
HIV prevalence
(%) among
adults (aged
15–49), 2012
Antenatal care
coverage –
at least one
visit (%),
2008–2012*
Annual
number
of births
(thousands),
2012
Estimate
356
–
–
–
–
–
–
–
89
–
92
100
99
84
74
94
86
70
–
43
100
2,839
64
24
–
218
328
1,898
128
26
230
14
3,084
18
32,000
–
<500
–
–
–
–
–
–
<1,000
–
38,000
–
28,000
<100
<500
–
<1,000
<500
<100
<500
<1,000
<500
<100
32,000
<100
37,000
<100
<500
–
1,200
1,200
<200
<1,000
2,600
<1,000
<200
46,000
<100
4,176
–
63
–
1,300
550
9
166
–
291
–
15,828
14
13
–
20
–
–
–
–
–
–
46
–
41
–
11
–
15
–
>95
60
6
23
–
34
–
35
71
15
–
26
–
>95
>95
15
81
–
69
–
49
>95
x
x
x
x
x
x
x
x
x
–
–
–
–
17
–
–
–
–
–
–
–
–
–
–
–
–
–
40
–
–
–
>95
–
–
–
66
54
–
–
64
–
–
14
–
–
–
–
19
–
–
68
–
–
–
–
1
–
–
–
14
–
63
22
–
–
37
–
–
4
–
83
–
44
34
32
21
–
86
>95
–
–
53
41
>95
61
56
–
–
11
–
–
30
1
17
–
–
55
–
>95
–
–
High
estimate
100
x
7
1
–
–
2,656
–
1,612
13
–
–
35
–
–
16
–
203
–
40
1,349
9
163
1
12,207
7,641
–
–
3,582
2,742
244
1,058
17,362
–
–
1,680
–
–
854
–
579
–
37
13,294
–
106
–
–
Low
estimate
–
x
x
x
<1,000
–
–
–
19,000
–
2,400
<100
<200
<200
<100
–
–
1,400
<100
<500
<500
<100
4,000
<100
<1,000
–
14,000
5,300
–
<100
6,700
6,500
<100
2,300
31,000
<500
–
16,000
<500
–
2,800
<500
3,500
–
–
24,000
<100
<100
–
<100
Estimate
1.1
–
1.2
–
0.7
0.6
<0.1
0.6
–
0.7
–
1.3
0.2
x
<100
–
–
–
12,000
–
1,400
<100
<100
<100
<100
–
–
<100
<100
<200
<200
<100
2,900
<100
<200
–
11,000
3,900
–
<100
4,400
3,900
<100
<1,000
23,000
<200
–
10,000
<100
–
1,400
<200
2,700
–
–
16,000
<100
<100
–
<100
High
estimate
Estimated percentage of pregnant
women living with HIV who
received ARVs for PMTCT, 2012
48
97
89
–
80
100
99
99
98
–
77
98
100
55
100
100
–
96
86
97
86
87
94
98
99
–
94
99
98
89
85
100
68
53
–
94
97
92
93
100
90
91
–
100
99
–
x
–
–
–
–
15,000
–
–
–
–
–
–
–
–
–
–
–
–
–
3,400
–
–
–
13,000
–
–
–
5,400
5,100
–
–
27,000
–
–
12,000
–
–
–
–
3,100
–
–
20,000
–
–
–
–
Low estimate
Reported number
of pregnant women
living with HIV who
received ARVs for
PMTCT, 2012
<0.1
–
–
–
2.3
–
0.4
0.2
–
–
0.2
–
–
<0.1
–
0.4
–
1.4
1.1
0.2
0.3
–
23.0
–
–
–
1.0
1.3
0.2
0.8
4.5
–
–
2.7
0.4
–
0.5
2.1
2.8
–
0.3
3.2
–
<0.1
–
–
x
1,053
40
946
–
934
1
695
41
305
80
168
6
20
3,150
4
103
129
8
371
15
273
34
48
3,009
7
70
683
443
10
386
820
391
156
579
246
18,455
912
26
165
–
74
731
41
108
13
118
Estimated number
of pregnant women
living with HIV, 2012
10
–
–
–
22
–
>95
>95
–
–
75
–
–
>95
–
>95
–
60
47
>95
72
–
>95
>95
–
–
81
69
>95
>95
73
–
–
18
–
–
59
2
22
–
–
84
–
>95
–
–
Elimination of new HIV infections among children by 2015 and keeping their mothers alive
Countries and areas
Finland
France
Gabon
Gambia
Georgia
Germany
Ghana
Greece
Grenada
Guatemala
Guinea
Guinea-Bissau
Guyana
Haiti
Holy See
Honduras
Hungary
Iceland
India
Indonesia
Iran (Islamic Republic of)
Iraq
Ireland
Israel
Italy
Jamaica
Japan
Jordan
Kazakhstan
Kenya
Kiribati
Kuwait
Kyrgyzstan
Lao People’s Democratic Republic
Latvia
Lebanon
Lesotho
Liberia
Libya
Liechtenstein
Lithuania
Luxembourg
Madagascar
Malawi
Malaysia
Maldives
Mali
Malta
Marshall Islands
Mauritania
Mauritius
Mexico
Micronesia (Federated States of)
Monaco
Mongolia
Montenegro
Morocco
Mozambique
Myanmar
Namibia
Estimated
HIV prevalence
(%) among
adults (aged
15–49), 2012
–
–
4.0
1.3
0.3
–
1.4
–
–
0.7
1.7
3.9
1.3
2.1
–
0.5
–
–
0.3
0.4
0.2
–
–
–
–
1.7
–
–
–
6.1
–
–
0.3
0.3
–
–
23.1
0.9
–
–
–
–
0.5
10.8
0.4
<0.1
0.9
–
–
0.4
1.2
0.2
–
–
<0.1
–
0.1
11.1
0.6
13.3
Antenatal care
coverage –
at least one
visit (%),
2008–2012*
100
100
95
98
98
100
96
–
100
93
85
93
92
90
–
97
–
–
74
96
97
78
100
–
99
99
–
99
99
92
88
100
97
54
92
96
92
79
93
–
100
–
86
95
97
99
75
100
81
84
–
96
80
–
99
97
77
91
83
95
x
x
x
x
x
x
x
x
x
x
x
x
x
x
x
x
x
Annual
number
of births
(thousands),
2012
61
792
53
77
59
699
794
110
2
474
428
63
16
265
–
208
98
5
25,642
4,736
1,454
1,037
71
156
563
50
1,071
192
340
1,535
2
67
148
181
23
62
57
150
130
–
34
6
781
639
516
8
705
4
–
131
14
2,269
2
–
64
7
739
995
922
60
Estimated number
of pregnant women
living with HIV, 2012
Estimate
–
–
1,500
–
–
–
9,500
–
–
–
6,300
2,200
–
5,000
–
–
–
–
–
–
–
–
–
–
–
–
–
–
–
86,000
–
–
–
–
–
–
16,000
<1,000
–
–
–
–
–
68,000
–
–
–
–
–
–
–
–
–
–
–
–
–
94,000
–
8,100
Low estimate
<100
<1,000
1,300
<1,000
<100
<500
7,800
<100
–
1,000
5,000
1,600
<100
4,200
–
<500
<100
<100
27,000
8,100
<500
–
<100
<100
<200
<500
<100
–
–
76,000
–
–
<100
<500
<100
–
14,000
<1,000
–
–
<100
<100
2,100
61,000
<500
<100
4,200
<100
–
<500
<100
1,100
–
–
<100
–
<500
81,000
2,800
6,700
High
estimate
<100
1,700
1,900
1,300
<100
<500
11,000
<100
–
4,600
8,000
3,100
<500
5,700
–
<1000
<100
<100
49,000
20,000
1,100
–
<200
<500
<500
<500
<100
–
–
97,000
–
–
<200
<500
<200
–
17,000
1,300
–
–
<100
<100
3,100
75,000
<1,000
<100
7,200
<100
–
<1,000
<100
1,900
–
–
<100
–
<1,000
110,000
4,000
9,700
Reported number
of pregnant women
living with HIV who
received ARVs for
PMTCT, 2012
–
–
1,064
1,068
24
–
8,957
–
13
252
2,755
738
152
4,889
–
238
–
–
–
1,048
115
–
–
–
–
295
–
–
302
45,397
–
–
111
49
–
5
9,153
850
34
–
–
–
77
40,770
342
–
3,339
–
–
554
95
773
–
–
5
–
195
80,779
2,890
7,619
Estimated percentage of pregnant
women living with HIV who
received ARVs for PMTCT, 2012
Estimate
–
–
70
–
–
–
95
–
–
–
44
33
–
>95
–
–
–
–
–
–
–
–
–
–
–
–
–
–
–
53
–
–
–
–
–
–
58
87
–
–
–
–
–
60
–
–
–
–
–
–
–
–
–
–
–
–
–
86
–
94
Low
estimate
–
–
57
80
36
–
77
–
–
8
34
25
48
85
–
37
–
–
–
5
11
–
–
–
–
61
–
–
–
47
–
–
64
13
–
–
52
69
–
–
–
–
2
54
48
–
44
–
–
72
>95
41
–
–
15
–
35
74
69
78
High
estimate
–
–
87
>95
79
–
>95
–
–
36
55
46
>95
>95
–
60
–
–
–
13
27
–
–
–
–
>95
–
–
–
60
–
–
>95
19
–
–
64
>95
–
–
–
–
4
67
>95
–
77
–
–
>95
>95
67
–
–
18
–
65
>95
>95
>95
55
TABLE 1
Elimination of new HIV infections among children by 2015 and keeping their mothers alive
Towards an AIDS-Free Generation – Children and AIDS: Sixth Stocktaking Report, 2013
Countries and areas
Nauru
Nepal
Netherlands
New Zealand
Nicaragua
Niger
Nigeria
Niue
Norway
Oman
Pakistan
Palau
Panama
Papua New Guinea
Paraguay
Peru
Philippines
Poland
Portugal
Qatar
Republic of Korea
Republic of Moldova
Romania
Russian Federation
Rwanda
Saint Kitts and Nevis
Saint Lucia
Saint Vincent and the Grenadines
Samoa
San Marino
Sao Tome and Principe
Saudi Arabia
Senegal
Serbia
Seychelles
Sierra Leone
Singapore
Slovakia
Slovenia
Solomon Islands
Somalia
South Africa
South Sudan
Spain
Sri Lanka
State of Palestine
Sudan
Suriname
Swaziland
Sweden
Switzerland
Syrian Arab Republic
Tajikistan
Thailand
The former Yugoslav
Republic of Macedonia
Timor-Leste
Togo
Tonga
Trinidad and Tobago
Tunisia
56
Estimated
HIV prevalence
(%) among
adults (aged
15–49), 2012
Antenatal care
coverage –
at least one
visit (%),
2008–2012*
–
0.3
–
–
0.3
0.5
3.1
–
–
–
<0.1
–
0.7
0.5
0.3
0.4
<0.1
–
–
–
–
0.7
–
–
2.9
–
–
–
–
–
1.0
–
0.5
–
–
1.5
–
–
–
–
0.5
17.9
2.7
–
<0.1
–
–
1.1
26.5
–
–
–
0.3
1.1
95
58
–
–
90
83
66
100
–
99
61
90
96
79
96
96
91
–
100
100
–
98
94
–
98
100
99
100
93
–
98
97
93
99
–
93
–
97
100
74
26
97
40
–
99
98
74
91
97
100
–
88
79
99
–
99
–
2.9
–
–
<0.1
x
x
x
x
x
x
x
x
x
x
x
x
x
x
x
84
72
98
96 x
98
Annual
number
of births
(thousands),
2012
Estimated number
of pregnant women
living with HIV, 2012
Estimate
Low estimate
High
estimate
Reported number
of pregnant women
living with HIV who
received ARVs for
PMTCT, 2012
Estimated percentage of pregnant
women living with HIV who
received ARVs for PMTCT, 2012
Estimate
Low
estimate
High
estimate
–
593
180
63
139
858
7,028
–
62
72
4,604
–
75
210
160
600
2,383
411
94
22
470
43
224
1,690
410
–
3
2
5
–
7
565
524
94
2
222
53
58
21
17
452
1,102
396
493
383
130
1,263
10
37
114
82
529
265
702
–
–
–
–
–
–
200,000
–
–
–
–
–
–
<1,000
–
–
–
–
–
–
–
–
–
–
10,000
–
–
–
–
–
–
–
–
–
–
3,200
–
–
–
–
–
280,000
7,500
–
–
–
–
–
12,000
–
–
–
–
–
–
<1,000
<100
<100
<200
2,500
170,000
–
<100
<100
1,000
–
<200
<1,000
<500
<1000
<200
<200
<200
–
<100
<200
<100
–
9000
–
–
–
–
–
<100
–
2,000
<100
–
2,300
<100
<100
<100
–
1,100
260,000
4,600
<500
<100
–
–
<100
11,000
<100
<100
–
<200
4,400
–
1,200
<200
<100
<500
3,900
230,000
–
<100
<100
3,200
–
<500
1,100
<1,000
4,000
<500
<500
<500
–
<200
<500
<200
–
12,000
–
–
–
–
–
<100
–
3,300
<100
–
4,800
<100
<100
<100
–
2,700
310,000
12,000
<1,000
<100
–
–
<200
13,000
<200
<200
–
<1,000
6,200
–
110
–
–
141
707
33,323
–
–
–
55
–
187
328
215
696
19
–
–
–
–
141
–
–
9,057
–
12
17
1
–
36
–
1,000
–
4
3,018
–
–
–
–
57
234,952
1,002
–
5
–
191
107
10,167
–
–
–
62
4,918
–
–
–
–
–
–
17
–
–
–
–
–
–
39
–
–
–
–
–
–
–
–
–
–
87
–
–
–
–
–
–
–
–
–
–
93
–
–
–
–
–
83
13
–
–
–
–
–
83
–
–
–
–
–
–
9
–
–
48
18
15
–
–
–
2
–
59
29
29
25
9
–
–
–
–
64
–
–
75
–
–
–
–
–
42
–
30
–
–
67
–
–
–
–
2
75
8
–
6
–
–
>95
75
–
–
–
11
78
–
18
–
–
>95
30
19
–
–
–
6
–
>95
51
>95
>95
18
–
–
–
–
>95
–
–
>95
–
–
–
–
–
86
–
48
–
–
>95
–
–
–
–
5
90
21
–
16
–
–
>95
92
–
–
–
44
>95
23
–
–
–
–
–
–
–
40
245
3
20
189
–
5,100
–
–
–
–
4,200
–
<500
<100
–
6,300
–
<500
<100
–
4,411
–
–
9
–
86
–
–
–
–
70
–
–
17
–
>95
–
–
52
Elimination of new HIV infections among children by 2015 and keeping their mothers alive
Countries and areas
Estimated
HIV prevalence
(%) among
adults (aged
15–49), 2012
Antenatal care
coverage –
at least one
visit (%),
2008–2012*
Turkey
Turkmenistan
Tuvalu
Uganda
Ukraine
United Arab Emirates
United Kingdom
United Republic of Tanzania
United States
Uruguay
Uzbekistan
Vanuatu
Venezuela (Bolivarian Republic of)
Viet Nam
Yemen
Zambia
Zimbabwe
–
–
–
7.2
0.9
–
–
5.1
–
0.7
0.1
–
0.6
0.4
0.1
12.7
14.7
92
99
97
93
99
100
–
88
–
96
99
84
94
94
47
94
90
SUMMARY INDICATORS
Sub-Saharan Africa a/
Eastern and Southern Africa
West and Central Africa
Middle East and North Africa
South Asia
East Asia and the Pacific
Latin America and the Caribbean
CEE/CIS
Least developed countries
Low- and middle-income countries
World
4.5
6.9
2.3
0.1
<0.1
0.2
0.5
0.5
1.7
0.9
0.8
78
79
78
83
71
89
96
–
74
–
83
DEFINITIONS OF THE INDICATORS
Estimated HIV prevalence (%) among adults (aged
15–49), 2012: Percentage of adults (aged 15–49) living with
HIV as of 2012.
Antenatal care coverage – at least one visit (%),
2008–2012: Percentage of women (aged 15–49) attended at
least once during pregnancy by skilled health personnel (doctor,
nurse, midwife).
Annual number of births (thousands), 2012: Estimated
number of live births in 2012 (in thousands).
Estimated number of pregnant women living with HIV,
2012: Estimated number of pregnant women living with HIV as
of 2012.
Reported number of pregnant women living with HIV who
received ARVs for PMTCT, 2012: Number of women testing
HIV-positive during visits to antenatal clinics who were provided
with most effective antiretrovirals (ARVs) to prevent mother-tochild transmission of HIV. Excludes single-dose nevirapine.
Estimated percentage of pregnant women living with HIV
who received ARVs for PMTCT, 2012: Calculated by dividing
the reported number of HIV-positive pregnant women who
received most effective ARVs (excluding single-dose nevirapine)
for prevention of mother-to-child transmission (PMTCT) of HIV
by the estimated unrounded number of pregnant women living
with HIV in 2012. The point estimates and ranges are given for
countries with a generalized epidemic whereas only ranges are
given for countries with a low or concentrated epidemic. Ranges
in coverage estimates are based on plausibility (uncertainty)
bounds in the denominator (i.e., low and high estimated number
of pregnant women living with HIV).
x
x
x
x
x
x
x
x
x
x
ǂ
ǂ
ǂ
ǂ
ǂ
**ǂ
ǂ
ǂ
ǂ
**ǂ
Annual
number
of births
(thousands),
2012
Estimated number
of pregnant women
living with HIV, 2012
Estimate
Low estimate
High
estimate
Reported number
of pregnant women
living with HIV who
received ARVs for
PMTCT, 2012
Estimated percentage of pregnant
women living with HIV who
received ARVs for PMTCT, 2012
Estimate
Low
estimate
High
estimate
1,268
111
–
1,591
495
131
771
1,898
4,226
49
623
7
601
1,440
752
608
439
–
–
–
100,000
–
–
–
97,000
–
–
–
–
–
–
–
79,000
68,000
<100
–
–
88,000
2,000
–
<1000
83,000
3,200
<100
<500
–
1,000
<1,000
<500
71,000
60,000
<200
–
–
120,000
3,900
–
1100
110,000
11,000
<200
<1,000
–
2,700
6,200
2,400
88,000
76,000
–
–
–
73,870
5,220
–
–
73,955
–
–
508
–
690
1,294
20
76,963
55,849
–
–
–
72
–
–
–
77
–
–
–
–
–
–
–
>95
82
–
–
–
62
>95
–
–
66
–
–
62
–
25
11
1
87
72
–
–
–
86
>95
–
–
89
–
–
>95
–
67
86
6
>95
91
34,734
15,780
17,667
10,223
35,448
30,975
10,951
5,889
29,287
–
138,314
1,400,000
1,000,000
350,000
6,700
39,000
36,000
24,000
13,000
640,000
1,500,000
1,500,000
1,200,000
940,000
300,000
4,600
32,000
24,000
19,000
9,000
580,000
1,300,000
1,400,000
1,500,000
1,100,000
400,000
10,000
57,000
53,000
33,000
17,000
730,000
1,600,000
1,700,000
857,830
753,490
104,086
641
202
11,966
21,449
6,621
348,803
898,455
–
63
75
30
10
1
43
88
>95
63
62
–
55
66
26
6
<1
29
58
>95
52
57
–
73
85
36
14
1
66
>95
>95
74
70
–
MAIN DATA SOURCES
Estimated HIV prevalence (%) among adults (aged 15–49),
2012: UNAIDS, Report on the Global AIDS Epidemic, 2013.
Antenatal care coverage – at least one visit (%),
2008–2012: Statistical data provided by UNICEF Data and
Analytics Section, September 2013.
Annual number of births (thousands), 2012: United Nations
Population Division.
Estimated number of pregnant women living with HIV,
2012: UNAIDS, Report on the Global AIDS Epidemic, 2013.
Reported number of pregnant women living with HIV who
received ARVs for PMTCT, 2012: UNAIDS, UNICEF, WHO,
2013 Global AIDS Response Progress Reporting.
Estimated percentage of pregnant women living with
HIV who received ARVs for PMTCT, 2012: UNAIDS, UNICEF,
WHO, 2013 Global AIDS Response Progress Reporting, and
UNAIDS, Report on the Global AIDS Epidemic, 2013.
NOTES
– Data not available.
* Data refer to the most recent year available during the period
specified in the column heading.
**Excludes China.
ǂ Regional averages are calculated only when the population
represents 50 per cent or more of the region’s total population
of interest.
x Data refer to years or periods other than those specified in the
column heading. Such data are not included in the calculation
of regional and global averages, with the exception of
2005–2006 India. Estimates from years prior to 2005 are not
displayed.
y Data differ from the standard definition or refer to only
part of a country. If they fall within the reference period,
such data are included in the calculation of regional and
global averages.
p Based on small denominators (typically 25–29 unweighted
cases). No data based on fewer than 25 unweighted cases
are displayed.
a/Sub-Saharan Africa includes the Sudan and Djibouti.
Some estimates do not add up to the totals because of rounding.
Low- and middle-income countries are classified as such by the
World Bank as of July 2013; these countries form the basis for
the data analysis in UNAIDS, UNICEF and WHO.
57
TABLE 2
Providing paediatric HIV care and treatment
Estimated number
of pregnant women
living with HIV, 2012
Estimated number
of children (aged 0–14)
living with HIV, 2012
Towards an AIDS-Free Generation – Children and AIDS: Sixth Stocktaking Report, 2013
Countries and areas
Afghanistan
Albania
Algeria
Andorra
Angola
Antigua and Barbuda
Argentina
Armenia
Australia
Austria
Azerbaijan
Bahamas
Bahrain
Bangladesh
Barbados
Belarus
Belgium
Belize
Benin
Bhutan
Bolivia
(Plurinational State of)
Bosnia and Herzegovina
Botswana
Brazil
Brunei Darussalam
Bulgaria
Burkina Faso
Burundi
Cabo Verde
Cambodia
Cameroon
Canada
Central African Republic
Chad
Chile
China
Colombia
Comoros
Congo
Cook Islands
Costa Rica
Côte d’Ivoire
Croatia
Cuba
Cyprus
Czech Republic
Democratic People’s
Republic of Korea
Democratic Republic
of the Congo
Denmark
Djibouti
Dominica
Dominican Republic
Ecuador
Egypt
El Salvador
Equatorial Guinea
Eritrea
Estonia
58
Estimate
Low
High
Estimate
Low
Number of infants born
% of infants born to pregnant
to pregnant women
women living with HIV
living with HIV started
started on cotrimoxazole
on cotrimoxazole
prophylaxis, 2012
prophylaxis, 2012
High
Number of infants born to
pregnant women living with
HIV started on antiretroviral
prophylaxis to prevent
mother-to-child
transmission, 2012
–
–
–
–
30,000
–
–
–
–
–
–
–
–
–
–
–
–
–
9,100
–
–
–
–
–
24,000
–
–
–
–
–
–
–
–
–
–
–
–
–
7,700
–
–
–
–
–
39,000
–
–
–
–
–
–
–
–
–
–
–
–
–
11,000
–
–
–
–
–
15,000
–
–
–
–
–
–
–
–
–
–
–
–
–
3,400
–
<100
–
–
–
12,000
–
1,400
<100
<100
<100
<100
–
–
<100
<100
<200
<200
<100
2,900
<100
<1,000
–
–
–
19,000
–
2,400
<100
<200
<200
<100
–
–
1,400
<100
<500
<500
<100
4,000
<100
–
–
9
–
2,061
–
2,525
10
–
–
35
–
–
9
–
195
–
–
–
–
–
–
–
–
13
–
–
–
–
–
–
–
–
–
–
–
–
–
–
–
–
–
–
–
11
–
>95
29
–
–
38
–
–
1
–
87
–
–
–
–
–
–
–
–
17
–
>95
>95
–
–
76
–
–
15
–
>95
–
–
–
–
–
–
–
–
2,061
–
2,525
12
–
–
31
–
–
11
–
204
–
44
432
–
–
–
–
–
<200
<1,000
–
–
–
–
15
–
11,000
–
–
–
21,000
17,000
–
–
59,000
–
–
34,000
–
–
–
–
13,000
–
–
63,000
–
–
–
–
–
10,000
–
–
–
17,000
14,000
–
–
51,000
–
–
28,000
–
–
–
–
12,000
–
–
53,000
–
–
–
–
–
12,000
–
–
–
25,000
21,000
–
–
67,000
–
–
43,000
–
–
–
–
15,000
–
–
74,000
–
–
–
–
–
13,000
–
–
–
5,400
5,100
–
–
27,000
–
–
12,000
–
–
–
–
3,100
–
–
20,000
–
–
–
–
–
11,000
3,900
–
<100
4,400
3,900
<100
<1,000
23,000
<200
–
10,000
<100
–
1,400
<200
2,700
–
–
16,000
<100
<100
–
<100
–
14,000
5,300
–
<100
6,700
6,500
<100
2,300
31,000
<500
–
16,000
<500
–
2,800
<500
3,500
–
–
24,000
<100
<100
–
<100
0
8,688
–
–
–
1,907
2,149
62
470
5,277
–
–
558
–
197
–
0
–
–
50
4,951
–
1
–
–
–
68
–
–
–
35
42
–
–
19
–
–
4
–
–
–
–
–
–
–
25
–
–
–
–
–
62
–
–
–
29
33
>95
20
17
–
–
3
–
–
–
<1
–
–
–
21
–
3
–
–
–
76
–
–
–
43
55
>95
71
22
–
–
6
–
–
–
<1
–
–
–
31
–
8
–
–
–
11,818
7,436
–
–
1,732
2,149
62
960
10,564
–
–
1,650
–
3,305
–
1
–
–
50
7,641
–
108
–
–
–
–
–
–
–
–
–
–
–
–
–
88,000
77,000
100,000
32,000
28,000
37,000
–
–
–
–
–
–
1,200
–
–
–
–
–
–
3,100
–
–
<1,000
–
–
–
–
–
1,700
2,300
–
–
1,500
–
–
–
–
–
6,100
4,400
–
–
<500
–
–
–
–
–
–
<1,000
–
<100
<500
–
<1,000
<500
<100
<500
<1,000
<500
<100
<100
<500
–
1,200
1,200
<200
<1,000
2,600
<1,000
<200
–
–
–
225
–
–
–
–
166
–
–
–
–
–
–
–
–
–
26
–
–
–
–
19
–
–
–
–
18
–
–
–
–
32
–
–
–
–
36
–
–
22
–
706
550
9
–
–
280
–
Providing paediatric HIV care and treatment
Countries and areas
Afghanistan
Albania
Algeria
Andorra
Angola
Antigua and Barbuda
Argentina
Armenia
Australia
Austria
Azerbaijan
Bahamas
Bahrain
Bangladesh
Barbados
Belarus
Belgium
Belize
Benin
Bhutan
Bolivia
(Plurinational State of)
Bosnia and Herzegovina
Botswana
Brazil
Brunei Darussalam
Bulgaria
Burkina Faso
Burundi
Cabo Verde
Cambodia
Cameroon
Canada
Central African Republic
Chad
Chile
China
Colombia
Comoros
Congo
Cook Islands
Costa Rica
Côte d’Ivoire
Croatia
Cuba
Cyprus
Czech Republic
Democratic People’s
Republic of Korea
Democratic Republic
of the Congo
Denmark
Djibouti
Dominica
Dominican Republic
Ecuador
Egypt
El Salvador
Equatorial Guinea
Eritrea
Estonia
Number of infants
% of infants born to
born to pregnant
pregnant women living
women living with
with HIV started on
HIV receiving
antiretroviral
prophylaxis to prevent virological test for HIV
within two months of
mother-to-child
birth, 2012
transmission, 2012
% of infants born
to pregnant women living
with HIV receiving
virological test for HIV
within two months
of birth, 2012
Estimated number of children needing
antiretroviral therapy based on
UNAIDS/WHO guidelines, 2012
Estimate
Estimated antiretroviral
Number of
therapy coverage
children
among children
(aged 0–14)
(aged 0–14), %, 2012
receiving
antiretroviral
Low
High
therapy, 2012 Estimate estimate estimate
Low
High
–
–
–
–
13
–
–
–
–
–
–
–
–
–
–
–
–
–
13
–
–
–
–
–
11
–
>95
35
–
–
33
–
–
1
–
91
–
48
11
–
–
–
–
–
17
–
>95
>95
–
–
67
–
–
19
–
>95
–
66
15
–
–
0
63
–
1,010
–
190
7
–
–
38
–
–
–
–
162
–
44
432
–
–
–
–
–
7
–
–
–
–
–
–
–
–
–
–
–
–
–
13
–
–
–
–
–
5
–
8
21
–
–
41
–
–
–
–
72
–
48
11
–
–
–
–
–
8
–
14
>95
–
–
83
–
–
–
–
>95
–
66
15
–
–
–
–
–
19,000
–
–
–
–
–
–
–
–
–
–
–
–
–
5,300
–
–
–
–
–
15,000
–
–
–
–
–
–
–
–
–
–
–
–
–
4,500
–
–
–
–
–
24,000
–
–
–
–
–
–
–
–
–
–
–
–
–
6,200
–
8
15
262
–
2,903
–
3,000
13
–
–
22
–
–
48
–
154
–
95
2,635
5
–
–
–
–
15
–
–
–
–
–
–
–
–
–
–
–
–
–
49
–
–
–
–
–
12
–
–
–
–
–
–
–
–
–
–
–
–
–
42
–
–
–
–
–
19
–
–
–
–
–
–
–
–
–
–
–
–
–
58
–
–
3
9
–
–
–
–
–
–
–
86
–
–
–
–
93
–
–
–
32
42
–
–
39
–
–
13
–
–
–
–
–
–
–
39
–
–
–
–
–
85
>95
–
–
26
33
>95
42
34
–
–
10
–
–
–
<1
–
–
–
32
–
>95
–
–
–
>95
>95
–
–
39
55
>95
>95
45
–
–
16
–
–
–
1
–
–
–
48
–
>95
–
–
1
4,827
2,241
–
14
1,101
547
42
439
9,563
–
–
443
–
1,119
332
0
316
–
50
5,346
–
108
–
–
–
38
–
–
–
20
11
–
–
35
–
–
4
–
–
–
–
10
–
–
27
–
–
–
–
–
35
42
–
–
17
8
>95
19
31
–
–
3
–
–
12
<1
9
–
–
22
–
>95
–
–
–
42
57
–
–
25
14
>95
66
41
–
–
4
–
–
23
<1
12
–
–
34
–
>95
–
–
–
10,000
–
–
–
12,000
9700
–
–
33,000
–
–
20,000
–
–
–
–
7,500
–
–
35,000
–
–
–
–
–
9900
–
–
–
9700
7800
–
–
29,000
–
–
17,000
–
–
–
–
6,600
–
–
29,000
–
–
–
–
–
10,000
–
–
–
14,000
12,000
–
–
38,000
–
–
25,000
–
–
–
–
8,500
–
–
41,000
–
–
–
–
1
10,261
–
–
6
6,863
2,023
66
4,595
4,992
–
825
5,812
–
–
6,249
1
1,148
–
61
5,620
–
24
–
–
–
>95
–
–
–
59
21
–
–
15
–
–
29
–
–
–
–
15
–
–
16
–
–
–
–
–
>95
–
–
–
49
17
–
–
13
–
–
24
–
–
–
–
13
–
–
14
–
–
–
–
–
>95
–
–
–
72
26
–
–
17
–
–
37
–
–
–
–
17
–
–
19
–
–
–
–
–
–
–
–
–
–
–
–
–
–
–
–
–
–
–
–
–
1,916
6
5
7
53,000
47,000
61,000
4,751
9
8
10
–
7
–
–
–
–
–
–
44
–
–
5
–
61
45
6
–
–
30
–
–
9
–
>95
>95
14
–
–
60
–
–
22
0
522
550
9
8
–
–
–
–
7
–
–
–
–
–
–
–
–
–
5
–
45
45
6
1
–
–
–
–
9
–
73
>95
14
3
–
–
–
–
<1,000
–
–
–
–
–
–
1,900
–
–
<1,000
–
–
–
–
–
–
1,400
–
–
<1,000
–
–
–
–
–
–
2,600
–
–
40
0
1,083
550
42
335
–
632
–
–
6
–
–
–
–
–
–
34
–
–
5
–
–
–
–
–
–
26
–
–
8
–
–
–
–
–
–
46
–
59
TABLE 2
Providing paediatric HIV care and treatment
Estimated number
of pregnant women
living with HIV, 2012
Estimated number
of children (aged 0–14)
living with HIV, 2012
Countries and areas
Ethiopia
Fiji
Finland
170,000
–
–
France
Towards an AIDS-Free Generation – Children and AIDS: Sixth Stocktaking Report, 2013
Estimate
Gabon
Gambia
Georgia
Germany
Ghana
Greece
Grenada
Guatemala
Guinea
Guinea-Bissau
Guyana
Haiti
Holy See
Honduras
Hungary
Iceland
India
Indonesia
Iran (Islamic Republic of)
Iraq
Ireland
Israel
Italy
Jamaica
Japan
Jordan
Kazakhstan
Kenya
Kiribati
Kuwait
Kyrgyzstan
Lao People’s
Democratic Republic
Latvia
Lebanon
Lesotho
Liberia
Libya
Liechtenstein
Lithuania
Luxembourg
Madagascar
Malawi
Malaysia
Maldives
Mali
Malta
Marshall Islands
Mauritania
Mauritius
Mexico
Micronesia
(Federated States of)
Monaco
Mongolia
Montenegro
60
Low
High
140,000
–
–
200,000
–
–
Estimate
Low
Number of infants born
% of infants born to pregnant
to pregnant women
women living with HIV
living with HIV started
started on cotrimoxazole
on cotrimoxazole
prophylaxis, 2012
prophylaxis, 2012
High
38,000
–
–
32,000
<100
<100
46,000
<100
<100
7,001
8
–
18
–
–
15
40
–
22
62
–
Number of infants born to
pregnant women living with
HIV started on antiretroviral
prophylaxis to prevent
mother-to-child
transmission, 2012
7,072
15
–
–
–
–
–
<1,000
1,700
–
–
–
–
–
3,600
–
–
–
28,000
–
–
–
14,000
5,900
–
12,000
–
–
–
–
–
–
–
–
–
–
–
–
–
–
–
200,000
–
–
–
3,000
–
–
–
23,000
–
–
–
11,000
4,500
–
10,000
–
–
–
–
–
–
–
–
–
–
–
–
–
–
–
180,000
–
–
–
4,200
–
–
–
33,000
–
–
–
17,000
7,700
–
14,000
–
–
–
–
–
–
–
–
–
–
–
–
–
–
–
240,000
–
–
–
1,500
–
–
–
9,500
–
–
–
6,300
2,200
–
5,000
–
–
–
–
–
–
–
–
–
–
–
–
–
–
–
86,000
–
–
–
1,300
<1,000
<100
<500
7,800
<100
–
1,000
5,000
1,600
<100
4,200
–
<500
<100
<100
27,000
8,100
<500
–
<100
<100
<200
<500
<100
–
–
76,000
–
–
<100
1,900
1,300
<100
<500
11,000
<100
–
4,600
8,000
3,100
<500
5,700
–
<1,000
<100
<100
49,000
20,000
1,100
–
<200
<500
<500
<500
<100
–
–
97,000
–
–
<200
371
1,070
24
–
2,236
–
11
121
2,275
–
127
1,168
–
–
–
–
–
–
74
–
–
–
–
–
–
–
306
–
–
–
76
24
–
–
–
24
–
–
–
36
–
–
24
–
–
–
–
–
–
–
–
–
–
–
–
–
–
–
–
–
–
–
19
81
32
–
20
–
–
3
29
–
42
20
–
–
–
–
–
–
7
–
–
–
–
–
–
–
–
–
–
–
44
29
>95
69
–
29
–
–
12
46
–
>95
28
–
–
–
–
–
–
16
–
–
–
–
–
–
–
–
–
–
–
>95
474
337
24
–
2,723
–
11
168
1,658
707
174
2,663
–
119
–
–
13,432
–
77
–
–
–
–
338
–
–
309
48,602
–
–
84
–
–
–
–
<500
<500
14
–
4
5
32
–
–
38,000
3,700
–
–
–
–
–
180,000
–
–
–
–
–
–
–
–
–
–
34,000
3,100
–
–
–
–
–
160,000
–
–
–
–
–
–
–
–
–
–
42,000
4,400
–
–
–
–
–
200,000
–
–
–
–
–
–
–
–
–
–
16,000
<1,000
–
–
–
–
–
68,000
–
–
–
–
–
–
–
–
<100
–
14,000
<1,000
–
–
<100
<100
2,100
61,000
<500
<100
4,200
<100
–
<500
<100
1,100
<200
–
17,000
1,300
–
–
<100
<100
3,100
75,000
<1,000
<100
7,200
<100
–
<1,000
<100
1,900
–
5
–
–
–
–
–
–
8
17,588
258
–
–
–
–
–
69
–
–
–
–
–
–
–
–
–
–
26
–
–
–
–
–
–
–
–
–
–
–
–
–
–
–
–
<1
23
36
–
–
–
–
–
81
–
–
–
–
–
–
–
–
–
<1
29
74
–
–
–
–
–
>95
–
–
5
–
604
–
–
–
–
8
36,667
258
–
–
–
–
45
72
–
–
–
–
–
–
–
0
–
–
–
0
–
–
–
–
–
–
–
–
–
–
–
–
–
<100
–
–
<100
–
–
2
–
–
–
–
–
6
–
–
7
–
–
2
–
Providing paediatric HIV care and treatment
Countries and areas
Ethiopia
Fiji
Finland
France
Gabon
Gambia
Georgia
Germany
Ghana
Greece
Grenada
Guatemala
Guinea
Guinea-Bissau
Guyana
Haiti
Holy See
Honduras
Hungary
Iceland
India
Indonesia
Iran (Islamic Republic of)
Iraq
Ireland
Israel
Italy
Jamaica
Japan
Jordan
Kazakhstan
Kenya
Kiribati
Kuwait
Kyrgyzstan
Lao People’s
Democratic Republic
Latvia
Lebanon
Lesotho
Liberia
Libya
Liechtenstein
Lithuania
Luxembourg
Madagascar
Malawi
Malaysia
Maldives
Mali
Malta
Marshall Islands
Mauritania
Mauritius
Mexico
Micronesia
(Federated States of)
Monaco
Mongolia
Montenegro
Number of infants
% of infants born to
born to pregnant
pregnant women living
women living with
with HIV started on
HIV receiving
antiretroviral
prophylaxis to prevent virological test for HIV
within two months of
mother-to-child
birth, 2012
transmission, 2012
18
–
–
16
75
–
22
>95
–
7,260
5
–
% of infants born
to pregnant women living
with HIV receiving
virological test for HIV
within two months
of birth, 2012
19
–
–
16
25
–
22
38
–
Estimated number of children needing
antiretroviral therapy based on
UNAIDS/WHO guidelines, 2012
Estimate
73,000
–
–
Low
High
63,000
–
–
84,000
–
–
Estimated antiretroviral
Number of
therapy coverage
children
among children
(aged 0–14)
(aged 0–14), %, 2012
receiving
antiretroviral
Low
High
therapy, 2012 Estimate estimate estimate
17,677
7
–
24
–
–
22
–
–
29
–
–
–
–
–
–
–
–
–
–
–
–
–
–
–
–
31
–
–
–
29
–
–
–
26
32
–
54
–
–
–
–
–
–
–
–
–
–
–
–
–
–
–
57
–
–
–
25
26
32
–
24
–
–
4
21
23
58
47
–
18
–
–
27
–
7
–
–
–
–
70
–
–
–
50
–
–
49
38
48
69
–
35
–
–
17
33
43
>95
63
–
29
–
–
49
–
17
–
–
–
–
>95
–
–
–
64
–
–
>95
681
–
24
–
1,702
–
4
206
8
–
71
3,901
–
176
–
–
–
–
40
–
–
–
–
–
–
–
306
33,777
–
–
14
45
–
–
–
18
–
–
–
<1
–
–
79
–
–
–
–
–
–
–
–
–
–
–
–
–
–
–
39
–
–
–
35
–
32
–
15
–
–
5
<1
–
24
68
–
26
–
–
–
–
4
–
–
–
–
–
–
–
–
35
–
–
8
54
–
69
–
22
–
–
21
<1
–
76
92
–
43
–
–
–
–
9
–
–
–
–
–
–
–
–
44
–
–
18
2,000
–
–
–
14,000
–
–
–
8,300
3,300
–
6,700
–
–
–
–
–
–
–
–
–
–
–
–
–
–
–
150,000
–
–
–
1,700
–
–
–
12,000
–
–
–
6,800
2,500
–
5,700
–
–
–
–
–
–
–
–
–
–
–
–
–
–
–
130,000
–
–
–
2,400
–
–
–
17,000
–
–
–
10,000
4,400
–
7,800
–
–
–
–
–
–
–
–
–
–
–
–
–
–
–
170,000
–
–
–
494
271
42
–
3,504
–
1
1,024
1,114
335
201
2,265
–
783
–
–
34,367
1,695
141
–
–
–
–
454
–
–
–
55,439
–
–
70
24
–
–
–
25
–
–
–
13
11
–
34
–
–
–
–
–
–
–
–
–
–
–
–
–
–
–
38
–
–
–
20
–
–
–
20
–
–
–
11
8
–
29
–
–
–
–
–
–
–
–
–
–
–
–
–
–
–
34
–
–
–
29
–
–
–
30
–
–
–
17
14
–
40
–
–
–
–
–
–
–
–
–
–
–
–
–
–
–
45
–
–
–
–
9
13
22
–
6
9
–
–
–
163
–
–
–
–
–
–
62
–
–
–
–
–
54
–
–
–
–
–
–
–
–
–
–
–
48
–
–
–
–
<1
49
36
–
–
–
–
6
85
–
–
–
–
78
–
–
–
–
<1
61
74
–
–
–
–
13
>95
–
–
5
–
564
–
–
–
–
4
2,830
258
–
777
–
–
–
14
–
–
–
–
–
–
–
–
–
–
4
–
–
–
–
–
–
–
–
–
–
–
–
–
–
–
–
<1
4
36
–
11
–
–
–
16
–
–
–
–
–
–
–
–
–
<1
5
74
–
19
–
–
–
21
–
–
–
22,000
2,100
–
–
–
–
–
100,000
–
–
–
–
–
–
–
–
–
–
19,000
1,800
–
–
–
–
–
90,000
–
–
–
–
–
–
–
–
–
–
24,000
2,500
–
–
–
–
–
110,000
–
–
–
–
–
–
–
–
–
4
5,395
430
–
–
–
–
14
36,441
490
0
1,912
–
0
51
10
1,800
–
–
25
20
–
–
–
–
–
36
–
–
–
–
–
–
–
–
–
–
22
17
–
–
–
–
–
33
–
–
–
–
–
–
–
–
–
–
27
24
–
–
–
–
–
41
–
–
–
–
–
–
–
–
–
–
–
0
–
–
–
–
–
–
0
–
–
–
–
–
–
–
6
–
–
7
–
–
2
–
–
–
–
–
6
–
–
7
–
–
–
–
–
–
–
–
–
–
–
–
0
–
–
–
–
–
–
–
–
–
61
TABLE 2
Providing paediatric HIV care and treatment
Estimated number
of pregnant women
living with HIV, 2012
Estimated number
of children (aged 0–14)
living with HIV, 2012
Towards an AIDS-Free Generation – Children and AIDS: Sixth Stocktaking Report, 2013
Countries and areas
Morocco
Mozambique
Myanmar
Namibia
Nauru
Nepal
Netherlands
New Zealand
Nicaragua
Niger
Nigeria
Niue
Norway
Oman
Pakistan
Palau
Panama
Papua New Guinea
Paraguay
Peru
Philippines
Poland
Portugal
Qatar
Republic of Korea
Republic of Moldova
Romania
Russian Federation
Rwanda
Saint Kitts and Nevis
Saint Lucia
Saint Vincent and
the Grenadines
Samoa
San Marino
Sao Tome and Principe
Saudi Arabia
Senegal
Serbia
Seychelles
Sierra Leone
Singapore
Slovakia
Slovenia
Solomon Islands
Somalia
South Africa
South Sudan
Spain
Sri Lanka
State of Palestine
Sudan
Suriname
Swaziland
Sweden
Switzerland
Syrian Arab Republic
Tajikistan
Thailand
62
Estimate
Estimate
Number of infants born
% of infants born to pregnant
to pregnant women
women living with HIV
living with HIV started
started on cotrimoxazole
on cotrimoxazole
prophylaxis, 2012
prophylaxis, 2012
Number of infants born to
pregnant women living with
HIV started on antiretroviral
prophylaxis to prevent
mother-to-child
transmission, 2012
Low
High
Low
High
–
180,000
–
18,000
–
–
–
–
–
–
430,000
–
–
–
–
–
–
3,100
–
–
–
–
–
–
–
–
–
–
27,000
–
–
–
150,000
–
16,000
–
–
–
–
–
–
370,000
–
–
–
–
–
–
2,300
–
–
–
–
–
–
–
–
–
–
23,000
–
–
–
220,000
–
22,000
–
–
–
–
–
–
500,000
–
–
–
–
–
–
4,100
–
–
–
–
–
–
–
–
–
–
33,000
–
–
–
94,000
–
8,100
–
–
–
–
–
–
200,000
–
–
–
–
–
–
<1,000
–
–
–
–
–
–
–
–
–
–
10,000
–
–
<500
81,000
2,800
6,700
–
<1,000
<100
<100
<200
2,500
170,000
–
<100
<100
1,000
–
<200
<1,000
<500
<1,000
<200
<200
<200
–
<100
<200
<100
–
9,000
–
–
<1,000
110,000
4,000
9,700
–
1,200
<200
<100
<500
3,900
230,000
–
<100
<100
3,200
–
<500
1,100
<1,000
4,000
<500
<500
<500
–
<200
<500
<200
–
12,000
–
–
190
60,571
1,288
–
–
72
–
–
100
239
8,562
–
–
–
0
–
168
–
113
–
–
–
–
–
–
60
–
–
7,576
–
7
–
64
–
–
–
–
–
–
–
–
4
–
–
–
–
–
–
–
–
–
–
–
–
–
–
–
–
–
72
–
–
34
54
32
–
–
6
–
–
32
6
4
–
–
–
<1
–
56
–
15
–
–
–
–
–
–
27
–
–
62
–
–
63
74
45
–
–
11
–
–
76
10
5
–
–
–
<1
–
>95
–
55
–
–
–
–
–
–
44
–
–
84
–
–
190
51,299
3,134
7,871
–
108
–
–
120
278
12,455
–
–
–
32
–
192
302
170
496
–
–
–
–
–
149
196
–
–
–
10
–
–
–
–
–
–
14
–
–
–
19
–
–
–
–
–
–
–
5,800
–
–
–
–
–
410,000
19,000
–
–
–
–
–
22,000
–
–
–
–
–
–
–
–
–
–
–
–
4,300
–
–
–
–
–
370,000
12,000
–
–
–
–
–
20,000
–
–
–
–
–
–
–
–
–
–
–
–
8,600
–
–
–
–
–
450,000
28,000
–
–
–
–
–
25,000
–
–
–
–
–
–
–
–
–
–
–
–
3,200
–
–
–
–
–
280,000
7,500
–
–
–
–
–
12,000
–
–
–
–
–
–
–
<100
–
2,000
<100
–
2,300
<100
<100
<100
–
1,000
260,000
4,600
<500
<100
–
–
<100
11,000
<100
<100
–
<200
4,400
–
–
<100
–
3,300
<100
–
4,800
<100
<100
<100
–
2,700
310,000
12,000
<1,000
<100
–
–
<200
13,000
<200
<200
–
<1,000
6,200
–
–
20
–
–
–
11
435
–
–
–
–
–
205,885
259
–
5
–
–
–
9,092
–
–
–
68
2,560
–
–
–
–
–
–
–
13
–
–
–
–
–
73
3
–
–
–
–
–
74
–
–
–
–
–
–
–
24
–
–
–
–
9
–
–
–
–
–
67
2
–
5
–
–
–
67
–
–
–
10
42
–
–
49
–
–
–
–
19
–
–
–
–
–
80
6
–
14
–
–
–
83
–
–
–
41
58
–
–
30
–
444
–
10
151
–
–
–
–
50
239,434
240
–
5
–
–
–
8,459
–
–
–
67
4,822
Providing paediatric HIV care and treatment
Countries and areas
Morocco
Mozambique
Myanmar
Namibia
Nauru
Nepal
Netherlands
New Zealand
Nicaragua
Niger
Nigeria
Niue
Norway
Oman
Pakistan
Palau
Panama
Papua New Guinea
Paraguay
Peru
Philippines
Poland
Portugal
Qatar
Republic of Korea
Republic of Moldova
Romania
Russian Federation
Rwanda
Saint Kitts and Nevis
Saint Lucia
Saint Vincent and
the Grenadines
Samoa
San Marino
Sao Tome and Principe
Saudi Arabia
Senegal
Serbia
Seychelles
Sierra Leone
Singapore
Slovakia
Slovenia
Solomon Islands
Somalia
South Africa
South Sudan
Spain
Sri Lanka
State of Palestine
Sudan
Suriname
Swaziland
Sweden
Switzerland
Syrian Arab Republic
Tajikistan
Thailand
Number of infants
% of infants born to
born to pregnant
pregnant women living
women living with
with HIV started on
HIV receiving
antiretroviral
prophylaxis to prevent virological test for HIV
within two months of
mother-to-child
birth, 2012
transmission, 2012
% of infants born
to pregnant women living
with HIV receiving
virological test for HIV
within two months
of birth, 2012
Estimate
Low
High
–
55
–
>95
–
–
–
–
–
–
6
–
–
–
–
–
–
36
–
–
–
–
–
–
–
–
–
–
–
–
–
34
46
78
82
–
9
–
–
39
7
6
–
–
–
1
–
64
27
23
13
–
–
–
–
–
66
–
–
–
–
–
63
63
>95
>95
–
17
–
–
92
11
7
–
–
–
3
–
>95
47
82
>95
–
–
–
–
–
>95
–
–
–
–
–
190
34,553
243
5,989
–
40
–
–
66
33
8,276
–
–
–
7
–
65
270
160
248
8
–
–
–
–
144
190
–
7,760
–
7
–
37
–
74
–
–
–
–
–
–
4
–
–
–
–
–
–
32
–
–
–
–
–
–
–
–
–
–
74
–
–
34
31
6
62
–
3
–
–
21
1
4
–
–
–
<1
–
22
24
21
6
3
–
–
–
–
64
–
–
63
–
–
63
42
9
89
–
6
–
–
50
1
5
–
–
–
1
–
48
42
77
50
7
–
–
–
–
>95
–
–
86
–
–
–
100,000
–
13,000
–
–
–
–
–
–
260,000
–
–
–
–
–
–
1,800
–
–
–
–
–
–
–
–
–
–
18,000
–
–
–
88,000
–
12,000
–
–
–
–
–
–
220,000
–
–
–
–
–
–
1,400
–
–
–
–
–
–
–
–
–
–
15,000
–
–
–
120,000
–
15,000
–
–
–
–
–
–
290,000
–
–
–
–
–
–
2,300
–
–
–
–
–
–
–
–
–
–
21,000
–
–
244
27,164
4,033
11,340
–
699
–
–
104
673
31,556
–
–
–
139
0
256
722
181
495
33
–
–
–
–
63
207
–
7,597
1
2
–
27
–
88
–
–
–
–
–
–
12
–
–
–
–
–
–
39
–
–
–
–
–
–
–
–
–
–
43
–
–
–
23
–
80
–
–
–
–
–
–
11
–
–
–
–
–
–
30
–
–
–
–
–
–
–
–
–
–
36
–
–
–
32
–
>95
–
–
–
–
–
–
14
–
–
–
–
–
–
51
–
–
–
–
–
–
–
–
–
–
52
–
–
–
–
–
14
–
–
–
–
–
–
2
–
–
–
–
–
–
–
–
–
–
5
–
–
–
–
–
84
3
–
–
–
–
–
69
–
–
–
–
–
–
–
36
–
13
–
–
3
–
–
–
–
2
78
2
–
5
–
–
–
63
–
–
–
10
78
–
–
73
–
22
–
–
6
–
–
–
–
5
93
5
–
14
–
–
–
77
–
–
–
41
>95
1
–
0
–
296
1
11
88
–
–
–
–
–
240,546
–
–
2
–
–
–
9,898
–
–
–
–
3,802
–
–
–
–
–
–
–
3
–
–
–
–
–
85
–
–
–
–
–
–
81
–
–
–
–
–
–
–
<1
–
9
–
–
2
–
–
–
–
–
78
–
–
2
–
–
–
73
–
–
–
–
62
–
–
<1
–
15
–
–
4
–
–
–
–
–
94
–
–
5
–
–
–
90
–
–
–
–
87
–
–
–
–
–
–
–
3,000
–
–
–
–
–
220,000
11,000
–
–
–
–
–
14,000
–
–
–
–
–
–
–
–
–
–
–
–
2,200
–
–
–
–
–
210,000
7,200
–
–
–
–
–
12,000
–
–
–
–
–
–
–
–
–
–
–
–
4,700
–
–
–
–
–
250,000
17,000
–
–
–
–
–
15,000
–
–
–
–
–
3
–
11
–
1,207
10
2
457
–
–
–
0
43
140,541
553
–
24
–
170
84
7,431
–
–
1
149
6,274
–
–
–
–
–
–
–
15
–
–
–
–
–
63
5
–
–
–
–
–
54
–
–
–
–
–
–
–
–
–
–
–
–
11
–
–
–
–
–
57
3
–
–
–
–
–
49
–
–
–
–
–
–
–
–
–
–
–
–
24
–
–
–
–
–
69
8
–
–
–
–
–
59
–
–
–
–
–
Estimated number of children needing
antiretroviral therapy based on
UNAIDS/WHO guidelines, 2012
Estimated antiretroviral
Number of
therapy coverage
children
among children
(aged 0–14)
(aged 0–14), %, 2012
receiving
antiretroviral
Low
High
therapy, 2012 Estimate estimate estimate
63
TABLE 2
Providing paediatric HIV care and treatment
Estimated number
of pregnant women
living with HIV, 2012
Estimated number
of children (aged 0–14)
living with HIV, 2012
Countries and areas
Towards an AIDS-Free Generation – Children and AIDS: Sixth Stocktaking Report, 2013
The former Yugoslav
Republic of Macedonia
Timor-Leste
Togo
Tonga
Trinidad and Tobago
Tunisia
Turkey
Turkmenistan
Tuvalu
Uganda
Ukraine
United Arab Emirates
United Kingdom
United Republic
of Tanzania
United States
Uruguay
Uzbekistan
Vanuatu
Venezuela
(Bolivarian Republic of)
Viet Nam
Yemen
Zambia
Zimbabwe
Estimate
Low
High
Low
High
Number of infants born to
pregnant women living with
HIV started on antiretroviral
prophylaxis to prevent
mother-to-child
transmission, 2012
–
–
–
–
–
–
0
–
–
–
–
–
17,000
–
–
–
–
–
–
190,000
–
–
–
–
14,000
–
–
–
–
–
–
160,000
–
–
–
–
21,000
–
–
–
–
–
–
230,000
–
–
–
–
5,100
–
–
–
–
–
–
100,000
–
–
–
–
4,200
–
<500
<100
<100
–
–
88,000
2,000
–
<1,000
–
6,300
–
<500
<100
<200
–
–
120,000
3,900
–
1,100
–
2,476
–
–
0
–
–
–
–
–
–
–
–
48
–
–
–
–
–
–
–
–
–
–
–
39
–
–
<1
–
–
–
–
–
–
–
–
59
–
–
<1
–
–
–
–
–
–
–
–
2,982
–
–
5
2
–
–
–
–
–
–
230,000
200,000
270,000
97,000
83,000
110,000
48,858
51
44
59
71,571
–
–
–
–
–
–
–
–
–
–
–
–
–
–
–
–
3,200
<100
<500
–
11,000
<200
<1,000
–
–
–
–
1
–
–
–
–
–
–
–
–
–
–
–
–
–
–
521
1
–
–
–
–
1,000
2,700
–
–
–
–
–
–
–
160,000
180,000
–
–
140,000
160,000
–
–
170,000
200,000
–
–
79,000
68,000
<1,000
<500
71,000
60,000
6,200
2,400
88,000
76,000
1,342
7
41,095
36,711
–
–
52
54
21
<1
46
48
>95
2
58
61
1,822
17
34,062
51,566
SUMMARY INDICATORS
Sub-Saharan Africaa/
3,000,000
Eastern and
2,100,000
Southern Africa
West and Central Africa
860,000
Middle East and
14,000
North Africa
South Asia
150,000
East Asia and the Pacific
63,000
Latin America and
56,000
the Caribbean
CEE/CIS
19,000
Least developed
1,500,000
countries
Low- and middle3,200,000
income countries
World
3,300,000
2,700,000
3,300,000
1,400,000
1,200,000
1,500,000
478,432
44
39
50
618,518
2,000,000
2,400,000
1,000,000
940,000
1,100,000
447,788
56
50
64
573,292
730,000
990,000
350,000
300,000
400,000
30,644
10
9
12
45,204
9,800
23,000
6,700
4,600
10,000
285
9
5
17
347
140,000
41,000
210,000
94,000
39,000
36,000
32,000
24,000
57,000
53,000
86
6,140
3
27
1
18
5
41
13,588
14,653
46,000
70,000
24,000
19,000
33,000
4,947
43
30
58
16,458
17,000
24,000
13,000
9,000
17,000
774
69
42
>95
1,599
1,400,000
1,800,000
640,000
580,000
730,000
159,451
41
34
48
189,631
3,000,000
3,700,000
1,500,000
1,300,000
1,600,000
490,664
44
38
50
665,304
3,000,000
3,700,000
1,500,000
1,400,000
1,700,000
–
–
–
–
–
DEFINITIONS OF THE INDICATORS
Estimated number of children (aged 0–14) living with HIV,
2012: Estimated number of children (aged 0–14) living with HIV
as of 2012.
Estimated number of pregnant women living with HIV,
2012: Estimated number of pregnant women living with HIV
as of 2012.
Number of infants born to pregnant women living with
HIV started on cotrimoxazole prophylaxis, 2012: Reported
number of HIV-exposed infants (those born to HIV-positive
mothers) started on cotrimoxazole prophylaxis within two
months of birth.
Percentage of infants born to pregnant women living with
HIV started on cotrimoxazole prophylaxis, 2012: Calculated
by dividing the number of HIV-exposed infants started on
cotrimoxazole prophylaxis by the estimated number of children
born to pregnant women living with HIV. The denominator is the
estimated unrounded number of pregnant women living with HIV
as of 2012.
Number of infants born to pregnant women living with HIV
started on antiretroviral prophylaxis to prevent motherto-child transmission, 2012: Reported number of HIV-exposed
64
Estimate
Number of infants born
% of infants born to pregnant
to pregnant women
women living with HIV
living with HIV started
started on cotrimoxazole
on cotrimoxazole
prophylaxis, 2012
prophylaxis, 2012
infants given antiretroviral prophylaxis for the prevention
of mother-to-child transmission of HIV as of 2012.
Percentage of infants born to pregnant women living
with HIV started on antiretroviral prophylaxis to prevent
mother-to-child transmission, 2012: Calculated by dividing
the number of HIV-exposed infants given antiretroviral
prophylaxis by the estimated number of children born to
pregnant women living with HIV. The denominator is the
estimated unrounded number of pregnant women living with
HIV as of 2012.
Number of infants born to pregnant women living with HIV
receiving virological test for HIV within two months of
birth, 2012: Reported number of HIV-exposed infants receiving a
virological HIV test within two months of birth.
Percentage of infants born to pregnant women living with
HIV receiving virological test for HIV within two months
of birth, 2012: Calculated by dividing the number of HIV-exposed
infants receiving a virological HIV test by the estimated number
of children born to pregnant women living with HIV. The
denominator is the estimated unrounded number of pregnant
women living with HIV as of 2012.
Estimated number of children needing antiretroviral
therapy based on UNAIDS/WHO guidelines, 2012:
Estimated number of children (aged 0–14) living with HIV in need
of antiretroviral treatment (ART) as of 2012.
Number of children (aged 0–14) receiving antiretroviral
therapy, 2012: Reported number of children (aged 0–14) living
with HIV receiving ART as of 2012.
Estimated antiretroviral therapy coverage among children
(aged 0–14), %, 2012: Calculated by dividing the reported
number of children (aged 0–14) receiving ART by the estimated
number of children (aged 0–14) in need of ART as 2012.
MAIN DATA SOURCES
Estimated number of children (aged 0–14) living with HIV,
2012: Joint United Nations Programme on HIV/AIDS, Global
Report: UNAIDS report on the global AIDS epidemic 2013,
UNAIDS, Geneva, 2013.
Estimated number of pregnant women living with HIV,
2012: Joint United Nations Programme on HIV/AIDS, Global
Report: UNAIDS report on the global AIDS epidemic 2013,
UNAIDS, Geneva, 2013.
Number of infants born to pregnant women living with
HIV started on cotrimoxazole prophylaxis, 2012: UNAIDS,
UNICEF, WHO, 2013 Global AIDS Response Progress Reporting.
Providing paediatric HIV care and treatment
Countries and areas
The former Yugoslav
Republic of Macedonia
Timor-Leste
Togo
Tonga
Trinidad and Tobago
Tunisia
Turkey
Turkmenistan
Tuvalu
Uganda
Ukraine
United Arab Emirates
United Kingdom
United Republic
of Tanzania
United States
Uruguay
Uzbekistan
Vanuatu
Venezuela
(Bolivarian Republic of)
Viet Nam
Yemen
Zambia
Zimbabwe
Sub-Saharan Africaa/
Eastern and
Southern Africa
West and Central Africa
Middle East and
North Africa
South Asia
East Asia and the Pacific
Latin America and
the Caribbean
CEE/CIS
Least developed
countries
Low- and middleincome countries
World
Number of infants
% of infants born to
born to pregnant
pregnant women living
women living with
with HIV started on
HIV receiving
antiretroviral
prophylaxis to prevent virological test for HIV
within two months of
mother-to-child
birth, 2012
transmission, 2012
% of infants born
to pregnant women living
with HIV receiving
virological test for HIV
within two months
of birth, 2012
Estimated number of children needing
antiretroviral therapy based on
UNAIDS/WHO guidelines, 2012
Estimate
Low
High
Estimated antiretroviral
Number of
therapy coverage
children
among children
(aged 0–14)
(aged 0–14), %, 2012
receiving
antiretroviral
Low
High
therapy, 2012 Estimate estimate estimate
–
–
–
–
–
–
–
–
–
–
1
–
–
–
–
58
–
–
–
–
–
–
–
–
–
–
–
47
–
–
10
–
–
–
–
–
–
–
–
71
–
–
29
–
–
–
–
–
–
–
–
837
–
–
5
3
–
–
–
–
–
–
–
16
–
–
–
–
–
–
–
–
–
–
–
13
–
–
10
–
–
–
–
–
–
–
–
20
–
–
29
–
–
–
–
–
–
–
–
8,800
–
–
–
–
–
–
110,000
–
–
–
–
7,200
–
–
–
–
–
–
88,000
–
–
–
–
11,000
–
–
–
–
–
–
130,000
–
–
–
3
2,098
–
–
12
0
–
–
35,453
2,268
–
–
–
24
–
–
–
–
–
–
33
–
–
–
–
19
–
–
–
–
–
–
28
–
–
–
–
30
–
–
–
–
–
–
41
–
–
–
74
64
86
26,608
28
24
32
130,000
110,000
150,000
32,407
26
22
30
–
–
–
–
–
–
62
–
–
–
>95
–
–
–
239
–
–
–
–
–
–
–
28
–
–
–
63
–
–
–
–
–
–
–
–
–
–
–
–
–
–
–
2,530
2
–
–
–
–
–
–
–
–
–
–
–
–
–
–
–
90
–
3
9
–
–
–
972
–
–
–
–
–
43
75
29
1
39
68
>95
4
48
85
955
2
48,188
23,192
–
–
61
34
15
<1
54
30
>95
<1
68
38
–
–
89,000
100,000
–
–
80,000
94,000
–
–
99,000
120,000
3,828
53
34,084
46,874
–
–
38
45
–
–
35
40
–
–
43
49
52
46
60
479,457
39
34
45
1,700,000
1,600,000
1,500,000
550,791
33
28
38
65
58
74
447,014
51
45
57
1,200,000
1,100,000
1,300,000
473,732
40
35
46
15
13
17
32,421
9
8
11
500,000
430,000
570,000
76,825
15
13
18
13
7
21
350
10
5
17
9,600
6,400
16,000
993
7
4
10
35
63
25
42
47
94
49
7,124
2
30
1
20
3
45
91,000
45,000
82,000
32,000
130,000
64,000
35,266
23,933
39
53
30
41
49
72
86
57
>95
9,438
42
27
57
39,000
33,000
49,000
26,499
67
50
83
87
55
>95
1,143
72
49
>95
12,000
12,000
13,000
9,024
85
80
89
49
41
58
91,737
22
18
25
860,000
770,000
970,000
209,136
28
23
32
52
45
61
497,748
39
34
45
1,900,000
1,700,000
2,100,000
646,852
34
31
39
–
–
–
–
–
–
–
1,900,000
1,700,000
2,100,000
–
–
–
–
Percentage of infants born to pregnant women living with
HIV started on cotrimoxazole prophylaxis, 2012: UNAIDS,
UNICEF, WHO, 2013 Global AIDS Response Progress Reporting
and UNAIDS 2012 HIV and AIDS estimates.
Number of infants born to pregnant women living with HIV
started on antiretroviral prophylaxis to prevent mother-tochild transmission, 2012: UNAIDS, UNICEF, WHO, 2013 Global
AIDS Response Progress Reporting.
Percentage of infants born to pregnant women living
with HIV started on antiretroviral prophylaxis to prevent
mother-to-child transmission, 2012: UNAIDS, UNICEF, WHO,
2013 Global AIDS Response Progress Reporting and UNAIDS
2012 HIV and AIDS estimates.
Number of infants born to pregnant women living with
HIV receiving virological test for HIV within 2 months of
birth, 2012: UNAIDS, UNICEF, WHO, 2013 Global AIDS Response
Progress Reporting.
Percentage of infants born to pregnant women living with
HIV receiving virological test for HIV within 2 months of
birth, 2012: UNAIDS, UNICEF, WHO, 2013 Global AIDS Response
Progress Reporting, and UNAIDS 2012 HIV and AIDS estimates.
Estimated number of children needing antiretroviral
therapy based on UNAIDS/WHO guidelines, 2012: Joint
United Nations Programme on HIV/AIDS, Global Report:
UNAIDS report on the global AIDS epidemic 2013, UNAIDS,
Geneva, 2013.
Number of children (aged 0–14) receiving antiretroviral
therapy, 2012: Joint United Nations Programme on HIV/AIDS,
Global Report: UNAIDS report on the global AIDS epidemic 2013,
UNAIDS, Geneva, 2013.
Estimated antiretroviral therapy coverage among children
(aged 0–14), 2012: Joint United Nations Programme on
HIV/AIDS, Global Report: UNAIDS report on the global AIDS
epidemic 2013, UNAIDS, Geneva, 2013.
NOTES
– Data not available.
* Data refer to the most recent year available during the period
specified in the column heading.
**Excludes China.
ǂ Regional averages are calculated only when the population
represents 50 per cent or more of the region’s total population
of interest.
x Data refer to years or periods other than those specified in the
column heading. Such data are not included in the calculation
of regional and global averages, with the exception of
2005–2006 India. Estimates from years prior to 2005 are
not displayed.
y Data differ from the standard definition or refer to only
part of a country. If they fall within the reference period,
such data are included in the calculation of regional and
global averages.
p Based on small denominators (typically 25–29 unweighted
cases). No data based on fewer than 25 unweighted cases
are displayed.
a/Sub-Saharan Africa includes the Sudan and Djibouti.
Some estimates do not add up to the totals because of rounding.
Low- and middle-income countries are classified as such by the
World Bank as of July 2013; these countries form the basis for
the data analysis in UNAIDS, UNICEF and WHO.
65
TABLE 3
Demography and epidemiology of HIV among adolescents
Demographics
Population
(thousands), 2012
Towards an AIDS-Free Generation – Children and AIDS: Sixth Stocktaking Report, 2013
Countries and areas
Afghanistan
Albania
Algeria
Andorra
Angola
Antigua and Barbuda
Argentina
Armenia
Australia
Austria
Azerbaijan
Bahamas
Bahrain
Bangladesh
Barbados
Belarus
Belgium
Belize
Benin
Bhutan
Bolivia (Plurinational State of)
Bosnia and Herzegovina
Botswana
Brazil
Brunei Darussalam
Bulgaria
Burkina Faso
Burundi
Cabo Verde
Cambodia
Cameroon
Canada
Central African Republic
Chad
Chile
China
Colombia
Comoros
Congo
Cook Islands
Costa Rica
Côte d’Ivoire
Croatia
Cuba
Cyprus
Czech Republic
Democratic People’s Republic of Korea
Democratic Republic of the Congo
Denmark
Djibouti
Dominica
Dominican Republic
Ecuador
Egypt
El Salvador
Equatorial Guinea
Eritrea
Estonia
Ethiopia
Fiji
66
Epidemiology
Total
Aged 10–19
Adolescents
aged 10–19 as
a % of total
population
29,825
3,162
38,482
78
20,821
89
41,087
2,969
23,050
8,464
9,309
372
1,318
154,695
283
9,405
11,060
324
10,051
742
10,496
3,834
2,004
198,656
412
7,278
16,460
9,850
494
14,865
21,700
34,838
4,525
12,448
17,465
1,377,065
47,704
718
4,337
21
4,805
19,840
4,307
11,271
1,129
10,660
24,763
65,705
5,598
860
72
10,277
15,492
80,722
6,297
736
6,131
1,291
91,729
875
7,753
572
6,391
–
4,879
16
6,733
415
2,929
922
1,513
60
159
32,280
38
971
1,236
70
2,330
147
2,308
539
444
34,205
70
664
3,907
2,184
109
3,055
5,045
4,078
1,042
3,026
2,724
174,700
8,797
155
947
–
830
4,591
471
1,430
151
995
3,940
15,400
696
179
–
1,997
2,966
15,236
1,425
156
1,344
129
22,993
158
26.0
18.1
16.6
–
23.4
17.7
16.4
14.0
12.7
10.9
16.3
16.2
12.1
20.9
13.4
10.3
11.2
21.6
23.2
19.9
22.0
14.1
22.1
17.2
17.1
9.1
23.7
22.2
22.0
20.6
23.2
11.7
23.0
24.3
15.6
12.7
18.4
21.6
21.8
–
17.3
23.1
10.9
12.7
13.4
9.3
15.9
23.4
12.4
20.9
–
19.4
19.1
18.9
22.6
21.2
21.9
10.0
25.1
18.1
Estimated number of adolescents
living with HIV, 2012
Total
aged 10–19
–
–
–
–
13,000
–
–
–
–
–
–
–
–
–
–
–
–
–
4,500
–
–
–
7,800
–
–
–
16,000
11,000
–
–
29,000
–
–
15,000
–
–
–
–
7,200
–
–
35,000
–
–
–
–
–
53,000
–
<500
–
–
–
–
–
–
2,000
–
91,000
–
Female
aged 10–19
–
–
–
–
7,900
–
–
–
–
–
–
–
–
–
–
–
–
–
2,400
–
–
–
4,600
–
–
–
8,100
5,600
–
–
17,000
–
–
8,400
–
–
–
–
3,800
–
–
19,000
–
–
–
–
–
32,000
–
<500
–
–
–
–
–
–
1,000
–
47,000
–
Male
aged 10–19
–
–
–
–
5,400
–
–
–
–
–
–
–
–
–
–
–
–
–
2,100
–
–
–
3,200
–
–
–
7,700
5,200
–
–
13,000
–
–
7,100
–
–
–
–
3,400
–
–
16,000
–
–
–
–
–
22,000
–
<200
–
–
–
–
–
–
<1,000
–
44,000
–
Adolescents (aged
10–19) living with Number of new HIV
HIV as a % of people infections among
adolescents§
(all ages) living with
HIV, 2012
(aged 15–19), 2012
–
–
–
–
5
–
–
–
–
–
–
–
–
–
–
–
–
–
6
–
–
–
2
–
–
–
14
12
–
–
5
–
–
7
–
–
–
–
10
–
–
8
–
–
–
–
–
11
–
5
–
–
–
–
–
–
11
–
12
–
–
–
–
–
2,500
–
–
–
–
–
–
–
–
–
–
–
–
–
<500
–
–
–
1,300
–
–
–
<1,000
<500
–
–
4,000
–
–
1,300
–
–
–
–
<500
–
–
2,600
–
–
–
–
–
7,700
–
<100
–
–
–
–
–
–
<100
–
2,300
–
Number of AIDS
deaths among
adolescents
(aged 10–19), 2012
–
–
–
–
<1,000
–
–
–
–
–
–
–
–
–
–
–
–
–
<500
–
–
–
<100
–
–
–
1,200
<1,000
–
–
1,900
–
–
1,300
–
–
–
–
<1,000
–
–
2,900
–
–
–
–
–
3,300
–
<100
–
–
–
–
–
–
<200
–
7,900
–
Demography and epidemiology of HIV among adolescents
Demographics
Population
(thousands), 2012
Countries and areas
Finland
France
Gabon
Gambia
Georgia
Germany
Ghana
Greece
Grenada
Guatemala
Guinea
Guinea-Bissau
Guyana
Haiti
Holy See
Honduras
Hungary
Iceland
India
Indonesia
Iran (Islamic Republic of)
Iraq
Ireland
Israel
Italy
Jamaica
Japan
Jordan
Kazakhstan
Kenya
Kiribati
Kuwait
Kyrgyzstan
Lao People’s Democratic Republic
Latvia
Lebanon
Lesotho
Liberia
Libya
Liechtenstein
Lithuania
Luxembourg
Madagascar
Malawi
Malaysia
Maldives
Mali
Malta
Marshall Islands
Mauritania
Mauritius
Mexico
Micronesia (Federated States of)
Monaco
Mongolia
Montenegro
Morocco
Mozambique
Myanmar
Namibia
Epidemiology
Total
Aged 10–19
Adolescents
aged 10–19 as
a % of total
population
5,408
63,937
1,633
1,791
4,358
82,800
25,366
11,125
105
15,083
11,451
1,664
795
10,174
1
7,936
9,976
326
1,236,687
246,864
76,424
32,778
4,576
7,644
60,885
2,769
127,250
7,009
16,271
43,178
101
3,250
5,474
6,646
2,060
4,647
2,052
4,190
6,155
37
3,028
524
22,294
15,906
29,240
338
14,854
428
53
3,796
1,240
120,847
103
38
2,796
621
32,521
25,203
52,797
2,259
620
7,753
351
416
507
8,075
5,576
1,061
20
3,537
2,633
376
173
2,243
–
1,793
1,046
45
238,563
44,619
11,790
7,492
584
1,224
5,788
560
11,822
1,399
2,420
9,622
22
466
1,047
1,554
198
861
498
949
1,097
–
343
64
5,319
3,796
5,558
68
3,412
51
–
841
192
23,529
26
–
473
85
6,063
5,835
9,299
530
11.5
12.1
21.5
23.2
11.6
9.8
22.0
9.5
18.8
23.5
23.0
22.6
21.7
22.0
–
22.6
10.5
13.7
19.3
18.1
15.4
22.9
12.8
16.0
9.5
20.2
9.3
20.0
14.9
22.3
22.2
14.3
19.1
23.4
9.6
18.5
24.3
22.6
17.8
–
11.3
12.3
23.9
23.9
19.0
20.1
23.0
11.8
–
22.2
15.5
19.5
25.2
–
16.9
13.6
18.6
23.2
17.6
23.5
Estimated number of adolescents
living with HIV, 2012
Total
aged 10–19
–
–
1,700
–
–
–
14,000
–
–
–
5,500
2,000
–
9,400
–
–
–
–
–
–
–
–
–
–
–
–
–
–
–
150,000
–
–
–
–
–
–
21,000
1,400
–
–
–
–
–
91,000
–
–
–
–
–
–
–
–
–
–
–
–
–
100,000
–
9,300
Female
aged 10–19
–
–
1,000
–
–
–
7,600
–
–
–
–
1,200
–
5,100
–
–
–
–
–
–
–
–
–
–
–
–
–
–
–
89,000
–
–
–
–
–
–
12,000
<1,000
–
–
–
–
–
49,000
–
–
–
–
–
–
–
–
–
–
–
–
–
68,000
–
5,200
Male
aged 10–19
–
–
<1,000
–
–
–
6,900
–
–
–
–
<1,000
–
4,300
–
–
–
–
–
–
–
–
–
–
–
–
–
–
–
64,000
–
–
–
–
–
–
8,900
<1,000
–
–
–
–
–
42,000
–
–
–
–
–
–
–
–
–
–
–
–
–
34,000
–
4,100
Adolescents (aged
10–19) living with Number of new HIV
HIV as a % of people infections among
adolescents§
(all ages) living with
HIV, 2012
(aged 15–19), 2012
–
–
4
–
–
–
6
–
–
–
5
5
–
6
–
–
–
–
–
–
–
–
–
–
–
–
–
–
–
9
–
–
–
–
–
–
6
7
–
–
–
–
–
8
–
–
–
–
–
–
–
–
–
–
–
–
–
7
–
4
–
–
<200
–
–
–
<1,000
–
–
–
–
<500
–
<1,000
–
–
–
–
–
–
–
–
–
–
–
–
–
–
–
18,000
–
–
–
–
–
–
2,900
<100
–
–
–
–
–
6,700
–
–
–
–
–
–
–
–
–
–
–
–
–
17,000
–
1,000
Number of AIDS
deaths among
adolescents
(aged 10–19), 2012
–
–
<200
–
–
–
1,100
–
–
–
<500
<200
–
<1,000
–
–
–
–
–
–
–
–
–
–
–
–
–
–
–
7,800
–
–
–
–
–
–
1,200
<200
–
–
–
–
–
5,600
–
–
–
–
–
–
–
–
–
–
–
–
–
3,900
–
<500
67
TABLE 3
Demography and epidemiology of HIV among adolescents
Demographics
Population
(thousands), 2012
Towards an AIDS-Free Generation – Children and AIDS: Sixth Stocktaking Report, 2013
Countries and areas
Nauru
Nepal
Netherlands
New Zealand
Nicaragua
Niger
Nigeria
Niue
Norway
Oman
Pakistan
Palau
Panama
Papua New Guinea
Paraguay
Peru
Philippines
Poland
Portugal
Qatar
Republic of Korea
Republic of Moldova
Romania
Russian Federation
Rwanda
Saint Kitts and Nevis
Saint Lucia
Saint Vincent and the Grenadines
Samoa
San Marino
Sao Tome and Principe
Saudi Arabia
Senegal
Serbia
Seychelles
Sierra Leone
Singapore
Slovakia
Slovenia
Solomon Islands
Somalia
South Africa
South Sudan
Spain
Sri Lanka
State of Palestine
Sudan
Suriname
Swaziland
Sweden
Switzerland
Syrian Arab Republic
Tajikistan
Thailand
The former Yugoslav
Republic of Macedonia
Timor-Leste
Togo
Tonga
68
Total
Aged 10–19
Epidemiology
Estimated number of adolescents
living with HIV, 2012
Adolescents
aged 10–19 as
a % of total
population
Total
aged 10–19
Female
aged 10–19
Male
aged 10–19
Adolescents (aged
10–19) living with Number of new HIV
HIV as a % of people infections among
adolescents§
(all ages) living with
HIV, 2012
(aged 15–19), 2012
Number of AIDS
deaths among
adolescents
(aged 10–19), 2012
10
27,474
16,714
4,460
5,992
17,157
168,834
1
4,994
3,314
179,160
21
3,802
7,167
6,687
29,988
96,707
38,211
10,604
2,051
49,003
3,514
21,755
143,170
11,458
54
181
109
189
31
188
28,288
13,726
9,553
92
5,979
5,303
5,446
2,068
550
10,195
52,386
10,838
46,755
21,098
4,219
37,195
535
1,231
9,511
7,997
21,890
8,009
66,785
–
6,354
2,007
606
1,319
3,956
37,675
–
642
557
39,901
–
690
1,601
1,395
5,804
20,817
4,132
1,094
171
6,350
424
2,230
14,071
2,774
–
32
20
42
–
40
4,723
3,162
1,180
14
1,358
702
595
191
124
2,440
9,578
2,544
4,304
3,248
1,060
8,546
97
299
1,084
865
4,749
1,710
9,059
–
23.1
12.0
13.6
22.0
23.1
22.3
–
12.9
16.8
22.3
–
18.2
22.3
20.9
19.4
21.5
10.8
10.3
8.3
13.0
12.1
10.3
9.8
24.2
–
17.8
18.3
22.2
–
21.5
16.7
23.0
12.4
15.1
22.7
13.2
10.9
9.2
22.6
23.9
18.3
23.5
9.2
15.4
25.1
23.0
18.2
24.3
11.4
10.8
21.7
21.3
13.6
–
–
–
–
–
–
170,000
–
–
–
–
–
–
1,300
–
–
–
–
–
–
–
<200
–
–
22,000
–
–
–
–
–
–
–
–
–
–
2,800
–
–
–
–
–
310,000
8,000
–
–
–
–
–
20,000
–
–
–
–
–
–
–
–
–
–
–
93,000
–
–
–
–
–
–
<1,000
–
–
–
–
–
–
–
–
–
–
11,000
–
–
–
–
–
–
–
–
–
–
2,000
–
–
–
–
–
210,000
–
–
–
–
–
–
12,000
–
–
–
–
–
–
–
–
–
–
–
74,000
–
–
–
–
–
–
<1,000
–
–
–
–
–
–
–
–
–
–
11,000
–
–
–
–
–
–
–
–
–
–
<1,000
–
–
–
–
–
100,000
–
–
–
–
–
–
7,400
–
–
–
–
–
–
–
–
–
–
–
5
–
–
–
–
–
–
5
–
–
–
–
–
–
–
–
–
–
11
–
–
–
–
–
–
–
–
–
–
5
–
–
–
–
–
5
5
–
–
–
–
–
9
–
–
–
–
–
–
–
–
–
–
–
21,000
–
–
–
–
–
–
<100
–
–
–
–
–
–
–
<100
–
–
<1,000
–
–
–
–
–
–
–
–
–
–
<1,000
–
–
–
–
–
56,000
–
–
–
–
–
–
3,600
–
–
–
–
–
–
–
–
–
–
–
11,000
–
–
–
–
–
–
<100
–
–
–
–
–
–
–
<100
–
–
1,200
–
–
–
–
–
–
–
–
–
–
<200
–
–
–
–
–
11,000
<1,000
–
–
–
–
–
<1,000
–
–
–
–
–
2,106
273
13.0
–
–
–
–
–
–
1,114
6,643
105
312
1,498
23
28.0
22.6
22.3
–
8,000
–
–
4,200
–
–
3,700
–
–
6
–
–
<500
–
–
<1,000
–
Demography and epidemiology of HIV among adolescents
Demographics
Population
(thousands), 2012
Countries and areas
Total
Aged 10–19
Epidemiology
Estimated number of adolescents
living with HIV, 2012
Adolescents
aged 10–19 as
a % of total
population
Total
aged 10–19
Female
aged 10–19
Male
aged 10–19
Adolescents (aged
10–19) living with Number of new HIV
HIV as a % of people infections among
adolescents§
(all ages) living with
HIV, 2012
(aged 15–19), 2012
Number of AIDS
deaths among
adolescents
(aged 10–19), 2012
Trinidad and Tobago
Tunisia
Turkey
Turkmenistan
Tuvalu
Uganda
Ukraine
United Arab Emirates
United Kingdom
United Republic of Tanzania
United States
Uruguay
Uzbekistan
Vanuatu
Venezuela (Bolivarian Republic of)
Viet Nam
Yemen
Zambia
Zimbabwe
1,337
10,875
73,997
5,173
10
36,346
45,530
9,206
62,783
47,783
317,505
3,395
28,541
247
29,955
90,796
23,852
14,075
13,724
177
1,692
12,846
994
–
8,890
4,389
812
7,264
10,828
42,958
521
5,696
52
5,537
14,819
6,010
3,357
3,327
13.3
15.6
17.4
19.2
–
24.5
9.6
8.8
11.6
22.7
13.5
15.3
20.0
21.1
18.5
16.3
25.2
23.8
24.2
–
–
–
–
–
110,000
–
–
–
170,000
–
–
–
–
–
–
–
82,000
120,000
–
–
–
–
–
64,000
–
–
–
97,000
–
–
–
–
–
–
–
43,000
63,000
–
–
–
–
–
48,000
–
–
–
69,000
–
–
–
–
–
–
–
39,000
55,000
–
–
–
–
–
7
–
–
–
11
–
–
–
–
–
–
–
7
9
–
–
–
–
–
15,000
–
–
–
21,000
–
–
–
–
–
–
–
5,500
6,900
–
–
–
–
–
6,300
–
–
–
10,000
–
–
–
–
–
–
–
4,400
6,500
SUMMARY INDICATORS
Sub-Saharan Africaa/
Eastern and Southern Africa
West and Central Africa
Middle East and North Africa
South Asia
East Asia and the Pacific
Latin America and the Caribbean
CEE/CIS
Least developed countries
Low- and middle-income countries
World
913,135
441,512
433,568
425,055
1,650,019
2,074,608
604,436
408,336
878,097
–
7,040,823
209,363
101,842
98,796
79,451
328,314
297,376
111,047
53,017
200,309
–
1,185,392
23
23
23
19
20
14
18
13
23
–
17
1,700,000
1,300,000
390,000
17,000
130,000
110,000
82,000
22,000
900,000
2,100,000
2,100,000
1,000,000
800,000
220,000
9,100
62,000
55,000
35,000
11,000
510,000
1,200,000
1,200,000
720,000
550,000
170,000
8,300
64,000
53,000
46,000
11,000
390,000
900,000
930,000
7
7
6
7
6
4
5
2
8
6
6
210,000
160,000
43,000
5,300
24,000
34,000
17,000
5,200
96,000
290,000
300,000
97,000
70,000
27,000
<1,000
5,100
1,400
2,000
<1,000
54,000
110,000
110,000
DEFINITIONS OF THE INDICATORS
Population (thousands), 2012: Estimated total population as
of 2012 (in thousands).
Adolescents aged 10–19 as a % of total population:
Percentage of the total population that is adolescents
(aged 10–19).
Estimated number of adolescents living with HIV, 2012:
Estimated number of children (aged 0–14) living with HIV as
of 2012.
Adolescents (aged 10–19) living with HIV as a % of people
(all ages) living with HIV, 2012: Percentage of the estimated
number of adults (aged 15+) living with HIV who are adolescents
(aged 15–19) living with HIV.
Number of new HIV infections among adolescents (aged
15–19), 2012: Estimated number of new HIV infections among
adolescents (aged 15–19) as of 2012.
Number of AIDS deaths among adolescents (aged 10–19),
2012: Estimated number of AIDS-attributed deaths among
adolescents (aged 10–19) as of 2012.
MAIN DATA SOURCES
Population (thousands), 2012: United Nations
Population Division, 2013.
Adolescents aged 10–19 as a % of total population:
United Nations Population Division, 2013.
Estimated number of adolescents living with HIV, 2012:
UNAIDS 2012 HIV and AIDS estimates.
Adolescents (aged 10–19) living with HIV as a
% of people (all ages) living with HIV, 2012:
UNICEF analysis of UNAIDS 2012 HIV and AIDS estimates.
Number of new HIV infections among adolescents (aged
15–19), 2012: UNAIDS 2012 HIV and AIDS estimates.
Number of AIDS deaths among adolescents (aged 10–19),
2012: UNAIDS 2012 HIV and AIDS estimates.
NOTES
– Data not available.
* Data refer to the most recent year available during the period
specified in the column heading.
**Excludes China.
ǂ Regional averages are calculated only when the population
represents 50 per cent or more of the region’s total population
of interest.
x Data refer to years or periods other than those specified in the
column heading. Such data are not included in the calculation
of regional and global averages, with the exception of
2005–2006 India. Estimates from years prior to 2005 are
not displayed.
y Data differ from the standard definition or refer to only
part of a country. If they fall within the reference period,
such data are included in the calculation of regional and
global averages.
p Based on small denominators (typically 25–29 unweighted
cases). No data based on fewer than 25 unweighted cases
are displayed.
a/Sub-Saharan Africa includes the Sudan and Djibouti.
§ Current spectrum modelling software used by UNAIDS
assumes HIV infections in the adolescent age group 10–14 are
due to mother-to-child transmission. No other transmission
routes are included in the model for this age group.
Some estimates do not add up to the totals because of rounding.
Low- and middle-income countries are classified as such by the
World Bank as of July 2013; these countries form the basis for
the data analysis in UNAIDS, UNICEF and WHO.
69
TABLE 4
Knowledge, HIV testing and sexual behaviour among adolescents
Knowledge
% of adolescents
(aged 15–19) who have
comprehensive knowledge
of HIV, 2008–2012*
Towards an AIDS-Free Generation – Children and AIDS: Sixth Stocktaking Report, 2013
Countries and areas
Afghanistan
Albania
Algeria
Andorra
Angola
Antigua and Barbuda
Argentina
Armenia
Australia
Austria
Azerbaijan
Bahamas
Bahrain
Bangladesh
Barbados
Belarus
Belgium
Belize
Benin
Bhutan
Bolivia (Plurinational State of)
Bosnia and Herzegovina
Botswana
Brazil
Brunei Darussalam
Bulgaria
Burkina Faso
Burundi
Cabo Verde
Cambodia
Cameroon
Canada
Central African Republic
Chad
Chile
China
Colombia
Comoros
Congo
Cook Islands
Costa Rica
Côte d’Ivoire
Croatia
Cuba
Cyprus
Czech Republic
Democratic People’s Republic of Korea
Democratic Republic of the Congo
Denmark
Djibouti
Dominica
Dominican Republic
Ecuador
Egypt
El Salvador
Equatorial Guinea
Eritrea
Estonia
Ethiopia
Fiji
70
Female
2
36
12
–
–
–
–
10
–
–
3
–
–
11
–
–
–
39
17
22
20
42
–
–
–
–
29
43
–
43
26
–
16
10
–
–
21
–
8
–
–
15
–
54
–
–
7
13
–
16
–
39
–
3
–
–
–
–
24
–
x
x
x
x
y
x
x
Male
–
21
–
–
–
–
–
4
–
–
2
–
–
–
–
–
–
–
31
–
24
41
–
–
–
–
31
45
–
41
30
–
26
–
–
–
–
–
18
–
–
21
–
–
–
–
–
–
–
–
–
33
–
16
–
–
–
–
32
–
x
x
x
x
Sexual behaviour
% of adolescents
% of adolescents (aged 15–19) % of adolescents (aged 15–19)
(aged 15–19) who had sex
with multiple partners who
who had sex with more than
before age 15,
used a condom at last sex,
one partner in the last 12
2008–2012*
2008–2012*
months, 2008–2012*
Female
–
0
–
–
–
–
–
–
–
–
0x
–
–
–
–
–
–
1
2
0
–
1
2
–
–
–
1
0
–
0
4
–
6
0
–
–
5
1
9
–
–
4
–
7
–
–
–
8
–
–
–
4x
–
–
–
–
–
–
0
–
% of adolescents
(aged 15–19) who were ever
tested and received results,
2008–2012*
Male
Female
Male
Female
Male
Female
Male
–
2
–
–
–
–
–
6
–
–
3x
–
–
–
–
–
–
–
8
–
10
5
1
–
–
–
2
1
–
0
10
–
17
–
–
–
–
7
9
–
–
13
–
–
–
–
–
–
–
–
–
14 x
–
–
–
–
–
–
1
–
–
–
–
–
–
–
–
–
–
–
–
–
–
–
–
–
–
–
33
–
–
–
–
–
–
–
57 p
–
–
–
52
–
28
–
–
–
45
–
25
–
–
32
–
64
–
–
–
18
–
–
–
37 x
–
–
–
–
–
–
–
–
–
–
–
–
–
–
–
–
–
–
–
–
–
–
–
–
–
–
40
–
43
–
–
–
–
–
76 p
–
–
–
70
–
50
–
–
–
–
51 p
49
–
–
70
–
–
–
–
–
–
–
–
–
72 x
–
–
–
–
–
–
–
–
–
1
–
–
–
–
–
0
–
–
0x
–
–
–
–
–
–
4
13 x
2
7
0
2
33 x
–
–
8
4
–
0
15
–
27
21
–
–
14
–
23
–
–
21
–
12
–
–
–
21
–
–
–
–
–
–
–
–
–
–
7
–
–
1
–
–
–
–
–
0
–
–
1x
–
–
–
–
–
–
–
13 x
–
10
2
3
–
–
–
2
9
–
0
11
–
10
–
–
–
–
–
24
–
–
14
–
–
–
–
–
–
–
–
–
–
–
–
–
–
–
–
1
–
–
–
1x
–
–
–
–
1
–
–
–
–
–
–
–
–
–
–
8x
10
–
–
–
–
–
–
14
16
–
7
28
–
13
–
–
–
18
–
10
–
–
19
–
19
–
–
–
6
–
–
–
–
–
–
–
–
–
–
32
–
–
–
–
–
–
–
–
1
–
–
–
–
–
–
–
–
–
–
5x
–
–
–
–
–
–
–
7
11
–
3
13
–
6
–
–
–
–
–
4
–
–
11
–
–
–
–
–
–
–
–
–
–
–
–
–
–
–
–
25
–
Knowledge, HIV testing and sexual behaviour among adolescents
Knowledge
% of adolescents
(aged 15–19) who have
comprehensive knowledge
of HIV, 2008–2012*
Countries and areas
Finland
France
Gabon
Gambia
Georgia
Germany
Ghana
Greece
Grenada
Guatemala
Guinea
Guinea-Bissau
Guyana
Haiti
Holy See
Honduras
Hungary
Iceland
India
Indonesia
Iran (Islamic Republic of)
Iraq
Ireland
Israel
Italy
Jamaica
Japan
Jordan
Kazakhstan
Kenya
Kiribati
Kuwait
Kyrgyzstan
Lao People’s Democratic Republic
Latvia
Lebanon
Lesotho
Liberia
Libya
Liechtenstein
Lithuania
Luxembourg
Madagascar
Malawi
Malaysia
Maldives
Mali
Malta
Marshall Islands
Mauritania
Mauritius
Mexico
Micronesia (Federated States of)
Monaco
Mongolia
Montenegro
Morocco
Mozambique
Myanmar
Namibia
Female
–
–
29
33
–
–
35
–
–
20
–
12
53
32
–
29
–
–
19
6
–
3
–
–
–
39
–
12
30
42
41
–
19
23
–
–
35
18
–
–
–
–
23
40
–
22
14
–
27
5
–
–
–
–
28
–
–
27
31
62
x
x,y
y
x,y
x
x
y
x
x
Male
–
–
35
–
–
–
34
–
–
24
–
–
45
25
–
33
–
–
35
2
–
–
–
–
–
34
–
–
30
51
46
–
–
25
–
–
28
21
–
–
–
–
26
45
–
–
–
–
35
–
–
–
–
–
24
–
–
49
–
59
x
x,y
y
x
x
x
Sexual behaviour
% of adolescents
% of adolescents (aged 15–19) % of adolescents (aged 15–19)
(aged 15–19) who had sex
with multiple partners who
who had sex with more than
before age 15,
used a condom at last sex,
one partner in the last 12
2008–2012*
2008–2012*
months, 2008–2012*
Female
–
–
9
1
–
–
2
–
–
1
–
5
1
2
–
2
–
–
0
–
–
–
–
–
–
16
–
–
0
1
1
–
–
–
–
–
2
8
–
–
–
–
3
1
–
–
1
–
5
–
–
–
–
–
0
–
–
3
–
1
p
x
x
x
x
Male
–
–
15
–
–
–
3
–
–
13
–
–
8
14
–
16
–
–
1
–
–
–
–
–
–
39
–
–
8
4
17
–
7
–
–
–
13
7
–
–
–
–
14
5
–
–
2
–
10
–
–
–
–
–
5
–
–
18
–
6
x
x
x
x
Female
–
–
58
–
–
–
22
–
–
–
–
56
–
42
–
39
–
–
–
–
–
–
–
–
–
56
–
–
–
–
–
–
–
–
–
–
37
11
–
–
–
–
7
42
–
–
–
–
–
–
–
–
–
–
–
–
–
43
–
77
p
p
p
x
p
x,p
Male
–
–
77
–
–
–
–
–
–
79
–
–
86
58
–
73
–
–
39
–
–
–
–
–
–
75
–
–
94
69
29
–
–
–
–
–
60
29
–
–
–
–
9
36
–
–
–
–
–
–
–
–
–
–
68
–
–
44
–
84
x
p
p
x
p
x
Female
–
–
17
4
–
–
8
–
–
7
–
27
10
14
–
12
–
–
8
–
–
–
–
–
–
16
–
–
0
12
1
–
0
5
–
–
9
19
–
–
–
–
17
12
–
0
17
–
15
–
–
4
–
–
0
–
–
22
–
7
x
x
x
x
x
x
Male
–
–
35
–
–
–
4
–
–
14
–
–
16
36
–
24
–
–
3
–
–
–
–
–
–
49
–
–
0
22
16
–
–
3
–
–
26
9
–
–
–
–
8
26
–
–
–
–
25
–
–
–
–
–
2
–
–
17
–
19
x
x
x
x
% of adolescents
(aged 15–19) who were ever
tested and received results,
2008–2012*
Female
Male
–
–
31
4
–
–
–
–
–
–
–
12
–
18
–
20
–
–
1x
–
–
–
–
–
–
–
–
–
14
28
–
–
–
–
–
–
43
3x
–
–
–
–
8
–
–
–
7
–
–
2
–
–
–
–
–
–
–
25
88
18 x
–
–
11
–
–
–
–
–
–
–
–
–
–
8
–
4
–
–
1x
–
–
–
–
–
–
–
–
–
14
22
–
–
–
–
–
–
19
1x
–
–
–
–
5
–
–
–
–
–
–
–
–
–
–
–
–
–
–
10
–
8x
71
TABLE 4
Knowledge, HIV testing and sexual behaviour among adolescents
Knowledge
% of adolescents
(aged 15–19) who have
comprehensive knowledge
of HIV, 2008–2012*
Towards an AIDS-Free Generation – Children and AIDS: Sixth Stocktaking Report, 2013
Countries and areas
Nauru
Nepal
Netherlands
New Zealand
Nicaragua
Niger
Nigeria
Niue
Norway
Oman
Pakistan
Palau
Panama
Papua New Guinea
Paraguay
Peru
Philippines
Poland
Portugal
Qatar
Republic of Korea
Republic of Moldova
Romania
Russian Federation
Rwanda
Saint Kitts and Nevis
Saint Lucia
Saint Vincent and the Grenadines
Samoa
San Marino
Sao Tome and Principe
Saudi Arabia
Senegal
Serbia
Seychelles
Sierra Leone
Singapore
Slovakia
Slovenia
Solomon Islands
Somalia
South Africa
South Sudan
Spain
Sri Lanka
State of Palestine
Sudan
Suriname
Swaziland
Sweden
Switzerland
Syrian Arab Republic
Tajikistan
Thailand
The former Yugoslav
Republic of Macedonia
Timor-Leste
Togo
Tonga
72
Female
8
25
–
–
–
12
22
–
–
–
2
–
–
–
–
17
19
–
–
–
–
–
–
–
49
–
–
–
2
–
39
–
26
53
–
23
–
–
–
29
3
–
8
–
–
5
4
40
56
–
–
6
11
46
x
x
x
x
x
x
x
x
23 x
11
33
–
Male
8x
33
–
–
–
14 x
–
–
–
–
–
–
–
–
–
–
–
–
–
–
–
–
–
–
44
–
–
–
5
–
39
–
28
43
–
–
–
–
–
26 x
–
–
–
–
–
–
–
–
52
–
–
–
9
–
Sexual behaviour
% of adolescents
% of adolescents (aged 15–19) % of adolescents (aged 15–19)
(aged 15–19) who had sex
with multiple partners who
who had sex with more than
before age 15,
used a condom at last sex,
one partner in the last 12
2008–2012*
2008–2012*
months, 2008–2012*
Female
–
–
–
–
–
0
3
–
–
–
–
–
–
–
6
1x
–
–
–
–
–
–
–
–
0
–
–
–
–
–
1
–
0
3
–
8
–
–
–
–
–
–
4
–
–
–
–
2
1
–
–
–
–
–
Male
–
2
–
–
–
0
–
–
–
–
–
–
–
–
–
–x
–
–
–
–
–
–
–
–
0
–
–
–
–
–
7
–
1
15
–
–
–
–
–
–
–
–
–
–
–
–
–
–
3
–
–
–
–
–
Female
–
–
–
–
–
–
44
–
–
–
–
–
–
–
50
–
–
–
–
–
–
–
–
–
–
–
–
–
–
–
–
–
–
–
–
10
–
–
–
15 x,p
–
–
6p
–
–
–
–
–
–
–
–
–
–
–
Male
Female
–
–
–
–
–
–
–
–
–
–
–
–
–
–
–
–
–
–
–
–
–
–
–
–
–
–
–
–
–
–
62 p
–
–
63
–
–
–
–
–
–
–
–
–
–
–
–
–
–
92 p
–
–
–
–
–
15
5
–
–
13
26
15
–
–
–
–
–
–
4
7
6
2
–
–
–
–
–
–
–
5
–
–
–
–
–
10
–
10
1
–
22
–
–
–
15
–
–
11
–
–
–
–
10
3
–
–
–
0
–
x
x
x
x
x
Male
35
4
–
–
–
5
6
–
–
–
–
–
–
4
–
–
–
–
–
–
–
–
–
–
13
–
–
–
–
–
12
–
6
4
–
11
–
–
–
16
–
–
–
–
–
–
–
–
2
–
–
–
4
–
x
x
x
x
% of adolescents
(aged 15–19) who were ever
tested and received results,
2008–2012*
Female
Male
–
2
–
–
–
2x
7
–
–
–
–
–
–
–
–
–
0
–
–
–
–
–
–
–
44
–
–
–
–
–
27
–
16
3
–
10
–
–
–
–
–
–
3
–
–
–
–
–
–
–
–
–
–
–
–
4
–
–
–
1x
–
–
–
–
–
–
–
–
–
–
–
–
–
–
–
–
–
–
37
–
–
–
–
–
10
–
11
3
–
–
–
–
–
–
–
–
–
–
–
–
–
–
–
–
–
–
–
–
–
–
–
–
–
–
–
–
–
15
36
–
–
4
–
0
7
–
–
47 p
–
–
–
–
1
12
–
1
6
–
–
8
–
–
8
–
Knowledge, HIV testing and sexual behaviour among adolescents
Knowledge
% of adolescents
(aged 15–19) who have
comprehensive knowledge
of HIV, 2008–2012*
Countries and areas
Female
Trinidad and Tobago
Tunisia
Turkey
Turkmenistan
Tuvalu
Uganda
Ukraine
United Arab Emirates
United Kingdom
United Republic of Tanzania
United States
Uruguay
Uzbekistan
Vanuatu
Venezuela (Bolivarian Republic of)
Viet Nam
Yemen
Zambia
Zimbabwe
49
15
–
4
31
36
39
–
–
46
–
–
27
14
–
51
2
36
46
x
SUMMARY INDICATORS
Sub-Saharan Africaa/
Eastern and Southern Africa
West and Central Africa
Middle East and North Africa
South Asia
East Asia and the Pacific
Latin America and the Caribbean
CEE/CIS
Least developed countries
Low- and middle-income countries
World
26
34
21
–
17
–
–
–
22
–
21
ǂ
ǂ
ǂ
ǂ
ǂ
**ǂ
ǂ
ǂ
ǂ
**ǂ
**ǂ
x
x
x
x
x
x,y
DEFINITIONS OF THE INDICATORS
Percentage of adolescents (aged 15–19) who have
comprehensive knowledge of HIV: Percentage of adolescents
(aged 15–19) who correctly identified the two major ways of
preventing the sexual transmission of HIV (using condoms and
limiting sex to one faithful, uninfected partner), who reject the
two most common local misconceptions about HIV and who
know that a healthy-looking person can transmit HIV.
Percentage of adolescents (aged 15–19) who had sex with
more than one partner in the last 12 months: Percentage
of adolescents (aged 15–19) who reported having sexual
intercourse with more than one partner in the last 12 months.
Percentage of adolescents (aged 15–19) with multiple
partners who used a condom at last sex: Percentage
of adolescents (aged 15–19) who reported having sexual
intercourse with more than one partner in the last 12 months
and who reported the use of a condom during their last
sexual intercourse.
Percentage of adolescents (aged 15–19) who had sex
before age 15: Percentage of adolescents (aged 15–19)
who reported having sex before age 15.
Percentage of adolescents (aged 15–19) who were tested
and received results: Percentage of adolescents (aged 15–19)
who have ever been tested for HIV and received the result.
Sexual behaviour
% of adolescents
% of adolescents (aged 15–19) % of adolescents (aged 15–19)
(aged 15–19) who had sex
with multiple partners who
who had sex with more than
before age 15,
used a condom at last sex,
one partner in the last 12
2008–2012*
2008–2012*
months, 2008–2012*
Male
Female
Male
–
–
–
–
57 x
35
33 x
–
–
41
–
–
–
–
–
–
–
38
42
2
–
–
–
–
2
2
–
–
3
–
–
0
–
–
0
–
2
1
–
–
–
–
–
5
8
–
–
7
–
–
–
–
–
–
–
5
3
x
5
5
–
–
1
–
–
–
–
–
–
ǂ
ǂ
ǂ
ǂ
ǂ
**ǂ
ǂ
ǂ
ǂ
**ǂ
**ǂ
36
39
–
–
34
–
–
–
–
–
–
ǂ
ǂ
ǂ
ǂ
ǂ
**ǂ
ǂ
ǂ
ǂ
**ǂ
**ǂ
3
2
4
–
0
–
–
–
2
–
–
x
x
x
x
ǂ
ǂ
ǂ
ǂ
**ǂ
ǂ
ǂ
ǂ
**ǂ
**ǂ
x
x
x
MAIN DATA SOURCES
Female
–
–
–
–
–
–
–
–
–
38
–
–
–
–
–
–
–
47 x,p
–
35
–
37
–
–
–
–
–
–
–
–
ǂ
ǂ
ǂ
ǂ
ǂ
**ǂ
ǂ
ǂ
ǂ
**ǂ
**ǂ
Male
–
–
–
–
–
56
66 x,p
–
–
45
–
–
–
–
–
–
–
50 x
66 p
–
–
–
–
39
–
–
–
–
–
–
ǂ
ǂ
ǂ
ǂ
ǂ
**ǂ
ǂ
ǂ
ǂ
**ǂ
**ǂ
Percentage of adolescents (aged 15–19) who have
comprehensive knowledge of HIV: UNICEF global
databases, 2013, based on DHS, MICS and other national
surveys, 2006–2012.
Percentage of adolescents (aged 15–19) who had sex
with more than one partner in the last 12 months: UNICEF
global databases, 2013, based on DHS, MICS and other national
surveys, 2006–2012.
Percentage of adolescents (aged 15–19) with multiple
partners who used a condom at last sex: UNICEF global
databases, 2013, based on DHS, MICS and other national
surveys, 2006–2012.
Percentage of adolescents (aged 15–19) who had sex
before age 15: UNICEF global databases, 2013, based on DHS,
MICS and other national surveys, 2006–2012.
Percentage of adolescents (aged 15–19) who were tested
and received results: UNICEF global databases, 2013, based
on DHS, MICS and other national surveys, 2006–2012.
% of adolescents
(aged 15–19) who were ever
tested and received results,
2008–2012*
Female
Male
Female
Male
5x
–
–
–
2x
12
1x
–
–
9
–
–
–
–
–
0
–
7
4
–
–
–
–
19 x
18
3x
–
–
12
–
–
–
–
–
–
–
9
4
–
0
–
–
–
45
–
–
–
31
–
–
–
–
–
7
–
21 x
25
–
–
–
–
–
25
–
–
–
20
–
–
–
–
–
–
–
9x
10
13
10
16
–
8
–
–
–
12
–
–
ǂ
ǂ
ǂ
ǂ
ǂ
**ǂ
ǂ
ǂ
ǂ
**ǂ
**ǂ
9
11
7
–
3
–
–
–
–
–
–
ǂ
ǂ
ǂ
ǂ
ǂ
**ǂ
ǂ
ǂ
ǂ
**ǂ
**ǂ
19
29
10
–
1
–
–
–
27
–
–
ǂ
ǂ
ǂ
ǂ
ǂ
**ǂ
ǂ
ǂ
ǂ
**ǂ
**ǂ
–
20
–
–
1
–
–
–
–
–
–
ǂ
ǂ
ǂ
ǂ
ǂ
**ǂ
ǂ
ǂ
ǂ
**ǂ
**ǂ
NOTES
– Data not available.
* Data refer to the most recent year available during the period
specified in the column heading.
**Excludes China.
ǂ Regional averages are calculated only when the population
represents 50 per cent or more of the region’s total population
of interest.
x Data refer to years or periods other than those specified in the
column heading. Such data are not included in the calculation
of regional and global averages, with the exception of
2005–2006 India. Estimates from years prior to 2005 are
not displayed.
y Data differ from the standard definition or refer to only
part of a country. If they fall within the reference period,
such data are included in the calculation of regional and
global averages.
p Based on small denominators (typically 25–29 unweighted
cases). No data based on fewer than 25 unweighted cases
are displayed.
a/Sub-Saharan Africa includes the Sudan and Djibouti.
Some estimates do not add up to the totals because of rounding.
Low- and middle-income countries are classified as such by the
World Bank as of July 2013; these countries form the basis for
the data analysis in UNAIDS, UNICEF and WHO.
73
TABLE 5
Epidemiology, knowledge, HIV testing and sexual behavior among key affected populations aged below 25 years
Epidemiology
HIV prevalence (%) among
higher-risk populations in capital
city (aged below 25), 2007–2012*
Towards an AIDS-Free Generation – Children and AIDS: Sixth Stocktaking Report, 2013
Countries and areas
Afghanistan
Albania
Algeria
Andorra
Angola
Antigua and Barbuda
Argentina
Armenia
Australia
Austria
Azerbaijan
Bahamas
Bahrain
Bangladesh
Barbados
Belarus
Belgium
Belize
Benin
Bhutan
Bolivia (Plurinational State of)
Bosnia and Herzegovina
Botswana
Brazil
Brunei Darussalam
Bulgaria
Burkina Faso
Burundi
Cabo Verde
Cambodia
Cameroon
Canada
Central African Republic
Chad
Chile
China
Colombia
Comoros
Congo
Cook Islands
Costa Rica
Côte d’Ivoire
Croatia
Cuba
Cyprus
Czech Republic
Democratic People’s Republic of Korea
Democratic Republic of the Congo
Denmark
Djibouti
Dominica
Dominican Republic
Ecuador
Egypt
El Salvador
Equatorial Guinea
Eritrea
Estonia
74
Sexual behaviour
% of higher-risk populations
(aged below 25) using a condom
at last sex, 2007–2012*
Access
People who
inject drugs
Sex
workers
Men who
have sex
with men
People who
inject drugs
Sex
workers
Men who
have sex
with men
% of persons who inject
drugs (aged below 25)
reporting use of sterile
injecting equipment the
last time they injected,
2007–2012*
2.7
–
–
–
–
–
1.4
0.0
1.7
–
1.7
–
–
0.7
–
6.8
–
–
4.8
–
–
–
–
–
–
11.9
–
–
–
–
–
2.6
–
–
–
3.7
–
–
–
–
–
–
–
–
0.0
–
–
–
–
–
–
–
–
–
–
–
–
36.4
0.3
–
4.3
–
7.2
–
–
0.0
0.0
–
1.2
–
–
0.2
–
0.0
0.4
0.0
13.3
–
0.6
–
–
–
–
0.0
8.6
24.3
0.5
–
27.5
–
–
19.6
–
0.2
0.5
0.0
3.8
–
–
11.7
–
0.9
–
–
–
4.5
–
12.5
–
2.4
–
–
–
–
1.5
11.1
0.0
–
–
8.2
–
–
9.4
3.5
–
–
0.0
15.0
–
0.0
–
0.0
3.8
10.5
–
–
–
–
–
–
–
0.0
1.3
1.1
–
1.1
28.8
2.2
33.9
–
7.3
5.6
9.5
–
20.2
–
–
13.8
–
6.2
–
1.4
–
5.5
–
–
16.0
3.7
8.8
–
–
–
–
0.0
43
–
–
–
–
–
65
54
27
–
8
–
–
43
–
58
–
–
60
–
–
43
–
–
–
68
–
–
–
–
–
40
–
–
–
47
–
–
–
–
–
–
–
–
–
–
–
–
–
–
–
–
–
–
–
–
–
41
51
–
40
–
74
–
100
91
–
–
57
–
–
62
73
80
–
90
87
–
96
–
–
–
–
85
98
91
56
–
76
–
–
43
74
89
99
68
82
–
–
92
–
71
–
–
–
27
–
71
–
84
–
–
–
–
68
100
17
–
–
–
25
–
91
71
39
–
23
79
–
34
–
65
54
60
59
–
67
–
–
–
–
66
–
68
–
69
57
65
69
–
50
76
–
–
59
–
–
67
–
71
–
40
–
16
–
–
70
41
54
–
83
–
–
41
64
–
–
–
–
–
92
66
75
–
54
–
–
41
–
87
–
–
26
–
–
76
–
–
–
75
–
–
–
58
–
92
–
–
–
57
–
–
–
–
–
0
–
–
–
–
–
–
–
–
–
–
–
–
–
–
–
89
Testing
% of higher-risk populations
(aged below 25) who received an HIV
test and knew their result, 2007–2012*
People who
inject drugs
Sex
workers
Men who
have sex
with men
79
–
–
–
–
–
45
0
49
–
3
–
–
4
–
40
24
–
26
–
–
17
–
–
–
61
–
–
–
36
–
74
–
–
–
27
–
–
–
–
–
–
–
–
–
–
–
–
–
–
–
–
–
–
–
–
–
35
53
–
39
–
35
–
–
27
60
–
13
–
–
8
80
70
–
57
92
–
63
–
–
18
–
59
–
62
28
–
32
–
–
38
91
30
41
100
46
–
–
47
–
32
–
–
–
85
–
100
–
79
–
–
95
–
80
56
73
–
–
–
30
–
99
32
83
–
19
50
–
11
–
70
39
57
31
–
36
–
–
21
–
52
100
23
–
33
54
36
84
–
26
39
–
–
27
–
42
59
–
20
–
27
–
81
–
–
24
36
22
–
52
–
–
29
Epidemiology, knowledge, HIV testing and sexual behavior among key affected populations aged below 25 years
Epidemiology
HIV prevalence (%) among
higher-risk populations in capital
city (aged below 25), 2007–2012*
Countries and areas
Ethiopia
Fiji
Finland
France
Gabon
Gambia
Georgia
Germany
Ghana
Greece
Grenada
Guatemala
Guinea
Guinea-Bissau
Guyana
Haiti
Holy See
Honduras
Hungary
Iceland
India
Indonesia
Iran (Islamic Republic of)
Iraq
Ireland
Israel
Italy
Jamaica
Japan
Jordan
Kazakhstan
Kenya
Kiribati
Kuwait
Kyrgyzstan
Lao People’s Democratic Republic
Latvia
Lebanon
Lesotho
Liberia
Libya
Liechtenstein
Lithuania
Luxembourg
Madagascar
Malawi
Malaysia
Maldives
Mali
Malta
Marshall Islands
Mauritania
Mauritius
Mexico
Micronesia (Federated States of)
Monaco
Mongolia
Montenegro
Sexual behaviour
% of higher-risk populations
(aged below 25) using a condom
at last sex, 2007–2012*
Access
People who
inject drugs
Sex
workers
Men who
have sex
with men
People who
inject drugs
Sex
workers
Men who
have sex
with men
% of persons who inject
drugs (aged below 25)
reporting use of sterile
injecting equipment the
last time they injected,
2007–2012*
–
–
–
–
–
–
1.1
0.0
–
8.8
–
–
–
–
–
–
–
–
0.0
–
5.3
11.6
6.6
–
–
–
–
–
–
–
2.6
–
–
–
8.1
–
5.8
–
–
–
–
–
0.0
0.0
–
–
4.8
0.0
–
–
–
–
–
6.9
–
–
–
–
–
0.0
–
–
–
–
–
–
–
–
–
–
14.8
22.2
6.6
6.7
–
1.4
–
–
1.7
8.0
0.0
–
–
–
–
1.3
–
–
1.0
–
–
–
3.5
0.8
15.0
–
–
–
–
–
0.0
–
0.3
–
1.1
0.0
25.7
–
–
–
11.1
0.9
–
–
0.0
0.0
–
–
–
1.5
–
–
3.0
3.0
–
–
–
–
59.7
–
–
13.3
–
4.1
4.0
–
3.5
6.1
0.0
–
–
–
–
25.7
1.2
–
0.3
12.2
–
–
2.2
5.2
3.1
–
–
–
–
–
0.0
–
–
–
6.2
0.0
–
–
–
4.6
8.3
12.4
–
–
10.0
0.0
–
–
–
–
–
–
50
48
–
–
–
–
–
–
–
–
–
–
21
–
13
56
24
–
–
–
–
–
–
–
56..2
–
–
–
52
–
62
–
–
–
–
–
–
–
–
–
25
–
–
–
–
–
16
38
–
–
–
–
98
91
–
–
56
–
90
–
–
0
–
95
71
91
92
91
–
78
–
–
88
49
62
–
–
–
–
91
37
–
73
87
–
–
83
93
80
–
–
–
–
–
89
–
–
–
88
–
97
–
–
–
86
65
–
–
84
81
–
–
45
57
–
–
76
52
–
69
–
81
25
–
–
71
–
68
25
–
44
64
45
–
63
–
56
75
50
–
86
–
–
–
74
24
40
–
–
–
–
–
40
60
–
–
72
–
–
–
–
–
58
72
–
–
70
–
–
–
–
–
–
–
88
93
–
–
–
–
–
–
–
–
–
–
67
–
85
82
91
–
–
–
–
–
–
–
55
–
–
–
86
–
85
–
–
–
–
–
97
–
–
–
94
71
–
–
–
–
83
40
–
–
–
95
Testing
% of higher-risk populations
(aged below 25) who received an HIV
test and knew their result, 2007–2012*
People who
inject drugs
Sex
workers
Men who
have sex
with men
–
–
–
–
–
–
7
63
–
77
–
–
–
–
–
–
–
–
22
–
21
84
17
–
–
–
–
–
–
–
58
–
–
–
54
–
59
–
–
–
–
–
72
–
–
–
79
15
–
12
–
–
32
34
–
–
–
–
98
27
–
63
40
–
44
–
–
57
–
92
83
95
88
66
–
81
–
–
38
78
25
–
–
–
–
65
72
–
73
95
–
–
31
21
60
–
–
–
–
–
25
–
–
–
71
21
–
–
–
59
75
54
–
–
50
17
–
–
24
41
–
–
29
32
–
28
–
63
47
28
86
47
–
25
100
–
7
92
11
–
30
–
30
72
20
–
56
–
–
–
37
12
24
–
–
–
–
–
16
46
–
–
75
12
–
–
–
–
93
38
–
–
56
11
75
TABLE 5
Epidemiology, knowledge, HIV testing and sexual behavior among key affected populations aged below 25 years
Epidemiology
HIV prevalence (%) among
higher-risk populations in capital
city (aged below 25), 2007–2012*
Towards an AIDS-Free Generation – Children and AIDS: Sixth Stocktaking Report, 2013
Countries and areas
Morocco
Mozambique
Myanmar
Namibia
Nauru
Nepal
Netherlands
New Zealand
Nicaragua
Niger
Nigeria
Niue
Norway
Oman
Pakistan
Palau
Panama
Papua New Guinea
Paraguay
Peru
Philippines
Poland
Portugal
Qatar
Republic of Korea
Republic of Moldova
Romania
Russian Federation
Rwanda
Saint Kitts and Nevis
Saint Lucia
Saint Vincent and the Grenadines
Samoa
San Marino
Sao Tome and Principe
Saudi Arabia
Senegal
Serbia
Seychelles
Sierra Leone
Singapore
Slovakia
Slovenia
Solomon Islands
Somalia
South Africa
South Sudanδ
Spain
Sri Lanka
State of Palestine
Sudanδ
Suriname
Swaziland
Sweden
Switzerland
Syrian Arab Republic
Tajikistan
Thailand
76
Sexual behaviour
% of higher-risk populations
(aged below 25) using a condom
at last sex, 2007–2012*
People who
inject drugs
Sex
workers
Men who
have sex
with men
People who
inject drugs
Sex
workers
Men who
have sex
with men
1.7
–
13.3
–
–
1.1
–
–
–
–
3.7
–
–
–
33.9
–
–
–
4.0
–
9.5
–
4.9
–
–
1.4
1.2
12.0
–
–
12.5
–
–
–
–
–
–
4.8
–
–
–
–
0.0
–
–
–
–
0.0
–
–
–
–
–
0.0
6.3
–
9.5
25.0
1.0
–
5.9
–
–
–
–
–
1.2
17.2
19.0
–
–
–
2.2
–
–
12.7
3.0
–
0.3
–
9.1
–
–
1.7
–
4.1
42.1
–
–
–
–
–
–
–
15.0
2.0
–
–
–
–
–
–
–
–
–
1.2
0.0
–
–
4.6
64.1
0.0
–
–
3.7
–
3.3
–
4.5
–
–
1.3
–
0.0
3.0
–
15.1
–
–
–
–
–
–
1.9
13.1
10.5
1.5
–
2.8
–
4.3
0.2
–
10.8
–
–
–
12.9
–
–
–
–
12.7
1.4
–
5.7
–
–
–
–
–
–
–
10.9
0.0
–
–
–
–
0.7
2.1
–
1.4
5.3
28
–
79
–
–
40
–
–
–
–
55
–
–
–
22
–
–
–
48
–
16
–
36
–
–
26
22
54
–
–
–
–
–
–
–
–
–
46
–
–
–
–
–
–
–
–
–
–
–
–
–
–
–
6
49
–
72
49
47
–
96
–
–
–
–
–
97
96
87
–
–
–
–
–
27
75
94
70
65
–
93
–
–
96
99
68
78
–
–
–
–
–
22
–
89
91
–
–
–
–
–
–
–
–
–
–
88
–
46
–
87
0
–
–
75
94
50
–
84
–
–
75
–
–
52
–
48
–
–
–
24
–
35
60
72
52
34
–
71
–
57
60
42
58
–
–
95
–
–
–
–
–
72
65
–
–
–
–
25
–
–
–
–
59
61
–
–
75
–
41
37
–
70
86
Access
% of persons who inject
drugs (aged below 25)
reporting use of sterile
injecting equipment the
last time they injected,
2007–2012*
58
–
83
–
–
97
–
–
–
–
75
–
–
–
63
–
–
–
93
–
22
–
59
–
–
100
87
86
–
–
–
–
–
–
–
–
–
88
–
–
–
–
–
–
–
–
–
–
–
–
–
–
–
44
95
–
91
73
Testing
% of higher-risk populations
(aged below 25) who received an HIV
test and knew their result, 2007–2012*
People who
inject drugs
Sex
workers
Men who
have sex
with men
7
–
26
–
–
19
–
–
–
–
18
–
–
–
8
–
–
–
70
–
2
–
41
–
–
36
14
34
–
–
22
–
–
–
–
–
–
17
–
–
–
–
–
–
–
–
–
–
–
–
–
–
–
47
65
–
31
54
15
–
68
–
–
–
–
–
42
70
37
–
–
–
6
–
27
43
72
–
14
–
71
–
–
19
25
36
86
–
–
–
–
–
68
–
48
68
–
–
–
–
–
–
–
–
–
–
–
–
6
93
92
56
–
–
41
40
25
–
45
–
–
36
–
–
28
–
21
–
–
–
–
–
35
63
54
–
4
–
76
–
23
7
42
31
–
–
100
–
–
–
–
–
31
34
–
–
–
–
–
–
–
–
–
37
7
–
–
98
–
31
39
–
39
17
Epidemiology, knowledge, HIV testing and sexual behavior among key affected populations aged below 25 years
Epidemiology
HIV prevalence (%) among
higher-risk populations in capital
city (aged below 25), 2007–2012*
Countries and areas
The former Yugoslav
Republic of Macedonia
Timor-Leste
Togo
Tonga
Trinidad and Tobago
Tunisia
Turkey
Turkmenistan
Tuvalu
Uganda
Ukraine
United Arab Emirates
United Kingdom
United Republic of Tanzania
United States
Uruguay
Uzbekistan
Vanuatu
Venezuela (Bolivarian Republic of)
Viet Nam
Yemen
Zambia
Zimbabwe
Sexual behaviour
% of higher-risk populations
(aged below 25) using a condom
at last sex, 2007–2012*
Access
Testing
% of higher-risk populations
(aged below 25) who received an HIV
test and knew their result, 2007–2012*
People who
inject drugs
Sex
workers
Men who
have sex
with men
People who
inject drugs
Sex
workers
Men who
have sex
with men
% of persons who inject
drugs (aged below 25)
reporting use of sterile
injecting equipment the
last time they injected,
2007–2012*
0.0
0.0
0.0
53
86
51
89
92
32
32
–
0.0
–
–
0.6
0.0
–
–
–
7.1
–
0.6
–
–
–
5.6
–
–
–
–
–
–
–
8.1
–
–
0.6
1.6
–
–
–
3.0
–
–
–
–
–
1.7
–
–
–
–
–
25.1
–
19.8
–
5.8
9.8
1.7
–
–
–
4.2
–
–
–
–
6.9
2.0
–
–
3.0
3.1
–
–
–
0
–
–
32
17
–
–
–
58
–
42
–
18
–
55
–
–
55
–
–
–
–
90
–
–
59
34
–
–
–
94
–
–
–
–
–
86
–
–
82
–
–
52
–
43
27
–
32
27
–
–
–
69
–
–
–
57
44
64
63
–
66
16
–
–
–
–
–
–
91
17
–
–
–
95
–
78
–
–
–
78
–
–
95
–
–
–
–
0
–
–
17
22
–
–
–
35
–
–
–
51
–
30
–
–
26
–
–
–
–
53
–
–
11
–
–
–
–
57
–
–
–
–
–
32
–
–
39
–
–
53
–
47
–
–
13
38
–
–
–
36
–
20
–
70
–
27
–
–
38
19
–
–
DEFINITIONS OF THE INDICATORS
HIV prevalence (%) among higher-risk populations in
capital city (aged below 25 years), 2007–2012: Percentage
of higher-risk populations (persons who inject drugs, sex workers
and men who have sex with men aged 0–24) living with HIV.
Percentage of higher-risk populations (aged below
25 years) using a condom at last sex, 2007–2012: Percentage
of higher-risk populations (persons who inject drugs, sex workers
and men who have sex with men aged 0–24) using a condom
at last sex.
Percentage of persons who inject drugs (aged below
25 years) reporting use of sterile injecting equipment the
last time they injected, 2007–2012: Percentage of people who
inject drugs (aged 0–24) reporting the use of sterile injecting
equipment the last time they injected.
Percentage of higher-risk populations (aged below
25 years) who received an HIV test and knew their result,
2007–2012: Percentage of higher-risk populations (persons who
inject drugs, sex workers and men who have sex with men aged
0–24) who received an HIV test in the past 12 months and knew
the result.
MAIN DATA SOURCES
HIV prevalence (%) among higher-risk populations in
capital city (aged below 25 years), 2007–2012: UNAIDS
online database, <www.aidsinfoonline.org>, accessed on
26 September 2013.
Percentage of higher-risk populations (aged below
25) using a condom at last sex, 2007–2012: UNAIDS
online database, <www.aidsinfoonline.org>, accessed on
26 September 2013.
Percentage of persons who inject drugs (aged below
25 years) reporting use of sterile injecting equipment the
last time they injected, 2007–2012: UNAIDS online database,
<www.aidsinfoonline.org>, accessed on 26 September 2013.
Percentage of higher-risk populations (aged below
25 years) who received an HIV test and knew
their result, 2007–2012: UNAIDS online database,
<www.aidsinfoonline.org>, accessed on 26 September 2013.
People who
inject drugs
Sex
workers
Men who
have sex
with men
NOTES
– Data not available.
* Data refer to the most recent year available during the period
specified in the column heading.
**Excludes China.
ǂ Regional averages are calculated only when the population
represents 50 per cent or more of the region’s total population
of interest.
x Data refer to years or periods other than those specified in the
column heading. Such data are not included in the calculation
of regional and global averages, with the exception of
2005–2006 India. Estimates from years prior to 2005 are
not displayed.
y Data differ from the standard definition or refer to only
part of a country. If they fall within the reference period,
such data are included in the calculation of regional and
global averages.
p Based on small denominators (typically 25–29 unweighted
cases). No data based on fewer than 25 unweighted cases
are displayed.
a/Sub-Saharan Africa includes the Sudan and Djibouti.
δ Due to the cession in July 2011 of the Republic of South
Sudan by the Republic of the Sudan, and its subsequent
admission to the United Nations on 14 July 2011,
disaggregated data for the Sudan and South Sudan as
separate States are not yet available for all indicators. In
these cases, aggregated data are presented for the Sudan
pre-cession.
Some estimates do not add up to the totals because of rounding.
Low- and middle-income countries are classified as such by the
World Bank as of July 2013; these countries form the basis for
the data analysis in UNAIDS, UNICEF and WHO.
77
TABLE 6
Protection, care and support for children affected by HIV and AIDS
Orphaned and vulnerable children
Towards an AIDS-Free Generation – Children and AIDS: Sixth Stocktaking Report, 2013
Countries and areas
Afghanistan
Albania
Algeria
Andorra
Angola
Antigua and Barbuda
Argentina
Armenia
Australia
Austria
Azerbaijan
Bahamas
Bahrain
Bangladesh
Barbados
Belarus
Belgium
Belize
Benin
Bhutan
Bolivia (Plurinational State of)
Bosnia and Herzegovina
Botswana
Brazil
Brunei Darussalam
Bulgaria
Burkina Faso
Burundi
Cabo Verde
Cambodia
Cameroon
Canada
Central African Republic
Chad
Chile
China
Colombia
Comoros
Congo
Cook Islands
Costa Rica
Côte d’Ivoire
Croatia
Cuba
Cyprus
Czech Republic
Democratic People’s Republic of Korea
Democratic Republic of the Congo
Denmark
Djibouti
Dominica
Dominican Republic
Ecuador
Egypt
El Salvador
Equatorial Guinea
Eritrea
Estonia
Ethiopia
Fiji
78
Children who have lost
one or both parents
due to all causes, 2012
–
–
–
–
1,100,000
–
–
–
–
–
–
–
–
–
–
–
–
–
450,000
–
–
–
160,000
–
–
–
980,000
680,000
–
–
1,300,000
–
–
960,000
–
–
–
–
220,000
–
–
1,300,000
–
–
–
–
–
5,100,000
–
43,000
–
–
–
–
–
–
160,000
–
4,500,000
–
Children who have lost one or
both parents due to AIDS, 2012
Low
High
Estimate
estimate
estimate
–
–
–
–
120,000
–
–
–
–
–
–
–
–
–
–
–
–
–
43,000
–
–
–
120,000
–
–
–
130,000
89,000
–
–
330,000
–
–
170,000
–
–
–
–
64,000
–
–
380,000
–
–
–
–
–
390,000
–
7,200
–
–
–
–
–
–
21,000
–
900,000
–
–
–
–
–
87,000
–
–
–
–
–
–
–
–
–
–
–
–
–
36,000
–
–
–
100,000
–
–
–
110,000
73,000
–
–
300,000
–
–
140,000
–
–
–
–
58,000
–
–
340,000
–
–
–
–
–
350,000
–
5,600
–
–
–
–
–
5,000
14,000
–
<100
–
–
–
–
–
170,000
–
–
–
–
–
–
–
–
–
–
–
–
–
51,000
–
–
–
130,000
–
–
–
160,000
110,000
–
–
380,000
–
–
200,000
–
–
–
–
72,000
–
–
440,000
–
–
–
–
–
440,000
–
8,700
–
–
–
–
–
20,000
30,000
–
<100
–
% of children whose
Orphan school
Children both of
Children both of whose
households received
parents have died due whose parents have attendance ratio,
external support, 2008–2012*
2008–2012*
died due to AIDS, 2012
to any cause, 2012
–
–
–
–
170,000
–
–
–
–
–
–
–
–
–
–
–
–
–
60,000
–
–
–
46,000
–
–
–
160,000
140,000
–
–
250,000
–
–
180,000
–
–
–
–
39,000
–
–
240,000
–
–
–
–
–
860,000
–
7,100
–
–
–
–
–
–
25,000
–
650,000
–
–
–
–
–
38,000
–
–
–
–
–
–
–
–
–
–
–
–
–
13,000
–
–
–
44,000
–
–
–
46,000
40,000
–
–
120,000
–
–
64,000
–
–
–
–
21,000
–
–
130,000
–
–
–
–
–
140,000
–
2,300
–
–
–
–
–
–
7,400
–
130,000
–
–
–
–
–
85
–
–
–
–
–
–
–
–
84 x
–
–
–
–
90 x
–
–
–
–
–
–
–
101
82
–
86
94
–
88
117
–
–
93
–
74 p
–
–
66
–
–
–
–
–
74
–
–
–
98
–
–
–
–
–
–
90
–
–
–
–
–
–
–
–
–
–
–
–
–
–
–
–
–
–
–
–
–
–
–
26
–
–
–
7
–
–
–
9
–
7
–
–
–
–
–
–
–
–
–
–
–
–
–
–
9
–
–
–
–
–
–
–
–
–
–
–
–
y
x
x
x
x
Protection, care and support for children affected by HIV and AIDS
Orphaned and vulnerable children
Countries and areas
Finland
France
Gabon
Gambia
Georgia
Germany
Ghana
Greece
Grenada
Guatemala
Guinea
Guinea-Bissau
Guyana
Haiti
Holy See
Honduras
Hungary
Iceland
India
Indonesia
Iran (Islamic Republic of)
Iraq
Ireland
Israel
Italy
Jamaica
Japan
Jordan
Kazakhstan
Kenya
Kiribati
Kuwait
Kyrgyzstan
Lao People’s Democratic Republic
Latvia
Lebanon
Lesotho
Liberia
Libya
Liechtenstein
Lithuania
Luxembourg
Madagascar
Malawi
Malaysia
Maldives
Mali
Malta
Marshall Islands
Mauritania
Mauritius
Mexico
Micronesia (Federated States of)
Monaco
Mongolia
Montenegro
Morocco
Mozambique
Myanmar
Namibia
Children who have lost
one or both parents
due to all causes, 2012
–
–
61,000
–
–
–
1,000,000
–
–
–
670,000
120,000
–
430,000
–
–
–
–
–
–
–
–
–
–
–
–
–
–
–
2,600,000
–
–
–
–
–
–
220,000
190,000
–
–
–
–
–
1,300,000
–
–
–
–
–
–
–
–
–
–
–
–
–
2,000,000
–
130,000
Children who have lost one or
both parents due to AIDS, 2012
Low
High
Estimate
estimate
estimate
–
–
19,000
–
–
–
190,000
–
–
–
46,000
17,000
–
100,000
–
–
–
–
–
–
–
–
–
–
–
–
–
–
–
1,000,000
–
–
–
–
–
–
150,000
23,000
–
–
–
–
–
770,000
–
–
–
–
–
–
–
–
–
–
–
–
–
740,000
–
76,000
–
–
16,000
–
–
–
160,000
–
–
–
35,000
13,000
–
90,000
–
–
–
–
–
–
–
–
–
–
–
–
–
–
–
<100
–
–
–
–
–
–
140,000
19,000
–
–
–
–
–
700,000
–
–
–
–
–
–
–
–
–
–
–
–
–
640,000
–
62,000
–
–
22,000
–
–
–
230,000
–
–
–
58,000
23,000
–
120,000
–
–
–
–
–
–
–
–
–
–
–
–
–
–
–
<100
–
–
–
–
–
–
170,000
27,000
–
–
–
–
–
850,000
–
–
–
–
–
–
–
–
–
–
–
–
–
870,000
–
95,000
% of children whose
Orphan school
Children both of
Children both of whose
households received
parents have died due whose parents have attendance ratio,
external support, 2008–2012*
2008–2012*
died due to AIDS, 2012
to any cause, 2012
–
–
9,900
–
–
–
140,000
–
–
–
100,000
21,000
–
61,000
–
–
–
–
–
–
–
–
–
–
–
–
–
–
–
410,000
–
–
–
–
–
–
64,000
30,000
–
–
–
–
–
270,000
–
–
–
–
–
–
–
–
–
–
–
–
–
420,000
–
25,000
–
–
6,000
–
–
–
53,000
–
–
–
15,000
6,000
–
29,000
–
–
–
–
–
–
–
–
–
–
–
–
–
–
–
290,000
–
–
–
–
–
–
59,000
7,500
–
–
–
–
–
240,000
–
–
–
–
–
–
–
–
–
–
–
–
–
260,000
–
22,000
–
–
101
106
–
–
76
–
–
–
73
109
–
96
–
92
–
–
72
–
–
94
–
–
–
–
–
–
–
95
–
–
–
80
–
–
98
85
–
–
–
–
74
97
–
–
92
–
–
100
–
–
–
–
102
–
–
91
–
100
x
x
x
x
p
x
–
–
–
–
–
–
–
–
–
–
–
8
13
5
–
–
–
–
–
–
–
–
–
–
–
15
–
–
–
21
–
–
–
–
–
–
–
–
–
–
–
–
–
17
–
–
–
–
–
–
–
–
–
–
–
–
–
22
–
17
x
x
x
x
x
x
79
TABLE 6
Protection, care and support for children affected by HIV and AIDS
Orphaned and vulnerable children
Towards an AIDS-Free Generation – Children and AIDS: Sixth Stocktaking Report, 2013
Countries and areas
Nauru
Nepal
Netherlands
New Zealand
Nicaragua
Niger
Nigeria
Niue
Norway
Oman
Pakistan
Palau
Panama
Papua New Guinea
Paraguay
Peru
Philippines
Poland
Portugal
Qatar
Republic of Korea
Republic of Moldova
Romania
Russian Federation
Rwanda
Saint Kitts and Nevis
Saint Lucia
Saint Vincent and the Grenadines
Samoa
San Marino
Sao Tome and Principe
Saudi Arabia
Senegal
Serbia
Seychelles
Sierra Leone
Singapore
Slovakia
Slovenia
Solomon Islands
Somalia
South Africa
South Sudan
Spain
Sri Lanka
State of Palestine
Sudan
Suriname
Swaziland
Sweden
Switzerland
Syrian Arab Republic
Tajikistan
Thailand
The former Yugoslav
Republic of Macedonia
Timor-Leste
Togo
Tonga
80
Children who have lost
one or both parents
due to all causes, 2012
–
–
–
–
–
–
11,500,000
–
–
–
–
–
–
320,000
–
–
–
–
–
–
–
–
–
–
590,000
–
–
–
–
–
–
–
–
–
–
370,000
–
–
–
–
–
4,000,000
470,000
–
–
–
–
–
120,000
–
–
–
–
–
Children who have lost one or
both parents due to AIDS, 2012
Low
High
Estimate
estimate
estimate
–
–
–
–
–
–
–
–
–
–
–
–
–
–
–
–
–
–
2,200,000 1,900,000 2,600,000
–
–
–
–
–
–
–
–
–
–
–
–
–
–
–
–
–
–
13,000
7600
19,000
–
–
–
–
–
–
–
–
–
–
–
–
–
–
–
–
–
–
–
–
–
–
–
–
–
–
–
–
–
–
120,000
110,000
140,000
–
–
–
–
–
–
–
–
–
–
–
–
–
–
–
–
–
–
–
–
–
–
–
–
–
–
–
–
–
–
26,000
18,000
37,000
–
–
–
–
–
–
–
–
–
–
–
–
–
–
–
2,500,000 2,300,000 2,700,000
110,000
67,000
170,000
–
–
–
–
–
–
–
–
–
–
–
–
–
–
–
78,000
69,000
87,000
–
–
–
–
–
–
–
–
–
–
–
–
–
–
–
% of children whose
Orphan school
Children both of
Children both of whose
households received
parents have died due whose parents have attendance ratio,
external support, 2008–2012*
2008–2012*
died due to AIDS, 2012
to any cause, 2012
–
–
–
–
–
–
2,000,000
–
–
–
–
–
–
43,000
–
–
–
–
–
–
–
–
–
–
110,000
–
–
–
–
–
–
–
–
–
–
56,000
–
–
–
–
–
1,100,000
75,000
–
–
–
–
–
33,000
–
–
–
–
–
–
–
–
–
–
–
750,000
–
–
–
–
–
–
3,900
–
–
–
–
–
–
–
–
–
–
47,000
–
–
–
–
–
–
–
–
–
–
7,800
–
–
–
–
–
940,000
34,000
–
–
–
–
–
30,000
–
–
–
–
–
–
72
–
–
–
67
100
–
–
–
–
–
–
–
–
–
–
–
–
–
–
–
–
–
91
–
–
–
–
–
–
–
97
–
–
88
–
–
–
–
78
101
78
–
–
–
–
–
100
–
–
–
–
93
–
–
–
–
–
–
–
–
360,000
–
–
90,000
–
–
75,000
–
–
110,000
–
–
62,000
–
–
30,000
–
75
86
–
p
–
–
–
x
x
x
–
–
–
–
–
–
6
–
–
–
–
–
–
–
–
–
–
–
–
–
–
–
–
–
13
–
–
–
–
–
4x
–
–
–
–
1
–
–
–
–
–
–
–
–
–
–
–
–
41 x
–
–
–
–
21 x
–
–
6x
–
Protection, care and support for children affected by HIV and AIDS
Orphaned and vulnerable children
Countries and areas
Children who have lost
one or both parents
due to all causes, 2012
Trinidad and Tobago
Tunisia
Turkey
Turkmenistan
Tuvalu
Uganda
Ukraine
United Arab Emirates
United Kingdom
United Republic of Tanzania
United States
Uruguay
Uzbekistan
Vanuatu
Venezuela (Bolivarian Republic of)
Viet Nam
Yemen
Zambia
Zimbabwe
–
–
–
–
–
2,700,000
–
–
–
3,100,000
–
–
–
–
–
–
–
1,400,000
1,200,000
SUMMARY INDICATORS
Sub-Saharan Africaa/
Eastern and Southern Africa
West and Central Africa
Middle East and North Africa
South Asia
East Asia and the Pacific
Latin America and the Caribbean
CEE/CIS
Least developed countries
Low- and middle-income countries
World
56,000,000
27,900,000
28,100,000
5,500,000
40,800,000
26,900,000
7,800,000
6,200,000
42,900,000
140,000,000
150,000,000
DEFINITIONS OF THE INDICATORS
Children who have lost one or both parents due to all
causes: Estimated number of children (aged 0–17) as of 2012
who have lost one or both parents due to any cause.
Children who have lost one or both parents due to AIDS:
Estimated number of children (aged 0–17) as of 2012 who have
lost one or both parents due to AIDS.
Children both of whose parents have died due to any
cause: Estimated number of children (aged 0–17) as of 2012
who have lost both parents due to any cause.
Children both of whose parents have died due to AIDS:
Estimated number of children (aged 0–17) as of 2012 who have
lost both parents due to AIDS.
Orphan school attendance ratio: Percentage of children
(aged 10–14) who have lost both biological parents and who
are currently attending school as a percentage of non-orphaned
children of the same age who live with at least one parent and
who are attending school.
Percentage of children whose households received
external support, 2005–2009: Percentage of orphaned and
vulnerable children whose households received free basic
external support in caring for the child.
Children who have lost one or
both parents due to AIDS, 2012
Low
High
Estimate
estimate
estimate
–
–
–
–
–
–
–
–
–
–
–
–
–
–
–
1,000,000
860,000 1,200,000
–
–
–
–
–
–
–
–
–
1,200,000 1,000,000 1,300,000
–
–
–
–
–
–
–
–
–
–
–
–
–
–
–
–
–
–
–
–
–
670,000
600,000
760,000
890,000
810,000
980,000
15,100,000
10,600,000
4,400,000
100,000
610,000
780,000
830,000
260,000
7,600,000
17,700,000
17,800,000
13,400,000
9,600,000
3,800,000
71,000
180,000
460,000
650,000
200,000
6,700,000
15,900,000
16,100,000
16,900,000
11,800,000
5,200,000
150,000
2,100,000
1,200,000
1,000,000
340,000
8,600,000
21,400,000
21,600,000
MAIN DATA SOURCES
% of children whose
Orphan school
Children both of
Children both of whose
households received
parents have died due whose parents have attendance ratio,
external support, 2008–2012*
2008–2012*
died due to AIDS, 2012
to any cause, 2012
–
–
–
–
–
510,000
–
–
–
570,000
–
–
–
–
–
–
–
370,000
350,000
–
–
–
–
–
330,000
–
–
–
370,000
–
–
–
–
–
–
–
280,000
330,000
10,300,000
5,500,000
4,800,000
490,000
3,600,000
2,000,000
520,000
410,000
6,900,000
17,300,000
17,600,000
5,000,000
3,500,000
1,500,000
21,000
180,000
110,000
110,000
57,000
2,400,000
5,500,000
5,500,000
Children who have lost one or both parents due to all
causes: UNAIDS 2012 HIV and AIDS estimates.
Children who have lost one or both parents due to AIDS,
2012: UNAIDS 2012 HIV and AIDS estimates.
Children both of whose parents have died due to any
cause, 2012: UNAIDS 2012 HIV and AIDS estimates.
Children both of whose parents have died due to AIDS,
2012: UNAIDS 2012 HIV and AIDS estimates.
Orphan school attendance ratio: UNICEF global databases,
2013, based on DHS, MICS and other national surveys,
2006–2012.
Percentage of children whose households received
external support: UNICEF global databases, 2013, based
on DHS, MICS and other national surveys, 2006–2012.
–
–
–
–
–
87
98 x
–
–
95
–
–
–
–
–
–
–
92
92
91
90
91
–
72
–
–
–
88
–
–
ǂ
ǂ
ǂ
ǂ
ǂ
**ǂ
ǂ
ǂ
ǂ
**ǂ
**ǂ
–
–
–
–
–
11 x
–
–
–
7
–
–
–
–
–
–
–
19 y
21
–
–
–
–
–
–
–
–
–
–
–
ǂ
ǂ
ǂ
ǂ
ǂ
**ǂ
ǂ
ǂ
ǂ
**ǂ
**ǂ
NOTES
– Data not available.
* Data refer to the most recent year available during the period
specified in the column heading.
**Excludes China.
ǂ Regional averages are calculated only when the population
represents 50 per cent or more of the region’s total population
of interest.
x Data refer to years or periods other than those specified in the
column heading. Such data are not included in the calculation
of regional and global averages, with the exception of
2005–2006 India. Estimates from years prior to 2005 are
not displayed.
y Data differ from the standard definition or refer to only
part of a country. If they fall within the reference period,
such data are included in the calculation of regional and
global averages.
p Based on small denominators (typically 25–29 unweighted
cases). No data based on fewer than 25 unweighted cases
are displayed.
a/Sub-Saharan Africa includes the Sudan and Djibouti.
Some estimates do not add up to the totals because of rounding.
Low- and middle-income countries are classified as such by the
World Bank as of July 2013; these countries form the basis for
the data analysis in UNAIDS, UNICEF and WHO.
81
Photo captions AND CREDITS
Cover
Children running home after taking part in a discussion group on
health, hygiene, sanitation and HIV.
© UNICEF/RWAA2011-00631/Noorani
Page 2
Left: See caption for pages 4–5
Centre: See caption for pages 24–25
Right: See caption for pages 40–41
Pages 4–5
In Lilongwe, Malawi, a mother receiving lifelong treatment with
antiretroviral (ARV) medicines holds her infant son.
© UNICEF Malawi/2013/Marinovich
Page 9
At a hospital in Côte d’Ivoire’s Worodougou Region, a nurse
tells a woman that she has tested negative for HIV.
© UNICEF/NYHQ2011-0238/Asselin
Additional photos in the online version of this report:
A health worker performs an HIV rapid test at the UNICEFsupported Redemption Public Hospital in Monrovia, Liberia.
Such tests allow for one-visit diagnosis.
© UNICEF/NYHQ2011-1757/Pirozzi
A health worker checks a pregnant woman in an integrated
health centre in the town of Maradi, in southern Niger.
© UNICEF/NIGB2010-0032/Pirozzi
Towards an AIDS-Free Generation – Children and AIDS: Sixth Stocktaking Report, 2013
Page 17
Point-of-care diagnostics can be used without extensive laboratory
infrastructure and technical skills.
© UNITAID/2013/Giulio Donini
Additional photos in the online version of this report:
In Mozambique, viral load tests used to be transported many
kilometres for processing. New machines can process the tests
locally in one hour.
© UNITAID/2013/Giulio Donini
An adolescent living with HIV in Tamil Nadu is dressed for school.
The MAC AIDS Fund, UNICEF and the Government of India are
rolling out a telemedicine initiative to provide services to families
like hers.
© UNICEF India/2013
Page 18
A South African woman living with HIV holds the single pill she
takes daily for ARV treatment – an innovative approach that ends
the need for a daily regimen of several pills.
© UNICEF South Africa/2013/Marinovich
Page 20
A woman living with HIV embraces her daughter at a hospital
in Moundou, Chad. The mother participated in an elimination of
mother-to-child transmission of HIV (EMTCT) programme and the
child remains free of HIV.
© UNICEF/NYHQ2011-2151/Esteve
Page 21
Two children play at the UNICEF-supported Kaldirgoch Day Care
Centre in Tashkent, Uzbekistan. The Centre provides care and
medical services to children living with HIV and their families.
© UNICEF/NYHQ2011-1692/Pirozzi
82
Additional photos in the online version of this report:
An eight-year-old girl living with HIV in Ruili City, China, is
embraced by UNICEF Ambassador and international film star
Maggie Cheung.
© UNICEF China/2010/Liu
Notes and drawings by children and social workers at the
UNICEF-sponsored Happy Kids and Adolescent Centre in
Freetown, Sierra Leone.
© UNICEF Sierra Leone/2011/Asselin
Page 22
In rural Zambia, a two-year-old boy, who is living with HIV and on
ARV treatment, smiles at his aunt. She took over his care after his
mother died of AIDS-related complications.
© UNICEF/NYHQ2010-2928/Nesbitt
Page 23
A registered nurse and midwife stands in the Chelstone Clinic in
Lusaka, the Zambian capital. The clinic’s services include prevention of mother-to-child transmission of HIV.
© UNICEF/NYHQ2011-0268/Nesbitt
Additional photos in the online version of this report:
A family case manager living with HIV, stands in the Red Ribbon
HIV/AIDS awareness campaign’s exhibition train at Vijaywada
station in India.
© UNICEF/INDA2010-00379/Purushotham
Village health workers in Zimbabwe set out on their bicycles to
provide health services to rural communities.
© UNICEF/AUSNC2012-0406/Tattersall
Pages 24–25
A girl who lives and works on the streets of Colombo, Sri Lanka,
holds a pocket calendar distributed at an HIV awareness event
hosted by the global Think Wise partnership.
© UNICEF/NYHQ2012-1507/Jayasuriya
Page 30
An adolescent boy injects drugs in an abandoned building
in Eastern Europe.
© UNICEF Serbia/2010/Maccak
Additional photos in the online version of this report:
Adolescent transgender sex workers on a popular tourist street.
© UNICEF Laos
A young girl, aged 15, lies on a bed in one of the rooms where
she meets clients in a brothel in Abidjan, Côte d’Ivoire.
© UNICEF Côte d’Ivoire/2013/Asselin
Page 31
An adolescent boy grimaces as a health worker collects a blood
sample for an HIV test at a youth centre that provides free testing
in Mondou, Chad.
© UNICEF/NYHQ2011-2154/Esteve
Additional photos in the online version of this report:
In the city of Sfax, Tunisia, a doctor takes blood for an HIV test
from a young patient at a UNICEF-supported centre.
© UNICEF/NYHQ2011-0612/Ramoneda
In Odessa, Ukraine, a nurse takes blood for an HIV test in a mobile
lab. Hope, Faith and Love, a UNICEF-supported NGO, tests young
female sex workers for HIV and syphilis, and counsels them on
issues related to HIV and other sexually transmitted infections.
© UNICEF Ukraine/2010/Pirozzi
Page 33
Young people participating in India’s Red Ribbon Club programme
for HIV prevention walk in Chandrapur District, Maharashtra. The
club is a voluntary forum for providing HIV information in villages.
© UNICEF/INDA2011-00068/Crouch
AIDS
acquired immunodeficiency syndrome
Additional photos in the online version of this report:
ART
antiretroviral therapy
At a youth centre in Moundou, Chad, a girl laughs during a skit
on HIV prevention. The centre teaches adolescents how to protect
themselves against the virus and offers HIV testing.
© UNICEF/NYHQ2011-2156/Esteve
ARV
antiretroviral (drug)
CD4
cluster of differentiation or designation 4:
Adolescents attend an HIV and AIDS awareness and prevention
workshop in the indigenous Shipibo-Conibo community of Nuevo
Saposoa in the Ucayali Region in the Peruvian Amazon.
© UNICEF/NYHQ2010-2084/Markisz
A girl attends a workshop for HIV and AIDS peer educators at a
UNICEF-supported social service centre in the city of Aden, Yemen.
© UNICEF/NYHQ2007-1660/Pirozzi
ACRONYMS
white blood count measure of eligibility for
ART treatment
CDC
Centers for Disease Control and Prevention
DHS
Demographic and Health Surveys
EGPAF
Elizabeth Glaser Pediatric AIDS Foundation
EID
early infant diagnosis (of HIV)
Page 39
An eleven-year-old boy, whose parents died of AIDS-related
causes, at the home of his uncle in Freetown, Sierra Leone.
The child was expelled from his aunt’s home when she learned
he is living with HIV.
© UNICEF/NYHQ2011-0759/Asselin
EMTCT
elimination of mother-to-child transmission (of HIV)
GARPR
Global AIDS Response Progress Reporting
GFATM
Global Fund to Fight AIDS, Tuberculosis and Malaria
HIV
human immunodeficiency virus
Additional photos in the online version of this report:
HPV
human papillomavirus
A 15-year-old girl, who is living with HIV, writes on the wall of
the abandoned house she shares with her family in Zanzibar
Island, Tanzania.
© UNICEF/NYHQ2010-1842/Noorani
IATT
Interagency Task Team
ILO
International Labour Organization
MCH
maternal and child health
MDGs
Millennium Development Goals
MICS
Multiple Indicator Cluster Surveys
NEPAD
New Partnership for Africa’s Development
Page 44
Tent for the provision of antiretroviral treatment (ART) in
Chiaquelane Camp, Chokwé district, Mozambique.
© UNICEF Mozambique/2013
NGO
non-governmental organization
PEPFAR
(United States) President’s Emergency Plan for
Additional photos in the online version of this report:
PMTCT
prevention of mother-to-child transmission (of HIV)
SMS
short message service (text messaging)
TB
tuberculosis
UNAIDS
Joint United Nations Programme on HIV/AIDS
UNDP United Nations Development Programme
Pages 40–41
A woman who lives with HIV and her granddaughter, aged 14, at
home in their village south of Bulawayo, Zimbabwe. They are one
of many families benefitting from social support.
© UNICEF/ZIMA2011-00003/Pirozzi
A nurse in Ouham Prefecture, Central African Republic, carries
an orphaned child whose mother died of AIDS-related causes.
The nurse is now caring for the child.
© UNICEF/NYHQ2011-0814/Grarup
A woman living with HIV speaks to UNICEF staff in the Bouldougu
slum on the outskirts of Djibouti City.
© UNICEF/NYHQ2011-1357/Takahashi
A sixteen-year-old girl looks out over the displacement camp
where she lives in Port-au-Prince, Haiti. She is pregnant and
living with HIV.
© UNICEF/NYHQ2011-1324/Dormino
AIDS Relief
UNESCO United Nations Educational, Scientific and
Cultural Organization
UNFPA United Nations Population Fund
UNHCR Office of the United Nations High Commissioner
for Refugees
UNICEF United Nations Children’s Fund
UNODC
United Nations Office on Drugs and Crime
VMMC
voluntary medical male circumcision
WFP
World Food Programme
WHO
World Health Organization
UNITE FOR CHILDREN
UNITE AGAINST AIDS
For the first time in the history of the HIV epidemic,
the global community has accumulated the knowledge, experience and tools to achieve an AIDS-free
generation. This means a generation in which all
children are born free of HIV and remain so for the
first two decades of life, from birth through adolescence. It also means that children living with and
affected by HIV have access to the treatment, protection, care and support they need to remain alive
and well.
Focusing on the first and second decades of life, the
Children and AIDS: Sixth Stocktaking Report, 2013:
• reviews the HIV burden among children and
adolescents and the progress being made
• identifies key strategies to accelerate access to
HIV prevention, treatment, protection, care and
support for children and adolescents
• s ummarizes opportunities arising from recent
scientific advances, new technology and
emerging practice innovations
• seeks to mobilize national and international
efforts to keep children HIV-free and ensure that
children living with HIV remain AIDS-free.
F or
supporting data and materials, please visit:
<www.childrenandaids.org>.
Unite for Children, Unite against AIDS
United Nations Children’s Fund
3 United Nations Plaza
New York, NY 10017, USA
E-mail: [email protected]
Website: www.childrenandaids.org
ISBN: 978-92-806-4723-5
© United Nations Children’s Fund (UNICEF)
November 2013


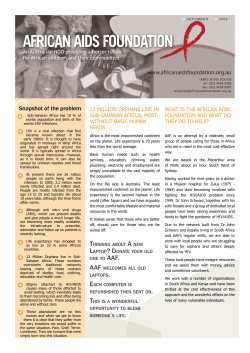


© Copyright 2026