
2012 Annual Report NSW Child Death Review Team October 2013
NSW Child Death Review Team
Annual Report
2012
October 2013
NSW Child Death Review Team
NSW Ombudsman
Level 24, 580 George Street
Sydney NSW 2000
General enquiries: (02) 9286 1000
Toll free (outside Sydney Metro Area, NSW only): 1800 451 524
Facsimile: (02) 9283 2911
Telephone typewriter: (02) 9264 8050
Website: www.ombo.nsw.gov.au
Email: [email protected]
ISSN 1329-640X
ISBN 978-1-925061-15-4 NSW Government Publication
© NSW Ombudsman, October 2013
This work is copyright, however material from this publication may be copied
and published by State or Federal Government Agencies without permission
of the Ombudsman on the condition that the meaning of the material is not
altered and the NSW Ombudsman is acknowledged as the source of the
material. Any other persons or bodies wishing to use material must seek
permission.
NSW Child Death Review Team | Annual Report 2012
Foreword
On behalf of the NSW Child Death Review Team, I extend my sincere sympathies to the family and friends of children who have
died and whose deaths are considered in this report. The death of any child is an immense loss – for their family and friends,
and for our broader community. It is critical that every effort is made to prevent and reduce the likelihood of these deaths.
This report is about the 493 children whose deaths were registered in NSW in 2012. The number of deaths, and the mortality
rate of 29.10 per 100,000 children, is the lowest since the Team began in 1996.
This is positive, and the Team welcomes important actions that have been taken in the past year to increase awareness and
reduce deaths associated with swimming pools, low speed vehicle run-over incidents, and accidental poisoning. However, the
report also demonstrates the need for further and concerted efforts to reduce child deaths.
Of current concern to the Team are the deaths of children associated with off-road vehicles. Over the 10 year period to 2012,
25 children died in off-road vehicle fatalities, involving vehicles such as quad bikes. The Team’s review found that the risk of
death or serious injury to children associated with the use of off-road vehicles is substantial, and the measures to prevent or
mitigate the risk are insufficient.
Importantly, the report provides a sobering reminder that preventing child deaths is a whole-of-community responsibility.
In 2012, the deaths of 20 children were intentional, including 16 deaths due to suicide. The report also underscores the
importance of promoting key messages to parents and other carers about reducing the risk of sudden and unexpected death
in infancy, particularly in relation to safe sleeping practices; and the risk of children drowning in bathtubs.
The work of the Team is focused on preventing child deaths, and ensuring that the knowledge gained from our reviews of
these deaths assists in sustaining and improving the lives of others. To that end, the Team has made 12 recommendations,
and will closely monitor their implementation.
Bruce Barbour
Convenor, Child Death Review Team
NSW Ombudsman
NSW Child Death Review Team | Annual Report 2012
i
NSW Child Death Review Team
Team members in 2012 - 2013 were:
Statutory members
Aboriginal representatives
Mr Bruce Barbour
Convenor
NSW Ombudsman
Professor Ngiare Brown
Executive Manager Research, National Aboriginal
Community Controlled Health Organisation
Ms Megan Mitchell (until March 2013)
Commissioner for Children and Young People
Professor Megan Davis
Ms Kerryn Boland (from March 2013)
Commissioner for Children and Young People
Children’s Guardian
Independent members
Mr Steve Kinmond
Community and Disability Services Commissioner
Deputy Ombudsman
Agency representatives
Ms Robyn Bale (Education and Communities)
Director, Student Engagement and Interagency Partnerships
Department of Education and Communities
Detective Superintendent Michael Willing
(from July 2012) (NSW Police Force)
Commander Homicide, NSW Police Force
Ms Anne Marie Dwyer (until December 2012)
(Ageing, Disability and Home Care)
Executive Director, Prevention and Pathways, Ageing,
Disability and Home Care
Ms Christine Callaghan (from July 2013)
(Ageing, Disability and Home Care)
A/Executive Director, Home Care and Operational Policy,
Ageing, Disability and Home Care
Ms Helen Freeland (until January 2013)
(Community Services)
A/Deputy Chief Executive, Operations, Community Services
Director, Indigenous Law Centre, University of NSW
Dr Susan Adams
Director, Division of Surgery and Senior Staff Specialist,
Paediatric General Surgeon, Sydney Children’s Hospital
Dr Luciano Dalla-Pozza
Head of Department and Senior Staff Specialist (Oncology),
Children’s Hospital at Westmead
Dr Jonathan Gillis
National Medical Director, Organ and Tissue Authority
(Deputy Convenor)
Dr Bronwyn Gould
General Practitioner
Dr John Howard
Senior Lecturer, National Drug and Alcohol Research Centre,
University of NSW
Professor Heather Jeffery
International Maternal and Child Health, University of Sydney/
Royal Prince Alfred Hospital
Professor Ilan Katz
Director, Social Policy Research Centre, University of NSW
Dr Helen Somerville
Visiting Medical Officer, Department of Gastroenterology,
Children’s Hospital at Westmead
Dr Ella Sugo
Paediatric Pathologist, Sydney Children’s Hospital
Ms Kate Alexander (from July 2013)
(Community Services)
Establishment Senior Practitioner, Community Services
Mr Marcel Savary (Attorney General and Justice)
Courts Policy Manager, Department of Attorney General
and Justice
Mr Maurice Taylor (Office of the State Coroner)
Coordinator, Coronial Information and Support Unit,
State Coroner’s Office
Professor Les White (NSW Health)
NSW Chief Paediatrician, Ministry of Health
ii
NSW Child Death Review Team | Annual Report 2012
Acknowledgements
The Child Death Review Team would like to thank NSW state government and other agencies that provided data and other
information for this report, including the NSW Registry of Births, Deaths and Marriages; the State Coroner’s Office; the Victorian
Institute of Forensic Medicine and Victorian Department of Justice (National Coronial Information System); the Department of
Family and Community Services, in particular Community Services and the Child Death and Critical Reports Unit; NSW Health;
and the NSW Police Force.
The Team would also like to acknowledge Sue Walker from the National Centre for Health Information Research and Kelly
Savage for providing cause of death coding; and Fadwa Al-Yaman, Deanna Pagnini and Bernice Cropper from the Australian
Institute of Health and Welfare for their work on two projects for the Team.
Thanks to Dr Jonathan Gillis, Dr Bronwyn Gould, Dr Michael Fairley and Dr Julie Brown for their review of matters and provision
of expert advice.
The Team is also grateful for the input and advice of the members of the CDRT sub-committees. In this regard, we thank
Professor Les White, Professor Heather Jeffery, Dr Bronwyn Gould, Dr Ella Sugo and Maurice Taylor for their work on
Sudden Unexpected Death in Infancy; and thank Professor Ilan Katz, Helen Freeland, Steve Kinmond, Dr Jonathan Gillis,
Kate Alexander, Kerryn Boland, and Christine Callaghan for their advice on the Team’s research project into causes of death
of children with a child protection history.
Finally, the Team appreciates the contribution of information from agencies and child death review committees in other states
and territories.
NSW Child Death Review Team | Annual Report 2012
iii
iv
NSW Child Death Review Team | Annual Report 2012
Chapter 1. Contents
Foreword............................................................................................................................................. i
NSW Child Death Review Team.........................................................................................................ii
Acknowledgements...........................................................................................................................iii
Executive summary........................................................................................................................... 1
List of recommendations.................................................................................................................. 8
Chapter 1. Introduction....................................................................................................................10
Chapter 2. All child deaths in 2012 ................................................................................................14
Chapter 3. Leading causes of death of children in NSW in 2012..................................................19
Chapter 4. Children who died outside of NSW............................................................................. 24
Chapter 5. Deaths due to natural causes...................................................................................... 25
Chapter 6. Deaths from conditions arising in the perinatal period............................................. 29
Chapter 7. Deaths from congenital and chromosomal causes.................................................... 32
Chapter 8. Deaths from neoplasms............................................................................................... 35
Chapter 9. Deaths from diseases of the nervous system............................................................ 38
Chapter 10. Deaths from diseases of the respiratory system...................................................... 40
Chapter 11. Deaths from endocrine, nutritional or metabolic diseases...................................... 42
Chapter 12. Deaths from diseases of the circulatory system...................................................... 44
Chapter 13. Deaths from infectious and parasitic diseases........................................................ 46
Chapter 14. Deaths of infants and Sudden Unexpected Death in Infancy ................................. 49
Chapter 15. Sudden Unexpected Death in Infancy (SUDI)........................................................... 52
Chapter 16. Deaths from all external causes................................................................................ 67
Chapter 17. Transport fatalities ..................................................................................................... 69
Chapter 18. Off-road vehicle fatalities 2003-2012 ........................................................................ 80
Chapter 19. Drowning..................................................................................................................... 89
Chapter 20. Deaths from other unintentional external causes.................................................... 97
Chapter 21. Suicide........................................................................................................................102
Chapter 22. Fatal assault ..............................................................................................................112
Chapter 23. Monitoring recommendations................................................................................... 114
Appendix 1: Methods.....................................................................................................................123
Appendix 2: Definitions ................................................................................................................126
Appendix 3: Definitional approach to Sudden Infant Death .......................................................129
NSW Child Death Review Team | Annual Report 2012
v
vi
NSW Child Death Review Team | Annual Report 2012
Executive summary
The purpose of the NSW Child Death Review Team is to prevent or reduce the likelihood of child deaths. The Team reports
annually on its work, including data, trends and patterns relating to child deaths, and its recommendations to reduce such
deaths. This is the Team’s seventeenth annual report, and the third since the NSW Ombudsman became Convenor.
The report provides information on 493 children whose deaths were registered in NSW in 2012.
The children who died in 2012
Consistent with previous years:
• most of the children who died (303; 61%) were infants under one year of age
• more males (293; 59%) than females (200; 41%) died, and
• Aboriginal and Torres Strait Islander children were over-represented in child deaths, with 52 children (11%) identified
as Indigenous.
While most of the children who died (63%) lived in major cities, the mortality rate was highest in remote areas of NSW.
The mortality rate was also highest amongst children who lived in the least socioeconomically advantaged areas.
The families of 88 children (18%) had a child protection history.
Leading causes of death in 2012
As the final cause of death of 35 children was unavailable at the time of writing, information and analysis relating to causes of
death in the report focuses on 458 children.
Overall, the leading causes of death for children in NSW in 2012 were consistent with previous years. The majority of deaths
(357 children; 78%) were due to natural causes, over half of which were due to certain conditions arising in the perinatal period
(32%), and congenital/chromosomal causes (22%). External (unnatural) causes comprised the third leading cause of the
deaths of children in 2012 (18%).
While the leading cause of death of infants was perinatal conditions, the leading cause for children over one year of age was
transport fatalities, followed by neoplasms (cancers and tumours).
Male children outnumbered female children in the majority of the leading causes of death. The largest gender imbalance was
in deaths from external causes. Almost twice as many males died from unnatural causes than did females.
Natural causes of death
Natural causes accounted for most of the deaths of infants aged less than one year (92%), and children aged 1-4 years (67%),
5-9 years (70%), and 10-14 years (54%). The lowest proportion of deaths from natural causes was amongst children aged
15-17 years (38%).
Conditions arising in the perinatal period
148 children died as a result of conditions arising in the perinatal period, such as complications of pregnancy, labour and
delivery, and disorders related to length of gestation and foetal growth, such as prematurity. The rate of perinatal deaths in
2012 was 1.49 per 1,000 live births. Most perinatal deaths occur in the first day of life: in 2012, just over half of the children who
died from these conditions were less than one day old.
Congenital malformations and chromosomal abnormalities
102 children died from congenital (88) and chromosomal (14) causes. The leading causes were congenital malformations of
the circulatory system (31%), and congenital malformations of the nervous system (23%). The vast majority of the children who
died from congenital and chromosomal causes (82%) were less than one year of age; almost half of these children died in the
first day of life. The rate of death from these causes in 2012 was 6.21 per 100,000 children.
NSW Child Death Review Team | Annual Report 2012
1
Neoplasms
29 children died as a result of neoplasms (cancers and tumours). In 2012, cancers and tumours were the leading natural cause
of death of children aged one year and over. The rate of death was 1.77 per 100,000 children, which was lower than previous
years. The most common causes of death from cancers and tumours were leukaemias (10 children) and malignant brain
tumours (7 children).
Diseases of the nervous system
25 children died as a result of diseases of the nervous system, mainly cerebral palsy, epilepsy, and spinal muscular dystrophy.
The rate of death from this cause was 1.52 per 100,000 children. There has been a decline in these deaths in NSW over the
past 15 years.
Diseases of the respiratory system
14 children died from diseases of the respiratory system. Half of these deaths were due to asthma, and four deaths were
attributed to pneumonia. The rate of death from respiratory diseases in 2012 was 0.85 per 100,000 children.
Endocrine, nutritional or metabolic diseases
11 children died as a result of metabolic diseases, including Batten disease, glycoprotein disorders and cystic fibrosis.
There were no deaths due to endocrine or nutritional diseases in 2012. The rate of death from metabolic diseases was
0.67 per 100,000 children.
Diseases of the circulatory system
10 children died from circulatory system diseases, including myocarditis, cardiomyopathy, and heart disease. Four of the
10 deaths were considered to be sudden cardiac deaths. The rate of death from circulatory system diseases was 0.61 per
100,000 children.
Infectious or parasitic diseases
Seven children died from infectious diseases, including sepsis, viral carditis, pertussis and meningococcal infection. There
were no deaths due to parasitic diseases in 2012. The rate of death from infectious diseases was 0.43 per 100,000 children.
Sudden and Unexpected Deaths in Infancy (SUDI)
Of the 303 infants whose deaths were registered in 2012, 50 (17%) were Sudden Unexpected Death in Infancy (SUDI). SUDI is
not a cause of death, but a classification to enable the consideration of deaths of otherwise healthy babies who die suddenly
and unexpectedly. It includes Sudden Infant Death Syndrome (SIDS).
Of the 50 SUDI:
• Most (32) of the infants died in the first three months of life. Thirteen infants were less than 28 days old (neonates).
• Over half (28) of the infants were male.
• Nine of the infants were Aboriginal. Aboriginal infants were overrepresented in SUDI, comprising 18 per cent of these deaths
in 2012.
• Over one-third (19) of the infants had a parent(s) who was born overseas in a country where the main language is not English.
• Infants from families with a child protection history were overrepresented in SUDI. Of the 50 families, over one-third (17)
had a child protection history. The vast majority (16) of the 17 infants with a child protection history who died suddenly and
unexpectedly were in unsafe sleep environments when they died.
Cause of death
At the time of writing, information on cause of death was available for 29 of the 50 infants:
• The cause of death of 13 infants was identified after investigation. The majority of explained SUDI (9) were due to
diseases and conditions that were not recognised as life threatening prior to death, including cardiac conditions and
respiratory infections.
• The cause of death of 16 infants remained unexplained after investigation. The deaths of these infants were generally
classified as consistent with SIDS, or due to ill-defined or unspecified causes of mortality.
2
NSW Child Death Review Team | Annual Report 2012
Modifiable risk factors
Modifiable risk factors for SUDI include exposure to tobacco smoke; infants sharing a sleep surface with another person; not
placing infants on their back to sleep; infants placed to sleep with loose bedding or other items; and infants placed to sleep
in bedding that is not infant-specific.
In 2012, more than three-quarters (39) of the 50 infants had at least one modifiable risk factor present. Almost all of these
infants (37) died while they were in a sleep environment, and most (22) had three or more risk factors present. Only three
infants who died in a sleep environment were placed to sleep alone in fixed infant-specific bedding.
Prevention messages
Key prevention messages to reduce the risk of SUDI are: to sleep babies on their back in a safe sleeping environment, on their
own, with their head and face uncovered, without loose bedding or objects, and in the same room as an adult caregiver; to
keep babies smoke free before and after birth; and to breastfeed.
The Team’s recommendations are aimed at achieving a comprehensive response to SUDI, including a multi-disciplinary case
review approach to the SUDI investigation process; an increased proportion of SUDI that are explained; and greater timeliness
of forensic pathology results. The Team is also focused on attaining consistent promotion of safe sleeping messages in
maternity facilities and the broader community, including education targeted at high-risk groups; and reducing the risk of
SUDI in families with a child protection history.
External causes of death
The deaths of 83 children were due to external (unnatural) causes. The majority (63) were due to unintentional or accidental
causes, mainly related to transport fatalities (39) and drowning (11). The deaths of 20 children were intentional, due to suicide
(16) or fatal assault (4).
Transport fatalities
The deaths of 39 children in 38 transport incidents were registered in 2012. Consistent with previous years, transport fatalities
were the leading external cause of death of children in NSW. The rate of death was 2.37 per 100,000 children, which was
slightly higher than the previous two years.
Of the 39 children who died in transport fatalities:
• Over half (20) were teenagers. Most of the teenagers (13) were 17 years of age, including seven who were driving a vehicle
at the time of their death.
• The majority (26) were male. In 2012, the rate of death from transport incidents of boys was almost twice that of girls.
• Four children (10%) were Aboriginal
Motor vehicle fatalities
The majority (28) of the children died in motor vehicle incidents: almost half of the children (19) were passengers, and nine
were drivers. Most (18) of the motor vehicle fatalities were single vehicle incidents, involving collision with stationary objects,
such as trees.
Most (16) of the 19 passenger deaths of children involved vehicles with adult drivers. Thirteen of these children who died
as passengers were using some form of child safety restraint at the time of the fatality. For most (9) of the 13 children, the
restraints were incorrectly or inappropriately used, such as straps being twisted or not fitted to the vehicle’s anchor point,
and children being below the recommended height for the use of an adult seatbelt.
There was a range of contributing factors to the motor vehicle fatalities that were largely preventable. These included speed
(15), drug or alcohol use (5), fatigue (5), and worn tyres (2). Environmental factors, such as heavy rain, poor street lighting,
and a slippery road surface were present in eight of the fatalities.
Pedestrian deaths
Six children who died were pedestrians. The vast majority (5) were male. Half of the pedestrian deaths involved a vehicle travelling
forward at low speed, including travelling across a pedestrian crossing, manoeuvring in a cul-de-sac, and exiting a car park.
NSW Child Death Review Team | Annual Report 2012
3
Contributory factors to the pedestrian deaths of children included limited visibility (2), negligent or reckless driving (2),
alcohol (1), and speed (1).
Other transport fatalities
Five children died in other transport fatalities, mainly involving incidents in which they were travelling or riding outside the
vehicle in a position not intended for passengers. This included standing in the tray of a utility vehicle, holding onto a vehicle
while riding a skateboard, and leaning out of a train. All of the children were male and aged 11-17 years.
Prevention measures
Key factors in the deaths of children in transport incidents in 2012 included speed; young drivers and risk-taking behaviour;
and failure to use, or incorrect/inappropriate use of, child safety restraints. In the main, these factors have been identified
in targeted prevention measures and behaviour modification strategies by NSW Government agencies and injury
prevention organisations.
Off-road vehicle fatalities 2003-2012
This year, the Team undertook a 10-year review of the deaths of children in off-road vehicle incidents. Between 2003 and 2012,
25 children died in off-road vehicle fatalities in NSW. The incidents mainly involved off-road motorcycles (13) and ‘all-terrain’
and other motor vehicles designed primarily for off-road use (11), such as quad bikes.
Off-road motorcycle fatalities
Thirteen children died in off-road motorcycle (or ‘dirt bike’) fatalities. All of the children were male, and their average age at death
was 14.2 years.
The vast majority of the fatalities (11) occurred off-road, mainly on state forests or fire trails (4), racetracks (3), and tracks/jumps
on private property (2). Most (10) of the children were riding for recreation.
The majority of the fatalities (10) were single vehicle incidents, where the child hit a stationary object such as a tree, or came off
the bike during jumps or other activities. Three fatalities resulted from collision with another motorcycle.
Most (82%) of the children were wearing a helmet at the time of the fatality. Less than half of the children who died in off-road
motorcycle fatalities had adult supervision at the time of the incident.
Quad bike and side-by-side vehicle fatalities
Quad bikes are four-wheeled motorcycles that are frequently used for both recreation and agricultural work. They are
considered to be inherently unstable on anything other than flat terrain, and are not designed to carry passengers. Side-byside vehicles are designed for off-road use and can transport at least two people on a bench-type seat.
Ten children died in incidents involving quad bikes (6) and side-by-side vehicles (4) in NSW. The children were aged between
one and 16 years. The average age at death of children in quad bike fatalities was nine years; the average age of the children
who died in side-by-side vehicle fatalities was slightly older, at 11.75 years. The vast majority (9) were riding for recreation.
Most (6) of the children were passengers, including three children who were being driven by other children (aged two to 12
years). Four of the children (aged 9-16 years) were driving the vehicle at the time of the fatality, and one of the children driving a
quad bike was carrying multiple passengers.
The majority (7) of the fatalities resulted from the vehicle tipping or rolling over. In four of these incidents, the roll-over occurred
while the vehicle was going up a steep incline. The injuries sustained in the incidents were primarily severe head injuries and
crush injuries. Two children were wearing a helmet at the time of the fatality.
Most (7) of the children were with, or watched by, adults. All of the peer drivers had been given permission by adult supervisors
to control the vehicle.
Prevention measures
Key areas that have been identified as necessary to prevent death and serious injury of children relating to the use of off-road
vehicles include:
• greater public awareness of the dangers of off-road vehicles
4
NSW Child Death Review Team | Annual Report 2012
• introduction of engineering controls – including fitment of roll over protective structures to quad bikes; and measures to
prevent operation of the vehicles by children, and
• introduction of administrative controls – such as vehicle registration; rider training and licensing; and requirements relating
to a minimum age of 16 years, no passengers, and mandatory use of personal protection, such as helmets.
The Team believes that a coordinated approach is required to prevent the deaths of children in relation to off-road vehicles,
including consideration by government and injury prevention groups of the need for specific strategies to reduce the risks.
Drowning
In 2012, the drowning deaths of 11 children were registered in NSW. This is the lowest number of deaths due to drowning since
2005, and represents a mortality rate of 0.67 deaths per 100,000 children.
Drowning was the second most common unnatural unintentional cause of death of children in NSW, and was the leading external
cause of death for children aged 1-4 years. As in previous years, the majority of the children who drowned were very young: almost
two-thirds (7) were four years of age or younger.
Consistent with deaths over the past 15 years, the majority (9) of the children who drowned were male. In 2012, the rate of death of
males from drowning was four times that of females.
One of the children who drowned was of Torres Strait Islander descent. This was a notable decrease from 2011, when seven
Indigenous children drowned.
Circumstances of drowning
Of the 11 children who drowned in NSW:
• Four children drowned in private swimming pools, all of which were permanent in-ground pools. The children were aged
one to eight years. All were out of sight of adults for periods ranging from five minutes to over an hour.
• Four children drowned in natural bodies of water, including oceans, a lake and a river. Two of the deaths occurred in boating
incidents, and two occurred during recreational swimming. Environmental conditions contributed to each of the deaths,
including strong tides and rips, low visibility, strong winds, and turbulent water.
• Two children drowned in bathtubs. Both were very young and were not directly supervised by an adult at the time
of the fatality.
• One child drowned in an irrigation channel on a rural property.
Drowning deaths of children in bathtubs 2003-2012
Between 2003 and 2012, 21 children in NSW drowned in bathtubs. The majority (15) of the children were under two years of age.
Of the 15 children under two years of age:
• The vast majority (13) had been placed in the bath by their carer/ adult supervisor, and were unsupervised at the time of the
fatality. The other two children accessed bathtubs that contained water, without the carer’s knowledge.
• Information relating to the length of time children were unsupervised was available for eight children. Most (5) were
unsupervised for less than five minutes.
• Relevant factors in the deaths included that the children were left with young siblings (aged 2-5 years), or had been left in a
bath that was not completely drained of water. In three incidents, the carer fell asleep while in the bathroom with the child;
alcohol was a factor in two of the three incidents.
Prevention measures
Prevention messages in relation to bathtub drowning deaths focus on ensuring constant and arms-length adult supervision of
young children in the bath, and restricting access to bathtubs without supervision.
In relation to swimming pools, the NSW Government has amended legislation to increase safety around backyard swimming
pools and reduce drowning and near-drowning incidents by including requirements that owners register their pools, and
that councils develop a pool inspection program. The Team’s recommendations are aimed at ensuring that properties
with swimming pools where young children reside or regularly visit are prioritised for inspection, and that the legislative
amendments are accompanied by a comprehensive education and awareness campaign.
NSW Child Death Review Team | Annual Report 2012
5
Other deaths due to unnatural unintentional causes
Excluding SUDI, 13 children whose deaths were registered in 2012 died from other unintentional external causes.
Four of the 13 children died from complications of surgery or underlying medical conditions, including two children whose
deaths were associated with organ transplants. Three children died as a result of unintentional poisoning.
The deaths of two children resulted from accidental threats to breathing, including accidental asphyxiation and choking on
food. Two children died during play, including a fall from a tree-house and being hit by a projectile. One child died after being
crushed by machinery at a workplace, and one child died in a household fire.
Deaths from unintentional poisoning
The deaths of three young people, aged 15-17 years, were due to unintentional poisoning. Each of the deaths was associated
with drug use.
Two of the young people died from mixed drug toxicity associated with the use of narcotics and various psychoactive drugs.
Both had taken multiple drugs, and had a background of substance use. The other young person died after ingesting a fatal
level of a substance thought not to be toxic. While the young person believed that the substance was a hallucinogenic drug, it
turned out to be a synthetic drug, ‘251-NBOMe’.
The deaths of young people from unintentional poisoning in 2012 reflect broader trends relating to deaths from this cause
over the past 15 years. During that time, 67 children or young people died as a result of unintentional poisoning; most (51)
were 15-17 years of age. Key factors in these deaths related to adolescent risk-taking and experimentation, poly drug use, and
vulnerable adolescents with a child protection history.
Of the 51 adolescents who died from unintentional poisoning in 1998-2012:
• Most (38) died as a result of toxic levels of narcotics and/or psychoactive drugs. Almost two-thirds (31) of the deaths
involved illicit drugs, including heroin, methamphetamine, amphetamines, cocaine, MDMA (ecstasy), and cannabis.
• Almost two-thirds (31) of the adolescents had engaged in poly drug use (involving the use of two to five drugs). The
combination of drugs typically involved both illicit and prescription drugs, such as heroin or amphetamines and
benzodiazepines; or methadone, antidepressants and alcohol. Just over half of the deaths involved the use of multiple
depressants, including two of the young people who died in 2012.
• Over half (30) of the adolescents had complex and multiple needs, and had experienced substantial childhood trauma,
neglect and/or abuse, and contact with the criminal justice system. Almost all were well known by agencies for their
drug use, and many had a history of involvement in detoxification and rehabilitation programs. Over half (29) had a child
protection history.
Prevention measures
Substance use is determined by numerous inter-related individual, family, social, environmental and other risk factors. There
is a range of drug and alcohol and youth focused organisations that currently provide useful information and resources on
individual drugs, their effects, and treatment of substance abuse. There are also numerous strategies and activities that target
adolescent and young adult drug use.
The Team considers that two areas that may warrant attention in future preventative campaigns are the use of pharmaceuticals
(such as opioids and benzodiazepines) by young people, and the risks associated with mixing drugs.
The NSW Government is currently undertaking work aimed at developing and improving services to vulnerable teens. Ongoing
reform in this area will be closely monitored by the NSW Ombudsman.
Suicide
The deaths of 16 young people registered in NSW in 2012 were suicides. After transport fatalities, suicide was the second
leading cause of death of young people aged 15-17 years. This was also the case in the previous two years. Since 1998, there
has been no significant change in the suicide mortality rate, with an average of 16 deaths per year.
The age of the young people ranged from 13 to 17 years. The majority (14) were 15 years and older. While nine of the 16 young
people who died from suicide were male, there were more female deaths attributed to suicide in 2012 than there had been
since 2004.
6
NSW Child Death Review Team | Annual Report 2012
In 2012, the deaths of four Indigenous young people were due to suicide, double the number that occurred the previous year.
Of the 16 young people who died as a result of suicide in 2012, most lived at home with at least one parent (10), and were
attending school (11). Half died at their family home or other usual place of residence.
Intent and precipitating factors
Just over half (9) of the young people documented their intent to suicide, via a note or letter, social networking website, text
messages, and/or video diary. Another six young people had previously raised the subject of suicide, made suicide threats or
attempts, experienced suicidal ideation, and/or engaged in self-harming behaviour.
For half of the young people who died from suicide in 2012, records indicated possible precipitating events that included a
relationship breakdown with a boy/girlfriend, an argument with a close friend or family member, and problems with schooling
and future education opportunities.
Risk factors associated with suicide
There are a range of interrelated biological, social and psychological risk factors associated with suicidal behaviour. These
include: mental health conditions such as depression, anxiety disorders, personality disorders and behavioural disorders;
previous suicidal behaviour; substance misuse; childhood trauma, including abuse or neglect; adverse circumstantial factors,
primarily interpersonal or personal stressors; and issues related to sexual identity, particularly social experience of sexual identity.
For the 16 suicide deaths in 2012:
• All of the young people experienced at least one risk factor associated with suicide. The majority (14) experienced multiple
risk factors.
• Interpersonal or personal stressors were present for the vast majority (15) of the young people, with most experiencing a
combination of stressors including educational, social, peer, family, personal or other relationship difficulties.
• The majority (13) had experienced mental health issues, either a diagnosed mental illness or undiagnosed mental health problems.
• Most (12) exhibited prior suicidal or self-harming behaviours, or prior suicidal thoughts and/or discussions.
Prevention measures
The NSW Suicide Prevention Strategy 2010-2015 is a whole-of-government strategy that includes specific actions targeted to
children and young people. The Team’s recommendations have been aimed at ensuring that the Strategy includes a focus
on making use of new media to deliver prevention services to young people, developing resources to educate young people
on the importance of passing on suicide risk concerns about peers, and increasing collaboration between schools and youth
mental health services.
Fatal assault
The deaths of four children registered in NSW in 2012 were due to fatal assault. All fatal assault deaths of children and young
people are subject to separate review by the NSW Ombudsman, as ‘reviewable deaths’.
All of the children were male and aged between two and 17 years. One child was Aboriginal. The families of two of the children
who died as a result of fatal assault had a child protection history.
Most fatal assault deaths of children in Australia are familial homicides. Three of the four deaths in 2012 occurred within a
familial context, allegedly involving biological parents and a step-parent. One teenager was allegedly killed by a peer.
In the past 15 years, more than two-thirds (69%) of child homicides were committed by family members, primarily parents. The
remaining assaults were perpetrated by peers (16%) or other unrelated persons (15%).
NSW Child Death Review Team | Annual Report 2012
7
List of recommendations
Sudden Unexpected Death in Infancy (SUDI)
NSW Kids and Families (page 73)
1. In relation to NSW Kids and Families’ file audits to assess compliance with the Death – Management of Sudden
Unexpected Death in Infancy policy directive, the agency should provide detailed advice to the Team on:
(a) the scope and method of the audits
(b) the findings of the audits, and
(c) any action NSW Kids and Families intends to take in response to the findings.
2. In relation to the review of the Death – Management of Sudden Unexpected Death in Infancy policy directive and model
of response to SUDI, NSW Kids and Families should:
(a) provide advice to the Team on the terms of reference and timeframes of the review, and
(b) include consideration of the potential for NSW to adopt a multi-disciplinary case review approach to the SUDI
investigation process, and the potential for a more centralised response to SUDI.
3. In relation to the promotion of safe sleeping practices, NSW Kids and Families should provide detailed advice to the
Team on:
(a) the outcome of the audits conducted by Local Health Districts to assess compliance with the Maternity – Safer
Sleeping Practices for Babies in NSW Public Health Organisations policy directive. The advice should include Kids
and Families’ assessment of:
(i) the adequacy of the audits, including the scope and method (such as the use of spot-checks)
(ii)the findings of the audits regarding compliance with the policy requirements, and
(iii) whether there are any systemic issues arising from the audits and, if so, the actions NSW Kids and Families will
take in response.
(b) the outcome of NSW Kids and Families’ consultation with SIDS and Kids and Community Services regarding the
available education resources and online packages for staff.
Ministry of Health (page 73)
4. In relation to post mortem examinations following unexpected deaths of infants, the Ministry of Health should provide
advice to the Team on current or planned initiatives to:
(a) reduce forensic pathology delays, and
(b) increase the proportion of SUDI that are explained.
Department of Family and Community Services, Community Services (page 73)
5. In relation to Community Services’ cohort review of SUDI where the infant’s family had a child protection history, the
agency should provide detailed advice to the Team on:
(a) the findings of the review
(b) the strategies and training resources that Community Services will develop to assist caseworkers to assess risk for
infants and provide casework services and targeted education to at-risk families, and
(c) how the agency will audit or otherwise measure practice and related outcomes.
8
NSW Child Death Review Team | Annual Report 2012
Off-road fatalities
The Centre for Road Safety (page 87)
6. In the context of the Centre for Road Safety’s (CRS) analysis of data relating to low speed vehicle run-over incidents
and its plans to convene key injury prevention agencies to determine further countermeasures to address such
incidents, CRS should provide advice to the Team on:
(a) key findings or results from the data analysis, and
(b) the outcomes of the consultations/ forum with relevant agencies, including any areas of further work to prevent low
speed vehicle run-over fatalities.
Department of Premier and Cabinet (page 97)
7. The Department of Premier and Cabinet (DPC) should bring together key injury prevention and regulatory agencies to
consider the findings of this report to identify whether specific strategies are needed in NSW to reduce the risk of death
and injury of children in relation to off-road vehicle incidents. In particular, DPC, with agencies, should consider:
(a) existing or planned initiatives within NSW and at the national level
(b) the need for targeted research, including environmental and vehicle design elements of prevention and attitudinal
research relating to parent and carer perceptions of risk
(c) the need for public awareness strategies, including print and electronic media resources that recognise the
behavioural, environmental and vehicle design elements of prevention, and
(d) the need for regulation of the recreational use of such vehicles on private property, including licensing, registration,
and requirements relating to safety equipment such as helmets.
8. DPC should provide detailed advice to the Team on the outcomes of this work, including identified strategies and how
they will be progressed.
Private swimming pools
Department of Premier and Cabinet, Division of Local Government (page 103)
9. In relation to targeting swimming pool inspection programs to pools at premises where children, particularly those
under five years of age, reside or regularly visit, the Division of Local Government should:
(a) provide detailed advice to the Team as to the demographic information available to Councils that will enable them to
identify and prioritise the inspection of the pools of these premises, and how the Division encourages Councils to
target resources towards swimming pools used by young children, and
(b) provide a copy of the Division’s guidelines to assist Councils to develop their pool inspection programs.
10.The Division of Local Government should advise the Team of the timeframe for issuing the Swimming Pools
Regulations.
11. In relation to the development of targeted educational resources on the Swimming Pools Act amendments and safety
requirements, the Division of Local Government should provide detailed advice to the Team on progress with:
(a) the education and awareness campaign it is conducting with Royal Life Saving Australia (NSW) and other
stakeholder agencies, and
(b) the development of specific resources for lessees of rental properties on the legal and safety requirements for
installing an above-ground or inflatable pool at rented premises.
Suicide
Ministry of Health (page 122)
12.The Ministry of Health should provide detailed advice to the Team on the progress of the project to develop resources
to support safe and effective discussion of suicide, Conversations Matter. The advice should include information about
the intended approach of the project in relation to children and young people, and timeframes for completion.
NSW Child Death Review Team | Annual Report 2012
9
Chapter 1. Introduction
Since 1996, the NSW Child Death Review Team (the Team) has been responsible for reviewing and reporting on child deaths
in NSW. This is the Team’s seventeenth report, and the third since the NSW Ombudsman became Convenor of the Team and
responsibility for support and assistance for the Team transferred to his office.1
This report provides information on 493 children and young people whose deaths were registered in NSW in 2012.
1.1 The purpose of the Team
The Team is established under Part 5A of the Community Services (Complaints, Reviews and Monitoring) Act 1993, for the
purpose of preventing and reducing the deaths of children in NSW.
The legislation requires the Team to comprise the NSW Ombudsman (Convenor); the Commissioner for Children and Young
People; the Community and Disability Services Commissioner; representatives of certain NSW government agencies; experts
in health care, research methodology, child development or child protection, or persons who are likely to make a valuable
contribution to the work of the Team; and two members who are Aboriginal. Members of the Team in 2012 are outlined on
page ii.
The functions of the Team are to:
• maintain a register of child deaths in NSW
• classify deaths in the register according to cause, demographic criteria and other relevant factors, and to identify trends and
patterns relating to those deaths
• undertake research that aims to help prevent or reduce the likelihood of child deaths, and to identify areas requiring further
research, and
• make recommendations as to legislation, policies, practices and services for implementation by government and nongovernment agencies and the community to prevent or reduce the likelihood of child deaths.
1.2 This report
1.2.1 Methodology
The methodology used in this report is detailed in Appendix 1, and definitions are provided in Appendix 2.
The information provided in this report is drawn from the NSW Child Death Register, which is maintained by the Team.
The register holds cause of death, demographic and other relevant information about children who died in NSW.
Percentages in the report have been rounded, so may not add to 100.
Cause of death
Reporting of cause of death in this report is by the International Statistical Classification of Diseases and Related Health
Problems (ICD) system. The ICD is the international standard health classification published by the World Health Organization
(WHO) for coding diseases for statistical aggregation and reporting purposes.2
The report presents information by the classification chapters of the (ICD) system, 10th revision, as modified for Australia
(ICD-10-AM).
The sources for coding of cause of death are medical certificates of cause of death and, in the case of deaths that are
examinable by the Coroner, autopsy reports and coronial certification of cause of death.
This report focuses primarily on underlying cause of death, which is defined by the World Health Organization as the ‘disease
or injury that initiated the train of events leading directly to death, or the circumstances of the accident or violence which
1
2
10
In late February 2011, responsibility for support and assistance for the Team transferred to the NSW Ombudsman from the NSW Commission
for Children and Young People.
National Centre for Classification in Health 2007, Causes of death of reviewable children in New South Wales from 2003-2006, Sydney: NSW
Ombudsman, unpublished.
NSW Child Death Review Team | Annual Report 2012
produced the fatal injury’. Underlying cause of death is considered the single most essential element to understanding causes
of death. Historically, and from national and international perspectives, the concept of underlying cause of death is considered
the most critical factor for public health reporting purposes in annual mortality statistics.3
In addition, cause of death coding identifies:
• direct cause of death – the final condition or event that actually caused death (for example, cardiac arrest
or respiratory failure)
• intervening causes of death – other conditions that may have given rise to the immediate cause of death, and
• contributory causes of death – conditions or events that were present in the sequence leading to death, but may not
have been necessary influences.
Multiple cause data, which considers the associations between underlying, direct, intervening and contributory causes
of death, is an important concept for a more complete understanding of the chain of events leading to death, and the
co-contribution of diseases to mortality.4
1.2.2 Identifying and reporting Aboriginal and Torres Strait Islander status
Collection of reliable data relating to Aboriginal and Torres Strait Islander identity is recognised as a significant issue that
affects policy development, planning and service improvement across health, education, community service and other areas.5
This has been an ongoing concern for the Team.6
There are multiple criteria that can be used to identify a child’s Aboriginal or Torres Strait islander status, including the
background of the child’s mother or father, residence in a particular community, adoption of Aboriginal or Torres Strait Islander
cultural practices, and self-reporting of identity.7
As was the case in 2010 and 2011, individual children are identified as Aboriginal or Torres Strait Islander in this report if:
• The child has been identified as either Aboriginal or Torres Strait Islander on their NSW Births, Deaths and Marriages
death certificate.
• The child or their parent/s have been identified as Aboriginal or Torres Strait Islander on their NSW Births, Deaths and
Marriages birth certificate.
• Agency records identify the child as Aboriginal or Torres Strait Islander through a number of records, which were
corroborative. Records used to do this include the NSW Police Computer Operated Policing System and Community
Services KIDS database, which often hold information that can support Aboriginal or Torres Strait Islander identity. NSW
Health and other agency records were also used to assess child and family background.
The Perinatal Data Collection also provides an additional source of information in identifying a child as Aboriginal or Torres
Strait Islander.8
Issues relating to the identification of Aboriginal and Torres Strait Islander children, and reporting of trends, are discussed
further below.
1.2.3 The child death register and data issues
2012 Annual Report and trend reporting
The data in this report, particularly in relation to trend reporting over 15 years, may differ from previously published data. To an
extent, this will always be the case as more detailed information becomes available and is placed on the child death register,
particularly about cause of death.
In some areas, there have also been additional issues that have impacted on data reliability. As noted in last year’s report, the
Team has adopted different practices over time that can affect trend reporting and the comparison of current trend data to
3
4
5
6
7
8
National Centre for Health Information, Research and Training 2011, Review and recommendations for the annual reporting of child deaths in NSW,
Sydney: NSW Ombudsman, unpublished.
Ibid.
Australian Institute of Health and Welfare 2010, National best practice guidelines for collecting Indigenous status in health data sets, AIHW cat no
IHW 29, Canberra: AIHW
See for example, NSW Child Death Review Team 2008 Trends in child deaths in New South Wales 1996–2005, Sydney: Commission for Children
and Young People, pp. 456–457.
Australian Institute of Health and Welfare, 2010, op. cit.
The NSW Perinatal Data Collection is a state-wide surveillance system that monitors patterns of pregnancy care, services and pregnancy outcomes.
NSW Child Death Review Team | Annual Report 2012
11
previously published work. Examples include the identification of Aboriginal and Torres Strait Islander status and the definition
of Sudden Unexpected Death in Infancy. In the main, differences arising from changed practices affect the comparison of data
on a year by year basis, but not overall trends.
In addition, in 2007-2009, the Team used an ‘all cause’ approach to reporting that allowed for multiple counts of cause of
death. As a result, previous reports have reported deaths against a number of causes, rather than identifying one underlying
cause. Again, this tends to affect comparison of data on a year by year basis, but not overall trends.
The child death register
Last year’s report outlined the considerable challenges faced by the Team in relation to the child death register, and the pressing
need for a new data system. In summary, the register has outgrown its original platform and the data capture has become
inconsistent over time, which has adversely affected the Team’s ability to reliably and consistently extract and analyse information.
A key priority for the Team has been the development of an integrated, reliable and sustainable death register that provides for
efficient extraction of meaningful data for prevention purposes. Earlier this year, NSW Treasury approved a business case for a
new register, enabling the Team to commence the necessary major re-build. This critical work will be the key focus of the Team
over the next year.
Aboriginal and Torres Strait Islander status
As was the case last year, this report does not provide trend information for Indigenous children, due to problems with data
consistency and comparability.
Over time, the Team has used different approaches to identify Aboriginal and Torres Strait Islander status and the base
population of Indigenous children in NSW that enables the calculation of mortality rates. As a result, data across years is not
directly comparable. For example, for a number of years until 2006, the Team engaged expert advisers and/or Aboriginal Team
members to identify Aboriginal families.
The approach taken by the Team in 2011 and in this report provides a more comprehensive approach to identifying Aboriginal
and Torres Strait Islander status, which by all accounts is largely underestimated. However, the same comprehensive approach
cannot be applied to the base population of all Indigenous children, which is needed to determine mortality rates. Consequently,
while the number of children identified each year may be more accurate, the mortality rate is likely to be over-estimated.
To improve the accuracy of data and the capacity to report on trends, this year the Team has contracted the Australian Institute
of Health and Welfare (AIHW) to provide expert advice on how the Team should best collect and report on Aboriginal and
Torres Strait Islander status of children who die in NSW.
Following provision of the expert advice, the Team will commence work to bring its approach in line with best practice and
consider options for further work in relation to the deaths of Indigenous children.
1.2.4 Structure of the report
Chapter 2 provides demographic and other information about the children who died in 2012, and trend analysis.
Chapter 3 presents an analysis of leading causes of death for children in 2012 by key demographic variables.
Chapter 4 of the report provides information about the deaths of children who were usually resident in NSW but died outside
of the state.
Chapters 5 to 13 focus on diseases and morbid conditions (natural causes of death), with a particular examination of the
leading natural causes of death for children in NSW.
Chapters 14 and 15 detail information about the deaths of infants, and Sudden Unexpected Deaths in Infancy.
Chapters 16 to 22 focus on external (unnatural) cause deaths. These deaths are of particular concern to the Team, given
the potential for prevention. These chapters include specific examination of child deaths resulting from:
• transport fatalities (including a 10-year review of off-road vehicle fatalities)
• drowning
• other unintentional external causes
• suicide, and
• fatal assault.
Chapters 23 reports on progress in relation to the implementation of previous recommendations made by the Team.
12
NSW Child Death Review Team | Annual Report 2012
1.3 Work of the Team and future plans
1.3.1 Key work of the Team
The work of the Team over the past year is documented throughout this report. The Team has met on four occasions, with
smaller focused sub-groups meeting on additional occasions.
Since the 2011 report, the work of the Team has included:
• Analytic process improvements to the CDRT register, including actions to increase the stability of the system and to support
data quality and analysis.
• Release of an issues paper on low speed vehicle run-over fatalities of young children in 2002-2011.
• Completion of a research project to analyse causes of death of children with a child protection history over a 10-year period.
• Contracting expert advice on identifying and reporting Aboriginal and Torres Strait Islander status.
• Holding a Team Planning meeting in March 2013, to identify opportunities and priorities for the Team’s work.
Following the planning meeting, the Team developed a high-level strategic plan for its work over the next three years. In the
coming year, priorities include establishing an integrated death review data system, obtaining the aforementioned expert
advice on identifying and reporting Aboriginal and Torres Strait Islander status, and strengthening the Team’s links to injury
prevention and child safety agencies and researchers.
Reporting on the Team’s research
Under CS CRAMA, the Team may, at any time (and at least every three years), report to Parliament on the results of research
undertaken in the exercise of its functions. The Team’s last research report – A preliminary investigation of neonatal SUDI
in NSW 1996-2008: opportunities for prevention – was released in October 2010. In the intervening period, the Team has
transitioned to the Ombudsman’s office, and work has focused on integrating and improving systems and processes,
producing detailed annual reports and issues papers, and strengthening the membership and effective operation of the Team.
In 2013, the Team completed a research project analysing the causes of death of children with a child protection history in the
10 year-period 2002-2011. The Australian Institute for Health and Welfare (AIHW) conducted the project, using data provided
by the Team.
Amongst other things, the research found that children with a child protection history have a higher mortality rate than children
without a child protection history. Given the complexities involved, it is important that the Team’s research is supplemented
by broader consideration and analysis of the child protection system. In this regard, in early 2014, the Ombudsman will table
a special report in Parliament on progress towards strengthening the child protection system and responding to capacity
challenges and other issues. The Team will release its special report on the causes of death of children with a child protection
history at the same time as the Ombudsman’s report.
1.3.2 Disclosure of information authorised by the Convenor
CS CRAMA contains strict confidentiality conditions that prevent the disclosure of CDRT information except in specific
circumstances. Section 34L(1)(b) of the legislation provides for the Convenor to authorise the disclosure of information
in connection with research that is undertaken for the purpose of helping to prevent or reduce the likelihood of deaths of
children in NSW.
Since the last report, the Convenor authorised the disclosure of information pursuant to s34L(1)(b) on five occasions. Two
requests, from a government agency and infant mortality researchers, related to the provision of data to inform research and
reviews of the sudden and unexpected deaths of infants. Two requests were received from child death review teams in other
Australian jurisdictions for de-identified data, and one request was made by a health organisation for de-identified data relating
to the deaths of children in above-ground swimming pools.
NSW Child Death Review Team | Annual Report 2012
13
Chapter 2. All child deaths in 2012
The deaths of 493 children were registered in NSW in 2012.
As shown in table 1, the number of deaths and the Directly Standardised Mortality Rate (DSMR)9 of 29.10 per 100,000 children
aged 0-17 years are the lowest since the CDRT began in 1996.
Table 1: Deaths of children from all causes – deaths registered, 1998-2012
Year
Population
Deaths
Crude Mortality
Rate
Directly
Standardised
Mortality Rate
95% Lower
Confidence
Limit
95% Upper
Confidence
Limit
1998
1582970
720
45.48
45.66
42.38
49.12
1999
1590912
813
51.10
51.24
47.78
54.89
2000
1600335
753
47.05
47.12
43.81
50.61
2001
1612999
715
44.33
44.33
41.14
47.70
2002
1610765
636
39.48
40.39
37.31
43.66
2003
1605241
645
40.18
40.96
37.86
44.25
2004
1599934
617
38.56
39.35
36.31
42.59
2005
1601597
668
41.71
41.98
38.86
45.29
2006
1610112
630
39.13
38.15
35.23
41.25
2007
1608544
597
37.11
36.53
33.66
39.59
2008
1610679
608
37.75
36.38
33.55
39.40
2009
1616319
580
35.88
34.11
31.38
37.01
2010
1624687
590
36.31
34.70
31.96
37.63
2011
1634606
582
35.60
33.81
31.12
36.69
2012
1642401
493
30.02
29.10
26.59
31.80
9
14
The Directly Standardised Mortality Rate is deaths per 100,000 people under 18 years of age, adjusted for the age structure of the population.
NSW Child Death Review Team | Annual Report 2012
2.1 Demographic and individual characteristics
Table 2 describes the demographic characteristics of the children who died in 2012.
Table 2: Key demographic and individual characteristics – deaths, 2012101112
Number
Percent
Crude Mortality
Rate
95%
Confidence
Interval10
493
100
30.02
27.37 - 32.67
Female
200
41
25.05
21.58 - 28.53
Male
293
59
34.71
30.74 - 38.68
303
61
325.41
(3.06)†
288.77 - 362.05
1-4 years
49
10
12.83
9.49 - 16.96
0.04
5-9 years
44
9
9.76
7.09 - 13.10
0.03
10-14 years
35
7
7.92
5.52 - 11.01
0.02
15-17 years
62
13
22.59
17.32 - 28.96
0.07
441
89
28.07
25.45 - 30.69
52
11
73.04
54.55 - 95.78
Major cities
303
63
25.71
22.81 - 28.60
Inner regional areas
110
23
32.40
26.35 - 38.46
Outer regional areas
55
12
51.43
38.75 - 66.95
2.00
9
2
107.87
49.33 - 204.78
4.20
1
0
-
-
-
Quintile 5 (highest)
102
22
25.18
20.29 - 30.06
Quintile 4
105
22
36.04
29.14 - 42.93
1.43
Quintile 3
84
18
30.24
24.12 - 37.43
1.20
Quintile 2
64
14
18.46
14.22 - 23.57
0.73
115
24
41.39
33.83 - 48.96
1.64
Total
Incident
Rate Ratio11
p12
1.39
0.0002
Gender
Age
Under 1 year
Aboriginal and Torres Strait Islander status
Not Aboriginal or Torres Strait Islander
Aboriginal or Torres Strait Islander
2.60
0
Remoteness*
Remote areas
Very remote areas
1.26
Socioeconomic status
**
Quintile 1 (lowest)
*Remoteness was not calculated in 15 cases.
**Socioeconomic status was not calculated for 23 cases.
† Infant Mortality Rate.
2.1.1 Age and gender
As has consistently been the case, infants accounted for almost two-thirds of all child deaths in NSW (303). The mortality rate
decreased to a minimum in the 10-14 year age group, then rose again in the 15-17 year age group.
The mortality rate was lower than previous years for all age groups, except for children aged 5-9 years. Compared with 2011,
the crude mortality rate for 5-9 year olds in 2012 increased approximately two per 100,000 population. However, this falls within
the range estimated by the 2011 confidence intervals and therefore may not be significant.
10 The confidence interval estimates the range in which some proportion (95%) of the statistics from all samples will fall
(see Appendix 1 for more information).
11 The Incident Rate Ratio is the ratio of the mortality rates for two exclusive classes of people, such as male and female (see Appendix 1).
12 The p-value is a quantitative measurement of the likelihood that a statistic occurred by chance. All p-values noted in this report are statistically
significant (see Appendix 1).
NSW Child Death Review Team | Annual Report 2012
15
As shown in tables 3 and 4, and consistent with previous years, more males (293) than females (200) died. The directly
standardised mortality rate for males (33.86 per 100,000 children) and females (24.15 per 100,000 children) in 2012
represented the lowest rates to date.
Table 3: Deaths of male children from all causes – deaths registered, 1998-2012
Year
Population
Deaths
Crude Mortality
Rate
Directly
Standardised
Mortality Rate
95% Lower
Confidence
Limit
95% Upper
Confidence
Limit
1998
811151
439
54.12
54.53
49.55
59.89
1999
814983
463
56.81
57.29
52.19
62.76
2000
819929
446
54.39
54.69
49.73
60.01
2001
827100
410
49.57
49.57
44.89
54.61
2002
825622
372
45.06
46.17
41.59
51.11
2003
822802
362
44.00
44.93
40.42
49.81
2004
820172
343
41.82
42.71
38.31
47.49
2005
821481
390
47.48
47.79
43.16
52.78
2006
825664
385
46.63
45.73
41.27
50.54
2007
825397
333
40.34
39.79
35.63
44.31
2008
826739
364
44.03
42.83
38.54
47.48
2009
830207
339
40.83
39.10
35.04
43.51
2010
834620
362
43.37
41.70
37.51
46.24
2011
840269
327
38.92
37.22
33.29
41.50
2012
844144
293
34.71
33.86
30.09
37.98
Table 4: Deaths of female children from all causes – deaths registered, 1998-2012
Year
Population
Deaths
Crude Mortality
Rate
Directly
Standardised
Mortality Rate
95% Lower
Confidence
Limit
95% Upper
Confidence
Limit
1998
771819
281
36.41
36.35
32.22
40.86
1999
775929
350
45.11
44.93
40.35
49.90
2000
780406
307
39.34
39.23
34.97
43.88
2001
785899
305
38.81
38.81
34.58
43.42
2002
785143
264
33.62
34.33
30.31
38.73
2003
782439
283
36.17
36.79
32.63
41.34
2004
779762
274
35.14
35.82
31.71
40.33
2005
780116
278
35.64
35.87
31.78
40.35
2006
784448
245
31.23
30.26
26.59
34.31
2007
783147
264
33.71
33.09
29.22
37.34
2008
783940
243
31.00
29.53
25.93
33.50
2009
786112
241
30.66
28.90
25.36
32.80
2010
790067
228
28.86
27.38
23.94
31.20
2011
794337
255
32.10
30.24
26.64
34.21
2012
798257
200
25.05
24.15
20.91
27.76
* In 2008, the gender of one child was not recorded.
16
NSW Child Death Review Team | Annual Report 2012
2.1.2 Child protection history
As described in table 5, the families of 88 children (18%) had a child protection history.
Fifty-nine of the children who died (12%) had been the subject of a report of risk of harm or significant risk of harm to
Community Services in the three years prior to their death. Five of these children were in care at the time of their death.
One child had been the subject of a report to a Child Wellbeing Unit, but this did not result in a report to Community Services.
An additional 28 children (6%) had not themselves been the subject of a report, but a sibling had been. Most of these children
(22) were infants.
Table 5: Age and child protection history, 2012
Age range
No known history
Child subject of a report(s) to
Community Services or Child
Wellbeing Unit
Sibling only subject of a
report(s)
Number
Percent
Number
Percent
Number
Percent
261
86.3
20
6.6
22
7.3
1-4 years
42
85.7
6
12.2
1
2
5-9 years
39
88.6
5
11.3
0
0
10-14 years
23
65.7
10
28.6
2
5.7
15-17 years
40
64.5
19
30.6
3
4.8
405
82.2
60
12.2
28
5.7
Infants (<1 year)
Total
In 2013, the Team completed a research project analysing the causes of death of children with a child protection history13 in the
10 year-period 2002-2011. The AIHW conducted the project, using data provided by the Team.
The AIHW’s findings included that the overall mortality rate for children with a child protection history was 1.4 times the rate
for those without a child protection history; and the children with a child protection history who died were more likely than
those without a child protection history to be Indigenous, older, from regional or remote areas, and to have lived in lower
socioeconomic areas.14
The report from the project includes trend analyses for the five leading causes of death where the likelihood of death was
found to be higher for children with a child protection history (deaths due to external causes, SIDS and other undetermined
causes, SUDI, suicide, and diseases of the nervous system); and analysis of the impact of key variables on cause of death
distributions for children with a child protection history and those without.
The Team’s report from the research project will be tabled in Parliament early next year.
2.1.3 Aboriginal and Torres Strait Islander status
In 2012, 52 children were identified as Indigenous. Forty-six children were Aboriginal, four children were of Torres Strait Islander
descent, and two children were Aboriginal and Torres Strait Islander.
The mortality rate for Indigenous children in 2012 of 73.04 per 100,000 children was more than 2.5 times that of
non-Indigenous children.
2.1.4 Remoteness15
Relative to the area population, deaths in remote areas in 2012 were about twice as prevalent as in outer regional areas,
around three times as prevalent as in inner regional areas, and four times the mortality rate in major cities.
One child in a very remote area died in 2012. While this equates to a relatively high mortality rate based on the numbers of
children living in those areas, the small numbers both for deaths and populations in more remote areas means that these
patterns should be interpreted with caution.
13 ‘Children with a child protection history’ comprised children (or their siblings), who were the subject of a report of risk of harm to Community
Services within three years prior to their death (2002-2009). For 2010-2011, this included children (or their siblings) who were the subject of a
report of risk of harm/significant harm to Community Services and/or a Child Wellbeing Unit in the three years before their death.
14 AIHW (2013) Analysis of Causes of Death – Children with a Child Protection History 2002-2011 – report prepared for the CDRT (unpublished).
15 Remoteness is measured using the Aria-Plus index. Further details are provided in Appendix 2.
NSW Child Death Review Team | Annual Report 2012
17
2.1.5 Socioeconomic status16
The number of deaths in the higher socioeconomic categories (quintiles 4 and 5) decreased in 2012 (207) compared
with 2011 (280). The individual category with the largest number of deaths in 2012 was quintile 1, representing the least
socioeconomically advantaged areas, where the number of deaths was the same in 2011 and 2012 (115).
As shown in figure 1, child protection history interacts with socioeconomic status, with children residing in areas of relatively
low socioeconomic status (quintile 1) being over four times as likely to have a child protection history as those residing in areas
of the highest socioeconomic status (quintile 5).
Figure 1: Child protection history by socioeconomic status (IRSD quintiles), 2012
No
Yes
Percentage of deaths in the quintile
100%
90%
Key
No child
protection
history
80%
70%
60%
Any child
protection
history
50%
40%
30%
20%
10%
0
Q5
Q4
Q3
Q2
Q1
Socioeconomic quintile category
16 The indicator of the socioeconomic status of a child used in this report is the Index of Relative Social Disadvantage (IRSD) of the area in which
the child normally resided. Quintile 1 represents the relatively most disadvantaged 20 per cent, and quintile 5 the relatively least disadvantaged
20 per cent. Further information is provided in Appendix 2.
18
NSW Child Death Review Team | Annual Report 2012
Chapter 3. Leading causes of death of children in
NSW in 2012
At the time of writing, information about cause of death was available for 458 children (93%). Where underlying cause of death
is the base for analysis below, it relates to 458 children.
3.1 Overview of leading causes of death by age group
Table 6 shows the total number and rates of death for each age category, and leading natural and external (unnatural) causes
of death.
As has consistently been the case, the leading cause of death of infants in 2012 was certain conditions arising in the perinatal
period (‘perinatal conditions’) – conditions that arise during pregnancy or up to 28 days after birth.
For children over one year of age, transport incidents were the leading cause of death, followed by neoplasms (cancers and
tumours). However the number of deaths due to neoplasms for children over one year of age decreased markedly in 2012 (29)
compared with 2011 (44).
While drowning has continued to be the leading external cause of death for children aged 1-4 years, the mortality rate in 2012
(1.57 per 100,000) was slightly less than 2011 (2.44 per 100,000).
In the 15-17 year age group, the second leading cause of death was suicide. In both 2011 and 2012, there were 14 suicide
deaths of 15-17 year olds.
Table 6: Frequency, rates and leading natural and external causes of death, 2012
Age category
<1 year
1-4 years
5-9 years
10-14 years
15-17 years
Total number
of deaths
Percentage of
total deaths
(0-17 years)
Leading natural cause for
age category
303
61%
Perinatal conditions
(158 per 100,000)
49
44
35
62
10%
9%
7%
13%
Congenital and chromosomal
conditions (2.62 per 100,000)
Leading external cause for
age category
Threats to breathing
(4.30 per 100,000)
Drowning
(1.57 per 100,000)
Neoplasms
Transport
(2.24 per 100,000)
(1.77 per 100,000)
Respiratory diseases
Transport
(1.13 per 100,000)
(2.04 per 100,000)
Neoplasm
Transport
(2.91 per 100,000)
(6.19 per 100,000)
3.2 Underlying causes of death by ICD chapter
Table 7 describes the underlying causes of death for children in NSW in 2012 by chapters of the International Statistical
Classification of Diseases and Related Health Problems (ICD) system.17
17 Nationally and internationally, morbidity and mortality data are coded according to the ICD system. The ICD is the international standard health
classification published by the World Health Organization (WHO) for coding diseases for statistical aggregation and reporting purposes. The ICD
provides structured rules guiding how the underlying cause of death is determined. Use of these rules assists with standardisation of coded data
and facilitates comparability with other collections of mortality data.
NSW Child Death Review Team | Annual Report 2012
19
The underlying cause of death is most frequently used for analysis of mortality statistics and reporting. It refers to the ‘disease
or injury that initiated the train of events leading directly to death, or the circumstances of the accident or violence which
produced the fatal injury’.18
Overall, the leading underlying causes of death of children in NSW in 2012 were consistent with previous years. The most common
causes were perinatal conditions (148) and congenital/chromosomal causes (102), which together accounted for over half of
all child deaths in that period. External causes (injury-related causes) continued to be the third most common cause of death.
Crude mortality rates for the vast majority of the causes of death were lower in 2012, particularly for deaths from perinatal
conditions, circulatory system diseases, neoplasms and external causes. The mortality rate for respiratory diseases in 2012
(0.85 per 100,000) was marginally higher than 2011 (0.49 per 100,000).
Table 7: Leading underlying causes of death by Indigenous identification, 2012
Number of deaths (Crude Mortality Rate)
ICD chapter
All children
Not Aboriginal
or Torres Strait
Islander
Aboriginal or
Torres Strait
Islander
Certain conditions arising in the perinatal period
148 (9.01)
130 (8.27)
18 (25.28)
Congenital malformations, deformations and chromosomal abnormalities
102 (6.21)
97 (6.17)
5 (7.02)
External causes of morbidity and mortality
80 (4.87)
69 (4.39)
11(15.45)
Neoplasms
29 (1.77)
28 (1.78)
1-
Diseases of the nervous system
25 (1.52)
22 (1.4)
3-
18 (1.1)
13 (0.83)
5 (7)
Diseases of the respiratory system
14 (0.85)
12 (0.76)
2-
Endocrine, nutritional and metabolic disorders
11 (0.67)
11 (0.7)
0-
Diseases of the circulatory system
10 (0.61)
9 (0.57)
1-
Certain infectious and parasitic diseases
7 (0.43)
6 (0.38)
1-
Diseases of the blood, blood-forming organs and certain disorders of the
immune system
4 (0.24)
4 (0.25)
0-
Diseases of the digestive system
4 (0.24)
4 (0.25)
0-
Injury, poisoning and certain other consequences of external causes
3-
3-
0-
Diseases of the musculoskeletal system and connective tissue
2-
2-
0-
Mental and behavioural disorders
1-
1-
0-
458
411
47
Symptoms, signs and abnormal clinical and laboratory findings, not
elsewhere classified
Total
3.2.1 Age and gender
Tables 8 and 9 describe the leading underlying causes of death by age group and gender.
For children under one year of age, perinatal conditions and congenital and chromosomal causes were the most common
causes of death, accounting for 82 per cent of infant deaths in NSW.
External causes were the leading cause of the deaths of children across all other age groups, including over half of the deaths
of children aged 15-17 years (33), and almost half of the deaths of children aged 10-14 years (16).
Male children outnumbered female children in the majority of the leading causes of death. Consistent with last year, the
largest gender imbalance was in deaths from external causes. Almost twice as many male children died from injury-related
causes than did female children.
Slightly more girls than boys died from respiratory and metabolic diseases.
18 World Health Organization 2012, International Statistical Classification of Diseases and Related Health Problems, 10th revision (ICD-10),
Geneva: WHO.
20
NSW Child Death Review Team | Annual Report 2012
Table 8: Leading underlying causes of death by age, 2012
Number of deaths (Crude Mortality Rate)
ICD chapter
All children
Under 1 year
1-4 years
5-9 years
10-14 years
15-17 years
Certain conditions arising in the perinatal
period
148 (9.01)
147 (157.87)
0-
1-
0-
0-
Congenital malformations, deformations
and chromosomal abnormalities
102 (6.21)
84 (90.21)
10 (2.62)
3-
2-
3-
External causes of morbidity and mortality
80 (4.87)
6 (6.44)
12 (3.14)
13 (2.88)
16 (3.62)
33 (12.02)
Neoplasms
29 (1.77)
0-
7 (1.83)
11 (2.44)
3-
8 (2.91)
Diseases of the nervous system
25 (1.52)
7 (7.52)
3-
5 (1.11)
4 (0.9)
6 (2.19)
18 (1.1)
16 (17.18)
2-
0-
0-
0-
Diseases of the respiratory system
14 (0.85)
4 (4.3)
2-
2-
5 (1.13)
1-
Endocrine, nutritional and metabolic
disorders
11 (0.67)
3-
3-
2-
2-
1-
Diseases of the circulatory system
10 (0.61)
3-
2-
1-
2-
2-
Certain infectious and parasitic diseases
7 (0.43)
5 (5.37)
0-
2-
0-
0-
Diseases of the blood, blood-forming
organs and certain disorders of the
immune system
4 (0.24)
1-
1-
1-
0-
1-
Diseases of the digestive system
4 (0.24)
2-
1-
1-
0-
0-
Injury, poisoning and certain other
consequences of external causes
3-
0-
0-
0-
0-
3-
Diseases of the musculoskeletal system
and connective tissue
2-
1-
0-
0-
1-
0-
Mental and behavioural disorders
1-
0-
0-
1-
0-
0-
458
279
43
43
35
58
Symptoms, signs and abnormal clinical
and laboratory findings, not elsewhere
classified
Total
Table 9: Leading underlying causes of death by gender, 2012
Number of deaths (Crude Mortality Rate)
All children
Female
Male
Certain conditions arising in the perinatal period
ICD chapter
148 (9.01)
57 (7.14)
91 (10.78)
Congenital malformations, deformations and chromosomal abnormalities
102 (6.21)
42 (5.26)
60 (7.11)
External causes of morbidity and mortality
80 (4.87)
27 (3.38)
53 (6.28)
Neoplasms
29 (1.77)
13 (1.63)
16 (1.9)
Diseases of the nervous system
25 (1.52)
10 (1.25)
15 (1.78)
18 (1.1)
7 (0.88)
11 (1.3)
Symptoms, signs and abnormal clinical and laboratory findings,
not elsewhere classified
Diseases of the respiratory system
14 (0.85)
8 (1)
6 (0.71)
Endocrine, nutritional and metabolic disorders
11 (0.67)
7 (0.88)
4 (0.47)
Diseases of the circulatory system
10 (0.61)
5 (0.63)
5 (0.59)
Certain infectious and parasitic diseases
7 (0.43)
2-
5 (0.59)
Diseases of the blood, blood-forming organs and certain disorders
of the immune system
4 (0.24)
2-
2-
Diseases of the digestive system
4 (0.24)
2-
2-
Injury, poisoning and certain other consequences of external causes
3-
0-
3-
Diseases of the musculoskeletal system and connective tissue
2-
1-
1-
Mental and behavioural disorders
1-
1-
0-
458
184
274
Total
NSW Child Death Review Team | Annual Report 2012
21
3.2.2 Remoteness and socioeconomic status
In 2012, there was a considerable decrease (18%) in the number of deaths from perinatal conditions in major cities. There was
a slight increase in the number of deaths from perinatal conditions in inner regional areas, resulting in these areas having the
highest rate of deaths from this cause (10.9 per 100,000 children).
The highest mortality rate was associated with external cause deaths in outer regional areas of NSW (19.64 per 100,000
children). This is an increase of over five deaths per 100,000 compared with 2011.
Despite the large numbers of deaths from perinatal conditions, there was no apparent pattern with socioeconomic status.
Mortality rates ranged from 5.8 per 100,000 in quintile 4 to 10.3 per 100,000 in quintile 2.
Table 10: Underlying cause of death by remoteness
Number of deaths (Crude Mortality Rate)
ICD chapter
All
children*
Major
Cities
Inner
Regional
Outer
Regional
Remote
Very
Remote
Certain conditions arising in the perinatal period
148 (9.05)
97 (8.23)
37 (10.9)
6 (5.61)
2-
0-
Congenital malformations, deformations and
chromosomal abnormalities
102 (6.24)
72 (6.11)
18 (5.3)
6 (5.61)
0-
0-
External causes of morbidity and mortality
80 (4.89)
35 (2.97)
20 (5.89)
21 (19.64)
3-
0-
Neoplasms
29 (1.77)
16 (1.36)
10 (2.95)
2-
0-
0-
Diseases of the nervous system
25 (1.53)
13 (1.1)
6 (1.77)
5 (4.68)
0-
0-
18 (1.1)
8 (0.68)
6 (1.77)
3-
1-
0-
Diseases of the respiratory system
14 (0.86)
5 (0.42)
4 (1.18)
3-
2-
0-
Endocrine, nutritional and metabolic disorders
11 (0.67)
8 (0.68)
2-
1-
0-
0-
Diseases of the circulatory system
10 (0.61)
9 (0.76)
0-
0-
0-
1-
Certain infectious and parasitic diseases
7 (0.43)
5 (0.42)
1-
1-
0-
0-
Diseases of the blood, blood-forming organs and
certain disorders of the immune system
4 (0.24)
4 (0.34)
0-
0-
0-
0-
Diseases of the digestive system
4 (0.24)
1-
1-
2-
0-
0-
Injury, poisoning and certain other consequences
of external causes
3-
0-
2-
1-
0-
0-
Diseases of the musculoskeletal system and
connective tissue
2-
2-
0-
0-
0-
0-
Mental and behavioural disorders
1-
1-
0-
0-
0-
0-
458
276
107
51
8
1
Symptoms, signs and abnormal clinical and
laboratory findings, not elsewhere classified
Total
*Remoteness was not calculated in 15 cases.
22
NSW Child Death Review Team | Annual Report 2012
Table 11: Underlying cause of death by Index of Relative Social Disadvantage quintile
(Crude Mortality Rate)
Number of deaths (Crude Mortality Rate)
ICD chapter
All children*
Quintile5
Quintile4
Quintile3
Quintile2
Quintile1
Certain conditions arising in the
perinatal period
148 (9.08)
29 (8.36)
18 (5.84)
28 (10.08)
30 (10.3)
36 (8.89)
Congenital malformations,
deformations and chromosomal
abnormalities
102 (6.26)
24 (6.92)
16 (5.19)
12 (4.32)
23 (7.89)
19 (4.69)
External causes of morbidity and
mortality
80 (4.91)
15 (4.33)
12 (3.89)
17 (6.12)
19 (6.52)
13 (3.21)
Neoplasms
29 (1.78)
3-
3-
1-
11 (3.78)
9 (2.22)
Diseases of the nervous system
25 (1.53)
5 (1.44)
2-
4 (1.44)
7 (2.4)
5 (1.23)
Symptoms, signs and abnormal
clinical and laboratory findings, not
elsewhere classified
18 (1.1)
7 (2.02)
1-
2-
2-
6 (1.48)
Diseases of the respiratory system
14 (0.86)
7 (2.02)
0-
4 (1.44)
3-
0-
Endocrine, nutritional and metabolic
disorders
11 (0.68)
2-
1-
1-
4 (1.37)
3-
Diseases of the circulatory system
10 (0.61)
4 (1.15)
3-
1-
0-
2-
Certain infectious and parasitic
diseases
7 (0.43)
3-
2-
2-
0-
0-
Diseases of the blood, blood-forming
organs and certain disorders of the
immune system
4 (0.25)
1-
0-
2-
0-
1-
Diseases of the digestive system
4 (0.25)
1-
1-
2-
0-
0-
Injury, poisoning and certain other
consequences of external causes
3-
1-
0-
1-
1-
0-
Diseases of the musculoskeletal
system and connective tissue
2-
1-
0-
0-
0-
1-
Mental and behavioural disorders
1-
0-
0-
0-
0-
1-
458
103
59
77
100
96
Total
*Socioeconomic status was not calculated in 23 cases.
NSW Child Death Review Team | Annual Report 2012
23
Chapter 4. Children who died outside of NSW
Each year, a number of children normally resident in NSW die in another state or territory. In 2011, 14 children from NSW died
outside of the state. As shown in table 12, this is lower than the average number of such deaths (23) over the 15 years to 2011.
Generally, if a person dies in a particular state, their death is registered in that state.19 This is required by legislation in NSW.
The 493 children whose deaths were registered in NSW in 2012 include seven children who were normally resident in another
state or territory, and four children who were normally resident in another country.
Table 12: Deaths of children resident in NSW registered in another state or territory, 1997 - 2011
1997
1998
1999
2000
2001
2002
2003
2004
2005
2006
2007
2008
2009
2010
2011
Total
ACT
11
6
10
7
12
13
7
5
6
11
7
7
9
11
5
127
NT
0
1
1
0
0
0
0
0
0
0
0
0
0
0
0
2
QLD
5
7
14
8
8
13
12
5
8
9
14
5
10
14
5
137
SA
3
0
2
1
2
1
2
1
1
1
2
4
1
0
0
21
VIC
0
0
1
3
4
3
1
5
3
2
2
8
9
5
3
49
WA
0
1
0
0
0
1
0
0
0
0
0
1
0
1
0
4
TAS
Total
0
0
0
0
0
0
0
0
1
1
0
0
0
1
1
4
19
15
28
19
26
31
22
16
19
24
25
25
29
32
14
344
4.1 CDRT reviews and children who die outside of NSW
The jurisdiction of the Team is limited to NSW, and it is therefore unable to require agencies in other states or territories to
provide information about a child who dies.
Each year, the Team requests information about children from NSW who die outside of the State from other child death review
teams or similar bodies, and/or registries of births, deaths and marriages. The information provided is typically limited to age
or age grouping, gender, cause of death, and residential postcode. No state or territory provides identifying data, which means
that no further information can be sought by the Team from agencies or service providers within NSW.
For this reason, the Team has generally excluded the deaths of children outside of NSW from detailed analysis in its annual
report, and has reported the deaths separately within the report.
In 2007, the Commission for Children and Young People Act 1998 was amended in relation to the CDRT, to enable the Team
to exercise any of its functions with respect to deaths of children from NSW that occur outside of the state. Changes also
provided for the Convenor to enter into an exchange of information arrangement with other state and territory child death
review (or similar) bodies.
At this time, the Team has no formal arrangements in place with other states or territories, and such an arrangement would
be dependent on similar provisions for exchange of information being available in the relevant legislation for other state and
territory review bodies.
4.2 Children who died outside of NSW in 2011
From the information provided by the other states and territories, the vast majority of the 14 children (13) died from natural
causes. Consistent with deaths that occurred in NSW, most were due to perinatal conditions (8) and congenital and
chromosomal causes (2).
One child who was normally resident in NSW died from whooping cough while interstate. One child was a passenger
in a motor vehicle accident.
The majority (12) were younger than one year of age when they died, including eight children who died on the day they were born.
19 Information about deaths registered interstate is not generally available for the current reporting year. The latest available information relates to
deaths registered in other states or territories in 2011.
24
NSW Child Death Review Team | Annual Report 2012
Chapter 5. Deaths due to natural causes
Over three-quarters (357)20 of the children whose deaths were registered in NSW in 2012 died as a result of natural causes.
This has consistently been the case.
This chapter provides information about all of the deaths due to natural causes. More detailed analyses on specific natural
causes are presented in the following chapters.
The deaths of five of the 357 children reported here are also reviewable deaths, subject to separate review by the Ombudsman.21
5.1 Demographic and individual characteristics
The table below outlines the demographic characteristics of all children who died from natural causes in 2012.
Table 13: Key demographic and individual characteristics – deaths due to natural causes, 2012
Total
Number
Percent
Crude Mortality
Rate
95% Confidence
Interval
357
100
21.74
19.48 - 23.99
Incident
Rate Ratio
p
1.30
0.0064
2.10
0
Gender
Female
150
42
18.79
15.78 - 21.80
Male
207
58
24.52
21.18 - 27.86
Age
Under 1 year
257
72
276.01 (2.59)†
242.26 -309.75
1-4 years
29
8
7.59
5.08 - 10.90
5-9 years
30
8
6.65
4.49 - 9.50
10-14 years
19
5
4.30
2.59 - 6.71
15-17 years
22
6
8.02
5.02 - 12.14
326
91
20.75
18.50 - 23.00
31
9
43.54
29.59 - 61.81
233
68
19.77
17.23 - 22.30
Inner regional areas
79
23
23.27
18.42 - 29.00
Outer regional areas
Aboriginal and Torres Strait Islander status
Not Aboriginal or Torres Strait Islander
Aboriginal or Torres Strait Islander
Remoteness
*
Major cities
26
8
24.31
15.88 - 35.63
Remote areas
4
1
47.94
13.06 - 122.76
Very remote areas
1
0
-
-
Quintile 5 (highest)
77
23
19.01
15.00 - 23.76
Quintile 4
78
23
26.77
21.16 - 33.41
Quintile 3
57
17
20.52
15.54 - 26.58
Socioeconomic status**
Quintile 2
46
14
13.27
10.92 - 19.89
Quintile 1 (lowest)
80
24
28.80
18.30 - 28.72
*Remoteness was not calculated in 14 cases.
**Socioeconomic status was not calculated in 19 cases.
† Infant Mortality Rate.
20 Based on the 458 deaths where cause of death was known.
21 Under Part 6 of the Community Services (Complaints, Reviews and Monitoring) Act 1993, the Ombudsman is required to review the deaths of
children and adults with disabilities in care; the deaths of children who died as a result of abuse, neglect, or in suspicious circumstances; and the
deaths of children in detention.
NSW Child Death Review Team | Annual Report 2012
25
5.1.1 Age and gender
Figure 2 illustrates the age and gender of children who died in 2012.
Almost three-quarters (257) of the children who died from natural causes were infants aged less than one year. Overall, natural
causes accounted for the vast majority of the deaths of infants (92%).
Natural causes also accounted for most of the deaths of children aged 1-4 years (67%), 5-9 years (70%), and 10-14 years
(54%). The lowest proportion of deaths from natural causes was amongst children aged 15-17 years (38%).
The mortality rate for natural causes in 2012 was lower across all age groups, except for children aged 5-9 years where there
was a slight increase (6.65 per 100,000, from 5.83 per 100,000).
Consistent with previous years, males had a higher mortality rate for natural causes than females. The proportion of deaths
from natural causes for males (76%) and females (82%) was also consistent.
Figure 2: Deaths due to natural causes by age and gender, 2012
300
250
Key
200
Male
150
Female
100
Total
50
0
Under 1 year
1-4 years
5-9 years
10-14 years
15-17 years
5.1.2 Aboriginal and Torres Strait Islander status
Thirty-one children who died from natural causes were Aboriginal (27) or Torres Strait Islander (4). The rate of death
of Aboriginal and Torres Strait Islander children from natural causes (43.54 per 100,000) was more than twice that of
non-Indigenous children.
5.1.3 Remoteness and socioeconomic status
Over two-thirds of the deaths of children from natural causes occurred in major cities. However, the mortality rate was higher
in regional and remote areas. Four deaths occurred in remote areas, and one child died from natural causes in a very remote
area of NSW.
Consistent with 2011, the mortality rate for children living in areas in the second lowest quintile of socioeconomic status was
lower than that of children living in areas in the highest quintiles. The rate of death from natural causes of children living in the
lowest quintile of socioeconomic status was 1.5 times that of children in the highest quintile.
5.1.4 Child protection history
Of the 357 children who died as a result of natural causes, the families of 42 (12%) had a child protection history.
Within the three years before their death, 25 of the 42 children had been the subject of a report of risk of harm or risk of
significant harm to Community Services. One child was in care at the time of their death.
Seventeen of the 42 children had not been the subject of a child protection report, but had a sibling who had been.
5.2 Leading natural causes of death
Table 14 outlines the top five leading natural causes of death of children in 2012.
The first four leading natural causes of death in 2012 – perinatal conditions, congenital and chromosomal causes, neoplasms
and diseases of the nervous system – are consistent with previous years.
In 2012, the fifth leading natural cause of death was respiratory diseases, mainly chronic lower respiratory diseases such as
asthma. The fifth leading natural cause of death in 2010 and 2011 was diseases of the circulatory system, which, in 2012, was
the seventh leading cause.
26
NSW Child Death Review Team | Annual Report 2012
Table 14: Top five leading natural causes of death, 2012
Natural cause of death
Count
Percent
Crude
Mortality Rate
95% Confidence
interval
148
41.5
9.01 (1.49)†
7.56 - 10.46
Foetus and newborn affected by maternal factors/ complications of
pregnancy (P00-P04)
68
19
4.14 (0.69)
3.22 - 5.25
Disorders related to length of gestation/ foetal growth (P05-P08)
30
8.4
1.83 (0.30)
1.23 - 2.61
Certain conditions originating in the perinatal period (P00-P96)
Perinatal respiratory and cardiovascular disorders (P20-P29)
18
5
1.10 (0.18)
0.65 - 1.73
Other perinatal disorders (P90-P96)
10
2.8
0.61 (0.10)
0.29 - 1.12
Haemorrhagic/haematological disorders of foetus/newborn (P50-P61)
9
2.5
0.55 (0.09)
0.25 - 1.04
Digestive system disorders of foetus/newborn (P75-P78)
5
1.4
0.30 (0.05)
0.10 - 0.71
Perinatal infections (P35-P39)
4
1.1
0.24 (0.04)
0.07 - 0.62
Transitory endocrine and metabolic disorders specific to foetus/
newborn (P70-P74)
2
0.6
-
-
Integument and thermoregulation conditions of foetus/newborn
(P80-P83)
2
0.6
-
-
102
28.6
6.21
5.01 - 7.42
Congenital malformations, deformations and chromosomal
abnormalities (Q00-Q99)
Malformations of the circulatory system (Q20-Q28)
32
9
1.95
1.33 - 2.75
Malformations of the nervous system (Q00-Q07)
23
6.4
1.40
0.89 - 2.10
Chromosomal abnormalities, not elsewhere classified (Q90-Q99)
14
3.9
0.85
0.47 - 1.43
Malformations/ deformations of the musculoskeletal system (Q65-Q79)
12
3.4
0.73
0.38 - 1.28
Other congenital malformations (Q80-Q89)
10
2.8
0.61
0.29 - 1.12
Malformations of the urinary system (Q60-Q64)
7
2
0.43
0.17 - 0.88
Malformations of the respiratory system (Q30-Q34)
2
0.6
-
-
Malformations of the digestive system (Q38-Q45)
2
0.6
-
-
Neoplasms (C00-D48)
29
8.1
1.77
1.18 - 2.54
Malignant neoplasms of lymphoid/haematopoetic tissue (C81-C96)
11
3.1
0.6
0.33 - 1.20
Malignant neoplasms of eye/brain/other parts of central nervous
system (C69-C72)
8
2.2
0.49
0.21 - 0.96
Malignant neoplasms of bone/cartilage (C40-C41)
5
1.4
0.30
0.10 - 0.71
Malignant neoplasms of urinary tract (C64-C68)
2
0.6
-
-
Malignant neoplasms of digestive organs (C15-C26)
1
0.3
-
-
Malignant neoplasms of ill-defined/secondary/unspecified sites
(C76-C80)
1
0.3
-
-
Malignant neoplasms of male genital organs (C60-C63)
1
0.3
-
-
Diseases of the nervous system (G00-G99)
25
7
1.52
0.99 - 2.25
Cerebral palsy/ other paralytic syndromes (G80-G83)
7
2
0.43
0.17 - 0.88
Episodic/paroxysmal disorders (G40-G47)
6
1.7
0.37
0.13 - 0.80
Systemic atrophies primarily affecting central nervous system
(G10-G13)
4
1.1
0.24
0.07 - 0.62
Inflammatory diseases of central nervous system (G00-G09)
3
0.8
-
-
Diseases of myoneural junction/muscle (G70-G73)
3
0.8
-
-
Other disorders of the nervous system (G90-G99)
2
0.6
-
-
Diseases of the respiratory system (J00-J99)
14
3.9
0.85
0.47 - 1.43
Chronic lower respiratory diseases (J40-J47)
7
2
0.43
0.17 - 0.88
Influenza/Pneumonia
5
1.4
0.3
0.10 - 0.71
Other acute lower respiratory infections (J20-J22)
1
0.3
-
-
Other diseases of upper respiratory tract (J30-J39)
1
0.3
-
-
† Infant Mortality Rate.
NSW Child Death Review Team | Annual Report 2012
27
5.3 Trends in deaths of children in NSW from natural causes,
1998-2012
As indicated in table 15, there has been a decline in the rate of deaths from natural causes over time. In 2012, the mortality rate
for natural causes (21.7 per 100,000) was the lowest rate for 15 years.
The rate of death from natural causes notably declined for both males and females. In 2012, the mortality rates for both
genders were the lowest rates for 15 years.
Table 15: Trends in deaths of children due to natural causes by gender, 1998-2012,
number and (crude mortality rate)
28
1998
1999
2000
2001
2002
2003
2004
2005
2006
2007
2008
2009
2010
2011
2012
Female
203
(26.3)
253
(32.6)
225
(28.8)
230
(29.3)
201
(25.6)
206
(26.3)
209
(26.8)
207
(26.5)
199
(25.4)
194
(24.8)
197
(25.1)
192
(24.4)
187
(23.7)
198
(24.9)
150
(18.8)
Male
291
(35.9)
323
(39.6)
289
(35.2)
288
(34.8)
234
(28.3)
246
(29.9)
247
(30.1)
285
(34.7)
257
(31.1)
235
(28.5)
269
(32.5)
249
(30.0)
261
(31.3)
247
(29.4)
207
(24.5)
Both
494
(31.2)
576
(36.2)
514
(32.1)
518
(32.1)
435
(27.0)
452
(28.2)
456
(28.5)
492
(30.7)
456
(28.3)
429
(26.7)
466
(28.9)
441
(27.3)
448
(27.6)
445
(27.2)
357
(21.7)
NSW Child Death Review Team | Annual Report 2012
Chapter 6. Deaths from conditions arising in the
perinatal period
In 2012, 148 children whose deaths were registered in NSW died as a result of conditions arising in the perinatal period.
The rate of perinatal deaths in 2012 (1.49 per 1,000 live births) was lower than 2010 and 2011 (2 per 1,000 live births).
Perinatal conditions are those that arise during pregnancy, or up to 28 days post-partum. It includes conditions such as
prematurity; respiratory and cardiovascular disorders, such as intrauterine hypoxia; maternal factors such as hypertensive
disorders; and complications of pregnancy, labour and delivery.
Use of the term ‘perinatal condition’ does not necessarily mean that the child died in the perinatal period. For example,
a perinatal condition may result in death at a later stage in childhood.
6.1 Demographic and individual characteristics
Table 16 outlines the key demographic characteristics of the 148 children who died from perinatal conditions in 2012. In this
table, mortality rates are Infant Mortality Rates (per 1,000 live births).
Table 16: Key demographic and individual characteristics – deaths due to perinatal conditions, 2012
Number
Percent
Crude Mortality
Rate
95% Confidence
Interval
148
100
1.49
1.25 - 1.73
Female
57
39
1.19
0.90 - 1.54
-
-
Male
91
61
1.78
1.44 - 2.19
1.51
0.0071
Total
Incident
Rate Ratio
p
Gender
Age
Under 1 day
83
56.1
0.84
0.67 - 1.04
-
-
Under 1 week
33
22.3
0.33
0.23 - 0.47
-
-
Under 28 days
18
12.2
0.18
0.11 - 0.29
-
-
Under 1 year
13
8.8
0.13
0.07 - 0.22
-
-
1
0.7
-
-
-
-
130
88
1.39
1.15 - 1.63
-
-
18
12
3.21
1.90 – 5.07
2.30
0
Major cities
97
68
1.29
1.04 - 1.57
-
-
Inner regional areas
37
26
2.14
1.51 - 2.95
-
-
Outer regional areas
6
4
1.12
0.41 - 2.45
-
-
Remote areas
2
1
-
-
-
-
Very remote areas
0
0
-
-
-
-
Quintile 5 (highest)
36
26
2.02
1.42 - 2.80
-
-
Quintile 4
30
21
1.86
1.26 - 2.66
-
-
Quintile 3
28
20
1.41
0.94 - 2.05
-
-
1 year and over
Aboriginal and Torres Strait Islander status
Not Aboriginal or Torres Strait Islander
Aboriginal or Torres Strait Islander
Remoteness
*
Socioeconomic status**
Quintile 2
18
13
0.77
0.46 - 1.22
-
-
Quintile 1 (lowest)
29
21
1.62
1.09 - 2.33
-
-
*Remoteness was not calculated in six cases.
**Socioeconomic status was not calculated in seven cases.
NSW Child Death Review Team | Annual Report 2012
29
6.1.1 Age, gender and Aboriginal and Torres Strait Islander status
The majority of perinatal deaths occur in the first day of life. In 2012, just over half of children were less than one day old and 80
per cent were less than one week old when they died from perinatal conditions. This is largely consistent with previous years.
As shown in table 17, males have typically had a higher rate of death from perinatal conditions than females over the past 15
years. In 2012, the mortality rate for both genders was notably lower than previous years.
Eighteen children identified as Aboriginal (16) or Torres Strait Islander (2) died from perinatal conditions in 2012. The mortality
rate of Indigenous children from this cause was more than double that of non-Indigenous children.
Table 17: Trends in deaths of children due to perinatal conditions by gender, 1998-2012, number and
(Infant Mortality Rate)
1998
1999
2000
2001
2002
2003
2004
2005
2006
2007
2008
2009
2010
2011
2012
Female
83
(2.0)
102
(2.4)
107
(2.5)
108
(2.6)
85
(2.0)
99
(2.4)
82
(2.0)
108
(2.6)
94
(2.2)
88
(2.0)
88
(1.9)
84
(1.9)
71
(1.5)
86
(1.8)
57
(1.2)
Male
105
(2.4)
149
(3.4)
139
(3.1)
136
(3.1)
102
(2.3)
100
(2.2)
101
(2.3)
148
(3.3)
144
(3.2)
110
(2.4)
125
(2.6)
116
(2.4)
114
(2.3)
110
(2.2)
91
(1.8)
Both
188
(2.2)
251
(2.9)
246
(2.8)
244
(2.9)
187
(2.2)
199
(2.3)
183
(2.1)
256
(3.0)
238
(2.7)
198
(2.2)
213
(2.2)
200
(2.2)
185
(1.9)
196
(2.0)
148
(1.5)
6.1.2 Remoteness and socioeconomic status
The highest rate of death from perinatal conditions in 2012 was recorded among infants who resided in inner regional areas.
One-quarter of the infants who died resided in areas of the highest socioeconomic status.
6.2 Leading causes of death from conditions originating in the
perinatal period
In 2012, and as shown in table 18, maternal factors and complications of pregnancy, labour and delivery were the leading
cause of death from perinatal conditions, accounting for almost half of all perinatal deaths (68). Of the 68 deaths of children
from this cause:
• half (35) were due to maternal complications of pregnancy, mainly related to premature rupture of membranes (11), multiple
pregnancy (9), or incompetent cervix (7)
• over one-quarter (23) were due to placenta, cord and membrane complications, mainly related to chorioamnionitis22 (12), or
placental separation and haemorrhage (6), and
• eight were as a result of maternal conditions, mainly maternal hypertensive disorders (5).
Disorders related to the length of gestation and foetal growth accounted for one-fifth of deaths from perinatal conditions (30).
The vast majority of these deaths (29) were due to extreme immaturity and extremely low birth weight.
Twelve per cent of perinatal deaths (18) were due to respiratory and cardiovascular disorders, mainly intrauterine hypoxia 23 (5)
and primary atelectasis24 of the newborn (4).
22 Bacterial infection of the foetal membranes.
23 Inadequate oxygen availability during the gestation period.
24 Failure of the lungs to expand fully at birth.
30
NSW Child Death Review Team | Annual Report 2012
Table 18: Leading causes of death from perinatal conditions, 2012
Type
Female
Male
Total
Crude Mortality
Rate
95% Confidence
Interval
Maternal/obstetric factors
21
47
68
0.73
0.53 - 0.87
Length of gestation (prematurity)
13
17
30
0.32
0.20 - 0.43
Respiratory/cardiovascular disorders
6
12
18
0.19
0.04 - 0.17
Other perinatal conditions
2
8
10
0.11
0.01 - 0.10
Haemorrhagic/haematological disorders
6
3
9
0.10
0.11 - 0.29
Infections
4
0
4
0.04
0.05 - 0.19
Endocrine/metabolic disorders
4
3
7
0.08
0.00 - 0.07
Disorders of thermoregulation
1
1
2
-
-
57
91
148
Total
NSW Child Death Review Team | Annual Report 2012
31
Chapter 7. Deaths from congenital and
chromosomal causes
In 2012, 102 children whose deaths were registered in NSW died as a result of congenital malformations and chromosomal
abnormalities (‘congenital and chromosomal causes’). Consistent with previous years, congenital and chromosomal
conditions were the overall second leading cause of death of children in NSW.
The majority of the deaths (88) were due to congenital factors. The deaths of 14 children were due to chromosomal causes.
7.1 Demographic and individual characteristics
Table 19 provides an overview of the key demographic characteristics of the 102 children whose underlying cause of death
was congenital and chromosomal conditions.
Table 19: Key demographic and individual characteristics – deaths due to congenital and chromosomal
causes, 2012
Number
Percent
Crude
Mortality Rate
95% Confidence
Interval
102
100
6.21
5.01 - 7.42
Female
42
41
5.26
3.79 - 7.11
Male
60
59
7.11
5.42 - 9.15
Under 1 year
84
82
90.21 (0.85)†
71.96 - 111.69
1-4 years
10
10
2.62
1.26 - 4.81
5-9 years
3
3
-
-
10-14 years
2
2
-
-
15-17 years
3
3
-
-
97
95
6.17
5.01 - 7.53
5
5
7.02
2.28 - 16.39
Major cities
72
75
6.11
4.78 - 7.69
Inner regional areas
18
19
5.30
3.14 - 8.38
Outer regional areas
6
6
5.61
2.06 - 12.21
Remote areas
0
0
-
-
Very remote areas
0
0
-
-
Quintile 5 (highest)
19
20
4.69
2.82 - 7.32
Quintile 4
23
24
7.89
5.00 - 11.84
Quintile 3
12
13
4.32
2.23 - 7.55
Quintile 2
16
17
4.61
2.97 - 8.42
Quintile 1 (lowest)
24
26
8.64
4.44 - 10.30
Total
Incident
Rate Ratio
p
1.35
0.0668
1.14
0.3897
Gender
Age
Aboriginal and Torres Strait Islander status
Not Aboriginal or Torres Strait Islander
Aboriginal or Torres Strait Islander
Remoteness*
Socioeconomic status**
* Remoteness was not calculated in six cases.
** Socioeconomic status was not calculated in eight cases.
† Infant Mortality Rate.
32
NSW Child Death Review Team | Annual Report 2012
7.1.1 Age, gender and Aboriginal and Torres Strait Islander status
As shown in figure 3, the vast majority (84; 82%) of the children who died from congenital and chromosomal conditions
were aged less than one year of age. Almost half of these children (35) died in the first day of life. Overall, congenital and
chromosomal causes accounted for 30 per cent of all infant deaths in NSW in 2012. This is largely consistent with the
proportion of infant deaths from this cause across Australia.25
In 2012, congenital and chromosomal conditions were the leading cause of the deaths of children aged 1-4 years. This was
the only age group in which the rate of death from this cause increased.
More males than females died from congenital and chromosomal conditions in 2012. This has generally been the case over
the past 15 years.
Five of the children who died from congenital and chromosomal conditions were Aboriginal. The rate of death of Indigenous
children from this cause in 2012 (7 per 100,000) was slightly higher than that of non-Indigenous children (6.1 per 100,000).
Figure 3: Deaths due to congenital and chromosomal causes by age and gender, 2012
90
80
Key
Number of Deaths
70
Male
60
50
Female
40
Total
30
20
10
0
under 1 year
1-4 years
5-9 years
10-14 years
15-17 years
7.2 Leading causes of death due to congenital and chromosomal
causes
In 2012, the leading causes of death of children from congenital and chromosomal causes were:
1. Congenital malformations of the circulatory system (32; 31%) – mainly congenital malformations of the aortic and mitral
valves (9), heart (8), and great arteries (7).
2. Congenital malformations of the nervous system (23; 23%) – primarily congenital malformations of the brain (10), and
spina bifida (6).
3. Chromosomal abnormalities, not elsewhere classified (14; 14%) – mainly Edwards and Patau’s syndromes (7).
4. Congenital malformations and abnormalities of the musculoskeletal system (12; 12%), such as congenital
diaphragmatic hernia.
5. Other congenital malformations (10; 10%), such as Cornelia de Lange syndrome and unspecified congenital
malformations.
Congenital malformations of the circulatory system are the most commonly reported congenital conditions in NSW,26 and
have consistently been a leading congenital cause of death of children. In the 15 years to 2012, 483 children died as a result of
congenital circulatory system conditions, the vast majority of whom (375; 78%) were infants. The 32 deaths from this cause in
2012 are consistent with the average over that period.
25 Across Australia in 2008-2010, congenital anomalies accounted for around one-quarter (26%) of all infant deaths. Australian Institute of Health
and Welfare 2012, A picture of Australia’s children 2012. Cat. no. PHE167. Canberra: AIHW, p. 13.
26 Centre for Epidemiology and Evidence 2013, NSW Mothers and Babies 2010. Sydney: NSW Ministry of Health, p. 92.
NSW Child Death Review Team | Annual Report 2012
33
As indicated in table 20, infants were prevalent in all of the leading causes of death from congenital conditions, including those
related to the circulatory system (27; 84%), nervous system (22; 96%), and musculoskeletal system (11; 92%).
Table 20: Leading causes of deaths due to congenital and chromosomal causes by age, 2012
Under 1 year
1-4 years
5-9 years
10-14 years
15-17 years
Circulatory system
27
Circulatory system
3
Circulatory system
1
Other congenital
1
Circulatory system
1
Nervous system
22
Other congenital
3
Respiratory system
1
Chromosomal
1
Urinary system
1
Musculoskeletal
11
Chromosomal
2
Chromosomal
Chromosomal
10
Nervous system
1
Urinary system
6
Digestive system
1
1
Other congenital
6
Respiratory system
1
Digestive system
1
34
NSW Child Death Review Team | Annual Report 2012
Musculoskeletal
1
Chapter 8. Deaths from neoplasms (cancers
and tumours)
In 2012, 29 children whose deaths were registered in NSW died as a result of neoplasms (cancers and tumours).
In NSW in 2012, cancers and tumours were the leading natural cause of death of children aged one year and over. Australiawide, cancers and tumours are the second most common cause of death among children over one year of age.27
The rate of death of children from cancers and tumours in 2012 was notably lower than in 2011. As shown in table 22, there has
been a decline in these deaths in NSW over the past 15 years.
8.1 Demographic and individual characteristics
Table 21 provides an overview of the main demographic characteristics of children who died as a result of cancers and tumours.
Table 21: Key demographic and individual characteristics – deaths due to cancers and tumours, 2012
Number
Percent
Crude
Mortality Rate
95% Confidence
Interval
29
100
1.77
1.18 - 2.54
Female
13
45
1.63
0.87 - 2.78
Male
16
55
1.90
1.08 - 3.08
Under 1 year
0
0
-
1-4 years
7
24
1.83
0.74 - 3.78
5-9 years
11
38
2.44
1.22 - 4.37
Total
Incident
Rate Ratio
p
1.16
0.3446
Gender
Age
10-14 years
3
10
-
-
15-17 years
8
28
2.91
1.26 - 5.74
28
97
1.78
1.18 - 2.58
1
3
-
-
Major cities
16
57
1.36
0.78 - 2.20
Inner regional areas
10
36
2.95
1.41 - 5.42
Outer regional areas
2
7
-
-
Remote areas
0
0
-
-
0
0
-
-
Aboriginal and Torres Strait Islander status
Not Aboriginal or Torres Strait Islander
Aboriginal or Torres Strait Islander
Remoteness
*
Very remote areas
Socioeconomic status
**
Quintile 5 (highest)
9
33
2.22
1.02 - 4.22
Quintile 4
11
41
3.78
1.88 - 6.75
Quintile 3
1
4
-
-
Quintile 2
3
11
-
-
Quintile 1 (lowest)
3
11
-
-
* Remoteness was not calculated in one case.
** Socioeconomic status was not calculated in two cases.
27 Australian Institute of Health and Welfare 2011, Australia’s Health 2010. Canberra: AIHW.
NSW Child Death Review Team | Annual Report 2012
35
8.1.1 Age and gender and Aboriginal and Torres Strait Islander status
In 2012, cancers and tumours were the overall leading cause of death of children aged 5-9 years, and the leading natural
cause of death of children aged 15-17 years.
The age of children who died due to cancers and tumours ranged from one year to 17 years of age. There were no deaths of
children under the age of one year.
Overall, the rate of death from cancers and tumours in 2012 (1.77 per 100,000) was lower than previous years (such as 2.99
per 100,000 in 2011). The mortality rate declined for children aged less than one year, and for those aged 1-4 and 10-14 years.
The rate of death from cancers and tumours increased marginally for children aged 5-9 and 15-17 years.
In 2012, slightly more males (16) than females (13) died from cancers and tumours. There was little gender difference in the
mortality rate from this cause. As shown in table 22, the mortality rate for males has generally, but not always, been higher than
for females over the past 15 years.
One of the 29 children who died due to cancers and tumours was Aboriginal.
Table 22: Trends in deaths of children due to cancers and tumours by gender, 1998-2012, number and
(crude mortality rate)
1998
1999
2000
2001
2002
2003
2004
2005
2006
2007
2008
2009
2010
2011
2012
Female
24
(3.1)
23
(3.0)
26
(3.3)
26
(3.3)
18
(2.3)
19
(2.4)
29
(3.7)
18
(2.3)
18
(2.3)
23
(2.9)
15
(1.9)
11
(1.4)
22
(2.8)
23
(2.9)
13
(1.6)
Male
42
(5.2)
41
(5.0)
26
(3.2)
33
(4.0)
29
(3.5)
34
(4.1)
25
(3.0)
21
(2.6)
13
(1.6)
24
(2.9)
18
(2.2)
21
(2.5)
22
(2.6)
26
(3.1)
16
(1.9)
Both
66
(4.2)
64
(4.0)
52
(3.2)
59
(3.7)
47
(2.9)
53
(3.3)
54
(3.4)
39
(2.4)
31
(1.9)
47
(2.9)
33
(2.0)
32
(2.0)
44
(2.7)
49
(3.0)
29
(1.8)
8.2 Leading causes of death due to cancers and tumours
Table 23 shows the leading types of cancers and tumours for children whose deaths were registered in 2012, by age.
Cancers of lymphoid and haematopoetic tissue (affecting the blood and bone marrow) were the most common cause,
accounting for the deaths of 11 children. The vast majority (10) were due to leukaemias.
Leukaemias are the most common cancers in children. Acute lymphoblastic leukaemia is the most common type of leukaemia
in children, and the most common type of childhood cancer.28 Of the 10 children who died from leukaemias in 2012, most (6)
died from acute lymphoblastic leukaemia. Four children died from myeloid leukaemia, mainly acute myeloid leukaemia (3).
In 1998-2012, 182 children died from leukaemias in NSW, including lymphoid leukaemia (103) and myeloid leukaemia (79). The
number of deaths in 2012 is consistent with the average for each type of leukaemia over the 15-year period.
Malignant brain tumours were the second leading cause of death of children in NSW from cancers and tumours, accounting
for the deaths of seven children. Approximately 100 children in Australia are diagnosed with malignant brain tumours each
year. While they are rare, brain tumours are the second most common cancer in children.29 The causes of most brain and
spinal cord tumours are unknown.30
The seven deaths from malignant brain tumours in 2012 was less than half of the deaths from this cause in 2010 (16) and 2011
(15), and lower than the average over the past 15 years (13.4 deaths per year). Of the 201 children who died from malignant
brain tumours in 1998-2012, most were aged 1-4 years (56; 28%) and 5-9 years (64; 32%).
Cancers of bone or cartilage were the third most common cause of death of children from cancers and tumours (5).
28 Leukaemia Foundation 2011, Blood cancers in children factsheet. Windsor, QLD: Leukaemia Foundation.
29 Cancer Council NSW 2011, Understanding Brain Tumours: A guide for people with brain or spinal cord tumours, and their families and friends,
Sydney: Cancer Council NSW, p. 13.
30 Ibid., p. 10.
36
NSW Child Death Review Team | Annual Report 2012
Table 23: Leading causes of deaths due to cancers and tumours by age, 2012
Under 1 year
1-4 years
5-9 years
10-14 years
15-17 years
Nil
Leukaemia
5
Brain/spinal cord
5
Bone
1
Bone
3
Brain
1
Kidney
2
Brain
1
Leukaemia
2
Liver
1
Leukaemia
2
Leukaemia
1
Testis
1
Bone
1
Brain
1
Primary site unspecified
1
Lymphoma
1
NSW Child Death Review Team | Annual Report 2012
37
Chapter 9. Deaths from diseases of the
nervous system
IIn 2012, 25 children whose deaths were registered in NSW died as a result of diseases of the nervous system.
Diseases of the nervous system relate to a broad range of conditions that include epilepsy, cerebral palsy, muscular dystrophy,
inflammatory diseases such as meningitis, and other nervous system disorders such as hydrocephalus.
Consistent with 2010 and 2011, diseases of the nervous system were the fourth leading natural cause of death of children in
2012. The number of deaths from nervous system diseases has declined over the past 15 years. The 25 deaths in 2012 was
much lower than the average since 1998 of 34 deaths per year.
9.1 Demographic and individual characteristics
Table 24 provides an overview of the key demographic characteristics of the 25 children whose deaths were due to nervous
system diseases.
Table 24: Key demographic and individual characteristics – deaths due to diseases of the nervous
system, 2012
Number
Percent
Crude
Mortality Rate
95%
Confidence
Interval
25
100
1.52
0.99 - 2.25
Female
10
40
1.25
Male
15
60
under 1 year
7
28
1-4 years
3
12
5-9 years
5
20
10-14 years
4
16
0.90
15-17 years
6
24
2.19
22
88
3
12
Total
Incident
Rate Ratio
p
0.60 - 2.30
-
-
1.78
0.99 - 2.93
1.42
0.1949
(0.07)†
3.02 - 15.49
-
-
-
-
-
-
1.11
0.36 - 2.59
-
-
0.25 - 2.32
-
-
0.80 - 2.12
-
-
1.40
0.88 - 2.12
-
-
-
-
-
-
Gender
Age
Aboriginal and Torres Strait Islander status
Not Aboriginal or Torres Strait Islander
Aboriginal or Torres Strait Islander
Remoteness
*
Major cities
13
54
1.10
0.59 - 1.89
-
-
Inner regional areas
6
25
1.77
0.65 - 3.85
-
-
Outer regional areas
5
21
4.68
1.52 - 10.91
-
-
Remote areas
0
0
-
-
-
-
Very remote areas
0
0
-
-
-
-
Quintile 5 (highest)
5
22
1.23
0.40 - 2.88
-
-
Quintile 4
7
30
2.40
0.97 - 4.95
-
-
Quintile 3
4
17
1.44
0.39 - 3.69
-
-
Quintile 2
2
-
-
-
-
-
Quintile 1 (lowest)
5
22
1.80
0.47 - 3.37
-
-
Socioeconomic status**
*Remoteness was not calculated in one case.
**Socioeconomic status was not calculated in two cases.
† Infant Mortality Rate.
38
NSW Child Death Review Team | Annual Report 2012
9.1.1 Age, gender and Aboriginal and Torres Strait Islander status
Deaths of children from nervous system diseases in 2012 occurred in all age groups. Over one-quarter (7) of the deaths were
infants, and they had the highest mortality rate amongst the age groups.
As indicated in table 25, most (15) of the children were male, but this has not been a consistent trend.
Two of the children were identified as Aboriginal, and one child was identified as both Aboriginal and Torres Strait Islander.
Table 25: Trends in deaths of children due to diseases of the nervous system by gender, 1998-2012,
number and (crude mortality rate)
1998
1999
2000
2001
2002
2003
2004
2005
2006
2007
2008
2009
2010
2011
2012
Female
12
(1.6)
17
(2.2)
12
(1.5)
21
(2.7)
20
(2.5)
18
(2.3)
21
(2.7)
12
(1.5)
21
(2.7)
9
(1.1)
15
(1.9)
14
(1.8)
10
(1.3)
14
(1.8)
10
(1.3)
Male
33
(4.1)
17
(2.1)
27
(3.3)
15
(1.8)
24
(2.9)
29
(3.5)
27
(3.3)
18
(2.2)
18
(2.2)
8
(1.0)
12
(1.5)
17
(2.0)
19
(2.3)
13
(1.5)
15
(1.8)
Both
45
(2.8)
34
(2.1)
39
(2.4)
36
(2.2)
44
(2.7)
47
(2.9)
48
(3.0)
30
(1.9)
39
(2.4)
17
(1.1)
27
(1.7)
31
(1.9)
28
(1.7)
27
(1.7)
25
(1.5)
9.2 Leading causes of death due to diseases of the nervous system
As shown in table 26, the leading causes of death from nervous system diseases in 2012 were cerebral palsy (7), epilepsy (6),
and spinal muscular atrophy (4). The leading causes are largely consistent with deaths in previous years.
Many of the children whose underlying cause of death was nervous system disease had considerable chronic health
concerns, including respiratory conditions (14) such as aspiration and lung disease; and relied on enteral nutrition via a
gastrostomy or nasogastric tube (11). Ten children were receiving palliative care at the time of their death.
Table 26: Leading causes of deaths due to diseases of the nervous system by age, 2012
Under 1 year
1-4 years
5-9 years
10-14 years
15-17 years
Spinal muscular atrophy/
motor neuron disease
3
Spinal muscular atrophy
Cerebral palsy
Epilepsy
Epilepsy
1
4
3
2
Meningitis
2
Epilepsy
1
Intracranial abscess/
granuloma
Cerebral palsy
1
Muscular dystrophy
1
1
Myoneural disorder
Cerebral palsy
Cerebral palsy
1
1
1
Myopathy
Hydrocephalus
1
1
Other disorders of the
nervous system
1
NSW Child Death Review Team | Annual Report 2012
39
Chapter 10. Deaths from diseases of the
respiratory system
In 2012, 14 children whose deaths were registered in NSW died from diseases of the respiratory system.31 Respiratory diseases
include conditions such as pneumonia and asthma.
The rate of death of children from respiratory diseases has not changed significantly over the past 15 years.
10.1 Demographic and individual characteristics
The following table provides an overview of the key demographic characteristics of the 14 children who died from
respiratory diseases.
Table 27: Key demographic and individual characteristics – deaths due to respiratory diseases, 2012
Number
Percent
Crude
Mortality Rate
95% Confidence
Interval
14
100
0.85
0.47 - 1.43
Female
8
57
1.00
0.43 - 1.97
Male
6
43
0.71
0.26 - 1.55
under 1 year
4
29
4.30 (0.04)†
1.17 - 11.00
1-4 years
2
14
-
-
5-9 years
2
14
-
-
10-14 years
5
36
1.13
0.37 - 2.64
15-17 years
1
7
-
-
12
86
0.76
0.39 - 1.33
2
14
-
-
Major cities
5
36
0.42
0.14 - 0.99
Inner regional areas
4
29
1.18
0.32 - 3.02
Outer regional areas
3
21
-
-
Remote areas
2
14
-
-
Very remote areas
0
0
-
-
Quintile 5 (highest)
0
0
-
-
Quintile 4
3
21
-
-
Quintile 3
4
29
1.44
0.39 - 3.69
Quintile 2
0
0
-
-
Quintile 1 (lowest)
7
50
2.52
0.81 - 4.16
All
Incident
Rate Ratio
p
0.71
0.2643
Gender
Age
Aboriginal and Torres Strait Islander status
Not Aboriginal or Torres Strait Islander
Aboriginal or Torres Strait Islander
Remoteness
Socioeconomic status
† Infant Mortality Rate.
31 The deaths of two of these children are included in Chapter 15 on Sudden Unexpected Deaths in Infancy.
40
NSW Child Death Review Team | Annual Report 2012
10.1.1 Age, gender and Aboriginal and Torres Strait Islander status
In 2012, respiratory diseases were the leading natural cause of death of children aged 10-14 years, primarily due to deaths
from asthma. Six of the 14 children who died due to respiratory diseases were younger than five years of age, with four children
under one year. The oldest child was 15 years of age.
Of the 14 children who died from respiratory diseases in 2012, most (8) were female. This is inconsistent with deaths since
1998, where the mortality rate for males due to respiratory diseases has been consistently higher than that of females.
In 2012, two of the 14 children who died from respiratory diseases were identified as Aboriginal.
Table 28: Trends in deaths of children due to respiratory diseases by gender, 1998-2012, number and
(crude mortality rate)
1998
1999
2000
2001
2002
2003
2004
2005
2006
2007
2008
2009
2010
2011
2012
Female
8
(1.0)
9
(1.2)
5
(0.6)
5
(0.6)
5
(0.6)
7
(0.9)
7
(0.9)
2
-
3
-
5
(0.6)
9
(1.1)
4
(0.5)
7
(0.9)
4
(0.5)
8
(1.0)
Male
17
(2.1)
14
(1.7)
9
(1.1)
9
(1.1)
11
(1.3)
8
(1.0)
9
(1.1)
5
(0.6)
8
(1.0)
11
(1.3)
10
(1.2)
5
(0.6)
10
(1.2)
5
(0.6)
6
(0.7)
Both
25
(1.6)
23
(1.4)
14
(0.9)
14
(0.9)
16
(1.0)
15
(0.9)
16
(1.0)
7
(0.4)
11
(0.7)
16
(1.0)
19
(1.2)
9
(0.6)
17
(1.0)
9
(0.6)
14
(0.9)
10.1.2 Remoteness and socioeconomic status
Half of the children who died from respiratory diseases resided in the lowest areas of socioeconomic status. Two children
resided in remote areas of NSW.
10.2 Leading causes of death due to respiratory diseases
As shown in table 29, the most common respiratory disease that caused the deaths of children in NSW in 2012 was asthma.
Asthma accounted for half (7) of the deaths of children from respiratory diseases in that period.
Four deaths were attributed to pneumonia – one was due to viral pneumonia, one was bacterial, and in two deaths the
pathogen was not specified. Three of the four children who died from pneumonia were under 12 months of age.
One child’s underlying cause of death was acute bronchitis with the pathogen not specified. One death was due to chronic
frontal sinusitis and another child died as a result of the avian influenza virus.
Of the seven asthma-related deaths that occurred in 2012, the youngest child who died was seven years of age, and the eldest
was 15 years. Most (5) of the children whose deaths were related to asthma were in middle childhood, aged nine to 14 years.
Over the next year, the Team will undertake a cohort review of asthma-related deaths. The review will examine the deaths of
children due to asthma that occurred in the 10 years between 2004 and 2013.
Table 29: Leading causes of deaths due to respiratory diseases by age, 2012
Under 1 year
1-4 years
5-9 years
10-14 years
15-17 years
Viral pneumonia
Avian influenza
Asthma
Asthma
Asthma
1
1
2
4
1
Pneumonia unspecified
Bronchopneumonia
Chronic sinusitis
2
1
1
Acute bronchitis
1
NSW Child Death Review Team | Annual Report 2012
41
Chapter 11. Deaths from endocrine, nutritional or
metabolic diseases
In 2012, 11 children whose deaths were registered in NSW died as a result of metabolic diseases. There were no deaths in 2012
attributed to nutritional or endocrine diseases (such as diabetes). Metabolic diseases include Batten disease and cystic fibrosis.
The number of deaths from endocrine, nutritional or metabolic diseases in 2012 was slightly lower than the average over the
past 15 years (15 deaths per year).
11.1 Demographic and individual characteristics
Table 30 provides an overview of the key demographic characteristics of the 11 children who died due to metabolic diseases.
Table 30: Key demographic and individual characteristics – deaths due to metabolic diseases, 2012
Number
Percent
Crude
Mortality Rate
95% Confidence
Interval
Incident Rate
Ratio
p
11
100
0.67
0.33 - 1.20
Female
7
64
0.88
0.35 - 1.81
-
-
Male
4
36
0.47
0.13 - 1.21
0.54
0.1611
Under 1 year
3
27
-
-
-
-
1-4 years
3
27
-
-
-
-
5-9 years
2
18
-
-
-
-
10-14 years
2
18
-
-
-
-
15-17 years
1
9
-
-
-
-
11
100
0.70
0.35 - 1.25
-
-
0
0
-
-
-
Major cities
8
73
0.68
0.29 - 1.34
-
-
Inner regional areas
2
18
-
-
-
-
Outer regional areas
1
9
-
-
-
-
Remote areas
0
0
-
-
-
-
Very remote areas
0
0
-
-
-
-
Quintile 5 (highest)
3
27
-
-
-
-
Quintile 4
4
36
1.37
0.37 - 3.51
-
-
Quintile 3
1
9
-
-
-
-
Quintile 2
1
9
-
-
-
-
Quintile 1 (lowest)
2
18
-
-
-
-
Total
Gender
Age
Aboriginal and Torres Strait Islander status
Not Aboriginal or Torres Strait Islander
Aboriginal or Torres Strait Islander
Remoteness
Socioeconomic status
42
NSW Child Death Review Team | Annual Report 2012
11.1.1 Age, gender and Aboriginal and Torres Strait Islander status
Deaths of children due to metabolic diseases occurred across all age groups.
As indicated in table 31, of the 11 children who died from metabolic diseases in 2012, most (7) were female. In the 15 years
since 1998, just over half of the children who died from endocrine, nutritional or metabolic diseases were male (56%).
No Aboriginal or Torres Strait Islander children died from endocrine, nutritional or metabolic diseases in 2012.
Table 31: Trends in deaths of children due to endocrine, nutritional and metabolic diseases by gender,
1998-2012, number and (Crude Mortality Rate)
1998
1999
2000
2001
2002
2003
2004
2005
2006
2007
2008
2009
2010
2011
2012
Female
7
(0.9)
12
(1.5)
7
(0.9)
6
(0.8)
7
(0.9)
5
(0.6)
6
(0.8)
7
(0.9)
5
(0.6)
4
(0.5)
3
(0.4)
12
(1.5)
5
(0.6)
3
-
7
(0.9)
Male
10
91.2)
13
(1.6)
4
(0.5)
6
(0.7)
11
(1.3)
9
(1.1)
3
-
8
(1.0)
4
(0.5)
8
(1.0)
16
(1.9)
9
(1.1)
9
(1.1)
8
(1.0)
4
(0.5)
Both
17
(1.1)
25
(1.6)
11
(0.7)
12
(0.7)
18
(1.1)
14
(0.9)
9
(0.6)
15
(0.9)
9
(0.6)
12
(0.7)
19
(1.2)
21
(1.3)
14
(0.9)
11
(0.7)
11
(0.7)
11.1.2 Remoteness and socioeconomic status
The majority of children lived in major cities (8 of 11), but the rate relative to the population in major cities is not particularly high.
The majority of children were from the two most advantaged socioeconomic categories, but no particular pattern is apparent.
11.2 Leading causes of death from metabolic diseases
The leading causes of death due to metabolic diseases in 2012 varied, as shown in table 32.
Two children died as a result of Batten disease, a fatal neurodegenerative disorder that typically begins in childhood.32 Two
deaths were attributed to ‘other metabolic disorders’, both of which were identified as mitochondrial. The deaths of two
children were due to glycoprotein metabolism disorders; both were younger than one year of age.
All of the remaining metabolic diseases were single cases. One child aged 15-17 years died from cystic fibrosis.
Table 32: Leading causes of death from metabolic diseases, 2012
Under 1 year
1-4 years
5-9 years
10-14 years
15-17 years
Disorders of fatty acid
metabolism
Other disorders of
glycoprotein metabolism
Batten disease
Mucopolysaccharidosis
Cystic fibrosis
1
1
2
1
1
Disorders of glycine
metabolism
Disorders of iron
metabolism
Other metabolic
disorders
1
1
1
Defects in glycoprotein
degradation
Other metabolic
disorders
1
1
32 National Institute of Neurological Disorders and Stroke (USA) 2011, ‘Batten Disease Fact Sheet’ Bethesda, MD: NINDS
http://www.ninds.nih.gov/disorders/batten/detail_batten.htm, accessed 16 July 2013.
NSW Child Death Review Team | Annual Report 2012
43
Chapter 12. Deaths from diseases of the
circulatory system
In 2012, 10 children whose deaths were registered in NSW died as a result of diseases of the circulatory system. Diseases of the
circulatory system relate to a broad range of conditions such as heart diseases, heart failure and cerebrovascular diseases.
The number and rate of deaths from diseases of the circulatory system in 2012 (0.6 per 100,000), represent the lowest number
and rate of deaths from this cause since 2003. Deaths in 2012 were considerably lower than the 15-year average of 19 deaths
per year.
12.1 Demographic and individual characteristics
Table 33 provides an overview of the key demographic characteristics of the 10 children who died from circulatory diseases.
Table 33: Key demographic and individual characteristics – deaths due to diseases of the circulatory
system, 2012
Number
Percent
Crude
Mortality Rate
95% Confidence
Interval
Incident
Rate Ratio
p
10
100
0.61
0.29 - 1.12
Female
5
50
0.63
0.20 - 1.46
-
-
Male
5
50
0.59
0.19 - 1.38
0.95
0.4681
Under 1 year
3
30
-
-
-
-
1-4 years
2
20
-
-
-
-
5-9 years
1
10
-
-
-
-
10-14 years
2
20
-
-
-
-
15-17 years
2
20
-
-
-
-
Not Aboriginal or Torres Strait Islander
9
90
0.57
0.26 - 1.09
-
Aboriginal or Torres Strait Islander
1
10
-
-
-
Major cities
9
90
0.76
0.35 - 1.45
-
-
Inner regional areas
0
0
-
-
-
-
Outer regional areas
0
0
-
-
-
-
Remote areas
0
0
-
-
-
-
Very remote areas
1
10
-
-
-
-
Quintile 5 (highest)
2
20
-
-
-
-
Quintile 4
0
0
-
-
-
-
Quintile 3
1
10
-
-
-
-
Quintile 2
3
30
-
-
-
-
Quintile 1 (lowest)
4
40
1.44
0.31 - 2.95
-
-
Total
Gender
Age
Aboriginal and Torres Strait Islander status
Remoteness*
Socioeconomic status
44
NSW Child Death Review Team | Annual Report 2012
12.1.1 Age, gender and Aboriginal and Torres Strait Islander status
Deaths due to diseases of the circulatory system occurred across all age groups. In 2012, half of the children who died from
circulatory diseases were younger than five years of age; three were under one year. The oldest child was 17 years of age.
The rate of death from circulatory system diseases was slightly lower in 2012 for infants and children aged 10-14 years.
As illustrated in table 34, there was no difference in the number of deaths for females and males. Overall, just over half of the
children who have died from circulatory system diseases since 1998 have been male (56%).
One of the children who died from circulatory system disease was Aboriginal.
Table 34: Trends in deaths of children due to diseases of the circulatory system by gender, 1998-2012,
number and (crude mortality rate)
1998
1999
2000
2001
2002
2003
2004
2005
2006
2007
2008
2009
2010
2011
2012
Female
8
(1.0)
11
(1.4)
8
(1.0)
8
(1.0)
11
(1.4)
4
(0.5)
9
(1.2)
8
(1.0)
11
(1.4)
10
(1.3)
8
(1.0)
7
(0.9)
8
(1.0)
8
(1.0)
5
(0.6)
Male
15
(1.8)
12
(1.5)
14
(1.7)
21
(2.5)
10
(1.2)
6
(0.7)
9
(1.1)
11
(1.3)
8
(1.0)
11
(1.3)
9
(1.1)
7
(0.8)
11
(1.3)
10
(1.2)
5
(0.6)
Both
23
(1.5)
23
(1.4)
22
(1.4)
29
(1.8)
21
(1.3)
10
(0.6)
18
(1.1)
19
(1.2)
19
(1.2)
21
(1.3)
17
(1.1)
14
(0.9)
19
(1.2)
18
(1.1)
10
(0.6)
12.2 Leading causes of death due to diseases of the circulatory
system
Table 35 shows the leading causes of death due to diseases of the circulatory system in 2012, by age.
In 2012, ‘other heart diseases’ comprised the largest cause of the death of children from circulatory system diseases,
accounting for the deaths of six children. Half of these deaths were due to myocarditis. Myocarditis is inflammation of the
heart muscle, usually caused by viral, bacterial or fungal infections that reach the heart. Two of the three children were under
12 months of age.
The other four deaths caused by ‘other heart diseases’ were attributed to cardiomyopathy, a conduction disorder, and
cardiac arrest (2).
The remaining three deaths from circulatory disease in 2012 were due to acute rheumatic heart disease, pulmonary heart
disease (primary pulmonary hypertension), and cerebrovascular disease (subarachnoid haemorrhage).
Table 35: Leading causes of deaths due to diseases of the circulatory system by age, 2012
Under 1 year
1-4 years
5-9 years
10-14 years
15-17 years
Myocarditis
Acute rheumatic heart
disease
Cardiac arrest
Pulmonary heart disease
Cardiac arrest
1
1
1
Other conduction disorder Cerebrovascular disease
Myocarditis
Cardiomyopathy
1
1
1
2
1
1
12.2.1 Sudden cardiac deaths
The deaths of four of the 10 children who died from diseases of the circulatory system in 2012 were considered to be sudden
cardiac deaths. Sudden cardiac death is defined as ‘an unexplained or presumed arrhythmic sudden death, occurring in a
short time (generally within one hour of symptom onset) in a child or young person with previously unknown cardiac disease’.33
Sudden cardiac death is rare and often occurs in seemingly healthy young people.
The four sudden cardiac deaths were attributed to cardiomyopathy, septic myocarditis, and cardiac arrest (2).
33 Commission for Children and Young People and Child Guardian 2012, Trends and Issues paper: Child deaths – sudden cardiac deaths Number 7
March 2012. Brisbane: CCYPCG.
NSW Child Death Review Team | Annual Report 2012
45
Chapter 13. Deaths from infectious or
parasitic diseases
In 2012, seven children whose deaths were registered in NSW died as a result of infectious diseases.34 No deaths from
parasitic diseases were registered in 2012.
Infectious diseases are caused by organisms such as bacteria, viruses, parasites or fungi and can be passed directly or
indirectly from person to person. Examples include septicaemia, gastroenteritis and meningococcal disease.
In Australia, there has been a decrease in deaths from infectious diseases over the past 30 years. This decrease is largely
attributed to the vaccination program and advances in public health.35
13.1 Demographic and individual characteristics
Table 36 provides an overview of the key demographic characteristics of the seven children who died from infectious diseases
and whose deaths were registered in 2012.
Table 36: Key demographic and individual characteristics – deaths due to infectious diseases, 2012
Number
Percent
Crude
Mortality Rate
95% Confidence
Interval
7
100
0.43
0.17 - 0.88
Female
2
29
-
Male
5
71
Total
Incident
Rate Ratio
p
-
-
-
0.59
0.19 - 1.38
2.36
0.1446
Gender
Age
Under 1 year
5
71
5.37 (0.05)†
1.74 - 12.53
-
-
1-4 years
0
0
-
-
-
-
5-9 years
2
29
-
-
-
-
10-14 years
0
0
-
-
-
-
15-17 years
0
0
-
-
-
-
Not Aboriginal or Torres Strait Islander
6
86
0.38
0.14 - 0.83
-
-
Aboriginal or Torres Strait Islander
1
14
-
-
-
-
5
71
0.42
0.14 - 0.99
-
-
Aboriginal and Torres Strait Islander status
Remoteness
Major cities
Inner regional areas
1
14
-
-
-
-
Outer regional areas
1
14
-
-
-
-
Remote areas
0
0
-
-
-
-
Very remote areas
0
0
-
-
-
-
Socioeconomic status
Quintile 5 (highest)
0
0
-
-
-
-
Quintile 4
0
0
-
-
-
-
Quintile 3
2
29
-
-
-
-
Quintile 2
2
29
-
-
-
-
Quintile 1 (lowest)
3
43
1.08
0.18 - 2.53
-
-
† Infant Mortality Rate.
34 The death of one of these children is also included in the SUDI chapter.
35 Australian Institute of Health and Welfare 2011, Young Australian: their health and wellbeing 2011, Canberra: AIHW, p. 46.
46
NSW Child Death Review Team | Annual Report 2012
13.1.1 Age, gender and Aboriginal and Torres Strait Islander status
In 2012, most (5) of the seven children who died as a result of infectious diseases were younger than 12 months of age.
The other children were six and eight years of age.
Males were slightly more likely to die from infectious diseases than females, but not significantly so. Five of the seven children
who died in 2012 were male. This is generally consistent with previous years (other than 2011), in which males have had a
higher mortality rate, as shown in table 37.
One of the children who died from an infectious disease in 2012 was identified as Aboriginal and Torres Strait Islander.
Table 37: Trends in deaths of children who died from infectious and parasitic diseases by gender,
1998-2012, number and (Crude Mortality Rate)
1998
1999
2000
2001
2002
2003
2004
2005
2006
2007
2008
2009
2010
2011
2012
4
3
7
2
5
6
2
1
7
6
2
1
2
7
2
(0.5)
-
(0.9)
-
(0.6)
(0.8)
-
-
(0.9)
(0.8)
-
-
-
(0.9)
-
10
(1.2)
8
8
6
8
7
7
7
6
5
(1.0)
(0.7)
(1.0)
12
(1.5)
8
(1.0)
(1.0)
(0.8)
(0.8)
(0.8)
(0.7)
(0.6)
Female
Male
12
8
5
(1.5)
(1.0)
(0.6)
Both
16
11
12
12
13
14
8
9
19
14
9
8
9
13
7
(1.0)
(0.7)
(0.7)
(0.7)
(0.8)
(0.9)
(0.5)
(0.6)
(1.2)
(0.9)
(0.6)
(0.5)
(0.6)
(0.8)
(0.4)
13.1.2 Remoteness and socioeconomic status
The majority of children who died from infectious diseases in 2012 lived in major cities, and tended to reside in areas of lower
socioeconomic status.
13.2 Leading causes of death due to infectious diseases
As noted in table 38, the underlying cause of death for two children from infectious disease was sepsis. One death was due
to viral carditis; one death was a result of congenital syphilis and one death was due to conditions arising from the human
immunodeficiency virus (HIV).
Two deaths in 2012 were due to vaccine preventable diseases. The underlying cause of death for one child was pertussis
(whooping cough). One death was due to meningococcal septicaemia. In this case, the serogroup type of meningococcal
disease was not identified. Both of these deaths were of children under the age of 12 months, both of whom were younger than
the recommended minimum age for receiving the respective vaccinations.36
Table 38: Leading causes of deaths due to infectious diseases by age, 2012
Under 1 year
1-4 years
5-9 years
Pertussis
1
Streptococcal sepsis
1
Meningococcal infection
1
Other sepsis
1
10-14 years
15-17 years
Congenital syphilis
1
HIV disease resulting in
other conditions
1
Viral carditis
1
36 The National Immunisation Program (NIP) recommends three doses of vaccination for pertussis in infants at two, four and six months of age.
The NIP recommends a meningococcal C conjugate vaccine be given to all children at 12 months of age.
http://www.health.gov.au/internet/immunise/publishing.nsf/Content/nips-ctn, accessed 16 July 2013.
NSW Child Death Review Team | Annual Report 2012
47
Notifiable and vaccine-preventable diseases
Diseases that are defined as communicable (including vaccine-preventable and certain infectious and parasitic diseases)
are required to be notified to NSW Health under the Public Health Act 2010. Communicable diseases are those that can be
transmitted between individuals, and are often preventable through vaccination.
The National Immunisation Program Schedule outlines vaccines that are recommended by age group to protect children from
a wide range of vaccine-preventable diseases, many of which are also communicable. Notification of the occurrence of these
diseases can assist health authorities to monitor and control outbreaks.
In 2012, six children died as a result of a notifiable disease. The notifiable diseases included four deaths that have been
reported in this chapter. These deaths have been attributed to syphilis and HIV, and the vaccine-preventable diseases of
pertussis and meningococcal septicaemia. Two additional deaths attributed to a notifiable disease include one child who died
from haemolytic-uraemic syndrome and one child who died from influenza due to the avian influenza virus.37, 38
Table 39: Notifiable conditions by gender, 2012
Cause of death
Female
Male
Total
Pertussis
1
1
Meningococcal infection
1
1
Congenital syphilis
1
1
Human immunodeficiency virus (HIV) infection
2
2
Haemolytic Uraemic Syndrome
1
1
Avian influenza virus
1
1
Total
4
3
7
37 The current seasonal influenza vaccine does not protect humans against the avian influenza virus.
http://www.health.gov.au/internet/immunise/publishing.nsf/Content/handbook10-4-7, accessed 16 July 2013,
http://www.betterhealth.vic.gov.au/bhcv2/bhcarticles.nsf/pages/Bird_flu, accessed 16 July 2013.
38 The two deaths are captured in the data relating to ICD chapters: Diseases of the blood and blood-forming organs and certain disorders
involving the immune mechanism (D50-D89), and Diseases of the respiratory system (J00-J99).
48
NSW Child Death Review Team | Annual Report 2012
Chapter 14. Deaths of infants and Sudden
Unexpected Death in infancy (SUDI)
In 2012, the deaths of 303 infants younger than one year of age were registered in NSW. This represents the majority (61%)
of all child deaths in 2012, which is consistent with previous years. Fifty (17%) of the infant deaths were Sudden Unexpected
Death in Infancy (SUDI). This was a slight increase from the proportion of infant deaths that were SUDI in 2011 (13%), but was
not a statistically significant difference.
SUDI is not a cause of death, but a classification to enable the consideration of deaths of otherwise healthy babies who die
suddenly and unexpectedly. In some cases, a cause of death may be identified through autopsy and examination of the
circumstances of the infant’s death. For others, no clear cause can be determined and many of these deaths are classified as
Sudden Infant Death Syndrome (SIDS).
The deaths of five of the 50 infants who died suddenly and unexpectedly are also ‘reviewable’ and will be reviewed separately
by the Ombudsman.
14.1 Demographic and individual characteristics
Table 40 provides an overview of the key demographic characteristics of all infant deaths registered in 2012.
Table 40: Key demographic and individual characteristics – deaths of infants from all causes in NSW, 2012
Total
Number
Percent
Infant Mortality
Rate
95% Confidence
Interval
303
100
3.06
2.71 - 3.40
Incident
Rate Ratio
p
Gender
Female
120
40
2.50
2.05 - 2.94
-
-
Male
183
60
3.59
3.07 - 4.11
1.44
0.0009
Under 1 day
123
41
1.24
1.02 - 1.46
-
-
under 1 week
50
17
0.50
0.37 - 0.67
-
-
under 28 days
49
16
0.49
0.37 - 0.65
-
-
under 1 year
81
27
0.82
0.65 - 1.02
-
-
0
0
-
-
-
-
270
89
2.89
2.54 - 3.23
33
11
5.88
4.05 – 8.26
2.03
0
Age
1 year and over
Aboriginal and Torres Strait Islander status
Not Aboriginal or Torres Strait Islander
Aboriginal or Torres Strait Islander
Remoteness*
Major cities
200
68
2.65
2.28 - 3.02
-
-
Inner regional areas
65
22
3.76
2.90 - 4.80
-
-
Outer regional areas
21
7
3.93
2.43 - 6.01
-
-
6
2
11.98
0.10 - 0.58
-
-
Quintile 5 (highest)
69
24
3.87
3.01 - 4.90
Quintile 4
53
18
3.29
2.46 - 4.30
-
-
Quintile 3
50
17
2.53
1.88 - 3.33
-
-
Quintile 2
41
14
1.76
1.26 - 2.38
-
-
Quintile 1 (lowest)
76
26
4.25
3.35 - 5.32
-
-
Remote areas
Socioeconomic status**
*Remoteness was not calculated in 11 cases.
**Socioeconomic status was not calculated in 14 cases.
NSW Child Death Review Team | Annual Report 2012
49
14.1.1 Age, gender and Aboriginal and Torres Strait Islander status
In 2012, almost three-quarters of the infants (222; 73%) died during the neonatal period (the period from birth to less than 28
days), which is consistent with previous years. More male infant deaths (183; 60%) were registered than female infant deaths
(120; 40%). Males have been consistently overrepresented in infant deaths in NSW over the past 15 years.
Thirty-three infants (11%) were Aboriginal. The rate of Indigenous infant deaths in 2012 remained significantly higher than that
of non-Indigenous children (incident rate ratio: 2.03, p<0.001).
14.1.2 Remoteness and socioeconomic status
The majority of infants whose deaths were registered in 2012 were from major cities (200), and the numbers of deaths
decreased as remoteness increased. This is consistent with 2011.
There was no clear pattern in socioeconomic status, with large numbers in all categories in 2012 and 2011.
14.2 Trends in infant deaths
Table 41 shows that there has been a steady decline in the Infant Mortality Rate since 1998. The rate in 2012 was 1.1 per cent
lower than in 1998. The rates of both male and female infant deaths have declined, with the female rate declining slightly more
(-1.4) than the rate for males (-1.0).
The national Infant Mortality Rate has more than halved over recent decades. Across Australia in 2010, there were 1229 deaths
of infants aged less than one year – a rate of 4.1 per 1000 live births.39
Table 41: Infant deaths and mortality rates by gender 1998-2012
1998
1999
2000
2001
Female
165
(4.0)
216
(5.2)
181
(4.3)
183
(4.3)
Male
209
(4.8)
262
(6.0)
252
(5.7)
Both
374
(4.4)
478
(5.6)
433
(5.0)
2002
2003
2004
2005
2006
2007
2008
2009
2010
2011
2012
159
(3.9)
175
(4.3)
162
(4.0)
187
(4.5)
160
(3.6)
168
(3.9)
167
(3.7)
155
(3.4)
147
(3.2)
162
(3.5)
120
(2.6)
239
(5.3)
184
(4.3)
194
(4.5)
203
(4.7)
248
(5.6)
242
(5.2)
199
(4.4)
223
(4.7)
213
(4.4)
217
(4.5)
203
(4.1)
183
(3.8)
422
(4.8)
343
(4.1)
369
(4.4)
365
(4.4)
435
(5.1)
402
(4.4)
367
(4.1)
390
(4.2)
368
(3.9)
364
(3.9)
365
(3.8)
303
(3.3)
14.3 Leading causes of infant death
As shown in table 42 below, conditions arising in the perinatal period accounted for almost half (49%) of all infant deaths and
was the leading cause of death for this age group in 2012. This is consistent with previous years. Almost all (134) of the infants
who died from perinatal conditions were neonates.
The second leading cause of death for infants was congenital and chromosomal conditions (28%). Over eighty percent (69)
of the infants who died due to this cause were neonates.
For 24 infants, the cause of death had not been classified at the time of reporting. An additional 16 infant deaths were due
to causes that were undetermined or ill-defined, including SIDS. The large majority of these deaths (37) were SUDI.
39 Australian Institute of Health and Welfare 2012, A picture of Australia’s children 2012. Cat. no. PHE 167. Canberra: AIHW.
50
NSW Child Death Review Team | Annual Report 2012
Table 42: All causes of infant deaths, 2012
Type
Female
Male
Total
Crude Mortality
Rate
95% Confidence
Interval
Certain conditions arising in the perinatal period
56
91
147
1.48
1.24 - 1.72
Congenital malformations, deformations and
chromosomal abnormalities
34
50
84
0.85
0.68 - 1.05
Cause of death not classified (not finalised)
10
14
24
0.24
0.16 - 0.36
Symptoms, signs and abnormal clinical and
laboratory findings not elsewhere classified
7
9
16
0.16
0.09 - 0.26
Diseases of the nervous system
4
3
7
0.07
0.03 - 0.15
External causes of morbidity and mortality
1
5
6
0.06
0.02 - 0.13
Certain infectious and parasitic diseases
1
4
5
0.05
0.02 - 0.12
Diseases of the respiratory system
3
1
4
0.04
0.01 - 0.10
Diseases of the circulatory system
1
2
3
Endocrine, nutritional and metabolic diseases
2
1
3
Diseases of the digestive system
1
1
2
Diseases of the blood, blood-forming organs and
certain disorders involving the immune system
0
1
1
Diseases of the musculoskeletal system and
connective tissue
0
1
1
14.3.1 Leading causes of neonatal and post neonatal death
While the leading cause of death for all infants is perinatal conditions, when neonatal and post neonatal deaths are considered
separately, the leading causes differ. This is illustrated in table 43 below. The leading category of cause of death for infants
aged 28 days and older is SIDS and other unexplained causes. External causes are among the top five causes of death for
post neonatal infants, but not for neonates.
Table 43: Top 5 causes of neonatal and post neonatal deaths, 1998-2012
Deaths of neonates (birth to <28 days) N = 4084
Deaths of post neonates (28 days to 365 days) N = 1693
Certain conditions originating in the perinatal period (71.4%)
Symptoms, signs and abnormal clinical and laboratory findings,
not elsewhere classified (32.1%)
Congenital malformations, deformations and chromosomal
abnormalities (31.6%)
Congenital malformations, deformations and chromosomal
abnormalities (21.1%)
Symptoms, signs and abnormal clinical and laboratory findings,
not elsewhere classified (2.4%)
Certain conditions originating in the perinatal period (11.5%)
Endocrine, nutritional and metabolic diseases (0.8%)
Diseases of the nervous system (7.6%)
Diseases of the nervous system (0.7%)
External causes of mortality and morbidity (7.3%)
NSW Child Death Review Team | Annual Report 2012
51
Chapter 15. Sudden Unexpected Death in Infancy
15.1 Defining Sudden Unexpected Death in Infancy
As SUDI is not a standardised classification, there is variation within Australia and internationally as to how it is defined. Not all
definitions, for example, include neonates.
Most SUDI deaths are attributed to SIDS or a fatal sleep accident.40 SIDS is a category of SUDI and is a diagnosis of exclusion.
The broadly accepted national definition of SIDS is:
The sudden and unexpected death of an infant under one year of age, with onset of the lethal episode apparently
occurring during sleep, that remains unexplained after a thorough investigation including performance of a complete
autopsy, and review of the circumstances of death and clinical history.41
There are a number of sub-classifications of SIDS (see Appendix 2). Since 2009, the Team has used the following definition
of SUDI.42
“Where an infant less than one year of age dies suddenly and unexpectedly. Included in SUDI are:
• Deaths that were unexpected and unexplained at autopsy (ie those meeting the criteria for Sudden Infant
Death Syndrome).
• Deaths occurring in the course of an acute illness that was not recognised by carers and/or by health professionals
as potentially life threatening.
• Deaths arising from a pre-existing condition that had not been previously recognised by health professionals.
• Deaths resulting from accident, trauma or poisoning where the cause of death was not known at the time of death.”
Specifically excluded from this definition are infants who died unexpectedly in misadventures due to external injury where the
cause of death was known at the time of death (such as transport fatalities and accidental drowning) and deaths that occurred
in the course of a known sudden acute illness in a previously healthy infant.
Along with the decreasing trend in infant deaths overall in NSW, the rate of SUDI has declined, albeit slowly, since 1998.
However, there has been considerable variation in the numbers and rates of SUDI over the past 15 years. Table 44 shows that,
since 2003, there has been an average of 54 sudden and unexpected deaths of infants in NSW each year.
Table 44: Infant Mortality Rate of SUDI neonatal status, 1998-2012
1998
1999
2000
2001
2002
2003
2004
2005
2006
2007
2008
2009
2010
2011
2012
9
9
9
12
7
12
4
7
7
12
8
5
11
10
13
Non-neonates
49
64
63
54
54
49
47
47
51
51
45
40
42
38
37
Total
58
73
72
66
61
61
51
54
58
63
53
45
53
48
50
IMRs
0.68
0.85
0.83
0.76
0.73
0.73
0.61
0.63
0.64
0.71
0.58
0.48
0.57
0.50
0.50
Neonates
There has also been a national decline in the number and rate of infant deaths identified as SIDS. This decline coincides with
the introduction of public health campaigns aimed at reducing the incidence of SIDS. Between 1986 and 2003, the SIDS death
rate decreased by 86 per cent, but has remained comparatively stable to 2010.43 In 2011, 61 infant deaths in Australia were
attributed to SIDS.44
40 Krous H. F. 2010, Sudden unexpected death in infancy and the dilemma of defining the sudden infant death syndrome, Current Pediatric Reviews
6(1): 5-12.
41 SIDS and Kids 2004. First Australian SIDS pathology workshop: adoption of a national consensus for the definition of SIDS and autopsy approach
to unexpected infant deaths, Canberra: SIDS and Kids.
42 Prior to 2009, the Team restricted the SUDI definition to infants who had been placed for sleep. Since 2009, the team has included all sudden and
unexpected deaths. A varying number of SUDI each year occur outside of sleep.
43 Australian Institute of Health and Welfare 2012, A picture of Australia’s children 2012. Cat. no. PHE 167. Canberra: AIHW, p. 14.
44 Australian Bureau of Statistics 2013, 3303.0 - Causes of Death, Australia, 2011. Canberra: ABS.
52
NSW Child Death Review Team | Annual Report 2012
15.2 Demographic and individual characteristics
The table below provides an overview of the main demographic characteristics of the 50 infants whose sudden and
unexpected deaths were registered in 2012.
Table 45: Key demographic and individual characteristics of deaths due to SUDI, 2012
Number
Percent
Infant Mortality
Rate
95% Confidence
Interval
Incident
Rate Ratio
p
50
100
0.50
0.37 - 0.67
Female
22
44
0.46
0.29 - 0.69
-
-
Male
28
56
0.55
0.36 - 0.79
1.20
0.2578
Under 1 day
3
6
0.03
0.01 - 0.09
-
-
under 1 week
2
4
0.02
0.00 - 0.07
-
-
under 28 days
8
16
0.08
0.03 - 0.16
-
-
37
74
0.37
0.26 - 0.51
-
-
0
0
-
-
-
-
41
82
0.44
0.31 - 0.60
-
-
9
18
1.60
0.73 - 3.04
3.65
0
Major cities
27
54
0.36
0.24 - 0.52
-
-
Inner regional areas
14
28
0.81
0.44 - 1.36
-
-
Outer regional areas
5
10
0.94
0.30 - 2.18
-
-
Remote areas
3
6
-
-
-
-
Very remote areas
0
0
-
-
-
-
Quintile 5 (highest)
9
18
0.20
0.23 - 0.96
-
-
Quintile 4
5
10
0.15
0.10 - 0.72
-
-
Quintile 3
7
14
0.22
0.14 - 0.73
-
-
Quintile 2
8
16
0.20
0.15 - 0.68
-
-
20
41
0.62
0.68 - 1.73
-
-
Total
Gender
Age
under 1 year
1 year and over
Aboriginal and Torres Strait Islander status
Not Aboriginal or Torres Strait Islander
Aboriginal or Torres Strait Islander
Remoteness*
Socioeconomic status**
Quintile 1 (lowest)
*Remoteness was not calculated in one case.
**Socioeconomic status was not calculated in one case.
15.2.1 Age and gender
The 50 infants ranged in age from less than one day to just under one year. Most (32) died during the first three months of life:
•Thirteen infants died in the neonatal period (less than 28 days after birth); five of these infants were aged less than one week.
•Nineteen infants were aged 1-3 months.
•Eleven infants were aged 4-6 months.
•Seven infants were older than six months: six were aged 7-10 months, and one was aged 11 months.
NSW Child Death Review Team | Annual Report 2012
53
Over half (28) of the infants were male. This is a slightly higher number than 2011 (25); however, the number of male infant SUDI
appears to have declined slowly over the past 10 years. For the three year period 2000-2002, there was an average of 39 male
SUDI per year.
15.2.2 Aboriginal and Torres Strait Islander status and cultural background
Nine of the infants (18%) were Aboriginal.
More than one-third (19) of the infants had a parent, or both parents, who were born overseas in a country where the main
language is not English. Six families were of Middle Eastern backgrounds, five families were of Pacific Island background,
four families were of a South East Asian background and two families were of an East Asian background. One family was of a
South Asian background and one family was of a European background.
15.2.3 Remoteness and socioeconomic status
The majority (41; 82%) of SUDI in 2012 were in major cities or inner regional areas. This is a more extreme result than was seen
in 2011 when 34 infants (70%) were from these less remote, more urbanised categories, but seems to be a relatively consistent
pattern through time.
Socioeconomic status showed a less consistent pattern through time, with the majority (20) in the lowest quintile in 2012
and 2010 but not in 2011, when the majority of SUDI was in the two highest quintiles.
15.2.4 Gestational age and birth weight
Prematurity (infants born at less than 37 weeks gestation) and low birth weight (less than 2500 grams) are recognised
SIDS risk factors.45
Information on gestational age was available for 48 of the 50 infants who died suddenly and unexpectedly and whose deaths
were registered in 2012. The majority (41) were full term infants. Seven infants were born prematurely between 32 and 36 weeks
gestation. Five of the premature infants and one additional infant had low birth weight, ranging from 1592g to 2335g.
The proportion of SUDI in 2012 who were infants born prematurely (15%) is lower than in 2011 (17%) and in 2010 (40%);
however the proportion in all three years is higher than the NSW rate. Over the 10-year period to 2010, the rate of premature
birth in NSW was between 7.0 and 7.5 per cent of all births.46
15.2.5 Maternal age
Young maternal age has been found to be one of the characteristics associated with SIDS.47 Four (8%) mothers of
the infants who died suddenly and unexpectedly in 2012 were teenagers aged between 14 and 19 years. This is an overrepresentation of mothers in this age group. In NSW, 3.3 per cent of mothers who gave birth in 2011 were less than 20 years
of age.48
15.2.6 Child protection history
Consistent with 2010 and 2011, infants with a child protection history were overrepresented in SUDI in 2012. Of the 50 families,
over one-third (17) had a child protection history.
Ten infants had been the subject of a report of risk of harm or report of risk of significant harm to Community Services; most of
whom (8) were the subject of a prenatal report. A prenatal report may be made if there are concerns an unborn infant may be
at risk of significant harm after his or her birth.
One additional infant was the subject of a report to a Child Wellbeing Unit. Six infants had not been the subject of a child
protection report, but had a sibling who had been.
45 Kinney, H. C. & Thach B. T. 2009, The sudden infant death syndrome. New England Journal of Medicine 361(8): 795-805.
46 Centre for Epidemiology and Research 2012, Health Statistics New South Wales, Sydney: NSW Ministry of Health
http://www.healthstats.nsw.gov.au, accessed 16 July 2013.
47 Moon R. Y. & Fu L. 2012, Sudden Infant Death Syndrome: An Update, Pediatrics in Review 33(7): 314-320.
48 Australian Bureau of Statistics 2012, 3301.0 - Births, Australia, 2011. Canberra: ABS.
54
NSW Child Death Review Team | Annual Report 2012
The nature of the reported concerns for the infants and/or their siblings included:
• exposure to domestic violence (11 families)
• inadequate shelter, homelessness or overcrowding (9 families)
• parent/carer mental health and emotional state (7 families), and
• parent/carer drug and alcohol use (7 families).
Eleven families had two or more risk factors present.
Sixteen of the 17 infants who had a child protection history were in unsafe sleep environments when they died. This includes
14 infants who were sharing a sleep surface with one or more family members and two infants who were sleeping alone in
non-infant specific sleep environments. Of the 14 infants who were sharing a sleep surface, three infants were with a parent
who had consumed alcohol and one infant was with a parent who was prescribed methadone.49
15.3 Cause of death
The SUDI category consists of deaths where a cause is found after investigation (‘explained’ SUDI) and those where the cause
remains unidentified after all possible investigations are completed (‘unexplained’ SUDI).
Explained SUDI includes deaths associated with unrecognised infection, cardiovascular anomalies, accidents, unsafe
sleep environments such as unsafe cots and bedding, rare metabolic diseases, and deaths due to non-accidental injury.50
Unexplained SUDI includes deaths that are classified as SIDS and other ill-defined or undetermined causes.
Around three-quarters of SUDI in NSW remain unexplained after autopsy and comprehensive investigation. Table 46 shows
that this has consistently been the case since 1998, with no substantial change in the proportion of explained SUDI.
At the time of writing, information regarding cause of death was available for 29 of the 50 infants (58%) who died suddenly and
unexpectedly in 2012.
Table 46: Number and rate of explained and unexplained SUDI, 1998-2012
1998 1999 2000 2001 2002 2003 2004 2005 2006 2007 2008 2009 2010 2011 2012
Total
(%)
Explained
11
10
19
20
9
15
17
11
14
15
13
9
22
13
13
211
(24)
Unexplained
47
63
53
46
52
46
34
43
44
48
40
36
30
27
16
623
(72)
Not finalised
0
0
0
0
0
0
0
0
0
0
0
0
2
8
21
33
(4)
58
73
72
66
61
61
51
54
58
63
53
45
54
48
50
867
(100)
Total
15.3.1 Explained SUDI
The cause of death for 13 infants who died suddenly and unexpectedly in 2012 was identified after a comprehensive autopsy
and examination of the circumstances of the death. Table 47 below shows that the majority of explained SUDI in NSW over the
past 15 years was due to diseases and morbid conditions that were not recognised as life threatening prior to death.
49 Methadone is a synthetic opioid used in the treatment of people dependent on heroin and other opioids.
Australian Drug Foundation, Methadone Facts, Melbourne.
http://www.druginfo.adf.org.au/drug-facts/methadone, accessed 16 July 2013.
50 NSW Child Death Review Team 2005, Sudden Unexpected Deaths in Infancy: the New South Wales experience, Sydney: Commission for Children
and Young People, p. 7.
NSW Child Death Review Team | Annual Report 2012
55
Table 47: Total number of explained causes of SUDI, 1998-2012
Cause of death
Number
Percent
Diseases of the respiratory system
44
21
Congenital chromosomal conditions
33
16
Other diseases and morbid conditions
61
29
138
65
37
18
Diseases and morbid conditions
Subtotal:
Accidental threats to breathing
Accidental suffocation and strangulation
Other accidental threats to breathing
12
6
Subtotal:
49
23
18
9
Other external causes
Assault
Other injury, poisoning or external cause
Subtotal:
Total
6
3
24
11
205
100.0
Diseases and morbid conditions
Consistent with previous years, the majority (9) of explained SUDI in 2012 were due to diseases and morbid conditions, including:
• cardiac conditions (5)
• respiratory infections (2)
• acute chorioamnionitis, and
• congenital diaphragmatic hernia.
Eight of the nine infants had been examined by a medical professional in the two weeks before their death; none had been
identified as having a life threatening condition. Of the eight infants:
• four had been examined due to minor illness (2) or for a routine health check (2)
• two infants who died as a result of congenital heart malformations had previously identified heart murmurs that were
pending further investigation, and
• two infants aged less than one week were still in hospital following their birth.
Two-thirds (6) of the infants who died as a result of diseases and morbid conditions were neonates.
External causes
The cause of death for four infants was accidental threats to breathing. As shown in table 47, this is the most common external
cause of explained SUDI in NSW over the past 15 years.
Three of the four infants died while sharing a sleep surface with a parent and/or sibling. One infant had been placed to sleep in
a portable travel cot and was found in the prone (face down) position.
15.3.2 Unexplained SUDI
The cause of death of 16 infants who died suddenly and unexpectedly in 2012 remained unexplained after a comprehensive
autopsy and examination of the circumstances of the death. Four of the infants were aged less than 28 days.
The cause of death of the 16 infants has been classified as:
• other ill-defined and unspecified causes of mortality (10)
• consistent with Sudden Infant Death Syndrome (5), and
• unattended death.
Table 48 shows the classification of unexplained SUDI since 1998. There has been a slight increase in the number of deaths
classified as other ill-defined cause. The table does not include the 31 matters that were not yet finalised at the time of writing
this report.51
51 As indicated in table 46, the ‘not finalised’ matters include two deaths from 2010, eight from 2011, and 21 in 2012.
56
NSW Child Death Review Team | Annual Report 2012
Table 48: Unexplained SUDI by year, 1998-2012
1998 1999 2000 2001 2002 2003 2004 2005 2006 2007 2008 2009 2010 2011 2012
Total
36
52
44
31
39
23
15
17
0
1
7
5
12
17
5
304
SIDS Unclassified
1
1
0
0
0
1
0
1
8
5
2
0
0
1
0
20
SIDS Category II
0
0
0
0
0
3
6
13
21
22
18
18
6
4
0
111
SIDS Category IB
0
0
0
0
0
0
0
2
4
9
3
2
0
0
0
20
SIDS Category IA
0
0
0
0
0
0
0
6
4
3
3
4
1
0
0
21
Other ill-defined and
unspecified causes of
mortality
0
2
1
8
2
1
2
1
0
4
5
4
9
5
10
54
Death occurring less
than 24 hrs from onset
of symptoms, not
otherwise explained
10
8
8
7
11
18
8
3
7
3
1
3
1
0
0
88
Other
0
0
0
0
0
0
3
0
0
1
1
0
0
0
1
6
Total
47
63
53
46
52
46
34
43
44
48
40
36
29
27
16
624
SIDS
15.4 Circumstances of death
15.4.1 Seasonal factors
For deaths registered in 2012, SUDI occurred throughout the calendar year. This distribution varies from deaths in previous
years, when SUDI was most common in the winter months of June, July and August.
Table 49: SUDI categorised by month, 2012
Month
No. of SUDI
JAN
FEB
MAR
APR
MAY
JUN
JUL
AUG
SEPT
OCT
NOV
DEC
5
4
5
1
8
4
5
4
4
4
2
4
15.4.2 Where the incident occurred
Almost three-quarters (36) of SUDI occurred in the infant’s usual home, which is consistent with previous years.
For 13 infants, the incident leading to death occurred in other places, including:
• the home of a relative or friend while the infant’s family was visiting (5)
• in hospital (4)
• while travelling in a car (3), and
• a motel.
For one infant, the place of the incident leading to death is unknown.
15.4.3 Carer at the time of the incident
The vast majority of infants (45) were being cared for by their mother and/or father in the period immediately preceding their
death, including three infants who were in hospital.
Grandparents were caring for three infants and one infant was being cared for by hospital staff. The carer of one infant whose
death was unattended is unknown.
15.4.4 Recent infant illness
The Team continues to monitor SUDI to identify recent illness and medication use.
In 2012, 15 infants (30%) who died suddenly and unexpectedly had displayed signs of an illness in the two weeks prior to their
death. Three of the infants were neonates.
NSW Child Death Review Team | Annual Report 2012
57
The infants displayed symptoms of upper respiratory tract infections (9), difficulties breathing (2), or generalised symptoms of
being unwell, such as diarrhoea, recurrent fevers and coughing (4).
Ten of the 15 infants saw a medical practitioner in relation to their symptoms in the two weeks prior to their death. Two other
infants who had been unwell were seen by medical practitioners for a routine health check in the two weeks prior to their death.
Eleven of the 15 infants had been treated in the two weeks prior to their death with prescribed or over-the-counter medications,
including paracetamol (6), ibuprofen (1), antibiotics (1) colic medication (1) cough medication (1) and complementary herbal
medication (1). Another infant was hospitalised at the time of their death and was being treated with a range of medications.
15.4.5 Other infant illness
One infant had a developmental delay with accompanying clinical symptoms that were the subject of extensive investigations
prior to the infant’s death. One infant had been diagnosed with an inguinal hernia and another infant was diagnosed with
neonatal abstinence syndrome at birth.
15.4.6 Hospital deaths
Four infants died in hospital. All were neonates. Three of the infants were still in hospital following their birth and one infant had
been admitted to hospital due to symptoms of an illness.
One of the four infants was bed sharing with their mother on a hospital ward at the time of the incident. The infant had been
taken to bed for the purpose of breastfeeding and settling and the infant’s mother subsequently fell asleep.
All four deaths were the subject of a Root Cause Analysis (RCA) by the health service.52 The RCA in each case identified
causes or contributing factors to the death and identified opportunities for systemic improvements at the Local Health District
level. Broadly, recommendations from the RCAs related to the need for neonatal and maternity policy updates, practice
development and staff education on maternity policies; and improved communication and handover of maternity, obstetric
and paediatric patients between clinicians.
15.4.7 Toxicology
At the time of reporting, post mortem toxicology results were available for 32 infants. For 28 of the 32 infants, toxicology results
did not detect any drugs (excluding drugs used for resuscitation).
For two infants, paracetamol was detected. For an additional infant both paracetamol and ibuprofen were detected. One infant
had metoclopramide detected in their toxicology, an antiemetic drug (to prevent nausea and vomiting) that was prescribed to
the infant’s mother.
15.5 Modifiable risk factors associated with SUDI
In NSW, modifiable risk factors remain evident in a large proportion of SUDI. There is evidence to suggest that over 90 per cent
of sudden and unexpected deaths in infancy are associated with preventable risk factors.53
Modifiable risk factors for SUDI include exposure to tobacco smoke; infants sharing a sleep surface with another person,
particularly when additional risk factors such as exposure to tobacco smoke or carer alcohol or other drug use are also
present; not placing infants on their back to sleep; loose bedding or other items that can cover the infant’s face or head; and
sleeping infants in bedding that is not infant-specific.
Information on modifiable risk factors present in the infant’s environment is obtained by reviewing police, health and coronial
records in relation to all SUDI. Police attending the death scene complete a narrative and standardised SUDI checklist
concerning the circumstances of the infant’s death. Hospital medical and social work staff gather SUDI medical history
through interviews with the infant’s parents/carers.
In 2012, more than three-quarters (39) of the 50 infants who died suddenly and unexpectedly had at least one modifiable risk
factor present in their environment. Almost all of these infants (37) died while they were in a sleep environment and the majority
(22) had three or more risk factors present. Only three infants who died in a sleep environment were placed to sleep alone in
fixed infant specific bedding; either a bassinette (2) or a cot.
52 A Root Cause Analysis is a process used to review and analyse an incident seeking to identify as far as possible all contributing factors leading
to the incident and to identify corrective steps to minimise risk of recurrence. Mental Health and Drug & Alcohol Office 2013, Clinical risk
management, Sydney: NSW Health, http://www0.health.nsw.gov.au/mhdao/clinical_risk_management.asp, accessed 16 July 2013.
53 Mitchell E. A. Freemantle J. Young J. & Byard R. W. 2012, Scientific consensus forum to review the evidence underpinning the recommendations of
the Australian SIDS and Kids Safe Sleeping Health Promotion Programme – October 2010. Journal of Paediatrics and Child Health, 48: 626-633.
58
NSW Child Death Review Team | Annual Report 2012
Table 50: Presence and frequency of modifiable risk factors for SUDI in a sleep environment, 2012
Cause of
death
Non infant specific
sleep environment:
Shared sleep
surface
Other
non infant
specific sleep
environment
Shared sleep
surface with person
alcohol and/or
drug affected
Infant not
placed to
sleep on
their back
Loose
bedding
Exposure
to tobacco
smoke
Total
ü
ü
ü
4
ü
ü
1
Explained:
External
2*
Explained:
External
ü
ü
3
Explained:
Natural
ü
ü
ü
ü
4
4
Explained:
Natural
ü
ü
ü
ü
4
5
Unexplained
ü
ü
ü
ü
4
6
Unexplained
ü
ü
ü
4
7
Not finalised
ü
ü
ü
4
ü
ü
ü
4
8*
Not finalised
ü
ü
ü
ü
4
9*
Not finalised
ü
ü
ü
ü
4
10*
Not finalised
ü
ü
Missing
ü
4
11
Explained:
External
ü
ü
3
ü
ü
3
12
Unexplained
13
Unexplained
ü
ü
ü
ü
ü
3
ü
14
Unexplained
ü
ü
ü
3
15
Not finalised
ü
ü
ü
3
16
Not finalised
ü
ü
ü
3
17
Not finalised
ü
ü
ü
3
3
18
Not finalised
ü
ü
19
Not finalised
ü
ü
20
Not finalised
ü
21
Not finalised
ü
22
23
Not finalised
Explained:
External
ü
ü
ü
ü
Missing
ü
24
Explained:
Natural
Missing
ü
25
Unexplained
26
Unexplained
27
Unexplained
28*
Unexplained
ü
29
Unexplained
ü
30
Unexplained
ü
ü
ü
ü
ü
31
Not finalised
Not finalised
33*
Not finalised
34
Not finalised
ü
35
Not finalised
ü
36
Not finalised
37
Unexplained
ü
3
ü
3
3
ü
ü
ü
Missing
2
ü
Missing
2
ü
2
ü
2
2
ü
2
ü
2
ü
2
ü
ü
ü
2
1
ü
9
2
2
ü
25
2
ü
ü
ü
3
2
2
ü
ü
ü
32
Total
ü
6
15
27
23
*Six infants were brought to bed for feeding and settling purposes and the mother unintentionally fell asleep. For the purpose of this table,
these infants have been included as ‘not placed to sleep on their back’.
NSW Child Death Review Team | Annual Report 2012
59
15.5.1 Shared sleep surfaces
Half (25) of the infants who died suddenly and unexpectedly in 2012 were sharing a sleep surface when they died.54
In most cases (22), the shared sleep surface was an adult mattress or bed:
• twelve infants were sharing a sleep surface with one person, either a parent (11) or sibling (1), and
• ten infants were sharing a sleep surface with two or more people, either two adults (5) or adults and children (5).
Five of the infants were sharing a sleep surface with an adult who had consumed either alcohol or other drugs. An additional
infant was co-sleeping with an adult prescribed methadone. Carers who consume drugs, alcohol or sedating medication prior
to sharing a sleep surface with a child can create hazardous sleep environments that increase the risk of sudden infant deaths
and fatal sleep accidents.55
Records show that in 16 cases, the adult(s) intended to sleep with the infant; and in six cases the mother brought the infant to
bed for the purpose of feeding or settling the infant, and unintentionally fell asleep.
Three of the 25 infants were sharing a cot with their twin (2) or triplets (1) when they died. The practice of placing twins to sleep
together is referred to as ‘co-bedding’.56 Current evidence indicates that the safest way to sleep twins at home is to place each
twin separately in their own cot.57 In the event that this is not possible, and in order to minimise the risks for twins sharing the
same cot, it is recommended to:
• place the babies head to head, at opposite ends of the cot
• not use bedding – safe alternatives include wrapping babies in accordance with SIDS and Kids guidelines and sleeping
infants in separate safe infant sleeping bags (for babies weighing 3.2kg and over)
• sleep the twins in separate, safe infant sleeping bags (for babies weighing 3.2kg and over), and
• place them in separate cots once they have reached an age that they can freely move around the cot.58
The Team has been collecting information on modifiable risk factors for SUDI since 2003. The sharing of sleep surfaces has
been a consistently identified factor. Table 51 shows that just under half (44%) of SUDI since 2003 were infants who were
sharing a sleep surface with another person or persons.
Table 51: SUDI and shared sleep surface, 2003-2012*
2003
2004
2005
2006
2007
2008
2009
2010
2011
2012
Total (%)
No
31
25
24
24
37
23
23
27
24
12
250 (52)
Yes
20
20
18
27
25
16
16
20
22
25
209 (44)
0
0
0
0
0
0
0
6
2
13**
21 (4)
51
45
42
51
62
39
39
51
48
50
480 (100)
Shared sleep surface
Other/not known
Total
* Information in this table prior to 2010 is drawn from previously published Team data.
** These 13 infants were not placed in a sleep environment when the incident occurred.
15.5.2 Inappropriate sleep surfaces and loose bedding
Placing infants to sleep on surfaces that are not infant-specific, even when the infant is sleeping alone, is also a factor in SUDI.
In 2012, nine infants were placed to sleep on surfaces that were not infant-specific. This included adult beds or mattresses (6),
and portable bedding such as portable cots (2) and a baby capsule (1).
Police recorded that loose bedding was present in the sleep environment of 27 infants.
54 ‘Sharing a sleep surface’ includes a person sharing a bed or other surface with an infant with the intention of co-sleeping; bed-sharing for the
purpose of feeding or settling the infant where either the adult or the infant has fallen asleep; and persons sleeping with infants on lounges or
sofas, whether the person intended to sleep with the infant or accidently fell asleep.
55 SIDS and Kids. National Scientific Advisory Group (NSAG). 2007 Information Statement: Sleeping with a baby. Melbourne: National SIDS Council
of Australia.
56 SIDS and Kids. National Scientific Advisory Group (NSAG). 2010. Information Statement: Co-bedding twins. Melbourne: National SIDS Council
of Australia.
57 Ibid.
58 Ibid.
60
NSW Child Death Review Team | Annual Report 2012
Sixteen infants had multiple loose objects present in their sleeping environment. These included more than one pillow, blanket,
or other items, such as toys. Five infants had adult pillows in their sleep environment. Five infants were sleeping with a loose
blanket or doona/quilt and one infant was sleeping with a baby pillow.
15.5.3 Sleep position
The majority (22) of the 37 infants who were in a sleep environment when they died were reportedly placed for sleep on their
back. Over two-thirds (15) of these infants were found on their back, four were found on their front, two were found on their side
and for one infant, this information was not available.
Eight infants were placed to sleep on their side. Of these eight infants, half were found on their front, three on their side and for
one infant, this information was not available.
One infant was placed to sleep on their front.
Six infants were brought into their mother’s bed for feeding and/or settling. For all six infants, it is uncertain from the available
records how the infant was placed. Three of the infants were found on their back and three were found at the mother’s breast.
As table 52 shows, between 2003 and 2012, just under one-third of SUDI were infants not placed for sleep on their back. In
2012 the proportion was slightly lower than average (30%).
Table 52: SUDI and position placed to sleep 2003-2011*
2003
2004
2005
2006
2007
2008
2009
2010
2011
2012
Total (%)
On back
23
28
24
36
33
25
22
28
22
22
263 (55)
On side
15
9
7
8
14
7
10
14
8
8
100 (21)
On front
5
1
1
4
5
2
3
2
3
1
27 (5)
At breast
0
0
0
1
0
0
1
0
1
0
3 (1)
Information not available
8
7
10
2
10
5
3
4
9
6**
64 (13)
Infant not in a sleep
environment
0
0
0
0
0
0
0
5
5
13
23 (5)
51
45
42
51
62
39
39
53
48
50
480 (100)
Position placed to sleep
Total
*Information in this table prior to 2010 is drawn from previously published Team data.
** Six infants were brought into their mother’s bed for feeding and/or settling. For all six infants, it is uncertain from the available records how
the infant was placed.
15.5.4 Infants not in a sleep environment
Thirteen of the 50 infants who died suddenly and unexpectedly in 2012 were not in a sleep environment when they died.
This is more than three times the number of infants who died while not in a sleep environment in 2010 (3) and 2011 (4). The
circumstances for the 13 infants prior to the incident included the following:
• five infants were being fed or had just finished feeding
• two infants were being held by a parent or carer
• two infants were travelling in cars and placed in an infant restraint
• two infants had developed problems within hours of their birth and were in hospital under medical observation, and
• the circumstances of death are uncertain for two infants who died following unattended births.
Records show that seven of the infants were awake when the incident leading to their death occurred. Some were observed
by their carers to choke, some appeared to have trouble breathing, and some appeared to change colour or simply
became unresponsive.
The cause of death for six of the 13 infants was ascertained after investigation. All were found to have died due to a disease or
morbid condition that had not been detected prior to their death. The cause of death could not be found for four infants; and
investigations are not finalised for another three infants.
NSW Child Death Review Team | Annual Report 2012
61
15.5.5 Exposure to tobacco smoke
Exposure to tobacco smoke continues to be a consistent factor in SUDI deaths. Half (25) of the infants who died suddenly
and unexpectedly in 2012 were exposed to tobacco smoke, during and/or after pregnancy.59 Smoking is one of the most
important modifiable risk factors in reducing the risks of sudden infant death with international agreement that the evidence
demonstrates a causal association.60
Table 53 shows a slight decrease from 2011 in the proportion of infants exposed to tobacco smoke. Since 2003, where
information is available, more than half of all SUDI were infants who had been exposed to tobacco smoke.
Table 53: SUDI and exposure to tobacco smoke 2003-2012
Exposure to tobacco
smoke
2003
2004
2005
2006
2007
2008
2009
2010
2011
2012
Total (%)
No
4
7
10
7
12
14
14
17
15
24
124 (23)
Yes
32
32
26
39
38
27
25
29
31
25
304 (57)
Information not available
25
12
16
12
13
12
6
7
2
1
108 (20)
Total
61
51
54
58
63
53
45
53
48
50
536 (100)
15.6 Protective factors
15.6.1 Breastfeeding
Research has shown that breastfeeding reduces the risk of SIDS.61
Information on breastfeeding was available for 48 of the 50 infants who died suddenly and unexpectedly in 2012. More than
half (28) of the infants were being breastfed.62 Two of the infants were breastfed after their mother had consumed alcohol.
Eighteen infants were being formula fed, including seven infants who had been exclusively formula fed from birth.
Two infants died in hospital shortly after their birth and prior to feeding.
15.6.2 Room sharing
Room sharing – the practice of sleeping an infant in a safe cot next to the parents’ bed – has been found to reduce the risk of
sudden unexpected infant death.
The National SIDS Council of Australia has reported that ‘[s]everal studies have shown that when a committed caregiver sleeps
in the same room, but not the same bed with their baby, the chance of the baby dying from Sudden Infant Death Syndrome
(SIDS) is reduced by 50 per cent when compared to babies sleeping in a separate bedroom (solitary sleeping)’.63
This year, the Team examined available records for information on room sharing. While information on room sharing is not
routinely collected by police or health, information about the location of an infant’s cot or bassinette was available for seven of
the eight infants who were placed for sleep in an infant-specific sleep environment.
Four of the seven infants were placed for sleep in their parents’ bedroom. In each case, modifiable risk factors for SUDI were
also present in the infant’s sleep environment, including loose bedding (2), the use of a portable cot (1), and sharing a cot
with a twin (1).
59 The team has used a definition that includes family members who smoke both inside and outside the family home. Research has shown that
cotinine (a metabolite of nicotine) levels in the hair of children of smokers were similar whether the parent smoked inside or outside. SIDS and
Kids 2009, Information Statement: Smoking, Melbourne: National SIDS Council of Australia.
http://www.sidsandkids.org/wp-content/uploads/Smoking-2009_Cit-sugg1.pdf, accessed 16 July 2013.
60 Queensland Health 2008 Safe infant care to reduce the risk of Sudden Unexpected Deaths in Infancy: Policy statement and Guidelines.
Brisbane: Queensland Health. www.health.qld.gov.au/ph/documents/childhealth/29567.pdf, accessed 16 July 2013.
61 SIDS and Kids. National Scientific Advisory Group (NSAG) 2012, Information Statement: Breastfeeding. Melbourne: National SIDS Council
of Australia.
62 The NSW Health Breastfeeding in NSW: Promotion, Protection and Support policy directive reports information from 2007-08 that indicates
that, while 91.1% of children aged 0-23 months across NSW were breastfed at birth, the rate decreases for each month of age. The rate of
breastfeeding at six months was 54.8%, while the rate at 12 months was 28.3%.
63 SIDS and Kids. National Scientific Advisory Group (NSAG) 2008, Information Statement: Room sharing with a baby. Melbourne: National SIDS
Council of Australia.
62
NSW Child Death Review Team | Annual Report 2012
15.7 Prevention measures
In Australia and internationally, education campaigns have played a significant role in reducing the number of deaths that are
attributed to SIDS. Despite this reduction, the leading category of infant death in the post neonatal period (between 28 and
365 days after birth) remains SIDS and other unexplained causes.
SIDS and Kids promotes six key messages to reduce the risk of sudden unexpected death in infancy, including SIDS and fatal
sleep accidents:64
• sleep baby on the back from birth, not on the tummy or side
• sleep baby with head and face uncovered
• keep baby smoke free before birth and after
• provide a safe sleeping environment day and night
• sleep baby in their own safe sleeping place in the same room as an adult caregiver for the first six to 12 months, and
• breastfeed baby.
In December 2012, the NSW Ministry of Health issued the second edition of Having a Baby, which contains clear messages
about the important steps that parents and carers can take to reduce the risk of SUDI. The publication aligns with the key
messages from SIDS and Kids and NSW Health policy and emphasises that the safest place to sleep babies in the first six to
12 months is in their own cot next to the carers’ bed.
15.8 The Team’s recommendations
15.8.1 A comprehensive response to SUDI
In 2005, the Team recommended that the NSW Government adopt a multi-agency integrated system of response to SUDI. In
response, Health issued a policy directive, Death – Management of Sudden Unexpected Deaths in Infancy (2008), aimed at
delivering a coordinated response to SUDI by health professionals, police, ambulance, forensic pathologists and coroners.
The policy has two main aspects: the diagnosis of the cause of the infant’s death and the support of the surviving family
members. An important component is the requirement for health staff to take a comprehensive medical history to assist the
forensic pathologist to establish, as far as possible, the cause of death.
Since the policy has been in place, the Team has examined post-death records for infants who died suddenly and
unexpectedly to determine whether key aspects have been implemented. Overall compliance with the policy has been found
to be low, particularly in relation to the requirements to interview parents and take a medical history, to provide follow-up care
to the family, and to provide information to the Department of Forensic Medicine.
For SUDI in 2012, the Team looked at whether the infant was transported to hospital following the incident, whether an
interview was completed with the family to obtain the infant’s medical history, and whether the family was provided with
psychosocial support. While there was a small improvement on previous years, the results indicate that compliance in key
areas remains relatively low:
• Thirty-five infants were transferred to a NSW hospital via ambulance as required (83% compliance).65
• Health staff conducted interviews with parents/carers and recorded the medical history for just over half (20) of the infants
transported to hospital by ambulance (57% compliance), and for one additional infant who was in hospital when the incident
occurred. While there was a slight increase in the number of interviews conducted in 2012 compared to 2011 (17 families;
43%), the details obtained from some families were limited.
• There was evidence that psychosocial support was provided to the families of 28 infants (80% compliance).
• Seven infants were transported directly from their place of death to the morgue by state contractors. Under these
circumstances, there was no opportunity for hospital staff to gather a medical history to inform the post-mortem
assessment or to provide psychological support to the family.
64 SIDS and Kids. National Scientific Advisory Group (NSAG) 2007, Information Statement: Sleeping with a baby. Melbourne: National SIDS Council
of Australia.
65 This calculation excludes infants who were in hospital when they died (4) or were taken directly to hospital by a caregiver (3) or died in unknown
circumstances.
NSW Child Death Review Team | Annual Report 2012
63
A thorough and complete investigation of the circumstances surrounding SUDI is critical to establishing, wherever possible,
the cause of death. The low compliance with the policy directive for delivering a multi-agency response to SUDI is one
impediment to this. The Team has previously identified issues with the consistency of the response which could be improved
through a more centralised response, potentially through a small expert team. In 2012, the Ministry of Health advised that the
NSW Sudden Infant Death Advisory Committee would be the appropriate body to consider this suggestion.
In last year’s report, the Team recommended that the Ministry of Health should review the purpose, terms of reference and
membership of the Sudden Infant Death Advisory Committee. The Team recommended that the scope of the review should
include consideration of the Committee’s role in advising on the potential for NSW to adopt a multi-disciplinary case review
approach to the SUDI investigation process, and the potential for a more centralised response to SUDI.
In September 2013, NSW Kids and Families advised that the review of the Committee had been completed. The agency
indicated that it would progress implementation of the review recommendations, including reviewing the Health policy directive
Death – Management of Sudden Unexpected Death in Infancy, and the service model underpinning the policy.
NSW Kids and Families also advised that file audits to assess compliance with the policy directive Death – Management of
Sudden Unexpected Death in Infancy had been delayed, but had now recommenced.
15.8.2 Post mortem examinations following unexpected deaths of infants
The Health policy, Death – Management of Sudden Unexpected Deaths in Infancy, indicates that, because the cause of
death can be difficult to establish, it is very important that the post mortem examination be done by a pathologist with
extensive experience in infant post mortems at a centre with appropriate facilities for special tests. All post mortems following
unexpected deaths of infants are currently required to be carried out at the Department of Forensic Medicine.
In 2011, the Convenor and Ombudsman wrote to the Minister for Health outlining his and the Team’s concerns in regard to
forensic pathology delays at the Department of Forensic Medicine, particularly in paediatric cases. In December 2011, the
Minister advised that the Ministry of Health was reviewing the concerns and considering a number of strategies, including:
• the possibility of a paediatric pathology registrar to support training in paediatric forensic pathology and possibly help to
free up the staff specialist in paediatric pathology at the Children’s Hospital to assist with more cases, and
• negotiating with the existing paediatric pathologist around an honorary appointment with the Department of Forensic Medicine.
In August 2012, the Ministry of Health advised that the South Eastern Area Laboratory Services was proceeding to appoint
a new paediatric anatomical pathology registrar training position, funded by Health. The Ministry noted that the appointment
would assist with workload management and future workforce shortages.
The Team continues to have concerns about the post mortem examinations of infants who have died suddenly and
unexpectedly. In this regard, the Team notes that, at the time of writing this report, information regarding cause of death was
outstanding for just under half of the infants who died suddenly and unexpectedly in 2012, and 10 infants who died in 20102011. The Team also notes that around three-quarters of SUDI remain unexplained after autopsy and investigation, and there
has been no substantial change in the proportion of explained SUDI since at least 1998.
15.8.3 Safe sleeping on maternity wards
In 2010, the Team recommended that the Ministry of Health should assess compliance with the Babies Safe Sleeping in NSW
Health Maternity Facilities policy. As a result of the subsequent audit findings, the audit team recommended the development
of a state-wide education strategy. The Ministry advised in 2012 that an education strategy would be developed following
release of the revised policy and that the policy and its key messages would be promoted at a state-wide level through forums
such as the Clinical Midwifery Consultants meeting.
The revised policy, Maternity – Safer Sleeping Practices for Babies in NSW Public Health Organisations, was published in
November 2012. The policy provides direction to staff on how to reduce the risk of SIDS and SUDI in settings where mothers
and babies are accommodated together, and provides consistent, evidence-based information to caregivers on safe infant
sleep practices. It directs all staff to follow safe sleeping practices, to advise all mothers that sleeping with their babies is
strongly discouraged, and to remind all new mothers, parents and caregivers that babies should be returned to their own safe
cot after feeding and settling.66
66 NSW Ministry of Health 2012, Maternity - Safer Sleeping Practices for Babies in NSW Public Health Organisations. Document No. PD2012_062.
Sydney: NSW Health http://www0.health.nsw.gov.au/policies/pd/2012/PD2012_062.html, accessed 16 July 2013.
64
NSW Child Death Review Team | Annual Report 2012
The policy requires Local Health Districts to conduct an annual audit of safer sleeping practices to ensure compliance with
the policy, and indicates that relevant health professionals are responsible for maintaining their clinical skills and knowledge of
evidence-based parenting advice on safer infant sleeping best practice.
Last year, the Team recommended that, as part of the review of the NSW Sudden Infant Death Advisory Committee, the
Ministry of Health should consider the Committee’s role in promoting safe sleep practices in maternity facilities, including
educational strategies for midwives and maternity staff. In September 2013, NSW Kids and Families advised that the review
of the Committee had been completed, and it was considered that, while the role of the Committee would include providing
advice on key messages, it would not play a direct role in promoting safe sleeping practices to health service staff.
NSW Kids and Families advised the Team that it is promoting SIDS and Kids prevention resources to Local Health Districts to
be used in implementing the policy, and is consulting with both SIDS and Kids and Community Services about the available
education resources and online packages for staff.
15.8.4 Public education – the importance of clear safe sleeping messages
In last year’s report, the Team noted the findings from a Victorian Coronial inquiry into the deaths of four infants who died
while they were sharing a sleep surface. The Coroner concluded that sharing a sleep surface was inherently dangerous, and
observed that the various terms used to define shared sleep surfaces – including co-sleeping, room-sharing and bed-sharing
– are confusing and could potentially impact on caregivers’ uptake of safe sleeping advice.
Noting the importance of considering this issue in the NSW context, where almost half (44%) of SUDI since 2003 have been
infants who were sharing a sleep surface, the Team recommended that the Ministry of Health should consider the role of the
NSW Sudden Infant Death Advisory Committee in providing a point of co-ordination for public education strategies using
best-evidence educational methods, including targeted strategies to high-risk groups. NSW Kids and Families has since
advised that the review of the Committee identified that, while the role of the Committee would include providing advice on
key messages, it would not coordinate public education strategies. The Committee considered that this was a major role for
groups such as SIDS and Kids.
15.8.5 Reducing risk for children with a child protection history
Noting that almost half of all SUDI in 2011 and 2010 were from families with a child protection history, last year the Team
recommended that Child Deaths and Critical Reports (Community Services) should conduct a cohort review of SUDI where
the infant’s family had a child protection history, for the purpose of developing targeted strategies and training resources to
assist caseworkers to assess risk for infants and provide casework services to at-risk families.
Community Services accepted the recommendation, and in May 2013 advised the Team that work on the review was
progressing. At that time, the agency had completed a survey of current staff knowledge, finalised data for the sample group,
and undertaken a review of relevant literature. The agency had also met with staff from NSW Kids and Families to discuss
opportunities to strengthen the interagency response to SUDI.
Community Services gave support for the Team’s recommendation that the NSW Ministry of Health should review the
membership of the NSW Sudden Infant Death Advisory Committee, and advised that it would welcome an invitation to
participate on the Committee. NSW Kids and Families has advised that, following a review of the Committee, revised
membership would include nominees from agencies involved in SUDI, including the Department of Family and
Community Services.
NSW Child Death Review Team | Annual Report 2012
65
Recommendations
NSW Kids and Families
1. In relation to NSW Kids and Families’ file audits to assess compliance with the Death – Management of Sudden
Unexpected Death in Infancy policy directive, the agency should provide detailed advice to the Team on:
(a) the scope and method of the audits
(b) the findings of the audits, and
(c) any action NSW Kids and Families intends to take in response to the findings.
2. In relation to the review of the Death – Management of Sudden Unexpected Death in Infancy policy directive
and model of response to SUDI, NSW Kids and Families should:
(a) provide advice to the Team on the terms of reference and timeframes of the review, and
(b)include consideration of the potential for NSW to adopt a multi-disciplinary case review approach to the
SUDI investigation process, and the potential for a more centralised response to SUDI.
3. In relation to the promotion of safe sleeping practices, NSW Kids and Families should provide detailed advice
to the Team on:
(a)the outcome of the audits conducted by Local Health Districts to assess compliance with the Maternity –
Safer Sleeping Practices for Babies in NSW Public Health Organisations policy directive. The advice should
include Kids and Families’ assessment of:
(i)the adequacy of the audits, including the scope and method (such as the use of spot-checks)
(ii) the findings of the audits regarding compliance with the policy requirements, and
(iii) whether there are any systemic issues arising from the audits and, if so, the actions NSW Kids and
Families will take in response.
(b)the outcome of NSW Kids and Families’ consultation with SIDS and Kids and Community Services
regarding the available education resources and online packages for staff.
Ministry of Health
4. In relation to post mortem examinations following unexpected deaths of infants, the Ministry of Health should
provide advice to the Team on current or planned initiatives to:
(a) reduce forensic pathology delays, and
(b) increase the proportion of SUDI that are explained.
Department of Family and Community Services, Community Services
5. In relation to Community Services’ cohort review of SUDI where the infant’s family had a child protection
history, the agency should provide detailed advice to the Team on:
(a) the findings of the review,
(b)the strategies and training resources that Community Services will develop to assist caseworkers to assess
risk for infants and provide casework services and targeted education to at-risk families, and
(c) how the agency will audit or otherwise measure practice and related outcomes.
66
NSW Child Death Review Team | Annual Report 2012
Chapter 16. Deaths from all external causes
In 2012, 83 children (18%) whose deaths were registered in NSW died from external (unnatural) causes. Three-quarters (63)
of these deaths were due to unintentional or accidental causes, mainly related to transport fatalities (39) and drowning (11).
The deaths of 20 children were intentional, due to suicide (16) and fatal assault (4).
The mortality rate for external causes (5.05 deaths per 100,000) was slightly lower than previous years.
This section summarises the major features of all deaths from external causes. Subsequent chapters provide more detailed
analysis of specific external causes.
16.1 Key demographic and individual characteristics
Table 54: Key demographic and individual characteristics – deaths from all external causes, 2012
Number
Percent
Crude
Mortality Rate
95% Confidence
Interval
Incident
Rate Ratio
p
83
100
5.05
4.03 - 6.26
Female
27
33
3.38
2.23 - 4.92
-
-
Male
56
67
6.63
5.01 - 8.61
1.96
0.0018
6
7
6.44 (0.06)†
2.36 - 14.03
-
-
1-4 years
12
14
3.14
1.62 - 5.49
0.49
-
5-9 years
13
16
2.88
1.54 - 4.93
0.45
-
10-14 years
16
19
3.62
2.07 - 5.88
0.56
-
15-17 years
36
43
13.12
9.19 - 18.16
2.04
-
Not Aboriginal or Torres Strait Islander
72
87
4.58
3.59 - 5.77
-
-
Aboriginal or Torres Strait Islander
11
13
15.45
7.71 - 27.65
3.37
0
Major cities
35
43
2.97
2.07 - 4.13
-
-
Inner regional areas
22
27
6.48
4.06 - 9.81
2.18
-
Outer regional areas
22
27
20.57
12.89 - 31.15
6.93
-
Remote areas
3
-
-
-
-
-
Very remote areas
0
0
0.00
-
0.00
-
Quintile 5 (highest)
13
16
3.21
1.71 - 5.49
-
-
Quintile 4
20
25
6.86
4.19 - 10.60
2.14
-
Quintile 3
18
23
6.48
3.84 - 10.24
2.02
-
Quintile 2
12
15
3.46
2.01 - 6.80
1.08
-
Quintile 1 (lowest)
16
20
5.76
2.64 - 7.49
1.79
-
Total
Gender
Age
Under 1 year
Aboriginal and Torres Strait Islander status
Remoteness*
Socioeconomic status**
* Remoteness was not calculated in one case.
**Socioeconomic status was not calculated in four cases.
† Infant Mortality Rate.
NSW Child Death Review Team | Annual Report 2012
67
16.1.1 Age, gender and Aboriginal and Torres Strait Islander status
Consistent with previous years, more males than females died as a result of external causes; particularly in transport and
drowning fatalities. There was a slight reduction in the mortality rates of both genders in 2012.
External causes were the leading cause of death for children aged 1-17 years. External causes accounted for the deaths of over
half of the children aged 15-17 years, and almost half of those aged 10-14 years. Compared with previous years, the rate of
death from external causes in 2012 declined for children aged 15-17 years, but increased for children aged 5-9 and 10-14 years.
Eleven children who died from external causes in 2012 were identified as Aboriginal (9) or Torres Strait Islander (2). The rate of
death of Indigenous children from external causes was more than three times that of non-Indigenous children.
16.1.2 Remoteness and socioeconomic status
As has consistently been the case, the rate of death from external causes increased with remoteness.
The highest rate of death from unnatural causes was amongst children in the second highest area of socioeconomic advantage.
16.1.3 Child protection history
Consistent with 2011, the families of over one-third (31) of the children who died from external causes in 2012 had a child
protection history.
Within the three years before their death, the majority (25) of these children had been the subject of a report of risk of harm
or risk of significant harm to Community Services. Three children had not been the subject of a report themselves, but had a
sibling who had been.
One child had been the subject of a report to a Child Wellbeing Unit. Four children were in care at the time of their death.
68
NSW Child Death Review Team | Annual Report 2012
Chapter 17. Transport fatalities
The deaths of 39 children in 38 transport incidents were registered in 2012. Consistent with previous years, transport fatalities
were the overall leading external cause of death of children in NSW. The rate of death from transport incidents (2.37 per
100,000) was slightly higher than the previous two years.
As shown in table 55, almost three-quarters (28) of the children died in motor vehicle incidents:
• Consistent with previous years, almost half of the children who died in motor vehicle incidents (19) were passengers.
• Nine children were riding or controlling a vehicle at the time of the fatality. Most (7) were vehicles driven on public roads;
two deaths occurred in off-road incidents.
Five of the children who died were pedestrians. Over the past 15 years, there has been an overall decline in the number and
rate of pedestrian deaths of children in NSW.
In 2012, four children died while travelling or riding outside of a moving vehicle. One child died when a vehicle collided with
a building in which they were an occupant, and one child was riding a bicycle at the time of the fatality.
Table 55: Trends in deaths of children due to transport incidents by user type – 1998 – 2012, number
and (Crude Mortality Rate)
1998
1999
2000
2001
2002
2003
2004
2005
2006
2007
2008
2009
2010
2011
2012
Total
Pedestrian
23
(1.5)
24
(1.5)
24
(1.5)
21
(1.3)
13
(0.8)
12
(0.7)
12
(0.8)
8
(0.5)
11
(0.7)
7
(0.4)
6
(0.4)
6
(0.4)
7
(0.4)
8
(0.5)
5
(0.3)
187
Driver (all
vehicles)
18
(1.1)
9
(0.6)
12
(0.7)
9
(0.6)
8
(0.5)
10
(0.6)
5
(0.3)
11
(0.7)
11
(0.7)
11
(0.7)
9
(0.6)
9
(0.6)
7
(0.4)
8
(0.5)
9
(0.5)
146
Passenger
(all
vehicles)
25
(1.6)
33
(2.1)
37
(2.3)
28
(1.7)
33
(2.0)
32
(2.0)
28
(1.8)
23
(1.4)
32
(2.0)
17
(1.1)
12
(0.7)
23
(1.4)
18
(1.1)
13
(0.8)
19
(1.2)
373
Rider
(pedal)
3
2
2
5
(0.3)
2
2
1
0
1
38
-
-
6
(0.4)
2
-
4
(0.2)
3
-
4
(0.2)
1
-
-
-
-
-
-
Other
2
2
3
4
4
2
2
1
-
-
-
-
-
-
-
5
(0.3)
50
-
5
(0.3)
2
-
9
(0.6)
3
-
4
(0.3)
2
71
70
78
66
62
57
54
47
65
46
32
42
35
30
39
794
Total
-
Five of the 39 transport-related deaths in 2012 are ‘reviewable deaths’ and will be reviewed separately by the Ombudsman.
NSW Child Death Review Team | Annual Report 2012
69
17.1 Demographic and individual characteristics
Table 56 provides an overview of the main demographic characteristics of children who died in transport fatalities in 2012.
Table 56: Key demographic and individual characteristics – deaths due to transport fatalities, 2012
Number
Percent
Crude
Mortality Rate
95% Confidence
Interval
Incident
Rate Ratio
p
39
100
2.37
1.69 - 3.25
Female
13
33
1.63
0.87 - 2.78
-
-
Male
26
67
3.08
2.01 - 4.51
1.89
0.0287
Under 1 year
1
3
-
-
-
-
1-4 years
4
10
1.05
0.29 - 2.68
-
-
5-9 years
8
21
1.77
0.77 - 3.50
-
-
10-14 years
9
23
2.04
0.93 - 3.86
-
-
15-17 years
17
44
6.19
3.61 - 9.92
-
-
35
90
2.23
1.55 - 3.10
-
-
4
10
5.62
1.53 - 14.39
2.52
0.0351
14
36
1.19
0.65 - 1.99
-
-
Inner Regional areas
9
23
2.65
1.21 - 5.03
-
-
Outer Regional areas
16
41
14.96
8.55 - 24.30
-
-
-
-
-
-
-
-
4
11
0.99
0.27 - 2.53
-
-
Quintile 4
13
35
4.46
2.38 - 7.63
-
-
Quintile 3
12
32
4.32
2.23 - 7.55
-
-
Quintile 2
4
11
1.15
0.35 - 3.32
-
-
Quintile 1 (lowest)
4
11
1.44
0.31 - 2.95
-
-
Total
Gender
Age
Aboriginal and Torres Strait Islander status
Not Aboriginal or Torres Strait Islander
Aboriginal or Torres Strait Islander
Remoteness
Major Cities
Remote areas
Socioeconomic status*
Quintile 5 (highest)
* Socioeconomic status was not calculated in two cases
17.1.1 Age, gender and Aboriginal and Torres Strait Islander status
In 2012, transport fatalities were the leading external cause of death of children aged 5-17 years. Over half (20) of the children
who died in transport fatalities were teenagers. Most of the teenagers (13) were 17 years of age, including seven who were
driving a vehicle at the time of their death.
As shown in table 57, and consistent with the Team’s previous findings, the majority (26) were male. Males were represented in
two-thirds of the deaths of drivers, four of the five pedestrian deaths, and all four of the fatalities in which children travelled or
rode outside of moving vehicles. In 2012, the rate of death from transport fatalities of boys was almost twice that of girls.
Four children and young people were Aboriginal.
70
NSW Child Death Review Team | Annual Report 2012
Figure 4: Transport deaths of children registered in 2012, by age and gender
0.06
14
Number of Deaths
12
Key
10
Male
8
Female
6
4
2
0.05
0
≤1
1
2
3
4
5
6
7 8 9
Age in Years
10 11 12 13 14 15 16 17
Table 57: Trends in deaths of children due to transport fatalities by gender, 1998-2012, number and
(Crude Mortality Rate)
1998
1999
2000
2001
2002
2003
2004
2005
2006
2007
2008
2009
2010
2011
2012
Total
Female
20
(2.6)
28
(3.6)
28
(3.6)
18
(2.3)
17
(2.2)
21
(2.7)
23
(2.9)
17
(2.2)
15
(1.9)
19
(2.4)
7
(0.9)
17
(2.2)
14
(1.8)
11
(1.4)
13
(1.6)
268
Male
51
(6.3)
42
(5.2)
50
(6.1)
48
(5.8)
45
(5.5)
36
(4.4)
31
(3.8)
30
(3.7)
50
(6.1)
27
(3.3)
25
(3.0)
25
(3.0)
21
(2.5)
19
(2.3)
26
(3.1)
526
Both
71
(4.5)
70
(4.4)
78
94.9)
66
(4.1)
62
(3.8)
57
(3.6)
54
(3.4)
47
(2.9)
65
(4.0)
46
(2.9)
32
(2.0)
42
(2.6)
35
(2.2)
30
(1.8)
39
(2.4)
794
Table 58: User type and age of children – transport fatalities, 2012
Under 1
1-4 years
5-9 years
10-14 years
15-17 years
Total
Driver/Rider
0
0
1
1
7
9
Passenger
1
3
6
4
5
19
Pedestrian
0
1
1
1
2
5
Pedal cyclist
0
0
0
1
0
1
Other transport
0
0
0
2
3
5
1
4
8
9
17
39
Total
17.1.2 Remoteness and socioeconomic status
The majority (25) of the children who died lived in a regional area: 16 children lived in an outer regional area, and nine lived in
an inner regional area. Most of the children (25) resided in the third and fourth quintiles of socioeconomic status.
17.1.3 Child protection history
The families of one-third (13) of the 39 children who died in transport fatalities had a child protection history. Within the three
years before their death, six of the children who died had been the subject of a report of risk of harm or risk of significant harm
to Community Services. The reported risk issues were not related to the circumstances of death.
NSW Child Death Review Team | Annual Report 2012
71
17.2 Motor vehicle fatalities
The majority (28) of the children died in 27 motor vehicle incidents: 19 were passengers and nine were drivers. One of the
incidents resulted in the passenger deaths of two children.
Of the 27 incidents:
• Two-thirds (18) were single vehicle incidents, most of which (14) involved collision with stationary objects, such as trees.
Nine incidents involved collision with other vehicles.
• In the vast majority of cases (24), the child was travelling in a light vehicle (sedan, station wagon, 4WD, utility or light van).
A small number of incidents involved off-road vehicles (2) or a motorcycle (1).
• Two-thirds (18) of the incidents occurred in daylight hours, five occurred between 11pm and 7am, and four took place
between 6pm and 11pm.
17.2.1 Passenger fatalities
Nineteen children who died in motor vehicle incidents were passengers in the vehicle. In the majority of cases (16), an adult
was driving the vehicle. The other three vehicles were driven by teenagers.
Passengers in vehicles with an adult driver
Of the 16 children who died as passengers in a vehicle with an adult driver, the vast majority (14) were related to the driver. The
other two children were driven by a professional driver and an adult peer. One incident resulted in two child deaths.
Use of safety restraints in the vehicle
Changes to legislation relating to child restraints in March 2010 introduced an age-graduated system.67 Children aged seven
years and younger are required to be seated in child safety restraints appropriate for their age, and children under seven years
must not travel in the front seat of a vehicle unless all of the rear seats are occupied by younger children.
The majority (13) of the 16 children who were passengers in vehicles with an adult driver were using some form of child safety
restraint at the time of the incident. Of the other children, one (aged 16 years) was unrestrained, and one was an occupant of a
bus that was not required to have seatbelts. Information regarding restraint use was unavailable for one child (aged 17 years).
As seen in figure 5, the majority (13) of children being driven by adults were younger than 11 years of age, including five
children who were younger than seven years, and eight children aged 7-10 years.
Figure 5: Deaths of children as passengers in vehicles with adult drivers by age of child, 2012
3.0
2.5
Key
2.0
Male
1.5
Female
1.0
0.5
0.0
≤1
0.06
1
2
3
4
5
6
7 8 9
Age in Years
10 11 12 13 14 15 16 17
67 Road Rules 2008 and Road Amendment (Isabelle Broadhead Child Restraint Measures) Rules 2010, under the Road Transport (Safety and Traffic
Management) Act 1999.
72
NSW Child Death Review Team | Annual Report 2012
Table 59 outlines child safety restraint information relating to the 13 children who were passengers in vehicles with adult
drivers, and who wore a restraint.
Table 59: Deaths of children as passengers in vehicles with adult drivers by age, position in vehicle,
restraint type and use, 2012686970
Age
Location in vehicle
Restraint typ
Restraint use issue
Under 7 years
Rear – drivers side
Forward facing child seat
Multiple incorrect uses of restraint, including:
• Top-tether straps twisted and not firmly fitted to the vehicle’s
anchor point.
• In-built harness straps twisted and uneven in length when
buckle engaged.
• Shoulder slot chosen for the in-built harness likely to have
been too high for the child.
Under 7 years
Rear – drivers side
Forward facing child seat
Multiple incorrect uses of restraint, including:
• Child’s shoulders not secured in the in-built harness (straps
positioned against child’s back).
• In-built harness positioned across child’s waist was twisted.
• Top-tether straps not attached to the vehicle’s anchor point.
Under 7 years
Rear – drivers side
Forward facing child seat
Incorrect use of restraint – top-tether straps not attached to
vehicle’s anchor point.68
Under 7 years
Rear – centre seat
Forward facing child seat
Multiple incorrect uses of restraint, including:
• Straps of inbuilt harness were unevenly thread through
restraint’s shoulder slots in the plastic mould. Straps were
different heights and lengths.
• Restraint not firmly fitted to seat.
• Restraint positioned on a narrow rear-centre seat. Top tether
straps positioned between gaps in adjoining seats instead
of over back of seat.
Under 7 years
Rear – passenger side
Forward facing booster seat,
accessory H-harness, and
adult lap-sash seatbelt
Incorrect use of restraint – injuries consistent with a
poorly-fitted accessory harness.
7-12 years
Rear – passenger side
Booster cushion and adult
lap-sash seat belt
No issues identified with restraint fit.
7-12 years
Rear – passenger side
Adult lap-sash seatbelt
Inappropriate use of restraint – child was 20cm shorter than
the recommended height for use of an adult seatbelt.69
7-12 years
Rear – centre seat
Adult lap-sash seatbelt
Insufficient information to ascertain appropriateness of
restraint (height of child not reported).
7-12 years
Front passenger
Adult lap sash seat belt
Inappropriate use of restraint – child was 20cm shorter than
the recommended height for use of an adult seatbelt.
7-12 years
Front passenger
Adult lap-sash seatbelt
Inappropriate use of restraint – child was 10cm shorter than
the recommended height for use of an adult seatbelt.
7-12 years
Rear – centre seat
Adult lap-only seatbelt
Incorrect use of restraint – likely that lap portion of seatbelt
was too loose for child.70
7-12 years
Rear – passenger side
Adult lap-sash seatbelt
No issues identified with restraint.
Over 12 years
Rear – passenger side
Adult lap-sash seatbelt
No issues identified with restraint.
68 Research has found high rates of accessory child safety harness system misuse, resulting in serious degradation of the level of protection they
provide. Recent research suggests that the risks of injury outweigh any perceived benefit of a child safety harness system over a lap-shoulder
system. (Brown J. Wainohu D. Aquilina P. Suranto B. Kelly P. & Bilston L.E. 2010, ‘Accessory child safety harnesses: Do the risks outweigh the
benefits?’ in Accident Analysis and Prevention 42: 112 – 121.)
69 Roads and Maritime Services advises that adult lap-sash seatbelts have been designed for people with a minimum height of 145cm.
http://www.rta.nsw.gov.au/roadsafety/downloads/choose_right_buckle_right.pdf, accessed 16 July 2013.
70 Roads and Maritime Services recommends that centre lap-only seat belts are replaced by lap-sash seat belts in that position. If a child is too
small for a restraint specified for their age, they should be kept in a previous level of restraint for as long as possible.
NSW Child Death Review Team | Annual Report 2012
73
The available information indicates that the child safety restraints were incorrectly used71 or inappropriately used72 in relation to
two-thirds (9) of the 13 children.
The restraints of six children were incorrectly used, including all of the children under seven years of age (5). In relation to three
of the five children, multiple errors in the restraint fitting process were evident. Research has shown that multiple minor misuses
of the restraint have a cumulative effect, and can have the same effect as major forms of restraint misuse.73
Three of the 11 children who were positioned in the rear of the vehicle were in the centre seat in a split-seat configuration:
• Expert review of the death of one child identified that the restraint was anchored to a narrow vehicle seat that had
insufficient strength to withstand forces during the collision (whilst a restraint was anchored to it). The restraint was attached
to the anchor point installed by the manufacturer.
• One child used a lap-only seat belt. Research has shown that, when fitted correctly, lap-sash seatbelts offer greater
protection to passengers than lap-only seatbelts.74
• One child was positioned on a seat of an early-model vehicle with a seat design that provided limited restraint of the child.
Contributing factors in fatalities involving children as passengers with an adult driver
The majority (11) of the 15 incidents occurred on roadways with a sign-posted speed limit of 80-100km/h.
Seven children were travelling in light vehicles that were manufactured prior to 2002, which were not fitted with many of the
vehicle safety systems available in more recently manufactured vehicles.
Police identified a number of contributing factors to the incidents, some of which were largely preventable. Some of the
incidents involved multiple contributory factors.
• Speed was identified as a factor in almost half (7) of the fatalities. This included drivers exceeding the sign-posted speed
limit by five to 100km/h (5), and driving too fast for the prevailing conditions (2).
• Drug use was relevant to three deaths. Two drivers returned positive results for cannabis at levels that were deemed by a
police expert to have impaired their driving ability. The driver of a vehicle that collided with a vehicle in which a child was a
passenger returned a positive result for amphetamines.
• Fatigue was a factor in three fatalities. Two drivers reported falling asleep whilst driving. Neither incident occurred in the
context of long-distance driving.
• Three incidents involved the driver being distracted – by children or animals in the vehicle, or something outside of the vehicle.
• Road and environmental conditions contributed to two of the 15 fatalities, and were possible factors in another three
incidents. The conditions included heavy rain and slippery roadways (3), inadequate warning signs about the risk of wildlife
entering the path of a vehicle (1), and limited visibility due to poor or absent street lighting (1).
• In two incidents, the vehicle tyres were deemed to be worn and devoid of tread.
• A pre-existing medical condition of the driver was found to have significantly contributed to two fatalities.
Other contributory factors included alcohol use (1) and mobile phone use (1).
Police charged six people in relation to the deaths of six children. The charges included negligent driving occasioning death,
dangerous driving, driving under the influence and inappropriate restraint of a child.
Passengers in vehicles with a teenage driver
Three of the passenger deaths of children occurred in vehicles driven by teenagers. The passengers were aged 14 years (1)
and 17 years (2). Two were male.
71 ‘Incorrect use of restraint occurs when the user does not use the restraint as it was designed to be used, either in installing the restraint in the
vehicle or securing the child in the restraint’, from Brown J. Hatfield J. Du W. Finch C.F. & Bilston L.E. 2010, ‘Population-level estimates of child
restraint practices among children aged 0-12 years in NSW, Australia’, in Accident Analysis and Prevention 42: 2144 – 2148.
72 Inappropriate restraint use ‘occurs when the child uses a restraint type that is not the most size appropriate. This commonly arises when small
children prematurely graduate into restraints designed for older children and adults’, in Brown J. et al. 2010, op. cit.
73 Tai A. Bilston L. Brown J. 2011, ‘The cumulative effect of multiple forms of minor incorrect use in forward facing child restraints on head injury risk’,
Enhanced Safety of Vehicles Conference, Washington DC.
74 Henderson M. Brown J. & Griffiths M. 1997, Children in Adult Seat Belts and Child Harnesses: Crash Sled Comparisons of Dummy Responses,
SAE Technical Paper 973308, doi:10.4271/973308.
74
NSW Child Death Review Team | Annual Report 2012
In two fatalities, the passengers were positioned in the front passenger seat and wore a seatbelt. They were the only
passengers. In the other fatality, the child was positioned in the rear passenger-side seat and the vehicle was full with
passengers aged 17-19 years. It is not known if the child who died wore a seatbelt.
The drivers were aged 17-18 years, and tended to be male (2) and unrelated to the child who died (2). Consistent with their age,
the drivers did not have extensive driving experience: two had a provisional (P1) driver licence, and one held an international
driver licence with no more than 12 months driving experience.
Of the three fatalities, two occurred in the evening between 9pm and 1am, and one occurred in daylight hours. The vehicles
were travelling along roadways with speed limits of 60-100km/h.
Contributing factors in fatalities involving children as passengers with a teenage driver
Police identified a number of factors that contributed to the three incidents:
• use of early model vehicles (2) – both vehicles had been manufactured in 1994-1999 and had less sophisticated vehicle
safety systems than current models
• speed (2) – in one case, the driver exceeded the speed limit by approximately 40km/h
• driver inexperience (2), and
• environmental conditions (heavy rain).
Police charged two drivers in relation to the death of two children. The charges included dangerous driving occasioning death
and negligent driving occasioning death.
17.2.2 Driver fatalities
Nine of the children who died in motor vehicle fatalities in 2012 were driving the vehicle at the time of the incident. The majority
(7) occurred on public roads and two occurred in off-road circumstances. Most of the drivers (6) were male.
The number of driver deaths of children has consistently ranged between seven and nine for the past five years.
Fatalities involving children as drivers on public roads
The vast majority (6) of the seven children who died while driving on a public road were 17 years of age. One child was aged
16 years.
Five of the children held a provisional (P1) licence. One driver had a learner licence, but was unsupervised by a fully licensed
driver at the time of the fatality. One child did not have a licence. One child was not wearing a seatbelt.
Six children were drivers of light vehicles (utility, light van, and sedan). In five of the incidents, the driver was the sole occupant
of the vehicle. One vehicle was carrying one peer passenger. Another child was riding a motorcycle and was carrying a peer
pillion passenger.
Most (5) were single vehicle incidents, which involved collision with stationary objects such as trees (4) and a telegraph pole (1).
Three of the incidents occurred on a Friday or Saturday night, two of which occurred between 11pm and 6am. The driver was
the only vehicle occupant in these two incidents.
All of the fatalities occurred in regional areas of NSW.
Contributing factors in fatalities involving children as drivers on public roads
Records indicate that:
• Excess speed was relevant to the vast majority (6) of the incidents. This included the driver exceeding the sign-posted
speed limit and/or the speed limit permitted by their licence.75
• In two fatalities, road conditions were contributory, including poor street lighting, no edge lines and a slippery road surface.
• Fatigue was a possible factor in two fatalities. The incidents occurred between 5am and 7am, and did not involve long distances.
Other contributory factors included inexperience with the presenting road conditions, and reckless driving. In one fatality, the
driver was impaired due to alcohol use.
75 Learner drivers cannot exceed 80km/h and Provisional (P1) drivers cannot exceed 90km/h. http://www.rta.nsw.gov.au/licensing/
gettingalicence/200707_restrictions.html, accessed 16 July 2013.
NSW Child Death Review Team | Annual Report 2012
75
Fatalities involving children as drivers of off-road vehicles
Two children died while driving off-road vehicles on private property. The children were aged nine and 13 years, and were
riding a quad bike and a side-by-side vehicle.76 Both were single vehicle incidents that included ejection from the vehicle.
Neither child wore a helmet.
These deaths are considered in more detail in Chapter 18.
17.3 Pedestrians
In 2012, six children died as pedestrians.77 The number of pedestrian deaths of children has remained relatively constant for
the past five years, averaging 6.4 per year.
The six children ranged in age from four to 17 years. The vast majority (5) were male.
Two young people were struck by a vehicle while walking along a roadway. One was walking dangerously in the middle of the
roadway and one was on the road shoulder. The speed limit for both roads was above 90km/h. Neither of the roadways had
designated footpaths for pedestrians.
One child was on a footpath and was struck by a vehicle that had left the roadway whilst being driven recklessly.
Three fatalities involved a vehicle travelling in a forward direction at low speed:78
• One child was walking across a designated pedestrian crossing with signals. The child was in a group of adults and other
children crossing and had stopped while the others continued.
• One child had left the footpath and entered the path of a vehicle manoeuvring in a cul-de-sac. The driver had limited
visibility due to other parked vehicles.
• One child was riding a bicycle and had entered the path of a vehicle exiting a public car-park driveway. This driver also had
limited visibility.
The fatalities involving vehicles travelling at low speed were not typical of the ‘low speed vehicle run-over’ incidents that the
Team has previously reported on.79 Only one fatality involved a child under five years of age, and none of the incidents involved
non-traffic areas or circumstances in which the driver believed that the child was in a safe location.
17.3.1 The driver and vehicle
In the majority (5) of the fatalities where the driver could be identified, two drivers were aged 17 years and three drivers were
aged between 37 and 58 years. Most (5) were male. None of the identified drivers were related to the children.
Five fatalities involved light vehicles (4WD, light van, sedan). In one incident the vehicle was unable to be identified.
Contributing factors in pedestrian deaths
Contributory factors in the pedestrian deaths of children in 2012 included:
• Two drivers had limited visibility prior to colliding with the child. Both drivers were noted to have been manoeuvring their
vehicles with caution.
• One driver had a poor driving history and had been granted a good behaviour period due to excessive demerit point
accumulation. The driver had been suspended from driving on four previous occasions, and had previously been awarded
demerit points for failing to give way, which was a relevant factor in the fatality.
• One driver was a learner licence holder and was not accompanied by a supervising driver. The driver was observed to be
driving recklessly prior to losing control of the vehicle.
• One driver returned a blood alcohol limit above the legal limit.
• One driver was reported to have been travelling at the sign-posted speed limit, but at an excessive speed for the
environmental/road conditions at the time of the incident.
76 A side-by-side vehicle (also known as an ultra light utility vehicle) is a small vehicle that typically has a bench-type seat and a steering wheel.
77 Transport for NSW notes a pedestrian includes ‘a person in or on a wheeled recreational device or wheeled toy’, http://roadsafety.transport.nsw.
gov.au/stayingsafe/pedestrians/skateboardsfootscootersandrollerblades/index.html, accessed 16 July 2013.
78 Vehicles travelling less than 10km/h. NSW Child Death Review Team 2012, NSW Child Death Review Team annual report 2011, Sydney: NSW
Ombudsman, p81.
79 Ibid., pp. 81-85.
76
NSW Child Death Review Team | Annual Report 2012
Police charged three drivers. The charges included negligent driving occasioning death, dangerous driving occasioning death
and driving under the influence.
17.4 Other transport fatalities
Five children died in transport fatalities in which they were not a passenger, driver or pedestrian. All were male and aged 11-17 years.
Most (4) of the fatalities involved the child travelling or riding outside the vehicle in a position not intended for passengers.
This included standing in the tray of a utility vehicle, standing on the front tip of a powered water vessel, holding onto a vehicle
whilst riding a skateboard, and leaning out of a train.
In three of these fatalities, the vehicle or vessel was driven by a peer aged 13-17 years. Three of the incidents occurred in
daylight hours and one occurred between midnight and 7am.
One child died when a vehicle collided with the building they were occupying.
Contributing factors
Most (4) of the children were engaged in risk-taking behaviour at the time of the fatality. Other relevant factors included:
• speed (4) – included a moving vessel that was operated at an excessive speed for the waterway
• lack of safety equipment (2) – included not wearing a helmet while travelling on a skateboard at speed, and not wearing a
personal flotation device on a boat, and
• impaired judgement of the driver – including one driver who was seriously impaired by alcohol and using a communication
device prior to the collision.
One vehicle that collided with a child was not fitted with a front under run protection system,80 which is required for vehicles
over 25 metres in length.
Police charged one peer driver with dangerous driving occasioning death.
17.5 Prevention measures
Key factors in the deaths of children in transport fatalities in 2012 included speed; young drivers and risk-taking behaviour; and
failure to use, or incorrect/inappropriate use of, child safety restraints.
In the main, these factors have been identified in targeted prevention measures and behaviour modification strategies by NSW
Government agencies and injury prevention organisations. Transport for NSW’s NSW Road Safety Strategy 2012-2021 includes
strategies to address speeding behaviour and improve the safety of children and young people.
17.5.1 Speeding
Speeding is the biggest single road safety issue on NSW roads, and is a contributing factor in 40 per cent of fatal crashes
involving P-plate drivers.81 Speed was a contributing factor in almost half (18) of the transport incidents that caused the deaths
of children in 2012.
‘Safer speeds’ is a key area of focus in the NSW Road Safety Strategy, with a multi-faceted ‘safe system approach’ that includes
appropriate speed limits and zoning, engineering controls and enforcement. Speeding behaviour is consistently the focus of
road safety campaigns, targeting young drivers, young men and the broader community, such as the recent ‘Don’t rush’ and
‘P-plate speeding’ campaigns.
17.5.2 Young, inexperienced drivers
Young drivers are over-represented in all transport fatalities.82 Over one-third (15) of all transport incidents that resulted in the
death of a child in 2012 involved young drivers.
80 A ‘front under-run protection system’ is a barrier integrated onto the front of a truck that can prevent a colliding car damaging the truck’s steering,
aids the deployment of air bags and crumple zones in the colliding vehicle, and distributes crash forces more evenly.
81 NSW Centre for Road Safety 2013, Speed threat information, Sydney: TfNSW, http://roadsafety.transport.nsw.gov.au/campaigns/speeding/index.
html, accessed 10 July 2013.
82 NSW Centre for Road Safety 2013, Crashes involving young drivers, Sydney: TfNSW, http://roadsafety.transport.nsw.gov.au/aboutthecentre/
statistics/crashesinvolvingyoungdrivers.html, accessed 16 July 2013.
NSW Child Death Review Team | Annual Report 2012
77
However, Transport for NSW reports that the number of fatal crashes involving young drivers (aged less than 26 years) fell by
47 per cent in 2000-2010. This was nearly twice the decrease for fatal crashes not involving a young driver.83 The NSW Road
Safety Strategy includes strategies targeted at reducing risks related to novice young drivers, such as reviewing the licensing
arrangements of learner drivers. Changes to learner licences were introduced in July 2013, including:
• learner licence holders can be credited 20 hours of logbook driving hours if they participate in a Safer Drivers Course84 and
professional lessons, and
• the speed limit for learner licence holders has been raised from 80km/h to 90km/h, to enable increased driving experience
on higher speed roads before graduating to a provisional licence.
The P Drivers Project aims to develop a driver education model (behaviour change program) for inclusion in the graduated
licensing scheme. The large-scale road safety research project in NSW and Victoria recruits newly licensed drivers to
participate in program sessions that educate them on common behaviours that lead to serious injury and fatalities.
Information and resources for young drivers are promoted by YouthSafe85 and the Roads and Maritime Services’ youth
website: geared.com.au.
17.5.3 Child restraint systems
While restraint use among children travelling in cars in NSW is high, the quality of restraint use is often poor.86 Inappropriate
and/or incorrect restraint use reduces the effectiveness of the restraint in preventing injury. Recent research has found that,
while there has been an increase in best practice child car restraint use for children aged 2-5 years in low socioeconomic
areas after the introduction of mandatory child restraint laws in NSW, further efforts are required to increase optimal child car
restraint use.87
Initiatives to prevent sub-optimal restraint use typically involve education of the adults fitting the restraints, and improvements
to restraint design to enable appropriate use.
Roads and Maritime Services encourages caregivers to use authorised restraint fitting stations to install child restraints.
The caregiver pays a fee for this service of $15-75. Local councils and Kidsafe NSW offer some fee-free restraint fitting days
throughout the state.
Recent NSW and national initiatives to improve the design and use of child restraint systems include:
• Kidsafe NSW’s Seat Me Safely program provides practical information on the selection and use of child restraints, safety tips
to consider when using child restraints, and information on how to correctly install and fit the restraint to the vehicle and child.
• Neuroscience Research Australia and Kidsafe Australia released Best Practice guidelines for the safe restraint of children
travelling in motor vehicles in May 2013. The guidelines provide evidence-based recommendations on how best to safely
restrain children up to 12 years of age. The guidelines will be supported through the development of targeted documents for
consumers and restraint fitters.
• The Child Restraint Evaluation Program (CREP) is a collaboration of government and non-government organisations that
provides car restraint buyers with information on the levels of protection from injury a restraint can provide, and the ease
with which the restraint can be used correctly.
• Revised Australian standards on child restraints were released in June 2013, which provide for the development of a booster
seat with an in-built harness for children up to eight years of age. The first booster seats designed for children up to 145cm
(marketed for children up to 10 years of age) became commercially available in Australia in February 2013.
83 Transport for NSW, NSW Road Safety Strategy 2012-2021. Sydney: TfNSW, http://roadsafety.transport.nsw.gov.au/downloads/road_safety_
strategy.pdf, accessed 16 July 2013.
84 A course offering theoretical and practical coaching to learner licence holders. The course deals with different road conditions, understanding
factors beyond a driver’s control and also helps identify risks on the road. NSW Centre for Road Safety 2013, Safer drivers course, Sydney: TfNSW,
http://roadsafety.transport.nsw.gov.au/stayingsafe/drivers/youngdrivers/youngerdriverscourse.html, accessed 16 July 2013.
85 Not for profit organisation and the peak body in NSW for youth injury prevention.
86 Brown J. Hatfield J. Du W. Finch C.F. & Bilston L.E. 2010, Population-level estimates of child restraint practices among children aged 0-12 years in
NSW, Australia, Accident Analysis and Prevention, 42: 2144 – 2148.
87 Brown J. Keay L. Hunter K. Bilston L.E. Simpson J.M. & Ivers R. 2013, ‘Increase in best practice child car restraint use for children aged 2-5 years in
low socioeconomic areas after introduction of mandatory child restraint laws’, in Australian and New Zealand Journal of Public Health, 37: 272 – 277.
78
NSW Child Death Review Team | Annual Report 2012
• Since July 2013, manufacturers of new vehicles have been required to install adult lap-sash seat belts in the rear centre
seat of vehicles transporting less than nine occupants. Lap-only seat belts are no longer permitted for installation in these
seats. The Australian standard on child restraint systems for use in motor vehicles also indicates that all manufacturers are
required to warn consumers that the restraint should not be used on a seat position where the top tether strap may fall into a
split in the seat back.
• A DVD was produced in 2012 to increase awareness amongst Aboriginal communities about the benefits of seatbelts, child
restraints and the issues to consider before purchasing a vehicle.
17.6 The Team’s recommendations
Last year, the Team took a close look at the deaths of 24 children over a 10-year period from low speed vehicle run-over
fatalities. In the context of the need to better understand and monitor the circumstances and scope of such incidents, the
Team directed two recommendations to the Centre for Road Safety (CRS).
The recommendations were aimed at improving the collection, analysis and publication of data about low speed vehicle run-over
fatalities; and enabling the development of strategies to reduce the risk of death and injury of children from these incidents.
In response to the Team’s recommendations, CRS detailed a range of activities in 2012 that were aimed at raising public
awareness of the risks to children from these incidents, including a media campaign, workshops and a driveway safety
resource for families and carers. The agency also indicated that the Commonwealth Government has initiated an international
study of the road safety benefits of reversing technology, in response to the issue being raised by the NSW Government.
The Team was advised that CRS’ new database system and recent data linkage activities would enable the recording and
reporting of off-road incidents, including low speed run-over incidents. CRS indicated that, once analysis of the data is
completed, it would convene key injury prevention agencies to determine further countermeasures to address low speed
vehicle run-overs. The Team will monitor CRS’ continuing and important work in relation to low speed vehicle run-over fatalities.
Recommendations
The Centre for Road Safety
6. In the context of the Centre for Road Safety’s (CRS) analysis of data relating to low speed vehicle run-over
incidents and its plans to convene key injury prevention agencies to determine further countermeasures to
address such incidents, CRS should provide advice to the Team on:
(a)key findings or results from the data analysis, and
the outcomes of the consultations/forum with relevant agencies, including any areas of further work to
prevent low speed vehicle run-over fatalities.
NSW Child Death Review Team | Annual Report 2012
79
Chapter 18. Off-road vehicle fatalities 2003-2012
In the 10 years between 2003 and 2012, 25 children died in off-road vehicle88 incidents in NSW.89 The fatalities mainly involved
off-road motorcycles (13) and ‘all-terrain’ and other motor vehicles designed primarily for off-road use (11), such as quad bikes.
Table 60 provides an overview of the main demographic characteristics of children who died in off-road vehicle fatalities in
2003-2012.
Table 60: Key demographic and individual characteristics – off-road vehicle fatalities, 2003-2012
Number
Percent
25
100
6
24
19
76
Under 1 year
0
0
1-4 years
2
8
5-9 years
3
12
10-14 years
12
48
15-17 years
8
32
23
92
2
8
6
24
Inner regional areas
11
44
Outer regional areas
7
28
Remote areas
1
4
Quintile 5 (highest)
4
16
Total
Gender
Female
Male
Age
Aboriginal and Torres Strait Islander status
Not Aboriginal or Torres Strait Islander
Aboriginal or Torres Strait Islander
Remoteness
Major cities
Socioeconomic status
Quintile 4
5
20
Quintile 3
5
20
Quintile 2
7
28
Quintile 1 (lowest)
4
16
In Australia and internationally, increasing attention is being paid to the high incidence of deaths and serious injuries from
incidents involving quad bikes and related off-road vehicles. Across Australia in 2012, 19 quad bike deaths were reported,
including the deaths of five children (26%), all aged between five and 13 years.90
In NSW in the five years to 2010/11, there were 2,036 hospitalisations of children involving off-road vehicles.91 Over three-quarters
88 An off-road vehicle is designed primarily for use on unsealed surfaces and most are unable to be registered.
89 We defined off-road incidents as instances in which a child was riding a vehicle that was primarily designed for off-road use in an off-road area or
temporarily on a public road (such as crossing a road to travel from one off-road area to another).
90 Safe Work Australia Quad Watch 2013, 2012 quad bike fatalities, Canberra: Safe Work Australia, http://www.safeworkaustralia.gov.au/sites/swa/
whs-information/agriculture/quad-watch/pages/quad-bike-fatalities, accessed 5 July 2013.
91 The data relates to primarily unregistered off-road vehicles, including motor-scooter, moped or motorised bicycles; motorcycles designed primarily
for off-road use; and all-terrain or other motor vehicle designed primarily for off-road use. The information pertains to children aged 0-17 years.
80
NSW Child Death Review Team | Annual Report 2012
(1,604) involved off-road motorcycles, followed by ‘all-terrain’ off-road vehicles, such as quad bikes (351). Almost two-thirds of
the hospitalisations (1,234) involved children aged 1-14 years.92
The CDRT’s previous work relating to recreational transport incidents93 and recent state and national attention to quad bike
incidents involving children have prompted the Team to examine off-road vehicle incidents in more detail.
18.1 The children
18.1.1 Age, gender and Aboriginal and Torres Strait Islander status
Of the 25 children who died, three-quarters (19) were male. The prevalence of males was particularly acute in fatalities
involving off-road motorcycles, where all of the children who died (13) were male.
Consistent with data on hospitalisations related to off-road vehicle incidents, just over two-thirds (17) of the children who died
in the 10-year period were aged 1-14 years.
Two of the children were Aboriginal.
18.1.2 Remoteness and socioeconomic status
Three-quarters (19) of the off-road vehicle incidents that resulted in the deaths of children in NSW occurred outside of the
major cities. The majority (18) occurred in regional areas.
There were differences in the location of fatalities involving off-road motorcycles and those involving ‘all-terrain’ vehicles. While
the greatest proportion of fatalities involving quad bikes and other ‘all-terrain’ vehicles occurred in major cities (40%), the vast
majority (85%) of the off-road motorcycle fatalities occurred outside of those centres. Over half (7) of the off-road motorcycle
fatalities occurred in inner regional areas.
18.2 The vehicles
As shown in table 61, just over half of the fatalities (13) involved off-road motorcycles. Eleven children died in incidents involving
‘all-terrain’ or other off-road vehicles, most of whom (6) were using a quad bike.
Table 61: Types of vehicles in off-road vehicle fatalities of children, 2003-2012
Type of vehicle
Number
Motorcycle designed primarily for off-road use
13
All-terrain or other motor vehicle designed primarily for off-road use
11
Quad bike
6
Side-by-side vehicle
4
Go kart
1
Tractor
1
Total
25
18.3 The incidents
All of the off-road vehicle incidents involved single fatalities.
92 NSW Commission for Children and Young People 2013, Submission to the NSW Parliament Inquiry into non-registered motorised vehicles,
Submission No 42, Sydney: NSW Parliament, accessed 6 June 2013, https://www.parliament.nsw.gov.au/Prod/Parlment/committee.nsf/0/48704f
21b1e20f16ca257b74001feeac/$FILE/Submission%2042.pdf.
93 NSW Child Death Review Team 2008, Trends in child deaths in New South Wales 1996-2005, Sydney: NSW Commission for Children and Young
People. The Team noted that 17 of 103 driver deaths occurred during recreational activities: seven of the children were driving in off-road areas;
six were racing motorbikes or go carts in organised motocross events; and four were driving on rural properties.
NSW Child Death Review Team | Annual Report 2012
81
18.3.1 Off-road motorcycle fatalities
Motorcycles designed primarily for off-road use are also known as ‘dirt bikes’. They are used for recreation, transport and
agricultural activities. The use of dirt bikes has a number of inherent risks: the roads tend to be uneven or in poor condition,
the activities are frequently risky (such as going over jumps or racing), and the activities often happen in isolated areas where
emergency service access may be delayed (such as rural properties or state forests).94 Australian and international research
has found increasing presentations of motorcycle injuries in children and adolescents.95
Thirteen children died in off-road motorcycle fatalities in NSW in 2003-2012; all of whom were male. The dominance of boys in
this cohort is consistent with Queensland research, which found that between 2007 and 2009 there were 10 fatal motorcycle
child fatalities, all of which involved boys.96
The 13 children were aged between nine and 17 years. The average age was 14.2 years.
Location
The vast majority of the fatalities involving off-road motorcycles (11) occurred off-road, on:
• state forests or fire trails (4)
• racetracks (3)
• tracks or jumps on private property (2)
• a driveway, and
• a paddock.
Two fatalities occurred on a road, either while crossing to get from one off-road area to another, or riding on an unsealed local
rural road.
Of the 13 fatalities, almost half (6) occurred in settings that required a licence and bike registration (state forests and on roads).
None of the six children had a licence or a registered bike.
Activity and injury
Most (10) of the children were riding for recreation. Three children were riding for transport purposes.
All of the children were sole riders of the bike at the time of the fatality; none had passengers.
The majority of the fatalities (10) were single vehicle incidents, where the child hit a stationary object (such as a tree) or came
off the bike during jumps or other activities. Three incidents involved a collision with another vehicle (all motorcycles).
The injuries sustained by the 13 children in the fatalities included multiple injuries (4), typically head, neck and chest fractures,
lacerations and other injuries; severe head injury (3); chest/ abdominal injury (3); injury to the neck and spinal cord (2); and
accidental strangulation (1).
Safety considerations
Information about helmet use was available for 11 of the 13 children. Nine of the 11 children (82%) were wearing a helmet at the
time of the fatality.
The level of supervision of the child was able to be ascertained in 12 cases. No adult supervision was provided in relation to
seven of the 12 children (58%) who died in off-road motorcycle incidents.
Three children were actively supervised by adults during an organised racing event. For two children, an adult was aware of the child
getting on the bike or aware of the time it would take the child to complete a circuit, but they did not have direct adult supervision.
Of the eight children whose blood alcohol level was recorded, one was heavily intoxicated.
94 Ramakrishnaiah R. Chetan Shah C. Parnell-Beasley D & Greenberg B. 2012, Motorized dirt bike injuries in children, Journal of Emergency
Medicine, 44(4): 806-810.
95 Bevan C. Babl F. Bolt P. & Sharwood L. 2008, The increasing problem of motorcycle injuries in children and adolescents, Medical Journal of
Australia, 189(1): 17-20; Cassell E. Clapperton A. O’Hare M & Congiu M. 2006, On- and off-road motorcycling injury in Victoria, Hazard 64: 1-27;
Centers for Disease Control and Prevention 2006, Nonfatal injuries from off-road motorcycle riding among children and teens — United States,
2001–2004, Morbidity and Mortality Weekly Report, 55(22): 621-624. The research includes on-road and off-road motorcycles.
96 Pym A. Wallis B. Franklin R. & Kimble R. 2013, Unregulated and unsafe: the impact of motorcycle trauma on Queensland children, Journal of
Paediatrics and Child Health, 49(6): 493-497.
82
NSW Child Death Review Team | Annual Report 2012
18.3.2 Quad bike fatalities
Quad bikes are four-wheeled motorcycles that are frequently used for both recreation and agricultural work.97 They have a
saddle-type seat that is designed for a single operator, and handlebars for steering control.
Quad bikes are considered to be inherently unstable on anything other than flat terrain due to a high centre of gravity.98 They
have both pitch instability (risk of tipping over when going up or down steep hills) and lateral instability (tipping risk from one
side of the bike being lower than the other).99 New Zealand researchers have noted that ‘[a]lthough they appear easy to ride
and handle, riding [a quad bike] requires the same or greater skill judgement and experience as for driving a car. [Quad bikes]
are heavy, powerful machines.’100 Quad bikes are currently the leading cause of death and serious injury on Australian farms.101
In the 10 years to 2012, six children died in incidents involving quad bikes in NSW. The vast majority (5) were female.
The children were aged between one and 16 years, with four children aged 11 years or younger. The average age was nine years.
Two of the children were driving the quad bike at the time of the fatality; they were 13 and 16 years old. One of the children was
carrying multiple passengers.
Quad bikes are not designed to carry passengers. The addition of passengers is dangerous as they ‘restrict the driver’s
mobility and add weight to an ATV, raising the centre of gravity, making it harder to control and more prone to tipping over.’102
Most of the children who died in incidents involving quad bikes were passengers (4). Three of the four passengers were being
driven by other children (aged two to 12 years) at the time of the fatality. All of the peer drivers had been given permission by
adult supervisors to control the vehicle. One child was driven by a parent.
Location
All of the quad bike deaths occurred on or around rural properties, mostly (5) in paddocks.
One fatality occurred on a road, with the bike hit by a car as it was crossing the road. It is illegal to move a quad bike over a
road while it is under power.103
Activity and injury
The majority of the children (5) were riding the quad bike for recreation. One child was travelling to a location to herd stock at
the time of the fatality.
Half (3) of the incidents were ‘rollovers’, involving the vehicle tipping or rolling over when the driver attempted to go up a steep
incline. In each of the three rollover incidents, the child who died was a passenger on the quad bike.
Quad bikes are noted to be ‘prone to tipping and rolling over when moving at moderate speeds and on slopes’.104 A review
of 127 quad bike deaths in Australia in 2001-2010 found that just under half of the incidents (55) were rollovers. New Zealand
research has indicated that 70 per cent of paediatric all-terrain vehicle fatalities involve rollovers, tipping or flipping.105
For the three non-rollover fatalities, two were single vehicle incidents (such as hitting a fence), and one involved collision with a car.
The injuries sustained in the incidents that resulted in death included multiple injuries (2), severe head injury (2), lung laceration (1),
and crushed larynx/ trachea (1). These injuries are consistent with those reported in other research relating to quad bike incidents.106
97 Australian Centre for Agricultural Health and Safety 2011, Safety of quad bikes and Side-by-Side Vehicles on Australian Farms – A practical
management guide, Moree, NSW: University of Sydney.
98 Ibid.; and WA Department of Health, unknown publication year, Literature Review – Quad Bike Related Injuries and Deaths,
http://www.healthnetworks.health.wa.gov.au/docs/injury_quad_bike.pdf, accessed July 2013.
99 Safe Work Australia 2012, Design and engineering controls for improving quad bike safety: key findings from the discussion paper and forum,
Canberra: Safe Work Australia.
100 Anson K. Segedin E. & Jones P. 2009, ATV (quad bike) injuries in New Zealand children: their extent and severity, New Zealand Medical Journal,
122(1302): 122.
101 Lower T. Pollock K. & Herde E. 2013, Australian quad bike fatalities: what is the economic cost?, Australian and New Zealand Journal of Public
Health, 37(2): 173-178.
102 Anson K. et al. 2009, op cit, p. 123.
103 Motorcycle Council of New South Wales Incorporated 2012, Where can you ride?, Sydney: MCCofNSW http://dirtbike.mccofnsw.org.au/a/16.html,
accessed 4 July 2013.
104 WA Department of Health, unknown publication year, Literature Review – Quad Bike Related Injuries and Deaths, http://www.healthnetworks.
health.wa.gov.au/docs/injury_quad_bike.pdf, accessed July 2013.
105 Anson K. Segedin E. & Jones P. 2009, ATV (quad bike) injuries in New Zealand children: their extent and severity, New Zealand Medical Journal,
122(1302): 127.
106 For example, the Australian Centre for Agricultural Health and Safety’s review of the deaths of 127 people from quad bike incidents in Australia
in 2001-2010 found that deaths were predominantly associated with multiple injuries and head injuries. Lower T. Herde E. and Fragar L. 2012,
Australian Quad Bike Deaths (2001-2010), Conference Presentation: 2012 “Are You Remotely Interested?” Mt Isa, QLD.
http://www.micrrh.jcu.edu.au/conferences-workshops/2012-remotely-interested/Program/S1/tony-lower.pdf, accessed 5 July 2013
NSW Child Death Review Team | Annual Report 2012
83
Safety considerations
Research suggests that helmet use with all-terrain vehicles reduces the risk of death by 42 per cent.107 Helmet use was able to
be ascertained for four of the six children: two children were wearing a helmet at the time of the fatality.
The majority (5) of the children who died in quad bike incidents were with, or watched by, adults. Three children were travelling
with adults, and two were riding by themselves but with adults nearby. One child had no adult supervision.
18.3.3 Side-by-side vehicle fatalities
Side-by-side vehicles are other small vehicles designed for off-road use. They are called side-by-side vehicles because they
are designed to transport at least two people who sit ‘side-by-side’.108
They have four tyres, tend to have a bench-type seat and a steering wheel, and generally have a small tray. Many have a roll
cage and seat belts.109 The Centre for Agricultural Health and Safety has noted that, while side-by-side vehicles are not as
common as quad bikes on Australian farms, they are increasingly being used as ‘a safer option’.110
In 2003-2012, four children in NSW died in side-by-side vehicle incidents. The vehicles included two ‘traditional’ side-by-side
vehicles, a dune buggy and an ex-army vehicle. Three of the four fatalities occurred in the last two years (2011 and 2012).
The children were aged between nine and 16 years, with an average age of 11.75 years. All were male.
Two children (aged nine and 11 years) were driving the vehicle at the time of the fatality. The other two children were
passengers in side-by-side vehicles; one in a seat, and one in the vehicle tray. Both were driven by adults.
All of the side-by-side fatalities occurred on rural properties.
Activity and injury
In all four fatalities, the vehicle rolled over or tipped.
Two of the children died in separate incidents involving a homemade ‘race-track’. In both cases, the vehicle made contact with
the edge of the track and tipped over. One child was a passenger and the other was a driver.
One child was on the vehicle with several other young people and was going up a steep incline. The other fatality occurred in a
paddock/yard – the area was relatively flat and it is unclear how the vehicle came to tip over.
The injuries sustained in the incidents that resulted in the children’s deaths were primarily severe head injuries (3), and crush
injuries to the child’s chest (1).
Safety considerations
None of the children were wearing a helmet at the time of the fatality. While three of the side-by-side vehicles had seatbelts,
they were not used by the children who died.
Two fatalities occurred while the vehicle was being driven by an adult. The other two children (aged nine and 11 years) did not
have adult supervision at the time of the incident
18.3.4 Other off-road vehicle fatalities
Over the 10 years, two young people died while using less common off-road vehicles: a go kart and a tractor. Both were
driving the vehicle at the time of the fatality.
The go kart rider was wearing full protective equipment, including a helmet.
18.4 Factors associated with off-road vehicle fatalities
Research has identified a number of risk factors that are associated with an increased likelihood of off-road vehicle fatalities:
107 Rodgers G. 1990, The effectiveness of helmets in reducing all-terrain vehicle injuries and deaths, Accident Analysis and Prevention, 22: 47–58.
108 Roads and Maritime Services 2012, Conditional registration guide (vehicle sheet):ultra-light vehicle, Sydney: RMS
http://www.rta.nsw.gov.au/registration/downloads/vehiclesheet/ultra_light_utility_vehicle_sheet.pdf, accessed 5 June 2013.
109 Australian Centre for Agricultural Health and Safety 2011, Safety of quad bikes and Side-by-Side Vehicles on Australian Farms – A practical
management guide, Moree, NSW: University of Sydney.
110 Australian Centre for Agricultural Health and Safety 2011, Safety of quad bikes and Side-by-Side Vehicles on Australian Farms – A practical
management guide, Moree, NSW: University of Sydney.
84
NSW Child Death Review Team | Annual Report 2012
• uneven or bumpy ground111
• slopes and steep inclines112
• low skill/experience of driver113
• being under 16 years of age114
• having a passenger115
• overloading the vehicle116
• not wearing a helmet117
• riding without other people nearby and/or having a delay in accessing emergency services118
• excessive speed,119 and
• alcohol or drug consumption.120
The above factors were common in the off-road vehicle incidents that resulted in the deaths of children in 2003-2012, and the
vast majority (22) involved two or more risk factors.
Some of the risk factors are particularly acute for children riding off-road motorcycles – the terrain is invariably bumpy, the
activity typically involves high speed, and there are considerable practical challenges in supervising the activity and facilitating
access to emergency services.
However, the risks are also serious for quad bikes and side-by-side vehicles. While these vehicles have been called ‘allterrain’ machines, this is not the case. The NSW Government has indicated that the term ‘is now discouraged as it gives a
false impression of the performance capabilities of these vehicles.’121 A 2009 Victorian Coroner’s inquest into eight quad bike
fatalities recommended that quad bikes not be described as all terrain vehicles, as ‘[s]o described, a false impression is
created, which warnings are unable to erase.’122 Many terrains pose a rollover risk for quad bikes and side-by-side vehicles,
including slopes, rough and rocky ground, tussocky vegetation, contour banks and dam banks.123
There is wide acknowledgement that off-road vehicles require skill to operate safely,124 and that children are at increased risk of
serious injury and death from off-road vehicle incidents. In terms of risks, age has been identified as more important than size
and weight,125 with the operation of many off-road vehicles noted to be beyond the physical capabilities of children.126 Two-thirds
of the off-road vehicle fatalities in NSW in 2003-2012 involved children aged 14 years and younger.
While the amount of adult supervision was low in relation to the children who died in off-road motorcycle fatalities, this was not
the case for children involved in quad bike and side-by-side vehicle fatalities. Most of the children who died in these incidents
111 Fragar L. & Pollock K. 2007, All-terrain Vehicle (Quad bike) Safety on Australian Farms Briefing Paper, Moree, NSW: Farmsafe Australia Reference
Group on Quad bike Safety; Milosavljevic S. McBride D. Bagheri N. Vasiljev R. Carman A. Rehn B. & Moore D. 2011, Factors associated with quad
bike loss of control events in agriculture, International Journal of Industrial Ergonomics 41(3): 317-321.
112 Fragar L. & Pollock K. 2007 op. cit.; Milosavljevic S. et al. 2011, op. cit.; and WA Department of Health, op cit.
113 Bevan C. Babl F. Bolt P. & Sharwood L. 2008, The increasing problem of motorcycle injuries in children and adolescents, Medical Journal of
Australia 189(1): 17-20; and O’Connor T. Hanks H. & Steinhardt D. 2009, All-terrain vehicle crashes and associated injuries in North Queensland:
findings from the Rural and Remote Road Safety Study, Australian Journal of Rural Health 17(5): 251-256.
114 Queensland Commission for Children and Young People and Child Guardian 2012, Issues paper number 9: child deaths - quad bike deaths in
Queensland, Brisbane: CCYPCG, http://www.ccypcg.qld.gov.au/pdf/publications/papers/trends-and-issues/Issues-Paper-no-9-Quad-bikes.pdf,
accessed 4 June 2013.
115 Curran J. & O’Leary C. 2012, Paediatric Trauma Associated with All-Terrain Vehicles, Irish Medical Journal, 105(7): 55-57; O’Connor et al. 2009, op cit.
116 Fragar, L. & Pollock, K. 2007, op cit.
117 Rodgers G. 1990, The effectiveness of helmets in reducing all-terrain vehicle injuries and deaths, Accident Analysis and Prevention 22: 47–58; and
Keenan H. & Bratton S. 2004, All-terrain vehicle legislation for children: a comparison of a state with and a state without a helmet laws, Paediatrics
113: e330-e333.
118 WorkSafe Victoria 2011, Quad bikes on farms, Melbourne: WorkSafe Victoria, http://www.worksafe.vic.gov.au/forms-and-publications/forms-andpublications/quad-bikes-on-farms, accessed 6 June 2013.
119 Milosavljevic S. et al. 2011, op. cit.
120 Hall A. Bixler D. Helmkamp J. Kraner J. & Kaplan J. 2009, Fatal all-terrain vehicle crashes: injury types and alcohol use, American Journal of
Preventive Medicine, 36(4): 311–316; and Curran J. & O’Leary C. 2012, op cit.
121 NSW Department of Premier and Cabinet 2013, Submission by NSW Government in response to The Parliamentary Joint Standing Committee on
Road Safety (Staysafe) Inquiry into Non-Registered Motorised Vehicles, Submission No 66, p. 17.
122 Australian Centre for Agricultural Health and Safety 2011, Safety of quad bikes and Side-by-Side Vehicles on Australian Farms – A practical
management guide, Moree, NSW: University of Sydney, p. 12.
123 Australian Centre for Agricultural Health and Safety 2011, op. cit.
124 Coroners Court of Victoria 2011, Finding into death without inquest, Coroners Case 958/2011, Angus William Wilson
125 Australian Centre for Agricultural Health and Safety 2011, op. cit.
126 Safe Work Australia 2012, Design and engineering controls for improving quad bike safety: key findings from the discussion paper and forum,
Canberra: Safe Work Australia.
NSW Child Death Review Team | Annual Report 2012
85
had adults with them or nearby, but this did not mitigate the significant risks involved. Very young children, including toddlers,
were drivers and passengers of these vehicles; the use of helmets and other safety equipment was low; and most of the quad
bikes carried loads, including child passengers.
18.5 Prevention measures
18.5.1 Countermeasures
Quad bike manufacturers provide labels or decals on quad bikes warning of the dangers to child operators,127 including that
children under the age of 16 must ‘never operate’ the vehicle, and that use by such children increases their chance of severe
injury or death.128 Manufacturers also recommend that passengers not be carried on quad bikes.129
However, information relating to the deaths of children in off-road vehicle incidents over the past 10 years indicates that
additional strategies are required. The key areas that have been identified as necessary to prevent death and serious injury of
children relating to the use of off-road vehicles include:
• greater public awareness of the dangers of off-road vehicles – including the use of quad bikes by children, inclusion of
passengers, and instability of the vehicles
• introduction of engineering controls – including fitment of crush protection devices/ roll over protective structures to quad
bikes; and measures to prevent operation of the vehicles by children, such as weight sensors on seats, and coded starting
systems, and
• introduction of administrative controls – such as vehicle registration; rider training and licensing; and requirements relating
to a minimum age of 16 years, no passengers, and mandatory use of personal protection, such as helmets.
While the use of off-road vehicles on roads and road related areas130 requires licensing and vehicle registration, there is no regulation
of the recreational use of off-road vehicles on private property. For example, there are no legislative requirements for recreational
riders of off-road vehicles on private properties, including quad bikes and motorcycles, to wear a helmet or be of a minimum age.
Riders of motorcycles on NSW roads are required to obtain a licence by completing various stages of training and testing, and
to have at least three years of experience before graduating to a full rider licence. To obtain a learner rider licence, a person
must be at least 16 years and nine months of age, complete a pre-learner training course, and pass a rider knowledge test. In
contrast, there are no licensing or training requirements or tests for children to be able to ride motorcycles off-road on private
property, and no minimum age requirements for riders.
In recent public appeals for greater protection of children in relation to off-road vehicle incidents, doctors and other emergency
medical staff have emphasised that adults should not allow unlicensed or inappropriate use of motorised vehicles and, when
used by children of an appropriate age, they should ensure that safety precautions used on roads – helmets and protective
clothing – are also observed off-road.131
In February 2013, the NSW Parliament Staysafe (Road Safety) Committee commenced an inquiry to review and report on the
increasing use of non-registered motorised vehicles on public roads and footpaths and their impact on road safety. Amongst
other things, the inquiry includes consideration of:
• the adequacy of data collection for injury and fatality rates arising from the use of non-registered motorised vehicles
• the extent and effectiveness of education and the necessity for skills and competency training for users of these vehicles, and
• initiatives taken by local Councils and other jurisdictions to certify, register and regulate the use of currently non-registered
motorised vehicles.
• Actions have been taken in recent years to improve the collection and analysis of information about off-road vehicle
incidents. QuadWatch, managed by Safe Work Australia, collects and reports on quad bike fatalities in Australia, and the
quad bike Product Stewardship Program enables users of quad bikes to report safety incidents and near-misses.132
127
128
129
130
Australian Centre for Agricultural Health and Safety (2011) op. cit.
Coroners Court of Victoria 2011, op. cit.
Mount Isa Centre for Rural & Remote Health 2012, Mount Isa Statement on Quad Bike Safety – 2012 media release 3 August 2012.
Roads and road related areas mean any area that is publicly accessible to vehicles, including roads, the road shoulder, car parks, fire trails, state
forests, and recreation areas. http://www.rta.nsw.gov.au/licensing/downloads/motorcycle_riders_handbook.pdf, accessed 11 July 2013.
131 Duke T. 2013, Farm bike rules must change to protect children, Herald Sun, 20 May 2013.
132 Safe Work Australia 2013, Quad bike stewardship program, Canberra: Safe Work Australia, http://www.safeworkaustralia.gov.au/sites/swa/whsinformation/agriculture/quad-watch/quad-stewardship-program/pages/quad-bike-stewardship-program
86
NSW Child Death Review Team | Annual Report 2012
The Centre for Road Safety (CRS) has indicated that its new database system, CrashLink 2, will enable recording and reporting
of off-road incidents that are reported to police, including provision of an off-road crash data summary on its new website.
Quad bikes will be reported as a separate category of road users.133 CRS has advised the Team that, in 2012, the UNSW
Transport and Road Safety Research group completed a data linkage of the NSW crash database to health and emergency
data and Births, Deaths and Marriages data in 2001-09, and that analysis of this linked data would include off-road incidents
that are not reported to police.134
The Quad Bike Performance Project (run by UNSW Transport and Road Safety on behalf of WorkCover NSW and the Heads of
Workplace Safety Authorities) is undertaking crash performance testing and research on quad bikes and side-by-side vehicles
to develop a testing and rating system for rollover stability, handling and crashworthiness. The project is also collecting injury
and fatality data, and preliminary analysis of the data has raised concerns that ‘the significant portion of riders killed and
injured are children under the age of 16.’135 The first stage of testing commenced in March 2013.
18.5.2 Current prevention measures
Current prevention measures associated with off-road vehicles are primarily focused on the use of quad bikes.
While there is consensus amongst stakeholders that operation of adult-sized quad bikes is beyond the physical capabilities
of children, and children should be prevented from using adult quad bikes, there is no consensus on the use of small size
quad bikes.136 Manufacturers support children using quad bikes of an ‘appropriate size’,137 while researchers, health and safety
experts and other stakeholders consider that there is no place for children under the age of 16 years on quad bikes.138
The Commonwealth Government has indicated that the responsibilities of quad bike users are to ‘wear a helmet, not to carry
passengers and not to let children ride quad bikes’, and has indicated that Safe Work Australia will work with state and territory
regulators to institute a ban on children under 16 years operating a quad bike of full size in a workplace.139 At present, there is
no agreement about how to prevent children from using quad bikes for recreational purposes, other than ongoing education of
parents to control child access to the vehicles.140
A range of organisations are involved in promoting quad bike safety, including FarmSafe and the Australian Centre for
Agricultural Health and Safety. Guidelines and recommendations for safe quad bike use have been issued by agencies such
as the Royal Australasian College of Surgeons, WorkCover NSW, the Australian Competition and Consumer Commission, the
Queensland Commission for Children and Young People and Comcare.
There does not seem to be a current focus on measures to prevent deaths of children in off-road motorcycle incidents.
While there is considerable work underway to reduce fatalities and serious injuries associated with quad bike use on farms in
a work setting, the Team’s review of off-road vehicle fatalities of children has identified that the vast majority of these deaths
occurred in a recreational context and were not limited to farms.
The review highlights the need for a specific focus on measures to prevent the deaths of children associated with the use of
off-road vehicles, beyond the bounds of work safety. The Team notes that there is currently no one agency in NSW that has
responsibility for matters relating to the recreational use of off-road vehicles in an off-road setting (including private property),
which presents a significant challenge in seeking to address these issues.
133 NSW Department of Premier and Cabinet 2013, Submission by NSW Government in response to The Parliamentary Joint Standing Committee on
Road Safety (Staysafe) Inquiry into Non-Registered Motorised Vehicles, Submission No 66, p. 17. Sydney: DPC.
134 Centre for Road Safety advice to the CDRT, 28 May 2013.
135 Transport and Road Safety (TARS) Research UNSW 2013, Submission to the Staysafe Committee Inquiry into Non-Registered Motor Vehicles,
Submission No 60, p. 5. Sydney: UNSW.
136 Safe Work Australia 2012, Design and engineering controls for improving quad bike safety: key findings from the discussion paper and forum,
Canberra: Safe Work Australia.
137 Ibid.
138 Ibid.; Australian Council of Trade Unions 2013, No more excuses: Quad Bikes without Crush Protection Devices should not be operated media
release, 2 May 2013, Melbourne: ACTU; Farmsafe Australia 2013, Quadbike and Vehicle Safety, Moree, NSW: ACAHS, http://www.farmsafe.org.
au/index.php?article=content/for-farmers/quadbike-and-vehicle-safety, accessed 6 July 2013; and Royal Australasian College of Surgeons 2013,
Position Paper, submission to NSW Parliament Inquiry into non-registered motor vehicles, Submission No 73, Melbourne: RACS.
139 Minister for Employment and Workplace Relations, Financial Services and Superannuation, Bill Shorten 2012, Quad bike safety media release,
19 December 2012.
140 Safe Work Australia 2012, op. cit.
NSW Child Death Review Team | Annual Report 2012
87
Recommendations
Department of Premier and Cabinet
7. The Department of Premier and Cabinet (DPC) should bring together key injury prevention and regulatory
agencies to consider the findings of this report to identify whether specific strategies are needed in NSW to
reduce the risk of death and injury of children in relation to off-road vehicle incidents. In particular, DPC, with
agencies, should consider:
(a)existing or planned initiatives within NSW and at the national level
(b)the need for targeted research, including environmental and vehicle design elements of prevention and
attitudinal research relating to parent and carer perceptions of risk
(c) the need for public awareness strategies, including print and electronic media resources that recognise the
behavioural, environmental and vehicle design elements of prevention, and
(d)the need for regulation of the recreational use of such vehicles on private property, including licensing,
registration, and requirements relating to safety equipment such as helmets.
8. DPC should provide detailed advice to the Team on the outcomes of this work, including identified strategies
and how they will be progressed.
88
NSW Child Death Review Team | Annual Report 2012
Chapter 19. Drowning
In 2012, the drowning deaths of 11 children were registered in NSW. This is the lowest number of deaths due to drowning since
2005, and represents a rate of 0.67 deaths per 100,000 children in NSW.
Drowning was the second most common unnatural unintentional cause of death of children in NSW. Overall, it was the third
leading external cause of death, after transport fatalities and suicide. It was the leading external cause of death for children
aged 1-4 years.
The 11 children drowned in:
• private swimming pools (4)
• natural bodies of water (4), including ocean (2), a lake and a river
• bathtubs (2), and
• an irrigation channel.
The drowning deaths of two of the 11 children reported here are also ‘reviewable’ deaths and will also be reviewed separately
by the Ombudsman.
19.1 Trends in drowning deaths of children in NSW, 1998-2012
Table 62 shows the trends in drowning deaths of children in 1998-2012, by incident location. Over the 15 years, the drowning
deaths of 281 children were registered in NSW. There has been a downward trend in the overall drowning rate of children in
NSW over that time, with an average mortality rate of approximately 1.15 deaths per 100,000 children.
Over the past 15 years, most drowning deaths have occurred in private pools (39%), natural inland bodies of water (16%),
and bathtubs (15%).
Table 62: Trends in deaths of children due to drowning by location – deaths registered 1998-2012,
number and (crude mortality rate)
1998
1999
2000
2001
2002
2003
2004
2005
2006
2007
2008
2009
2010
2011
2012
Total
Pool
(private)
5
(0.3)
8
(0.5)
8
(0.5)
4
(0.2)
11
(0.7)
10
(0.6)
7
(0.4)
5
(0.3)
6
(0.4)
13
(0.8)
12
(0.7)
6
(0.4)
6
(0.4)
5
(0.3)
4
(0.2)
110
Natural
inland
(river,
creek,
lake)
6
(0.4)
10
(0.6)
5
(0.3)
4
(0.2)
2
2
2
1
1
-
-
4
(0.2)
52
-
4
(0.4)
2
-
4
(0.2)
2
-
3
(0.2)
-
-
Bathtub
7
(0.4)
4
(0.3)
2
2
4
(0.2)
3
(0.2)
2
1
2
1
2
-
-
-
-
-
-
3
(0.2)
2
-
6
(0.4)
1
-
Natural
coastal
(ocean,
beach,
estuary)
3
(0.2)
5
(0.3)
2
4
(0.2)
5
(0.3)
5
(0.3)
2
0
1
2
2
0
1
-
-
-
-
-
-
3
(0.2)
2
-
Dams
5
(0.3)
2
1
3
(0.2)
1
0
1
0
0
0
1
2
0
-
3
(0.2)
1
-
-
-
-
-
-
-
-
-
-
-
Pool
(public)
0
1
1
1
0
0
0
3
2
1
0
0
0
0
0
-
-
-
-
-
-
-
-
-
-
-
-
-
-
-
Other
0
2
1
0
2
0
1
0
0
0
1
1
0
2
1
-
-
-
-
-
-
-
-
-
-
-
-
-
-
-
26
(1.6)
32
(2.0)
20
(1.2)
18
(1.1)
29
(1.8)
22
(1.4)
16
(1.0)
10
(0.6)
15
(0.9)
18
(1.1)
21
(1.3)
12
(0.7)
14
(0.9)
17
(1.0)
11
(0.7)
All
-
42
37
-
20
9
11
281
* Other includes drains, toilets, culverts, sewers, troughs, buckets, etc.
NSW Child Death Review Team | Annual Report 2012
89
19.2 Demographic and individual characteristics, 2012
Table 63 provides an overview of the key demographic characteristics of the 11 children who drowned and whose deaths were
registered in 2012.
Table 63: Key demographic and individual characteristics – deaths of children due to drowning, 2012
Number
Percent
Crude
Mortality Rate
95% Confidence
Interval
11
100
0.67
0.33 - 1.20
Total
Incident
Rate Ratio
p
Gender
Female
2
18
-
-
-
-
Male
9
82
1.07
0.49 - 2.02
4.26
0.0222
Age
Under 1 year
1
9
-
-
-
-
1-4 years
6
55
1.57
0.58 - 3.42
-
-
5-9 years
2
18
-
-
-
-
10-14 years
1
9
-
-
-
-
15-17 years
1
9
-
-
-
-
10
91
0.64
0.31 - 1.17
-
-
1
9
-
-
-
-
Major cities
7
64
0.59
0.24 - 1.22
Inner regional areas
2
18
-
-
-
-
Outer regional areas
2
18
-
-
-
-
Remote
0
0
-
-
-
-
Very remote
0
0
-
-
-
-
Quintile 5 (highest)
4
40
0.99
0.27 - 2.53
-
-
Quintile 4
1
10
-
-
-
-
Quintile 3
2
20
-
-
-
-
Quintile 2
1
10
-
-
-
-
Quintile 1 (lowest)
2
20
-
-
-
-
Aboriginal and Torres Strait Islander status
Not Aboriginal or Torres Strait Islander
Aboriginal or Torres Strait Islander
Remoteness
Socioeconomic status*
* Socioeconomic status was not calculated in one case.
19.2.1 Age, gender and Aboriginal and Torres Strait Islander status
In 2012, the rate of death of males from drowning was four times that of females. This is consistent with the over-representation
of boys in drowning deaths over the past 15 years, as shown in table 64.
One of the children who drowned in 2012 was of Torres Strait Islander descent. This is a notable decrease from 2011, when
seven Indigenous children drowned.
Table 64: Trends in drowning deaths of children by gender, 1998-2012, number and (Crude Mortality Rate)
90
1998
1999
2000
2001
2002
2003
2004
2005
2006
2007
2008
2009
2010
2011
2012
Total
Female
12
(1.6)
9
(1.2)
3
(0.4)
7
(0.9)
8
(1.0)
5
(0.6)
8
(1.0)
5
(0.6)
3
(0.4)
8
(1.0)
7
(0.8)
6
(0.4)
3
(0.4)
4
(0.5)
2
(0.3)
90
Male
14
(1.7)
23
(2.8)
17
(2.1)
11
(1.3)
21
(2.5)
17
(2.1)
8
(1.0)
5
(0.6)
12
(1.5)
10
(1.7)
14
(1.7)
6
(0.7)
11
(1.3)
13
(1.5)
9
(1.1)
191
Both
26
(1.6)
32
(2.0)
20
(1.2)
18
(1.1)
29
(1.8)
22
(1.4)
16
(1.0)
10
(0.6)
15
(0.9)
18
(1.1)
21
(1.3)
12
(0.7)
14
(0.9)
17
(1.0)
11
(0.7)
281
NSW Child Death Review Team | Annual Report 2012
Consistent with previous years, the majority of the children who drowned in 2012 were very young. Almost two-thirds (7) were
four years of age or younger, including four children who were one year of age or less.
As the Team has noted previously, age is strongly linked to the location of drowning in bathtubs and private swimming pools. In
2012, both children who drowned in bathtubs (2) were one year of age or younger, and the vast majority (3) of the four children
who drowned in private swimming pools were younger than four years of age.
The age of children who have drowned in natural bodies of water tends to vary. In 2012, deaths from drowning in natural
bodies of water occurred across all age groups.
Figure 6: Location of drowning fatality by age, 2012
Key
Swimming
pools
0-4
Natural
water
5-9
10-14
15-17
Bathtubs
0.0
0.5
1.0
1.5
2.0
2.5
3.0
3.5
4.0
4.5
Number of deaths
19.2.2 Remoteness and socioeconomic status
In 2012, four of the 11 drowning deaths were children from families in areas of highest socioeconomic advantage, and seven
out of the 11 drowning deaths occurred in a major city. These statistics do not follow any particular pattern over the last 15
years, and differ for statistics in 2011, and 2010.
19.2.3 Child protection history
Families of three of the 11 children who drowned had a child protection history. All three children drowned in swimming pools.
Within the three years prior to their death, two children had been the subject of a report of risk of harm or risk of significant
harm to Community Services, and one child had siblings who were the subject of a report. The reported risks related to
absconding behaviours of the children (2) and lack of supervision (1). Inadequate supervision was a factor in the deaths of
each of these children.
19.3 Private swimming pools
In 2012, four children drowned in swimming pools. All of the deaths occurred in permanent in-ground pools. The children
ranged from one to eight years of age.
Over the 15 years between 1998 and 2012, the number of swimming pool drowning deaths has ranged from four to 14 per
year. The four deaths in 2012 represent the lowest number of swimming pool drowning deaths in 15 years.
In 2012, half of the drowning deaths in private swimming pools occurred at the child’s own residence. One child drowned in a
pool at a family friend’s residence, and one occurred at a neighbour’s residence that was unfamiliar to the child.
In relation to access to the pools, one child was at an age where they were able to access the pool, one pool had a broken
side gate, and two pools were unfenced.
All four children were out of sight of adults for periods ranging from five minutes to over an hour. The supervising adults of
two children were occupied at the time of the fatality for a short period of time: one parent believed their child to be safe with
another adult, and one parent was aware the child was in and around water without supervision.
Charges of manslaughter were laid and subsequently dropped in relation to one of the swimming pool deaths in 2012. The
child had accessed the poorly fenced pool of a neighbour.
NSW Child Death Review Team | Annual Report 2012
91
Figure 7: Swimming pool drowning deaths, 1998 - 2012
16
14
12
10
8
6
4
2
2012
2011
2010
2009
2008
2007
2006
2005
2004
2003
2002
2001
2000
1999
1998
0
Year
19.3.1 Factors associated with drowning in swimming pools and
prevention measures
Children under the age of five are most at risk of drowning, and swimming pools located at the properties where children live
or visit regularly pose the highest risks. Key factors in the drowning deaths of children in private swimming pools relate to the
adequacy of adult supervision and the adequacy of pool barriers to prevent unsupervised access.
In 2013, the Coroner held an inquest into the death of a child in a private swimming pool in 2011, and made recommendations
aimed at improving pool safety for children in foster care. The recommendations focused on the need for all care agencies
in NSW to ensure that new foster carers at residences with swimming pools provide a certificate of compliance under the
Swimming Pools Act 1992 before being authorised as a carer; and that home visits conducted by providers involve monthly
observations of the state of any swimming pool and its safety adherence.
In 2012, the NSW Government amended the Swimming Pools Act 1992. The amendments are intended to increase safety
around backyard swimming pools, and to reduce drowning and near-drowning incidents by including new obligations,
responsibilities and accountability for people with swimming pools. Key changes include requirements for:
• pool owners to register their pools on an online register by 29 October 2013
• pool owners to include a valid certificate of compliance141 or a relevant occupant certificate142 if they sell or lease their
property from 29 April 2014, and
• local councils to develop a pool inspection program to ensure compliance with the Swimming Pools Act.
The NSW Swimming Pools Register opened on 29 April 2013. Royal Life Saving has started a public education campaign to
ensure that the public understand their responsibilities in relation to the amended legislation, and there are implementation
workshops for Council staff responsible for checking compliance.
In January 2013, the Australian Competition and Consumer Commission released the Consumer Goods (Portable Swimming
Pools) Safety Standard 2012 (Cth), which covers labelling requirements for portable swimming pools. The Standard comes into
effect on 30 March 2014, and includes requirements to warn users that children have drowned in portable swimming pools, that
there must be active arms-length adult supervision at all times, and that the pools should be drained and put away after use.143
19.3.2 The Team’s recommendations
Last year, following a 10-year review of swimming pool drowning deaths of children, the Team made eight recommendations to
improve pool safety and compliance with requirements.
A key focus of the recommendations included the need for Councils to be able to identify properties with swimming pools
141 Pool owners can request the local council or an accredited certifier to inspect the pool for the purpose of obtaining a certificate of compliance.
This certificate is valid for three years and states that the swimming pool is registered and complies with the requirements under the Act.
142 A relevant occupation certificate is an occupation certificate issued under the Environmental Planning and Assessment Act 1979 that is less than
three years old and that authorises the use of the swimming pool.
143 Product Safety Australia 2013, Portable Swimming Pools, Canberra: Australian Competition and Consumer Commission:
http://www.productsafety.gov.au/content/index.phtml/itemId/998360, accessed 9 July 2013.
92
NSW Child Death Review Team | Annual Report 2012
where young children reside or regularly visit, in order to prioritise those premises for inspection. The Division of Local
Government has indicated that Councils have access to demographic information that will assist them in assessing risk
factors and prioritising inspections, and that it encourages Councils to target resources towards swimming pools used by
young children. However, further information is required by the Team to ascertain the adequacy of the proposed measures for
addressing the intent of the recommendations.
The Division of Local Government has advised that the Swimming Pools Regulations will give effect to the Team’s
recommendation that Councils be required to report annually on compliance with the requirements of the Swimming Pools Act.
However, the timeframe for release of the Regulations has yet to be advised.
The Team also made recommendations aimed at ensuring the development of a comprehensive education and awareness
campaign to accompany the amendments to the legislation, including strategies targeting lessees of rental properties. The
Division of Local Government advised the Team of an ongoing campaign that is being conducted with Royal Life Saving
Australia (NSW) and other stakeholder agencies, including the development of resources in 16 community languages and
multimedia platforms. The Division has indicated that the next phase of the work will include the development of specific
resources for lessees of public and private properties.
Recommendations
Department of Premier and Cabinet, Division of Local Government
9. In relation to targeting swimming pool inspection programs to pools at premises where children, particularly
those under five years of age, reside or regularly visit, the Division of Local Government should:
(a)provide detailed advice to the Team as to the demographic information available to Councils that will
enable them to identify and prioritise the inspection of the pools of these premises, and how the Division
encourages Councils to target resources towards swimming pools used by young children, and
(b)provide a copy of the Division’s guidelines to assist Councils to develop their pool inspection programs.
10.The Division of Local Government should advise the Team of the timeframe for issuing the Swimming Pools
Regulations.
11.In relation to the development of targeted educational resources in relation to the Swimming Pools Act
amendments and safety requirements, the Division of Local Government should provide detailed advice to the
Team on progress with:
(a)the education and awareness campaign it is conducting with Royal Life Saving Australia (NSW) and other
stakeholder agencies, and
(b)the development of specific resources for lessees of rental properties on the legal and safety requirements
for installing an above-ground or inflatable pool at rented premises.
19.4 Natural bodies of water
Four children drowned in natural bodies of water, including ocean (2), an inland lake and a river. Environmental conditions
contributed to each of the deaths, including strong tides and rips, low visibility, strong winds and turbulent water. Two of the
deaths occurred in boating incidents, and two occurred during recreational swimming.
19.4.1 Boating
In 2012, two children drowned after boats capsized. In both cases, boating conditions were affected by strong winds and
turbulent water. In one of the deaths, the turbulence of the water was related to recent rainfall and a dam release. The children
were four and 13 years of age.
Office of Boating Safety and Maritime Affairs data indicates that, in the boating fatalities since 2000, less than five per cent of
the people who drowned wore lifejackets.144 Of the two children who drowned in boating incidents in 2012, one was wearing
a personal flotation device, and was in the boat with other adults. The other child was not wearing a personal flotation device,
and was self-supervising with a peer. Neither child was a strong swimmer.
144 The Office of Boating Safety and Maritime Affairs 2012, Boating Safety Communications & Education Strategy 2012-2015, Sydney: Transport for NSW,
http://www.transport.nsw.gov.au/sites/default/files/b2b/publications/2012-15-boating-safety-communications-and-education-strategy.pdf,
accessed 16 July 2013.
NSW Child Death Review Team | Annual Report 2012
93
19.4.2 Recreational activities
Two children drowned while they were swimming or playing with others in the ocean. Both were at beaches known to have
strong rips. The children were eight and 15 years of age.
One child who was swimming with peers at a patrolled beach, but outside of the flagged area. At the time of the child’s death,
there were additional environmental factors of winds and an outgoing tide that contributed to minimal visibility in the water
and hazardous conditions. The other child was swimming at a beach that was not patrolled at the time, and was intermittently
supervised by adult family friends. The child was not a strong swimmer.
19.4.3 Factors associated with drowning in flood waters and
prevention measures
Boating
The Team’s reviews continue to highlight the risks associated with the absence of life jackets. Children have a higher likelihood
than adults of being unable to cope once in difficulty in the water.
In November 2010, the rules governing the use of lifejackets on recreational vessels on NSW navigable waters were strengthened.
Requirements include that children under the age of 12 must wear a lifejacket at all times in a vessel less than 4.8 metres.145
Last year, the Team recommended that NSW Transport: Office of Boating Safety and Maritime Affairs (OBSMA) should provide
advice about its strategies to promote boating water safety, particularly in relation to the safety of children and young people
on boats, and education about new life jacket regulations.
OBSMA advised that it has enforced sanctions for breaches, and has developed a Boating Safety Education and
Communication Strategy 2012-2015, which includes a focus on wearing lifejackets. OBSMA reported that the strategy has seen
the largest public awareness campaign for lifejackets, which ran from December 2012 to Easter 2013. The agency has linked
to a range of stakeholders to promote life jackets use, and has funded the distribution of almost 5,000 life jackets.
Further information regarding OBSMA’s response is provided in Chapter 23.3.
19.5 Rural waterways
In 2012, a young child died in an irrigation channel on a rural property. The child was with a sibling and friends, and was
intermittently supervised. Unlike previous years, there were no drowning fatalities involving dams.
The Australian Centre for Agricultural Health and Safety (AgHealth) has noted that drowning is the number one cause of child
farm fatality in Australia, and that children under five years are at greatest risk. ‘Safe play’ fenced areas on rural properties are
promoted as a key child safety measure.146 Farmsafe Australia has produced a resource package to inform carers of children
on farms about safe play areas.147
19.6 Bathtubs
The deaths of two children who drowned in bathtubs were registered in 2012. Both children were very young, and were
dependant on adults for care. The children were at their family residence, and were not directly supervised by an adult at the
time of the fatality.
One child had been placed in the bathtub by the carer, and the other child had been left to play with siblings and accessed the
undrained bathtub without the knowledge of the carer. Available information indicates that both children were unsupervised for
at least 10 minutes.
As shown in table 65, 21 children in NSW drowned in bathtubs in the 10 years to 2012. Almost three-quarters (15) of the
children were under two years of age, and six children were four years of age or older. The older children were noted to have
had epilepsy (3), cognitive impairment (2) and/or had a recent illness (2) at the time of the fatality.
145 NSW Marine Safety (General) Regulation 2009.
146 Australian Centre for Agricultural Health and Safety 2013, Child safety on farms, Moree NSW: University of Sydney.
http://www.aghealth.org.au/index.php?id=5049, accessed 9 July 2013
147 Rural Industries Research and Development Corporation 2005, Safe play areas on farms: A resource package, Version 2, Barton ACT: RIRDC,
http://www.aghealth.org.au/tinymce_fm/uploaded/fs_docs/Child%20Safety/aghealth_spa_booklet.pdf, accessed 16 July 2013.
94
NSW Child Death Review Team | Annual Report 2012
Of the 15 children under the age of two years, just over half (8) were younger than 12 months. The vast majority (13) of the 15
children had been placed in the bath by their carer/adult supervisor, and were unsupervised at the time of the fatality. The other
two children accessed bathtubs that contained water, without the carer’s knowledge.
Table 65: Bathtub drowning deaths by age range, 2003-2012
Age range
Number of children
Under three months
2
3 months to under 6 months
nil
6 months to under 12 months
6
12 months to under 2 years
7
2-4 years
1
5-9 years
4
10-17 years
1
Total
21
Supervision was a relevant factor in all of the deaths of children under the age of two years who drowned in bathtubs in NSW
in 2003-2012.
Information relating to the length of time children were unsupervised was available for eight children. As shown in the figure
below, most (5) were unsupervised for less than five minutes.
Figure 8: Bathtub drowning deaths of children under two years of age, 2003-2012, length of time unsupervised
6
Number of Deaths
5
4
3
2
1
0
≤ 5 minutes
≤ 15 minutes
≥ 20 minutes
Time (minutes)
Reasons why parents or caregivers had left the child unattended included:
• preparation of food/formula (3)
• fell asleep in the bathroom (3)
• left child with sibling (3)
• went to the toilet (1), and
• gave child additional playtime in the bath (1).
Relevant factors in the above matters included that children were left with young siblings (aged 2-5 years), or had been left in
a bath that was not completely drained of water. Alcohol was a factor in two of the three fatalities in which the carer fell asleep
while in the bathroom with the child.
NSW Child Death Review Team | Annual Report 2012
95
19.6.1 Factors associated with bathtub drowning, and prevention measures
Royal Lifesaving Australia reports that, on average, five children under the age of five drown and 47 are hospitalised due to
bathtub drowning incidents in Australia each year. The majority of bathtub drowning deaths are of children less than two years
old who were already in the bathtub when they drowned.148
Prevention measures focus on ensuring constant and arms-length adult supervision of young children in the bath, and
restricting access to bathtubs without supervision. Royal Lifesaving Australia’s Keep Watch @ Bath Time resources provide
clear guidance for carers on preventing bathtub drowning deaths. The resources include a checklist of actions carers should
take, including having everything ready for bathing before entering the bathroom, and leaving the bathroom with taps turned
off, plug removed, bathtub drained and door closed.149
148 Royal Lifesaving Society Australia 2013, Keep watch @ bath time, Deakin, ACT: RLSA,
http://www.royallifesaving.com.au/programs/keep-watch-toddler-drowning-prevention-program, accessed 9 July 2013.
149 Royal Life Saving Society Australia 2013, Keep Watch @ Bath Time (brochure), Deakin, ACT: RLSA,
http://www.royallifesaving.com.au/__data/assets/pdf_file/0018/3942/KW_BathTime_A4toDL_final.pdf, accessed 9 July 2013.
96
NSW Child Death Review Team | Annual Report 2012
Chapter 20. Deaths from other unintentional
external causes
Transport fatalities and drowning consistently account for the majority of deaths of children in NSW from unnatural (external)
unintentional causes. This chapter focuses on the deaths of children from other unintentional external causes, such as
complications of surgery, falls and accidental poisoning.
Table 66 provides an overview of the key demographic characteristics of the 13 children who died as a result of other
unintentional external causes in 2012.
Table 66: Key demographic and individual characteristics – deaths due to other external causes, 2012
Number
Percent
Crude
Mortality Rate
95% Confidence
Interval
Incident
Rate Ratio
p
13
100
0.79
0.42 - 1.35
Female
6
46
0.75
0.28 - 1.63
-
-
Male
7
54
0.83
0.33 - 1.71
1.10
0.4325
Under 1 year
0
0
-
-
-
-
1-4 years
2
15
-
-
-
-
5-9 years
3
23
-
-
-
-
10-14 years
2
15
-
-
-
-
15-17 years
6
46
2.19
0.06 - 1.89
-
-
12
92
0.76
0.39 - 1.33
1
8
-
-
-
-
Major cities
8
67
0.68
0.29 - 1.34
-
-
Inner regional areas
3
25
-
-
-
-
Outer regional areas
1
8
-
-
-
-
Remote areas
0
0
-
-
-
-
Very remote areas
0
0
-
-
-
-
Quintile 5 (highest)
2
17
-
-
-
-
Quintile 4
2
17
-
-
-
-
Quintile 3
0
0
-
-
-
-
Quintile 2
2
17
-
-
-
-
Quintile 1 (lowest)
6
50
2.16
0.64 - 3.77
-
-
Total
Gender
Age
Aboriginal and Torres Strait Islander status
Not Aboriginal or Torres Strait Islander
Aboriginal or Torres Strait Islander
Remoteness*
Socioeconomic status**
* Remoteness was not calculated in one case.
** Socioeconomic status was not calculated in one case.
NSW Child Death Review Team | Annual Report 2012
97
The deaths of 13 children150 in NSW from other unintentional external causes were registered in 2012:
• four children died from complications of surgery or underlying medical conditions, including two deaths associated with
organ transplants
• three children died as a result of unintentional poisoning
• the deaths of two children were caused by accidental threats to breathing, including accidental asphyxiation and choking
on food
• one child died following a fall from a tree-house during play
• one child died after being hit by a projectile during play
• one child died after being crushed by machinery at a workplace, and
• one child died in a household fire.
The deaths of two of these children are ‘reviewable deaths’ and will be reviewed separately by the Ombudsman. Both children
were in care at the time of their death.
20.1 Demographic and individual characteristics
20.1.1 Age, gender and Aboriginal and Torres Strait Islander status
In 2012, deaths due to other unintentional external causes occurred predominantly in the 15-17 year age group (6). Six of the
children who died were female and seven were male.
This information is largely consistent with deaths from these causes in the last 15 years. In 1998-2012, two-thirds of the children
who died from other unintentional external causes were male, and were mainly aged 1-4 years (27%) or 15-17 years (31%).
One child who died due to other unintentional external causes in 2012 was Aboriginal.
20.1.2 Residence, remoteness and socioeconomic status
Of the 13 children who died, 12 usually resided in NSW. One child normally resided overseas, but died while receiving medical
treatment in NSW.
Most (8) of the children who died from unintentional external causes lived in major cities. The largest proportion of children (6)
lived in areas in the lowest quintile of socioeconomic status.
20.1.3 Where the fatalities occurred
Most (8) of the fatalities occurred at, or in the near vicinity of, the child’s home. The other fatalities occurred in hospital (3),
a public place and a worksite.
20.1.4 Child protection history
In 2012, the families of five children (38%) who died from other unintentional external causes had a child protection history.
In the three years before their death, four children had been the subject of a report of risk of harm or risk of significant harm to
Community Services. One child had a sibling who was the subject of a report to Community Services. Two of the families were
also known to a Child Wellbeing Unit.
The nature of reported concerns for the children and/or their siblings varied. For three children, the concerns reported were not
related to the risks or circumstances associated with their death.
For two young people, the concerns reported related to significant risk-taking or challenging behaviours, which in both cases was
relevant to either the young person’s death or other circumstances associated with their death. Reports related to ongoing problems
with substance abuse, non-compliance with treatment, historical sexual abuse, violent behaviour, and/or mental health issues.
Two children and young people were in care at the time of their death.
150 The 13 deaths reported for 2012 do not include four deaths of infants less than one year of age who died suddenly and unexpectedly from
unintentional external causes, which have also been classified as explained SUDI. These deaths are discussed in detail in Chapter 15.
98
NSW Child Death Review Team | Annual Report 2012
20.2 Deaths from complications of medical and surgical care
In 2012, four children died from complications arising from medical treatment or surgery for significant health problems.
Two children were organ transplant recipients with substantial ongoing health issues and/or congenital disease. The other
two children experienced complications linked to infections arising from long-term illnesses or spinal surgery.
All were older children or young people: two were aged 12-13 years, and two were 16 years old. Most (3) were female.
Following one death, the health service involved with the child conducted an internal review, which considered the child’s
presentation to the Emergency Department and subsequent management in hospital. The review identified areas for systems
improvement, including recognition of paediatric sepsis, arrangements for Medical Emergency Team calls, and referrals
involving Emergency and Paediatric services.
20.3 Deaths from unintentional poisoning
The deaths of three young people from unintentional poisoning were registered in 2012. Each of the deaths was associated
with drug use: two deaths resulted from the combined effects of multiple drugs, and one child ingested a fatal level of a
substance thought not to be toxic.
All three were aged 15-17 years. Two of the teenagers were male, and one was female. Information relating to the unintentional
poisoning deaths of the three teenagers in 2012 is largely consistent with deaths from this cause over 15 years. During that
time, 67 children have died as a result of unintentional poisoning. Three-quarters (51) of the children were aged 15-17 years,
and just under two-thirds (42) were male.
20.3.1 Circumstances of death
Two of the young people who died from accidental poisoning in 2012 died from mixed drug toxicity associated with the use of
narcotics and various psychoactive drugs. Both had taken multiple drugs, including opioids (such as methadone or morphine),
benzodiazepines, and illicit drugs (such as heroin and/or cannabis). The deaths of the two young people resulted from the
combined effects of the drugs, rather than a fatal level of a single drug.
Both of the young people had a background of substance use. One had been involved in a drug treatment program in the
months prior to death.
The other young person died after ingesting a toxic quantity of a substance taken for recreational purposes. The young person
had ingested multiple tablets of what was believed to be an illicit hallucinogenic drug. However, subsequent toxicology tests
found that the ingested substance was a synthetic drug, ‘251-NBOMe’.
20.3.2 Factors associated with unintentional poisoning
The deaths of children from unintentional poisoning in 2012 reflect broader trends relating to the deaths of 15-17 year olds
in NSW from this cause over 15 years. Key factors relate to adolescent risk-taking and experimentation, poly drug use, and
vulnerable adolescents with a child protection history.
Risk-taking and experimentation
In 2012, all three unintentional poisoning deaths involved teenagers engaging in risk-taking behaviour.
Developmentally, adolescence is a time when many young people test and push boundaries, and experiment with adult or
risk-taking behaviours.151 In the past 15 years, the vast majority (45) of the 51 deaths of children aged 15-17 years occurred in
the context of adolescent experimentation.
Of the 51 children aged 15-17 years who died from unintentional poisoning in the past 15 years in NSW, three-quarters (38)
died as a result of toxic levels of narcotics and/or psychoactive drugs. Almost two-thirds (31) of the adolescent accidental
poisoning deaths involved illicit drugs, including heroin, methamphetamine, amphetamines, cocaine, MDMA (ecstasy),
and cannabis.
The deaths of 15 adolescents resulted from an overdose of various drugs (such as methadone, benzodiazepines and
antidepressants), alcohol, and/or over-the-counter medications such as paracetamol, opioid analgesics, and other easily
151 Australian Institute of Health and Welfare 2011. Young Australians: their health and wellbeing 2011. Cat. No. PHE 140 ,Canberra: AIHW, pp. 2, 30.
NSW Child Death Review Team | Annual Report 2012
99
obtainable substances, such as aerosols and butane gas. In most cases, the drugs appeared to have been used by young
people to become intoxicated or to offset the effects of stimulants such as amphetamines or cocaine.152 Information about how
the young people obtained the medication was largely unavailable. In a small number of cases, the medication belonged to a
family member or associate, and in one case the medication had been prescribed to the young person who died.
The 2010 National Drug Strategy Household Survey found that the use of pharmaceuticals for non-medical purposes by
children and young people aged 14 years or older had increased between 2007 and 2010.
Poly drug use153
For two of the young people who died from accidental poisoning, death resulted from the combined effects of the multiple
drugs they used.
Notably, almost two-thirds (31) of the 51 young people who died from unintentional poisoning in 1998-2012 had engaged in
poly-drug use (involving the use of two to five drugs). The combination of drugs typically involved both illicit and prescription
drugs, such as heroin or amphetamines and benzodiazepines; or methadone, antidepressants and alcohol.
Poly-substance use is common among adolescents.154 The likelihood of multiple drug toxicity is noted to be especially high
with the use of more than one ‘depressant’ drug (those that act to slow down the activity of the central nervous system and
messages between the brain and body).155 Depressant agents include opioids (heroin, methadone), benzodiazepines (such
as diazepam, oxazepam, and rohypnol), alcohol and cannabis. The effects of these drugs include sedation, muscle relaxation,
and reduced anxiety.
In 1998-2012, just over half of the deaths of young people aged 15-17 years from accidental poisoning involved the use of
multiple depressants, including two of the young people who died in 2012.
Vulnerability and child protection history
In 2012, two of the three teenagers who died from unintentional poisoning had an extensive child protection history, and a
family background of abuse, neglect and childhood trauma. Both were highly vulnerable teenagers with complex and multiple
high needs, including substance use, risk-taking behaviour, mental health concerns, criminal and/or anti-social behaviour and
school issues.
Amongst the 51 adolescents aged 15-17 years who died from unintentional poisoning in 1998-2012, 59% (30) had complex
and multiple needs, and had experienced substantial family dysfunction, childhood trauma and/or abuse. Records identified
challenging behaviour and/or extensive contact with the criminal justice system, including, in some cases, periods in custody.
Almost all were well known by agencies for their drug use; and many had a history of involvement in detoxification and
rehabilitation programs. Over half (29) had a child protection history; seven were living in care at the time of their death.
20.3.3 Prevention measures
Substance use is determined by numerous, inter-related individual, family, social, environmental and other risk factors.156
Research into adolescent substance abuse has found that maladaptive substance use is often part of a problem behaviour
syndrome that includes delinquency, substance abuse, adolescent pregnancy, school failure and dropping out.157 As a result,
interventions that target single-risk factors or risk behaviours are unlikely to be effective.
Youth-specific alcohol and drug treatment services based on holistic treatment and harm-reduction principles are noted to be
best suited to meet the needs of young people.158 Key components include educational and vocational programs; practical
assistance to address issues like homelessness; physical and recreational activities; integrated medical and psychological
services; and family and peer programs.
A range of drug and alcohol and youth focused organisations currently provide useful information and resources on individual
152 In one case records indicate the prescription drugs present were prescribed to the young person who died.
153 ‘Poly-drug use involves: using two or more drugs at the same time or on the same occasion, or using two or more drugs within a certain period,
but not necessarily at the same time’. Department of Education, Employment and Workplace Relations 2003, Resilience Education and Drug
Information (REDI), A Drug Information Resource for Australian School Communities, Canberra: DEEWR.
154 NSW Centre for the Advancement of Adolescent Health 2008, Adolescent Health: GP Resource Kit 2nd ed., Westmead, NSW: NSW CAAH,
http://www.caah.chw.edu.au/resources/gpkit/Complete_GP_Resource_Kit.pdf, accessed 16 July 2013.
155 Australian Drug Foundation 2013, Drug Facts – Alcohol and other drugs, Melbourne: ADF http://www.druginfo.adf.org.au, accessed 16 July 2013.
156 Headspace 2013, Substance use disorders, Melbourne: National Youth Mental Health Foundation http://www.headspace.org.au/what-works/
research-information/substance-use, accessed 16 July 2013.
157 Spooner C. Mattick R. & Howard J. 1996, The nature and treatment of adolescent substance abuse. National Drug and Alcohol Research Centre
Monograph No. 26.
158 Ibid.
100
NSW Child Death Review Team | Annual Report 2012
drugs, their effects, and treatment of substance abuse.159 There are also numerous strategies and activities that target
adolescent and young adult drug use, such as recent information and awareness campaigns on harm reduction in emergency
and overdose situations involving illicit drugs; binge drinking and anti-social behaviour; and the impact of frequent cannabis
use on lifestyle.160 In June 2013, the Commonwealth Government announced that new headspace youth mental health
services would open across the country to support young people dealing with mental health issues and substance abuse.
Seven of the 15 new headspace centres will be located in NSW.
The use of pharmaceuticals (such as opioids and benzodiazepines) by young people, and the risks associated with mixing
drugs, are two areas that may warrant attention in future preventative campaigns.
The NSW Government is currently undertaking work aimed at developing and improving services to vulnerable young people.
Recent key work, such as the Better Outcomes for Vulnerable Teens161 review undertaken by the Department of Family and
Community Services, identify the need to shift to a person-centred, place-based approach to support. Key directions include
working towards whole-of-government and community strategies, developing opportunities to intervene early in vulnerability,
strengthening supports, and improving system capacity. Ongoing reform in this area will be closely monitored by the
NSW Ombudsman.
The Team’s recommendations
Last year, the Team noted that two children had died (in 2010 and 2011) after accessing and ingesting prescription medication,
and directed recommendations to the Clinical Excellence Commission aimed at improving child-resistant safety measures
relating to medications.
In response to the Team’s recommendations, the Clinical Excellence Commission reviewed the capacity of the iPharmacy
software, and designed a specific warning code ‘KIDCAP’ to identify medicines requiring a child-resistant closure. The
Commission advised that the required label changes would take place across NSW over the second half of 2013.
The Commission also advised of other actions that would be taken to improve practice and awareness of child-resistant
safety measures, including providing information to pharmacies, updating a Health policy directive, and issuing an information
bulletin alerting health services staff to the required changes.
20.4 Threats to breathing
In 2012, two children died from unintentional asphyxia.162 The children were aged between one and four years old. Both were
in the care of a parent when the fatality occurred, and died as a result of restricted breathing in incidents associated with the
child’s very young age – choking on a small item of inhaled food, and becoming wedged in a gap between a wall and bed.
20.4.1 Factors associated with unintentional threats to breathing, and
prevention measures
The two deaths in 2012 are consistent with previous threat to breathing deaths involving young children, and reinforce the need
for community messages regarding safe sleeping and keeping home environments free of potential choking hazards.163
Over the past 15 years, 83 children less than five years of age have died in accidental asphyxia-related incidents, including
unintentional suffocation and strangulation. The vast majority (68) of these children were less than two years of age.
The highest risk of unintentional asphyxia for very young children is related to their bedding and sleep environment, followed
by situations where children accidentally inhale or ingest something that causes respiratory obstruction. Strategies to prevent
such accidents occurring include ensuring that children are placed for sleep in suitable environments such as cots; and
ensuring that children cannot access choking hazards as they become mobile and explore things by putting them in their
mouth. Chapter 15 provides a more comprehensive discussion in relation to these issues.
159 Organisations include the Australian Drug Information Network, Australian Drug Foundation, Centre for Youth Drug Studies, Youth Substance
Abuse Service, National Drug & Alcohol Research Centre, Youth NSW, Australia’s National Youth Mental Health Foundation – Headspace, and
the Australian Institute of Health and Welfare.
160 NSW Ministry of Health campaigns: Club Drugs – Don’t let drugs use you; What Are You Doing to Yourself?; and The Cannabis Campaign.
http://www0.health.nsw.gov.au/mhdao/campaigns.asp, accessed 16 July 2013.
161 NSW Department of Family and Community Services 2012, Better Outcomes for Vulnerable Teens – FACS Review, Sydney: FACS.
162 As noted previously, the deaths of an additional four children under one year in 2012 have been classified as explained SUDI. These deaths are
discussed more fully in Chapter 15.
163 Information for parents and caregivers about strategies to prevent suffocation and strangulation in the home environment are published by
organisations such as Kidsafe SA Inc.
NSW Child Death Review Team | Annual Report 2012
101
Chapter 21. Suicide
The deaths of 16 young people registered in NSW in 2012 were suicides. After transport fatalities, suicide was the second
leading cause of death for young people aged 15 to 17 years, as was also the case in 2011 and 2010.
NSW Health estimates that for each suicide in NSW, there are 30 to 40 hospitalisations following suicide attempts each year.
This information is based on hospital admissions only, and it is likely there are many more suicide attempts that are excluded
from this calculation.164 Suicide rates in NSW are higher for young males,165 while young women are three times more likely to
be hospitalised for self-harm than young men.166
This section considers the deaths of young people that occurred as a result of suicide or probable suicide. Included are
deaths where the State Coroner had determined the cause and manner of death to be self-harm with fatal intent, and deaths
where records provide indicators that suicide was the probable manner of death. The latter includes deaths where police
identify the death as a suicide and the indicators include evidence of prior suicide attempts, expressions of suicidal ideation
and/or a history of self-harming behaviour. The Team has consistently used this approach in reporting suicide.167
Of the 16 deaths of young people reported here, the Coroner has determined that seven were the result of suicide. In five
cases, the Coroner has dispensed with an inquest without recording findings regarding manner of death. At the time of writing,
four cases are still open with the Coroner.
The suicide of one young person is also ‘reviewable’ by the Ombudsman as the young person was in care at the time
of their death.
In this chapter, the terms ‘young person’ and ‘young people’ are used, regardless of the age of the child.
21.1 Trends in suicide deaths of young people in NSW 1998-2012
As detailed in table 67 below, the child death register includes 245 suicides over the 15 years from 1998 to 2012. There has
been no apparent change in the suicide rate over recent years.
Table 67: Trends in deaths due to suicide by gender – number and (Crude Mortality Rate) 1998-2012
Male
Female
Total
1998
1999
2000
2001
2002
2003
2004
2005
2006
2007
2008
2009
2010
2011
2012
Total
13
(1.6)
8
(1.0)
10
(1.2)
12
(1.5)
13
(1.6)
12
(1.5)
9
(1.1)
14
(1.7)
6
(0.7)
11
(1.3)
8
(1.0)
14
(1.7)
9
(1.1)
13
(1.5)
9
(1.1)
161
2
-
13
(1.7)
8
(1.0)
5
(0.8)
6
(0.8)
6
(0.8)
7
(0.9)
6
(0.8)
2
-
4
(0.5)
5
(0.6)
4
(0.5)
5
(0.6)
4
(0.5)
7
(0.9)
84
15
(0.9)
21
(1.3)
18
(1.1)
17
(1.1)
19
(1.2)
18
(1.1)
16
(1.0)
20
(1.2)
8
(0.5)
15
(0.9)
13
(0.9)
18
(1.1)
14
(0.9)
17
(1.0)
16
(1.0)
245
21.2 Demographic and individual characteristics
Table 68 below provides an overview of the main demographic characteristics of the 16 young people who died as a result of
suicide and whose deaths were registered in 2012.
164
165
166
167
102
NSW Department of Health 2010, NSW Suicide Prevention Strategy 2010-15, Sydney: NSWDH, p. 10.
Australian Institute of Health and Welfare 2011, Young Australians: Their health and wellbeing 2011, cat. no. PHE 140, Canberra: AIHW, p. 33.
NSW Department of Family and Community Services 2013, Women in NSW 2013, Sydney: FACS, p. 40.
NSW Child Death Review Team, 2010, Annual Report 2009, Sydney: NSW Commission for Children and Young People, p. 141.
NSW Child Death Review Team | Annual Report 2012
Table 68: Key demographic and individual characteristics – deaths of young people due to suicide, in 2012
Number
Percent
Crude
Mortality Rate
95% Confidence
Interval
Incident
Rate Ratio
p
16
100
0.97
0.56 - 1.58
Female
7
44
0.88
0.35 - 1.81
-
-
Male
9
56
1.07
0.49 - 2.02
1.22
0.352
Under 1 year
0
0
-
-
-
-
1-4 years
0
0
-
-
-
-
5-9 years
0
0
-
-
-
-
10-14 years
2
13
-
-
-
-
15-17 years
14
88
5.10
2.79 - 8.56
-
-
12
75
0.76
0.39 - 1.33
-
-
4
25
5.62
1.53 - 14.39
7.36
0
Major cities
5
31
0.42
0.14 - 0.99
-
-
Inner regional areas
7
44
2.06
0.83 - 4.25
-
-
Outer regional areas
2
13
-
-
-
-
Remote
2
13
-
-
-
-
Very remote
0
0
-
-
-
-
Quintile 5 (highest)
3
19
-
-
-
-
Quintile 4
4
25
1.37
0.37 - 3.51
-
-
Quintile 3
4
25
1.44
0.39 - 3.69
-
-
Quintile 2
4
25
1.15
0.35 - 3.32
-
-
Quintile 1 (lowest)
1
6
-
-
-
-
Total
Gender
Age
Aboriginal and Torres Strait Islander status
Not Aboriginal or Torres Strait Islander
Aboriginal or Torres Strait Islander
Remoteness
Socioeconomic status
21.2.1 Age and gender
Nine of the 16 suicide deaths registered in NSW in 2012 were male and seven were female. Males had a slightly higher rate of
death than females; however, this difference was not significant. There were more deaths of females attributed to suicide in
2012 than there had been since 2004.
The young people who died as a result of suicide in 2012 were aged between 13 and 17 years; the majority (14) were 15 years
and older. As indicated in the table below, since 1998, two-thirds of young people who died as a result of suicide in NSW were
16 or 17 years of age.
NSW Child Death Review Team | Annual Report 2012
103
Table 69: Trends in suicide deaths of young people by age, 1998-2012 – number and per cent
1998
1999
2000
2001
2002
2003
2004
2005
2006
2007
2008
2009
2010
2011
2012
Number
(%)
10 years
0
0
0
0
0
1
0
0
0
0
0
0
0
0
0
1 (<1)
11 years
0
0
0
0
0
0
1
1
0
0
0
0
0
0
0
2 (<1)
12 years
1
0
0
1
0
0
1
0
1
0
0
0
0
0
0
4 (2)
13 years
2
1
1
1
0
1
0
1
1
2
0
0
0
0
1
11 (4)
14 years
0
4
1
0
2
2
4
0
0
1
3
0
1
3
1
22 (9)
15 years
1
5
3
3
2
1
2
4
0
3
1
3
3
7
4
42 (17)
16 years
3
3
5
6
6
6
6
3
3
2
5
7
3
5
3
66 (27)
17 years
Total
8
8
8
6
9
7
2
11
3
7
4
8
7
2
7
97 (40)
15
21
18
17
19
18
16
20
8
15
13
18
14
17
16
245 (100)
21.2.2 Aboriginal and Torres Strait Islander status
There were more young people of Aboriginal or Torres Strait Islander descent who died as a result of suicide in 2012 (4)
than in 2011 (2).
21.2.3 Remoteness and socioeconomic status
The majority of the suicide deaths in 2012 occurred in major cities and inner regional areas (12 of 16). There were more deaths
in inner regional areas in 2012, in contrast with 2011, when there were more in major cities. There was no apparent pattern in
the socioeconomic status of the young people who died as a result of suicide in 2012.
21.2.4 Child protection history
Of the 16 young people who died as a result of suicide in 2012, the families of 11 had a child protection history. This is
considerably higher than the proportion in 2011, when the families of four young people who died as a result of suicide had
a child protection history.
Within the three years prior to their death, the 11 young people had been the subject of a report of risk of harm or risk of
significant harm to Community Services. The nature of reported issues for five of the 11 young people concerned risk of
suicide and/or concerns relating to the young person’s mental health. The majority of the young people with a child protection
history had been the subject of reports concerning their drug and/or alcohol use.
21.2.5 Education and employment circumstances
The majority (11) of the young people were enrolled and attending school. One young person was not attending school due
to absenteeism and difficulties finalising enrolment.
The majority (11) had experienced some stress associated with schooling or education, including bullying, behavioural
problems, academic failure and a history of suspensions/expulsion from school (see also section 21.4.6).
Two young people were no longer enrolled in school and were not employed or engaged in any further education or training
program. Two other young people had become unemployed in the weeks prior to their death.
21.2.6 Usual residence
The majority (10) of the 16 young people lived at home with at least one birth parent; four of the young people lived with both
birth parents. Two young people were living with other relatives.
Two young people were residing with the families of friends and one other young person had been moving between friends
and family. One young person was living independently.
21.2.7 Place of fatality
Of the 16 young people who died from suicide, half died at their family home or other usual place of residence. Six young
people were found in public places and another two young people died at the home of a friend.
104
NSW Child Death Review Team | Annual Report 2012
21.3 Intent and precipitating factors
21.3.1 Stated or inferred intent
Just over half (9) of the young people who died as a result of suicide documented their intent to do so. The most common
documentation was a note or a letter (6). Other documentation included messages of suicidal intent posted on a social
networking website; text messages, and, for two young people, the recording of a video diary. Often, the young person used
more than one medium of communication.
Another six young people had previously raised the subject of suicide, made suicide threats or attempts, experienced suicidal
ideation and/or engaged in self-harming behaviour. For three of these six young people, suicidal threats and/or expressions of
a desire to die occurred on the same day as the suicide incident.
21.3.2 Precipitating events
Research indicates that stressful and traumatic events, including interpersonal conflict, can serve as tipping points for young
people already experiencing other risk factors of suicide.168
For deaths in 2012, records indicate possible precipitating events for half (8) of the suicides. For most (7), this included a
relationship breakdown with a boy/girlfriend. Other events involved an argument with a close friend or family member, and
problems with schooling and future education opportunities.
21.4 Risk factors associated with suicide
There are a range of interrelated biological, social and psychological risk factors associated with suicidal behaviour. These include:
• mental health conditions, such as depression, anxiety disorders, personality disorders and behavioural disorders;169
• history of suicidal behaviour;170, 171
• substance misuse;172
• childhood trauma, including abuse or neglect;173
• adverse circumstantial factors, primarily interpersonal or personal stressors;174 and
• issues related to sexual identity, particularly social experience of sexual identity.175
Many of these factors are not uncommon among the general population, and suicide among young people has been noted to
be sometimes an impulsive act.176
Suicide Prevention Australia notes that suicide is complex, and generally results from a combination of several individual,
social and contextual risk factors; and for young people the grouping of these factors poses the greatest risk.177
As illustrated in the table below, for the 16 suicide deaths in 2012:
• All 16 young people experienced at least one risk factor associated with suicide. The majority (14) experienced multiple risk
factors, the most frequent being mental health issues, previous suicidal behaviour and/or self-harm, substance misuse and
a variety of interpersonal or personal stressors.
• Interpersonal or personal stressors were present for all except one young person; with most experiencing a combination of
stressors including educational, social, peer, family, personal or other relationship difficulties.
• The majority (13) of young people had experienced mental health issues; either formally diagnosed mental illness or
undiagnosed mental health problems. All except one of the 13 young people received some form of treatment, assessment
or mental health support in the year before their death.
• The majority (12) of the young people exhibited prior suicidal or self-harming behaviours, or prior suicidal thoughts
and/or discussions.
168
169
170
171
172
173
174
175
Suicide Prevention Australia 2010, Position statement: youth suicide prevention, Sydney: SPA, p. 3.
NSW Department of Health 2010, NSW suicide prevention strategy 2010-15, Sydney: NSWDH, p. 13.
History of suicidal behaviour refers to a previous suicide attempt and non-suicidal self-harm.
NSW Department of Health 2010, op. cit., p. 14.
Suicide Prevention Australia 2011, Position statement: alcohol, drugs and suicide prevention, Sydney: SPA.
Suicide Prevention Australia 2010, Position statement: youth suicide prevention, Sydney: SPA, p. 5.
Ibid.
Plöderl M. Wagenmakers E. J. Tremblay P. Ramsay R. Kralovec K. Fartacek C. & Fartacek R. 2013, Suicide Risk and Sexual Orientation: A Critical
Review. Archives of Sexual Behavior, In Press (doi: 10.1007/s10508-012-0056-y).
176 Standing Committee on Health and Ageing, Federal House of Representatives 2011, Before it’s too late: report on early intervention programs
aimed at preventing youth suicide, Canberra: SCHA, p. 13.
177 Suicide Prevention Australia 2010, op. cit., p. 4.
NSW Child Death Review Team | Annual Report 2012
105
106
NSW Child Death Review Team | Annual Report 2012
ü
ü
ü
ü
ü
ü
ü
ü
ü
ü
ü
3
4
5
6
7
8
9
10
11
12
13
Total
16
15
13
ü
2
14
ü
1
Mental
illness or
undiagnosed
mental health
conditions
12
ü
ü
ü
ü
ü
ü
ü
ü
ü
ü
ü
ü
Previous
suicidal
behaviour
and self-harm
7
ü
ü
ü
ü
ü
ü
ü
Substance
misuse
Table 70: Risk factors for suicide, 2012
13
ü
ü
ü
ü
ü
ü
ü
ü
ü
ü
ü
ü
ü
Difficult family
circumstances
11
ü
ü
ü
ü
ü
ü
ü
ü
ü
ü
ü
Difficulties
associated
with school,
education or
employment
7
ü
ü
ü
ü
ü
ü
ü
Difficult peer
relationships,
including
bullying
7
ü
ü
ü
ü
ü
ü
ü
Difficult close
personal
relationships,
including
relationship
breakdown
6
ü
ü
ü
ü
ü
ü
Psychosocial
issues,
self-esteem,
body image,
social isolation
4
ü
ü
ü
ü
Criminal/
anti-social
behaviour
5
ü
ü
ü
ü
ü
Childhood
trauma
1
1
2
2
4
4
6
6
6
7
7
7
7
8
8
9
Total
21.4.1 Mental illness
Nine of the 16 young people had been diagnosed with a mental illness.
The range of diagnosed mental illnesses included depression, anxiety, post-traumatic stress disorder (PTSD), oppositional
defiance disorder (ODD), attention deficit hyperactivity disorder (ADHD), adjustment disorder, conduct disorder and alcohol
dependence. All of the nine young people either had multiple mental health diagnoses and/or exhibited signs of other mental
health concerns in addition to the primary diagnosis.
Depression was the most commonly diagnosed mental illness. For the six young people, depression was one of a number
of mental illnesses diagnosed. Two other young people exhibited signs of depression in addition to their primary mental
illness diagnoses.
Four of the nine young people with a diagnosed mental illness had previously attempted suicide and deliberately self-harmed.
Four other young people had threatened and/or discussed suicide; three of these four young people had also engaged in selfharming behaviour.
Eight of the nine young people with a diagnosed mental illness also had a history of substance misuse.
Treatment
Eight of the nine young people with a mental illness received outpatient treatment from health professionals in the 12 months
prior to their death.
Treatment was provided by general practitioners, psychologists, psychiatrists, Child and Adolescent Mental Health Services
(CAMHS), counsellors and other community mental health providers. The young person who had not received any mental
health support was transient during the 12 months prior to their death.
One young person with a diagnosed mental illness had presented to a hospital emergency department twice in the 12
months prior to their death. Records indicate the young person was brought into hospital on both occasions under schedule
threatening self-harm and/or suicide, and demonstrating self-harming behaviour. Research indicates that young people
brought into emergency departments in relation to suicide attempts and other self-inflicted injuries are at risk of further suicide
attempts, with more lethal methods.178
Four of the young people receiving mental health treatment were prescribed medication. All four young people had been prescribed
selective serotonin reuptake inhibitor (SSRI) antidepressant medication at some time in the 12 months prior to their death.
One young person was taking SSRI medication in the period immediately preceding their death and another young person had
ceased taking the SSRI and commenced on serotonin and norepinephrine reuptake inhibitor (SNRI) medication one month
prior to their death. For two young people, the records are unclear as to whether they were taking the prescribed medication
immediately prior to their death.
All four young people prescribed medication were referred to a counselling/psychological service in conjunction with
antidepressant medication and as part of a mental health care plan. This is in line with Beyondblue Clinical practice guidelines
for treating depression. The degree of engagement with counselling and therapy by the young people was varied. One young
person did not regularly attend therapy sessions during the medication period and another young person who attended an
initial appointment declined further appointments.
The Beyondblue Clinical practice guidelines note that ‘prescription of an SSRI must occur within the context of an ongoing
therapeutic relationship and management plan’ and ‘young people must be provided with information on adverse effects
(including the possibility of emergence or escalations of suicidal thinking) and the need for ongoing monitoring during
treatment’.179 The guidelines also emphasise that caution is required when prescribing antidepressant medication for young
people with depression. The guidelines indicate that the use of antidepressants in adolescents may be appropriate when
depression is moderate or severe.
Headspace indicates that it is essential that young people experiencing a depressive disorder are engaged with good clinical
care, and that, irrespective of treatment chosen, close monitoring of symptoms or side effects (if medication is prescribed)
is imperative.180
178 Hughes J. & Asarnow J. 2013, Enhanced mental health interventions in the emergency department: Suicide and suicide attempt prevention,
Clinical Pediatric Emergency Medicine, 14(1): 28-34.
179 Beyondblue: The National Depression Initiative 2010, Clinical practice guidelines: depression in adolescents and young adults, Melbourne:
Beyondblue, p. 57.
180 Headspace 2012, Evidence summary: using SSRI antidepressants to treat depression in young people: what are the issues and what is the
evidence? Version 2, Melbourne: National Youth Mental Health Foundation.
NSW Child Death Review Team | Annual Report 2012
107
21.4.2 Undiagnosed mental health concerns
In addition to the nine young people with a diagnosed mental illness, records show that four young people displayed signs
of poor mental health. The range of mental health issues observed in the four young people included depression, anxiety,
suicidal threats and/or thoughts, self-harming behaviour, mood instability and disordered eating behaviours.
All four young people had contact with health professionals concerning their mental health in the 12 months prior to their
death. These included general practitioners, psychologists, Child and Adolescent Mental Health Services (CAMHS), and
school or other counsellors. Three of the young people had received counselling and the other person was referred to a
psychologist, however declined to attend. One young person presented to hospital emergency departments on numerous
occasions regarding mental health concerns and self-harming behaviours.
Three of the 16 young people had no mental health concerns identified before their death.
21.4.3 Previous suicidal behaviour and self-harm
A previous suicide attempt is considered to be the strongest predictor of a future suicide attempt or suicide.181
In 2012, over one-third of the young people whose deaths were due to suicide (6) had previously attempted suicide. Records
indicate that at least two of the young people had previously attempted suicide on more than one occasion. An additional five
young people had previously made suicide threats or discussed suicide.
Self-harming behaviour is frequently related to stress reduction, inflicting self-punishment or the signalling of personal
distress to others; and there may be no suicidal intent.182 However research indicates that people who engage in self-harming
behaviours are at higher risk of suicide than those who do not.183
The majority (10) of young people who previously attempted suicide, made suicide threats or discussed suicide had also
engaged in self harming behaviour.
For one-quarter (4) of the 16 young people who died due to suicide in 2012, there was no history of prior self harm or suicidal
ideation, from the information available.
21.4.4 Substance misuse
Substance abuse can increase the risk of suicide for young people.184 Research indicates that cannabis use has been linked to
suicidal behaviour; and depression with alcohol abuse has been associated with increased suicidal behaviour.185
In 2012, almost half (7) of the 16 young people had a history of substance misuse, most commonly cannabis and alcohol use.
Records indicate that two of the seven young people solely used cannabis. The other five used cannabis in conjunction with
alcohol and/or other substances including amphetamines, prescription drugs and ‘petrol sniffing’.
One young person had a provisional diagnosis of substance abuse disorder and had undertaken drug and alcohol counselling.
One other young person had attended counselling for substance misuse and treatment had been suggested for a further two
young people.
The vast majority (6) of the young people who had a history of substance misuse also had a mental illness or undiagnosed
mental health issue. Five young people had either a diagnosis or displayed some signs of depression and/or anxiety.
More than half (9) of the young people who died as a result of suicide in 2012 had no reported substance misuse issues.
21.4.5 Childhood trauma
Adverse and traumatic events in childhood can be precipitating factors in youth suicide attempts or suicides.186 In particular,
bullying, physical abuse, sexual abuse and family violence have been associated with suicide attempts.187
From the available information, five young people had experienced childhood trauma. Reported childhood trauma included
exposure to family violence, physical abuse, sexual harm and the suicide of a parent.
181
182
183
184
185
186
187
108
Suicide Prevention Australia 2010, Position statement: youth suicide prevention, Sydney: SPA, p. 5.
Wilkinson P. & Goodyer I. 2011, Non-suicidal self-injury, European child and adolescent psychiatry, 20(2): 103-108.
Suicide Prevention Australia 2010, Position statement: youth suicide prevention, Sydney: SPA, p. 5.
Suicide Prevention Australia 2010, Position statement: youth suicide prevention, Sydney: SPA, p. 4.
Ibid.
Suicide Prevention Australia 2010, op. cit., p. 5.
Ibid.
NSW Child Death Review Team | Annual Report 2012
21.4.6 Interpersonal and personal stressors
The vast majority (15) of the 16 young people who died as a result of suicide in 2012 had experienced, or were currently
experiencing, one or more interpersonal or personal stressors. These included:
• family difficulties, such as conflict with parents and/or other family members, family discord and parents’ divorce/separation (13)
• difficulties associated with school, education and/or employment (11)
• difficult peer relationships, including arguments with friends and bullying (7)
• difficulties with close personal relationships, including arguments or relationship breakdowns with boy/girlfriends (7)
• psychosocial issues, such as poor self-esteem, body-image problems and social isolation (6)
• criminal and/or anti-social behaviour (4), and
• a recent health problem/injury (2).
The majority (13) of the young people experienced a combination of interpersonal and/or personal stressors. The most common
stressors were difficulties associated with family circumstances, education and employment, and peer related problems.
Family circumstances
Family conflict, familial discord and parental divorce or separation has been associated with an increased risk of suicide for
young people.188, 189 In 2012, 13 young people who died as a result of suicide experienced familial difficulties. Family difficulties
included arguments with parents/carers, arguments with siblings, strained relationships between parent/s and young people,
parental divorce/separation, exposure to family violence and estrangement from parents.
Research indicates that family conflict may present as a trigger event in conjunction with other suicide risk factors.190 Records
indicate that 12 of the 13 young people experienced additional interpersonal or personal stressors in conjunction with
family difficulties.
Education, school and employment issues
The majority (11) of the young people had experienced some stress associated with schooling or education. Chronic
absenteeism was an issue for four young people, and two young people were no longer enrolled in school at the time of their
death following periods of disengagement and behavioural problems. For other the other five young people, school related
stress was associated with bullying, behavioural problems, academic failure and a history of suspensions/expulsion from
school. One young person experienced stress associated with a recent rejection from an education/employment program.
The NSW School-Link Initiative is a collaborative initiative between NSW Health and the Department of Education in order to
improve the mental health of children and young people in NSW. This program is aimed to improve prevention, treatment and
support for young people experiencing mental health problems. From available records, four young of the young people who
died as a result of suicide in 2012, had contact with their school counsellor. Five other young people received some support at
school and/or were referred to external support programs for behavioural or absenteeism issues.
Research indicates that young people affected by bullying are at increased risk of suicidality and young people with multiple
roles (victim, bully, and bystander) are significantly more likely experience suicidal thoughts.191
NSW Education and Communities Bullying: Preventing and Responding to Student Bullying in School Policy stipulates that all
students experience school free from the fear of bullying, harassment and anti-social behaviour, and in a secure, ordered and
supportive environment.192 Schools are required to have individual anti-bullying plans that comply with the policy. The plans
must be revised at least every three years, and need to reflect emerging issues such as cyber bullying.193
Records show that six young people who suicided were subject to bullying; two of these young people were reportedly bullies
as well as victims. All six young people were bullied in the school environment, with three of the six young people also bullied
over the internet.
188
189
190
191
192
Suicide Prevention Australia 2010, Position statement: youth suicide prevention, Sydney: SPA, p. 6.
Australian Institute of Health and Welfare 2011, Young Australians: Their health and wellbeing 2011, cat. no. PHE 140, Canberra: AIHW, p. 33.
Suicide Prevention Australia 2010, op. cit.
Rivers I. & Noret N. 2010, Participant roles in bullying behaviour and their association with thoughts of ending one’s life, Crisis, 31(3): 143-148.
NSW Department of Education and Communities 2011, Bullying: preventing and responding to student bullying in schools guidelines,
Sydney: NSW DEC, p. 3.
193 NSW Department of Education and Communities 2011, op. cit.
NSW Child Death Review Team | Annual Report 2012
109
21.5 Prevention measures
As previously noted, suicide is a complex problem, and generally results from a combination of individual, social and
contextual risk factors.194 For young people, the greatest risk arises when there is a grouping of these risk factors.195
The NSW Suicide Prevention Strategy 2010-2015 details the NSW Government’s directions and proposed outcomes for suicide
prevention in NSW.196 The strategy aligns with the national suicide prevention framework: Living Is For Everyone, and provides
the basis for a coordinated, whole-of-government approach. Actions that are specifically targeted to children and young
people include:
• the continued development and implementation of early childhood and school-based programs promoting resilience and
providing support for children and young people to help reduce the risk of suicide (such as the School-Link program),197 and
• development of multi-media resources to target young people and provide support and information for those affected
by suicide.198
The first report of agencies’ progress against the strategy’s implementation plan was released in August 2012.199 The progress
report details new School-Link initiatives, including a strategic review of the School-Link program and a School-Link DVD
training program aimed at enhancing skills in the recognition, intervention planning, treatment, support and prevention of
mental health problems in children and young people.200 A number of local School-Link initiatives are underway.
The Team’s recommendations
Since 2010, the Team has monitored progress on three recommendations directed to NSW Health in relation to the NSW Suicide
Prevention Strategy. The recommendations, published in the Team’s Annual Report 2009, focused on making use of new media
to deliver prevention services to young people, developing resources to educate young people on the importance of passing on
suicide risk concerns about peers, and increasing collaboration between schools and youth mental health services.
NSW Health supported the recommendations and advised the Team of a range of strategies in place to meet them, including
a market research project; development of a communication strategy to increase community awareness of suicide risks,
prevention and to reduce the stigma associated with suicide; and development of school staff training resources around
suicide risk identification and support.
In 2011, NSW Health advised the Team that the NSW Suicide Prevention Strategy included action to ‘develop multimedia
resources to target young people and provide support and information for those affected by a suicide/attempt’, by 2011/2012.201
To progress this, and to inform the development of the communication strategy, a suicide prevention market research project
was undertaken (to identify and review new media and social media initiatives promoting suicide prevention for young people).
The market research project was finalised in November 2011.
In September 2012, the Ministry of Health advised that the development of a social marketing campaign and new media
resources for young people on suicide prevention was on hold while another commitment in the Suicide Prevention Strategy
– community guidelines for discussing suicide – was being finalised. The Ministry advised that the guidelines would set down
key messages that would be incorporated into the social marketing project, which was anticipated to proceed in 2013.
The Ministry of Health also advised the Team that the evaluation of the outcomes of the NSW Suicide Prevention Strategy
would start in 2012/13.
Last year, the Team recommended that the Ministry of Health should progress the proposed development of the social marketing
campaign and new media resources for suicide prevention in 2013. The recommendation focused on specific aims to:
• develop multimedia and new media resources targeting young people and providing support and information to those
affected by a suicide or suicide attempt; and
194
195
196
197
198
199
Suicide Prevention Australia 2010, Position statement: youth suicide prevention, Sydney: SPA, p. 4.
Suicide Prevention Australia 2010, op. cit.
NSW Department of Health 2010, NSW Suicide Prevention Strategy 2010-2015: Sydney: NSWDH, p. 1.
NSW Department of Health 2010, NSW Suicide Prevention Strategy Implementation Plan 2010-2015, Sydney: NSWDH, p. 10.
NSW Department of Health 2010, op. cit., p. 21.
NSW Ministry of Health 2012, First Progress Report of the NSW Suicide Prevention Strategy 2010-2015, Sydney: NSW Health,
http://www0.health.nsw.gov.au/pubs/2012/suicide_prevent_strat.html, accessed 1 July 2013.
200 NSW Ministry of Health 2012, NSW Suicide Prevention Strategy 2010-2015 First Progress Report September 2010 – March 2012,
Sydney: NSW Health, p. 10.
201 NSW Department of Health 2010, NSW Suicide Prevention Strategy Implementation Plan 2010-2015, Sydney: NSWDH, p. 21
110
NSW Child Death Review Team | Annual Report 2012
• develop effective strategies to raise awareness among young people of suicide prevention, to promote help-seeking
behaviour, and to challenge the stigma associated with suicide.
Health has advised that the proposed development of awareness-raising multimedia resources for young people has been
superseded by the Ministry contracting the Hunter Institute of Mental Health to develop broader suicide prevention online
resources, Conversations Matter.
The resources aim to raise community awareness of how to communicate safely and without harm about suicide, and will
provide specific advice for particular target populations (including schools, families and community). This includes broad
conversations about suicide and its prevention (intervention-focused) and conversations that occur following a suicide death
(postvention-focused).
Advice has been sought on the needs of children and young people in talking about suicide from a range of agencies,
including the Commission for Children and Young People, Headspace, and MH-Kids.
Health has indicated that future activity in this area is to be guided by work currently underway by the NSW Mental Health
Commission to develop an implementation plan that will guide work to prevent and/or reduce suicide, as well as the Strategic
Plan for Mental Health.
The Team will monitor the progress of the Ministry of Health’s work in relation to Conversations Matter, and will meet with
the NSW Mental Health Commission to discuss the development and scope of relevant strategic and implementation plans
targeting the prevention of suicide deaths of young people, and broader work to evaluate the outcomes of the NSW Suicide
Prevention Strategy.
Recommendations
Ministry of Health
12.The Ministry of Health should provide detailed advice to the Team on the progress of the project to develop
resources to support safe and effective discussion of suicide, Conversations Matter. The advice should
include information about the intended approach of the project in relation to children and young people, and
timeframes for completion.
NSW Child Death Review Team | Annual Report 2012
111
Chapter 22. Fatal assault
The deaths of four children registered in NSW in 2012 were the result of fatal assault.
In 1998-2012, 185 children in NSW died from injuries sustained in fatal assaults. The four deaths in 2012 comprise the smallest
proportion of child deaths from fatal assault since the Team commenced in 1996. The number of deaths from assault is much
lower than may have been expected based on the recent trend: for the past eight years, the number of deaths from this cause
has ranged from eight to 14 per year.
However, as previously noted by the Team in its 2008 report on Trends in the fatal assault of children in NSW: 1996-2005,
‘[t]he number of deaths of vulnerable children appears to vary by chance, and caution needs to be exercised in drawing any
conclusion… A drop in numbers for any particular year need not indicate an improvement, just as an increase in numbers in
any particular year need not indicate a worsening: rather they reflect the erratic nature of such deaths.’202
Due to the small number of fatal assault deaths in 2012, we have exercised caution in describing the circumstances of these deaths.
22.1 Demographic and individual characteristics
22.1.1 Age, gender and Aboriginal and Torres Strait Islander status
In 2012, the four children who died as a result of fatal assault were aged between two and 17 years. All of the children were
male, and one child was Aboriginal.
As shown in table 72, over the past 15 years, the largest proportion of deaths of children from assault has involved children
under the age of five years. One-quarter of the children who died from assault in that period were aged 15-17 years.
Male children are more likely to die as a result of fatal assault than females. Table 71 shows that, over the 15-year period,
males accounted for 62 per cent of fatal assault deaths.
Table 71: Fatal assault deaths by age range, 1998-2012
Age
Number (% rounded)
< 1 year
36 (19)
1-4 years
57 (31)
5-9 years
25 (14)
10-14 years
21 (11)
15-17 years
46 (25)
Total
185 (100)
Table 72: Trends in deaths of children due to fatal assault by gender, 1998-2012, number and (Crude
Mortality Rate)
1998
1999
2000
2001
2002
2003
2004
2005
2006
2007
2008
2009
2010
2011
2012
Total
Male
10
(1.2)
10
(1.2)
10
(1.2)
8
(1.0)
7
(0.8)
10
(1.2)
3
-
11
(1.3)
11
(1.3)
5
(0.6)
8
(1.0)
5
(0.6)
11
(1.3)
4
(0.5)
4
(0.5)
115
Female
7
(0.9)
5
(0.6)
6
(0.8)
7
(0.9)
2
-
10
(1.3)
6
(0.8)
0
-
0
-
3
-
5
(0.6)
2
-
3
-
7
(0.9)
0
-
70
Both
17
(1.1)
15
(0.9)
16
(1.0)
15
(0.9)
9
(0.6)
20
(1.2)
9
(0.6)
13
(0.8)
11
(0.7)
8
(0.5)
13
(0.8)
7
(0.4)
14
(0.9)
11
(0.7)
4
(0.2)
185
202 NSW Child Death Review Team 2008, Trends in the fatal assault of children in NSW: 1996-2005, Sydney: NSW Commission for Children and
Young People, p. 10.
112
NSW Child Death Review Team | Annual Report 2012
22.1.2 Child protection history
The families of half of the children who died in fatal assault incidents in 2012 had a child protection history. In the three years
before their death, one child had been the subject of risk of a significant harm report to Community Services and one child
had a sibling who had been the subject of a report.
In NSW, children who have died in circumstances of abuse have consistently been more likely to have had a child protection
history. In 2010 and 2011, half of the families of children who died in abuse-related circumstances had a child protection history.203
22.2 Circumstances of fatal assault
Three of the four assault deaths in 2012 occurred within a familial context, allegedly involving biological parents and a step-parent.
One teenager was allegedly killed by a peer. Three of the alleged offenders were male, and two were female.
The children allegedly died as a result of knife wounds (2), blunt force trauma, and other maltreatment. Police have laid charges
against four alleged offenders in relation to three of the fatal assault deaths. At the time of writing, these cases were still subject
to criminal proceedings. In the fourth case, the alleged perpetrator also died in the incident, which was an apparent murder-suicide.
Most fatal assault deaths of children in Australia are familial homicides.204 205 As illustrated in table 73, this has been the case
in NSW over the last 15 years with the exception of 2010, when deaths of teenagers allegedly killed by peers outnumbered
familial homicide.
More than two-thirds (69%) of the child homicides were committed by family members, primarily parents. The remaining
assaults were perpetrated by peers (16%) or other unrelated persons (15%). Peer homicide generally relates to young people
in a context of confrontational violence between friends, acquaintances and strangers.206 Peers are generally close in age and
social status.
Table 73: Trends in deaths of children due to fatal assault by offender relationship to child, 1997-2011
1998
1999
2000
2001
2002
2003
2004
2005
2006
2007
2008
2009
2010
2011
2012
Total
Familial
9
10
10
11
5
14
6
12
11
5
12
7
5
8
3
128
Peer
4
2
2
0
1
4
1
1
1
1
2
1
7
2
1
30
Other*
4
3
4
4
3
2
1
1
0
2
0
0
2
1
0
27
17
15
16
15
9
20
8
14
12
8
14
8
14
11
4
185
Total
* ‘Other’ offender types in fatal assault include where the perpetrator is unknown, a stranger or an acquaintance.
As all fatal assault deaths are reviewable deaths, the deaths reported here will be the subject of further detailed analysis by
the Ombudsman.
203 NSW Ombudsman 2013, Report of reviewable deaths in 2010 and 2011: volume 1: child deaths, Sydney: NSW Ombudsman, p. 1 and p. 20.
204 Familial homicide includes filicide (custodial and non-custodial parents or step-parents), siblicide, and killings by other family members, including
extended family.
205 Australian Institute of Criminology 2013, Homicide in Australia: 2008–09 to 2009–10 National Homicide Monitoring Program annual report, cat. no.
Monitoring Report 21, Canberra: AIC.
206 NSW Ombudsman 2013, Report of reviewable deaths in 2010 and 2011: volume 1: child deaths, Sydney: NSW Ombudsman, p. 25. This report
includes an analysis of peer-related homicides 2002-2011.
NSW Child Death Review Team | Annual Report 2012
113
Chapter 23. Monitoring recommendations
23.1 Sudden Unexpected Death in Infancy (SUDI)
Ministry of Health
Recommendation 1
NSW Kids and Families response 2013
The Ministry of Health should review the purpose, terms
of reference and membership of the NSW Sudden
Infant Death Advisory Committee. The review should
include consideration of the Committee’s role in:.
In September 2013, NSW Kids and Families advised that the
review of the Sudden Infant Death Advisory Committee (SIDAC)
had been completed. The agency indicated that it would progress
implementation of the review recommendations, including
reviewing the Health policy directive Death – Management of
Sudden Unexpected Death in Infancy, and the service model
underpinning the policy.
• Advising on the potential for NSW to adopt a
multi-disciplinary case review approach to the SUDI
investigation process, and the potential for a more
centralised response to SUDI.
• Providing a point of co-ordination for public
education strategies using best-evidence
educational methods, including targeted
strategies to high-risk groups.
• Promoting safe sleep practices in maternity facilities,
including education strategies for midwives and
maternity staff.
On related matters, NSW Kids and Families advised in
July 2013 that:
• File audits to assess compliance with the policy directive
Death – Management of Sudden Unexpected Death in Infancy
had been delayed but had now recommenced. The Clinical
Excellence Commission has identified a paediatric medical
officer to assist with the audit, and relevant files have been
requested from the Local Health Districts.
• Release of the revised policy Maternity – Safer Sleeping
Practices for Babies in NSW Public Health Organisations has
been promoted through Local Health Districts, the Clinical
Excellence Commission, and Statewide forums. Chief
Executives of NSW Public Health organisations are responsible
for ensuring that quality assurance processes are in place,
including an annual local audit of safer sleeping practices, to
ensure compliance with the policy directive.
• NSW Kids and Families is consulting with SIDS and Kids and
with Community Services regarding the available education
resources and online training packages for staff. A number
of packages are currently being assessed, and advice will be
provided to LHDs when one or more packages are selected.
Recommendation 2
NSW Kids and Families response 2013
The Ministry of Health should:
NSW Kids and Families advised that it had engaged an
independent consultant to conduct a thorough literature review
to determine if there is any known association between SUDI
and prop-feeding. In April 2013, the consultant reported that no
association could be found in the literature.
• Undertake research into the risks associated with
‘prop’ feeding or leaving infants to feed from a
bottle unattended, and
• Subsequent to the findings of this research, review
the adequacy of advice and education strategies
for parents and carers around these issues.
114
Health advised that it will continue to encourage parents to
breastfeed for as long as possible, and to hold their babies while
bottle feeding to encourage optimal parent-infant attachment.
Parents will continue to be discouraged from prop feeding their
infants, and NSW Kids and Families will continue to monitor the
literature for any further evidence on the issue.
NSW Child Death Review Team | Annual Report 2012
The Team’s response
The Team notes the work undertaken by NSW Kids and Families to
implement the Team’s recommendation regarding prop-feeding,
and the agency’s continued attention to evidence-based practice.
The Team welcomes NSW Kids and Families’ advice that it will
review the Health policy directive on the management of SUDI,
including the underlying service model, and that file audits to
assess Local Health Districts’ compliance with the policy directive
have recommenced.
However, overall, work to progress the Team’s recommendations
concerning SUDI has been slow. The Team has made further
recommendations with the aim of progressing key areas of
concern and improving practice in relation to SUDI.
Department of Family and Community Services, Community Services
Recommendation 3
Community Services response 2013
The Child Deaths and Critical Reports (Community
Services) should conduct a cohort review of SUDI
where the infant’s family had a child protection history.
The purpose of the review should be to develop
targeted strategies and training resources to assist
caseworkers assess risk for infants and provide
casework services to at-risk families
Community Services advised that the agency accepted the
recommendation in full and noted that the cohort review would
complement the work CS had previously done to promote the
awareness of modifiable risk factors for sudden and unexpected
infant death.
As at May 2013, the work had involved a survey of staff
knowledge, finalisation of data for the sample group, and a review
of relevant literature. Community Services has also met with
staff from NSW Kids and Families to discuss opportunities and
strategies to strengthen the interagency response.
Community Services also noted agreement with the Team’s
recommendation to the Ministry of Health in relation to reviewing
the membership of the NSW Sudden Infant Death Advisory
Committee. The agency advised that it would welcome an
invitation to participate on this committee.
The Team’s response
The Team welcomes Community Services’ progress in
addressing the recommendation, but notes that the review is in
its early stages. The Team will continue to monitor the progress of
the cohort review.
23.2 Transport fatalities
Centre for Road Safety
Recommendation 4
Centre for Road Safety response 2013
The Centre for Road Safety should co-ordinate the
implementation of a consistent method of collecting,
analysing and publishing data about low-speed vehicle
run-over incidents.
The Centre for Road Safety (CRS) advised that it is in the final
stages of developing a new database system, Crashlink 2, which
includes a spatial layer that will enable the ongoing recording and
reporting of off-road incidents that are reported to police. CRS
NSW Child Death Review Team | Annual Report 2012
115
As part of this work, the Centre for Road Safety should
liaise with the Ministry of Health regarding the potential
for data linkage to include incidents resulting in child
injury that are not attended by police.
Consideration should be given to extending such a
data collection exercise to all non-traffic vehicular
incidents resulting in injury or death.
noted that this would also facilitate the summation of reported
off-road low speed run over crashes retrospectively back to
approximately 1997.
CRS indicated that it is developing a new website, which will
include prominent promotion of driveway safety messaging and
(once Crashlink 2 is completed) an off-road crash data summary
in the Statistics section.
In 2012, the Transport and Road Safety Research group at the
University of NSW completed a data linkage of the NSW crash
database to health and emergency data, and Births, Deaths and
Marriages data in 2001-2009 for CRS. This data is now being
analysed, and will include the analysis of low speed run over
incidents that are not reported to police.
CRS is currently initiating the linkage of the 2010 and 2011
datasets and is working with NSW Health to develop a more
regular system of linkage.
Recommendation 5
Centre for Road Safety response 2013
The Centre for Road Safety (CRS) should bring
together key injury prevention agencies to consider
the findings of this report to identify whether specific
strategies are needed within NSW to reduce the risk
of death and injury of children in low speed vehicle
run over incidents. Key agencies should include the
Motor Accidents Authority, KidSafe, Kids and Traffic,
Kids Health, and the National Roads and Motoring
Association. In particular, the CRS, with agencies,
should consider:
In relation to public awareness strategies, CRS advised that, in 2012:
• existing or planned initiatives within NSW and at
the national level;
• the need for targeted research, including
environmental and vehicle design elements of
prevention and attitudinal research relating to
parent and carer perceptions of risk; and
• the need for public awareness strategies, including
up-to-date and consistent print and electronic
media resources that recognise the behavioural,
environmental and vehicle design elements
of prevention.
• Transport for NSW sponsored a six-week newspaper
campaign: ‘Check, See – Turn the Key’, which included
in-depth articles, distribution of car stickers, a TV spot, and
release of a new Wiggles road safety song.
• CRS released the Road Safety: A guide for families and carers
of children 0 to 5 years resource, which includes a section on
driveway safety. The resource was distributed to almost 3,500
early childhood centres and to some hospitals.
• Kids and Traffic delivered 222 workshops to educators in
children’s services to increase awareness and education
around driveway safety, and provided Driveway Safety
Display Kits.
• The Federal Government held a National Road Safety
Forum, which included the agencies listed in the Team’s
recommendation. At the Forum, the Federal Government
released a brochure on driveway safety and a report: ‘Child
Pedestrian safety: Driveway deaths and low speed run-overs’.
In 2012, the Minister for Roads and Ports raised the issue
of mandating reverse camera technology with the Federal
Government, the Australasian New Care Assessment Program,
and the Standing Committee on Transport and Infrastructure. In
response, the Federal Department for Infrastructure and Transport
has initiated an international study of the road safety benefits of
reversing technology.
CRS advised that, once the analysis of the data on incidents
not reported to police is undertaken (see response to
recommendation 4), it would convene the stakeholders listed in
the Team’s recommendation to analyse the new data from the
linkage study (and in time, the complete Crashlink 2 dataset of
off-road incidents) and determine further countermeasures to
address low speed vehicle run overs.
116
NSW Child Death Review Team | Annual Report 2012
The Team’s response
The Team notes the considerable work that is underway by the
Centre for Road Safety to improve the collection, analysis and
reporting of off-road vehicle crash data, including low speed
vehicle run over incidents. However, it is not clear at this stage
whether CRS has given consideration to extending the data
collection to all non-traffic vehicular incidents resulting in injury or
death.
The Team welcomes the range of public awareness strategies
implemented by CRS/Transport for NSW to reduce the risk
of death and injury of children in low speed vehicle run over
incidents. The work to bring together the key injury prevention
agencies to consider the findings of the previous CDRT report
regarding low speed vehicle run overs is scheduled to take
place following CRS’ analysis of data relating to off-road vehicle
incidents. The Team will monitor CRS’ continuing and important
work in relation to low speed vehicle run over fatalities.
23.3 Drowning deaths
Boating
Office of Boating Safety and Maritime Affairs (NSW Transport)
Recommendation 6
Office of Boating Safety and Maritime Affairs response 2013
The Office of Boating Safety and
Maritime Affairs should provide advice
to the Team regarding strategies in
place or planned to promote boating
water safety, particularly in relation
to the safety of children and young
people on boats, and education about
new life jacket regulations.
In line with the new requirements governing life jacket use for recreational boaters
introduced in November 2010, the Office of Boating and Safety Maritime Affairs
(OBSMA) has enforced sanctions for breaches, and developed a Boating Safety
Education and Communication Strategy 2012-2015, which includes a focus on the
need to wear lifejackets.
OBSMA has advised the Team that 2012/13 saw the largest public awareness
campaign for lifejacket wear, aimed at a broad base of boaters, including
children. In addition, OBSMA has provided lifejackets to Maritime teachers across
NSW in high schools, and partnered with the Boating Industry Association of
NSW to deliver safety and information packs at the Sydney International Boat
Show. To date, OBSMA has funded the distribution of over 4,000 life jackets.
There are over 60 boating safety officers on NSW waters who educate boaters
about water safety. Since November 2010, safety officers have penalised
skippers if a child on their boat is not wearing a life jacket.
The Team’s Response
The Team notes the actions taken to date by the Office of Boating Safety and
Maritime Affairs to promote boating water safety, the safety of children and young
people on boats, and education about the life jacket regulations.
NSW Child Death Review Team | Annual Report 2012
117
Floodwaters
State Emergency Service
Recommendation 7
State Emergency Service response 2013
The State Emergency Service provide
advice to the Team regarding the nature
and scope of strategies in place or
planned to promote to children and their
parents and carers the risks associated
with, and safety strategies around,
floodwater and flooded waterways.
The NSW State Emergency Service (SES) advised that it has three targeted
education programs for children and their parents that address the risks
associated with, and safety strategies around, floodwater and flooded
waterways: StormSafe, FloodSafe and TsunamiSafe.
The programs include key safety messaging around never playing in floodwater
and staying clear of hazardous watercourses such as drains, gutters, stormwater
channels, creeks and rivers.
The SES’ ‘I’m a StormSafe Kid’ and ‘I’m a FloodSafe Kid’ programs are aimed
at empowering young people to help take appropriate responsibility for the
preparedness of their family and friends, including encouraging safer behaviour
from their peers.
Safety messages are delivered through school programs, engagement at
community events and age-specific promotional items. The SES has developed
take-home packs to complement the schools-based programs to improve
children’s education and emergency preparedness.
The SES also advised that it has previously worked with the Australasian Fire and
Emergency Services Council and other agencies to develop a series of multihazard education community service announcements aimed at primary school
children. Copies of the episodes have been provided to all SES Regions and
Units to supplement school strategies, and corresponding lesson plans were
distributed to all primary schools.
The Team’s response
The Team notes the important strategies that the State Emergency Service has
put in place to increase the awareness of children and their families of the risks
associated with floodwater and flooded waterways.
Private swimming pools
Department of Premier and Cabinet, Division of Local Government
Recommendation 8
Division of Local Government response 2013
In registering a pool, the prescribed
information that owners should
provide should include details
about whether children reside at the
property, and if so, their age(s); and
if children are not resident, whether
children are regular visitors.
The Division of Local Government (DLG) advised that it has not adopted the
Team’s recommendation. Instead, the DLG has sought to implement the intent of
the recommendation ‘by including it as a consideration for Councils in developing
their pool inspection programs, given it is a significant risk factor.’ DLG advised
that Councils have access to demographic information that will assist them in
assessing this risk factor and prioritising inspections in their community.
Recommendation 9
Division of Local Government response 2012
DLG has indicated that it made the decision not to implement the specifics of the
recommendation in recognition of the public’s sensitivity to revealing how many
children and their ages are residing at, or regularly visit, a particular address.
The DLG considers that a compulsory response to such questions would have
a detrimental effect on the willingness of pool owners to register their pools.
If registration is based on self-certification, DLG has advised that the registration scheme is not based on self-certification.
an evaluation of the scheme should be
Rather, it is based on self-assessment by pool owners followed by external
undertaken within three years of
certification by a council officer or private certifier.
118
NSW Child Death Review Team | Annual Report 2012
implementation, and should include
consideration of the frequency of
self-certification and the adequacy
of self-certification as opposed to
external certification.
Recommendation 10
If inspection programs are to be the
responsibility of individual Councils, such
programs should be supported
by model policies that must be complied
with by councils, and that provide
for a broadly consistent approach
to inspections across NSW.
Model policies should provide for
the effective targeting of inspection
demographics. Model policies would
detail the basic requirements for a
programs, while accommodating for
differences in Council size and local
program of inspection, and would
include but not necessarily be limited
to, requirements for inspection of:
DLG advised that recommendations 10 and 11 have been partially implemented.
The Division is drafting guidelines to assist Councils to develop their pool
inspection programs.
The guidelines will include the breadth of possible inspection activities, as
described by the amended legislation, and will identify the matters that should
be considered in taking a risk-based approach to developing such programs.
In addition to the guidelines, other resources and support will be made available
to Councils. In this regard, Councils will be provided with a list of risk factors to
be considered when developing inspection programs, one of which is local area
demographics. DLG advised that it encourages Councils to target resources
towards swimming pools used by children, particularly very young children.
• tourist, visitor and multi-occupancy
developments;
• properties that are being newly leased
or sold; and
• properties at which young children are
recorded on the register as residing.
Recommendation 11
Swimming pool inspection programs
should be targeted to swimming pools
at premises where children, particularly
those under five years of age, reside or
regularly visit. This should be a consistent
approach across NSW.
Recommendation 12
NSW Councils should be required to report
annually on the number of swimming
pool inspections undertaken, the level
of compliance with the requirements of
the Swimming Pools Act, orders issued
by councils to rectify non-compliance,
and whether or not owners have rectified
defects within a reasonable period of time.
DLG has advised that, to give effect to this recommendation, the Swimming
Pools Act requires Councils to report actions taken in relation to swimming pool
inspection programs as prescribed by the Regulations.
The Regulations are currently in draft form, and will include reporting provisions
designed to assess the effectiveness of the Swimming Pool Act amendments on
councils’ operations, community awareness and reduced incidence of injury or
death related to child immersions.
Recommendation 13
Amendments to the Swimming Pools
DLG advised the Team that, in response to this recommendation, and
Act should be accompanied by a
accompanying the implementation of the state-wide register of swimming
comprehensive education and awareness pools, an ongoing education and awareness campaign will be conducted
NSW Child Death Review Team | Annual Report 2012
119
campaign that targets metropolitan
and non-metropolitan areas and
homeowners and private and social
housing tenants, and that includes, but is
not limited to:
• the need for active adult supervision
in conjunction with Royal Life Saving Australia (NSW) and other stakeholder
agencies from late April 2013 until June 2014.
Resources will be developed in 16 community languages and multimedia
platforms, and target key user groups such as parents, pool owners, councils,
private certifiers, property conveyance practitioners, lawyers, strata managers,
bodies corporate and real estate agents.
of children around pools
• compliance requirements for above
ground and portable pools, and
• the need for regular maintenance
checks of pool-safety barriers,
with specific note of the need for
maintenance of gate and latch
mechanisms.
Recommendation 14
The Division of Local Government,
Department of Premier and Cabinet,
in conjunction with Royal Life Saving
Australia and the Real Estate Institute
of NSW should develop an educational
resource targeting lessees of rental
properties outlining the legal and
safety requirements for installing an
above ground or inflatable pool at
rented premises.
The Division has yet to target residential tenants specifically, but is working with
Royal Life Saving Australia (NSW) to target information to real estate agents.
As part of the next phase of educational resource development, the Division
is seeking to extend this work to include specific resources that can be
disseminated to tenants in both public and private lease situations later
this year.
The Team’s response
It is important that Councils are able to clearly identify swimming pools at
properties where young children reside or regularly visit, in order to prioritise
inspections. The Team appreciates the reasoning behind the Department
of Local Government’s decision not to require pool owners to provide such
details when registering their pool. However, it is not clear what ‘demographic
information’ Councils have access to that will enable them to adequately identify
which pools have children on the premises (either as residents or regular
visitors). Given the importance of this issue, the Team has made a further
recommendation to DLG.
While the Division indicates that it encourages Councils to target resources
towards swimming pools used by young children, it is not clear how this is done,
or whether the guidelines in development will address the key elements of the
Team’s recommendation. The Team has made a further recommendation to DLG
in this regard.
The Team notes that reporting requirements relating to compliance with the
Swimming Pools Act will not come into effect until the Regulations are finalised
and enacted, and DLG has not provided a timeframe for this work. It is not
clear whether the Regulations will require reporting of all of the elements
recommended by the Team. The Team will continue to pursue this issue.
The Team welcomes the education and awareness program that is being
undertaken by DLG and its partners, and notes that the publications include
information relating to the key messages identified in the Team’s recommendation.
The Team notes that work to provide key information to public and private
lessees is currently in development, and will monitor progress in this area.
120
NSW Child Death Review Team | Annual Report 2012
Department of Family and Community Services, Housing NSW
Recommendation 15
Housing NSW response 2013
Housing NSW should review current
installation and inspection requirements
for above-ground swimming pools at
departmental owned and managed
properties, particularly in relation to
fencing requirements.
Since the Team’s recommendation, Housing NSW has completed a review of its
operational guidelines, including policy, procedure and client communications.
The review has confirmed that the guidelines are correct according to the
Swimming Pools Act. However, Housing NSW noted that staff and tenants would
benefit from more detail around the policy, which should inform tenants of their
obligations, and inform Housing NSW staff of the appropriate action they should
take in relation to swimming pools.
Housing NSW has advised that it has worked closely with the Land and Housing
Corporation to ensure that staff and clients are aware of the Swimming Pools Act
and the requirements of the Pool Safety Act. As part of this work, the agency has:
• developed new guidelines for all staff to ensure that tenants understand their
obligations and remove unauthorised pools as soon as possible, and
• included information about tenants’ obligations under the Swimming Pools Act
in the September 2013 newsletter Your Home, and on the agency’s website.
The Team’s response
The Team notes the actions that have been taken by Housing NSW in response
to this recommendation.
23.4 Poisoning
Clinical Excellence Commission/Medication Safety Expert Advisory Group
Recommendation 16
Clinical Excellence Commission response 2013
The Clinical Excellence Commission,
with the Medication Safety Expert
Advisory Group, and in consultation
with the Pharmacy Improvement
Program of Health Services Support
(HealthShare NSW), should:
The Clinical Excellence Commission (CEC) advised that, following a review of the
capacity of the iPharmacy software, a specific warning code ‘KIDCAP’ has been
designed and added to the system to identify medicines requiring a child-resistant
closure. For all such medicines, the labels generated in iPharmacy will contain the
warning flag ‘KIDCAP’. In addition, the warning statements within the iPharmacy
system state ‘child-resistant packaging required’.
(a) Review the capacity of pharmacy
software across NSW Health
facilities to flag medicines requiring
child-resistant packing during the
dispensing process. A flag should
alert pharmacists to medications
that must be dispensed in childresistant packaging, and act as
a prompt to advise patients or
parents that the medicine should
not be removed from the childresistant packaging.
The warning code has been incorporated into the version of iPharmacy currently
available to NSW hospital pharmacies, and has been applied to all relevant
medicines as identified by TGO 80 and TGO 80A. The CEC advised that the
required label changes are expected to take place over the second half of 2013
across NSW.
Information will be provided to pharmacies across NSW explaining the changes to
the iPharmacy system and what action pharmacy staff must take in response to
the ‘KIDCAP’ warning flag. The required actions will include the provision of childresistant packaging as well as highlighting to consumers the need to retain the
product in child-resistant packaging.
The Policy Directive Medicines Handling in NSW Public Hospitals is currently being
reviewed (due for release in the second half of 2013), and draft revisions include
NSW Child Death Review Team | Annual Report 2012
121
(b) Include in the Medication Safety
Self Assessment audit tool
components to assess safety
measures relating to use of childresistant closures for medications
and compliance with Therapeutic
Goods Order No. 80.
statements about the provision of medicines in child-resistant packaging and
the use of iPharmacy to prompt this. In the interim, an Information Bulletin will be
issued alerting the NSW Health system to the required changes.
The Medication Safety Self Assessment for Australian Hospitals is currently under
review. As part of the review process, consideration will be given to incorporating
an item related to child-resistant packaging in the relevant section of the tool.
The Team’s response
The Team notes the considerable work that has been undertaken by the Clinical
Excellence Commission and its partners to address the recommendation.
23.5 Suicide
Ministry of Health
Recommendation 17
Clinical Excellence Commission response 2013
The Ministry of Health should progress
the proposed development of a social
marketing campaign and new media
resources for suicide prevention in 2013
with specific inclusion of aims to:
Health has advised that the proposed development of awareness-raising
multimedia resources for young people has been superseded by the Ministry
contracting the Hunter Institute of Mental Health to develop broader suicide
prevention program online resources, Conversations Matter.
• Develop multimedia and new media
resources that target young people
and provide support and information
to those affected by a suicide or
suicide attempt.
• Develop effective strategies to raise
awareness among young people of
suicide prevention, to promote helpseeking behaviour, and to challenge
the stigma associated with suicide.
The resources aim to raise community awareness of how to communicate safely
and without harm about suicide, and will provide specific advice for particular
target populations (including schools, families and community). Advice has been
sought on the needs of children and young people in talking about suicide from
a range of agencies, including the Commission for Children and Young People,
headspace, and MH-Kids.
Health has indicated that future activity in this area is to be guided by work
currently underway by the NSW Mental Health Commission to develop an
implementation plan that will guide work to prevent and/or reduce suicide, as well
as the Strategic Plan for Mental Health.
The Team’s response
The Team notes the actions taken by the Ministry of Health to contract the
development of suicide prevention online resources, and will monitor the
progress of this work.
Given the importance of reducing the suicide deaths of young people, the
Team will also meet with the NSW Mental Health Commission to discuss the
development and scope of relevant strategic and implementation plans targeting
this issue, and broader work to evaluate the outcomes of the NSW Suicide
Prevention Strategy.
122
NSW Child Death Review Team | Annual Report 2012
Appendix 1: Methods
Base-line measurements
The report methodology is underpinned by survey data and estimates produced by the Australian Bureau of Statistics (ABS).
Population estimates
The comparative population size for the Crude Mortality Rate calculations are sourced from a range of ABS reports, including
tables supplied by ABS to order:
• The base population for sex and age was taken from the latest ABS release of the NSW population by single year of age.207
• The base populations by Socio Economic Index for Areas (SEIFA), Index of Relative Disadvantage (IRSD) quintiles were
taken from a table supplied to order by ABS.
• The base populations by age and remoteness were taken from tables that the ABS supplied to order.208
• Infant mortality rates were calculated from the number of live births in NSW in 2011209 and the breakdown of population and
births in NSW by Statistical Local Area.210 The SEIFA IRSD scores for Statistical Local Areas in NSW produced the base
populations for births in high and low SES areas.
• Indigenous population estimates were taken from the 2006211 census and a table of indigenous population in NSW by age
and sex supplied by ABS to order.212
For the calculation of Crude Mortality Rates in the suicide category, the base populations were those within the age range of
observed suicides (10-17 years).
Remoteness
Remoteness was measured using the Aria-Plus index,213 a measure of access to services using proxy measures of distance to
the five nearest centres of defined populations. The breakdown of population by age categories in the six ARIA categories as
of 30 June 2011 was supplied by the ABS to order.
As the ABS is changing its underlying geographic spatial structures from Australian Standard Geographical Classification
(ASGC) to Australian Statistical Geography Standard (ASGS), this is the last year that data listed by ASGC will be available.
Addresses that were assigned to a given area in the ASGC may be grouped slightly differently under the ASGS and,
consequently, geographic patterns may be subject to change in the next report. It is likely that the changes will be minimal at the
higher level of remoteness grouping, however caution should be applied when analysing and interpreting changes through time.
The remoteness (ARIA) scores were missing in 2012 for 15 children: four were resident overseas, one was resident interstate,
and 10 did not have postcodes, or had postcodes that did not map correctly.
Relative socioeconomic status
Socioeconomic status refers to the relative access to material resources of an individual or group. The indicator of the
socioeconomic status of a child used in this report is the Index of Relative Social Disadvantage (IRSD) of the area in which a
child normally resided.
207
208
209
210
211
212
213
Australian Bureau of Statistics, 2013, 3101.0 Australian Demographic Statistics (TABLE 51. New South Wales, 2013), Canberra: ABS.
Australian Bureau of Statistics, 2013, Estimated Resident Populations by NSW Remoteness Areas, by age groups, Canberra: ABS.
Australian Bureau of Statistics, 2012, 3301.0DO001_2011 - Births, Australia, 2011 Canberra: ABS.
Australian Bureau of Statistics, 2012, 3301.0DO0003_2011 - Births, Australia, 2011 Canberra: ABS.
Australian Bureau of Statistics, 2010, 2068.0 Indigenous Status by age by sex (1996-2006) Canberra: ABS.
Australian Bureau of Statistics 2012, Indigenous experimental population projections by age, by sex – Reference period 2010 Canberra: ABS.
Australian Population and Migration Research Centre, 2013, ARIA (Accessibility/Remoteness Index of Australia), Adelaide: APMRC.
http://www.adelaide.edu.au/apmrc/research/projects/category/about_aria.html, accessed 19 August 2013.
NSW Child Death Review Team | Annual Report 2012
123
Socioeconomic status is reported by quintiles. Quintile 1 represents the relatively most disadvantaged 20 per cent, and quintile
5 the relatively least disadvantaged 20 per cent.
In this report, socioeconomic status is not included in calculations for children whose main residence was outside of the state
or overseas. Twenty-four children did not have an IRSD score, of which 11 also did not have an ARIA score. In the remaining
13 cases, the usual residence was in another state, and not included in the list of IRSD scores corresponding to postcodes.
Indigenous identification
Individual children are identified as Aboriginal or Torres Strait Islander if:
• The child has been identified as either Aboriginal or Torres Strait Islander on their NSW Births Deaths and Marriages
death certificate.
• The child or their parent/s have been identified as either Aboriginal or Torres Strait Islander on their NSW Births Deaths
and Marriages birth certificate.
• Agency records identify the child as Aboriginal or Torres Strait Islander through a number of records, which are
corroborative. Records used to do this include the NSW Police Computer Operated Policing System and Community
Service KIDS client database, which often hold information that can support Aboriginal or Torres Strait Islander identity.
NSW Health and other agency records were also used to assess the child and family background.
The Perinatal Data collection also provides an additional source of information in identifying a child as Aboriginal or Torres
Strait Islander.214
Classification of cases
In relation to cause of death, individual cases are, with the exception of Sudden Unexpected Death in Infancy (SUDI), reported
against a specific category within the report. SUDI is not a cause of death. For this reason, SUDI cases with known underlying
causes of death are reported in the sections pertaining to those underlying causes.
For natural cause deaths, reporting categories align with chapter levels of the International Statistical Classification of
Diseases and Related Health Problems (ICD). This is also generally (but not always) the case for external cause deaths, where
precedence may be determined according to the most appropriate category for considering prevention.
Calculations
Mortality rates
The Crude Mortality Rates (CMR) were calculated as rates per 100,000 persons. This was done in SQL or Excel by dividing
the number of deaths in a given category by the population that was appropriate for the category. For example, the CMR for
deaths of children from all causes in 2012 was (493/1642401 x 100000) = 30.01.
Directly Standardised Mortality Rates (DSMR) were also calculated as rates per 100,000 persons. The DSMR differs from the
CMR in that it is adjusted for the difference in the age structure of the current population compared with a standard population
(in this case, 2001). The adjustment allows comparison between years.
Here, the age-adjustment method used the number of deaths in each year age category for each year and the population
in each year age category for each year (and number of deaths and populations separately by gender where appropriate).
Calculation of DSMR and associated confidence intervals was performed using the R statistical language,215 specifically, using
the ageadjust.direct function in the epitools package.216
Infant Mortality Rates (IMR) were calculated as rates per 1,000 live births. The number of infant deaths in a given category is
divided by the total number of live births for the year and multiplied by 1000. Data on live births in 2012 were not available at the
time of writing this report, so 2011 birth figures were used. For example, in 2012 the IMR for infants (under 1 year) where the cause
of death was a disease of the circulatory system was (5 / 99054 x 1000) = 0.05. These calculations were performed in Excel.
214 The NSW Perinatal Data Collection is a state-wide surveillance system that monitors patterns of pregnancy care, services and pregnancy outcomes.
215 R Development Core Team 2010, R: A language and environment for statistical computing. R foundation for Statistical Computing, Vienna: Austria.
ISBN 3-900051-07-0, http://www.R-project.org
216 Aragon, T. 2010, epitools: Epidemiology Tools. R package version 0.5-7, Berkeley, CA: University of California, http://CRAN.R-project.org/
package=epitools
124
NSW Child Death Review Team | Annual Report 2012
Confidence intervals
If the number of observed cases was less than 100, confidence intervals were calculated directly from the Poisson distribution,
as recommended by the Washington State Department of Health.217 The pois.exact function from the epitools package in
R was used. When the number of cases was 100 or more, the normal approximation was used to calculate the confidence
intervals. The equation applied was: (±1.96 x (CMR or appropriate rate) / √ (number of deaths)).
Incident rate ratios
Incident rate ratios are a pairwise comparison of mortality rates. In the 2012 report, they were calculated to compare male with
female rates and Aboriginal/Torres Strait Islander with non-Aboriginal/Torres Strait Islander rates. Where the ratio is equal to
one, rates were equal. Where the ratio was greater than one, male or Aboriginal/Torres Strait Islander rates were higher. Where
they were less than one, female or non-Aboriginal/Torres Strait Islander rates were higher.
P values
A test procedure called the two-proportion z-test was used to assess the significance of differences between males and
females and Aboriginal/Torres Strait Islander and non-Aboriginal/Torres Strait Islander populations. Rates and p values
were not calculated where there were less than four deaths in either category, due to unreliability of estimates for very small
numbers. Where p is less than 0.05, male or Aboriginal/Torres Strait Islander rates were significantly higher than female or
non-Aboriginal/Torres Strait Islander rates. The lower the p value below 0.05, the more significant the difference. A p value of
<0.001 indicates a very significant difference.
Software
Much of the data extraction and summarisation was done using Microsoft SQL Server 2005 and Microsoft Access, with the
remainder of the analysis and all illustrations done in Microsoft Excel. Some of the analysis and processing was done in R
statistical language.218 The epitools219 package was used to calculate Directly Standardised Mortality Rates and associated
confidence intervals.
217 Washington State Department of Health 2012, Guidelines for Using Confidence Intervals for Public Health Assessment , Olympia, WA: DOH
http://www.doh.wa.gov/Portals/1/Documents/5500/ConfIntGuide.pdf
218 R Development Core Team 2010, R: A language and environment for statistical computing. R foundation for Statistical Computing, Vienna: Austria.
ISBN 3-900051-07-0, http://www.R-project.org, accessed 16 July 2013.
219 Aragon, T. 2010, epitools: Epidemiology Tools. R package version 0.5-7, Berkeley, CA: University of California, http://CRAN.R-project.org/
package=epitools, accessed 16 July 2013.
NSW Child Death Review Team | Annual Report 2012
125
Appendix 2: Definitions
Causes of death
ICD-10 is the International Statistical Classification of Diseases and Related Health Problems, 10th revision (World Health
Organization). The ICD-10 has more than 12,000 unique codes in more than 2000 categories. The highest level classification
is the chapter level (22 chapters). ICD-10-AM is the Australian modification of ICD-10.
Underlying cause of death is defined by the World Health Organization as the ‘disease or injury that initiated the train of events
leading directly to death, or the circumstances of the accident or violence which produced the fatal injury’. In this report, unless
otherwise indicated, the cause of death relates to underlying cause. This is because the underlying cause of death
is recognised as the single most essential element to understanding causes of death.220
Direct cause of death is the final condition or event that results in death.
Intervening causes of death are other conditions that may have given rise to the immediate cause of death.
Contributory causes of death are conditions or events that were present during the sequence leading to death, but may not
have been necessary influences.
Natural causes of death221
Name
Description
ICD codes
Certain conditions
originating in the perinatal
period
It includes conditions such as prematurity; complications of labour,
including hypertension and maternal haemorrhage; and disorders
associated with fetal growth. It may also include certain respiratory,
cardiovascular and infectious diseases associated with the perinatal
period, such as aspiration of meconium and respiratory distress
of the newborn.
P00-P96
Congenital malformations
and chromosomal
abnormalities
Includes a range of conditions, including congenital hydrocephalus,
trisomy 18 (Edwards syndrome), and Down syndrome.
Q00-Q99
Diseases of the
circulatory system
Conditions such as cardiac and blood vessel malformations and
disorders of metabolism that lead to blocking of blood vessels.
I00-I99
Diseases of the
nervous system
Includes disorders such as epilepsy, cerebral palsy and muscular
dystrophy, as well as inflammatory and degenerative conditions.
G00-G99
Endocrine, nutritional and
metabolic diseases
Includes conditions such as diabetes, malnutrition and
Cushing’s syndrome.
E00-E89
Certain infectious and
parasitic diseases
Infectious diseases are caused by organisms such as bacteria, viruses,
parasites or fungi, and can be passed directly or indirectly from
person to person.221 Examples include influenza, gastroenteritis and
meningococcal disease.
A00-B99
Neoplasms
Cancers and tumours.
C00-D48
Diseases of the
respiratory system
Includes conditions such as pneumonia, influenza and asthma
J00-J99
Other diseases/morbid
conditions
Includes diseases of the blood and blood-forming organs and certain
disorders involving the immune mechanism; mental and behavioural
disorders; diseases of the eye and adnexa; diseases of the ear and
mastoid process; diseases of the digestive system; diseases of the skin
and subcutaneous tissue; diseases of the genitourinary system; and
pregnancy, childbirth and the puerperium.
D50-D89, F00-F99,
H00-H59,
H60-H95,
K00-K93, L00-L99,
N00-N99,
O00-O99
220 National Centre for Health Information Research and Training 2011 Review and recommendations for the annual reporting of child deaths in NSW.
Sydney: NSW Ombudsman. Unpublished.
221 World Health Organization 2011, Infectious Diseases, Geneva: WHO. http://www.who.int/topics/infectious_diseases/en/, accessed 16 July 2013.
126
NSW Child Death Review Team | Annual Report 2012
External causes of death
Name
Notable inclusions
ICD code
Drowning
W65-W74, Y21
Fatal assault
Assault involving drowning (X92) or a motor vehicle (Y02-Y03) would be
included with deaths from fatal assault.
X85-Y09
Suicide
This includes intentional crashing of a vehicle and intentional self harm
by drowning.
X60-X84
Transport
V01-V99, Y31-Y32
Other unintentional A number of unintentional external cause deaths occur that are not due to
external cause
transport incidents, assault, suicide or drowning. Due to the small number and
death
great variety of these deaths, they are described in one section of the report.
Sudden Unexpected Death in Infancy (SUDI)
In this report, SUDI is defined as:
Where an infant less than one year of age dies suddenly and unexpectedly. Included in SUDI are:
• Deaths that were unexpected and unexplained at autopsy (i.e. those meeting the criteria for Sudden Infant Death Syndrome)
• Deaths occurring in the course of an acute illness that was not recognised by carers and/or by health professionals as
potentially life threatening
• Deaths arising from a pre-existing condition that had not been previously recognised by health professionals, and
• Deaths resulting from accident, trauma or poisoning where the cause of death was not known at the time of death.
Sudden Infant Death Syndrome (SIDS)
SIDS is a category of SUDI and is a diagnosis of exclusion. In this report, SIDS is defined as:
The sudden and unexpected death of an infant under one year of age, with onset of the lethal episode apparently
occurring during sleep, that remains unexplained after a thorough investigation including performance of a complete
autopsy, and review of the circumstances of death and the clinical history.
As noted, there are a number of sub-classifications of SIDS (see Appendix 3 for sub-classifications).
NSW Child Death Review Team | Annual Report 2012
127
Definitions – other
Child – A person under the age of 18 years.
Child protection history – A child is reported as being from a family with a child protection history if the child, or their sibling,
had been the subject of a report(s) of risk of harm or risk of significant harm to Community Services, or the subject of a report
to a Child Wellbeing Unit, within the three years before the child’s death.
Co-sleeping – A child or children sleeping with an adult on a shared surface such as a bed, sofa or mattress.
Confidence interval – A confidence interval is a quantitative estimate of the uncertainty of a statistic. It is used in this report
primarily for the Crude Mortality Rate (see below). Although we know the number of children who died and lived in 2012,
the numbers are not static, with children being born, dying and having birthdays throughout the year. This means that the
Crude Mortality Rate is a measurement of a sample population, with all other intervals of one year being alternative sample
populations (e.g., a year starting on 1 May, rather than 1 January). The confidence interval estimates the range within which
95% of all possible sample populations would occur.
Crude Mortality Rate (CMR) – The rate per 100,000 persons (for this report, persons are all those aged under 18 years). In
this report, rates are not calculated for numbers less than four because of lack of reliability.
Directly Standardised Mortality Rate (DSMR) – The rate per 100,000 children under 18 years of age, adjusted for the age
structure of the population. In this report, rates are not calculated for numbers less than four because of lack of reliability.
Incident Rate Ratio – The ratio of the mortality rates for two exclusive classes of people, such as male and female.
Infant – A child less than one year old.
Infant Mortality Rate – The rate of death per 1,000 live births. In this report, rates are not calculated for numbers less than
four because of lack of reliability.
International Classification of Diseases (ICD) – The ICD is the international standard health classification published by the
World Health Organization (WHO) for coding diseases for statistical aggregation and reporting purposes.
International Classification of Diseases – Australian Modification – The ICD-10-AM contains additional codes that are
useful in the Australian setting, but is otherwise equivalent to the ICD-10.222
Natural body of water – Oceans, lakes, rivers, creeks, lagoons and other permanent or temporary bodies of water formed by
natural processes.
Neonatal period – The period from birth to less than 28 days.
Other bodies of water – Reservoirs, dams, artificial channels, drainage or sewerage works and any other permanent or
temporary body of water not formed by natural processes.
Perinatal period – The period inclusive of late pregnancy, birth and the first 28 days of life.
Post neonatal period – The period from 28 days to less than 365 days.
P-value – a quantitative measurement of the likelihood that a statistic occurred by chance. A p-value of 0.05 means that there
is only a five per cent probability that the result obtained was due to a chance variation. A p-value of 0.05 is the conventional
level for statistical significance. P-values are valid only when the distribution of the observation is the same as, or very close to,
the theoretical distribution used to calculate the statistic. All p-values noted in this report are statistically significant.
Remoteness – A measure of distance from services. There are five levels of remoteness specified in this report: Highly
Accessible (Major Cities), Accessible (Inner Regional), Moderately Accessible (Outer Regional), Remote and Very Remote.
Socioeconomic status – A measure of the relative material resources of an individual or group.
Young person – A person aged 16 or 17 years.
222 World Health Organization, 2010, International Statistical Classification of Diseases and Related Health Problems, 10th Revision. Geneva: WHO.
128
NSW Child Death Review Team | Annual Report 2012
Appendix 3: Definitional approach to Sudden
Infant Death
The following is sourced from: Krous Henry et al, Sudden Infant Death Syndrome and Unclassified Sudden Infant deaths: A
definitional and diagnostic approach, Pediatrics 2004; 114;234.
General definition of SIDS
SIDS is defined as the sudden unexpected death of an infant less than one year of age, with onset of the fatal episode
apparently occurring during sleep, that remains unexplained after a thorough investigation, including performance of a
complete autopsy and review of the circumstances of death and the clinical history.
Category IA SIDS: Classic Features of SIDS present and completely
documented
Category IA includes infant deaths that meet the requirements of the general definition and also all of the following requirements.
Clinical
• more than 21 days and less than nine months of age
• normal clinical history, including term pregnancy (gestational age of ≥ 37 weeks)
• normal growth and development, and
• no similar deaths among siblings, close genetic relatives (uncles, aunts or first-degree cousins), or other infants in the
custody of the same caregiver.
Circumstances of death
Investigation of the various scenes where incidents leading to death might have occurred and determination that they do not
provide an explanation for the death. Found in a safe sleeping environment, with no evidence of accidental death.
Autopsy
Absence of potentially fatal pathologic findings. Minor respiratory system inflammatory infiltrates are acceptable; intrathoracic
petechial haemorrhage is a supportive but not obligatory or diagnostic finding.
No evidence of unexplained trauma, abuse, neglect or unintentional injury.
No evidence of substantial thymic stress effect (thymic weight of <15g and/or moderate/severe cortical lymphocyte depletion).
Occasional ‘starry sky’ macrophages or minor cortical depletion is acceptable.
Negative results of toxicologic, microbiologic, radiologic, vitreous chemistry and metabolic screening studies.
Category IB SIDS: Classic features of SIDS present but incompletely
documented
Category IB includes infant deaths that meet the requirements of the general definition and also meet all of the criteria for
category IA except that investigation of the various scenes where incidents leading to death might have occurred was not
performed and or ≥ 1 of the following analyses was not performed: toxicologic, microbiologic, radiologic, vitreous chemistry,
or metabolic screening studies.
Category II SIDS
Category II includes infant deaths that meet category I criteria except for ≥ 1 of the following.
NSW Child Death Review Team | Annual Report 2012
129
Clinical
Age range outside that of category 1A or 1B (i.e., 0-21 days or 270 days [9 months] through first birthday).
Similar deaths among siblings, close relatives, or other infants in the custody of the same caregiver that are not considered
suspect for infanticide or recognised genetic disorders.
Neonatal or perinatal conditions (for example, those resulting from preterm birth) that have resolved by the time of death.
Circumstances of death
Mechanical asphyxia or suffocation caused by overlaying not determined with certainty.
Autopsy
Abnormal growth and development not thought to have contributed to death.
Marked inflammatory changes or abnormalities not sufficient to be unequivocal causes of death.
Unclassified Sudden Infant Death
The unclassified category includes deaths that do not meet the criteria for category I or II SIDS but for which alternative
diagnoses of natural or unnatural conditions are equivocal, including cases for which autopsies were not performed.
Post-resuscitation cases
Infants found in extremis who are resuscitated and later die (“temporarily interrupted SIDS”) may be included in the
aforementioned categories, depending on the fulfilment of relevant criteria.
130
NSW Child Death Review Team | Annual Report 2012
NSW Child Death Review Team | Annual Report 2012
131
132
NSW Child Death Review Team | Annual Report 2012


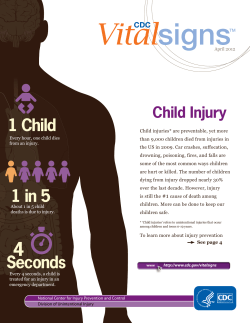


© Copyright 2026