
Fact Sheet
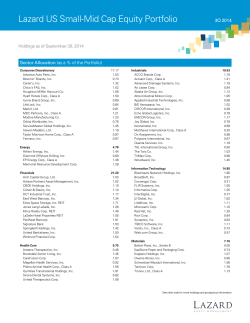
Focus Fund
Focus Fund
Fact Sheet :: Q4 2014
Investor Class: MOATX Class C: CASTX
An Absolute Return Mindset Rooted in Fundamental Analysis
We employ an absolute return mindset to long-only value investing. As fundamentally focused investors, we seek to identify
good business models with high barriers to entry trading at substantial discounts to our conservative evaluation of fair value.
Further, it is our belief that entry price is a significant determinant of return.
Focus on Absolute Returns
Wide-Moat Stocks
The portfolio manager attempts to reduce
volatility on the downside while being
appropriately positioned to participate on
the upside.
Growth of $10,000
22000
S&P 500
Experienced Manager
The Fund is a long-only portfolio of
approximately 20 to 30 ‘wide-moat’
stocks where the manager believes that
each position can make a substantive
contribution to performance.
The Castle Focus Fund will follow the same
strategy that the sub-advisor has used for
its private clients since 1999.
Fund Data
July 1, 2010 to December 31, 2014
MOATX
20500
19000
17500
16000
Total Fund Assets
$145.7 Million
Average Market Cap
$35.6 Billion
No. of Holdings
18
Minimum Investment
$4000 (Investor)
$2000 (Class C)
Dividend/Cap Gain
Frequency
Annually (December)
Benchmark
S&P 500
Risk Measures1
14500
Vs. S&P 500 (Three Year)
13000
11500
10000
Q3
Q4Q1 Q2 Q3Q4Q1 Q2Q3Q4 Q1Q2 Q3Q4 Q1 Q2Q3Q4 Q1
2010
2011
2012
2013
Alpha
-2.79
Beta
0.58
Standard Deviation
6.29
Up Capture
51.17%
Down Capture
72.64%
R
71.7
2
2014
Buys & Sells for the Past Quarter as of December 31, 2014
New Positions
Positions Sold
McCormick & Company, Inc. (3.31% of Fund Assets)
Apache Corp.
ITC Holdings Corp. (3.19% of Fund Assets)
Checkpoint Software Technologies Ltd.
Schlumberger Ltd. (2.52% of Fund Assets)
Enbridge, Inc.
Diageo PLC (ADR) (0.78% of Fund Assets)
Liberty Media Corp.
Medtronic, Inc.
Rayonier Advanced Materials, Inc.
Silver Wheaton Corp.
www.castleim.com :: 703.260.1921
Focus Fund
Focus Fund
Fact Sheet :: Q4 2014
Investor Class: MOATX Class C: CASTX
About the Sub-Adviser — St. James Investment Company of Dallas, Texas
St. James is an SEC Registered Investment Adviser founded in 1999 and manages $1.46 Billion as of December 31, 2014. They utilize fundamental
analysis and a strict value discipline with an objective of achieving attractive absolute returns. St. James has employed this value philosophy of bottom-up
stock selection since 1999.
Top Ten Holdings
Security
About the Portfolio Manager
% of fund assets
Cash & Cash Equivalents*
29.60%
Spectra Energy Corp.
7.10%
Express Scripts Holding Co.
6.68%
Nestle S.A. (ADR)
5.76%
Sanofi SA (ADR)
5.07%
Philip Morris International, Inc.
5.03%
W.R. Berkley Corp.
4.92%
Expeditors International Of Washington, Inc.
3.98%
Sysco Corp.
3.95%
The Bank of New York Mellon Corp.
3.90%
Robert Mark is the portfolio manager for the Castle Focus Fund. Robert founded St. James
Investment Company (the Fund’s sub-advisor) in 1999 and has been the lead portfolio
manager at St. James since the firm’s inception. Robert formerly worked in the Private
Asset Management Group at Goldman Sachs in Houston. While at Goldman, he and his
team managed client assets for over 75 wealthy families. Robert’s primary responsibilities
included researching, implementing and managing equity portfolios. Prior to joining
Goldman Sachs, Robert attended the University of Texas at Austin where he received his
MBA in Finance. Robert is a 1989 graduate of the United States Military Academy at West
Point with a BS in Engineering. After graduating from West Point, he was commissioned
as an officer in the US Army where he served in Germany and the Gulf War as an armored
cavalry scout platoon leader. He was awarded the Bronze Star for actions in combat against
Iraqi armored forces of the Republican Guard.
*Represents cash equivalents and other assets less liabilities.
Fund Performance as of December 31, 2014
Total Return Year-to-Date
One Year
Castle Focus Fund Investor Class (MOATX)
8.57%
8.57%
8.55%
9.82%
Fund Benchmark: S&P 500 13.69%
13.69%
20.41%
19.10%
Avg. Annual Return
Three Years Since Inception (6/30/10)
Performance quoted represents past performance. Past performance is no guarantee of future results. Investment return and the principal value
of an investment will fluctuate. Shares may be worth more or less than original cost when redeemed. Current performance may be lower or higher
than performance shown. You may obtain performance data current to the most recent month-end by calling 703-260-1921. The expense ratio
excluding acquired fund expenses for the Investor Share Class is 1.34% (2.34% for Class C). The expense ratio including acquired fund expenses
for the Investor Share Class is 1.36% (2.36% for Class C). Effective November 1, 2014 the Adviser has contractually agreed to waive Services
Agreement fees by 0.24% of its average daily net assets through October 31, 2015. The Services Agreement fee waiver will automatically terminate
on October 31, 2015 unless it is renewed by the Adviser. The Adviser may not terminate the fee waiver before October 31, 2015. The total expense
ratio excluding the Services Agreement fee waiver for the Investor Share Class is 1.60% (2.60% for Class C). If you redeem Class C Shares of the
Fund, your redemption may be subject to a 1.00% Contingent Deferred Sale Charge if the shares are redeemed less than one year after the original
purchase of the Class C Shares. The Fund imposes a redemption fee of 2.00% of the total redemption amount (calculated at market value) if you
sell or exchange your shares after holding them for 90 days or less.
The Fund’s investment objectives, risks, charges and expenses must be considered carefully before investing. The prospectus contains this and other important
information about the Fund , and it may be obtained by calling 1-877-743-7820, or visiting www.castleim.com. Read it carefully before investing. Distributed
by Rafferty Capital Markets, LLC-Garden City, NY 11530, Member FINRA.
Alpha measures the excess return of an investment vehicle, such as a mutual fund, relative to the return of its benchmark, given its level of risk (as measured
by beta). Beta is a measure of the portfolios sensitivity to the market. Standard deviation is use to measure an investment’s historic volatility. The up capture
and down capture ratios are statistical measures of a manager’s overall performance in upward moving and downward moving markets, respectively.
R-Squared is a statistical measure that represents the percentage of a fund or security’s movements that can be explained by movements in a benchmark index.
1
The risks associated with the Fund, detailed in the Prospectus, include the risks of investing in small and medium sized companies and foreign securities which
may result in additional risks such as the possibility of greater price volatility and reduced liquidity, different financial and accounting standards, fluctuations
in currency exchange rates, and political, diplomatic and economic conditions as well as regulatory requirements in foreign countries. There also may be risks
associated with the Fund’s investments in exchange traded funds, real estate investment trusts (“REITs”), significant investment in a specific sector, and nondiversification. Technology companies held in the Fund are subject to rapid industry changes and the risk of obsolescence. The Fund has a small number of
holdings and may be subject to higher volatility than a Fund with a greater number of holdings.


© Copyright 2026