
Technical Document on Municipal Solid Waste Organics Processing
Technical Document on Municipal Solid Waste Organics Processing Technical Document on Municipal Solid Waste Organics Processing. Cat. No.: En14-83/2013E ISBN: 978-1-100-21707-9 Information contained in this publication or product may be reproduced, in part or in whole, and by any means, for personal or public non-commercial purposes, without charge or further permission, unless otherwise specified. You are asked to: Exercise due diligence in ensuring the accuracy of the materials reproduced; Indicate both the complete title of the materials reproduced, as well as the author organization; and Indicate that the reproduction is a copy of an official work that is published by the Government of Canada and that the reproduction has not been produced in affiliation with or with the endorsement of the Government of Canada. Commercial reproduction and distribution is prohibited except with written permission from the Government of Canada’s copyright administrator, Public Works and Government Services of Canada (PWGSC). For more information, please contact PWGSC at 613-996-6886 or at [email protected]. © Her Majesty the Queen in Right of Canada, represented by the Minister of the Environment, 2013 Aussi disponible en français sous le titre : Document technique sur la gestion des matières organiques municipales Preface Solid waste management is unquestionably an essential service that local governments provide their citizens. They have an important responsibility to make decisions regarding collection services, disposal infrastructure, waste diversion and recycling programs that are cost-effective and respond to their communities’ needs. Even in communities with long-established programs and infrastructure, the management of waste continues to evolve and require informed decisions that take into consideration a complex set of environmental, social, technological, and financial factors. Communities are considering options for processing organic waste and need more detailed, objective technical guidance and reliable information on the available processing technologies. In recent years, there has been increasing attention to managing the organic fraction of the municipal waste stream. Biodegradable material such as food waste constitutes approximately 40% of the residential waste stream, therefore diversion of organic materials is essential to reach high diversion targets. The environmental benefits of diverting organic materials from landfill include reduced methane emissions (a potent greenhouse gas), and decreased leachate quantities from landfills. From a life-cycle perspective, other benefits, such as the production of valuable compost and renewable energy, can also be derived from the diversion of organic materials from disposal depending on the processing method selected. While the science of processing leaf and yard waste at open windrow sites is well understood, and facilities are successfully operating at numerous sites across the country, the knowledge and experience of processing food waste in Canada is less well established. Opinions differ on the effectiveness of various technologies for the processing of organics. Canadian experience has been a mix of successes and setbacks. It is important that lessons learned be shared. Objective and reliable technical information is needed so that local governments choosing an approach to the processing of organics are doing so in a well-informed way that best meets their local needs. Optimization of resource allocation and the economic value of waste materials are important aspects of the sustainability of integrated waste management. This Technical Document on Municipal Solid Waste Organics Processing was developed to meet this need by providing science-based, objective and user-friendly information on the various aspects of organic waste management planning and operation for organics processing of different capacities and in different locations. The most applicable and relevant proven composting and anaerobic digestion treatment approaches for implementation in Canada and the considerations applicable to their implementation are also discussed. Treatment technologies still at the research level, that are not yet commercially available, or that have not fully demonstrated technical feasibility in the Canadian context are not covered in this Technical Document. i Preface As many municipalities across Canada are considering options for processing organic wastes, this document can be used as a resource by government officials and stakeholders as they engage with consulting firms and service and technology providers to discuss and assess potential options, prepare tender documents, and evaluate proposals. Users are encouraged to carefully read and interpret the information based on their specific local conditions and regulatory requirements. This document draws on lessons learned and expert knowledge of professionals, practitioners and academics in the field of organics management across North America. The extensive and varied experience of all contributors and reviewers is brought together in 18 comprehensive chapters describing the technical aspects and key considerations involved in processing organic wastes. The document covers a wide range of topics from the science and principles of composting and anaerobic digestion, to the description of proven processing technologies, biogas utilization, facility design, odor control, and compost quality, as well as other related issues such as procurement approaches and system selection. It is hoped that readers will benefit from this compendium of knowledge and lessons learned to support further efforts to reduce greenhouse gas emissions and optimize the value of municipal solid waste organics under an integrated waste management approach. ii Contents Preface . . . . . . . . . . . . . . . . . . . . . . . . . . . . . . . . . . . . . . . . . . . . . . . . . . . . . . . . . . . . . . . . . . . . . . . . . . . . . . i Acknowledgements . . . . . . . . . . . . . . . . . . . . . . . . . . . . . . . . . . . . . . . . . . . . . . . . . . . . . . . . . . . . . . . . . . . ix Acronyms and Abbreviations . . . . . . . . . . . . . . . . . . . . . . . . . . . . . . . . . . . . . . . . . . . . . . . . . . . . . . . . . . . . x 1 . Introduction to Municipal Solid Waste Organics . . . . . . . . . . . . . . . . . . . . . . . . . . . . . . . . . . . . . 1-1 1.1 2. 1.1.1 Food Waste . . . . . . . . . . . . . . . . . . . . . . . . . . . . . . . . . . . . . . . . . . . . . . . . . . . . . 1-1 1.1.2 Leaf and Yard Waste . . . . . . . . . . . . . . . . . . . . . . . . . . . . . . . . . . . . . . . . . . . . . . 1-2 1.2 Estimating the Quantities of MSW Organics . . . . . . . . . . . . . . . . . . . . . . . . . . . . . . . . . . . 1-3 1.3 Common Issues and Challenges . . . . . . . . . . . . . . . . . . . . . . . . . . . . . . . . . . . . . . . . . . . . 1-4 Benefits of Organic Waste Diversion . . . . . . . . . . . . . . . . . . . . . . . . . . . . . . . . . . . . . . . . . . . . . . 2-1 2.1 3 . Composition of MSW Organics . . . . . . . . . . . . . . . . . . . . . . . . . . . . . . . . . . . . . . . . . . . . . 1-1 Environmental Benefits . . . . . . . . . . . . . . . . . . . . . . . . . . . . . . . . . . . . . . . . . . . . . . . . . . . 2-1 2.1.1 Greenhouse Gas Reduction . . . . . . . . . . . . . . . . . . . . . . . . . . . . . . . . . . . . . . . . . 2-1 2.1.2 Compost Products Uses . . . . . . . . . . . . . . . . . . . . . . . . . . . . . . . . . . . . . . . . . . . . 2-2 2.2 Social Benefits . . . . . . . . . . . . . . . . . . . . . . . . . . . . . . . . . . . . . . . . . . . . . . . . . . . . . . . . . . 2-3 2.3 Economic Benefits . . . . . . . . . . . . . . . . . . . . . . . . . . . . . . . . . . . . . . . . . . . . . . . . . . . . . . . 2-4 Science and Principles of Aerobic Processing (Composting) . . . . . . . . . . . . . . . . . . . . . . . . . . 3-1 3.1 Steps of the Composting Process . . . . . . . . . . . . . . . . . . . . . . . . . . . . . . . . . . . . . . . . . . . 3-1 3.2 Compost Microbiology . . . . . . . . . . . . . . . . . . . . . . . . . . . . . . . . . . . . . . . . . . . . . . . . . . . . 3-5 3.3 3.2.1 Bacteria . . . . . . . . . . . . . . . . . . . . . . . . . . . . . . . . . . . . . . . . . . . . . . . . . . . . . . . . 3-6 3.2.2 Fungi . . . . . . . . . . . . . . . . . . . . . . . . . . . . . . . . . . . . . . . . . . . . . . . . . . . . . . . . . . . 3-6 3.2.3 Actinomycetes . . . . . . . . . . . . . . . . . . . . . . . . . . . . . . . . . . . . . . . . . . . . . . . . . . . 3-6 Key Process Management Parameters . . . . . . . . . . . . . . . . . . . . . . . . . . . . . . . . . . . . . . . 3-7 3.3.1 Oxygen Concentration . . . . . . . . . . . . . . . . . . . . . . . . . . . . . . . . . . . . . . . . . . . . . 3-7 3.3.2 Free Air Space, and Particle Size and Structure . . . . . . . . . . . . . . . . . . . . . . . . 3-10 3.3.3 Carbon to Nitrogen Ratio . . . . . . . . . . . . . . . . . . . . . . . . . . . . . . . . . . . . . . . . . . 3-11 3.3.4 Moisture Content . . . . . . . . . . . . . . . . . . . . . . . . . . . . . . . . . . . . . . . . . . . . . . . . 3-12 3.3.5 Temperature . . . . . . . . . . . . . . . . . . . . . . . . . . . . . . . . . . . . . . . . . . . . . . . . . . . . 3-13 3.3.6 pH Level . . . . . . . . . . . . . . . . . . . . . . . . . . . . . . . . . . . . . . . . . . . . . . . . . . . . . . . 3-15 iii Contents 4 . Science and Principles of Anaerobic Processing (Anaerobic digestion) . . . . . . . . . . . . . . . . . 4-1 4.1 Overview of the Anaerobic Digestion Process . . . . . . . . . . . . . . . . . . . . . . . . . . . . . . . . . . 4-1 4.2 Typical Mass Balance. . . . . . . . . . . . . . . . . . . . . . . . . . . . . . . . . . . . . . . . . . . . . . . . . . . . . 4-5 4.3 Anaerobic Digestion Chemistry and Microbiology . . . . . . . . . . . . . . . . . . . . . . . . . . . . . . . 4-6 4.4 Key Process Management Parameters . . . . . . . . . . . . . . . . . . . . . . . . . . . . . . . . . . . . . . . 4-8 4.5 4.6 5 . Moisture Content . . . . . . . . . . . . . . . . . . . . . . . . . . . . . . . . . . . . . . . . . . . . . . . . . 4-8 4.4.2 pH, Alkalinity, and Volatile Fatty Acids . . . . . . . . . . . . . . . . . . . . . . . . . . . . . . . . . 4-9 4.4.3 Temperature . . . . . . . . . . . . . . . . . . . . . . . . . . . . . . . . . . . . . . . . . . . . . . . . . . . . . 4-9 4.4.4 Solids Retention Time . . . . . . . . . . . . . . . . . . . . . . . . . . . . . . . . . . . . . . . . . . . . . 4-10 4.4.5 C:N Ratio and Ammonia Toxicity . . . . . . . . . . . . . . . . . . . . . . . . . . . . . . . . . . . . 4-10 4.4.6 Sulphide Concentration . . . . . . . . . . . . . . . . . . . . . . . . . . . . . . . . . . . . . . . . . . . 4-10 Digestate Characteristics, Quantities, and Processing . . . . . . . . . . . . . . . . . . . . . . . . . . 4-11 4.5.1 Digestate Characteristics and Processing . . . . . . . . . . . . . . . . . . . . . . . . . . . . . 4-11 4.5.2 Digestate Quantities . . . . . . . . . . . . . . . . . . . . . . . . . . . . . . . . . . . . . . . . . . . . . . 4-11 Biogas Characteristics and Quantities . . . . . . . . . . . . . . . . . . . . . . . . . . . . . . . . . . . . . . . 4-12 4.6.1 Biogas Characteristics . . . . . . . . . . . . . . . . . . . . . . . . . . . . . . . . . . . . . . . . . . . . 4-12 4.6.2 Biogas Quantities . . . . . . . . . . . . . . . . . . . . . . . . . . . . . . . . . . . . . . . . . . . . . . . . 4-13 4.6.3 Energy Potential of Biogas . . . . . . . . . . . . . . . . . . . . . . . . . . . . . . . . . . . . . . . . . 4-14 Aerobic Processing Technologies . . . . . . . . . . . . . . . . . . . . . . . . . . . . . . . . . . . . . . . . . . . . . . . . . 5-1 5.1 5.2 5.3 iv 4.4.1 General Feedstock Preparation Steps . . . . . . . . . . . . . . . . . . . . . . . . . . . . . . . . . . . . . . . . 5-4 5.1.1 Particle Size Reduction . . . . . . . . . . . . . . . . . . . . . . . . . . . . . . . . . . . . . . . . . . . . 5-4 5.1.2 Mixing and Blending . . . . . . . . . . . . . . . . . . . . . . . . . . . . . . . . . . . . . . . . . . . . . . . 5-4 5.1.3 Ferrous Metal Removal . . . . . . . . . . . . . . . . . . . . . . . . . . . . . . . . . . . . . . . . . . . . 5-4 5.1.4 Water or Leachate Addition . . . . . . . . . . . . . . . . . . . . . . . . . . . . . . . . . . . . . . . . . 5-4 5.1.5 Feedstock Preparation Considerations . . . . . . . . . . . . . . . . . . . . . . . . . . . . . . . . 5-5 Passively Aerated and Turned Composting Systems. . . . . . . . . . . . . . . . . . . . . . . . . . . . . 5-5 5.2.1 Static Pile Composting . . . . . . . . . . . . . . . . . . . . . . . . . . . . . . . . . . . . . . . . . . . . 5-6 5.2.2 Bunker . . . . . . . . . . . . . . . . . . . . . . . . . . . . . . . . . . . . . . . . . . . . . . . . . . . . . . . . . 5-7 5.2.3 Windrow . . . . . . . . . . . . . . . . . . . . . . . . . . . . . . . . . . . . . . . . . . . . . . . . . . . . . . . . 5-8 5.2.4 Turned Mass Bed . . . . . . . . . . . . . . . . . . . . . . . . . . . . . . . . . . . . . . . . . . . . . . . . 5-10 5.2.5 Passively Aerated Windrow . . . . . . . . . . . . . . . . . . . . . . . . . . . . . . . . . . . . . . . . 5-11 Actively Aerated Composting Systems. . . . . . . . . . . . . . . . . . . . . . . . . . . . . . . . . . . . . . . 5-12 5.3.1 Aerated Static Pile . . . . . . . . . . . . . . . . . . . . . . . . . . . . . . . . . . . . . . . . . . . . . . . 5-14 5.3.2 Enclosed Aerated Static Pile (Tunnel) . . . . . . . . . . . . . . . . . . . . . . . . . . . . . . . . 5-16 5.3.3 Static Container . . . . . . . . . . . . . . . . . . . . . . . . . . . . . . . . . . . . . . . . . . . . . . . . . 5-17 5.3.4 Agitated Container . . . . . . . . . . . . . . . . . . . . . . . . . . . . . . . . . . . . . . . . . . . . . . . 5-18 5.3.5 Channel . . . . . . . . . . . . . . . . . . . . . . . . . . . . . . . . . . . . . . . . . . . . . . . . . . . . . . . 5-19 5.3.6 Agitated Bed . . . . . . . . . . . . . . . . . . . . . . . . . . . . . . . . . . . . . . . . . . . . . . . . . . . 5-20 5.3.7 Rotating Drum . . . . . . . . . . . . . . . . . . . . . . . . . . . . . . . . . . . . . . . . . . . . . . . . . . 5-22 Contents 6 . 7 . Anaerobic Processing Technologies . . . . . . . . . . . . . . . . . . . . . . . . . . . . . . . . . . . . . . . . . . . . . . . 6-1 6.1 General Pretreatment Requirements . . . . . . . . . . . . . . . . . . . . . . . . . . . . . . . . . . . . . . . . . 6-1 6.2 Types of AD Technologies . . . . . . . . . . . . . . . . . . . . . . . . . . . . . . . . . . . . . . . . . . . . . . . . . 6-2 6.2.1 High-Solids Versus Wet AD Systems . . . . . . . . . . . . . . . . . . . . . . . . . . . . . . . . . . 6-2 6.2.2 One Stage Versus Two Stage. . . . . . . . . . . . . . . . . . . . . . . . . . . . . . . . . . . . . . . . 6-3 6.2.3 Thermophilic Versus Mesophilic . . . . . . . . . . . . . . . . . . . . . . . . . . . . . . . . . . . . . . 6-3 6.2.4 Technology Overview . . . . . . . . . . . . . . . . . . . . . . . . . . . . . . . . . . . . . . . . . . . . . . 6-4 6.3 High-Solids-Stackable Digestion Systems . . . . . . . . . . . . . . . . . . . . . . . . . . . . . . . . . . . . . 6-6 6.4 High-Solids-Slurry Digestion Systems . . . . . . . . . . . . . . . . . . . . . . . . . . . . . . . . . . . . . . . . 6-8 6.5 Wet (Low-Solids) Digestion Systems . . . . . . . . . . . . . . . . . . . . . . . . . . . . . . . . . . . . . . . . 6-10 6.6 Codigestion in Wastewater Treatment Plant Biosolids Digesters . . . . . . . . . . . . . . . . . . . 6-12 BioGas Conversion and Utilization Options . . . . . . . . . . . . . . . . . . . . . . . . . . . . . . . . . . . . . . . . . 7-1 7.1 Low-Grade Uses . . . . . . . . . . . . . . . . . . . . . . . . . . . . . . . . . . . . . . . . . . . . . . . . . . . . . . . . 7-3 7.1.1 7.2 Medium-Grade Uses . . . . . . . . . . . . . . . . . . . . . . . . . . . . . . . . . . . . . . . . . . . . . . . . . . . . . 7-4 7.2.1 7.3 8 . Biogas Treatment Requirements for Medium-Grade Uses . . . . . . . . . . . . . . . . . . 7-5 High-Grade Uses . . . . . . . . . . . . . . . . . . . . . . . . . . . . . . . . . . . . . . . . . . . . . . . . . . . . . . . . 7-6 7.3.1 7.4 Biogas Treatment Requirements for Low-Grade Uses . . . . . . . . . . . . . . . . . . . . . 7-3 Gas Treatment Requirements for High-Grade Biogas Uses . . . . . . . . . . . . . . . . 7-7 Biogas Safety . . . . . . . . . . . . . . . . . . . . . . . . . . . . . . . . . . . . . . . . . . . . . . . . . . . . . . . . . . . 7-8 Facility Siting . . . . . . . . . . . . . . . . . . . . . . . . . . . . . . . . . . . . . . . . . . . . . . . . . . . . . . . . . . . . . . . . . . . 8-1 8.1 Facility Siting Approaches . . . . . . . . . . . . . . . . . . . . . . . . . . . . . . . . . . . . . . . . . . . . . . . . . 8-2 8.2 Environmental Considerations . . . . . . . . . . . . . . . . . . . . . . . . . . . . . . . . . . . . . . . . . . . . . . 8-3 8.3 8.4 8.2.1 Wetlands and Water Bodies . . . . . . . . . . . . . . . . . . . . . . . . . . . . . . . . . . . . . . . . . 8-3 8.2.2 Potable Water Sources . . . . . . . . . . . . . . . . . . . . . . . . . . . . . . . . . . . . . . . . . . . . . 8-4 8.2.3 Flood Plains . . . . . . . . . . . . . . . . . . . . . . . . . . . . . . . . . . . . . . . . . . . . . . . . . . . . . 8-4 8.2.4 Topography . . . . . . . . . . . . . . . . . . . . . . . . . . . . . . . . . . . . . . . . . . . . . . . . . . . . . . 8-4 8.2.5 Groundwater Depth . . . . . . . . . . . . . . . . . . . . . . . . . . . . . . . . . . . . . . . . . . . . . . . 8-4 8.2.6 Soil Type . . . . . . . . . . . . . . . . . . . . . . . . . . . . . . . . . . . . . . . . . . . . . . . . . . . . . . . . 8-5 8.2.7 Wind Speed and Direction . . . . . . . . . . . . . . . . . . . . . . . . . . . . . . . . . . . . . . . . . . 8-5 Proximity and Access Considerations . . . . . . . . . . . . . . . . . . . . . . . . . . . . . . . . . . . . . . . . 8-5 8.3.1 Transportation Network . . . . . . . . . . . . . . . . . . . . . . . . . . . . . . . . . . . . . . . . . . . . 8-5 8.3.2 Feedstock Sources . . . . . . . . . . . . . . . . . . . . . . . . . . . . . . . . . . . . . . . . . . . . . . . . 8-6 8.3.3 Markets and End-Users . . . . . . . . . . . . . . . . . . . . . . . . . . . . . . . . . . . . . . . . . . . . 8-6 8.3.4 Utilities and Services . . . . . . . . . . . . . . . . . . . . . . . . . . . . . . . . . . . . . . . . . . . . . . 8-7 8.3.5 Water Sources . . . . . . . . . . . . . . . . . . . . . . . . . . . . . . . . . . . . . . . . . . . . . . . . . . . 8-7 Land-Use Considerations . . . . . . . . . . . . . . . . . . . . . . . . . . . . . . . . . . . . . . . . . . . . . . . . . . 8-8 8.4.1 Land Usage and Activities on Adjacent Sites . . . . . . . . . . . . . . . . . . . . . . . . . . . . 8-8 8.4.2 Allowable Land Uses and Zoning . . . . . . . . . . . . . . . . . . . . . . . . . . . . . . . . . . . . . 8-8 v Contents 9. 10 . 11 . 12 . vi 8.4.3 Protection of Agricultural Lands . . . . . . . . . . . . . . . . . . . . . . . . . . . . . . . . . . . . . . 8-8 8.4.4 Buffer Zones . . . . . . . . . . . . . . . . . . . . . . . . . . . . . . . . . . . . . . . . . . . . . . . . . . . . . 8-8 8.4.5 Proximity to Airports . . . . . . . . . . . . . . . . . . . . . . . . . . . . . . . . . . . . . . . . . . . . . . . 8-9 8.4.6 Proximity to Other Waste Management Facilities . . . . . . . . . . . . . . . . . . . . . . . . . 8-9 Additional Facility Design Considerations . . . . . . . . . . . . . . . . . . . . . . . . . . . . . . . . . . . . . . . . . . 9-1 9.1 Health and Safety . . . . . . . . . . . . . . . . . . . . . . . . . . . . . . . . . . . . . . . . . . . . . . . . . . . . . . . . 9-1 9.2 Fire Prevention, Detection, and Control . . . . . . . . . . . . . . . . . . . . . . . . . . . . . . . . . . . . . . . 9-2 9.3 Site Security . . . . . . . . . . . . . . . . . . . . . . . . . . . . . . . . . . . . . . . . . . . . . . . . . . . . . . . . . . . . 9-3 9.4 Operational Flexibility and Maintenance . . . . . . . . . . . . . . . . . . . . . . . . . . . . . . . . . . . . . . 9-3 9.5 Building Ventilation Systems . . . . . . . . . . . . . . . . . . . . . . . . . . . . . . . . . . . . . . . . . . . . . . . 9-4 9.6 Compost Product Specifications . . . . . . . . . . . . . . . . . . . . . . . . . . . . . . . . . . . . . . . . . . . . 9-5 9.7 Winter Operations . . . . . . . . . . . . . . . . . . . . . . . . . . . . . . . . . . . . . . . . . . . . . . . . . . . . . . . 9-5 9.8 Seasonal Variations in Waste Quantities . . . . . . . . . . . . . . . . . . . . . . . . . . . . . . . . . . . . . . 9-6 9.9 Self-Hauled Feedstock Deliveries . . . . . . . . . . . . . . . . . . . . . . . . . . . . . . . . . . . . . . . . . . . 9-7 9.10 Signs . . . . . . . . . . . . . . . . . . . . . . . . . . . . . . . . . . . . . . . . . . . . . . . . . . . . . . . . . . . . . . . . . 9-8 9.11 Corrosion Protection. . . . . . . . . . . . . . . . . . . . . . . . . . . . . . . . . . . . . . . . . . . . . . . . . . . . . . 9-8 9.12 Provincial and Municipal Requirements . . . . . . . . . . . . . . . . . . . . . . . . . . . . . . . . . . . . . . . 9-9 Common Supporting Infrastructure . . . . . . . . . . . . . . . . . . . . . . . . . . . . . . . . . . . . . . . . . . . . . 10-1 10.1 Feedstock Receiving Area . . . . . . . . . . . . . . . . . . . . . . . . . . . . . . . . . . . . . . . . . . . . . . . . 10-2 10.2 Amendment Storage Area . . . . . . . . . . . . . . . . . . . . . . . . . . . . . . . . . . . . . . . . . . . . . . . . 10-4 10.3 Compost Curing Area . . . . . . . . . . . . . . . . . . . . . . . . . . . . . . . . . . . . . . . . . . . . . . . . . . . . 10-4 10.4 Finished Compost Storage Area . . . . . . . . . . . . . . . . . . . . . . . . . . . . . . . . . . . . . . . . . . . 10-5 10.5 Residuals Storage Areas . . . . . . . . . . . . . . . . . . . . . . . . . . . . . . . . . . . . . . . . . . . . . . . . . 10-6 10.6 Leachate and Effluent Management Infrastructure . . . . . . . . . . . . . . . . . . . . . . . . . . . . . 10-6 10.7 Contaminated Stormwater Management Infrastructure . . . . . . . . . . . . . . . . . . . . . . . . . 10-7 10.8 Uncontaminated Stormwater Management Infrastructure . . . . . . . . . . . . . . . . . . . . . . . . 10-8 10.9 Additional Infrastructure Requirements . . . . . . . . . . . . . . . . . . . . . . . . . . . . . . . . . . . . . . 10-8 Common Supporting Equipment . . . . . . . . . . . . . . . . . . . . . . . . . . . . . . . . . . . . . . . . . . . . . . . . . 11-1 11.1 Front-End Loaders . . . . . . . . . . . . . . . . . . . . . . . . . . . . . . . . . . . . . . . . . . . . . . . . . . . . . . 11-1 11.2 Mixing Equipment . . . . . . . . . . . . . . . . . . . . . . . . . . . . . . . . . . . . . . . . . . . . . . . . . . . . . . . 11-2 11.3 Screening Equipment . . . . . . . . . . . . . . . . . . . . . . . . . . . . . . . . . . . . . . . . . . . . . . . . . . . . 11-4 11.4 Size-Reduction Equipment . . . . . . . . . . . . . . . . . . . . . . . . . . . . . . . . . . . . . . . . . . . . . . . . 11-5 11.5 Conveyor Systems . . . . . . . . . . . . . . . . . . . . . . . . . . . . . . . . . . . . . . . . . . . . . . . . . . . . . . 11-7 Collection Programs . . . . . . . . . . . . . . . . . . . . . . . . . . . . . . . . . . . . . . . . . . . . . . . . . . . . . . . . . . . 12-1 12.1 Drop-Off Depots . . . . . . . . . . . . . . . . . . . . . . . . . . . . . . . . . . . . . . . . . . . . . . . . . . . . . . . . 12-1 12.2 Community Collection Sites . . . . . . . . . . . . . . . . . . . . . . . . . . . . . . . . . . . . . . . . . . . . . . . 12-3 Contents 12.3 Curbside Collection Programs . . . . . . . . . . . . . . . . . . . . . . . . . . . . . . . . . . . . . . . . . . . . . 12-3 12.4 Collection Considerations. . . . . . . . . . . . . . . . . . . . . . . . . . . . . . . . . . . . . . . . . . . . . . . . . 12-5 12.4.1 Bag-Based Collection Programs . . . . . . . . . . . . . . . . . . . . . . . . . . . . . . . . . . . . 12-5 12.4.2 Cart-Based Collection Programs . . . . . . . . . . . . . . . . . . . . . . . . . . . . . . . . . . . . 12-6 12.4.3 Kitchen Pails . . . . . . . . . . . . . . . . . . . . . . . . . . . . . . . . . . . . . . . . . . . . . . . . . . . . 12-7 13 . Organics Processing Facility Procurement Approaches . . . . . . . . . . . . . . . . . . . . . . . . . . . . . 13-1 13.1 Design-Bid-Build. . . . . . . . . . . . . . . . . . . . . . . . . . . . . . . . . . . . . . . . . . . . . . . . . . . . . . . . 13-1 13.2 Construction Management At-Risk . . . . . . . . . . . . . . . . . . . . . . . . . . . . . . . . . . . . . . . . . 13-3 13.3 Design-Build . . . . . . . . . . . . . . . . . . . . . . . . . . . . . . . . . . . . . . . . . . . . . . . . . . . . . . . . . . . 13-4 13.4 Design-Build-Operate . . . . . . . . . . . . . . . . . . . . . . . . . . . . . . . . . . . . . . . . . . . . . . . . . . . . 13-7 13.4.1 Financing and Transfer of Ownership Options . . . . . . . . . . . . . . . . . . . . . . . . . . 13-8 13.5 14 . General Procurement Considerations . . . . . . . . . . . . . . . . . . . . . . . . . . . . . . . . . . . . . . . 13-8 Odour Control and Management . . . . . . . . . . . . . . . . . . . . . . . . . . . . . . . . . . . . . . . . . . . . . . . . . 14-1 14.1 Odours Sources . . . . . . . . . . . . . . . . . . . . . . . . . . . . . . . . . . . . . . . . . . . . . . . . . . . . . . . . 14-1 14.2 Sampling and Measuring Odours . . . . . . . . . . . . . . . . . . . . . . . . . . . . . . . . . . . . . . . . . . . 14-3 14.2.1 Sample Collection . . . . . . . . . . . . . . . . . . . . . . . . . . . . . . . . . . . . . . . . . . . . . . . . 14-3 14.2.2 Odour Concentration Measurements . . . . . . . . . . . . . . . . . . . . . . . . . . . . . . . . . 14-4 14.3 Predicting Offsite Odour Impacts . . . . . . . . . . . . . . . . . . . . . . . . . . . . . . . . . . . . . . . . . . . 14-6 14.4 Treatment Technology Options. . . . . . . . . . . . . . . . . . . . . . . . . . . . . . . . . . . . . . . . . . . . . 14-7 14.4.1 Wet Scrubbers . . . . . . . . . . . . . . . . . . . . . . . . . . . . . . . . . . . . . . . . . . . . . . . . . . 14-7 14.4.2 Carbon Adsorption . . . . . . . . . . . . . . . . . . . . . . . . . . . . . . . . . . . . . . . . . . . . . . . 14-9 14.4.3 Biofilter Systems . . . . . . . . . . . . . . . . . . . . . . . . . . . . . . . . . . . . . . . . . . . . . . . . 14-10 15 . 16 . Nuisance Management and Controls . . . . . . . . . . . . . . . . . . . . . . . . . . . . . . . . . . . . . . . . . . . . . 15-1 15.1 Dust . . . . . . . . . . . . . . . . . . . . . . . . . . . . . . . . . . . . . . . . . . . . . . . . . . . . . . . . . . . . . . . . . 15-1 15.2 Litter . . . . . . . . . . . . . . . . . . . . . . . . . . . . . . . . . . . . . . . . . . . . . . . . . . . . . . . . . . . . . . . . . 15-3 15.3 Noise . . . . . . . . . . . . . . . . . . . . . . . . . . . . . . . . . . . . . . . . . . . . . . . . . . . . . . . . . . . . . . . . 15-4 15.4 Insects, Birds, and Animals . . . . . . . . . . . . . . . . . . . . . . . . . . . . . . . . . . . . . . . . . . . . . . . 15-5 Compost Quality Standards . . . . . . . . . . . . . . . . . . . . . . . . . . . . . . . . . . . . . . . . . . . . . . . . . . . . . 16-1 16.1 Fertilizer Act . . . . . . . . . . . . . . . . . . . . . . . . . . . . . . . . . . . . . . . . . . . . . . . . . . . . . . . . . . . 16-2 16.1.1 Quality Standards . . . . . . . . . . . . . . . . . . . . . . . . . . . . . . . . . . . . . . . . . . . . . . . . 16-2 16.1.2 Labelling . . . . . . . . . . . . . . . . . . . . . . . . . . . . . . . . . . . . . . . . . . . . . . . . . . . . . . . 16-4 16.2 CCME Guidelines for Compost Quality . . . . . . . . . . . . . . . . . . . . . . . . . . . . . . . . . . . . . . 16-4 16.3 BNQ Organic Soil Conditioners—Composts . . . . . . . . . . . . . . . . . . . . . . . . . . . . . . . . . . 16-6 16.4 Provincial Regulatory Requirements . . . . . . . . . . . . . . . . . . . . . . . . . . . . . . . . . . . . . . . . 16-8 16.5 Compost Quality Alliance . . . . . . . . . . . . . . . . . . . . . . . . . . . . . . . . . . . . . . . . . . . . . . . . . 16-8 vii Contents 17 . Compost Market Considerations . . . . . . . . . . . . . . . . . . . . . . . . . . . . . . . . . . . . . . . . . . . . . . . . . 17-1 17.1 Compost Markets . . . . . . . . . . . . . . . . . . . . . . . . . . . . . . . . . . . . . . . . . . . . . . . . . . . . . . . 17-1 17.1.1 Agriculture . . . . . . . . . . . . . . . . . . . . . . . . . . . . . . . . . . . . . . . . . . . . . . . . . . . . . 17-1 17.1.2 Erosion and Sediment Control . . . . . . . . . . . . . . . . . . . . . . . . . . . . . . . . . . . . . . 17-2 17.1.3 Landscaping . . . . . . . . . . . . . . . . . . . . . . . . . . . . . . . . . . . . . . . . . . . . . . . . . . . . 17-3 17.1.4 Reclamation . . . . . . . . . . . . . . . . . . . . . . . . . . . . . . . . . . . . . . . . . . . . . . . . . . . . 17-3 17.1.5 Reselling . . . . . . . . . . . . . . . . . . . . . . . . . . . . . . . . . . . . . . . . . . . . . . . . . . . . . . . 17-4 17.1.6 Topsoil Manufacturing . . . . . . . . . . . . . . . . . . . . . . . . . . . . . . . . . . . . . . . . . . . . . 17-4 17.1.7 Turf Application . . . . . . . . . . . . . . . . . . . . . . . . . . . . . . . . . . . . . . . . . . . . . . . . . . 17-5 17.1.8 Wholesale Nurseries . . . . . . . . . . . . . . . . . . . . . . . . . . . . . . . . . . . . . . . . . . . . . 17-6 17.2 18 . Market Development and Planning . . . . . . . . . . . . . . . . . . . . . . . . . . . . . . . . . . . . . . . . . 17-6 17.3 Distribution Options . . . . . . . . . . . . . . . . . . . . . . . . . . . . . . . . . . . . . . . . . . . . . . . . . . . . . 17-8 17.4 Bulk Versus Bagged Product Sales . . . . . . . . . . . . . . . . . . . . . . . . . . . . . . . . . . . . . . . . . 17-8 17.5 Competing Products . . . . . . . . . . . . . . . . . . . . . . . . . . . . . . . . . . . . . . . . . . . . . . . . . . . . . 17-9 17.6 Transportation . . . . . . . . . . . . . . . . . . . . . . . . . . . . . . . . . . . . . . . . . . . . . . . . . . . . . . . . . 17-9 System Selection . . . . . . . . . . . . . . . . . . . . . . . . . . . . . . . . . . . . . . . . . . . . . . . . . . . . . . . . . . . . . 18-1 18.1 Factors to Consider . . . . . . . . . . . . . . . . . . . . . . . . . . . . . . . . . . . . . . . . . . . . . . . . . . . . . 18-1 18.2 Common Technology Combinations. . . . . . . . . . . . . . . . . . . . . . . . . . . . . . . . . . . . . . . . . 18-1 18.2.1 Combination 1: Collection and Windrow Composting of L&YW Only . . . . . . . . 18-3 18.2.2 Combination 2: Combined Collection and Composting of Food Waste with L&YW in an Actively Aerated Composting System . . . . . . . . . . . . . . . . . . . 18-5 18.2.3 Combination 3: Collection and Actively Aerated Composting of Food Waste, and Separate Collection and Windrow Composting of L&YW . . . . . . . . 18-7 18.2.4 Combination 4: Collection and Processing of Food Waste in an AD Facility, and Separate Collection and Windrow Composting of L&YW . . . . . . . . . . . . . 18-10 18.2.5 Combination 5: Collection and AD of Food Waste at the Local WWTP with Biosolids, and Windrow Composting of L&YW at a Separate Facility . . . . 18-12 18.3 Evaluation of Program and Technology Combinations. . . . . . . . . . . . . . . . . . . . . . . . . . 18-13 References . . . . . . . . . . . . . . . . . . . . . . . . . . . . . . . . . . . . . . . . . . . . . . . . . . . . . . . . . . . . . . . . . . . . . . . . . R-1 Glossary . . . . . . . . . . . . . . . . . . . . . . . . . . . . . . . . . . . . . . . . . . . . . . . . . . . . . . . . . . . . . . . . . . . . . . . . . . . G-1 viii Acknowledgements This Environment Canada publication was developed under the lead of Alain David, Program Enginee the Waste Reduction and Management Division. Mr. David would like to acknowledge the contribution of the following people for their hard work and commitment to make this publication possible. CH2M HILL External Reviewers Scott Gamble, Project Manager/Subject Matter Expert Suzanne Burelle Ministère du Développement durable, de l’Environnement, de la Faune et des Parcs du Québec Rita Burke, Lead Graphic Designer Beth Cavers, Subject Matter Expert Mari Chijiwa, Graphic Designer Zeynep Erdal, Subject Matter Expert Dianne Kearney, Lead Information Designer Tom Kraemer, Subject Matter Expert Jose Lozano, Reprographics Specialist Donna Riley, Information Designer Felicia Rubright, Lead Technical Editor Jennifer Seebeck, Technical Editor Todd Williams, Subject Matter Expert Eliot Epstein Epstein Environmental Consultants Jeff Gage Compost Design Services Daryl McCartney Edmonton Waste Management Centre of Excellence Lambert Otten Compost Council of Canada Rhonda Sherman North Carolina State University Melissa Woo, SharePoint Manager Environment Canada Subconsultants François Letellier, Program Scientist, Waste Reduction and Management Division Ron Alexander R . Alexander Associates, Inc . Véronic Pichard, Program Scientist, Waste Reduction and Management Division Françoise Forcier SOLINOV Jacinthe Séguin, Manager, Strategies and Coordination, Waste Reduction and Management Division Konrad Fichtner Morrison Hershfield Nora Goldstein BioCycle ix Acronyms and Abbreviations °C .................. Degrees Celsius C.R.C. ............ Consolidated Regulations of Canada 24/7................ 24 hours a day and 7 days per week CSTR ............. Continuously stirred tank reactor 3R .................. Reduce-Reuse-Recycle DB.................. Design-build AD.................. Anaerobic digestion DBB ............... Design-bid-build ASCE ............. American Society of Civil Engineers DBFO............. Design-build-finance-operate ASP ............... Aerated static pile DBO ............... Design-build-operate ASTM............. American Society for Testing and Materials DFO ............... Fisheries and Oceans Canada BMP ............... Best management practice dw .................. Dry weight BNQ ............... Bureau de Normalisation du Québec EBRT ............. Empty bed residence time BOD5 ............. 5-day biochemical oxygen demand FAS ................ Free air space BTU/ft3 ........... British FBR ............... Fluidized bed reactor thermal units per cubic foot D/T ................. Dilutions to threshold C .................... Carbon FCM ............... Federation of Canadian Municipalities CAP ............... Compost Analysis Proficiency FIT ................. Feed-in tariff CCC ............... Compost Council of Canada FOG ............... Fats, oils, and grease CCME ............ Canadian Council of Ministers of the Environment FTE ................ Full-time equivalent C-CO2 ........... Carbon-carbon dioxide CFIA............... Canadian Food Inspection Agency CGA ............... Canadian Gas Association CH4 ................ Methane CHP ............... Combined heat and power CIWMB .......... California Integrated Waste Management Board g..................... Gram GHG .............. Greenhouse gas g/L.................. Grams per litre GMP .............. Guaranteed maximum price H2................... Hydrogen H2S ................ Hydrogen sulphide ha................... Hectare Cl ................... Chlorine hp................... Horsepower cm .................. Centimetre ICI .................. Industrial, commercial, and institutional CMAR ............ Construction management at-risk C:N ............... Carbon to nitrogen CNG............... Compressed natural gas CO2 ................ Carbon dioxide CO2 eq. .......... Carbon dioxide equivalent x IEA ................. International Energy Agency K .................... Potassium kg ................... Kilogram kg/ha ............. Kilograms per hectare Acronyms and Abbreviations kg/m3 ............. Kilograms per cubic metre O&M .............. Operations and maintenance kJ/m3.............. Kilojoules per cubic metre O2 .................. Oxygen km .................. Kilometre OM ................. Organic matter kPa ................ KiloPascal kW ................. Kilowatt OSHA............. United States Occupational Safety and Health Administration kWh ............... Kilowatt-hours P .................... Phosphorus kWh/t ............ Kilowatt-hour per tonne P3 .................. Public-private partnership L..................... Litre PAW ............... Passively aerated windrow L&YW ............ Leaf and yard waste PFRP ............. Process to Further Reduce Pathogens LCA................ Life-cycle assessment LNG ............... Liquefied natural gas m.................... Metre m2 .................. Square metre m3 .................. Cubic metre m3/min/m2 ..... Cubic metres per minute per square metre PPE ............... Personal protective equipment ppm................ Parts per million QC ................. Quality control RFI ................. Request for information RFP ............... Request for proposal RFQ .............. Request for qualifications m3/t ............... Cubic metre per tonne rpm ................ Rotations per minute mg C-CO2/g OM/day .......... Milligrams of carbon in the form of carbon dioxide per gram of organic matter per day R.S.C. ............ Revised Statutes of Canada mg S-2/L ......... Milligrams of sulphide per litre mg/kg ............ Milligrams per kilogram mg/L............... Milligrams per litre SiO2 ............... Silicon dioxide SRT ............... Solids retention time SS .................. Suspended solids SSO ............... Source-separated organics T .................... Tonne mg/m3 ............ Milligrams per cubic metre TMECC .......... Test Methods for Examination of Composting and Compost MJ .................. Megajoules tpd.................. Tonnes per day MJ/m3 tpy .................. Tonnes per year ............ Megajoules per cubic metre MJ/Nm3 .......... Megajoules per normal cubic metre TS .................. Total solids mL.................. Millilitre UASB ............. Up-flow anaerobic sludge blanket mm................. Millimetre U.S................. United States MPN............... Most Probable Number MSW .............. Municipal solid waste USEPA........... United States Environmental Protection Agency N .................... Nitrogen UV.................. Ultraviolet N/A................. Not applicable V .................... Volt NM3................ Normal cubic metre VFA ................ Volatile fatty acid xi Acronyms and Abbreviations VFD ............... Variable frequency drive VOC ............... Volatile organic compound VS .................. Volatile solids VSr................. Volatile solids reduction WEF............... Water Environment Federation WWTP ........... Wastewater treatment plant yd3 ................. Cubic yard yr.................... Year xii 1. Introduction to Municipal Solid Waste Organics Organic waste makes up about 40% of the residential waste in Canada. Municipalities cannot realistically reach diversion targets greater than 50% without instituting some type of residential organics collection program (FCM, 2009). Increasingly, municipalities are collecting source-separated organics (SSO) from residences, and a few municipalities collect SSO from selected businesses, such as restaurants, hotels, and grocery stores. One of the most important decisions in planning an organics recovery program is the choice of processing technology that will successfully meet the community’s diversion needs. Some technologies are more suitable than others, depending on the composition and quantities of organic material to be treated. The acquisition of a good knowledge of the community’s organic waste stream, including composition, quantities and sources, is therefore an essential first step in the planning process. This chapter discusses: • • • 1.1 Section 1.1: Composition of MSW Organics Section 1.2: Estimating the Quantities of MSW Organics Section 1.3: Common Issues and Challenges Composition of MSW Organics The municipal solid waste (MSW) stream is diverse and contains a variety of organic and inorganic materials. Typically, the identifiable organic fractions include food waste and leaf and yard waste (L&YW). SSO waste is a commonly used term that refers to the combination of the MSW organic fraction from residences and the industrial, commercial, and institutional (ICI) sector. 1.1.1 Food Waste Food waste represents a significant proportion of organic material found in residential waste. It is generated primarily by the residential and ICI sectors, and can be either postconsumer, originating from residential and commercial kitchens (i.e., restaurants and hospitals), or preconsumer, coming from distribution and retail agents (i.e., transporters and supermarkets). Food waste has a high moisture content, which can lead to the generation of leachate and odours during handling and processing. Specific Organic Wastes Typically Targeted for Diversion ■ Grass and leaves ■ Garden debris and weeds ■ Tree prunings and brush ■ Bones ■ Bread, muffins, cake, cookies, pies, and dough ■ Coffee grounds and tea bags ■ Eggs and egg shells ■ Fruit and vegetable peelings ■ Meat, chicken, and fish ■ Nut shells ■ Pasta and rice ■ Sauces and gravy ■ Solid dairy products ■ Table scraps and plate scrapings 1-1 1. Introduction to Municipal Solid Waste Organics In this Technical Document, soiled paper products are included as part of the food waste discussion. Soiled paper products that cannot be recycled (e.g., paper towels, napkins, soiled or waxed cardboard, soiled newspaper, and tissues) are often included in organic waste diversion programs. These materials are readily degradable, so including them in diversion programs can be beneficial, since they act as an absorbent for other liquids during collection. 1.1.2 Leaf and Yard Waste L&YW consists of green grass clippings and thatch, leaves, weeds, brush, and small tree prunings. L&YW is generally small enough that it does not require grinding or shredding before being processed through composting or anaerobic digestion. More than any other component of the solid waste stream, L&YW generation rates vary widely during the course of the year. Figure 1-1 shows the magnitude of this variation, with the typical monthby-month quantities. L&YW quantities can also vary from year to year within the same area. Intuitively, these fluctuations can be attributed mainly to climatic changes that directly affect grass and tree growth rates, including variations in temperature, precipitation, and hours of sunlight. Photo 1-1: Source-separated food waste © Environment Canada, 2012. Photo: Alain David Photo 1-2: Preconsumer food waste tends to be relatively free of contaminants © CH2M HILL L&YW is generally a very clean and contaminantfree feedstock. Some of the common contaminants found in L&YW include plastic bags, pet wastes, dirt, rocks, and fertilizer containers. Brush, tree limbs, and to a lesser extent tree trunks and stumps, can also be found in the MSW stream and are often considered when evaluating L&YW diversion programs. These wood wastes are sometimes referred to as “green wood” to differentiate them from dimensional lumber and other processed wood products that can be found in the MSW stream. Green wood should be ground or chipped before it is mixed with other organic waste materials. 1-2 Photo 1-3: L&YW is the most common feedstock at organic processing facilities in Canada © CH2M HILL 1. Introduction to Municipal Solid Waste Organics Figure 1-1 : Typical monthly variation in L&YW quantities Green wood can be generated as a result of gardening and landscaping, tree care, and overhead utility line clearing. Land development or redevelopment, as well as wind and ice storms, are other contributors. Tree diseases and insect infestations (e.g., Dutch elm disease and pine bark beetle) can also affect the quantity of greenwood waste generated; however, debris resulting from control of these infestations is often managed outside of L&YW and wood waste programs due to concerns over disease spread. 1.2 Estimating the Quantities of MSW Organics Photo 1-4: Storms can result in large volumes of tree limbs and branches © CH2M HILL Figure 1-2 illustrates the typical content of residential waste in Canada. The residential sector generates food scraps in a relatively constant quantity all year around, but L&YW fluctuates according to the season and the type of area (i.e., suburb, downtown urban, or rural, where urban areas generate more food waste, and rural areas generate more L&YW and other waste). On average, a common household generates between 150 and 200 kilograms (kg) per person of organic waste annually. In municipalities where there is curbside recycling but no SSO diversion programs, as much as half of the waste sent to landfill can be organic in nature (CH2M HILL, 2011). Organic waste is also generated in large quantities by the ICI sectors. Some of the larger generators of ICI organic wastes include food packaging and distribution companies, restaurants, cafeterias and convention centres, and supermarkets. If these large contributors are Figure 1-2: Typical content of residential waste in Canada 1-3 1. Introduction to Municipal Solid Waste Organics being considered for inclusion in an organics recovery program, they should be investigated, since the nature and quantities of organic waste produced may vary considerably from one to another. In order to properly plan SSO diversion programs and design facilities, accurate estimates of organic waste quantities in the MSW stream are required. Material that is already separated and diverted can be quantified through direct measurement, but in the case of organics mixed with other waste types, solid waste professionals must extrapolate quantities from known values that represent their percentage of the incoming waste stream. Estimating the quantities of L&YW generated is complicated by seasonal and year-to-year variations, as well as the fact that a significant quantity of L&YW is managed onsite by residents and businesses through such means as mulching and backyard composting. As a result, L&YW quantities are normally estimated on an as-disposed basis, which represents only material managed through municipal programs and facilities. Determining the relative quantities of the different waste types in mixed MSW is sometimes achieved by conducting a waste composition study. During such a study, representative samples of solid waste from various sources (e.g., residential and ICI) are obtained and manually sorted into major fractions (e.g., paper, plastic, metals and food waste). The weights of the various fractions are tabulated, and the overall composition of the waste is calculated on a percentage basis. Solid waste composition studies that are statistically valid are very costly to undertake; as a result, they are not commonly done outside of major population centres. Also, in order to accurately reflect the waste composition, a study must include sampling intervals in at least the winter and summer seasons to account for seasonal fluctuations in L&YW quantities (though it is possible to extrapolate waste composition data from studies done in other areas with similar climates and socioeconomic characteristics). 1.3 Common Issues and Challenges An effective organics management program can yield important benefits for a community as discussed in detail in Chapter 2. Successful implementation of a program requires careful planning and diligent implementation. Drawing on the experience across Canada in implementing such programs with a variety of technologies, the main factors for consideration include: 1. Choice of technology: This is one of the most important decision in the process, particularly if facilities are sited near population centres. The challenge is to choose the right site for the treatment facility according to the technology chosen (or, inversely, choosing the technology according to the available site), that is at a suitable distance from surrounding neighbours. 2. Size and capacity of facility: In addition to technological aspects, collection methods also have to be considered carefully. The choice of containers (volume and type) is influenced by the type of organics to be recovered (residential food waste combined or separated from L&YW) and adapted to the population profile. 1-4 1. Introduction to Municipal Solid Waste Organics 3. Meeting all regulatory requirements: Dedicated treatment facilities need to be planned according to different provincial environmental requirements, with sufficient capacity and controls to accept materials from a range of sectors. 4. Program costs and financing: To avoid unexpected costs, developing accurate estimates for the project (e.g., collection, facility investment and operation, and end-product marketing and use) can be challenging as decision-makers work with budget envelopes. 5. Meeting community expectations and concerns: Community involvement in siting is paramount. Involvement of the citizens in various aspects of the planning and implementation can contribute to building acceptance of the project, better inform the choice of technology, collection methods, costs and other implementation parameters. 6. Deriving economic benefits: To successfully sell the compost, the quality of the produced compost, the market segment and its end use need to be carefully evaluated. In the case of anaerobic digestion, the investment costs and the revenues associated with the utilisation of the biogas to produce renewable energy also necessitate an assessment. Finally, integrating all the issues and challenges for an optimal decision is on its own a challenge. The secret to success resides in an integrated approach. In other words, technology by itself cannot guarantee the success of an organics recovery program; all aspects, including siting and community involvement, have to be considered equally. 1-5 2. Benefits ofOrganicWaste Diversion Organic matter is an essential component of soils and plays a fundamental role in soil conservation, crop production, and fertility maintenance. Recycling organic matter to the soil is a part of carbon cycling, an emerging and important environmental issue. Organic waste is recognized as an important organic matter resource and has numerous beneficial attributes. However, when sent to landfills, organic waste generates greenhouse gas (GHG) emissions and can create nuisances and health issues. Therefore, it is important to turn this valuable resource into a soil amendment and fertilizer through sound and efficient collection, transportation, treatment, and management practices. Historically, organic wastes, along with other components of the waste stream collected from residential and industrial, commercial, and institutional (ICI) sectors, have been disposed in landfills. It is now widely acknowledged that organic waste contributes significantly to the issues associated with landfills. Anaerobic decay of these materials in a landfill leads to the generation of methane, which in turn can be released to the atmosphere if there are no controls in place. Decay of organic waste also increases the production of leachate and putrid odours. In addition to decreasing landfill nuisances, several other environmental and social benefits are associated with landfill diversion. Biological treatment technologies have been developed to capture the full potential of organic waste diverted from landfills. Composting and anaerobic digestion (AD) technologies were adapted to the specific characteristics of the organic fraction of the municipal solid waste (MSW) stream. Numerous techniques are available to transform organic wastes into valuable products that can be beneficially used in agriculture, horticulture, landscaping, land reclamation, erosion control, and for other purposes. AD technologies in enclosed bioreactors provide new opportunities to capture energy from organic wastes. This energy can further contribute to reducing GHG emissions by displacing fossil fuel use. When all of the advantages of sound MSW organics management are taken into account, significant benefits occur. This chapter discusses the following three categories of benefits in further detail: • • • Section 2.1, Environmental Benefits Section 2.2, Social Benefits Section 2.3, Economic Benefits 2.1 EnvironmentalBenefits 2.1.1 Greenhouse Gas Reduction GHG reductions can be realized when organic waste is diverted from landfills to composting and AD facilities and processed under controlled conditions. MSW organics buried in a landfill break down GHG Reduction In Canada, diverting one tonne of food waste through composting or anaerobic digestion reduces GHG emissions by approximately one tonne of CO2 equivalent compared to landfilling. 2-1 2. Benefits of Organic Waste Diversion anaerobically and produce landfill gas that consists primarily of GHG Reduction Factors methane (CH4). Methane is a potent GHG, with approximately 25 times ■ Level of landfill gas capture the global warming potential of carbon dioxide (CO2), making landfills a ■ Carbon content of compost significant contributor to GHG emissions. Methane also has a relatively recycled to soil short atmospheric lifetime (of about a decade), as compared to carbon ■ Quantity and type of energy generated from biogas dioxide (which remains in the atmosphere for centuries). Due to this ■ Quantity of fertilizer replaced short atmospheric lifetime, reducing emissions of methane and other “short-lived climate forcers” has the ability to slow the rate of nearterm climate change. Through capture, combustion, or utilization of landfill gas, some landfills are able to recover a significant percentage of the methane generated. However, landfill gas capture systems are not 100% efficient, and many landfills are not equipped with such systems. Diverting organics to composting and AD facilities reduces the methane emissions from landfills. Other activities associated with composting and AD also contribute to GHG reductions, although to a lesser extent. Recycling of organic matter (OM) to soil provides carbon restoration and humus formation (ICF, 2005). Reductions in chemical fertilizer use as a result of compost applications also provide energy savings. Additional reductions can be obtained when AD is used. Biogas produced during the AD process is captured and can be used to produce electricity that displaces the electricity produced from burning fossil fuels. Biogas can also be refined into a fuel that displaces fossil fuels in heating and vehicles, which further contributes to GHG reductions. Many factors, such as the level of landfill gas capture, the carbon content in the compost recycled to soil, the quantity and type of energy displaced by the energy created from biogas, and the replacement of fertilizer, all influence the level of GHG reductions associated with organics processing and use. 2.1.2 Compost Products Uses One of the primary outcomes of most organic waste diversion programs is the production of a stable, mature, and pathogen-free finished compost product: a dark, friable, and earthy-smelling material that resembles soil and is high in humus and valuable plant nutrients. Compost is extremely beneficial in a variety of applications. Benefits of Compost Use ■ Improves any soil to which it is applied, increasing productivity ■ Suppresses soil-borne disease organisms ■ Prevents topsoil loss ■ Provides erosion control ■ Degrades some petroleum-based contaminants and reduces the bioavailability of heavy metals As a soil amendment for agriculture, landscaping, and horticultural applications, compost improves any soil to which it is applied. Dense clay soils benefit from the inclusion of compost, as it makes them more friable, improving root penetration and drainage. Porous, sandy soils gain better water-holding capacity with the addition of compost, and nutrients are more readily retained. Agricultural soils with depleted OM and that are subjected to extensive cultivation practices improve water conservation through better fertilizer retention in soil, less compaction due to improved structure, and increased productivity. Horticultural soils are improved with the addition of compost for these same reasons, as well as the fact that compost also contains bioavailable nutrients that are released over several growing seasons. Research projects over the past decade have proven that using compost can also suppress soil-borne disease organisms. 2-2 2. Compost can also be used for erosion control and to prevent further loss of topsoil in disturbed areas. Compost blankets absorb moisture, moderating the effect of rain on otherwise bare areas, so they are useful in disturbed areas, such as construction sites, capped landfill areas, and restored watercourse banks. One can plant directly into compost, which stays in place indefinitely to enhance the soil. Compost can both improve the physical, chemical, and biological characteristics of soils, as well as provide a biological method to degrade specific petroleum-based contaminants and reduce the bioavailability of heavy metals. Reclamation and restoration uses for industrial lands are also well acknowledged. Benefits of Organic Waste Diversion Environmental Benefits of Diverting Organics from Landfills ■ Preserves landfill capacity ■ Reduces landfill leachate quantities and management costs ■ Passively treats landfill gas emissions in landfill closure projects ■ During the active life of a landfill, provides erosion prevention, sediment control, and surface water treatment Use of compost products from organic waste collection and processing provides several environmental benefits that also translate into cost savings. Soil improvement and the decreased need for general fertility maintenance and fertilizer use and production provide measurable benefits. As well, compost helps reduce the humus extraction from soils (peat and black earth) and produces associated benefits. Compost can be integrated into landfill cover systems and has successfully been used as part of methaneoxidation cover systems that passively treat landfill gas emissions. 2.2 SocialBenefits All of the environmental benefits associated with landfill diversion and compost use also provide social benefits. Reducing the GHG and other pollutant emissions (e.g., particulates and air pollutants) help protect human health and prevent degradation of natural ecosystems. Social Benefits of Diverting Organicsfrom Landfills ■ Protects human and environmental health ■ Reduces landfill safety risks Methane generated by burying organic wastes in landfills can also present a safety risk. Landfill gas can migrate underground and accumulate in and around structures that are close to the landfill site. If significant quantities accumulate, there is a risk of explosion. Reducing the quantity of organics in landfills helps to reduce the amount of landfill gas generated and the associated safety risks. Extended landfill life contributes to land preservation; diverting organics from landfills preserves space for those wastes that cannot be diverted or reused. As well, compost can be incorporated into bioswales, engineered wetlands, and other biological systems for treating surface water runoff and reversing the negative impacts of industrialization. ■ Contributes to land preservation ■ Produces compost, which can be used for reforestation, wetlands restoration, and habitat revitalization to reverse industrialization impacts ■ Decreases nuisances for neighbours ■ Allows creation of compost and biogas, reducing reliance on nonrenewable resources (peat and fossil fuels) ■ Provides opportunities for teaching, training, and employment ■ Contributes to healthy soils vital to sustaining the agricultural industry Removing organics from landfills reduces leachate and odours nuisances; therefore, decreasing the social negative impacts for 2-3 2. Benefits of Organic Waste Diversion surrounding communities and society. The development of organic processing facilities and the end-use of compost and energy derived from organics processing also lead to numerous social benefits. Developing facilities closer to the communities in which the organic wastes are generated can encourage better community participation. Facilities that are close to waste sources also reduce transportation requirements, which can also provide environmental health benefits through the reduction of GHG emissions. Source separation, conversion, and reintroduction of organics into the carbon cycling system also promote the Reduce-Reuse-Recycle (3R) hierarchy by modelling the importance of sound resource management. Distributing compost for residential, commercial, agricultural, and industrial uses demonstrates practical and positive outcomes for organic cycling, which in turn encourages participation at all levels of the wasteresource system. Compost end-use also stimulates employment and a new, environment-based economy. Processing facilities create new jobs during both the construction and operation phases. Compost management supports economic development through employment: handling, marketing, research, demonstration, and education. By reducing fertilizer needs and providing soil improvement, organics recycling helps sustain agriculture and food production. 2.3 EconomicBenefits At first glance, MSW organics collection and processing, and subsequent use as a soil amendment, leads to additional MSW management system costs associated with: • • • • • Operating and amortized capital costs for new processing infrastructure Re-engineering collection programs Communications to promote participation Administration of stewardship programs to support the organics recycling strategy Research, demonstration, and education to develop markets and social acceptance Economic Benefits of Diverting Organics from Landfills ■ Extends landfill life ■ Reduces harmful emissions ■ Provides new, environmentalbased, direct and indirect employment opportunities ■ Provides costs savings by reducing fossil fuel and fertilizer use ■ Generates potential revenue if GHG reductions sold as offsets ■ Provides costs and energy savings from chemical fertilizer replacement Traditional accounting methods would normally estimate that these modifications may represent an additional cost to each household within the system. However, these supplemental costs depend on the specific analysis context. For example, when conducting a life-cycle analysis of an organics diversion program, supplemental costs to the environmental and social benefits gained would be considered to estimate the net cost impact to society. Positive impacts of organic diversion programs that would also be considered include: • • • 2-4 Extended landfill life Reductions in GHG emissions and air pollutants (versus landfilling) Direct and indirect employment benefits 2. • • • Benefits of Organic Waste Diversion Energy and costs savings from chemical fertilizer replacement Potential revenues from energy produced from anaerobic digestion Lower cost for leachate management Organic waste diversion programs typically provide net benefits when a life-cycle accounting procedure is used to measure the cost of capital and operations, taking into account the social and environmental benefits. Landfill space has become a valuable commodity in many parts of Canada. Diverting organic materials with viable management options away from landfills, and preserving that space in the landfill for materials that have no other alternative, makes good business sense. With less waste coming in, the lifespan of existing landfills can be extended significantly, which defers the costs associated with finding and constructing new landfill sites. Siting new landfills is normally a challenging task as many, often opposing, factors need to be taken into account. For instance, a desirable proximity to the waste source is in direct opposition to the selection of a site with no nearby neighbours who might be negatively impacted. From an economic standpoint, extending the lifespan of an existing site is always preferable to seeking a new property to replace a landfill nearing capacity. In jurisdictions where landfills are located hundreds of kilometres (km) from the point of waste generation, the costs of transferring waste to landfills can be significant. Since organic waste processing facilities do not preclude future redevelopment and land use, it may be possible to locate these facilities closer to the point of generation; thus, reducing transfer and management costs for municipalities, as well as GHG emissions. As discussed in the previous section, the compost production and distribution cycle provides employment and other resultant benefits to local communities. As well, the AD process produces both electricity and a substitution for fossil fuel. With the increasing cost of energy and a better understanding of climate change’s negative impacts, it has become more obvious that diverting organics from landfills provides a logical and practical choice for the future. In addition to cost savings, revenues can be obtained from byproducts, such as compost that can be marketed and sold. AD facilities may also be able to convert biogas into heat and various grades of fuel for electrical generation, district heating, and powering vehicles. The economic benefits of selling these products, or using them to offset internal consumption of fossil fuels, can be significant. Diverting organic materials from landfills reduces the cost of landfill leachate management. Less organic waste means there is less moisture going into the landfill to contribute to leachate generation. Collecting and managing landfill leachate can be costly, particularly if offsite treatment or disposal is required. 2-5 3. Science and Principles of Aerobic Processing (Composting) As shown conceptually in Figure 3-1, composting is an aerobic biological process that involves a succession of different microorganisms decomposing organic materials and converting them into a biologically stable product with no phytotoxic (harmful) effects on plants when used as a soil supplement. Composting differs significantly from the decay process that occurs in nature; it is monitored and controlled, aerobic conditions are maintained, and it includes a high-temperature phase (e.g., above 55 degrees Celsius [°C]) that reduces or eliminates pathogens and weed seeds. Figure 3-1: The composting process Chapter 5 provides details about the range of composting methods and commonly used technologies. This chapter focuses on providing the reader with a basis understanding of the key aspects of the composting process, including: For Project Planning Purposes • • • 3.1 Section 3.1, Steps of the Composting Process Section 3.2, Compost Microbiology Section 3.3, Key Process Management Parameters For every tonne of source-separated organics that is composted, approximately 0.5 tonnes of finished compost is produced. Steps of the Composting Process Successful composting involves up to seven different steps, as illustrated in Figure 3-2. Throughout all of the steps, odours and other nuisance conditions (e.g., dust, litter, and vectors); surface waters; and leachate must be managed. These additional requirements are discussed further in Chapters 9, 10, 14, and 15. Step 1: Inspecting Feedstock . This step involves removing the materials that have been delivered to the composting facility from containers or bags, and inspecting for unacceptable or noncompostable items (e.g., metal cans, glass bottles, and plastic film). Particular emphasis is usually placed on removing contaminants that could pose safety concerns to workers in the facility (e.g., sharps, and glass or metal pieces); damage equipment (e.g., large rocks and concrete pieces and empty pesticide containers); or negatively impact finished compost product quality (e.g., batteries). Figure 3-2: Steps of the composting process 3-1 3. Science and Principles of Aerobic Processing (Composting) Step 2: Preparing Feedstock . This step refers to the changes made to the feedstocks’ physical and chemical characteristics in order to provide optimal conditions for active composting. This may involve grinding to change particle size, blending to ensure the feedstocks are homogeneous, or adding amendments or other materials to adjust physical or chemical characteristics of the feedstocks. At larger facilities, the inspecting and preparing feedstock steps are sometimes integrated into a single line of equipment. Feedstock Preparation May include one or more of the following steps, depending on feedstock and composting technology type: ■ Debagging ■ Sorting ■ Screening ■ Grinding or shredding ■ Adding amendments or inoculants (e.g., recycled compost) ■ Adding water or leachate ■ Mixing feedstock, amendments, water and leachate, and/ or inoculants together into a homogeneous mixture Step 3: Active Composting . This step involves the rapid decomposition of feedstock components that degrade easily. Once the feedstocks have been amended and mixed with other materials, they are placed into the pile, windrow, or vessel where active composting takes place. The active composting step is characterized by high levels of biological activity that create a high demand for oxygen. The activity of these microorganisms also results in a rapid rise in temperature within the feedstock mixture. When the optimal oxygen, moisture, and nutrient levels are present, the biological activity can raise the feedstock mixture’s temperature from ambient levels into the 55 to 65°C range within 24 hours. Photo 3-1: Both manual and mechanical methods are used for feedstock inspection and preparation © Scott Gamble The heat produced by the microorganisms that are decomposing the feedstocks provides several important benefits. Most importantly, it allows for the populations of pathogenic microorganisms in the feedstocks to be reduced to acceptable levels, as defined in regulatory standards discussed in Chapter 16. The active composting phase’s high temperatures also render weed and plant seeds inactive. Pathogens Most pathogenic bacteria, viruses, and parasites are inactivated when exposed to temperatures in excess of 55°C for 3 or more consecutive days. However, the temperatures encountered during active composting can also cause large quantities of water to evaporate from the composting piles. If this loss of moisture is not properly managed, and the moisture content of the material is allowed to drop below the optimal range (i.e., 55 to 65%), then the microorganisms are impeded, and the composting process slows down. If feedstocks are allowed to dry out too much (i.e., less than 40% moisture), they may also become a source of dust, increasing the risk of fires and causing health issues for site staff and visitors. Section 3.3.4, Moisture Content, provides additional details related to optimal moisture content and moisture management. 3-2 3. Science and Principles of Aerobic Processing (Composting) This step of the composting process generally requires the closest monitoring, as it could result in objectionable odours and other nuisance conditions (i.e., the attraction of flies and rodents). Active composting can last from 3 to 4 weeks, or it can take 8 to 12 months. The wide variation in time can be attributed to several factors, including the type of feedstocks, the degree of feedstock preparation, the type of composting technology used, climatic conditions, and the level of operator control and management. Step 4: Recovering Bulking Agents . Some composting facilities recover coarse bulking agents, such as woodchips, from the feedstocks for reuse before curing by passing the materials over 2- or 2.5-centimetre (cm) screens; the smaller particles continue on to the curing step, and the larger particles are recycled back to the preparing feedstock step. However, removing bulking agents reduces the free air space (FAS) within the material. This increases the potential for anaerobic conditions to develop, which can lead to objectionable odours and may create the need for closer monitoring and more frequent turning during the curing step. Thus, leaving bulking agents in the material and recovering them during the final screening step can improve passive aeration during the curing step. Step 5: Curing . This step involves microorganisms converting carbon into carbon dioxide and humus, and nitrogen into nitrates, which is a much slower biological process. Microorganisms begin to decompose more complex organic structures, such as the lignins and cellulose contained in paper, wood, and plants, and stable humic substances are formed in the curing piles. Photo 3-2: Large particles removed from compost through screening can be reused if not contaminated © CH2M HILL Advantages of Recycling Bulking Agents ■ Reduces the volume of material to be handled during curing, which then reduces curing space requirements and material handling costs ■ Reduces the quantity of fresh bulking agents that need to be procured by as much as 50% ■ Accelerates the composting of subsequent feedstock batches through the beneficial microorganisms contained in the recycled bulking agent As the more readily degradable materials in the feedstock are consumed, the types of microorganisms in the feedstock change, and the overall populations become smaller. These changes results in a lower oxygen demand and lower temperatures, characteristics of the curing step. Climatic conditions are also relevant, because curing activities generally occur outdoors. Since ambient temperatures directly affect the level of Photo 3-3: Windrows are commonly used for curing © CH2M HILL 3-3 3. Science and Principles of Aerobic Processing (Composting) biological activity, the curing step may be partially or completely interrupted by cold, winter temperatures as microorganisms in the curing piles become dormant. If there are pockets of cold temperatures, the curing step can take 8 to 12 months (e.g., from September through to the following summer or fall). The curing step is considered complete when the stability and maturity criteria outlined in Chapter 16 are met. The terms “stability” and “maturity” are often used interchangeably, but they are actually two separate indicators that measure different properties: Curing Timeframe ■ Curing can be done in as little as 8 weeks or can take as long as 12 months to complete ■ Time requirement depends on: - Type of feedstock used • • Stability is a measure of the biological activity in the compost material. Conceptually, material with a high amount of biological activity (e.g., more than 4 milligrams of carbon in the form of carbon dioxide per gram of organic matter per day [4 mg C-CO2/g OM/day]) indicates that the decomposition process is still occurring and that the material is not ready to be used as a soil supplement. Maturity is a measure of the broader chemical condition of compost and is used to indicate the presence or absence of phytotoxic effects (i.e., harmful to plants), which are usually caused by higher levels of ammonia or organic acids. Phytotoxic effects can also be caused by using compost that is not fully stabilized. - Type of active composting process used - Duration of the active composting step - Conditions in the curing piles Stability vs . Maturity Because of the differences in what is being measured (biological activity versus phytotoxic effects), it is possible for a compost product to be stable but not mature. However, mature compost is always stable. Stability is determined by using various tests that measure the oxygen demand or carbon dioxide evolution by microorganisms in a sample (i.e., higher oxygen demand or generation of more carbon dioxide indicates a sample is less stable), or by measuring the temperature increase (or lack thereof) in samples under controlled conditions. Temperature rise indicates that the microorganisms are still actively decomposing materials and generating heat; if this is still happening, the material is less stable. The most common maturity test used is a seed germination test. However, ammonia and volatile organic acid concentrations in the compost also provide a measure of maturity. Due to the potential for false positive results, two tests should be used when assessing whether compost is finished: one test for stability and one for maturity. Chapter 16 provides details about the specific criteria used to assess whether compost is mature. Step 6: Final Screening . This step involves refining the cured compost before it is sold or used so that it is a more suitable soil amendment. Most commonly, this involves passing the material over 1- to 1.25-cm screens to remove oversized materials, such as large compost particles, stones, and uncomposted bulking agents (which can be reused in the active composting step). Screening can also remove some of the remaining physical contaminants that may be present, such as glass or metal pieces. Finished compost is sometimes further refined to produce value-added products. For example, compost can be blended with topsoil, sand, or gypsum to make customized horticultural media. Finished compost can also be dried and reformed into a pelletized or granulated product using specialized processing equipment. 3-4 3. Science and Principles of Aerobic Processing (Composting) Step 7: Storing . Properly storing the finished compost product is the final step of the composting process. Whether compost is in bulk form or placed in bags, it should be stored in a manner that prevents dust or odours from developing, and prevents contamination of the product from weeds, leachate, or other contaminants. For example, large stockpiles of finished compost can become a source of odours if they are saturated with rainfall, and can quickly become infested by weeds. Fire prevention and control should also be considered in finished product storage areas, since compost can be a fuel source. 3.2 Compost Microbiology Composting is an aerobic biological process that relies on different types of microorganisms through the active composting and curing steps. The predominant types of microorganisms present during the composting process are bacteria, fungi, and actinomycetes. During the active composting and curing steps, there is a succession of different types of microorganisms. The specific types of microorganisms present at any given time depend upon the food sources available and the temperatures of the composting environment, as illustrated in Figure 3-3. Photo 3-4: Weeds and other vegetation should not be allowed to take root in stockpiles of finished compost © Scott Gamble Microbial Succession ■ During composting, there is a succession of microbial species; the environment created by, or the byproducts of, one species invites the activity of another species. ■ Bacteria break down easily degraded OM; fungi and actinomycetes work on more complex organics. ■ No single species persist through the entire range of conditions encountered during the composting process. Figure 3-3: Theoretical temperature variations and microbial populations during the composting process 3-5 3. Science and Principles of Aerobic Processing (Composting) 3.2.1 Bacteria As shown in Table 3-1, bacteria can be classified into three types, according to the temperature at which they can survive and flourish. Composting practitioners often use this method of referring to bacteria types instead of referring to specific bacteria species. Table 3-1: Bacteria types Bacteria (types) Temperature range Psychrophile Less than 20°C Mesophile 20 to 45°C Thermophile 45 to 80°C (Cammack et al ., 2006) The size of the bacteria populations normally increases rapidly during the first 3 to 7 days of the active composting step. As the bacteria population expands and degrades the organic feedstocks, bacteria gives off heat, which causes composting pile temperatures to rise into the 55 to 65°C range. Bacteria are generally faster decomposers than actinomycetes and fungi, but they mainly target the less complex compounds in the feedstock, such as carbohydrates and proteins. Once these more easily degraded materials are depleted, the bacteria populations decline, and the other two types of microorganisms become more predominant. It is important to note that although the populations decline, bacteria can still be found in the latter steps of the composting process. 3.2.2 Fungi Fungi are larger microorganisms and may also be present in many forms. While they are present during active composting, fungi are more prevalent during the mesophilic conditions found during curing. This is partly because fungi have the ability to break down the more complex compounds, such as cellulose and lignin, and partly because they are more adapted to the drier conditions that normally take place during the curing step. 3.2.3 Actinomycetes “Actinomycetes” is an older term for a specialized group of bacterial formally classified as Actinobacteria. However, many composting practitioners continue to use the older terminology. Photo 3-5: Actinomycetes (actinobacteria) are visible just under the surface of the pile during the latter part of active composting © CH2M HILL Although actinomycetes are a type of bacteria, they are similar in some ways to fungi. As shown in Figure 3-3, actinomycetes are more prevalent during the mesophilic conditions that occur during the latter stages of the active composting step and during curing. They are often visible during the latter half of the active composting step, and can be recognized as the greyish, cobwebby growth that tends to be located 3 to 5 cm below the surface of the compost pile. Actinomycetes play an important role in converting nitrogen into plant-usable forms. 3-6 3. 3.3 Science and Principles of Aerobic Processing (Composting) Key Process Management Parameters Several key process management parameters are commonly used to monitor and control composting progress: • • • • • • Oxygen concentration FAS and particle size and structure Carbon to nitrogen (C:N) ratio Moisture content Temperature pH level Photo 3-6: Turning windrows with a front-end loader or windrow turner reintroduces oxygen and re-establishes porosity © CH2M HILL These parameters apply to all composting methods and technologies. However, the emphasis placed on each parameter varies from facility to facility, depending upon feedstock types, composting technology, and operator experience. Table 3-2 provides a summary of the ranges for each parameter that combine to define optimal composting conditions. Table 3-2: Summary of optimal composting conditions Parameter Active composting Curing Product storage Oxygen concentration 13 to 18% FAS 40 to 60% Particle size A mixture of particles between 3 and 50 mm C:N ratio 25:1 to 30:1 18:1 to 23:1 15:1 to 20:1 Moisture content 55 to 65% 45 to 55% 40 to 45% Temperature 55 to 60°C Less than 50°C Ambient pH 6.5 to 8 Notes: mm—millimetre 3.3.1 Oxygen Concentration Composting is an aerobic process, which means that degradation occurs in the presence of oxygen. Adequate oxygen is vital so that the desired types of bacteria, fungi, and actinomycetes are present to break down the organic feedstocks. The oxygen exists and permeates through the air voids between individual particles within the composting pile. Anaerobic processes are those that occur in the absence of oxygen. Aerobic processes are typically able to decompose organic waste more quickly than anaerobic processes. Anaerobic processes also tend to generate more odours. Chapter 4 provides further details about the anaerobic process. The rate at which oxygen is consumed (i.e., the oxygen demand) varies during the composting process, as illustrated in Figure 3-4. Oxygen consumption is highest during the first two to three weeks of active composting, when bacteria populations are at their largest, and is then reduced as the size of the microorganism populations decline later in the active composting step and during curing. 3-7 3. Science and Principles of Aerobic Processing (Composting) It is important to recognize that, even after active composting and curing are completed, there are still microorganisms present in the finished compost. Adequate levels of oxygen (i.e., 13–18%) must, therefore, be maintained in storage piles. Since oxygen demand cannot easily be measured in the field, the oxygen concentration (also referred to as oxygen levels and oxygen content) in the compost pile’s pore spaces is used as a monitoring and control parameter. Oxygen concentrations can be measured in a matter of seconds using probes that are manually inserted into the pile. Figure 3-4: Theoretical oxygen demand by microorganisms during the composting process The oxygen concentration of ambient air is 21%. However, maintaining an oxygen concentration of 21% in a compost pile is difficult and may actually lead to other problems, like low moisture content. The target oxygen concentration during all stages of the composting process is 13 to 18%. It is normal to encounter lower oxygen concentrations in small pockets within the compost pile. However, corrective action should be taken when levels less than 10% appear in large areas of a compost pile, or over a period of several days. Concentrations of less than 5% are indicative of insufficient oxygen. When these conditions are encountered, corrective actions should be undertaken immediately. Photo 3-7: Specialized instruments are used to measure oxygen levels in compost piles © CH2M HILL Oxygen is supplied to the compost pile through passive aeration, mechanical agitation, or forced aeration: • • • Passive aeration is the result of convection within the Oxygen Control compost pile: hotter temperatures in the centre of the pile ■ Aeration is done passively (i.e., cause air to be heated and rise upwards through the top of chimney effect; see Figure 3-5), through mechanical agitation (e.g., the pile, creating a vacuum in the pile’s centre that causes with windrow turners) or by forced fresh air to be drawn in from the sides of the pile. aeration (i.e., using fans). Mechanical agitation of the compost pile (i.e., mixing ■ Oxygen levels in the range of 13 to 18% are desirable. it with a front-end loader or windrow turner every two ■ Corrective action should be taken to three days, or tumbling it within a vessel) exposes when oxygen falls below 10%. materials to the ambient air and helps to re-establish FAS within the pile. Forced aeration refers to the practice of forcing air through the compost pile using highpressure aeration fans and perforated pipes, or some other type of air distribution plenum. When aeration fans are used, they are designed to either blow fresh air up through the compost pile, or suck air down through the pile. Blowing air up and through the pile is referred to as positive aeration. Using fans to suck air down through a pile is referred to as negative aeration. Figure 3-6 illustrates these 3-8 3. Science and Principles of Aerobic Processing (Composting) concepts. There are also aeration systems that, through the use of dampers and additional air ducts, are capable of switching between positive and negative aeration modes. These types of systems are known as bidirectional aeration systems. Aeration can be controlled by turning aeration fans on and off on a set schedule by a mechanical timer or computer. Alternatively, a computer system controls the on/off cycle based on real-time data from temperature or oxygen sensors in the compost pile. Figure 3-5: Passive aeration in a composting pile (chimney effect) Figure 3-6: Two primary methods of forced aeration using fans In both cases, the aeration fan’s on-off cycle should be measured in minutes (e.g., 5 to 10 minutes on, and 5 to 10 minutes off), since oxygen within the compost pile can be consumed in as little as 20 minutes during the active composting step, and anaerobic conditions can start to develop (see Figure 3-7). It is also important that the compost pile still has sufficient FAS to allow for passive aeration when the fans are turned off. (For the same reason, sufficient FAS is required in mechanically agitated systems and turned windrows, even when the compost pile is turned or agitated every 2 or 3 days.) Figure 3-7: Decline of oxygen levels in an aerated composting pile The concentration of oxygen in a compost pile can be consumed very rapidly during the active composting step 3-9 3. Science and Principles of Aerobic Processing (Composting) Continuous aeration is an alternative aeration fan design approach that has become more popular in recent years. In this type of system, aeration fans are run continuously (24 hours per day, 7 days per week [24/7]), and the rate at which air is supplied to the composting pile is controlled by dampers, by using a variable frequency drive (VFD) to speed up and slow down the aeration fan, or by a combination of these two methods. Continuous aeration systems may result in higher power consumption, but they are able to maintain oxygen concentrations in the compost pile at a more consistent level, which is more beneficial to the microorganisms. A continuously operated negative aeration system also allows more odours to be captured than a negative aeration system that is operated intermittently. 3.3.2 Free Air Space, and Particle Size and Structure In composting, three controlled parameters are directly correlated to oxygen concentrations and decomposition rate time: 1. Free air space (FAS) is a measure of the space between individual particles in the compost pile that are filled with air (see Figure 3-8) and is fundamental to active composting and curing, as there must be enough void space in the compost pile for oxygen. It is also critical that the spaces between the particles are interconnected so that air can move through the compost pile passively, or be forced through with aeration fans. Generally, FAS of 40 to 60% is required during the active composting step. Figure 3-8: Air flow through compost pile FAS FAS in the composting pile is affected by the size range of the individual particles, and the relative amounts of differing particle sizes (i.e., the particle size distribution or gradation). Generally, a material that consists mainly of large particles has more FAS than a material comprising mainly smaller particles. It is possible to measure FAS in a compost sample, but the procedure requires the use of specialized instruments that are generally too cumbersome to be used in the field on a regular basis. Instead, bulk density is often used as an indicator of FAS. For example, the bulk density of feedstocks and amendments processed in an actively aerated composting system should be in the range of 475 to 590 kilograms per cubic metre (kg/m3). Materials composted using a passively aerated method (e.g., static piles and windrows) should have a lower density (e.g., less than 475 kg/m3), which is indicative of a higher FAS. 3-10 Bulking Agents ■ Bulking agents are amendments that are added to a feedstock to increase FAS and structure. ■ Bulking agents often have a high carbon content (i.e., high C:N ratio), so resist degradation. ■ Bulking agents are normally removed during screening and subsequently remixed with new feedstocks. ■ Woodchips are the most common bulking agent used at composting facilities. 3. Science and Principles of Aerobic Processing (Composting) 2. The Size of individual particles affects the rate of decomposition. Smaller particles have a greater surface area relative to their volume, and more surface area means more of the material is exposed to microorganisms. Particles should typically be between 3 and 50 mm in size. While smaller particles increase the rate of decomposition, they also affect the FAS within the material: compost piles comprising many small particles may not have enough FAS, so the concentration of oxygen within the compost pile can be too low. Smaller particle sizes may also lead to larger bacterial populations and faster degradation rates. The higher populations can result in the oxygen being rapidly consumed by the microorganisms, and developing anaerobic conditions. 3. The term Structure refers to the strength or “rigidity” of individual particles, as well as their resistance to degradation and compaction over time. It is important that enough of the particles in the composting pile maintain their structural properties throughout the composting process so that the appropriate amount of FAS is also maintained. If all of the particles have poor structural characteristics (like cardboard, which becomes wet and loses its initial rigidity), the FAS within the composting pile is reduced, and anaerobic conditions can develop. 3.3.3 Carbon to Nitrogen Ratio C:N Ratio The microorganisms involved in the composting process need phosphorus (P), potassium (K), carbon (C), and nitrogen (N) in order to survive and flourish. However, it is quite common for the amount of carbon or nitrogen in a particular feedstock to be a limiting factor. Microorganisms use carbon for energy and growth, while nitrogen is used for protein synthesis and reproduction. In order for the composting process to proceed properly, these two nutrients must be available in sufficient quantities, and must be biologically available to the microorganisms. Most of the municipal solid waste (MSW) feedstocks commonly handled by municipal composting facilities contain sufficient quantities of phosphorus and potassium to sustain microorganisms. Food wastes and green grass are examples of materials with relatively high nitrogen contents and, thus, low C:N ratios. Woodchips, dried leaves, and cardboard have a higher proportion of carbon, so high C:N ratios. ■ P and K are usually available in sufficient concentration in feedstocks for active composting to progress. C or N is typically the limiting factor in a feedstock. ■ C:N ratio is commonly used to express the relative quantities of these nutrients in a feedstock or amendment. ■ C:N ratio is controlled by mixing various feedstocks and amendments together to get the desired end result. ■ Biological organisms generally require about 25 to 30 times more C than N. Thus, the target range of C:N ratio for the active composting step is between 25:1 and 30:1. C:N Ratios of Common Feedstocks Food . . . . . . . . . . . . . . . . . . . . . 15:1 The C:N ratio is a commonly used indicator of the relative amounts of nutrients present in a composting feedstock. Green grass . . . . . . . . . . . . . . . 10:1 Leaves . . . . . . . . . . . . . . . . . . . . 55:1 Woodchips . . . . . . . . . . . . . . . . 200:1 • • Low C:N ratio = a higher proportion of nitrogen High C:N ratio = a higher proportion of carbon Newsprint. . . . . . . . . . . . . . . . . 400:1 Cardboard . . . . . . . . . . . . . . . . 560:1 3-11 3. Science and Principles of Aerobic Processing (Composting) The optimal C:N ratio for the active composting step is between 25:1 and 30:1. If a material’s C:N ratio is less than 20:1, then the available carbon may be fully consumed before all the nitrogen is stabilized, and the surplus nitrogen can be converted to ammonia and lost as a gaseous emission. If the C:N ratio is higher, the composting process proceeds, but at a slower pace, since the microorganism’s population size is limited by the lack of nitrogen. Compost Recipe Development ■ A compost recipe defines the relative quantities of feedstocks and other materials needed to achieve a mixture with the optimum C:N ratio, moisture content, and bulk density. ■ Recipe development is an iterative process. Spreadsheets and commercially available software can be used for efficiencies. Since the C:N ratio of feedstocks does not always fall within the ideal range, it is a normal practice to blend several feedstocks together, or add amendments to feedstocks prior to the active composting step. For instance, a feedstock containing a large concentration of nitrogen, like food waste or green grass, would be mixed with one that contains a high concentration of carbon, like woodchips or newsprint, to arrive at a mixture with a C:N ratio in the optimal range. 3.3.4 Moisture Content Maintaining adequate levels of moisture in the compost pile is critical to microorganism survival because they require water to sustain their metabolic and reproductive functions. Water is also the media through which nutrients are transferred to the microorganisms. The optimal moisture content during the active composting step is generally between 55 and 65%, depending upon the type of feedstock composted and the technology used. Generally, indoor and in-vessel composting systems, and systems processing food wastes, tend to operate in the 60 to 65% range. Outdoor systems tend to operate at the lower 55 to 60% range, but that may vary based on local climatic conditions. During the curing step, moisture levels are typically maintained between 45 and 55%, while during storage, moisture levels are typically in the 40 to 45% range. Figure 3-9 illustrates the target moisture content ranges during the steps of the composting process. If moisture levels are too low (i.e., less than 40%), the size and activity level of the microorganism populations is inhibited, resulting in slower active composting and/ or curing. When moisture levels are too high (i.e., more than 65%), there is a risk that too much of the pore space between individual particles fills with water, which can prevent the efficient movement of air and lead to anaerobic conditions and unpleasant odours. Higher 3-12 Figure 3-9: Target moisture content ranges during the composting process 3. Science and Principles of Aerobic Processing (Composting) moisture levels can also lead to excess moisture draining out of the composting pile, which increases the quantity of leachate that must be managed. At outdoor composting facilities, this leachate can also become a significant odour source and may attract flies and other insects. Moisture content is initially adjusted while preparing feedstocks for active composting by blending wet and dry feedstocks and amendments together. If the mixture of feedstocks and amendments is still too dry, potable water, stormwater, or leachate can be added. Photo 3-8: Excess moisture draining from the base of piles can attract insects and contribute to odours © CH2M HILL Water must often be added during the active composting and curing steps to replace moisture lost as a result of evaporation. To be effective, the moisture added must be evenly distributed throughout the materials. Turning during or immediately after watering is recommended. Excess moisture is normally managed by adding dry amendments or increasing the frequency of mechanical agitation. If the composting system uses forced aeration, increasing the volume of air flowing through the materials can help remove excess moisture. Leachate as a Moisture Source ■ Under normal circumstances, the only time leachate is used as a moisture source is when feedstocks are being prepared for active composting. ■ Adding leachate during the active composting and curing steps can reintroduce pathogens or other contaminants into the material. Moisture content is expressed as a percentage-by-weight basis. Accurate moisture content measurements normally require drying samples of a material in a laboratory using specialized drying ovens. However, these drying methods can be approximated in the field using a microwave oven or a device used to measure moisture in wheat and barley grains (e.g., Koster Moisture Tester). The experience of various facility operators has shown that moisture probes commonly used for soils and wood do not provide consistently accurate results in compost. 3.3.5 Temperature The microbial activity that takes place during the composting process generates heat, and the amount of heat varies during the composting process as microorganism types and population sizes increase and decrease. The characteristic curve in Figure 3-10 shows the typical rise and fall of temperatures during the various Figure 3-10: Typical temperatures during the composting process 3-13 3. Science and Principles of Aerobic Processing (Composting) steps of the composting process. Temperature measurements provide operators with a quick indication of the composting process’s progress. Process to Further Reduce Pathogens (CCME, 2005) ■ In-vessel composting: During the active composting step, temperatures should be between 55 and 60°C. During curing, the temperature is normally less than 50°C, and eventually drops below 30°C as the process nears completion. - Maintain material at operating conditions of 55°C or greater for 3 consecutive days ■ Windrow composting: - Material attains a temperature It is necessary to maintain temperatures in the thermophilic range of 55°C or greater for at least 15 consecutive days during the during the active composting step to reduce pathogens and weed composting period seeds that may be present in the feedstocks being composted. The - During this 15-day period, materials need to be turned at relationship between the exposure time and various temperatures least 5 times required to kill pathogens has been well-documented by the scientific community. Standardized time and temperature requirements have been adopted universally in the composting industry, and have been written into several provincial and federal regulations and guidelines. The requirements, known as the Process to Further Reduce Pathogens (PFRP) criteria (USEPA, 1992), outline the specific requirements for static pile and windrow composting, as well as in-vessel and aerated static pile (ASP) composting systems. The distinction between the criteria for the two types of systems is that there is typically a greater temperature difference between a windrow’s Figure 3-11: Windrow temperature gradients The core temperature of an outdoor composting windrow or core and its surface, as shown in Figure 3-11. static pile can be significantly higher than the outer surface temperature. For pathogen reduction, all compost pile Increasing the time requirements and requiring materials must be exposed to the core’s higher temperatures turning/mixing of windrows ensures that all materials are exposed to the higher temperatures in the pile’s core for at least three days. While thermophilic temperatures are required for pathogen risk reduction, too much heat can be detrimental. If the heat generated during active composting is not managed and temperatures become too high for sustained periods (generally greater than about 65°C), the populations of beneficial microorganisms decline, and the composting process slows down. Similarly, temperatures that are too low can allow less efficient microorganisms to become predominant, again, resulting in slower composting. During the active composting phase, temperatures are most commonly controlled by aerating materials through either mechanical methods (mixing or turning) or by forcing air through the compost pile with highpressure fans, as discussed in Section 3.3.1, Oxygen Concentration. Some lower-technology composting methods rely on the airflow resulting from passive aeration to prevent temperatures from becoming too high. Facilities that rely only on passive aeration must pay particular attention to moisture levels and FAS during the composting process. During the curing step, microbial activity is lower, and temperatures can normally be controlled through passive aeration. 3-14 3. 3.3.6 Science and Principles of Aerobic Processing (Composting) pH Level Since microorganisms cannot survive in environments that are too acidic (e.g., where the pH is less than 5.5) or alkaline (e.g., pH is more than 9), the pH of materials being composted is important. Also, when the material’s pH is greater than 9, nitrogen is more readily converted to ammonia and becomes biologically unavailable, increasing the C:N ratio and slowing the composting process. The pH is measured by first creating a slurry using the feedstock or compost sample and deionized water. The pH of the slurry is then measured using litmus paper or specialized pH probes. Generally, a pH range of 6.5 to 8 is acceptable for composting, and most common feedstocks fall within this range. An exception can occur when feedstocks are temporarily stored, and the pH drops as a result of the onset of anaerobic conditions in the storage pile. As the active composting process progresses, it is essentially self-regulating with respect to pH. Thus, measuring pH is normally not required following the initial preparation step. However, there is the potential for the pH in the compost pile to drop during the initial week of the active composting step when oxygen demand is at its highest. This drop can occur when there is insufficient oxygen available to maintain aerobic conditions through the compost pile (e.g., as a result of insufficient aeration or poor FAS). Generally, the pH recovers when sufficient oxygen is provided and aerobic conditions are re-established, as illustrated in Figure 3-12. However, if conditions persist, the pH can drop to between 4.8 and 5.0. Not only can this impede microorganisms, but certain trace elements become more mobile at a low pH. Once these trace elements are released as a result of low pH conditions, they cannot be removed from the compost. As outlined in Chapter 16, increasing the concentration of these trace elements may affect the quality of Figure 3-12: pH characteristic curve The pH in the composting pile can drop during the initial week of active composting if the finished compost product. there is insufficient oxygen; the pH usually rebounds once oxygen is provided 3-15 4. Science and Principles of Anaerobic Processing (Anaerobic digestion) Anaerobic digestion (AD) is a naturally occurring biological process that uses microorganisms to break down organic material in the absence of oxygen. In engineered AD systems, the breakdown takes place within specially designed reactors or chambers. Critical environmental conditions, such as moisture content, temperature, and pH levels, are measured and controlled within the reactor to maximize biogas generation and waste decomposition rates. In an engineered system for municipal solid waste (MSW) sourceseparated organics (SSO) digestion, the digestion process generally occurs during a two- to six-week period. Chapter 6 describes specifics on engineered AD systems and equipment currently being used for MSW organics processing. Perhaps the most important byproduct of the AD process is biogas because it can be used as fuel, so provides a renewable energy source. Biogas consists primarily of methane (CH4) and carbon dioxide (CO2), but can also contain significant concentrations of hydrogen sulphide (H2S) and may also contain trace quantities of siloxanes and various volatile organic compounds (VOCs). Chapter 7 discusses biogas refining and utilization options. The solid or semi-solid material left over after AD is called digestate, while liquid exiting from the digester is called effluent. In some jurisdictions, digestate can be used directly, land-applied as fertilizer. In North America, it is more common to compost digestate or dry it for use as a fertilizer. Three Byproducts of AD 1. Digestate: Solid material 2. Effluent: Liquid (recirculated or waste) 3. Biogas This chapter covers: • • • • • • 4.1 Section 4.1, Overview of the Anaerobic Digestion Process Section 4.2, Typical Mass Balance Section 4.3, Anaerobic Digestion Chemistry and Microbiology Section 4.4, Key Process Management Parameters Section 4.5, Digestate Characteristics, Quantities, and Processing Section 4.6, Biogas Characteristics and Quantities Overview of the Anaerobic Digestion Process The moisture content at which a digester is designed to operate is the most important decision regarding which process technology is best for a given feedstock mix. This decision determines the basic design parameters for the digester vessel, conveyance systems, feedstock preparation systems, and digestate handling systems. It also affects operating costs, with higher moisture contents generally incurring greater costs. Figure 4-2 shows the basic digester types, as determined by moisture content. 4-1 4. Science and Principles of Anaerobic Processing (Anaerobic digestion) Figure 4-1 is a schematic of a typical MSW organics processing AD facility. Figure 4-1: Typical anaerobic digestion facility schematic Notes: BOD—biochemical oxygen demand N—nitrogen P—phosphorus Wet digesters are designed to handle materials dissolved or suspended in water. A wet digester vessel is a stirred tank. In high-solids digesters, the materials are either pumped into a digester tank as a slurry or stacked in place. When stacked in place, water is percolated through the materials to distribute nutrients and microorganisms; they are not submerged in a tank. Wet or high-solids digesters may be designed to operate as: • • • 4-2 High-temperature (thermophilic), at a temperature greater than 45 degrees Celsius (°C) Mid-temperature (mesophilic), at temperatures between 20 and 45°C Low-temperature (psychrophilic), at temperatures less than 20°C 4. Science and Principles of Anaerobic Processing (Anaerobic digestion) Digesters can also be configured as single-stage or two-stage systems. Most digesters are singlestage, with the entire biological digestion process taking place in a single vessel. In two-stage systems, the first and second stages of the process occur in two different vessels, which are optimized for the microorganisms active in each digestion stage. Multi-stage digestion systems (i.e., more than two stages) are used for other waste types, but MSW organics digesters have been restricted to two stages. Table 4-1 summarizes the main characteristics of the different, basic variations in digester design. Table 4-1: Figure 4-2: Types of SSO digesters Main characteristics of different digester designs High-solids (slurry and stackable) AD systems Wet (low-solids) AD systems • Requires less energy • More energy needed to heat and pump water • More energy available for export • More energy needed to dewater digester contents • Stackable systems require bulking agents to provide adequate porosity for percolation • More suited for codigestion with animal manures or biosolids • Stackable systems must operate as batch systems— requires purging and opening the digester • Can remove plastic from incoming waste stream • Slurry systems require special pumps • Loss of VS and potentially lower gas yields • Requires more water • Cannot handle liquid wastes as well as wet digesters Single-stage AD systems Two-stage AD systems • Lower capital cost • Higher capital cost • Easier to operate • More technical complexity • Fewer technical failures • More technical failures • Conditions for two stages are not optimized • Potentially higher gas yields • May lead to somewhat lower biogas yields • More decomposition of biodegradable material under optimal conditions Mesophilic digestion systems Thermophilic digestion systems • Bacterial populations more robust and adaptable to changing conditions • Higher construction costs for heat-resistant materials • Lower energy input to maintain temperature • Higher energy input to heat to thermophilic temperatures • Lower rates of gas production • Higher rates of gas production • Lower throughput rates • Higher throughput rates Notes: VS—volatile solids The balance of this section describes the four main steps of the AD process, namely: feedstock receiving and preprocessing, the AD process, biogas capture and utilization, and digestate handling and processing. Subsequent sections discuss the key process parameters, their management, and effects. Chapter 6 provides further details related to the three categories of AD technologies. 4-3 4. Science and Principles of Anaerobic Processing (Anaerobic digestion) 1. Feedstock Receiving and Preprocessing: The first step of the process involves receiving materials at the processing facility, inspecting them for unacceptable materials or materials that might damage processing equipment, and preparing them for the AD process. Four Main Steps of the Anaerobic Digestion Process 1. Feedstock Receiving and Preprocessing 2. AD 3. Biogas Capture and Utilization Feedstock preprocessing methods are dependent on the feedstock properties, as well as the digestion technology. Depending upon the collection program and processing facility design, the inspecting feedstock step may require mechanically removing the materials from containers or bags. Once the feedstocks have been inspected and contaminants removed, they may need to be physically or chemically altered (through grinding, shredding, or adjusting the pH) in order to provide optimal conditions for the digestion process. Important considerations during the preprocessing step are to ensure that materials are fully mixed and as homogeneous as possible, and that the particle size of feedstocks is optimal for the digestion technology being used. 4. Digestate Handling and Processing Photo 4-1: Biogas storage tank © Organic Waste Systems Inc. Unacceptable Materials for an SSO Digester ■ Tires During preprocessing, materials that will damage equipment or decrease digestate quality have to be removed. Chapter 6 provides further information on feedstock preparation requirements for the various AD technologies used for SSO. ■ Household hazardous waste ■ Metal cans ■ Scrap metal ■ Large rocks or pieces of concrete 2. Anaerobic Digestion: This step involves the chemical and biological decomposition of the feedstocks’ organic fraction in the AD reactor for a period of 14 to 40 days. Wet anaerobic digesters produce a wet digestate (which is then dewatered to produce a relatively solid residue), biogas, and effluent. In high-solids digesters (less than 80% water), the digestate may not require dewatering before further processing, depending on the specific technology and feedstocks used. 3. Biogas Capture and Utilization: As the feedstocks degrade in an anaerobic environment, the biochemical reactions produce biogas. This biogas is a mixture of methane (the same molecule as natural gas for home heating and cooking), carbon dioxide, and various trace gases, including hydrogen sulphide, ammonia, and nitrogen. The quantity of gas produced depends upon the biodegradability of the material in the digester, how many calories are in the material being digested, and how efficiently the digester operates. Biogas can be further processed and refined into fuel for space heating, boilers, industrial engines, vehicles, and pipeline distribution, or in a generator to create electricity for local use or distribution through the electrical grid. Chapter 7 provides details about biogas refining and utilization options. 4-4 4. Science and Principles of Anaerobic Processing (Anaerobic digestion) 4. Digestate Handling and Processing: As previously mentioned, the residual solid/liquid mixture from the AD process is known as digestate. This material can have high moisture content and can be odorous. As a result, special handling may be required. The digestate produced from wet (low-solids) AD technologies has a very low solids content (less than 20%), and is normally dewatered prior to further handling and treatment. This digestate can be dewatered using centrifuges, belt filter presses, or screw presses. A portion of the water from the dewatering process can be reused during feedstock preparation or within the AD system. Any surplus is often directed to a wastewater treatment plant. Digestate from high-solids digesters typically has moisture content and solids content similar to the waste as it is processed in the digester, which can range from 60% water (40% solids) to 80% water (20% solids). Some European AD facilities allow farmers to land-apply digestate without further stabilization. This is much less common in North America, and digestate from Canadian AD facilities is not currently land-applied without prior pretreatment. Composting of digestate can be carried out onsite, or the digestate can be trucked offsite to a separate facility. Some European facilities compost digestate onsite. Generally, these sites are located where the composting operation was the original intent of the site, and the digester was added at a later stage to provide additional capacity so that the composting and digestion are collocated. 4.2 Typical Mass Balance Figures 4-3 through 4-5 show typical, simplified mass balances for generic wet (low-solids), high-solidsslurry, and high-solids-stackable anaerobic digesters processing SSO wastes. Water is added to create the appropriate moisture content. The figures show the typical inputs and outputs. The quantities shown are relative to 1 tonne (t) of SSO waste processed. Figure 4-3: Wet (low-solids) digester typical mass balance 4-5 4. Science and Principles of Anaerobic Processing (Anaerobic digestion) Figure 4-4: High-solids-slurry digester typical mass balance Figure 4-5: High-solids-stackable digester typical mass balance For a high-solids digestion systems (both slurry and stackable), as shown in Figures 4-4 and 4-5, very little water, if any, may be added, and the liquid effluent production may be less than 10% of the input SSO tonnage, depending on the specific technology and feedstocks used. 4.3 Anaerobic Digestion Chemistry and Microbiology Figure 4-6 shows the four specific substages of the AD process, which are described in the following sections. The process occurs in distinct stages because different groups of microorganisms convert the organic waste materials into successive products that ultimately result in biogas production. Typically, only 50% of the organic material is broken down in anaerobic digesters (Palmisano and Barlaz, 1996). 4-6 4. Science and Principles of Anaerobic Processing (Anaerobic digestion) Figure 4-6: Chemistry and microbiology of organic compound anaerobic degradation 1. Hydrolysis or depolymerization, the breakdown of large and complex organic material into small organic molecules, is achieved by a specific set of organisms that release enzymes into the digester, which then breaks down the large molecules. The hydrolysis stage occurs best under acidic conditions (below 5.0 pH) (Ostrem, 2004). Hydrolysis is typically the slowest step, so it limits the entire process if it occurs in a single vessel or tank. 2. Acidogenesis or acid formation occurs when fermentative microorganisms break the hydrolyzed materials down into a range of different organic acids and alcohols. This production of organic acids lowers the pH of liquids in the digester. 3. Acetogenesis is further fermentation of organic acids and alcohols to form short-chain volatile fatty acids (VFAs) and hydrogen (H2). This is accomplished by yet another group of organisms that are also acid tolerant. 4. Methanogenesis is methane generation, the conversion of byproducts into biogas (primarily methane and carbon dioxide). This is accomplished by a unique group of organisms called methanogens, which are strictly anaerobic, meaning they are poisoned and die in the presence of oxygen. Methanogens cannot tolerate low pH and are killed below pH 5.0. The optimal pH range for methanogens is 6.5 to 7.2 (Speece, 2008). Given the different optimum pH ranges for different groups of organisms responsible for digestion, a process design requiring all of the biological breakdown steps to occur in the same vessel must operate at a compromise pH of 6.0 to 7.0 that is not optimal for any of the substages. This type of system is referred to as a single-stage system. For this reason, some digester systems have been devised with two or more 4-7 4. Science and Principles of Anaerobic Processing (Anaerobic digestion) stages where the pH is optimized for the organisms most active at that stage in the process. MSW organics digesters have been restricted to two stages. 4.4 Key Process Management Parameters The digestion process can be limited by certain factors and operational conditions that affect feedstock breakdown and biogas generation. Table 4-2 lists the key process parameters and typical parameter values for AD of SSO. Table 4-2: Typical process parameters for anaerobic digestion of MSW organics Parameter Typical range High-solids Moisture content pH Wet Stackable Slurry Low solids Less than 60% Between 60 to 80% Greater than 80% 6.0 to Alkalinity 7.0a More than 100 mg/L VFAs Less than 4000 mg/L Temperature Retention time Mesophilic digesters: 30 to 38°C Thermophilic digesters: 50 to 60°C 14 to 40 daysb C:N ratio 30:1 Ammonia 200 mg/L Sulphide Less than 50 mg/L Notes: a Typical range for single-stage digester . In two-stage digesters, typical range is 5 .0 to 6 .0 in hydrolysis/acid-forming stages (first digester) and 6.5 to 8.0 in methanogenic stage (second digester). b Depends strongly on technology; see Chapter 6 . C:N – carbon to nitrogen mg/L—milligrams per litre 4.4.1 Moisture Content Moisture content is the most important process parameter because the entire process is designed around a certain range of moisture content in the digester; it must be in the right range for the type of digester, or the system will not work. For wet digesters, water must be added to dry wastes to meet the required moisture content of 80% or greater shown in Table 4-2. High-solids-stackable digesters that do not submerge the wastes in a tank cannot accept wastes that have a moisture content greater than approximately 60%. High-solids-slurry digesters can accept wastes with moisture contents between 60 and 80% by weight, as well as drier wastes if water is added. Moisture content at each step in the process is typically determined by mass balance rather than direct measurement. Feedstock moisture content is typically estimated based on known moisture content for similar feedstocks, rather than measurements of moisture content in incoming feedstocks. 4-8 4. 4.4.2 Science and Principles of Anaerobic Processing (Anaerobic digestion) pH, Alkalinity, and Volatile Fatty Acids The hydrolytic, acidogenic, and methanogenic microorganisms required for AD all have different optimal pH ranges, as shown in Figure 4-6. This makes it difficult to maintain pH in a range that allows all of these organisms to perform their required part in the AD process. Failing to maintain pH within an appropriate range could cause digester failure. A pH shift in a digester can be due to organic acid accumulation when the methanogens cannot break down the acids because of ammonia toxicity effects or other factors that can slow down the methanogens’ metabolism. The resulting low pH then further slows and may kill the methanogens. Usually, there is little alkalinity in the MSW organics alone that is available to neutralize the organic acid buildup during AD. As such, the acidogenic stage progresses faster than the methanogenic stage, which can lead to process upsets. Managing pH requires adequate alkalinity and the buffering capacity of the waste that is being digested. Therefore, a feedstock mixture with appropriate buffering capacity needs to be established by adding alkalinity, such as calcium carbonate or lime (Erdal et al., 2006). The addition of anaerobically digested biosolids to the digester is another means of adding alkalinity to the digester and encouraging the digestion process. The pH level in the digester is a good indicator of anaerobic process stability. However, because pH only changes when the substrate-specific buffer capacity is consumed, there could be a delay between the onset of acid accumulation and pH change (Eder and Schulz, 2006; Erdal et al., 2006). In some cases, monitoring the pH, alkalinity, and even VFA concentrations may be necessary, depending on the reactor design and experience. A healthy reactor normally has VFA concentrations less than 4000 mg/L. Higher concentrations of VFAs can be toxic to the microorganisms in the digester (Seereeram, 2004). Although pH may be measured continuously, pH, alkalinity, and VFAs are normally measured by taking liquid samples from the digesters or percolate lines, rather than through in-process, real-time instruments in the digesters. pH should be measured at least weekly. Alkalinity and VFAs may only need to be measured if the pH is repeatedly out of optimal range. 4.4.3 Temperature There are subgroups of microorganisms responsible for all of the breakdown substages described that operate in the mesophilic and thermophilic ranges (see Table 4-3). The advantage of the mesophilic process is that the bacteria are more robust and more adaptable to changing environmental conditions (Ostrem, 2004). The main advantage associated with a thermophilic reactor is that higher temperatures can yield a superior rate of biogas production in a shorter period of time. Table 4-3: Digester operating temperature ranges Thermophilic breakdown proceeds much faster than mesophilic. A rule of thumb is that biochemical System Operating range Optimal conditions reaction rates approximately double for each Mesophilic 30 to 38°C 35°C 10°C increase in temperature (Rittman and Thermophilic 50 to 60°C 55°C McCarty, 2001). Thus, throughput rates can be increased in thermophilic systems, resulting in higher biogas production rates. The drawbacks of thermophilic operations include greater parasitic energy use to maintain the higher temperature, more expensive equipment design, and more sensitive process control requirements. 4-9 4. Science and Principles of Anaerobic Processing (Anaerobic digestion) Digester temperatures are typically measured in the digesters on a real-time basis, and frequently on a continuous basis. 4.4.4 Solids Retention Time Solids retention time (SRT) is one of the most important parameters impacting digester Figure 4-7: Solids retention time concept performance in terms of VS destruction and gas production. For a continuous process such as wet digestion and most high-solids-slurry digesters, the SRT is the average time a given particle of solids remains in the digester; Figure 4-7 illustrates this concept. The SRT varies from technology to technology, but is generally in the range of 14 to 40 days. However, some wet anaerobic processes have an SRT as low as 3 days, and others are as long as 55 days. If the SRT is too short, the full degradation process will not be achieved, and the full quantity of biogas will not be captured from the feedstocks. It the SRT is too long, biogas recovery efficiency suffers, and the digester vessel will not be efficiently used. High-solids-stackable digesters are batch processes, and the SRT is essentially the batch processing time. Required batch processing times for these digesters vary from 14 to 30 days, depending on the particular design. 4.4.5 C:N Ratio and Ammonia Toxicity Nitrogen (N) is an important nutrient for cell growth, so some uptake by microorganism cells can be expected. However, excess nitrogen can lead to the accumulation of ammonia in the digester. Excess ammonia leads to substrate/product toxicity and hampers the digestion process. The concentration of nitrogen is controlled through the C:N ratio of the feedstock, which should be approximately 30. Total ammonia nitrogen levels are typically in the 200 mg/L range; however, higher levels in the range of 1 700 to 14 000 mg/L can cause a 50% reduction in methane production. Methanogens are the least tolerant and the most likely to stop growing due to ammonia inhibition. Likely symptoms of ammonia toxicity include low biogas production, low methane content, high VFA concentration, or a combination thereof (Bujoczek, 2001). C:N ratio is not measured directly but is usually approximated from the estimated quantities of carbon and nitrogen in the mix of feedstocks used. 4.4.6 Sulphide Concentration The presence of high sulphide (as H2S) levels inhibits the digestion process. It was shown that sulphide concentrations in excess of 50 milligrams of sulphide per litre (mg S-2/L) inhibit methane generation (McCartney and Oleszkiewicz, 1993), most likely due to high loading of sulphur compounds, including proteins. Proteins are the usual source of sulphides in MSW organics. Sulphides are measured by taking and analyzing samples from the digester or percolate. 4-10 4. 4.5 Science and Principles of Anaerobic Processing (Anaerobic digestion) Digestate Characteristics, Quantities, and Processing Digestate is the solid or semi-solid material left over at the end of the digestion process once any liquid effluents or percolates have been drained off. This material can be useful as compost or fertilizer after processing. 4.5.1 Digestate Characteristics and Processing In wet (low-solids) and high-solids-slurry digestion systems, the digestate is the solid material extracted from the bottom of the digestion tanks. In high-solids-stackable digestion systems, the digestate is the solid material removed from the digestion tunnels. Digestate from all types of systems has a moisture content similar to the material in the digester (see Table 4-2). The unit weight of undewatered digestate from highsolids-slurry and -stackable digestion systems is in the 900 to 1000 kilograms per cubic metre (kg/m3) range because of the presence of undigested leaf and yard waste (L&YW) that is typically mixed with the food and other highly digestible wastes in these systems. Digestates from wet (low-solids) digesters that are not dewatered have unit weights of 1200 kg/m3 and greater because the solids in wet digesters typically have a higher density (Metcalf and Eddy, 2002). Digestates from high-solids digestion systems are often composted immediately after removal from the digester, without dewatering. Digestate from wet (low-solids) digestion systems are usually dewatered to approximately 50% moisture content (Recycling Council of Alberta, 2006) and further treated and used in a variety of ways, including agricultural land spreading as fertilizer (where allowed), composting, or drying to 10 to 15% moisture (85 to 90% solids) and pelletizing for use as fertilizer (AgroEnergien, 2012). 4.5.2 Digestate Quantities The digestate quantities produced are the result of removing organic materials and water from the incoming waste. Thus, the digestate quantities from a given process can be estimated by subtraction if the organics destruction and water removal quantities are known. For this purpose, the organic solids quantities in the waste materials are approximated by the volatile solids (VS) content. Typical VS contents in urban food waste are 70%, and may be as much as 97% by weight of the total solids in the wastes (Zhang et al., 2007). Destruction of VSs (resulting in biogas production) in the digestion process varies from 67% (Rittman and McCarty, 2001) to 77% (Zhang et al., 2007). Figure 4-8: Solids weight reduction and total weight reduction in wet (low-solids) digester The total solids in the waste are reduced by approximately 50 to 75% by weight in the digestion process, but because the solids are only a part of the total (most of the waste is water), the total reduction in weight in a wet digester is only 5 to 20%, as illustrated in Figure 4-8. Volume reduction (vs. weight reduction) is higher because of compaction, especially in high-solids digestion systems. Volume reduction in high-solidsstackable digestion systems has been reported to be typically in the 30 to 35% range (Bogg, 2012). A typical quantity of digestate for all digester types is 0.85 t of dewatered digestate for each t of wet SSO added to the digester, as shown in Figures 4-3 through 4-5. 4-11 4. Science and Principles of Anaerobic Processing (Anaerobic digestion) Table 4-4 summarizes typical quantities and characteristics of MSW organics raw digestate. Table 4-4: Raw digestate typical characteristics and quantities (prior to dewatering) Parameter High-solids digestion (slurry and stackable) kg/m3 Wet (low-solids) digestion 1200 kg/m3 Density 900 to 1000 Moisture content 60% 80% Solids content 40% 20% Mass reduction from raw waste 15% 5% Volume reduction from raw waste 30 to 35% 10% 4.6 Biogas Characteristics and Quantities 4.6.1 Biogas Characteristics Typical Biogas Parameters ■ CH4: 60% by volume The biogas generated by the AD process is primarily composed of methane and carbon dioxide. The methane concentration of the biogas is highly dependent upon on the feedstock composition, biological consortia, and operating conditions of the digesters. Biogas generated from MSW organics typically contains 60% methane. ■ CO2: 40% by volume ■ H2S: 200 to 4000 ppm ■ Trace contaminants (highly variable): siloxanes, chlorinated organics, and VOCs Hydrogen sulphide, nitrogen, ammonia, and hydrogen are also present in biogas, but in smaller concentrations. Although hydrogen sulphide is not a major component of biogas, it can be present at levels that pose a health and safety risk to site personnel, and can cause problems for equipment that uses biogas as fuel if it is not reduced to lower levels. Concentrations of H2S in biogas from MSW feedstocks typically vary from 200 to 4000 parts per million (ppm) by volume (Verma, 2002). Hydrogen sulphide is immediately dangerous to life and health at 100 ppm by volume (OSHA, 2005). Other trace contaminants, which may be present in biogas and can affect its use for energy production, include siloxanes, chlorinated organics (which can be corrosive), and other VOCs. When burned as part of the biogas, siloxanes produce a hard silica residue that can damage engine parts. Siloxanes are commonly found in landfill gas and biogas produced by digestion of wastewater biosolids. However, there is little published data about siloxanes in biogas produced from digestion of MSW organics, especially from SSOs. VOCs in biogas vary widely and are produced from contaminants materials, such as solvents and cleaners discarded with the organic wastes, rather than being created in the digestion process. Halogenated VOCs can be a problem for equipment combusting biogas because they can produce acid gases when burned, which cause corrosion. In general, concentrations of these compounds should not be expected to be problematic unless there is reason to believe that contaminant rates will be high. However, it may be prudent to sample gases generated during biochemical methane potential tests, which produce a gas similar to those produced in a full-scale digester for these compounds. Alternatively, biogas samples from the operational facility can be taken to confirm the VOC concentrations. 4-12 4. 4.6.2 Science and Principles of Anaerobic Processing (Anaerobic digestion) Biogas Quantities The quantity of biogas that each tonne of feedstock can produce is referred to as the biogas yield, which depends primarily on the waste type of the solid waste (Steffen et al., 1998). Table 4-5 shows some VS and corresponding methane gas yields reported for various individual components of solid waste feedstocks based on actual cases. Table 4-5: Summary of biogas and methane yields Waste type Biogas yield (m3/t waste) Methane (%) Methane yield (m3/t waste) Leaves 23 60 14 Grass 34 60 20 Mixed paper 112 60 67 Brush 67 60 40 Food waste 144 60 86 FOG 390 60 234 Notes: FOG—fats, oil, and grease m3/t—cubic metre per tonne The degradation rates of waste organic matter can vary significantly with the substrate composition. As shown in Table 4-6, food wastes typically have higher biogas production than high-cellulose materials such as grass, leaves, paper, and brush. Fats, oil, and grease are reported to provide the highest biogas yields, but at the same time, due to their poor bioavailability, require the highest retention times. Table 4-6: Biogas typical production rate ranges 1 t SSO = 100 to 150 m3 biogas = 60 to 90 m3 methane Energy = 2200 to 3300 MJ Assumption: With engine at 35% efficiency = 200 to 300 kWh electricity Notes: 1 kWh = 3 .6 MJ kWh—kilowatt hours MJ—megajoules The actual quantity of biogas that can be harvested can be estimated through laboratory testing. Representative samples of the feedstock are assessed using a biochemical methane potential test. The tests, which are conducted in laboratory-scale digesters, estimate the ultimate methane production that can occur under optimal digester conditions (Chynoweth et al., 1993; Owens and Chynoweth, 1993). For Project Planning Purposes A conservative rule of thumb is a biogas yield of 100 m3 per tonne of SSO. In practice, the actual quantity of biogas produced can vary considerably from the theoretical yield. The actual yield depends, in part, on whether the feedstock mixture exhibits properties that may inhibit the biochemical digestion process, such as high nitrogen content that can lead to ammonia toxicity. Actual yield is also affected by digester design and efficiency, and retention time. For example, poor nutrient and water 4-13 4. Science and Principles of Anaerobic Processing (Anaerobic digestion) circulation, or less than optimal temperatures within the digester vessel, can result in reduced conversion efficiency. Similarly, shortening the residence time in the digester vessel means that not all of the biogas potential can be captured. Table 4-7 summarizes recent reports of actual biogas production from organics in the MSW stream. These may be considered rough benchmarks for proposed projects in the absence of more specific data on feedstocks for a given project. Table 4-7: Biogas production benchmarks Waste mix Biogas production Organic fraction of MSW 100 to 150 m3/t of SSO Food waste with grass cuttings 165 m3/t of SSO Residential food waste 144 m3/t of SSO (CIWMB, 2008; Smith Bellerby Limited, 2007; Zhang et al., 2007) 4.6.3 Energy Potential of Biogas The energy content of biogas is completely determined by the biogas’s methane content: the higher the concentration of methane, the higher the biogas’s energy potential. Methane has a total energy potential of approximately 37 megajoules per cubic metre (MJ/m3). Biogas, at 60 to 70% methane, has a total energy potential of 22 to 26 MJ/m3. As previously mentioned, biogas’s methane concentration is a factor of the feedstocks from which the biogas is produced and the efficiency of the conversion process. Selecting materials with a high yield and/ or optimizing process performance increases methane content and improves energy potential. Methane concentration can also be increased by removing other biogas components (e.g., carbon dioxide). Chapter 7 describes technologies for biogas cleanup and methods for extracting and using the energy from biogas. 4-14 Biogas Generation is Directly Correlated with: ■ Feedstock composition and biodegradability ■ Feedstock pretreatment and preparation for the digestion step ■ System design (e.g., retention time, temperature, mixing, and pH) ■ Maintenance and resultant uptime of the mechanical components 5. Aerobic Processing Technologies Centralized composting has been practiced in North America and many other countries around the world for several decades. As a result, a number of technologies and techniques have been developed and refined, ranging from simple and inexpensive, to complex, highly mechanized, and automated solutions. This chapter focuses on the active composting step, as described in Chapter 3. Given the wide range of active composting methods and their differences, classifying them into general groups is often helpful in understanding and comparing their advantages and disadvantages. Table 5-1 presents the classification system used in this Technical Document, which is based, in Table 5-1: Types of composting systems part, on the method(s) used to Passively aerated and turned Actively aerated aerate material. In this approach, • ASP (uncovered and covered) • Static pile technologies fall into two broad • Enclosed ASP (tunnels) • Bunker groups: (1) passively aerated and • Containerized ASP (static and • Windrow turned composting systems, and agitated) • Turned mass bed (2) actively aerated composting • Channel • PAW systems. Further classification of • Agitated bed technologies and techniques can • Rotating drum be based on the specific method Notes: used to provide aeration and the ASP—aerated static pile size/shape of the composting pile PAW—passively aerated windrow or vessel. The following sections provide a brief overview of the general active composting methods and technologies outlined in Table 5-1. These are suitable for facilities with capacities ranging from a few hundred tonnes to tens of thousands of tonnes per year (tpy). As previously outlined, once organic materials have been actively composted using one of these technologies, further curing is required before achieving the finished product quality criteria discussed in Chapter 16. Tables 5-2 and 5-3 provide a high-level summary of each system’s main characteristics. This chapter includes the following: • • • Section 5.1, General Feedstock Preparation Steps Section 5.2, Passively Aerated and Turned Composting Systems Section 5.3, Actively Aerated Composting Systems 5-1 5. Aerobic Processing Technologies Table 5-2: Summary of main characteristics of passively aerated and turned composting systems Static piles Bunkers Windrows Turned mass bed PAWs Indoor or outdoor Outdoor Outdoor Outdoor Indoor or outdoor Outdoor Typical capacity (tpy SSO) Less than 10 000 Less than 500 Less than 50 000 15 000 to 50 000 Less than 10 000 L&YW Food waste Typical pretreatment requirements Shredding/mixing Shredding/mixing Shredding Shredding Shredding/mixing Typical active composting time 2 to 3 years 2 to 6 weeks 3 to 12 months 3 to 12 months 1 to 2 years Aeration method Passive Passive Passive and mechanical agitation Passive and mechanical agitation Passive Postprocessing requirements Curing Curing Curing Curing Curing Relative space requirements High Medium to high Medium to high Medium to high High Level of odour control Low Low Low to medium Low to medium Low Water requirements Low Low Low to medium Low to medium Low Electricity consumption N/A N/A N/A N/A N/A Fuel consumption Low to medium Low to medium High High Low to medium Contaminated surface water quantity High Medium to high High Low to medium Low Leachate/condensate quantity Low Low Low Low Low Relative construction costs Low Low Low to medium Low to medium Low Relative O&M costs Low Low Low to medium Low to medium Low Notes: L&YW—leaf and yard waste N/A—Not applicable O&M—operations and maintenance SSO—source-separated organics 5-2 5. Aerobic Processing Technologies Table 5-3: Summary of main characteristics of actively aerated composting systems ASP (positive aeration) ASP (negative aeration) ASP (covered) Enclosed ASP (tunnel) Static container Agitated container Indoor or outdoor Indoor or outdoor Indoor or outdoor Indoor or outdoor Indoor Outdoor Typical capacity (tpy SSO) 1 000 to greater than 100 000 1 000 to greater than 100 000 1 000 to greater than 100 000 10 000 to greater than 100 000 300 to 30 000 Rotating drum Channel Agitated bed Indoor or outdoor Indoor Indoor Indoor or outdoor 100 to 15 000 15 000 to 100 000 15 000 to greater than 100 000 1 000 to greater than 100 000 L&YW Food waste Typical pretreatment requirements Shredding/ mixing Shredding/ mixing Shredding/ mixing Shredding/ mixing Shredding/ mixing Shredding/ mixing Shredding Shredding Shredding Typical active composting time 2 to 6 weeks 2 to 6 weeks 3 to 8 weeks 2 to 4 weeks 2 to 4 weeks 2 to 4 weeks 2 to 4 weeks 3 to 4 weeks 1 to 7 days Aeration method Aeration fans Aeration fans Aeration fans Aeration fans Aeration fans Aeration fans and mechanical agitation Aeration fans and mechanical agitation Aeration fans and mechanical agitation Aeration fans and mechanical agitation Postprocessing requirements Curing Curing Curing Curing Curing Curing Curing Curing Further composting and curing Relative space requirements Low to medium Low to medium Low to medium Low Low to medium Low to medium Low to medium Low Medium to high Level of odour control Medium Medium to high Medium to high High High High High High Medium to high Water requirements Low to medium Low to medium Low Low Low Low Low Low to medium Low Electricity consumption Medium Medium Low to medium Medium Medium Medium to high Medium to high Medium to high High Fuel consumption Medium Medium Medium Medium Low Low Low Low Low Contaminated surface Medium water quantity Medium Low to medium Low Low Low Low Low Low Leachate/condensate quantity Low Medium to high Low to medium Medium Medium Low Low Medium to high Low Relative construction costs Medium Medium Medium High High High Medium to high High High Relative O&M costs Low to medium Low to medium Low Medium to high Medium to high Medium to high Medium High Medium to high 5-3 5. Aerobic Processing Technologies 5.1 General Feedstock Preparation Steps As outlined in Chapter 3, the preparation step involves changing the physical and/or chemical characteristics of feedstocks, with the goal of optimizing conditions for microorganisms during active composting. Depending upon feedstock characteristics, size of the facility, and the composting technology employed, preparation steps may include particle size reduction, mixing and blending with other feedstocks and/or amendments, ferrous metal removal, and water or leachate addition. 5.1.1 Particle Size Reduction The size of individual feedstock and amendment particles affects the rate of decomposition. Smaller particles have a greater surface area relative to their volume, and more surface area means more of the material is exposed to microbial degradation, allowing the decomposition process to proceed more quickly. Chapter 11 provides details about the types of grinding and shredding equipment commonly used at composting facilities. 5.1.2 Mixing and Blending The purpose of mixing equipment is to blend feedstocks, amendments and bulking agents, water, and other materials together into as homogeneous a mixture as possible. Providing a homogeneous mixture is an important step for providing optimal composting conditions and reducing the need for troubleshooting process-related problems. 5.1.3 Ferrous Metal Removal Nails, bottle caps, and wire are examples of ferrous metal contaminants that can find their way into composting feedstocks. These materials may clog or damage processing and application equipment, or their sharp edges can result in injury to people using the finished compost. Magnet systems installed on the conveyor belts of screening, mixing, or grinding equipment are often used to remove ferrous metals during the preparation step. 5.1.4 Photo 5-2: Vertical mixer used at a composting facility © Scott Gamble Water or Leachate Addition If the moisture content of the materials being composted is less than 55%, the decomposition process is impaired. The moisture content of some feedstocks in the municipal solid waste (MSW) stream, such as leaves and dry grass, is normally too low (i.e., less than 55%) to sustain efficient active composting, so supplemental moisture must be 5-4 Photo 5-1: Shear shredders are commonly used to reduce particle size and further mix SSO feedstocks prior to composting © CH2M HILL Photo 5-3: Water is best added to windrows when they are being turned © CH2M HILL 5. Aerobic Processing Technologies added. Moisture can also be lost to heat generated during the active composting process, so it is also necessary to increase moisture during the preparation step to offset these losses, even with wetter feedstocks, such as food wastes. The ability to add moisture during active composting has been engineered into many composting systems. Moisture can also be added during the preparation step. Stationary systems can be set up to allow water or leachate to be sprayed on materials coming out of grinding and shredding equipment discharge conveyors. Water or leachate can also be pumped directly into operating mixing equipment. Photo 5-4: Water can be added to windrows and stockpiles using sprinklers © CH2M HILL Irrigate pile surfaces with caution, as watering may seal the available free air space (FAS) in the pile’s wet layer, and water can quickly migrate to the bottom layer along small channels. When water migrates, the base of the pile can be over-wetted and can generate leachate, but can also leave dry sections throughout the pile. It is good practice to turn windrows as soon as possible after significant rain events or pile surface watering. 5.1.5 Feedstock Preparation Considerations Rather than a single preparation system that handles all of the materials delivered, consideration should be given to using two smaller systems in parallel. Although this approach is more costly, it provides internal redundancy within the facility in the event of scheduled maintenance or an equipment breakdown. Splitting processing systems into smaller, parallel lines also allows for operation of a single processing line when feedstock deliveries are lower than peak values, or for one line to be run on an evening or weekend shift to reprocess materials, if needed. 5.2 Passively Aerated and Turned Composting Systems The five types of passively aerated and turned composting systems discussed in this section are: 1. 2. 3. 4. 5. Static pile Bunker Windrow Turned mass bed PAW As outlined in Chapter 3, maintaining adequate oxygen concentrations during the composting process is vital so that the aerobic microorganisms can break down the organic feedstocks. The oxygen exists and permeates through the air voids between individual particles within the composting pile. In these five composting systems, oxygen is supplied to the compost pile through passive aeration. In some cases, mechanical agitation is used to re-establish FAS within the composting piles and speed up the degradation process. 5-5 5. Aerobic Processing Technologies 5.2.1 Static Pile Composting Historically, static pile composting has been used to process leaves, brush, and wood residuals. This method is not well-suited for processing feedstocks with low carbon to nitrogen (C:N) ratios, such as SSO with a high food waste or green grass component. Static pile composting is also not well-suited for use in urban areas, since odours can be constantly emitted from piles, and agitation of older material releases odours as the aerobic process is restarted. Photo 5-5: Typical static pile method used to process L&YW © Scott Gamble This method of composting is the simplest and least expensive option available. It is generally only appropriate for feedstocks with high C:N ratios (e.g., greater than 40:1), such as leaves and branches, and when there is an abundance of space and time available. The static pile method involves forming the organic feedstocks into large, outdoor windrows or piles, which are allowed to decompose for two to three years with little or no mixing or turning. Static piles are normally built using front-end loaders, skid-steers, farm tractors, or excavators. Once built, windrows or piles are passively aerated by convection and diffusion, so it is critically important that materials initially be mixed with amendment to provide sufficient FAS, allowing air flow within the pile. Although larger static piles are used at some facilities, they should ideally be limited to a height of 5 metres (m), as shown in Figure 5-1. There is a higher potential that anaerobic conditions and spontaneous combustion can occur in larger piles. The weight of materials in higher piles can also compress materials in the pile’s base, which leads to further problems related to air flow and odours. Occasional remixing and reformation of the static pile is helpful in re-establishing porosity lost over time as the materials degrade. Without periodic mixing, areas within the pile will not attain the required temperatures for composting; thus, a proportion of the material will not be adequately composted, and the outer layer may not undergo composting at all. Figure 5-1: Typical footprint of a small scale (i.e., less than 1000-tpy) static pile composting facility Static Pile Composting Method ■ Appropriate for L&YW with high C:N ratios ■ Not appropriate for food waste and L&YW with large amounts of green grass ■ Active composting time is 2 to 3 years ■ Suitable for up to 10 000 tpy ■ Method relies on passive aeration, so FAS is critical During pile remixing and rebuilding, the pile’s dry areas should be remoistened to help speed up the composting process and reduce the likelihood of spontaneous combustion. 5-6 5. Aerobic Processing Technologies When piles are too large or there is insufficient passive aeration, anaerobic conditions can develop within static piles, and odours can be generated that may affect the surrounding community. Odours are often released when piles are mixed or moved. The higher potential for odours increases the need for buffer zones between the static pile compost site and adjacent properties; which, in turn, increases land requirements. Static pile composting takes much longer to complete than other methods due to the lack of agitation and the resulting lower aeration rate. It is generally used at smaller facilities that process less than 1000 tpy. It is feasible to process larger quantities (e.g., up to 10 000 tpy), but the land requirements for such an operation are often a limiting factor because the longer composting time means that more space is required relative to other methods that compost materials more quickly. Leachate from static pile facilities is a mixture of higher-strength leachate from the piles themselves, and runoff from the working pad. Due to the larger working area footprint, the overall quantities of leachate from a static pile composting facility are higher than from a similarly sized facility using a different composting method. However, static piles have a lower surface area to volume ratio, which means that less rain and snow melt will infiltrate into the pile. Since static piles are built and moved using mobile equipment, there are no electrical or other utility requirements. Table 5-4 lists static pile advantages and disadvantages. Table 5-4: Static pile advantages and disadvantages Advantages Disadvantages • Low capital and operating costs • Large area required • Piles do not require frequent turning (fewer equipment and staffing requirements) • Not suitable for food waste • Works best when feedstock contains large amounts of woodchips • No electric power needed • No means of controlling odours, which may require larger buffer areas around the site • Decreased ability to manage pile moisture • Spontaneous combustion and anaerobic conditions are more likely • Slow decomposition rate requires long composting time 5.2.2 Bunker Static piles built in small bunkers is a simple composting method well-suited to smaller feedstock quantities (i.e., less than 500 tpy). The bunkers can be constructed from cast-in-place concrete, concrete lock-blocks, modular concrete barriers (e.g., Jersey barriers), and even wood. Depending upon the installation location and climate, bunkers can be located outdoors, covered by a simple roof structure, or contained within a building. Photo 5-6: Small bunker composting system © Scott Gamble 5-7 5. Aerobic Processing Technologies A typical installation consists of three separate bunkers. The first bunker is used for receiving fresh materials on a daily basis. When this bunker is filled (typically after one to two weeks), the third bunker is emptied and refilled with material from the second bunker. The material from the first bunker is then moved into the second bunker to make room for fresh materials. Active composting occurs in the second and third bunkers. The process of moving materials from bunker to bunker helps with mixing and re-establishing porosity lost as the materials degrade. Bunker Composting Method ■ Appropriate for L&YW with high C:N ratios ■ Not appropriate for food waste and L&YW with large amounts of green grass ■ Active composting time is 3 to 6 weeks ■ Suitable for up to 500 tpy Depending upon the size of the composting operation, materials can be moved from bunker to bunker using a skid-steer or small front-end loader. Due to their simplicity, bunker systems can be custom designed to match a specific application and rate of feedstock generation. Individual bunkers can range in size from 2 to 3 cubic metres (m3), to as large as 20 m3. Larger bunkers can also be equipped with aeration systems, as outlined later in this chapter, to provide better process and odour control. Table 5-5 lists bunker advantages and disadvantages. Table 5-5: Bunker advantages and disadvantages Advantages Disadvantages • Low capital and operating costs • Not suitable for food waste • Well-suited to small feedstock quantities • Need equipment to move materials • Can be constructed from a variety of materials • If outdoors, no means of controlling odours, which may require larger buffer areas around the site • Simple method that can be custom sized for a particular operation • No electric power needed 5.2.3 • Not suitable for large quantities of material unless active aeration is provided Windrow Windrow composting is the most common composting method used in North America due to its suitability for a wide range of feedstocks and facility capacities, and because infrastructure requirements are low. Windrow composting also has relatively low operating costs when compared to other composting methods. This method involves the feedstocks being formed into long, low piles known as windrows. The windrows are regularly moved or turned to re-establish porosity, break up, and blend material. The turning process also reintroduces oxygen into the windrow. However, since the oxygen can be rapidly consumed, aeration of windrows is still largely passive, and maintaining good FAS within the materials is important. Windrow Composting Method ■ Suitable for L&YW and food waste ■ Active composting time between 3 and 12 months ■ Suitable for up to 50 000 tpy ■ Aeration achieved by mixing or turning with front-end loader or specialized equipment The time required for active composting using this approach can be as low as 3 to 4 months if it is done in the summer and the site is aggressively managed, but 6 to 12 months is more common in colder climates. 5-8 5. Aerobic Processing Technologies Turning regularly (e.g., one to three times per week during the active composting period), maintaining appropriate pile sizes (i.e., less than 3-m high), and ensuring sufficient FAS are important variables that must be controlled to accelerate processing times and reduce the potential for odour generation. Because composting times are reduced, the same quantity of material can be processed on a smaller footprint by using the windrow method rather than static piles. The area required for windrow composting is determined by windrow size and spacing, and these requirements are determined by the type of equipment used to turn the windrows. Windrows are typically 1.5- to 3.5-m high and 3- to 6-m wide. Spacing between windrows Windrow Turning Equipment ranges from 1 to 5 m. Windrows are usually situated on a firm working ■ Front-end loaders surface, or pad, which is constructed to support the weight of delivery ■ Manure spreaders vehicles and turning equipment without rutting. The pad is normally ■ Towed windrow turners sloped (0.5 to 2%) to direct drain runoff towards a collection ditch ■ Self-propelled windrow turners or detention pond. Composting pad surfaces are usually concrete, asphalt, cement-treated base, or compacted gravel. Sites that use large, self-propelled, straddle-type windrow turners can manage more material than sites that use front-end loaders or manure spreaders. Similarly, windrows created and turned with front-end loaders are larger than those turned with towed windrow turners. Windrow composting is almost always done outdoors where the pile is exposed to precipitation and can lead to runoff management problems. Any runoff created must be collected and treated, or added to a batch of incoming feedstock, increasing moisture content. To avoid problems with runoff, piles can be placed under a roof or in a building, although this adds to facility capital costs. Every time a windrow is turned, heat, water vapour, and gases trapped in the pore spaces are released into the atmosphere. If the facility is outdoors, there is little that can be done to capture the water vapour and gases; as a result, this composting method has the potential to affect adjacent neighbouring properties, so always turn windrows when odours will have the least impact on neighbours (e.g., mornings or when the wind is blowing away from neighbours). Photo 5-7: Straddle-style windrow turner © CH2M HILL Photo 5-8: Typical windrow operation with a towed windrow turner © CH2M HILL Leachate from windrow composting facilities is similar to that from static pile facilities: a mixture of higherstrength leachate from windrows and less contaminated runoff from the working pad. The quantity of leachate from a windrow composting facility is less than from a static pile facility of the same capacity due to the smaller footprint. Windrow composting is commonly used to process L&YW, brush, and wood residuals. Food waste and biosolids can also be processed in this manner, but due to odour control, it is not generally recommended. Windrow composting is appropriate for facilities that process as little as 500 and as much as 50 000 tpy. 5-9 5. Aerobic Processing Technologies Like static pile composting, there are no electrical or utility requirements for windrow composting, resulting in relatively low capital costs. Infrastructure generally includes an outdoor working pad, access roads, and accompanying drainage ditches and a detention pond. Table 5-6 lists windrow advantages and disadvantages. Table 5-6: Windrow advantages and disadvantages Advantages Disadvantages • Can handle feedstocks with lower C:N ratios or porosity than static piles • Large area required • Relatively low capital costs and technology requirements • Relatively low operating costs • No electric power needed • Extensive practical experience exists in the industry • More labour-intensive than static piles, particularly for feedstocks with low C:N ratio or porosity • No odour control, which may require larger buffer area between site and neighbours • More challenges to overcome if food wastes are included • Exposure to rain, wind, and cold can be problematic 5.2.4 Turned Mass Bed Turned mass bed composting is a variation of the traditional windrow method. It is a continuous-flow system that relies on a specialized windrow turner and the use of windrows that are 15- to 40-m wide. To create a mass bed, the typical windrow turner is modified by adding a horizontal cross-conveyor behind the incline conveyor. As the modified unit travels down the length of the windrow, the material is still lifted up and thrown backwards by the incline conveyor. However, rather than falling back on the ground directly behind the turner, the horizontal conveyor catches the material and throws it to the side of the turner opposite the inclined conveyor. Due to the investment in the specialized turner, mass bed composting is generally appropriate for facilities processing between 15 000 and 50 000 tpy. Mass bed composting can be done indoors or outdoors. It can also be further improved by combining it with an in-floor forced-aeration system, as described later in this chapter. The time required for active composting using an unaerated mass bed system is similar to that for windrow composting. Photo 5-9: A self-propelled windrow turner used for turned mass bed composting © CH2M HILL Turned Mass Bed Composting Method ■ Appropriate for L&YW mixed with small quantities of food waste ■ Active composting time generally between 3 and 12 months ■ Appropriate for 15 000 to 50 000 tpy ■ Can be combined with active aeration to decrease active composting time and provide greater process control The primary benefit of the mass bed approach is that it allows for a much larger quantity of material to be processed in a smaller footprint compared to windrow composting. Thus, even though the cost of the turning equipment is higher than large, straddle-type turners, the smaller working pad and reduced construction costs can make this approach very cost-effective. The smaller operating footprint also means there is a smaller quantity of leachate and runoff generated compared to a windrow facility with the same capacity. 5-10 5. Aerobic Processing Technologies The downside to using mass beds is that there is less surface area and a lower level of passive aeration, driving the need for more frequent turning (e.g., every two to four days) and a higher level of monitoring. Because of the reduced amount of passive aeration, this approach is also less suitable for materials with a high oxygen demand, such as food waste and biosolids. Table 5-7 lists turned mass bed advantages and disadvantages. Table 5-7: Turned mass bed advantages and disadvantages Photo 5-10: A mass bed system in the process of being turned; note turner location at bottom left of the pile and aisle created behind the turner © Lenz Enterprise Inc. Advantages Disadvantages • Smaller pile surface area relative to volume improves heat retention • Specialized windrow turner has higher capital cost than towed and smaller, straddle-type turners • Efficient use of available space • Capital cost is increased if forced-aeration system is used • Efficient material handling • Forced aeration can be used to increase oxygen concentrations within the pile and reduce active composting times 5.2.5 • Combination of over-aeration and turning can lead to excessive moisture loss from the piles Passively Aerated Windrow This composting method is a cross between the static pile and ASP methods discussed in the following section. The mixture of materials to be composted is placed in long, low windrows, which are constructed over a network of 100-millimetre (mm)-diameter perforated pipes, as shown in Figure 5-2. The pipes are placed every 30 to 45 centimetres (cm) along the length of the windrow, and are covered with a 15- to 25-cm layer of compost or peat moss. The pipes extend laterally to the outside of the windrow and are open-ended so that air can enter and naturally diffuse through the windrow without the use of aeration fans. A layer of compost or peat moss is placed overtop the windrow’s surface to help discourage insects, to assist with moisture retention, and to manage odours. The increased level of passive aeration relative to the traditional static pile method should theoretically allow for quicker composting times, which are generally estimated to be between one and two years. Figure 5-2: Typical passively aerated windrow system PAW Composting Method As with static piles and ASP systems, particular attention must be given to the moisture and porosity of the material when constructing the windrow so that adequate aeration can be maintained. Table 5-8 lists PAW advantages and disadvantages. ■ Appropriate for L&YW with high C:N ratios ■ Not appropriate for food waste and L&YW with large quantities of green grass ■ Active composting time is 1 to 2 years ■ Suitable for up to 10 000 tpy 5-11 5. Aerobic Processing Technologies Table 5-8: Passively aerated windrow advantages and disadvantages Advantages Disadvantages • Low capital and operating costs • Not suitable for food waste • Well-suited to small feedstock quantities • No means of controlling odours • No electric power needed • Not suitable for large quantities of material • Constructing piles overtop of pipes is time-consuming 5.3 Actively Aerated Composting Systems The seven types of composting system subcategories presented in this section are: 1. 2. 3. 4. 5. 6. 7. ASP (positive aeration, negative aeration, and covered) Enclosed ASP (tunnel) Static container Agitated container Channel Agitated bed Rotating drum Active aeration is a common feature in all of these technologies. There are many subtle variations in the design of composting aeration systems, and many system designers and vendors use these variations to provide a balance between processing efficiency and capital costs. Photo 5-11: Outdoor composting piles with a pipe-on-grade system © CH2M HILL Figure 5-3: Aeration pipes must be installed away from the edges of the compost pile to prevent short-circuiting of air In an actively aerated composting system, the air is distributed through the composting pile by a network of air pipes underneath the composting pile. The simplest method is a pipe-on-grade system using a set of perforated pipes that are laid out on the ground, with the compost pile built on top of the pipe system. The perforated pipe is often covered by a porous layer of woodchips or straw before the compost pile is built to improve air distribution. The perforated pipes and the porous base layer should typically be at least 2 m from the edges of the pile to prevent air from short-circuiting out the ends and sides of the pile, and to force air to pass through the material being composted, as shown in Figure 5-3. The aeration pipes can be installed in or underneath the floor of the composting vessel or pad. There are several variations of in-floor systems, including covered trenches, pipe and spigot arrangements, and elevated plenums. These systems are more costly to construct but allow for quicker pile construction and tear-down, since there are no exposed pipes. They also eliminate the risk of damaging aeration piping and the need to replace pipes. Often, below-grade systems provide more efficient air delivery, which translates to reduced electrical consumption by aeration fans. 5-12 5. Aerobic Processing Technologies Aeration systems generally fall into three categories: positive, negative, and bidirectional. In a positive aeration system, airflow is introduced at the base of the composting pile, and air flows up and out of the pile’s surface, as shown in Figure 5-4. The sides and top of positively aerated compost piles are sometimes covered with a layer of coarse compost or screening overs to help manage odours and retain heat and moisture in the pile. A negative aeration system is designed to pull air down through the composting pile and into the aeration pipes. This allows the odorous compounds in the air to be captured and directed to some form of odour treatment system. Photo 5-12: In-floor aeration with pipe and spigot system; inset photo shows system prior to concrete floor being poured © CH2M HILL Figure 5-4: Aeration systems are designed to operate in positive or negative mode and can be designed to switch back and forth between these two modes A bidirectional aeration system requires a higher degree of engineering and hardware, but it allows switching between positive and negative aeration through the use of additional air ducting and manually or automated dampers, providing better control of temperatures in the compost pile. With these aeration systems, air can be forced through the composting pile on a continuous or intermittent basis. Continuous operation allows for lower air flow rates, but excessive cooling may result if the system is not carefully designed and managed. Over-cooled piles will not reach the temperatures needed for pathogen destruction and can increase the time required to stabilize materials. Intermittent fan operation is more common. Aeration fans are typically controlled by a timer or by a system that measures temperatures in the piles and turns the fans on and off, much like a home thermostat. 5-13 5. Aerobic Processing Technologies Fans are usually of the centrifugal-axial-blade type. The size of the fan depends on a number of factors, including: the type and porosity of material in the pile, the size of the pile, and air flow characteristics of the air distribution system. It is recommended that an experienced designer size and select the fan. 5.3.1 Aerated Static Pile This method of composting was developed in the early 1970s and has since been used successfully for L&YW, food waste, animal mortalities, animal manures, biosolids, and industrial composting. ASP composting offers less exposed pile surface, requires less agitation, and generally allows for a higher level of odour control than static pile and windrow composting, particularly if negative aeration is used. ASP systems are very versatile in that they can be used at small facilities processing less than 1 000 tpy and at large facilities processing in excess of 100 000 tpy. Feedstocks are mixed and piled to depths of between 1.5 and 3.5 m, depending upon the feedstock characteristics and site design. In more extensively engineered systems, pile heights of up to 8 m are possible. There is no standard width or length for ASPs, as size is often dependent on site-specific requirements and land availability. ASP Composting Method ASP composting facilities are normally designed around a composting time of two to six weeks. After being removed from the ASP system, materials are usually further cured in outdoor windrows. At some facilities, the composting piles are remixed halfway through the active composting period to re-establish porosity in the materials and/or to ensure that all materials are exposed to the higher temperatures needed for pathogen and weed seed destruction in the pile core. As necessary, the materials are also remoistened during this remixing step. Since ASPs are not turned regularly, care must be taken during the blending of feedstocks with structural amendments so that adequate porosity is maintained throughout the composting period. It is important to achieve a homogeneous mixture and not compact the material with machinery while constructing the pile so that air distribution is even and no anaerobic areas develop causing sections of uncomposted material. 5-14 ■ Appropriate for food waste and L&YW ■ Active composting time typically between 2 and 8 weeks ■ Suitable for up to 100 000 tpy Photo 5-13: Typical ASP system with aboveground piping; block walls separate batches to better utilize available space © CH2M HILL 5. Aerobic Processing Technologies Table 5-9 lists ASP advantages and disadvantages. Table 5-9: Aerated static pile advantages and disadvantages Advantages Disadvantages • Pile configurations and height result in reduced space requirements • Slightly higher capital cost for forced-aeration equipment • Use of negative aeration can help avoid odour problems • Over-aeration can remove moisture • Smaller surface area relative to windrows reduces impacts of cold weather and rain infiltration • Feedstock preprocessing requires a higher degree of care; feedstocks must be well mixed and properly sized and moistened • Significantly shorter active composting times than passively aerated systems • More operator skill required to manage aeration systems • Aeration systems generally require three-phase electrical supply The concept of using covers overtop ASP composting systems was a natural progression that has evolved over the past several decades. There are many tarp variations that use woven and nonwoven fabrics. The tarp covers generally protect the pile from infiltration of precipitation, reduce evaporative loss of water from the compost pile, contain litter that may be in the compost pile, reduce vector attraction, and in some cases help to control odours and volatile organic compound emissions. Covered ASP systems are usually designed with an active composting time of three to eight weeks. One early covered ASP system used silage bags that are made from polyethylene film, and vary in lengths up to 60-m long. The bags have either a 1.5- or 3-m diameter and are perforated to allow air movement and leachate drainage. Feedstocks are injected into tubes as they are unrolled using a special piece of equipment that also places one or two flexible plastic aeration pipes in the bottom of tubes. When the pods are filled, the ends are sealed, and the pipe(s) in the base are connected to a positive aeration system. When the composting is complete, the plastic tubes are cut open, and the materials are removed. Photo 5-14: Composting system using polyethylene covers © Scott Gamble Photo 5-15: Covered, positively aerated composting system © CH2M HILL Covered ASP systems that use tarps containing a semi-permeable membrane are also available. These systems typically use positive aeration, and depending upon the installation, in-ground aeration trenches or aboveground aeration piping. Aeration fans are controlled by an oxygen or temperature sensor and a control computer. The membrane within the tarp helps to treat odorous process air as it diffuses through the tarp. Although covers on these various systems can be placed manually, mechanical winders are available. Weights (e.g., sandbags or water-filled hoses) are typically used around the perimeter of the piles to seal the edges Photo 5-16: Mobile unit used to place and remove covers © CH2M HILL 5-15 5. Aerobic Processing Technologies of the tarp on the ground and prevent process air from short-circuiting. Straps are often placed overtop the tarps to secure them in the wind. 5.3.2 Enclosed Aerated Static Pile (Tunnel) Fully enclosed ASP composting is a further improvement on bunkerstyle ASP composting systems. This system uses a positively aerated composting system with below-floor aeration. The aeration floor and the composting pile are housed completely within a long and narrow, cast-in-place concrete enclosure (hence, the tunnel). These enclosures are typically 3- to 6-m wide, 6- to 10-m high, and upwards of 50-m long. The enclosures are designed to allow large front-end loaders to drive in and out to load and remove materials. Photo 5-17: Enclosed tunnel composting system © CH2M HILL A custom-designed door system is used to seal the front of the enclosure during active composting. These doors manually slide on tracks (similar to a barn door) or are hinged at the top and opened using hydraulics. Locking mechanisms and rubber door gaskets are used to keep an airtight seal on the tunnels when the doors are closed. The active composting time is two to four weeks, and the system can be sized and designed to allow for materials to be removed and remixed halfway through this period. Photo 5-18: Closeup of tunnel door system © CH2M HILL During operation, process air is exhausted from the headspace area of the tunnel, above the composting pile. The sealed door system and tightly controlled air exhausting allow for a very high degree of process air containment. This generally leads to improved odour control and less building corrosion compared to unenclosed composting systems. However, the design of the aeration system in tunnel systems is typically more complicated than in a typical ASP system. The larger quantity of concrete involved in constructing the tunnels also adds to construction costs. However, since the tunnel is completely sealed, it is not necessary that it be situated inside a building. In a typical tunnel composting facility design, only the loading/ unloading end of the tunnel, and the aeration fans at the opposite end, are indoors; tunnel bays are often outdoors. Tunnel system space requirements are similar to bunker-style ASP systems. Like bunker systems, the tunnel walls allow for the sides and back of the composting pile to be vertical, which optimizes space: a 6-m-wide by 30-m-long tunnel can hold approximately 430 m3 of material, which corresponds to roughly 215 tonnes (t) of organic waste feedstock and amendment material. 5-16 Photo 5-19: Aerated static pile composting inside an enclosed concrete tunnel © Scott Gamble Enclosed Aerated Static Pile (Tunnel) Composting Method ■ Appropriate for food waste and L&YW ■ Typically designed with an active composting time of 2 to 4 weeks ■ Capacities up to 100 000 tpy ■ Materials in tunnels are often turned halfway through active composting 5. Aerobic Processing Technologies Based on the magnitude of the investment, tunnel composting systems are usually more appropriate for facilities processing more than 25 000 tpy; however, they may be used to process smaller quantities (as low as 10 000 tpy) when a higher degree of odour control is required. Larger facilities that use this technology are in the range of 100 000 tpy. One issue that has been encountered with tunnel composting systems is related to worker health and safety, and whether the tunnel meets the criteria of a confined space under the various provincial occupational health and safety regulations. Designation as a confined space may necessitate facility operators to implement specific operating protocols and use personal protective equipment (PPE) and alarm systems. Table 5-10 lists enclosed ASP (tunnel) advantages and disadvantages. Table 5-10: Enclosed aerated static pile (tunnel) advantages and disadvantages Advantages Disadvantages • Tunnel system design provides a high degree of odour control • Extensive use of cast-in-place concrete increases construction costs • Corrosive process air is contained within the tunnel, so building damage is reduced • Vendor-supplied systems typically have complex aeration and control systems • Less opportunity for automation, as tunnel loading/ unloading normally done with a front-end loader • Designation as a confined space may necessitate implementation of specific operating protocols and use of PPE and alarm systems 5.3.3 Static Container Static containerized systems are a type of in-vessel composting system that relies on a number of discrete composting vessels. These containers are very similar to 40-cubic-yard (yd3) roll-off containers used in North America for handling commercial solid wastes. The size of the individual containers makes them portable, and they can be moved around the facility. They are also modular, and additional containers can be added as more capacity is required. The containers are filled through sealable doors in the rear or roof of the container. Once filled, the containers are moved to an outdoor concrete or asphalt pad and connected to a stationary aeration system capable of providing air to multiple containers. Air is fed into the base of the filled composting container and removed from the top. The odorous exhaust air is then passed through a biofilter for treatment. Photo 5-20: Static container composting system © CH2M HILL Static Container Composting Method ■ Appropriate for food waste and L&YW ■ Active composting time typically between 2 and 4 weeks ■ Capable of processing up to 30 000 tpy, but more appropriate for less than 15 000 tpy 5-17 5. Aerobic Processing Technologies After two to four weeks of active composting, the containers are emptied by hoisting them on a truck with a specialized lifting system, and material is tipped out of the rear doors, much like a dump truck. This same truck is used to move empty and full containers around the site. Discharged material needs to be further cured and matured before being used as a soil amendment. Footprint requirements for each composting container are relatively small, but the space required for multiple containers can quickly add up. Photo 5-21: Composting system that uses multiple static containers © CH2M HILL The capacity of these systems depends on the composting time, but is generally between 200 and 900 tpy per container. Facilities using this technology are generally smaller and have fewer than 15 containers. Table 5-11 lists static container advantages and disadvantages. Table 5-11: Static container advantages and disadvantages Advantages Disadvantages • High degree of odour control • With processing times of less than two weeks, material is less stable and more odorous when removed • Low to moderate space requirements • Small size of containers allows for modular expansion of processing facility • Small capacity limits appropriateness for large-scale operations • Requires specialized trucks to move and unload containers 5.3.4 Agitated Container Agitated container systems are generally stationary and operate on a continuous-flow basis. Like static container systems, agitated container and vessel systems tend to have smaller capacities and are modular. This makes them well-suited to facilities with smaller quantities of feedstock (e.g., less than 10 tonnes per day [tpd]) and facilities that will be developed and expanded over time. These composting systems tend to have integrated control systems that monitor temperature and other control parameters, and manage water addition. A mixing and loading hopper and a biofilter for treating exhaust air are also usually included. Material handling is also generally automated. In some units, a moving floor system slowly walks materials from the unit’s inlet end to its discharge end. One or more sets of spinners may also be located along the length of the unit to agitate materials and break up clumps. 5-18 Photo 5-22: Each static container is attached to a central air system using flexible hoses © CH2M HILL Photo 5-23: Agitated container composting system installed at a university campus © CH2M HILL Agitated Container Composting Method ■ Appropriate for food waste and L&YW ■ Active composting time typically between 2 to 4 weeks ■ Multiple units can be used to process up to 15 000 tpy 5. Aerobic Processing Technologies Other systems use an auger that runs along the length of the vessel to move materials towards the unit’s discharge end. The auger is driven by a motor and gear box situated outside of the processing chamber so it is readily accessible for maintenance. Systems are available in a wide range of sizes, from 300 kilograms (kg) per day, to 12 tpd. Additional processing capacity can be achieved by using multiple units in parallel. The size of these units vary based on their capacity; smaller units can fit inside a single parking stall, while larger units are typically 3- to 5-m wide and have lengths exceeding 7 m. Installations are commonly designed with a composting time of 2 weeks; however, 4-week composting times are possible by lengthening the unit. Photo 5-24: Agitated container system © CH2M HILL Table 5-12 lists agitated container advantages and disadvantages. Table 5-12: Agitated container advantages and disadvantages Advantages Disadvantages • High degree of odour control • Generally has a short composting time (about two weeks), so material is less stable and more odorous when removed • Low to moderate space requirements • Highly automated, meaning reduced labour costs • Small size allows for modular expansion of processing facility • Small capacity limits appropriateness for large-scale operations • Can be located indoors or outdoors 5.3.5 Channel Channel systems are essentially turned windrow piles placed inside of buildings. The windrow is situated between two long, parallel, concrete walls that are 1.8- to 2.4-m high and spaced between 3- and 6-m apart. The raw materials are loaded into one end of the channel and are moved down its length over a period of two to four weeks by a turning machine that rides along the tops of the concrete walls. The turning machine has a conveyor or rotating drum that hangs below it and physically lifts and throws the compost backwards, agitating it in the process. As the turning mechanism makes repeated passes down the channel over time, it moves the mass of material from the feed end of the channel to its discharge end. Oxygen and temperature control within each channel is provided by an aeration system in the floor of the channel. Photo 5-25: Channel composting system © Scott Gamble Several channels are used simultaneously to obtain the necessary daily or weekly processing capacity. The length of time material spends in the channels is a function of the channel length and how 5-19 5. Aerobic Processing Technologies often material is turned. Channel systems are normally designed with a composting time of 2 to 4 weeks. With a turning schedule of every 1 to 3 days, channels are generally 30- to 75-m long. Buildings enclosing the channels are typically 15- to 30-m longer to accommodate equipment access to each end of the channels. Building widths depend on the number and width of individual channels. Feedstocks can only be added to the channel system at the in-feed end; consequently, there is only one opportunity to achieve the proper blend of feedstocks and amendments, requiring skilled operators to work with different loads and types of wastes so that the proper blend is achieved. Channel Composting Method ■ Appropriate for food waste and L&YW ■ Typically designed with an active composting time of 2 to 4 weeks ■ Appropriate for facilities processing between 15 000 and 100 000 tpy ■ Typical turning frequency is every 1 to 3 days The aeration system used in most channel composting systems is positive; air is blown upwards through the pile and escapes from the top surface. This approach results in large quantities of steam and poor visibility, particularly in uninsulated buildings. In some cases, it is possible to construct a secondary enclosure overtop the channels to contain and collect this air, improving indoor air quality. Channel systems are very efficient from a materials handling perspective, since materials are moved as they are turned. This reduces the quantity of material handling required with front-end loaders. Improved efficiencies can be realized by installing a conveyor belt system at the tail end of the channels to automatically collect and move materials as they are discharged from the channel. Table 5-13 lists channel advantages and disadvantages. Table 5-13: Channel advantages and disadvantages Advantages Disadvantages • Usually enclosed in buildings, so a higher degree of odour control can be achieved • Medium to high capital costs • Less space required than windrow composting • Mechanical turning systems are elevated above the composting bed and are easier to maintain • Lacks flexibility in dealing with feedstock peaks (requires increasing the turning schedule) • Positive aeration results in lower indoor air quality • Proper preparation and mixing of feedstocks and amendments is critical • Building and facility footprints are long and narrow, which may not fit on some properties 5.3.6 Agitated Bed An agitated bed composting system is similar to a turned mass bed system, with a much higher degree of automation. These types of systems are wellsuited for installations handling large volumes of material (e.g., more than 50 000 tpy). 5-20 Agitated Bed Composting Method ■ Appropriate for food waste and L&YW ■ Active composting time typically 3 to 4 weeks ■ Capacities range from 15 000 to 100 000 tpy ■ Typical turning frequency is every 1 to 3 days 5. Aerobic Processing Technologies The system consists of a large bed of composting material enclosed within perimeter walls. The walls around the bays allow for material depths between 2 to 3 m. The bays are equipped with an aeration system in the floor, similar to that used with ASP and tunnel systems. Both positive and negative aeration can be used, but negative aeration is more common. Material in each bay is turned every one to three days using an automated system. Composting time of materials in the bays is typically around three to four weeks and is governed by the length of the bed and the turner design (i.e., how far the material is moved with each pass). The turner consists of an auger or flail, which is suspended from a bridge crane that spans the bay. The movement of the turner along the bridge crane, combined with the bridge crane’s ability to travel up and down the length of the bay, enables the turning device to access all areas of the bay. Photo 5-26: Agitated bed system viewed from discharge end of bay © CH2M HILL Operationally, materials are placed along the receiving side of the bay using front-end loaders or conveyor systems. The materials are subsequently moved across the bay by the turner, which follows a serpentine path from the bay’s discharge end to its receiving end. As the turner makes a lateral pass across the bay, the augers or flails physically lift material and move it towards the discharge end. Over time, as the turner makes repeated passes through the bay, the fresh material moves completely across the bay and is discharged onto the floor or a conveyor belt. The capacity of the bed is a function of the depth of material and the bed width. Dimensions range from 25- to 50-m long and 10- to 75-m wide. Higher capacities can be achieved by installing several agitated beds in parallel. Photo 5-27: Bridge crane and suspended auger turning mechanism viewed from discharge side of bay © Scott Gamble Agitated bed systems are wellsuited for processing SSO feedstocks with high proportions of food waste. Facilities that use this technology typically have capacities ranging from 15 000 to greater than 100 000 tpy. Figure 5 5: Agitated bay turner movement and material flow 5-21 5. Aerobic Processing Technologies Table 5-14 lists agitated bed advantages and disadvantages. Table 5-14: Agitated bed advantages and disadvantages Advantages Disadvantages • Normally enclosed in buildings, so a higher degree of odour control can be achieved • Higher complexity due to degree of automation • Space requirements per tonne of capacity are low • Lacks flexibility in dealing with feedstock peaks (requires increasing the turning schedule) • Typically installed with a negative aeration system, which improves indoor air quality • Proper preparation and mixing of feedstocks and amendments is critical • High degree of automation reduces labour and material handling requirements 5.3.7 Rotating Drum Several small-scale, horizontal, rotating drum systems have been developed during the past decade, modelled on large-scale drum systems that were popular in the 1990s for composting MSW. Drum systems typically consist of a steel drum with a diameter between 1.5 and 5 m. In small-scale systems, the drums have a length of up to 10 m. By comparison, large-scale systems use drums that are significantly longer (i.e., 30 to 80 m). The drums are positioned on a slight incline (less than 5%) and rotate at between 0.5 and 5 rotations per minute (rpm). The combination of the drum’s rotation and incline, with gravity, results in materials tumbling down the drum in a corkscrew manner from the upper in-feed end to the lower discharge end. Air is typically injected into the drums, usually at the discharge end, to meet process air requirements. Depending on the size of the drums, they are driven by large ringgears, rubber trunions, or sprockets and chains. The loading and unloading doors and the drive mechanisms introduce a higher degree of mechanical complexity and maintenance requirements relative to other in-vessel composting systems. Drum capacities for smaller-scale systems range from 5 to 50 m3; generally, the drums are loaded to between 65 to 80% of their total volume. Loading more material into the drum prevents materials inside from tumbling and reduces processing efficiency. 5-22 Photo 5-28: Small-scale rotating drum system © CH2M HILL Rotating Drum Composting Method ■ Appropriate for food waste and L&YW ■ Active composting time is typically between 1 and 7 days ■ One or more drums can be used to provide processing capacities of between 1 000 and 100 000 tpy ■ Often combined with another composting technology 5. Aerobic Processing Technologies A drum’s annual capacity is determined by how much is unloaded from the drum and how often. For example, if a drum has 50% of its contents unloaded each day, it will have twice the annual capacity of a drum the same size that only has 25% of its contents unloaded each day. Rotating drums are usually designed with a composting time of one to seven days. With composting times this short, the material emerges without having completed the active composting step and needs further treatment. Table 5-15 lists rotating drum advantages and disadvantages. Table 5-15: Rotating drum advantages and disadvantages Advantages Disadvantages • Body of drum can be located outdoors; typically only ends need to be enclosed within buildings • Higher mechanical complexity due to drive system and loading/unloading systems • Provides very effective mixing and agitation of feedstocks and amendments • Drums and drive system require periodic alignment • Air injection systems prone to clogging • Typical short composting time • Treated material needs further treatment 5-23 6. Anaerobic Processing Technologies Anaerobic digestion (AD) of source-separated organics (SSO) from the municipal solid waste (MSW) stream is relatively new, but has been used at a few sites in Europe for approximately 20 years. It is now being introduced into North America, while also becoming more widely adopted in Europe. Most digester technologies used for SSO were derived from earlier dairy manure and wastewater biosolids digester technologies. Within the past few years, digesters specifically designed for SSO have been introduced. This chapter provides a brief overview of the general types of AD methods and technologies suitable for facilities with capacities ranging from 10 tonnes per day (tpd) up to several hundreds of tpd. AD basic science and principles were covered in Chapter 4. This chapter includes the following: • • • • • • Section 6.1, General Pretreatment Requirements Section 6.2, Types of AD Technologies Section 6.3, High-Solids-Stackable Digestion Systems Section 6.4, High-Solid-Slurry Digestion Systems Section 6.5, Wet (Low-Solids) Digestion Systems Section 6.6, Codigestion in Wastewater Treatment Plant Biosolids Digesters Pretreatment Considerations 6.1 General Pretreatment Requirements Careful consideration must be given to pretreating and mixing wastes for AD. SSO should be delivered to an enclosed, designated receiving area to keep vectors out and odours in. After receiving, loads should be inspected for unacceptable materials or materials that might damage processing equipment, as described in Chapter 4. Depending on collection program requirements and processing facility design, the inspection process may require mechanically removing materials from containers or bags. ■ Determine material handling methods required by the quantity of liquids in the feedstock and feedstock particle size ■ Remove materials that may: - Interfere with the digestion process (e.g., very high-saltcontent food wastes) - Interfere with equipment (e.g., large objects) - Affect final compost quality (e.g., glass and plastic) Once the feedstocks have been inspected and unacceptable materials removed, they may need to be physically or chemically altered (through grinding or shredding, or altering the pH) in order to provide optimal conditions for the digestion process, as particle size governs the surface area available for microbial action. The level and type of preprocessing and preparation required is dependent on the feedstock and also on the specific AD technology used. Feedstock preprocessing may involve removal of nondegradable waste that affects equipment or digestate quality. In some digestion systems, feedstocks are converted into a slurry form by adding water and agitating them. Light materials that float to the top of the slurry tank (e.g., film plastic) can then be skimmed or raked. Heavier materials (e.g., glass, rocks, and bottle caps) can be removed as grit from the bottom of the slurry tank. 6-1 6. Anaerobic Processing Technologies The preparation stage may involve a mixing step. In some digestion systems, feedstocks can be mixed with heated water or steam to increase the moisture content and the temperature of the waste to be processed. Mixing with warm water or steam also raises feedstock temperature, and increases the level of microbial activity and the extent of organic material degradation within the AD reactor (Section 6.2.3 provides details about temperature). For dry digestion systems, feedstocks may be mixed with “bulking agents” or “structural” organic materials, such as ground-up leaf and yard waste (L&YW) or woodchips, to ensure water can percolate through the waste mass. Starter inoculums (e.g., recycled feedstock that has already gone through the digestion process or wastewater produced during digestate dewatering or percolation steps) might be added to initiate microbial activity at the mixing stage. The recycled material carries many microorganisms already adapted to the digester environment so they can inoculate the incoming waste, speeding up the start of digestion. 6.2 Types of AD Technologies There are two major categories of AD systems used for processing SSO: wet (low-solids) systems (moisture content greater than 80%) and high-solids systems (moisture content less than 80%). There are subcategories within these categories based on specific moisture content ranges. Further subcategories involve staging sequential parts of the biological process in separate vessels, operating in different temperature ranges, and batch vs. continuous operation, as described in the following subsections. 6.2.1 High-Solids Versus Wet AD Systems AD system general categories are based on the solids content (or conversely, the moisture content) of the materials being digested, since this is the most important factor governing equipment design. There is some inconsistency in the industry regarding the exact meaning of “dry” vs. “wet” and “low solids” vs. “high solids,” mainly because digester technology is evolving with time. In this document, and in keeping with the most recent usage in applying AD technologies to MSW organics, we use “high solids” and “wet” as the primary categories: Process Control Requirements for Optimal SSO AD Operations Include Monitoring ■ Feedstock composition and contaminants ■ Water recirculation rates ■ Water addition rates ■ Digester temperature ■ Gas composition ■ Gas pressure and flow rates • • 6-2 High Solids: Systems with typically less than 80% moisture content (greater than 20% solids). Using front-end loaders, feedstocks are typically stacked into the digester as solid materials, or pumped in as a high-solids slurry. Wet: Systems with greater than 80% moisture content (less than 20% solids). Feedstocks are dissolved or suspended in a liquid form and are handled as a liquid. ■ Digestion times and loading rates (flow-through rates/solids loading rates) in second-stage digesters ■ Percolate pH, dissolved solids, ammonia, sulphide, and temperature See Chapter 4 for more information. 6. Anaerobic Processing Technologies Table 6-1 presents a comparison of high-solids (slurry and stackable) vs. wet (low-solids) digestion systems, and provides a summary of differences in the basic types of digester based on moisture content. Table 6-1: Digester type by moisture content summary Digester water content Feedstock consistency Net energy outputa Digestate treatment Leachate production High-solids stackable Less than 60% Stackable materials Highest Dewatering not required Lowest High-solids slurry Between 60 and 80% Wet but not liquid Intermediate Dewatering may be required Intermediate Wet (low solids) Greater than 80% Liquid Lowest Dewatering is required Highest Digester type Notes: Defined as energy generated less energy consumed per tonne of input feedstocks a 6.2.2 One Stage Versus Two Stage Another means of classifying technologies is based on whether the digestion process occurs in a single vessel or two sequential stages. In two-stage AD systems, the first stage is generally operated at pH 5 to 6, which is near optimal for organisms that break down large organic molecules, but not for methane-forming bacteria that produce biogas. In the second stage, the pH is raised into the 6.5 to 7.2 range to optimize the system for methane formers. A single-stage system allows both stages to occur in one vessel, but is not optimal for either. Table 4-1 in Chapter 4 presents the advantages and disadvantages of one-stage vs. twostage systems. 6.2.3 Thermophilic Versus Mesophilic Both high-solids and wet (low-solids) systems can be configured as single- or multiple-stage digesters, and can be designed to operate in either thermophilic or mesophilic temperature ranges. Thermophilic digesters typically operate at temperatures of 50 to 60 degrees Celsius (°C). Mesophilic digesters typically operate at temperatures in the 30 to 38°C range. The main difference between these two ranges is the speed at which reactions occur. Digestion reactions occur faster in the high-energy thermophilic range, so provide higher throughput and a higher rate of biogas production than mesophilic, but at the cost of requiring external heat to maintain the higher temperature. Thermophilic and mesophilic processes can be established for both single- and multiple-stage digesters. Table 4-1 in Chapter 4 summarizes the advantages and disadvantages of thermophilic vs. mesophilic digesters. 6-3 6. Anaerobic Processing Technologies 6.2.4 Technology Overview Table 6-2 summarizes technology types; additional details are presented in the following subsections. Table 6-2: AD technology summary (cont’d) Considerations Waste pretreatment/ preparation Digestion system type High-solids stackable High-solids slurry Wet (low solids) • Requires limited pretreatment: • Requires some pretreatment: • Requires high level of pretreatment: - Debagging, screening, and mixing - No aggressive size reduction - Needs bulking material (e.g., shredded or ground-up L&YW) to provide porosity - Debagging, aggressive size reduction (e.g., shredder) - Debagging, aggressive size reduction (e.g., shredder) - No need for bulking material - Remove floatables and settleables - Maximum particle size must be less than 5 cm to be pumpable - No need for bulking material - Particle size should be less than 20 cm Moisture addition Digester design • Most SSO wastes require no water addition • Most SSO wastes require water addition • All SSO wastes require water addition • Requires moisture content to be less than 60% • Requires moisture content to be 60% or greater • Requires moisture content 80% or greater • Typically requires 0.05 m3 water per t of waste • Typically requires 0.10 m3 water per t of waste • Typically requires 0.5 m3 water per t of waste • Typical design ranges: • Typical design ranges: • Typical design ranges: - Configuration: concrete tunnels with tight doors - Operating capacity: 10 000 to 100 000 t SSO/year - Retention time: 14–30 days • Mode of operation: batch - Configuration: plug-flow or continuously stirred tank - Operating capacity: 3 000 to 250 000 t SSO/ year • Retention time: 14–30 days • Mode of operation: continuous or batch 6-4 - Particle size typically must be less than 5 cm to be pumpable - Configuration: continuously stirred tank - Operating capacity: 3 000 to 250 000 t SSO/ year • Retention time: 14–40 days • Mode of operation: continuous 6. Table 6-2: Anaerobic Processing Technologies AD technology summary (cont’d) Considerations Digestate handling and characteristics (quantity and quality) Digestion system type High-solids stackable High-solids slurry • Digestate (solid material) removed by front-end loaders • Digestate pumped out of the digester • Typical moisture content of digestate between 50 and 60% by weight • Typically requires dewatering to a moisture content around 50% using filter/screw presses or other techniques commonly used in WWTPs for biosolids dewatering • Does not require dewatering before composting • Typically needs to be composted: • Typically needs to be composted: - Can be added to other compost feedstocks, such as L&YW - Can be composted separately - Compost times typically reduced due to partial decomposition during digestion Wet (low solids) • Typical moisture content of digestate prior to dewatering between 70 and 90% - Can be composted to a humus-like condition - Compost times typically reduced due to partial decomposition during digestion - Can be dried and used as fertilizer if it contains adequate nutrients and does not contain substances harmful to plants carried over from feedstocks and not destroyed in the digestion process (see Chapter 16) • Quantity: 0.85 t dewatered digestate per t of SSO processed • Quantity: 0.85 t per t SSO processed Effluent characteristics (quantity and quality) Effluent consists of excess percolate water Effluent comes from dewatering of the digestate Effluent comes from dewatering of the digestate Quantity: up to 0 .1 m3 per t of SSO Quantity: 0 .1 to 0 .3 m3 per t of SSO Quantity: 0.4 to 0.7 m3 per t of SSO • Almost all percolate from the digester is recirculated • As much as 30% of the water fed into the digester may be discharged as effluent • As much as 45% of the water fed into the digester may be discharged as effluent Quality: Quality: Quality: • BOD5: 2000 to 5000 mg/L • BOD5: 1 500 to 15 000 mg/L • BOD5: 1 500 to 15 000 mg/L • SS: 50 to 5000 mg/L • SS: 50 to 5000 mg/L • Ammonia as N: 1000 to 3000 mg/L • Ammonia as N: 1000 to 3000 mg/L • With some wetter feedstocks, excess percolate may need to be disposed to a treatment facility • SS: 50 to 5000 mg/L • Ammonia as N: 1000 to 3000 mg/L Unacceptable materials • Contaminants, such as glass, metals, and plastics, present in feedstocks and removed before, during, or after digestion • Typically landfilled 6-5 6. Anaerobic Processing Technologies Table 6-2: AD technology summary (cont’d) Considerations Net energy production (electrical) Digestion system type High-solids stackable High-solids slurry Wet (low solids) • 170 to 250 kWh/t SSO • 145 to 220 kWh/t SSO • 110 to 160 kWh/t SSO Notes: * Net energy production is the electrical output minus the electrical and thermal energy consumed by the digester . m3—cubic metre mg/L—milligrams per litre SS—suspended solids t—tonne WWTP—wastewater treatment plant BOD5—5-day biochemical oxygen demand cm—centimetre kWh/t—kilowatt-hour per tonne L—litre N—nitrogen 6.3 High-Solids-Stackable Digestion Systems High-solids-stackable AD systems that do not submerge the waste in a tank but rather recirculate percolating effluent water through the wastes are a relatively recent development in AD technology. In these systems, “stackable” materials with moisture content less than 60% are placed in tunnels using front-end loaders. After loading, a gas-tight door on the tunnel is closed, and water draining from the material is recirculated to spray nozzles above the waste to carry microorganisms and nutrients through the waste mass. The material digests in the tunnel for typically 14 to 30 days, depending on the specifics of the process (described in the following subsections), and then the solid residual digestate is removed and processed. Biogas Percolate Liquid Distribution Flare Percolate Liquid Distribution Gastight Door Biomass Heating Electricity Single Stage Heat Engine Combined Heat and Power Unit Concrete Tunnel with Integrated Heating System Drainage System for Percolate Liquid Percolate Biogas Small Wet Digester Figure 6-1: One-stage high-solids-stackable AD system flow diagram (with optional second stage) 6-6 Percolate Optional Second Stage 6. This AD process may be implemented as either a thermophilic or mesophilic process, and it may be implemented as a single- or twostage process. As shown in Figure 6-1, percolate in a single-stage system is recirculated directly back to the digesting wastes rather than through a second-stage digester. Biogas is collected directly from the tunnel that holds the feedstocks. The biogas in this system is being used as fuel in a combined heat and power unit, which generates electricity by burning the gas in an engine-generator set. Heat from the engine’s cooling water jacket is used to heat the digester rather than being radiated to the air. This type of digester may be designed as either a one- or two-stage system. In a two-stage, high-solids-stackable AD process, the first stage occurs in the tunnel, which is operated to maintain the pH in a range of 5 to 6, below the methanogenic range. Hydrolytic organisms degrade the larger organic molecules to soluble sugars and fatty acids, which are then pumped with the percolate to a second-stage, small, wet digester before being recirculated back to the tunnel. In two-stage systems, biogas is collected primarily from the second-stage digester. Anaerobic Processing Technologies High-Solids-Stackable Digester ■ All are batch systems ■ Typical retention times: - Thermophilic: 14 days - Mesophilic: 14 to 30 days ■ Two-stage systems: - Second stage operates faster than first stage due to breakdown of organic molecules in first stage - First stage sets processing time for each batch - Capacities from 10 000 to 100 000 t SSO/year Uniform Percolation in HighSolids-Stackable Systems A mixture with enough permeability for uniform percolation requires roughly equal quantities of food waste and L&YW by mass. High-solids AD systems incorporating concrete tunnels can handle SSO waste flows of roughly 10 000 tonnes per year (tpy) and higher. A typical facility includes the concrete tunnels as well as liquid storage tanks, receiving and processing facilities, access roads, staff and administrative areas, and possibly a digestate composting area. Modular high-solids AD systems for stackable wastes, including tunnels built from materials other than concrete, are less expensive and may be cost-effective at capacities as low as 10 000 tpy of waste input and even lower, based on project specifics. The high-solids-stackable AD process is particularly appropriate for SSO commercial and residential food wastes. If materials arrive in bags, they must be debagged, and several techniques have been developed for debagging. Debagging knives can be placed in a rotating trammel screen, which also separates out materials too large for digestion. Organic waste maximum sizes should be in the 13- to 20-cm range. Aggressive size reduction should be avoided, as it can create a liquid slurry. Screening and mixing are the primary feedstock preprocessing techniques appropriate for high-solids AD systems. Food wastes must be mixed with “structural” materials, such as shredded or ground L&YW, so that the mixture has enough permeability for uniform percolation. Fat, oil, and grease can be added in small quantities to increase biogas production. 6-7 6. Anaerobic Processing Technologies Table 6-3 provides an overview of high-solids-stackable AD systems. Table 6-3: High-solids-stackable AD system advantages and disadvantages Advantages Disadvantages • Can process waste with contaminant material (plastic, metals, rocks) • Requires mixing with shredded L&YW or other bulking materials • Handles solid stackable wastes with little pretreatment • Must operate as a batch system, requiring purging and opening the digester between batches • Produces negligible effluents • More energy efficient than other AD systems • Odour potential when door is opened • May require no water addition 6.4 High-Solids-Slurry Digestion Systems This type of digester is appropriate for a wider variety of materials than high-solids-stackable digestion. It can handle large volumes of wet materials, many types of food processing wastes, as well as residential and commercial food wastes. Some designs incorporate methods within the digester tank for removing large pieces of plastic and metals that sink or float. The feedstock quality may necessitate complex pretreatment and conveyance equipment, including size reduction, mixing, and slurry pumping for feedstock handling. The feedstock receiving and separation/sorting areas need to be enclosed in a building equipped with air quality/odour control systems. The level of separation and cleaning of the feedstocks depend on the downstream product handling processes and requirements, but must be reduced to a pumpable slurry through size reduction and water addition (60% or greater moisture content). High-Solids-Slurry Digester Types ■ Vertical silo (low footprint) ■ Horizontal ■ Mostly thermophilic systems ■ One, two, or more stages High-Solids-Slurry Digesters ■ Batch or continuous feed ■ Capacities from 3 000 to 250 000 t SSO/yr ■ Retention times: 14 to 30 days ■ Thermophilic and mesophilic ■ Almost always single stage After debagging, the material is typically put through size-reduction machinery. Size reduction to 5 cm or less is generally considered necessary for this type of digester for pumping. Many package systems include recommended, specific size-reduction equipment for the particular digester. High-solids-slurry digesters are typically operated at a moisture content of 60 to 80% by weight. Although solids feed and conveyance equipment is generally more expensive than that used in wet (low-solids) systems, high-solids-slurry systems are more robust and flexible regarding acceptance of nonbiodegradable material in the digester, such as rocks, glass, metals, and plastics (CIWMB, 2008). This type of digester may be either batch or continuous feed. Batch digesters are designed to be fairly simple, but because batch digesters have no continuous feed, the gas generation peaks at a certain point and decreases as the digestion progresses. Single-stage batch processes are typically used in very small applications (less than 5000 tpy) where energy recovery is not the major focus. Continuous-feed digesters are typically a better fit for larger AD systems that aim for energy recovery. 6-8 6. Anaerobic Processing Technologies Due to high solids content, material in high-solids-slurry reactors moves via plug-flow without using mechanical mixers. Biogas injection is sometimes used to assist mixing the reactor contents (Luning et al., 2003). However, complete mixing cannot be achieved with biogas injection, which reduces the ideal contact between microorganisms and substrate, thereby reducing overall system performance. Continuous-flow, high-solids-slurry systems are normally designed with an inoculum loop that recycles a fraction of the digestate from the end of the plug-flow digester vessel to the head end in order to distribute microorganisms rapidly into the incoming raw waste. Most high-solids-slurry digesters are designed to operate in the thermophilic range. See Figure 6-2 for a schematic of a typical high-solids-slurry digester. Within this category, vertical-silo-type slurry digester package systems use the available footprint efficiently, but may be limited by local height ordinances. The receiving and feed separation/sorting areas need to be enclosed in a building equipped with air quality/odour control. The system is continuously fed with continuous biogas generation and recovery. The biogas generated is piped to storage; from there, the biogas is delivered to the biogas handling system. Horizontal-reactor-type slurry digestion systems are also continuously fed. Typically, the horizontal digester is a cylinder with internal paddles or rotors that move the digesting material through the system. The biogas generated is piped to storage before being delivered to the biogas utilization system. Note that these processes typically contain a loop for recirculation of some digested material. Feedstock Preparation: Debagging and Size Reduction Biogas Electricity Water Addition Combined Heat and Power Unit Digester Feed Mixer Heat to Digester Inoculation Loop Dewatering Digestate Screw Conveyor Effluent Composting Figure 6-2: Vertical silo, one-stage, high-solids-slurry AD process flow (Adapted with permission: Organic Waste Systems Inc.) 6-9 6. Anaerobic Processing Technologies Processing capacities for high-solids-slurry digesters that are operational range from 3 000 to greater than 250 000 tpy. The typical footprint for a large SSO facility includes receiving and preprocessing facilities, digester vessels, a dewatering facility, access roadways, and staff/administrative facilities, and may include a compost area for further processing digestate. Vertical silo digesters can be used to reduce the footprint of the facility (compared to horizontal digesters). Typical retention times are 14 to 30 days in the digester (CIWMB, 2008). Additional time for processing and composting digestate varies significantly, depending on the particular system used, the feedstocks, and end products. Very few high-solids-slurry systems are configured as two-stage systems. Table 6-4 provides an overview of high-solids-slurry AD systems. Table 6-4: High-solids-slurry AD system advantages and disadvantages Advantages Disadvantages • Can process waste with contaminants (e.g., plastic, metals, and rocks) • Slurry typically is not completely mixed, so can cause uneven digestion if not carefully managed • Handles wastes that are in a liquid or slurry condition upon arrival • Produces more effluent than high-solids-stackable digestion • Produces less effluent than wet (low-solids) digestion • Less energy-efficient than high-solids-stackable digestion • More energy-efficient than wet (low-solids) systems • Entirely contained system (high level of odour control) 6.5 • May require water addition to make the feedstocks pumpable Wet (Low-Solids) Digestion Systems In wet (low-solids) systems, organic solid waste is diluted to 80% or more moisture content to allow continuous stirred operation and complete mixing. The designs of these systems are similar to WWTP biosolids digesters and were some of the first designs used in treating MSW organics. Wet (low-solids) systems rely on pretreatment more than their high-solids counterparts, and require various steps, depending on the feedstock. Wet (low-solids) systems can also be operated under mesophilic or thermophilic temperatures and be arranged as single-, dual-, or multistage digesters. Wet (Low-Solids) Digesters ■ Continuous feed ■ Capacities from 3 000 to 250 000 t SSO/yr ■ Retention times: 14 to 40 days ■ Thermophilic and mesophilic ■ Almost always single stage (when used for SSO) Processing capacities for wet (low-solids) digesters that are operational range from 3 000 to greater than 250 000 tpy. A typical wet AD facility is similar to a high-solids-slurry facility in that it contains receiving and preprocessing facilities, digester vessels, a dewatering facility, access roadways, and staff/ administrative facilities, and may include a compost area for further processing digestate. The footprint for a large facility, in the range of 150 000 to 200 000 tpy, is approximately 4 ha, including all process facilities, access roadways, and administrative facilities. 6-10 6. Anaerobic Processing Technologies Wet (low-solids) AD systems are most appropriate for very low-solids feedstocks, such as dairy manure and certain food processing wastes (e.g., juices, cheese whey, and spoiled milk). These wastes can be mixed with low- or high-solids materials as long as the moisture content does not drop below that required for good operation, typically in the 80 to 85% range. Feedstocks for continuously stirred systems must typically be processed to remove large, fibrous materials that can wrap around or otherwise interfere with the mixing and stirring mechanisms. Typical retention times are 14 to 40 days. Table 6-5 presents an overview of wet (low-solids) AD systems. Table 6-5: Wet (low-solids) AD system advantages and disadvantages Advantages Disadvantages • Handles wastes that are in a liquid or slurry condition upon arrival • Cannot generally handle waste with contaminant material (e.g., plastic, metals, and rocks) • Entirely contained system (high level of odour control) • Requires significant pretreatment and operational care to avoid exceeding capacity or upsetting biosolids digestion • Produces more effluent than the other two digester types • Requires more energy consumption than high-solids digesters The most common configuration of wet (low-solids) digesters used for processing food waste is the complete mix continually stirred tank reactor (CSTR) configuration shown in Figure 6-3. Feedstock Preparation • Debagging • Size Reduction Heat to makeup Water Addition Combined Heat and Power Unit Engines Floatables Biogas Digester SSO Heat Electricity 80-95% Water Heat Addition Inoculation Loop Dewatering Digestate Water Addition Composting Liquids Settleables Liquid Recirculation Effluent Figure 6-3: Typical complete mix CSTR wet (low-solids) AD process flow (Adapted with permission: Waste Science & Technology) 6-11 6. Anaerobic Processing Technologies 6.6 Codigestion in Wastewater Treatment Plant Biosolids Digesters Codigestion of food waste in WWTP sludge digesters may be an attractive option where capacity exists in these plants. Major modifications to the WWTP are generally not necessary, except to add receiving, pretreatment, and feed equipment for the food wastes. Excess capacity in biosolids digestion facilities is a prerequisite for codigestion at WWTPs. Feed total solids (TS), carbon to nitrogen ratio, and operating conditions should be clearly determined to estimate how much feedstock can be added to the digester and to avoid process upsets. Without excess capacity, there may be a lack of sufficient drivers for codigestion. Codigestion at WWTPs requires training the WWTP operators to handle the SSO pretreatment equipment. The objectives of pretreatment are to: Issues with Codigestion of SSO with WWTP Biosolids ■ Stringent pretreatment required ■ Toxics may upset normal operation • • • • Separate unwanted impurities and inorganic material (e.g., grit, sand, and glass) not contributing to biogas production Provide more uniform and homogenous feedstock to the digesters Adjust feed TS content Protect downstream processes against damage ■ Food waste may form scum layer that is resistant to digestion ■ Excess capacity may diminish over time due to increase in sewage accepted Materials delivered must be sorted to remove large and harmful objects, shredded or ground to reduce their size, and then conveyed to the existing digester. Figure 6-4 shows a typical pretreatment scheme. Fork Lift SSO Conveyor Sorting Conveyor Shredder Conveyor Bottles, Cans, Plastics Sorted and Shredded SSO Debris Box Fan F To Receiving/Processing Facility at WWTP Odour Scrubbers Solids Content 25% SSO from Transfer Facility Rock Trap/Grinder 10% Solids Content Food Waste 10% Solids to Existing WWTP Digester Drum Screen Slurry Tank Dilution Water (Treated Effluent from WWTP) Slurry Pump Debris Box Debris Box Figure 6-4: Pretreatment scheme for food waste sent to WWTP digesters (Adapted with permission: Central Marin Sanitation Agency) 6-12 7. BioGas Conversion and Utilization Options As outlined in Chapter 4, the major components of biogas produced by anaerobic digestion (AD) systems are carbon dioxide (CO2) and methane (CH4). Biogas produced from municipal solid waste (MSW) feedstocks can also contain hydrogen sulphide (H2S) and other sulphur compounds, chlorinated organics, and volatile organic compounds. Siloxanes are commonly found in biogas from landfill gas collection systems and wastewater biosolids digestion. However, there is little published data about siloxanes in MSW digestion, especially from source-separated organic (SSO) wastes. From a conversion and utilization standpoint, the methane content of the biogas is what determines energy and reuse potential. Methane provides approximately 37 200 kilojoules per cubic metre (kJ/m3) (1 000 British thermal units per cubic foot [BTU/ft3]). Thus, the energy value of biogas generated by AD systems varies between 22 300 kJ/m3 (at 60% methane content) and 26 000 kJ/m3 (at 70% methane content) (600 and 700 BTU/ft3, respectively). As outlined in Chapter 4, 1 tonne (t) of SSO typically produces between 100 and 150 cubic metres (m3) of biogas. The options for using biogas can be broken down into three main categories, based on the level of biogas treatment and upgrading required. These use categories are summarized in Table 7-1 and are discussed in further detail in the following sections: • • • • Table 7-1: Section 7.1, Low-Grade Uses Section 7.2, Medium-Grade Uses Section 7.3, High-Grade Uses Section 7.4, Biogas Safety Summary of biogas use options Three main categories Low grade Range of uses • Heat source for the AD process • Process water heating • Space heating • Boilers and furnace fuels • Brick and cement kiln firing Typical utilization equipment Gas boiler Medium grade • Heating the digester • Heating buildings at or adjacent to the AD facility • District heating High grade • Injection into natural-gas distribution system • Vehicle fuel • CNG or LNG • Hot water for other industrial processes nearby • Preheating boiler water or steam-cleaning water • CHP Engine-generator set with heat recovery CNG compression and filling station Notes: CHP—combined heat and power CNG—compressed natural gas LNG—liquefied natural gas 7-1 7. BioGas Conversion and Utilization Options Going from low- to high-grade uses, progressively more elaborate treatment of the biogas is required. Figure 7-1 shows the typical level of treatment for each level of use, and the different treatment technologies that have been used successfully. The treatment requirements are cumulative as the level of biogas uses increases. Thus, high-level uses require all of the treatment levels listed, and medium-level uses require trace gas removal, particulate removal, and moisture removal. Figure 7-2 shows a typical biogas treatment schematic. The figure shows the points in the schematic where low-grade, medium-grade, and high-grade biogas can be collected for use (and the remainder of the treatment scheme removed from that point forward). Figure 7-1: Summary of biogas treatment and technologies Figure 7-2: Typical biogas treatment sequence 7-2 7. 7.1 BioGas Conversion and Utilization Options Low-Grade Uses Biogas can be mixed with natural gas or used by itself as a direct natural gas substitute in industrial processes, to heat water, or for building heating. Usually, removing particulate matter and reducing the biogas’s moisture content are the only treatment steps required prior to use. Given that biogas has only 60 to 70% of the heating value of natural gas, gas burners typically need to be modified so that they can handle the higher flow rates necessary to achieve the same quantity of heating. Chimneys and heat distribution systems may also need to be modified to handle the higher volume of exhaust gases. Biogas is also commonly reused within the AD facility itself to heat materials in the digester’s vessels and maintain the optimal temperature range. This is typically accomplished using heat exchangers. In wet (low-solids) digesters, the liquid in the digester tank may be heated as it is recirculated, while in high-solids digesters, the recirculating percolate is usually heated. Ten (10) to 20% of the biogas from mesophilic digesters, and 20 to 40% of the biogas from thermophilic digesters, may be consumed this way. 7.1.1 Biogas Treatment Requirements for Low-Grade Uses Biogas is typically 100% saturated with moisture and needs to be dehydrated before it can be used in any application. Different applications require degrees of moisture removal, which is usually accomplished by chilling the gas to a dew point that corresponds to the maximum water content allowable for the application. Once the biogas is dried, it can be handled much like natural gas. Biogas from SSO, and in particular from food waste, may contain sulphur at concentrations up to several thousand parts per million (ppm), which may be too high for certain uses, so sulphur removal may be required. Commonly used methods for removing sulphur from biogas are discussed in Section 7.2.1. For some direct-use applications, the gas must be pressurized and transported through dedicated pipes and other equipment to the end-user. Typically, biogas can be transported to end-users up to 10 kilometres (km) away. The approximate pressure requirements of equipment that burns the gas should be determined during the planning stage, as these requirements can significantly impact costs. Various types of compressors apply to different ranges of gas pressures and flow rates. Similarly, burner modifications for existing boilers and other equipment that use natural gas may vary in sophistication, price, and installation requirements. In summary, the most important variables for planning projects that will directly burn low-grade biogas are: • • • Pressure required by the utilization equipment (e.g., boiler, burner, and furnace) Distance from the digester to the point of use Whether the burner requires sulphur removal These variables will largely determine the costs for the project, and they vary considerably from project to project, so must be estimated separately for each project. 7-3 7. BioGas Conversion and Utilization Options 7.2 Medium-Grade Uses AD of organics from the MSW stream is much more commonplace and has a longer track record in Europe than it has in North America. It is an interesting trend that in Europe, most AD projects use biogas to generate electric power, which is then sold to the local power grid under feed-in tariff programs. AD plants often use standard gas-fired enginegenerator sets to produce electrical power. As a result, equipment manufacturers have gained experience with sizing and modifying their equipment to run on digester gas. Manufacturers are often also able to estimate emissions from their engines based on actual analyses of the biogas to be used as fuel, or its estimated constituent concentrations. Photo 7-1: Package CHP system © CH2M HILL Standard gas-fired engine-generator sets have become much more efficient when converting the chemical energy in methane to electric power. Manufacturers typically claim electrical conversion efficiencies of 35 to 45% (or more) for units in the 300-kilowatt (kW) and larger size range. Microturbine-generator sets have been successfully used for smaller landfill gas and biogas-to-energy projects. The scale of these systems makes them appropriate and more economical for projects in the 60- to 300-kW range. However, the conversion efficiency of currently available microturbine technology is in the 25 to 35% range, which is less efficient than larger engine-generator sets. Table 7-2 shows expected electricity production from SSO-generated biogas. Table 7-2: Electricity production from SSO SSO (tpy) Electrical plus heat Electrical efficiency recovery efficiency Typical range range (%) range (%) of project (kW) Electrical power generation (watts per tpy SSO) Engines More than 6000 35 to 45 60 to 90 More than 300 53 Microturbines 1200 to 6000 25 to 35 35 to 72 60 to 300 40 Notes: tpy—tonnes per year Using gas-fired engines and microturbines to produce electric power generates heat. As a result, engines and microturbines are often surrounded by cooling water jackets. Much like a car engine, pumps are used to transfer the heat from the engine or microturbine unit to radiators. This heat can also be collected and used, which increases the overall efficiency of the project. In a CHP recovery system, the hot 7-4 Digester Heat Required from CHP Systems ■ Mesophilic digesters: 10 to 20% of biogas produced ■ Thermophilic digesters: 20 to 40% of biogas produced 7. BioGas Conversion and Utilization Options cooling water is directed to somewhere that the heat can be put to use. When CHP systems are used, some of the waste-heat is typically used to heat the digester. Typically, the digester requires only a portion of the available heat for this purpose. For mesophilic digesters, this may equate to 10 to 20% of the generated biogas, depending on the system configuration, size, and local climate. For thermophilic digesters, a range of 20 to 40% of generated biogas is suggested (Kocar and Eryasar, 2007). The cooling water from a CHP system is typically at 90 to 115 degrees Celsius (°C) and can be used for: • • • • • Heating the digester Heating buildings at or adjacent to the AD facility District heating Hot water for other industrial processes nearby Preheating boiler water or steam-cleaning water The quantity of total energy that can be recovered using the heat from water-cooled systems is nearly double that achieved by electricity generation alone. 7.2.1 Biogas Treatment Requirements for Medium-Grade Uses For use in engines and turbines to produce electricity, biogas must usually be treated to remove particulates and moisture, and reduce the high levels of sulphur that may be present. As previously discussed, particulate removal is achieved using knockout tanks, and water removal is accomplished by chilling the gas to a dewpoint that depends on the specific gas processing equipment used. Further biogas refining can be accomplished using a variety of methods, as described in the following subsections. Hydrogen Sulphide Internal combustion engines fuelled by biogas can typically tolerate hydrogen sulphide concentrations of 1000 ppm and greater (Heguy and Bogner, 2011). However, specific engine and microturbine manufacturers establish and regularly update pretreatment recommendations for their products, so higher levels of treatment may be required. Project planners should consult engine and turbine manufacturers’ current published levels for allowable H2S concentrations. Hydrogen sulphide can be transformed in an engine into acids that can cause corrosion of the engine. The limiting factor for sulphur compounds in fuels may also be governed by the concentration of sulphur allowed in engine/microturbine exhaust emissions by the particular jurisdiction and airshed where the equipment is located. Local air regulations should be consulted during the project planning phase. For hydrogen sulphide treatment, the most commonly used removal methods are amine-based liquid “scavenger” systems, iron oxide solid media “scavenger” systems, and iron reduction systems, such as “iron sponge.” For biogas systems handling less than 25 kilograms (kg)/day of sulphur, liquid scavenger systems are typically used (Graubard et. al., 2011). This treatment process produces a biodegradable water-soluble sulphur product that can be treated to produce a solid sulphur cake residual. Siloxanes Treatment for removal of siloxanes may also be required. The presence of siloxanes in biogas presents a concern when considering the use of biogas to operate internal combustion engines and turbines. Siloxanes 7-5 7. BioGas Conversion and Utilization Options are silicon compounds used in various consumer products that can end up in SSO. When burned, these compounds from silicates can coat engine parts and create friction. The detrimental effects of silicon dioxide (SiO2) on internal combustion engines and turbines have resulted in manufacturers imposing restrictions on the use of siloxane-containing fuels, including biogas, for guaranteed performance and equipment warranties. Project planners should consult engine and turbine manufacturers’ current published levels for allowable siloxane concentrations. Although internal combustion engines are able to operate over a broad concentration of siloxanes in fuel gas, maintenance costs generally increase as siloxane concentrations increase (Wheless and Pierce, 2004). For siloxane removal, the standard treatment method is activated carbon. Depending on the concentration of siloxanes in the biogas, the expected cost of siloxane removal may exceed the increased engine maintenance caused by SiO2 deposits, which can be removed by overhauling the engine and physically removing deposits from the engine internals at intervals. It has also been demonstrated that chilling the gas stream to 4°C can remove from one-third to one-half of the siloxane present (Wheless and Pierce, 2004). Chlorinated Compounds Chlorinated compounds in biogas may be a concern for engines (e.g., corrosion by formation of hydrochloric acid, which attacks engine parts) if they are present in high concentrations. However, digester biogas (unlike landfill gas) does not usually have chlorinated compounds at levels that would harm engines or microturbines. 7.3 High-Grade Uses Biogas can be purified to create a high-grade fuel that is comparable in heating value to natural gas. This requires the removal of carbon dioxide and any entrained oxygen, as well as any trace compounds that may be corrosive. Biogas treated to this level is referred to as biomethane. Two Primary Uses for High-Grade Biogas 1. Injection into natural gas pipelines 2. Use as CNG or LNG for vehicle fuels The Canadian Gas Association (CGA), which represents gas utilities across Canada, has published a set of guidelines for upgrading biogas so that it is suitable for injection into the natural gas distribution systems (CGA, 2012). According to these guidelines, the calorific value of the gas must be raised to at least 36 megajoules per normal cubic metre (MJ/Nm3) from the typical 22 to 26 MJ/m3 found in biogas. These criteria require biogas producers to strip nearly all nonmethane constituents from the biogas so it has a methane concentration of at least 96% (by volume). The oxygen concentration of the biogas must also be less than 0.4% (by volume), since oxygen can cause certain components of the distribution systems to corrode. Monitoring systems must also be included in any project that involves injecting biogas into a natural gas distribution system. The gas distribution utility typically also requires that the injection system have automatic controls to shut it off if required quality thresholds (e.g., methane or oxygen concentrations) are not met. 7-6 7. BioGas Conversion and Utilization Options Converting biogas to vehicle fuel results in the most valuable final product on a per-kJ basis; on this basis, biogas can compete with liquid fuels refined from petroleum. However, the costs to upgrade the biogas, pressurize and dispense it, and the potential need to upgrade vehicle engines and fuel tanks to use CNG or LNG may outweigh the fuel-value benefit for a given project, so these costs must be carefully evaluated during project planning. 7.3.1 Gas Treatment Requirements for High-Grade Biogas Uses Once particulates and moisture have been removed, sulphur removal (as described in the previous section) is typically the next step used to treat gas so that it meets the CGA’s pipeline quality standards. This is followed by removing carbon dioxide and excess oxygen. There are several commercially available processes that can remove carbon dioxide and oxygen. Of the technologies that can be used for biogas cleanup to highgrade uses, pressure swing adsorption and water-wash technologies are usually the most economical for a typical project (in the range of 2000 Nm3 per hour or less). However, treatment methods in this field continue to improve, and new methods continue to be developed. The choice of gas cleanup technology depends on the composition and flow range of the input biogas, the requirements for the final gas product, the availability of supplies and equipment, and site-specific operational requirements. Typical Treatment Technologies forHigh-Grade Biogas ■ Water-washing ■ Amine scrubbing ■ Membrane separation ■ Pressure swing adsorption Rule of Thumb The biogas from 1 t of SSO produces the equivalent of approximately 60 L of diesel fuel. The treatment steps and equipment for converting biogas to CNG are similar to those described for converting biogas to pipeline-quality gas: particulate, water vapour, and sulphur are removed first, followed by carbon dioxide and other constituents. However, CNG specifications for typical internal combustion engines are less stringent than the CGA specifications for gas system injection into natural gas pipelines. It is more expensive to convert biogas to LNG than it is to convert biogas to CNG. However, there is more energy in LNG than in the equivalent volume of CNG. This has advantages in that more energy can be stored onboard a vehicle in a smaller volume when using LNG. To produce LNG, biogas is purified and condensed into liquid by cooling it to –162°C. Producing LNG from biogas lends itself to the cryogenic treatment method of removing carbon dioxide, which initially refrigerates the gas while purifying it. 7-7 7. 7.4 BioGas Conversion and Utilization Options Biogas Safety Biogas is a flammable gas, as well as an asphyxiant. Methane, which typically makes up 60 to 70% of digester biogas, is explosive in the concentration range of 5 to 15% by volume in air, as illustrated in Figure 7-3. Due to these hazards, AD equipment and facilities should be equipped with continuously monitoring fixedexplosive gas meters. Personnel operating the digesters should be trained in the potential hazards of digester gas and personal monitoring and safety practices. Figure 7-3 : Flammability chart for methane concentration in air (Adapted from the public domain [United States Department of the Interior, 1952]) 7-8 8. Facility Siting A properly sited, designed, and operated organic waste facility can help prevent nuisances to neighbours and impacts to their health or quality of life, as well as environmental impacts to groundwater, surface water, and soil. Adherence to sound design principles and implementation of best management practices during the facility’s operational stage are proven methods of reducing these potential risks. However, thoughtful selection of the facility’s location is just as important to success. This chapter provides an overview of issues that should be considered during site selection, including: • • • • Section 8.1, Facility Siting Approaches Section 8.2, Environmental Considerations Section 8.3, Proximity and Access Considerations Section 8.4, Land-Use Considerations The space required for the facility is a key site selection criterion. An organics processing facility typically requires space for receiving feedstocks, storing amendments, blending and processing the materials, and storing finished products. Additional space may be required to house systems for treating odours, leachate, and runoff. Separation distances between the facility and sensitive habitats or sources of potable water may help to prevent serious environmental impacts. Similarly, buffer zones between the facility and neighbouring properties can help temporarily mitigate nuisance impacts until further controls can be implemented. As a result, most provinces, and some municipalities, have established requirements for siting composting, anaerobic digestion (AD), and other waste management facilities. Table 8-1 provides examples of typical setback distances contained in provincial regulations. Factors that Determine Overall Facility Footprint ■ Capacity ■ Technology ■ Product sales cycle and storage requirements ■ Setback distances ■ Regulatory requirements Site characteristics, such as topography and availability of utilities, can affect the processing facility’s capital or operating cost and, thus, its financial sustainability. Financial risk may cause managers and operators to reduce operations and maintenance practices and costs, increasing the possibility of nuisances and impacts. Ultimately, decisions relating to selecting a facility location can have ramifications well into the future. 8-1 8. 8.1 Facility Siting Facility Siting Approaches There are two different approaches to facility siting. One method is to first define the appropriate technology (e.g., enclosed composting, AD, or open-air windrow composting), and then determine the location. In this case, site selection criteria are determined according to the specific technology requirements. As an example, if an AD facility is the preference and a wet process is favoured, water use and wastewater treatment, as well as biogas utilization, will be important factors in determining site selection. Another example is large-scale, open-air composting, which typically requires a large footprint and has higher odour control challenges, requiring greater setbacks from sensitive residential areas. Table 8-1: Typical setback distances Setback type (distance from) Distance Property line 15 to 50 m Drainage ditches/pipes leading to natural surface water bodies 30 m Natural surface water bodies and wetlands 100 m Private well or other potable water source 150 m Permanent residence 300 m Hotel, restaurant, food processing facility, school, church, or public park 300 m Commercial/industrial occupancies 300 m Water supply intake 300 m 8 km The second approach is to first identify a location Notes: with the best chance of community acceptance Municipal and/or provincial regulations may exist and compliance with regulatory requirements, that contain specific setback requirements. These and then determine the most appropriate facility requirements should be identified and reviewed during configuration (e.g., process and technology layout) the facility planning process . km—kilometre for the local context. A technology preference, if m—metre applicable, then helps to guide site selection and is not the main consideration. This approach is best where location represents a major challenge (e.g., poor social acceptance due to negative experience with waste treatment facilities already implemented in the region, or limited potential available locations). Another example is for small-scale operations where open-windrow composting is favoured because of least cost, but is more difficult to locate (typically, where setback distances over 300 m are required). Airports There is no basis for claiming that one of these approaches is better than the other. In many cases, the approach is dictated by project-specific issues, such as project development timelines, availability of project funding, and whether the proponent is trying to site the facility at an existing waste management operation. As shown in Figure 8-1, there are a number of issues and criteria that should be considered when siting an organic waste processing facility. These fall into three general categories: 1. Environmental considerations 2. Proximity and access considerations 3. Land-use considerations Organic Waste Processing Facility Siting Approaches ■ Define the technology and then select the most appropriate site. ■ Identify a site and then determine the most appropriate technology and facility layout. Specific factors within each of these broad categories are discussed in further detail in the following sections. 8-2 8. Facility Siting Figure 8-1: Issues to be considered when siting an organic waste processing facility 8.2 Environmental Considerations 8.2.1 Wetlands and Water Bodies In most jurisdictions, wetlands are recognized as sensitive habitats, so development around them is controlled. It is generally recommended that organic waste treatment facilities not be sited near wetlands, or that engineering protection and controls be put in place due to the potential for facility runoff to impact these sensitive habitats. Similarly, the potential for uncontrolled releases has prompted many provinces to establish minimum setback distances (e.g., 100 m) between waste management facilities and streams, rivers, lakes, and oceans. In addition to provincial requirements, sections of the federal Fisheries Act and associated regulations apply to development in and around fish-bearing waterways. 8-3 8. Facility Siting 8.2.2 Potable Water Sources Sources of potable water, whether wells that service private dwellings or surface water bodies that serve population centres, should be protected from potential contamination (e.g., nutrients and pathogens) coming from organic waste processing facilities. Provincial and local regulations often define required setbacks from potable water sources (e.g., 150 m or greater). 8.2.3 Flood Plains Organic waste processing facilities should not be located in areas that are subject to flooding, since the likelihood of feedstocks, leachate, or other contaminants being released to the environment during a flood is high. Development of solid waste facilities in areas subject to flooding during a 1-in-100-year storm event is often prohibited by municipal and provincial authorities. Even smaller flood events (e.g., 1-in-25-year and 1-in50-year events) can lead to ponding water or saturated conditions in outdoor composting areas and feedstock/ amendment storage piles; ponding is a potential source for odours and contamination. Flooding can also pose serious operational difficulties, including equipment damage and preventing access to the site. 8.2.4 Topography Indoor and outdoor working areas at organic waste processing facilities are normally designed with slopes between 0.5 and 2% to promote drainage and reduce ponding of runoff water, as shown in Figure 8-2. It is generally easier to locate a processing facility on a relatively flat site. Steeper slopes and undulating topography can increase the costs associated with initial earthwork and site preparation during construction. However, situating a facility on land with gentle slopes may afford the designer the opportunity to lay out the various working areas and Groundwater Protection their grading in a manner that reduces earthwork requirements and Considerations construction costs. Areas with steep slopes should be avoided where ■ Maintain at least 1 m of vertical possible. Not only do these areas have a greater potential for erosion, elevation between the seasonally high water table and the bottom of but they may create challenges to the layout and design of roadways working pad liner systems, sumps, and working pads. and underground piping. 8.2.5 Groundwater Depth The first line of defence against groundwater impacts is buildings and working pads with properly designed and constructed floors and/ or liner systems that serve as a barrier to downward contamination Ditch to Divert Runoff from Up-Slope Area Slope Pad 1–2% Figure 8-2: Typical organic waste processing facility site topography 8-4 ■ Additional engineering features, such as groundwater pumping and dewatering systems, can be used in areas where groundwater is closer to the surface and a 1-m separation cannot be maintained. 8. Facility Siting migration. Maintaining a vertical buffer between processing activities and surface water and groundwater sources provides a second line of defence against potential contamination (e.g., from nutrient or pathogens in runoff and leachate). The soils above the water table can also provide additional protection by filtering solid particles and decreasing nutrient migration. 8.2.6 Soil Type For organic waste processing facilities that include some outside operations, impermeable surfaces should be constructed for runoff and leachate capture, confinement, and treatment. In some cases, sites located overtop naturally impermeable clay soils may provide significant cost advantages if provincial regulators agree that the natural clay provides a comparable level of protection as engineered clay or synthetic liners. This criterion is of particular interest for open-windrow composting projects where cost is an important constraint, or site location is planned in a remote or agricultural context. On the other hand, the presence of rock formations at or just below the site surface may represent additional construction cost (e.g., blasting), and often present more sensitive groundwater conditions. Other geotechnical and hydrogeological features may also have significant impacts on facility cost. 8.2.7 Wind Speed and Direction Wind speed and the prevailing wind direction influence how quickly and where odours from a processing facility disperse. In urban areas, historical data on wind speed and direction may be available from airports or Environment Canada weather stations. Obtaining reliable information in remote or rural areas may be more difficult, since weather stations tend to be clustered near population centres. Other parameters that play an important role in odour dispersion include topography (see Section 8.2.4, Topography), presence of forest cover, and the frequency of temperature inversions. These features, along with the facility’s specific odour emission characteristics, can be incorporated into computer models that can be used to predict how far and in which directions odour from the facility will be dispersed. These dispersion models provide a useful tool for validating site location and technologies, or comparing different layout options for a specific site. Such modelling studies are becoming more common as part of the design process for larger facilities, and may be integrated into operating approvals issued by environmental regulatory agencies. 8.3 Proximity and Access Considerations 8.3.1 Transportation Network Being able to access the organics facility via a network of appropriate access roads is important to minimizing traffic, noise, and dust impacts on surrounding neighbours, and increasing traffic safety. Photo 8-1: Unsurfaced roads can lead to significant dust impacts on neighbours © CH2M HILL 8-5 8. Facility Siting Roadways for collection vehicles should be appropriately designed and constructed to handle the types of vehicles expected. This includes appropriate lane widths, turning radii, and grades. Roadways should be surfaced to prevent generation of excessive quantities of dust. Particular emphasis should be placed on identifying whether access roads are subject to seasonal weight restrictions or road bans. These restrictions may reduce the quantity of feedstocks that delivery vehicles are allowed to carry, and can result in increased collection and transportation costs. Access to the site from arterial and collector roadways is normally a benefit, since it reduces the likelihood that traffic will have to travel through residential areas. However, direct access from roads with high traffic volumes may create the need to widen these roadways to accommodate turning lanes or install traffic controls to accommodate vehicles turning across traffic into the facility. Existing traffic congestion on access roadways should be considered. Congestion increases the time it takes to transfer feedstocks from the generator’s location to the processing facility, increasing collection costs. 8.3.2 Feedstock Sources The costs of collecting and transporting feedstocks to the processing facility can significantly affect the financial viability of a particular site. If the facility is too far from where the organic wastes are generated or if the site is not easily accessible, it may be more economical to transport the material to another processing site or a landfill. Reduced travel distances also reduce fuel consumption and associated greenhouse gas emissions. Of course, the cost benefit of proximity to the feedstock materials must be weighed against other site selection factors, including the difficulties of locating a facility closer to urban areas (i.e., traffic, distance to neighbours, and land planning). Photo 8-2: Using transfer stations and long-haul trailers can make hauling organics to distant facilities more economical © CH2M HILL Transfer stations may provide a means of balancing the benefits and challenges of siting a processing facility close to feedstock sources. Transfer stations allow for feedstocks to be reloaded onto larger vehicles that are more efficient for transporting materials over longer distances. 8.3.3 Markets and End-Users Although it may not be as important as proximity to feedstocks, proper location with regard to the endmarkets identified in Chapter 17 may help reduce transportation costs and impacts. As an example, when agricultural markets are targeted as the compost end-users, a rural location may be favoured. 8-6 8. Facility Siting The biogas utilization aspects of AD projects outlined in Chapter 7 can be a major factor in facility siting as well, since the sale of biogas conversion products may be crucial to the project’s overall financial viability. For example, purifying biogas for injection into regional natural gas networks may only be effective if the site is located close to service lines. Similarly, the proximity of the site to other facilities that can use heat from biogas conversion for heating or industrial processes may be an important consideration. 8.3.4 Utilities and Services Photo 8-3: Aeration fans used at composting facilities normally require three-phase power supply © CH2M HILL The ability and cost of providing electrical service, natural gas, potable water, and sanitary sewer services to a site can be critical factors in the site selection process. Depending upon the nature of equipment and technology employed, electrical service may be required for aeration fans, mixing equipment, and conveyor belts, as well as for indoor and outdoor lighting. Even at small processing facilities, a three-phase electrical service is often required, but may not be available or may be cost-prohibitive to provide. Smaller buildings can often be heated with electrical heaters or from natural gas stored in tanks at the site. However, large building heating requirements will often require a connection to a regional gas network or other energy source. Access to a sanitary sewer network can be useful if the facility generates significant surplus volumes of lowto moderate-strength effluents and leachate. Transporting these liquids via tanker trucks to a wastewater treatment plant can be costly. 8.3.5 Water Sources An organic processing facility should have a source of potable water for staff washrooms and possibly for shower facilities. Potable water can be obtained from wells or municipal water networks, or can be provided through the use of holding tanks. Processing facilities that handle drier feedstocks (e.g., leaves and brush) or that are located in areas with low rainfall may need to add makeup water to materials during processing in order to maintain optimal conditions. Access to a nonpotable water source may, therefore, be a factor in site selection. A common practice is to reuse site runoff collected in surface water ponds; trying to supply a facility’s process water requirements using well water is not normally feasible. The proximity to sufficient quantities of water or some other means of fire suppression should be another siting consideration, since municipal authorities may refuse to issue development permits if there are insufficient fire protection measures. Authorities may also specify larger aisles around and between working areas and material stockpiles, and may limit the height or size of stockpiles. Both limitations can increase the space required for the facility’s working areas. 8-7 8. Facility Siting The potential for processing facility fires to spread to adjacent properties, or vice versa, may also be a consideration. The vegetation on and around the site, setback distances, and the ability to create fire breaks in buffer zones are factors for consideration. 8.4 Land-Use Considerations 8.4.1 Land Usage and Activities on Adjacent Sites The nature of the land use and activities on properties adjacent to or in close proximity to the processing facility is an important consideration. Choosing a location that is close to existing or proposed residential development may be more controversial than a location surrounded by industrial developments. In addition to the existing activities on adjacent lands, future land uses must also be considered. Despite proactive land-use policies and plans, commercial and residential development can encroach on waste management facilities over time, and community attitudes towards the facility can change from positive to negative. 8.4.2 Adjacent Site Use Considerations ■ Identify sensitive receptors: - Schools and daycare centres - Hospitals and medical clinics - Food storage, processing, and preparation facilities ■ Determine separation distances mandated between waste management facilities and sensitive receptors in provincial/ municipal regulations Allowable Land Uses and Zoning Local land-use plans and bylaws should be investigated and understood early in the site selection and evaluation process. It is common for the processing of rezoning and development permit applications to take longer than the processing of provincial environmental approval applications. Provincial policies may also prevent the processing of approval applications until all zoning and development permit applications have been received from municipal authorities. 8.4.3 Protection of Agricultural Lands Provincial regulations relating to protection of agricultural lands and land use in agricultural zones should also be taken into account. In some provinces, a specific authorization is required to implement nonagricultural activities on land included in defined agricultural zones. 8.4.4 Buffer Zones While it should not be the sole means of mitigating impacts, and should never be used in place of good facility design or operational practices, providing buffer zones between an organic processing facility and the surrounding community is a common practice. The size of the buffer zone may be dictated by the minimum separation distances specified in provincial or municipal regulations, bylaws, and guidelines (see Table 8-1). The capacity of the facility, the potential for 8-8 Buffer Zones Providing buffer zones between the organic processing facility and the surrounding community is a common practice, but these should never be used in place of good facility design or operational practices. 8. Facility Siting creating nuisance conditions, topography and wind conditions, and the facility’s specific design controls also factor into determining buffer zone sizes. As a general rule, the larger the distance from a facility to a sensitive area, the higher the potential to reduce conflicts between the site and adjacent land uses and neighbours related to odour, traffic, noise, and dust. Vegetation, shrubs, trees, and berms can be incorporated into buffer zones to serve as visual barriers and to reduce noise levels. Fencing in buffer zones may also help control litter. 8.4.5 Proximity to Airports Transport Canada has developed general guidelines related to land use around airports. These have been developed primarily to prevent structures from being built (e.g., buildings, radio towers, and stacks and chimneys) that might affect aircraft navigation and lines-of-sight. Transport Canada has also provided guidance on waste processing facilities, including composting and AD facilities handling food waste, which may attract birds and increase the potential for bird strikes. Since birds may also be attracted to the heat given off by the composting process in the winter, outdoor facilities processing leaf and yard waste may also need to consider Transport Canada requirements and/or take specific precautions to control birds. Proximity to Airports ■ Transport Canada provides guidelines for siting solid waste facilities that handle food and other putrescible wastes. ■ Facilities should not be located within 8 km of an airport. Site-specific limits related to land use and development around airports can be found in specific regulations enacted under the federal Aeronautics Act (1985), and in municipal land use bylaws. 8.4.6 Proximity to Other Waste Management Facilities Historical activities and past issues from other organic processing facilities in the vicinity may contribute to community acceptance. In particular, odours and nuisances caused by other facilities can seriously undermine the confidence a community may have in a new facility, despite differences in technologies, designs, and operational practices. Changing community attitudes and pre-existing opinions is a difficult proposition and can take months or years to achieve. 8-9 9. Additional Facility Design Considerations Designing an organic waste processing facility is a complicated endeavour, as there are many factors that must be accounted for in addition to ensuring that the biological processes perform efficiently. This chapter highlights some of the additional functional features and requirements that should be considered by designers and owners. Specifically, the following are addressed: • • • • • • • • • • • • 9.1 Section 9.1, Health and Safety Section 9.2, Fire Prevention, Detection, and Control Section 9.3, Site Security Section 9.4, Operational Flexibility and Maintenance Section 9.5, Building Ventilation Systems Section 9.6, Compost Product Specifications Section 9.7, Winter Operations Section 9.8, Seasonal Variations in Waste Quantities Section 9.9, Self-Hauled Feedstock Deliveries Section 9.10, Signs Section 9.11, Corrosion Protection Section 9.12, Provincial and Municipal Requirements Health and Safety Health and safety measures should be incorporated into the design of the facility to mitigate operator fatigue and the potential for injuries, as well as downtime due to human-error-related incidents. In organic processing facilities, there are somewhat unique conditions that should be taken into account. One critical consideration is the air quality within the facility and the potential for personnel to be exposed to elevated levels of air contaminants (e.g., ammonia, methane, carbon monoxide, dusts, and bioaerosols). Typically, occupied areas within organic waste processing facilities are designed with six or more air changes per hour. Ventilation systems are often supplemented with source capture systems around unit processes, such as mixing and screening operations, and open processing vessels or piles. Health and Safety Considerations ■ Provide at least six air changes per hour in occupied areas of facilities ■ Use source-capture ventilation systems around mixers, screeners, and other open processing equipment ■ Install covers over long conveyors ■ Control humidity levels to prevent fog ■ Provide easily accessible light fixtures for regular maintenance Where possible, processing technologies and material handling systems should be designed in a manner that controls temperature and humidity within buildings. This is necessary to prevent fog from developing inside the building, which can reduce visibility and lead to accidents. Controlling humidity also helps 9-1 9. Additional Facility Design Considerations prevent corrosion damage to building components and equipment, as discussed further in Section 9.11. Fog can be controlled with sourcecapture ventilation systems and hoods over conveyor belts. Preheating makeup air and using negative aeration in composting systems are other ways to reduce fog. Portable air sampling equipment should be available to check for common air contaminants, such as carbon monoxide, hydrogen sulphide, and methane, as well as issues involving oxygen levels. Increasing ventilation rates or adding respirator requirements for specific processing areas are common solutions to air quality issues. Photo 9-1: Dust and fog within processing facilities can lead to worker health impacts and reduced visibility © CH2M HILL Accessibility of light fixtures is another key consideration. Light fixtures become dirty very quickly and/or bulbs fail prematurely. If the fixtures are not easily accessible, they will likely not be cleaned regularly, resulting in poor lighting conditions and potential health and safety issues for staff (e.g., slips, trips, and fall injuries). ConfinedSpaces Underground or aboveground tanks, sumps, and ventilation ducts are confined spaces, and proper confined space entry procedures must be followed. The gases that can build up in confined spaces in composting and anaerobic digestion (AD) facilities can be toxic under certain conditions, or these gases can displace oxygen and create an oxygen-deficient atmosphere that is unsuitable for human entry. 9.2 Fire Prevention, Detection, and Control Organics processing facilities contain many fuel sources, including storage piles of materials that have become overly dry (e.g., green waste, screening overs, and finished product), litter from feedstock receiving, and dust from grinding and screening operations. Off-gases from the composting process do not contain significant quantities of explosive gases (e.g., methane) and are not a concern from a fire-prevention-and-control perspective. However, biogas harvested from AD systems contains high concentrations of methane (up to 70%) and presents an explosion risk in the 5 to 15% concentration range (see Chapter 7). In light of the many fuel sources and potential ignition sources, facility designers should give particular attention to fire prevention and detection. 9-2 Operational Practices to Prevent and Control Fires ■ Regularly inspect fire alarm systems and extinguishers to ensure they are in good working order and are not corroded ■ Designate portions of the facility as nonsmoking areas ■ Provide enough separation between outdoor feedstock, amendment, and product stockpiles to allow equipment to access the piles in the event of a fire and protect against the spread of fires ■ Regularly blow off stationary and mobile equipment using compressed air to prevent accumulation of dust and other debris in and around engine compartments and exhaust systems ■ Regularly monitor conditions in amendment and product stockpiles, as well as composting and curing windrows, for conditions that could lead to spontaneous combustion ■ Limit the height of dry amendment storage piles to 5 m ■ Store and maintain portable pumps, hoses, and other firefighting equipment 9. When designing and planning a new facility, consideration should be given to including a sprinkler system in receiving and temporary storage areas, and installing additional fire hydrants at strategic locations within the facility rather than relying on municipal fire hydrants at the site’s perimeter. Sufficient space (e.g., 5 to 10 metres [m]) should also be provided within outside working areas between amendment and product storage piles to allow for access aisles for equipment and fire trucks. Design features should always be supplemented with good operational practices to help minimize the risk of fires starting and spreading. 9.3 Photo 9-2: Fires have occurred at composting facilities © Sevier Solid Waste, Inc. Potential Ignition Sources ■ Lightning strikes ■ Sparks from malfunctioning electrical equipment ■ Hot engine manifolds ■ Cigarettes ■ Spontaneous combustion within material stockpiles Photo 9-3: Fire detection and alarm systems inside organic processing facilities are particularly susceptible to damage from corrosion © CH2M HILL Site Security Some form of access control and site security should be provided to prevent illegal waste dumping and vandalism. Commonly, waste management facilities are enclosed within by barbed-wire or chain-link fencing. Installation of security systems (i.e., building alarms, video cameras) may also be necessary to augment basic security precautions, depending upon the degree of vandalism encountered in the area. 9.4 Additional Facility Design Considerations Site Security Considerations ■ Enclose facilities with chain link or other types of fencing ■ Use natural features (e.g., ravines, trees) to prevent unauthorized access Operational Flexibility and Maintenance The working environment at organic waste processing facilities generally results in a higher degree of wear and breakdown of mobile and stationary equipment than is encountered at transfer stations and material recovery facilities. Flexibility and redundancy should, therefore, be incorporated into the layout and design of the facility to allow operators to adjust for planned and unplanned maintenance. Flexibility is also required to respond to unexpected surges in Photo 9-4: A temporary storage area can decouple systems in the facility and provide operators with some flexibility to schedule daily tasks © CH2M HILL 9-3 9. Additional Facility Design Considerations feedstock quantities that can occur from week to week or as a result of isolated events, such as holidays, special events, and wind storms. For example, installing two smaller, parallel, processing lines rather than a single, larger line allows for continued operation (albeit at reduced capacity) if a machine breaks down. This also allows only one system to be operated when feedstock quantities are low, which should reduce energy consumption. Decoupling processing systems by including surge hoppers or temporary storage areas is a way of allowing systems to operate independently, and provide the opportunity for a system to be taken out of service temporarily for maintenance. Photo 9-5: Designers should provide appropriate ladders and catwalks so equipment can be easily accessed for inspections and maintenance © CH2M HILL Designers should also ensure that suitable walkways, access stairs and ladders, and service platforms are incorporated into equipment arrangements so that systems are readily accessible for inspection, maintenance, repair, and/or replacement. Efficient material handling and the flow of materials through the processing facility should also be considered by designers. Careful choices when laying out a facility or specifying equipment reduce operational costs and bottlenecks. 9.5 Building Ventilation Systems Like the systems for process air, the building ventilation system at an organic processing facility should be tightly integrated with the odour treatment system so that both process air and odorous building air is captured and conveyed to the odour treatment system. Releases of fugitive emissions from buildings can lead to odour impacts on neighbours, resulting in complaints. Ideally, the ventilation system should keep the building under a slight negative pressure so that air is drawn into the building and odours are contained. Designing ventilation systems to provide an air flow rate of at least six air changes per hour, and using source-capture exhaust systems, as outlined in Section 9.1, helps with odour control, as well as health and safety. 9-4 Photo 9-6: Source-capture systems should be used to capture odours before they disperse within the building © CH2M HILL 9. Additional Facility Design Considerations Processing areas within the facility can also be segregated with walls or flexible partitions to prevent or minimize the transfer of large volumes of air, and the accompanying migration of odours and dust from space to space. Separate, filtered ventilation of electrical rooms should be provided so that equipment is not exposed to dust or trace levels of corrosive gases, which would lead to premature failure. It may also be necessary to provide air conditioners so that electrical equipment does not overheat. 9.6 CompostProductSpecifications Photo 9-7: Leaving doors open impairs the ability of a building’s ventilation systems to contain odours © CH2M HILL The proposed uses of the final compost products produced by the composting facility should be reflected in the facility’s design so that suitable allowances are made for postprocessing equipment, operations, and storage space. In particular, the desired level of compost product stability and maturity must be considered and reflected in the residence time of materials in the active composting system and curing area. If sufficient residence time is not provided, material may not meet customer expectations or requirements, and alternative markets may need to be explored. Photo 9-8: Market requirements and finished compost specifications are factors in the selection and design of refining equipment © Environment Canada, 2012. Photo: Alain David Similarly, end-user particle size requirements and their tolerance for contaminants are factors in the selection of the type of screening and refining equipment used. 9.7 Winter Operations If the processing facility is intended to operate year-round, special consideration needs to be given to working in cold climates. One of the primary issues related to winter operations is maintaining optimal temperatures in composting and AD systems. Enclosing these systems in heated buildings is an obvious solution, but this may be cost-prohibitive for some projects. One option may be to insulate processing vessels rather than place them indoors. For outdoor composting systems, pile sizes and configurations may need to be adjusted to minimize the quantity of heat lost through the pile surfaces. Biofilters Care must be taken to ensure that biofilters remain operational during the winter. The temperature of the air ventilated to the biofilter should be maintained above 5 degrees Celsius (°C), and ideally between 9-5 9. Additional Facility Design Considerations 35 and 40°C, so that treatment efficiencies are not adversely affected. Relying on surface irrigation systems to maintain the moisture level of the biofilter may also not be possible in the winter. Another problem with operating biofilters during the winter is the potential for freezing of the media around the edges of the biofilter. This occurs if there is poor air distribution or the biofilter is exposed to high winds. Proper design and spacing of air distribution pipes and use of perimeter walls can alleviate these problems. Air and Liquid Handling Leachate, effluents, and other liquids that are handled using outdoor pumps and aboveground pipes can freeze in the winter, and result in pipe ruptures and equipment damage. Similarly, the condensation that can occur in air handling equipment used to transfer high-humidity process air can freeze inside of ducting and control dampers. Pumps, pipelines, and ducting may need to be insulated to prevent freezing. Access The need to access outdoor working areas during the winter months is another consideration. Yearround access may drive the need for improved roadway and pad surfaces, and having equipment that is capable of clearing snow. Thought should also be given to the location of snow dumps so that when the snow melts in the spring, it does not create water ponding/drainage issues or contribute unnecessarily to leachate quantities. Photo 9-9: Operating outdoors during the winter months creates unique design and operational challenges © Scott Gamble Health and Safety Operating in the winter can also create unique health and safety issues. For example, the steam emitted by outdoor composting windrows and biofilters can create fog banks that reduce visibility. Operating in unheated buildings can also lead to fog and excessive condensation within buildings. The moisture can also freeze on stairs, walkways, handrails, and other surfaces, and create slipping hazards. 9.8 Seasonal Variations in Waste Quantities The variation in waste generation rates on a monthly, weekly, and daily basis is an important consideration in the planning and design of all waste processing facilities, and must be accounted for in the design of facilities and equipment to avoid bottlenecks in storage and processing capacity. Generally, the quantity of solid waste generated in Canada is greater during the warmer months (e.g., May through September); food waste is generated steadily year-round, but quantities of organics increase dramatically in the spring and summer due to the influence of leaf and yard waste (L&YW). The extent of this variation is shown graphically in Figure 9-1. Although the scale of the winter/summer variation may differ, this trend is typical of what is encountered in municipal programs that include L&YW. 9-6 9. Additional Facility Design Considerations Figure 9-1: Organic waste generation rates can vary significantly during the year and must be considered during processing facility sizing and design L&YW quantities can also vary from year to year within the same area. Intuitively, these variations can be attributed mainly to climatic variations that directly affect rates of tree and grass growth, like variations in temperatures, precipitation, and hours of sunlight. Spring snowstorms can also increase L&YW quantities. When snowstorms happen late in the spring after the leaves on trees have formed, there can be significant breakage of tree limbs from the weight of the snow. The variations in organic waste quantities that occur on a daily basis are important when sizing facilities. Average and peak daily waste volumes are used as a basis for determining facility capacity. Trends and variations in waste quantities within the week (e.g., quantity received on Saturday versus Monday) also factors into design of larger facilities, as there are often definitive patterns relating to the types of customers and vehicles that use the facility each day. Variations during the week can also affect staffing requirements. Density ■ Density of different feedstocks, and whether density changes during the year, must be considered in the facility design process. ■ Dry leaves have a very low density (25 to 50 kg/m3) and require a lot of space. Food waste has a density on the order of 650 kg/m3. Since the density of organic wastes can vary, the variation in the volumes of materials generated can be even more significant than the weight variation. For instance, dry grass generated in the early spring and leaves generated in the fall have a very low density relative to food waste. This low density can dramatically increase the magnitude of the spring and fall peaks, and can be significant, since many technologies have a limited volumetric capacity. 9.9 Self-Hauled Feedstock Deliveries Feedstock delivered to most organic processing facilities are diverted through residential and commercial recycling programs operated by municipalities and private waste collection/recycling companies. This means that the majority of feedstocks are delivered to the processing facility in large waste collection trucks. 9-7 9. Additional Facility Design Considerations However, it is common for facilities to also allow residential and commercial generators to deliver feedstocks directly to the facility. This practice of self-hauling materials can significantly increase traffic volumes and result in a diverse mix of small vehicles at the site, ranging from passenger cars and minivans to pickup trucks and panel vans, all with and without trailers. Concentrating this diverse mix of vehicles and drivers with varying skill levels together with larger waste collection trucks and dump trucks in a small area can lead to serious traffic management and safety issues. With the acceptance of self-haul customers, particular attention must be given to routing vehicles within the site to prevent confusion and congestion, and maximizing the safety of all customers and site personnel. It is a good practice to separate commercial and self-haul traffic whenever possible. This can be achieved by directing traffic into distinct spots within the receiving area, or providing unloading areas that are completely separate. Another alternative is to provide a remote unloading area for residential traffic, and transfer the material to the main receiving area at the end of each working day. 9.10 Photo 9-10 Accepting feedstocks directly from residents can create traffic and safety issues © Scott Gamble Photo 9-11: Waste management facility with receiving doors for self-haul traffic that are completely separated from the doors used by larger waste collection vehicles © CH2M HILL Signs Signs are a critical but often overlooked component of waste management facilities. Signs are necessary to direct traffic, establish speed limits, control access to operating areas, and provide information on tipping fees and acceptable and unacceptable materials. Some provinces also require that signs containing emergency contact information be provided at the entrance to waste management facilities. It is critical that signs be legible, and that they use clear and simple language that is easily understood. The signs throughout the site should also be consistent in terms of font, colour scheme, size, and placement. Although signs are most often provided in English and/or French, there may be a need in some regions for some signs to be provided in additional languages. 9.11 Corrosion Protection Experience at several solid waste facilities has demonstrated the damage that can be incurred as a result of organic waste handling, high-humidity environments, and the off-gases from the AD and composting processes. If left unchecked, corrosion can lead to the permanent closure of a facility and the need to demolish buildings for safety reasons. Based on this experience, all buildings, ventilation and heating ducting and equipment, fire sprinklers, natural gas lines, and process air handling and processing equipment that will come into contact with the 9-8 9. Additional Facility Design Considerations organic material, process off-gases, or other corrosive environments at the facility should be designed and constructed using suitable materials or protective coatings to minimize corrosion. Corrosion Protection Considerations ■ Building components and equipment at organic waste processing facilities are subject to high levels of corrosion. Over the past 20 years, there have been many advances in understanding the corrosion that occurs within organic waste facilities, and what is required to prolong the lifespan of buildings and equipment. For example, the use of specialty epoxy and polyurethane coatings on the structural components of buildings has become more commonplace, as has the use of components that are galvanized or constructed of stainless steel. Use of alternative materials, such as plastic and fibre-reinforced plastic, is also becoming more common. ■ Use corrosion-resistant materials (e.g., stainless steel, plastics), specialty coatings, and higher ventilation rates to manage corrosion. ■ Give particular attention to building structural components and process ventilation systems. The design of building and process ventilation systems is also an integral part of corrosion prevention. Containing corrosive off-gases from processes and controlling humidity can help to prolong the lifespan of building components and equipment. 9.12 Provincial and Municipal Requirements Photo 9-12: Corrosion has proven to be one of the most challenging design issues for the organic processing industry © CH2M HILL As part of environmental protection legislation, most provincial and territorial governments have developed specific regulations that deal with solid waste management facilities. Many provinces have also developed regulations or guidelines that specifically address composting or AD facilities. Generally, these regulations and guidelines address siting and design requirements, including setbacks from natural environmental features and sensitive land uses (e.g., hospitals, schools, and commercial food preparation establishments), environmental protection features (e.g., liners, leachate, and surface water controls), construction specifications, and closure requirements. Operating protocols and requirements for facility monitoring, recordkeeping, and reporting are also often specified. In addition to these provincial/territorial requirements, organic processing facilities are subject to the development and redevelopment requirements and bylaws that have been enacted by the municipality in which they are located. This applies to municipally owned as well as privately owned facilities. Municipal bylaws are normally developed to cover a range of general issues that are common to residential, commercial, and industrial developments. This can include noise prevention, dust and litter controls, surface water controls, discharges to sanitary and storm sewer systems, building heights, setbacks from property boundaries, and requirements with fire prevention and control (e.g., access and accumulation of flammable materials). Some Canadian municipalities have also enacted specific bylaws that deal with organic waste processing facilities or solid waste management facilities in general. Many of these municipalities also require specific licensing of facilities that is in addition to normal development and building permits, and any requirements of provincial agencies. 9-9 10. Common Supporting Infrastructure As shown in Figure 10-1, an organic processing facility often has several discrete working areas where the various processing steps take place. The functional and design requirements for each of these areas are slightly different, and these differences must be understood by designers. This chapter provides an overview of the various operating areas and supporting infrastructure that are common to both aerobic and anaerobic processing facilities, as well as a discussion of the features of each area. Specifically, the following supporting infrastructure is discussed. • • • • • • • • • Section 10.1, Feedstock Receiving Area Section 10.2, Amendment Storage Area Section 10.3, Compost Curing Area Section 10.4, Finished Compost Storage Area Section 10.5, Residuals Storage Areas Section 10.6, Leachate and Effluent Management Infrastructure Section 10.7, Contaminated Stormwater Management Infrastructure Section 10.8, Uncontaminated Stormwater Management Infrastructure Section 10.9, Additional Infrastructure Requirements Figure 10-1: Operating areas in typical municipal solid waste organics processing facility 10-1 10. Common Supporting Infrastructure 10.1 Feedstock Receiving Area A well-defined receiving area should be included in the layout and design of all organics processing facilities. A dedicated area allows for traffic controls that prevent delivery vehicles from entering processing areas and possibly creating safety issues. It also allows for feedstocks to be inspected before they are processed so that potentially harmful, unacceptable materials, such as sharps and large objects, can be removed. Including small, temporary storage space in the receiving area provides operations staff with the flexibility to manage surges in feedstock deliveries and preprocessing, as well as processing equipment, in a more consistent manner. Another benefit to providing temporary storage is that feedstock can continue to be received in the event that processing is disrupted for short periods of time (i.e., as a result of equipment malfunction or process upsets). At facilities accessed by roadways subject to traffic congestion, storage provides flexibility to schedule deliveries during off-peak traffic hours, which can help to reduce collection and transfer costs. The size of the receiving area will vary based on the daily capacity of the facility, and the number and types of vehicles delivering feedstock. At a minimum, the receiving area should allow for at least two vehicles to unload materials simultaneously and for material handling equipment to manoeuvre within the storage area at the same time. At larger facilities, it may be necessary to accommodate more than two vehicles at the same time. To help mitigate odours, the size of storage space in the receiving area should be limited to be between one and three days’ worth of material. Regardless of the amount of storage provided, operations staff should always strive to process materials the same day it arrives at the facility. If feedstocks will be stored for more than one day, store them on a “first-in, first-out” basis: older feedstocks should not be covered by newer feedstocks or otherwise be inaccessible as new materials are received. Photo 10-1: Multiple, clearly defined unloading positions should be provided, especially at facilities that cater to residential customers © Scott Gamble Receiving Area Size Considerations The number of vehicle unloading bays needed is determined by: ■ Number of delivery vehicles arriving during the busiest hour of the day ■ Length of time it takes for vehicles to unload: - Curbside garbage trucks can be unloaded in 10 minutes or less - Walking floor trailers can take as long as 30 minutes to unload ■ Acceptable waiting time Photo 10-2: Fabric-style receiving building © CH2M HILL Outdoor Receiving Areas Ideally, outdoor receiving areas should be paved or have some other hard surface (e.g., concrete or lime- or cement-stabilized soil) that can withstand the loads from heavy trucks and wheel loaders. This is, in part, to ensure that the receiving area can be accessed during all anticipated weather conditions, and feedstocks can be removed or processed on a regular basis (rather than accumulating and leading to nuisance conditions). The receiving area should have a slope of between 0.5 and 2%, and surface water 10-2 10. Common Supporting Infrastructure runoff should be captured for treatment. Environmental regulations also often require that outdoor receiving areas be constructed overtop an environmental liner (e.g., clay or synthetic material) to protect groundwater resources. Enclosed Receiving Areas As a result of the potential for some feedstocks (e.g., food waste) to generate odours and/or to attract birds and wildlife, it may be beneficial for the receiving area to be partially or fully enclosed within a building. There are a number of building types that can be used, ranging from wood frame and fabric-style buildings, to engineered metal structures. The style of building used is a function of the amount of interior space needed, interior clearance requirements, ventilation design for odour capture, and corrosion protection. Designing the receiving building so that delivery vehicles can be completely indoors with access doors closed when unloading significantly reduces the risk of odour releases. However, this approach does increase the size and cost of the building, particularly if it must be designed to accommodate large tractor-trailer units that are typically used to transport materials from transfer stations. The concept of using two doors to create an “airlock” that delivery vehicles must pass through to enter the receiving building is another means of reducing the risk of odour emissions. However, these types of systems also increase the size and complexity of the building, and its construction cost. Overhead doors that open and close quickly are a recommended feature that should be incorporated into receiving buildings. Whenever the overhead doors are opened, the ability of ventilation systems to prevent odorous air from leaving the building is severely compromised. Using doors that can be opened or closed in 15 seconds or less can help to significantly reduce the impacts on ventilation systems, and also reduce delivery vehicle unloading times. Air curtain technology has become a popular means of balancing structural design and construction costs with the need for odour containment at organic waste processing facilities. An air curtain system consists of a fan and ducting system installed along the top frame of overhead doors. The system blows air downwards at a high velocity over the entire width of the door opening, and creates an invisible barrier that prevents interior air from leaving and exterior air from entering. Some facility operators also claim that the high-velocity air current also deters birds from entering the facility through open doors. Photo 10-3: Engineered steel frame receiving building © CH2M HILL Photo 10-4: Rapid-cycle rubber overhead doors used at a composting facility © Scott Gamble Enclosed Receiving Area Considerations ■ Reduces the potential for birds and animals to be attracted to the facility ■ Increases the ability to contain and manage odours ■ Allows litter to be contained and better managed ■ Helps to reduce contaminated stormwater quantities and treatment requirements ■ Improves working conditions and operator comfort during the winter ■ Enclosures increase the capital cost of the facility ■ Fire detection and sprinkler systems are normally required within an enclosed receiving building Photo 10 5: Air curtain installed overtop an overhead door © CH2M HILL 10-3 10. Common Supporting Infrastructure Floors within enclosed receiving areas are normally constructed of concrete, although it may be feasible to use asphalt. In either case, the floors should be sloped away from doors so that any leachate that escapes from feedstocks is contained within the building. Floor drains can collect leachate and direct it to storage tanks, but drains are prone to clogging and can become an ongoing maintenance issue. Absorbing leachates with dry feedstocks, woodchips, or compost, and then composting the absorbent may be a preferable method of managing leachate. 10.2 Amendment Storage Area The amendments typically used at municipal processing facilities, such as straw, woodchips, and sawdust, are normally high in carbon and have a low moisture content, and can be stored outdoors without producing odours. However, it may be necessary to provide some type of containment or enclosure to prevent these amendments from getting wetted by precipitation or carried away by strong winds. Depending upon climatic and hydrogeological conditions, providing a liner system under amendment storage areas to prevent groundwater impacts may be necessary. Amendment Supply Considerations ■ Maintain an ample supply of dry amendments to ensure sufficient material is available to mix with unexpected surges in wet feedstock delivery. ■ Dry amendments can also be used to soak up liquids that leach from feedstocks in the receiving area, as well as leachate, digestate, or other liquids that are spilled around the facility. Amendment Storage Area Considerations ■ Enclosed storage areas keep amendments dry, which increases their usefulness in adjusting the moisture content of wet feedstocks. ■ Enclosures contain dust and prevent amendments from blowing offsite. ■ Enclosures add to the capital cost of the facility. ■ Fire detection and sprinkler systems may be required within an amendment storage building. Amendments such as woodchips, straw, and paper are flammable. Local building codes and bylaws may contain specific requirements, including maximum pile heights, and volumes and separation distances between piles. The need for fire detection and sprinkler systems must also be considered and incorporated into facility design. 10.3 Compost Curing Area At facilities that use enclosed or in-vessel composting technologies, curing activities normally take place in a separate, outdoor area. At outdoor composting facilities, curing often takes place at the same location as active composting for convenience and to reduce material handling requirements. When curing and active composting areas are separated, they should be located up-slope so that drainage from receiving and active processing areas does not flow into or through the curing area. Like outdoor receiving areas, the working surface in outdoor curing areas should be designed to meet the expected wear and tear from site equipment, including wheel loaders and trucks. Although concrete and asphalt are the most desirable working surfaces, their capital costs can be prohibitive. Therefore, curing pads are often constructed of gravel, crushed concrete, lime- or cement-stabilized soil, or asphalt millings. Clay working pads covered with a layer of topsoil or woodchips have also been used. Curing 10-4 10. Common Supporting Infrastructure areas are most often underlain by a clay or synthetic liner system for groundwater protection. Curing pads should also have a slope of between 0.5 and 2% to promote drainage. It is important to ensure that windrows and piles are oriented in the same direction as the pad’s slope to prevent blocking the flow of runoff and leachate draining from one pile into an adjacent pile. 10.4 Figure 10-2: Windrow layout in a curing pad Windrows should always be oriented in the same direction as the pad slope so drainage is not blocked Finished Compost Storage Area Finished compost should be stored away from operating areas so that it is not contaminated by incoming feedstocks or surface water runoff from active composting and curing pads. Ideally, the product storage area is also easily accessible by customers; they should not have to drive through operating areas to access the storage area, as this increases safety risks. The storage area should have graded surfaces (e.g., sloped at 0.5 to 2%) that promote drainage and prevent water from ponding, which can raise the product’s moisture content (and affect sales efforts) and/ or result in anaerobic conditions and odours. The product storage area should also have a working surface consisting of a strong sub-base and base material that is able to support the weight of wheel loaders and trucks without rutting. Large ruts can limit vehicle access and can lead to further water ponding. The size of product storage areas is a key consideration and is normally determined by the facility’s production cycle and the demand for compost over the year. Consider the following when designing storage areas: • • Market cycle information (i.e., how much product is sold during each month of the year), in combination with the facility’s anticipated monthly or weekly production output, is used during the facility design stage to determine storage requirements. The form in which products are sold affects storage space requirements. When compost products are sold in bulk, they can be stored in large stockpiles that maximize space utilization. However, if products are bagged and palletized, the amount of required space increases significantly, since pallets holding bagged compost cannot be stacked. Photo 10-6: Water ponding in a compost facility’s product storage area can affect access and lead to odours © CH2M HILL 10-5 10. Common Supporting Infrastructure 10.5 Residuals Storage Areas It is common for feedstocks collected through the residential and commercial source-separated organics collection programs described in Chapter 12 to contain between 5 and 10% unacceptable materials by weight. These nonorganic materials must be removed from the feedstocks, and sent to a landfill or waste-to-energy facility for disposal. As outlined in Chapters 3 and 4, these unacceptable materials (e.g., plastic and metal containers and plastic bags) can be removed from the feedstocks at various points during the composting and anaerobic digestion (AD) processes. Where possible, residuals should be removed during the feedstock recovery and preprocessing stages so that the quality of finished products is not impaired. Photo 10-7: Enclosed roll-off containers can be used to contain litter and residuals from preprocessing and screening operations © CH2M HILL Once these unacceptable materials are removed, they should be stored in roll-off containers, in concrete lock-block bunkers, or through some other means that prevents litter. The size of containers and bunkers should be chosen to prevent more than two or three days’ worth of material from accumulating; this forces a frequent disposal schedule and helps to prevent odours. 10.6 eachateandEffluentManagement L Infrastructure Leachate is the highly contaminated liquids that drain from feedstock stockpiles, active composting and curing piles, and residual piles. Effluents may also be generated within processing tanks and vessels.1 Proper control and management of leachate is necessary to prevent releases of harmful substances to the environment that could result in adverse effects. Leachate and Effluent Sources ■ High Strength: ■ Runoff from feedstock stockpiles ■ Condensate and leachate from aeration systems and process aircooling systems ■ Effluent from dewatering operations ■ Water from equipment and floor washing ■ Drainage from biofilters Designers and operators should focus on separating leachates into low-strength (i.e., less contaminated) and high-strength (i.e., more contaminated) leachate. This allows for more flexibility in treatment and disposal options; it is generally more cost-effective to treat smaller volumes of a high-strength leachate than larger volumes of low- to moderate-strength leachate. 1 ■ Sewerage from staff washrooms and showers ■ Low Strength: ■ Runoff from curing pads and product storage areas ■ Runoff from outdoor amendment storage areas Some AD technologies produce digestate that has a very low solids content (less than 10%) and that is normally dewatered prior to further handling and treatment. The effluent generated by the dewatering process is referred to as centrate. Digestate and centrate, which are discussed in further detail in Chapters 4 and 6, are normally distinguished from leachate. 10-6 10. Common Supporting Infrastructure Where high-strength leachate is collected separately, it may be beneficial to store the leachate in underground or aboveground tanks. High-strength leachate can be a significant source of odours, and it is much easier to collect odorous air from the vents of a tank than it is from an open-air detention pond. As discussed in Chapters 3 and 4, reuse of leachate within the AD and composting processes is a common practice. However, it may not be possible to reuse all of the leachate generated. Therefore, treatment options, including onsite treatment, discharge to sanitary sewer systems, or offsite disposal at a wastewater treatment facility, should be investigated during the planning and design processes. The choice of management option, and the associated costs, depends on nutrients and contaminant concentrations, as well as provincial and municipal regulations. 10.7 Photo 10-8: Underground sumps and tanks are commonly used to collect and store high-strength leachate © CH2M HILL Contaminated Stormwater Management Infrastructure Contaminated stormwater includes surface water runoff and roof drainage that has come in contact with leachate, feedstocks that are stored or processed outdoors, and residuals. Since it has the potential to contain contaminants (albeit in lower concentrations than leachate), this runoff needs to be managed to prevent environmental impacts. It is a good practice to assume that any stormwater runoff from outdoor feedstock and amendment receiving (and storage) areas, processing areas, and residual storage areas is contaminated, so design and operate the facility accordingly. Leachate and Effluent Considerations To reduce the quantity of highstrength material that needs to be treated, leachate and effluents should be segregated and managed separately from contaminated stormwater. Capture and collection of contaminated stormwater requires some combination of site grading, swales, ditches, curbs and gutters, and catch basins. If catch basins are to be used, consideration should be given to sediment and debris traps, since there is a higher likelihood that material will accumulate in the catch basins and associated underground lines. Contaminated stormwater is generally collected in retention ponds where it can be tested prior to being released. At a minimum, these design ponds should be capable of managing the flow from a 1-in-25-year, 24-hour storm event. Lining retention ponds with engineered clay liners or synthetic materials to prevent seepage and possible groundwater impacts is a common requirement. It may also be beneficial to aerate the ponds with pumping systems or paddlewheels to reduce the levels of biodegradable organic contaminants in the stormwater. Reusing contaminated stormwater within the AD and composting processes is a widespread practice that is used to minimize the need for using potable water in processing operations. Photo 10-9: Contaminated stormwater is commonly collected in retention ponds and is reused in the treatment process © CH2M HILL 10-7 10. Common Supporting Infrastructure 10.8 Uncontaminated Stormwater Management Infrastructure Stormwater runoff that does not come into contact with feedstocks, such as from building roofs and parking lots, is normally considered to be clean and requires no special management prior to being released to the environment. Designers should focus on providing infrastructure that prevents clean stormwater from mixing with contaminated stormwater and leachate. Infrastructure, such as ditches, swales, berms, or other conveyance methods, can be effectively used as part of the site development. Provisions for capturing or diverting roof drainage from eave troughs and downspouts should also be considered. Contaminated Stormwater Pond Considerations ■ Providing additional capacity in stormwater retention ponds increases operational flexibility by ensuring there is always a source of water for process needs. ■ Stormwater ponds can also be a source of water for washing equipment and extinguishing fires. Even through stormwater may be considered uncontaminated, there is the potential for sediments to become entrained in the water as it flows through the site and drainage ditches. As a result, it may be necessary to remove stormwater sediments using filter berms or settling ponds. 10.9 Additional Infrastructure Requirements Depending upon the site and location of the processing facility, there may be additional infrastructure required. If the processing facility is located at an existing waste management facility (e.g., landfill or recycling centre) or public works yard, it may be possible to share existing infrastructure. Additional infrastructure that may be required includes: • • • • • • Photo 10-10: Filter berms and bioswales can be a cost-effective way to remove sediments from uncontaminated stormwater © Scott Gamble Weigh-scale systems to track the quantities of incoming feedstocks and provide a basis for charging customers Shower and locker facilities, and break rooms for site staff Office areas Warehouse area for storage of spare parts Maintenance area Onsite fuelling station Photo 10-11: Water from roof drains should be directed around operating areas to minimize the quantity of contaminated surface water that has to be collected and treated © Scott Gamble 10-8 11. Common Supporting Equipment Regardless of the type of technology used, most organic processing facilities rely heavily on a combination of mobile and stationary equipment to handle materials, mix feedstocks, screen product, and move material through the process. At facilities with large volumes of material to handle (e.g., more than 20 000 tonnes [t] of source-separated organics [SSO] per year), equipment selection considerations related to productivity are as important to the success of the project as process considerations. This chapter discusses the range of supporting equipment commonly used at organic waste processing facilities, including: • • • • • 11.1 Section 11.1, Front-End Loaders Section 11.2, Mixing Equipment Section 11.3, Screening Equipment Section 11.4, Size-Reduction Equipment Section 11.5, Conveyor Systems Front-End Loaders Front-end loaders, also called wheel-loaders, are a key piece of equipment used at most organic waste processing facilities. They can be used for a wide variety of tasks, including: • • • • • • • Moving feedstocks and other materials Loading and unloading vessels Building windrows and stockpiles Turning and agitating piles Loading composting into screening equipment Loading finished compost product onto trucks Scraping and cleaning paved surfaces Photo 11-1: Front-end loaders are the workhorse of the organic waste industry © CH2M HILL Front-end loaders are available in a wide variety of sizes, ranging from 50 to 1600 horsepower (hp). The larger models are rarely used in the solid waste industry and are generally used in the mining industry. Front-end loaders in the 100- to 250-hp range are most commonly used at organic waste processing facilities. 11-1 11. Common Supporting Equipment To avoid constraints and material handling bottlenecks, processing facility layout should always be developed with the size and capabilities of the loader in mind. For example, receiving areas should have sufficient room for the loader to manoeuvre and turn, even when the receiving area is full of feedstocks. When front-end loaders are used inside buildings, ensure enough overhead clearance so that the loader’s bucket in the raised position avoids roof beams, fire sprinkler systems, lights, and other building components. It is also important to match the size of the front-end loader to other facility equipment. For example, a large-capacity front-end loader can easily overload grinding or screening equipment, causing a reduction in performance. Photo 11-2: Front-end loader equipped with a roll-out bucket, which significantly enhances reach and versatility © CH2M HILL Careful consideration should also be given to bucket size and style. There are many bucket options available, and the standard bucket size and type with which loaders come equipped is not usually the best choice for organic waste processing operations. Table 11-1 provides a comparison of different bucket types. Table 11-1: Front-end loader bucket type advantages and disadvantages Bucket type Advantages Disadvantages General purpose • Does not hamper visibility • Not efficient for handling lightweight materials • Can be used to handle gravel and sand without risk of exceeding loader’s lifting capacity Oversized • Allows for greater productivity when handling lightweight materials • Rear counterweights may be necessary to offset the extra weight of the bucket • Larger bucket can hamper visibility • When dense materials are being handled (e.g., gravel and topsoil), loader’s lifting capacity can be exceeded Roll-out • Allows for loading of screens, mixers, and trucks without the use of ramps • Extra weight of bucket makes rear counterweights necessary • Requires additional operator training • When dense materials are being handled (e.g., gravel and topsoil), loader’s lifting capacity can be exceeded 11.2 Mixing Equipment Several types of mixers are available and suitable for mixing high-moisture feedstocks, such as food waste with amendments (see Table 11-2 for a mixing equipment comparison). These mixers generally consist of a hopper with a mixing mechanism mounted on a vertical or horizontal shaft. These mixing units are not normally used for processing leaf and yard waste unless it has been pre-ground and is being used as an amendment material. 11-2 11. Vertical mixers typically have one to two 1- to 1.5-metre (m)diameter augers mounted in the base of a large, open-topped, mixing hopper. Materials are loaded in the hopper using conveyors or a front-end loader, and blended for a period of about 5 to 10 minutes. Once mixed, the materials are discharged through a door on the side of the mixing hopper. Horizontal mixers used in organic processing include pug mills, plow mills, and auger mixers. Pug mills and plow mills are similar in that they have a single horizontal shaft from which mixing arms extend radially. The ends of the mixing arms in pug mills have paddles affixed to them, while plow mills have a plow-shaped blade at the end of the mixing arm that tends to lift and roll the materials. Common Supporting Equipment Photo 11-3: Vertical auger mixing unit © Scott Gamble Photo 11-5: Horizontal auger mixer © CH2M HILL Photo 11-4: Augers inside a vertical mixer © Scott Gamble Photo 11-6: Top view of augers inside a horizontal mixer © CH2M HILL Auger mixers consist of three or four augers arranged horizontally and at different heights. Materials are loaded in the top, and mixing is achieved through the combined effect of the turning action of the augers and gravity pulling materials downward through the mixing chamber. Table 11-2: Mixing equipment advantages and disadvantages Equipment type Advantages Disadvantages Vertical mixers • Blending takes 5 to 10 minutes • Batch operation—requires a set quantity of materials to be loaded, mixed, and unloaded before additional material can be processed • Does an excellent job of shredding any wet and wax-coated cardboard included in the feedstocks • Available as stationary units or can be truckor trailer-mounted • Not suited to processing feedstocks containing large pieces of wood (tree limbs or trunks, pallets) • Well-suited for food waste processing Horizontal mixers • Continuous-flow operation • Higher initial cost (pug and plow mills, horizontal auger mixers) • Materials are continuously metered in a controlled fashion • Not well-suited to processing feedstocks with a high proportion of food waste • Not suited to processing feedstocks containing large pieces of wood (tree limbs or trunks, pallets) 11-3 11. Common Supporting Equipment 11.3 Screening Equipment Screening equipment is typically used in the latter stages of the compost curing process to remove rocks, large wood particles, and other unwanted materials from finished compost, and to meet enduser particle size requirements. Screens can also be used at composting and anaerobic digestion facilities during the pre-processing stage to open bags and remove large contaminants and plastics from feedstocks prior to further mixing and processing. The two main types of screening equipment used in organic waste processing facilities are trommel screens and star screens. Both screen types are available as mobile or stationary units. Other screening systems are available and are used extensively in gravel and mining operations. However, these have not been found to perform well with organic feedstocks and compost, which tend to be wetter and more cohesive. Trommel screens consist of a rotating horizontal drumshaped frame that ranges in size from 1.25 to 2.5 m in diameter and 3 to 11 m in length, around which screens are wrapped. During operation, the drum rotates between 5 and 25 rotations per minute (rpm), and unscreened material is conveyed into the drum’s interior. The combination of the drum rotation and a slight incline moves material down the length of the drum towards the discharge end. As the materials travel along the drum, small particles fall through the screens and are caught on a conveyor belt below. Larger materials continue through the drum and fall out of the discharge end onto a separate conveyor. Trommels used on finished compost normally use screens made from welded wire mesh, which are relatively inexpensive and can be easily removed and replaced with mesh with different-sized openings. Trommels used in feedstock recovery and preparation stages generally have punched screens; the screen openings are cut into curved steel plates that are subsequently bolted or welded onto the trommel drum’s frame. 11-4 Photo 11-7: Trommel screen: Oversize materials fall from the drum onto the left conveyor, and fine materials fall through the screen and are discharged off the conveyor to the right © CH2M HILL Photo 11-8: Top view of a series of shafts with rubber stars in a star screen (material flow is from left to right across the deck) © CH2M HILL Photo 11-9: View of an individual star from a star screen © CH2M HILL 11. Common Supporting Equipment A star screen consists of a screening deck comprising a number of rotating shafts oriented perpendicular to the flow of material. The shafts are equipped with a number of 6- to 12-pointed rubber stars that have a tip diameter in the range of 10 to 15 centimetres (cm). The stars on adjacent shafts are offset to create an interlocking pattern. During operation, the shafts/stars rotate at 200 to 300 rpm, and small particles fall through the spaces created between stars onto a conveyor belt. Larger particles bounce along on tips of the stars until they travel the length of the screening deck and fall off onto a separate conveyor. Because of their low profile (i.e., in the range of 50- to 100-cm high), two star screens can be placed one overtop the other, for a three-way particle size split (i.e., undersized, mid-sized, and oversized). Achieving the same three-way split with trommel screens would take two units operated in series; the undersized fraction from the first feeding into the second unit, or the materials would have to be screened twice through the same unit using smaller screens the second time through. Table 11-3 provides a screen equipment comparison. Table 11-3: Screening equipment advantages and disadvantages Equipment type Advantages Disadvantages Trommel screen • Available as portable or stationary units • Screening performance is reduced when handling materials with moisture content greater than 50% • Ability to change screens increases versatility Star screen • Can be used during SSO feedstocks preprocessing • Changing screens can take several hours • Cutting teeth can be added to the inside of the drum so it can be used as a bag opener • Three-way particle size split normally requires two trommels set up in series (large footprint) • Available as portable or stationary units • Higher maintenance costs • Able to handle materials with a higher moisture content (~50%) without screening performance suffering • Variability of screening size is limited • Not generally suitable for SSOpreprocessing applications • Minor adjustments to effective screen size can be made simply by varying the rotation speed of the stars from the control panel • Two star screen decks can be placed one overtop the other to obtain a threeway particle size split without significantly increasing space requirements 11.4 Size-Reduction Equipment Although there are other variations, the three types of equipment most commonly used in the organic waste processing industry to reduce the particle size of feedstocks and amendments are tub grinders, horizontal grinders, and shear shredders. These units are mainly used to reduce the size of wood, stump, log, and brush materials. However, they also provide a degree of mixing when smaller quantities of food and/or grass are processed along with these materials. Table 11-4 provides a comparison. 11-5 11. Common Supporting Equipment Tub grinders are easily recognizable by their large rotating tub into which materials are loaded with a frontend loader or excavator. A hammermill sits inside the tub at its base and does the actual grinding. The rotation of the tub serves to move and force the materials against the hammermill. Once the material has been ground down to the desired size, it falls through grates at the bottom of the tub, onto a conveyor belt that transfers materials into a stockpile next to the machine. Horizontal grinders also use hammermills or fixed knife mills to grind materials, and a set of grates to control particle size. Horizontal grinders have a large, horizontal, conveyor system that moves material laterally towards the mill. Immediately in front of the mill is a large, cleated, feed drum that grabs materials and forces them against the mill. The grinding chamber itself is fully enclosed within the machine. Shear shredders differ significantly from tub and horizontal grinders. Rather than a single, high-speed hammermill, the shear shredder uses pairs of counter-rotating shafts that contain a number of cutting discs, and operate at a much lower rpm. Materials are loaded into a hopper above the shredder’s cutting discs, and teeth spaced around the circumference of the discs grab and pull materials down into the shredder. As material passes down between the discs, it is sheared into smaller pieces and falls onto a conveyor belt below the machine. Photo 11-10: Tub grinder © CH2M HILL Shear shredders used for organic processing typically have two or four shafts. The nature of the grinding action and the slower operating speed makes shear shredders more appropriate for handling mixtures containing large quantities of food wastes. Photo 11-11: Horizontal grinder © CH2M HILL Photo 11-13: Shredding units are common in SSO processing facilities © CH2M HILL Photo 11-12: View of conveyor and grinding chamber of a horizontal grinder © CH2M HILL 11-6 Photo 11-14: Cutting shafts inside a shear shredding unit © Scott Gamble 11. Common Supporting Equipment Table 11-4: Grinder and shredder equipment advantages and disadvantages Equipment type Advantages Disadvantages Tub grinder • Range of manufacturers and sizes available • Less appropriate for processing feedstocks with a large proportion of food waste • In most regions, private companies can provide grinding services using this equipment on a contract basis Horizontal grinder • Range of manufacturers and sizes available • In most regions, private companies can provide grinding services using this equipment on a contract basis Shear shredder 11.5 • Nature of the grinding action and the slower operating speed is more appropriate for handling food waste or mixtures containing high proportions of food waste • Material can be ejected from the top of the tub, creating a safety hazard • Less appropriate for processing feedstocks with a large proportion of food waste • Private companies with mobile units are less readily available Conveyor Systems Heavy-duty horizontal or inclined conveyors provide a means of increasing productivity at organic waste processing facilities. Most often, conveyors are used to move feedstocks and amendments between stationary processing equipment, allowing for a single loading point for materials, rather than having to pick up the discharged material from one machine and load it into the next machine. When materials are spread over an area that is several hectares (ha) in size, conveyors can also be used instead of front-end loaders and/ or trucks to transport the materials to a central processing area. For example, a large-scale windrow composting or curing operation can use a conveyor system instead of requiring operators to haul materials from point to point with a front-end loader or trucks. Careful design, including consideration of ease of cleaning conveyor components and spillage from under conveyors, significantly reduces the maintenance associated with conveyor systems. Photo 11-15: Conveyor belts provide efficiencies in moving large quantities of materials within a processing facility © CH2M HILL Stacking Conveyors Stacking conveyors are a type of conveyor system used to create large, conical stockpiles of materials. By increasing stockpile height, stacking conveyors provide a cost-effective way to place and store large volumes of finished product or amendments in a relatively small area. Stacking conveyors also create stockpiles with a lower exposed surface area to volume ratio, which helps to limit the quantity of precipitation absorbed into stockpiled materials during wet weather, or alternatively reduce the quantity of moisture lost during hot weather. 11-7 11. Common Supporting Equipment Stacking conveyors are described by the length of the conveyor belt; 18-, 24-, and 30-m conveyers are typical. The height and volume of the stockpile created by a particular stacking conveyor depends on the angle of the conveyor, as well as the materials’ natural angle of repose. A variation of the mobile stacking conveyor is a radial stacking conveyor. The wheels on this type of conveyor allow it to pivot around its base, as well as move backwards. The result is that an operator can create an initial semicircular stockpile by pivoting the conveyor. In higher-end equipment, the radial movement of the conveyor system can be controlled by remote control, meaning that operators do not have to stop their activities to move the conveyor manually. Photo 11-16: Stacking conveyors allow for the creation of large stockpiles with a small footprint © CH2M HILL Photo 11-17: Radial stacking conveyor © Scott Gamble 11-8 12. Collection Programs Although much of this Technical Document focuses on processing source-separated organics (SSO), it is equally important that municipalities consider collection methods. As outlined further in Chapter 18, the method of collection can influence the design of the processing facility (in particular, the receiving area) and the choice of preprocessing methods. SSO collection programs are summarized in Table 12-1 and are further discussed in the following sections: • • • • Section 12.1, Drop-Off Depots Section 12.2, Community Collection Sites Section 12.3, Curbside Collection Programs Section 12.4, Collection Considerations Processing facility infrastructure and preprocessing methods has been previously discussed in Chapters 3, 4, and 11. A further discussion of system development and evaluation is provided in Chapter 18. Collection Program Terminology Participation rate is the measure (in percent) of the number of waste generators who chose to take part in the collection/diversion program. Capture rate is the percentage of the available material that program participants divert. Diversion rate is the percentage of the total available material that is diverted through the program. It can be theoretically calculated from participation and capture rates. For example, if 60% of residents participate and capture 80% of their organics, the overall diversion rate is 48%. Diversion rates can also be measured through a waste composition study to determine how much of a particular material remains in the municipal solid waste stream (i.e., how much is not diverted). Table 12-1: SSO collection program summary Method Typical diversion rates Types of feedstocks Drop-off depots 10 to 25% L&YW Community collection sites 10 to 25% Food waste, L&YW Curbside collection 50 to 75% Food waste, L&YW Notes: L&YW—leaf and yard waste 12.1 Drop-Off Depots Constructing one or more centralized drop-off depots is generally the least expensive method available to large and small municipalities for collecting organic wastes. However, they rarely capture more than 50% of the available materials, and diversion rates of less than 25% are more common. Drop-off depots are also generally not appropriate for collection of SSO that contains food waste. Drop-off depots vary widely in terms of their level of sophistication. At the lowest end of the spectrum are depots that consist of a Photo 12-1: L&YW is stockpiled outdoors on a prepared base at this outdoor dropoff depot © Scott Gamble 12-1 12. Collection Programs prepared pad where materials are dumped in a single, large pile. At the opposite end of the spectrum are facilities with paved areas that contain designated containers or bunkers for different materials (e.g., grass and leaves, shrubs and branches, large branches, and logs and stumps), and which have specific traffic flow patterns. The latter style of depot tends to be used at sites with higher traffic volumes. Bunkers generally help to maintain a cleaner-looking site and piles, and can be constructed from wooden timbers, railway ties, old telephone poles, concrete highway barriers, or cast-in-place concrete. The use of pre-cast concrete “ecology-blocks” is also very common; these blocks can be reconfigured or reused for other purposes. When piles and bunkers are used, there is no need for specialized trucks, so the dump trucks used by most municipalities can transfer materials from the depot site to the processing facility. If large volumes of material are collected and/or the hauling distances are 50 kilometres (km) or more, it may be more economical to use a walking floor trailer rather than a dump truck. Walking floor trailers have a capacity in excess of 75 cubic metres (m3), compared to 5 to 10 m3 for a typical dump truck. Photo 12-2: Bunker: ecology-blocks used at an L&YW drop-off depot © CH2M HILL Photo 12-3: Roll-off containers used at an L&YW drop-off depot © CH2M HILL The use of roll-off containers at drop-off depots is also common, and equally functional. However, stairways/ walkways or retaining walls are normally required so that site users can safely lift and deposit materials into the container without risking back injuries. Table 12-2 provides a drop-off depot program overview. Table 12-2: Drop-off depot advantages and disadvantages Advantages Disadvantages • Least costly alternative • Low diversion rate (less than 25%) due to low participation and capture rates • Appropriate for L&YW and woody materials, such as brush, clean white wood, and Christmas trees • Not as convenient as curbside collection programs • When piles and bunkers are used, there is no need for specialized collection trucks • Not suited to putrescible organic materials, such as food waste, due to odour and vector issues • When roll-off containers are used, double-handling associated with loading materials from the ground or a bunker into a dump truck is eliminated • When walking floor trailers are used to transfer materials from the depot to the processing facility, a ramp may be required to safely load the trailer • Roll-off containers provide a higher level of containment • Roll-off containers require that a specialized bintruck be purchased, or that the transfer service be contracted out • Stairways and walkways, or retaining walls with barricades, may be needed for safe loading of roll-off containers 12-2 12. 12.2 Collection Programs Community Collection Sites Rather than providing one or two larger centralized drop-off locations, a municipality can choose to provide several smaller drop-off sites located at a neighbourhood level throughout the community. This allows sites to be located closer to waste generators, making them more convenient to use. Theoretically, the higher level of convenience should result in higher participation rate and greater diversion than a program based on drop-off depots. However, there is limited experience with community organic waste collection sites, and participation and diversion rates are not readily available. Photo 12-4: Community collection bins used to collect food waste © CH2M HILL These neighbourhood sites typically consist of some form of waste container, such as oversized wheeled carts, or 2- to 4-m3 commercial front-end waste containers. If food waste is included, the collection containers must be animal-proof. Since the containers are small, they must be emptied frequently (e.g., two to four times per week) to prevent them from overflowing and becoming unsightly. An increased collection frequency is also required to prevent odours. Depending upon the style of container, community depot sites can be located in parking lots at municipal facilities (e.g., parks, sports fields, skating arenas, and swimming pools) or even at the sides of roads with appropriate shoulders for safe access. Because of traffic and odour potential, locating containers on roadways in residential areas may result in complaints from nearby residents. Table 12-3 provides a community collection site program overview. Table 12-3: Community collection site advantages and disadvantages Advantages Disadvantages • Sites can be located closer to waste generators, making them more convenient and increasing participation • Potential for odours and attraction of animals • Higher collection frequency enables collection of food wastes • Limited to no site preparation required 12.3 • Siting on roadways in residential areas may result in complaints from nearby residents due to traffic and odours • Depending on container, specialized collection trucks may have to be purchased, or the service contracted out Curbside Collection Programs Curbside collection of organic waste from residential sources can significantly increase diversion rates by making the service more convenient; thus, increasing program participation and capture rates. In established programs with regular weekly service, consistent participation rates of 80 to 90%, and diversion rates of 75%, are achievable. 12-3 12. Collection Programs Curbside collection programs are well-suited to collecting L&YW and food waste, either separately or together. As discussed further in Section 12.4, the curbside collection program can be based around the use of bags or carts. However, curbside programs are not well-suited to the collection of bulky yard wastes, such as tree limbs, logs, stumps, or sod. These materials are often banned from curbside collection programs, or strict limitations are put in place (e.g., maximum diameter and length of tree limbs, weights of bags or carts, or requiring limbs to be tied in bundles). Photo 12-5: Dual-compartment truck that can be used to collect two different materials © CH2M HILL Although curbside programs can increase diversion rates, they come at a substantially higher cost than maintaining and operating a network of drop-off depot and community collection sites. Costs for curbside collection programs vary depending on the frequency of collection, the number of households, and the distance to/from processing facilities. There are many scheduling variations for curbside SSO collection programs. For programs including food waste, collection is provided on a weekly basis throughout the year, or weekly collection during the spring, summer, and fall, with biweekly collection in the winter. For programs that only include L&YW, regular curbside service is provided (e.g., weekly or biweekly) during the growing season, or periodically (e.g., once a month, or only in the spring and/or fall). The choice of collection schedules affects the size and design of the receiving area/building at the processing facility. There are also variations in the type of trucks that are used for curbside programs: single-compartment versus dual-compartment trucks, and manually loaded trucks versus trucks with automated lift arms. The choice of truck depends on collection schedules and frequency, what materials are being collected, and the destination of the materials. For example, co-collecting L&YW with waste in a dual-compartment truck during the winter months when there is little to no L&YW would not provide a good financial return on the investment in this specialized truck. However, co-collection of organic waste and recyclables/garbage in a dual-compartment truck may be cost-effective if the processing facilities for the two materials are located close together. Similarly, diversion programs that collect only food waste are more amenable to manually loaded trucks, while programs that collect food waste and L&YW together tend to use fully or semiautomated trucks to prevent back strain and other collection staff injuries. Table 12-4 provides a curbside collection program overview. Table 12-4: Curbside collection advantages and disadvantages Advantages Disadvantages • Suitable for L&YW and food wastes • Not well-suited to collection of bulky yard wastes • Higher diversion rates typically achieved due to high participation rate • Substantially higher cost than maintaining and operating a network of drop-off sites • Collection services can be contracted out to avoid having to purchase collection trucks • Semi-automated or automated collection trucks may be required to avoid collection staff injuries 12-4 12. 12.4 Collection Programs Collection Considerations 12.4.1 Bag-Based Collection Programs Bag-based programs provide a convenient option for both residents and municipalities, since bags are readily available at retail stores. Bag-based programs require manual collection; thus, equipping collection trucks with specialized lifting arms is also not required. This means that smaller municipalities may be able to set up a collection schedule that allows the same collection trucks to be used for garbage and organics pickup, thereby avoiding fleet expansion. Both paper and plastic bags can be used in curbside collection programs. Paper bags are generally more appropriate when the feedstocks are limited to L&YW. Kraft paper bags are available for roughly the same cost as large plastic bags. These paper bags have the benefit that they can be incorporated directly into the composting process and will normally degrade without affecting product quality. In a typical outdoor windrow composting operation, there is no need to open bags or otherwise preprocess the feedstocks; the bags will rip open during windrow turning. Photo 12-6: Paper bags provide an alternative to plastic bags for organic material collection © CH2M HILL Compostable Plastic Bags— Certification Program BNQ 9011-911/2007 Since 2007, all bags marked as “compostable” in Canada must conform to a national protocol based on a specific amount of degradation within a specific time frame (e.g., 90% in 84 days). On the other hand, using plastic bags creates the need for some form of preprocessing to debag feedstocks and separate them from the plastic. If plastic bags are not removed during the preprocessing step, compost quality will be negatively impacted, and wind-blown plastic can lead to litter problems. Depending upon the volumes of materials, opening bags and separating them can be done manually or mechanically. Typically, bag opening at smaller sites is done by a crew of labourers equipped with knives. At large facilities, mechanical bag-opening equipment may be warranted. For moderately sized programs that already use a trommel screen, it may be feasible to retrofit the trommel to act as a bag opener. Regardless of the means used to open bags, there is a high likelihood that not all of the plastic will be removed, and that physical contamination of the finished compost product will result from small pieces of film plastic left behind. In response to the problems associated with plastic bags, the plastic industry has developed compostable plastic bags made from resins that break down during the composting process. While the bags may not fully degrade, they do help with physical contamination issues, and are becoming more widely used in SSO collection programs. Plastic bags that are marketed as being compostable must undergo testing and certification to ensure they meet the national standard for degradability during the composting process. Photo 12-7: Bags and other plastic contamination can become tangled in windrow turners and are very difficult to remove © Scott Gamble 12-5 12. Collection Programs Despite the improvement of compostable plastic bags, some municipalities have chosen to ban them from their collection programs because there is a concern residents may not wish to spend extra money for compostable bags, and will, instead, use regular plastic bags that compromise feedstock quality. Another concern is that since compostable bags are relatively new to the marketplace, residents might not understand the difference and continue to use the less expensive, noncompostable bags, once again compromising feedstock quality. Table 12-5 provides a bag-based collection program overview. Table 12-5: Bag-based collection program advantages and disadvantages Advantages Disadvantages • Bags are readily available at retail stores, making participation convenient • Heavy bags of wet green grass and/or food waste can expose collection workers to risk of back strains and injuries • No special collection vehicles required • Noncompostable plastic bags can cause operational and litter problems in composting facilities • Plastic bags can lead to contamination of the compost products produced; materials must be debagged as part of the preprocessing step 12.4.2 Cart-Based Collection Programs Collection of organic wastes, garbage, and recyclables using standardized, wheeled carts is becoming more commonplace in Canada. Cart-based collection programs for organics eliminate many of the problems associated with plastic-bag-based collection, and when combined with automated or semi-automated collection trucks, allow for increased collection productivity. Carts for organics are available in a number of sizes, ranging from 50 to 360 litres (L). Popular cart sizes used in North American organics collection programs are 80, 120, 245, and 360 L. Smaller carts (i.e., 50 and 80 L) can be collected manually. Larger carts required the use of automated or semi-automated lifting arms on the collection truck. Choosing the appropriate cart size is often based on waste statistics, collection program pilot testing, and resident surveys. The range of sizes available allows a municipality to choose a cart that matches its program’s collection frequency, waste generation rates, resident preferences (e.g., availability of space to store carts, ability to physically move carts when they are full), and the type of material being handled (e.g., L&YW, food waste, or both). A common concern expressed by municipalities in Canadian climates is the potential for organic materials to freeze in the carts during winter months. While freezing is certainly a reality, it has been shown to be manageable. 12-6 Photo 12-8: Typical 240-L cart used in SSO collection programs © CH2M HILL 12. Collection Programs Another concern sometimes expressed in relation to cart-based food waste programs is the potential for increased odours and the possibility for animal attraction. While these are real issues and must be managed, they also exist with garbage collection programs where the food waste is not diverted (i.e., it is mixed with garbage and disposed of). Odour and animal issues can typically be managed through frequent collection (i.e., at least weekly) and selection of appropriate carts. Table 12-6 provides a cart-based collection program overview. Table 12-6 Cart-based collection program advantages and disadvantages Advantages Disadvantages • Eliminates many of the problems associated with plastic-bag-based collection of organics (e.g., lifting heavy bags, operational and litter problems, and plastic contamination of the compost) • Larger carts can be too heavy for some residents to manoeuvre • No lifting required by residents • Potential for material in carts freezing during winter • When combined with automated or semi-automated collection trucks, allows for increased collection productivity • Carts require periodic cleaning • May require more storage space (240 or 360 L) than traditional garbage cans • Using different-coloured carts can help users and collection truck operators differentiate materials 12.4.3 Kitchen Pails To improve convenience, small, 4-L kitchen pails are provided to residents as part of organic waste collection programs. These pails are designed to sit on the countertop or be tucked away under the counter, and provide a single receptacle for food and other kitchen organic wastes. Many residents prefer to use a paper or plastic liner bag, or line the pail with a folded newspaper. A liner helps to contain liquids, and makes handling and transferring food waste from kitchen pails to collection carts more convenient (i.e., less need to touch the food waste). Liners also reduce the frequency that the kitchen pail and also the collection cart need to be washed. Photo 12-9: Typical kitchen pails used in residential SSO collection programs © CH2M HILL There is an ongoing debate about the use of plastic versus compostable plastic liner bags in kitchen pails. Using liner bags made from noncompostable plastic, or using shopping bags, causes many of the same problems as large plastic garbage bags in terms of preprocessing and compost product quality. As a result, some municipalities openly discourage or ban the use of plastic liner bags (including compostable liners), and instead request that residents use paper bags or line kitchen pails with folded newspaper. 12-7 13. Organics Processing Facility Procurement Approaches Many of the organic processing facilities initially built in Canada were developed by municipalities through traditional infrastructure delivery processes. However, in the late 1990s, the landscape of the organics processing industry, and municipal infrastructure projects in general, began to change. Part of the upsurge in popularity for alternative delivery methods is a result of increasing capital funding pressures placed on municipalities. In many jurisdictions, funding of new organic process facilities must compete not only with other new developments, such as water treatment plants and recreation facilities, but also with the capital requirements to upgrade or replace older infrastructure. Another driver, which is particularly true in the organics waste industry, is that much of the expertise needed to plan, design, and operate organic waste facilities lies in the private, not public, sector. Each of the traditional and alternative project delivery methods has its own attributes that generally differ in terms of allocation of risks and responsibilities, scheduling and schedule certainty, ownership, performance guarantees, and procurement complexity. The common models for procuring organic processing facilities are shared with other infrastructure development models. They include the conventional design-bid-build (DBB), as well as a range of alternative delivery and public-private partnership (P3) options. In the organics industry, alternative delivery projects often follow a design-build-operate (DBO) model. However, alternative delivery options encompass a much wider range of delivery methods that also involve ownership and financing options. This chapter discusses the most common procurement approaches used in the organics industry in Canada (which are also illustrated in the following figure), as well as general considerations. Specifically, this chapter includes: • • • • • 13.1 Procurement Approach Defines the relationship and risk allocation between owners, designers, builders, and operators Section 13.1, Design-Bid-Build Section 13.2, Construction Management At-Risk Section 13.3, Design-Build Section 13.4, Design-Build-Operate Section 13.5, General Procurement Considerations Design-Bid-Build DBB has historically been the most common approach for developing municipal infrastructure projects. The DBB process has also been used extensively by the private sector to procure new facilities. A typical DBB project involves the owner engaging an engineering firm to develop a detailed design and specifications, and assist with obtaining local and provincial project approvals. The owner then uses the detailed design 13-1 13. Organics Processing Facility Procurement Approaches Figure 13-1: Four commonly-used procurement models in the municipal solid waste organics industry and specifications package as part of a tender package to obtain bids from contractors. The contractor selected through the tender process is subsequently engaged to construct the facility in accordance with the bid price and schedule. Normally, the contractor is paid monthly progress payments, and the owner applies holdbacks on payments in accordance with governing provincial legislation. Typically on a DBB project, the design and permitting phases are completed by the design team before the owner releases the tender for construction. This sequence leads to a longer overall delivery schedule, but it also reduces exposing the owner’s capital to risks resulting from permitting delays or unexpected changes in permit conditions. Roles in a DBB project are normally very clearly defined, and the owner’s risk exposure is low. Design and project performance risks lie with the design team. Construction and scheduling risks lie with the contractor. However, contractors do not have input into the design, which can contribute to construction issues. Claims during construction are common, and the requirement for some redesign during construction exists. Table 13-1 provides a DBB overview. 13-2 13. Organics Processing Facility Procurement Approaches Table 13-1: DBB advantages and disadvantages Advantages to owner Disadvantages to owner • Well understood and time-tested process and procedures • Sequential nature of process takes more time • Ability to select subconsultants by qualifications and cost in the traditional manner • Limited at-risk exposure for local professional firms • Contractor bids are based on full plans and specifications • Construction price known at bid time • Little or no designer/contractor collaboration • Limited job size/scope may not attract best potential technologies/best practices • Relies on designer’s cost estimates until very late in the project • Little opportunity to select contractor on qualifications and past performance, in addition to price • Separate contracts for design and construction create multiple points of contact for owner and do not align business interests 13.2 Construction Management At-Risk In a construction management at-risk (CMAR) process, the design team is selected by the owner using traditional professional services criteria. However, this method introduces the concept of contractor selection without a firm estimate or bid on the construction cost. Instead, contractors are selected primarily based on their qualifications, in combination with their proposed scope of services and fee for service prior to construction, as well as their fees and overhead costs for construction services. CMAR Approach Encourages Collaboration Sometimes referred to as “designbuild-light,” CMAR maintains two separate contracts, but encourages collaboration during design to reduce the risk of design changes and change orders once the contractor proceeds to construction. The construction cost is subsequently developed by the contractor during the design period, typically with full disclosure to the owner and designers, and is ultimately agreed upon as a guaranteed maximum price (GMP) prior to authorizing the start of construction. Where agreement on a GMP cannot be reached, or construction pricing competitiveness cannot be verified, owners have the option to revert to a tender and bid process. A CMAR model creates an intentional overlap between the designer and the contractor, allowing the contractor to bring construction insight to bear as early as practical in the design process. While promoting collaboration early in the design process, the formal contracts between the owner and designer and the owner and contractors are essentially unchanged from a traditional DBB model. During construction, traditional practices for managing contractor change orders, requests for information from the designer, and verification of construction performance also remain unchanged. Table 13-2 provides a CMAR overview. 13-3 13. Organics Processing Facility Procurement Approaches Table 13-2: CMAR advantages and disadvantages Advantages to owner Disadvantages to owner • Relies on proven, accepted method for selecting professional engineering services based on qualifications/price • Still relies on designer’s estimate for initial cost characterization • Integrates constructability earlier in the design process • Provides contractor-led estimates earlier, and allows scope revision during design to meet project budget • Can reduce overall project risk and contingency • Can reduce design misunderstandings and resulting potential for change orders • Allows qualifications and past performance to be taken into account when selecting a contractor • Forces a partnership between designer and contractor that may not work if both sides are not committed to openness and collaboration • Final construction scope still subject to change order potential • Added cost to owner for contractor’s preconstructionphase services (although may be offset with construction savings due to early collaboration) • Requires selection of contractor based on fees without knowing full construction price • Separate contracts for design and construction create multiple points of contact for owner and do not align business interests 13.3 Design-Build Under a design-build (DB) structure, the owner enters into a single fixed-price contract with a single DB contractor (or a consortium of companies acting together as one entity). Generally, the DB contractor has the responsibility of designing and building a project that meets owner-prescribed standards, and the owner then pays the DB entity based on certain construction milestones being achieved. The benefits of contracting with a single entity for both design and construction are well understood. The most important is avoidance of placing blame: if problems arise, the designer cannot blame the builder for not adhering to the design, and the builder cannot blame the designer for a faulty design. With the designer and builder working together from the outset, problems related to complex construction methods are less likely to arise, and if they do arise, the owner can hold the design-builder responsible for dealing with the problems. (In contrast, the relationship between the designer and the builder in a DBB procurement effectively puts ultimate responsibility for the design on the owner.) The various forms of DB procurements differ largely in the type of pricing requested of proposers and in the degree of problem definition developed for the project in advance of a procurement and subsequently provided to the design-builder during the request for qualifications (RFQ)/request for proposals (RFP) processes. The industry recognizes three basic DB models: 1. Performance-based DB 2. Prescriptive DB 3. Progressive DB 13-4 13. Organics Processing Facility Procurement Approaches Performance-Based DB In a performance-based DB procurement, the RFQ/RFP issued by the owner generally includes a conceptual design as a minimum and a 15% design as a maximum. Requirements are stated as measurable performance objectives of the completed project rather than the specific approaches or processes the design-builder should follow to achieve those objectives. Performance-Based Procurements Provide Owner Flexibility Preferred when owners have a clear vision of how a facility must perform, but limited resources, time, and interest in specific technology A performance-based procurement gives design-builders the flexibility to propose how they will meet the owner’s objectives while requiring proposers to provide a lump-sum price for project completion. Alternatively, owners may ask for a target price for construction that establishes a not-to-exceed construction price basis, while allowing the owner to collaborate on and adjust scope during detailed design definition. In this case, the target lump sum can be adjusted after award, but only as directed by ownerapproved scope changes. Except for these explicitly approved owner changes, the design-builder must conform to the originally proposed price. This model is used to prompt industry’s most innovative and cost-effective solutions through what is essentially a design competition, typically in combination with a need to accelerate the schedule. Table 13-3 provides a performance-based DB overview. Table 13-3: Performance-based DB advantages and disadvantages Advantages to owner Disadvantages to owner • Maximum potential for DB cost savings through design innovation during competitive procurement • If life-cycle cost is not analyzed or operations not included in scope, may result in higher O&M costs or undesirable project features • Maximum transfer of design-related performance risk to design-builder • Minimal design work by owner required prior to procurement, resulting in relatively low cost to prepare RFP • Competitive • Fastest possible method to procure and construct the facility • Competitive construction pricing provided at time of bid • Allows selection of designer and contractor based on past performance, qualifications, and ability to work as a single-entity team with aligned interests for project success • No contractor-initiated change orders • Proposal evaluation and selection is relatively complex • Limited ability to predict what will ultimately be proposed • Lump-sum pricing may include excess risk and contingency cost due to undefined project scope • Limited opportunity for owner and design-builder collaboration on design during procurement process • Limited ability for owner to adjust proposed design without resulting in owner-initiated change orders and resulting price adjustments • May limit local/small subconsultant participation due to at-risk nature of the work • Single contract and point of contact with owner Notes: O&M—operations and maintenance 13-5 13. Organics Processing Facility Procurement Approaches Prescriptive DB In a prescriptive DB procurement, the RFQ/RFP typically includes at least a 30% design completed by an owner’s consultant prior to the procurement, often referred to “bridging documents.” Requirements are stated in terms of specific approaches or processes the designbuilder must follow. With this method, the lump-sum price in the design-builder’s proposal is only adjusted for specific owner-initiated scope changes, generally due to unforeseen conditions or a change in law or regulatory practice. Table 13-4 provides a prescriptive DB overview. Prescriptive Procurements Provide Owner with More Control Preferred when an owner has very clear and defined preferences and wants to use DB to accelerate the schedule while allowing selection of a design-builder based on a combination of qualifications and a lump-sum price Table 13-4: Prescriptive DB advantages and disadvantages Advantages to owner Disadvantages to owner • Substantial control over project design and O&M costs • Procurement schedule is prolonged, and RFP preparation and evaluation is costly due to high level of owner-developed design required prior to procurement • Proposal selection can emphasize project DB cost • Allows selection of designer and contractor based on past performance, qualifications, and ability to work as a single-entity team with aligned interests for project success • Competitive construction pricing provided at time of bid • High level of project definition when the DB contract is signed • No contractor-initiated change orders • Single contract and point of contact with owner • Design risk not clearly assumed by the design-builder • Very complex and staff-intensive evaluation of proposals required • Does not promote as much innovation • Limited opportunity for owner and design-builder collaboration on design during procurement process • Limited ability for owner to adjust design without resulting in owner-initiated change orders and resulting price adjustments • May limit local/small subconsultant participation due to at-risk nature of the work Progressive DB In a progressive DB procurement, a design-builder is selected based primarily on qualifications, in a manner similar to the CMAR model, with an added component of cost for design services (either in a lumpsum or on a not-to-exceed basis). As the design-builder develops the design from conceptual through detailed levels, a construction cost estimate is also progressively developed. Once the design is well advanced (e.g., between 60 and 90%), a GMP is defined for approval by the owner. If the design-builder and the owner cannot reach agreement on an acceptable GMP, the owner can use the completed design as the basis for a traditional tender and bid process. Progressive Procurements Provide Owner with Greater Cost Control Preferred when a project lacks definition or when an owner prefers to remain involved in the design process while leveraging the schedule, collaboration, and contractual advantages provided by the DB process This model is also valuable when regulatory permitting requires well-developed design solutions, or when owners believe that they can lower costs by participating in design decisions and managing risk progressively through the project definition phase. 13-6 13. Organics Processing Facility Procurement Approaches Owners do not generally use the progressive procurement method when a project’s definition is well advanced prior to the procurement or when a lump-sum construction price is preferred (or required) to select a design-builder. Table 13-5 provides a progressive DB overview. Table 13-5: Progressive DB advantages and disadvantages Advantages to owner Disadvantages to owner • Maximum control over project design, construction, and O&M costs because final construction contract is not signed until a large portion of the design is complete • Requires selection based on fee; full construction cost is not known at the time of initial contract • Single, straightforward, and inexpensive procurement process can be completed in short timeframe • Increased marketplace interest due to relatively low proposal preparation cost • Allows selection of designer and contractor based on past performance, qualifications, and ability to work as a single-entity team with aligned interests for project success • Provides progressively accurate contractor’s estimates of total project costs • May not be as fast to deliver as other DB methods due to potential for extended design/estimate development period, including involvement of numerous stakeholders in the design process • May not be perceived as being competitive for construction pricing • Requires significant owner staff involvement and resources during design • May limit local/small subconsultant participation due to at-risk nature of the work • Provides maximum opportunity for designer, contractor, and owner collaboration to define scope, meet schedule and budget, and tailor subcontracting plan • Provides an opportunity to change to a tender process if GMP is not competitive or cannot be agreed upon • No contractor-initiated change orders • Requires little or no design to be completed by owner in advance of procurement • Single contract and point of contact with owner 13.4 Design-Build-Operate The DBO model provides owners with a whole-life solution for project implementation. Typically, DBO procurements are developed from the basis of a performance-based DB model, with the added component of requiring the proposer to operate the facility for an extended period of time (typically, no less than 5 years, and often as long as 15 or 20 years). This operations component ensures that the performance commitments of the DB proposal are indeed met, as the designer must deliver on them during its tenure— or alter or repair the facility accordingly. Long-term operations can also include maintenance or replacement of critical components. DBO entities are typically formed by a consortium of designers, builders, and operators. Operators often lead the consortium, as the majority value of DBO contracts often are in the operations scope versus the capital construction scope. DBO Procurement Allows Owner to Outsource Operations Preferred when whole-life (life-cycle) is of greatest concern, and/or no fixed operations staff is in place for the given facility 13-7 13. Organics Processing Facility Procurement Approaches DBO procurement models allow proposers to evaluate true project life-cycle costs while requiring them to operate facilities for an extended period of time, transferring risk to the DBO entity. DBO contracts are also beneficial when implementing a new or unproven technology that requires long-term, hands-on demonstration of performance. A DBO model for infrastructure procurement encourages contractors to optimize the tradeoffs between initial construction costs and longer-term maintenance and rehabilitation costs, since they are responsible for both. For the public body, a DBO model can be used to reduce the capital needed at the beginning of a project by spreading payments over a longer period of time. However, it is critical that agreement concerning useful asset life at handback be prenegotiated. Table 13-6 provides a DBO overview. Table 13-6: DBO advantages and disadvantages Advantages to owner Disadvantages to owner • Opportunity to include long-term operations and lifecycle cost • Requires long-term (e.g., 10 years or more) commitment to contract mechanism and future payments • Provides for numerous turnkey delivery options • May provide method for obtaining project financing not otherwise possible • Can be complex to implement and controversial • May encounter public employee union resistance 13.4.1 Financing and Transfer of Ownership Options There are also variations of the DBO model that include facility financing and ownership by the privatesector partner. However, these variations have been used in Canada for transportation projects (e.g., toll roads and bridges) but are less common for organic waste facilities. In part, this has to do with the complexities of environmental permitting for such facilities, and the desire for many owners to maintain a higher level of control over the project to manage odour and nuisance risks. It is notable that the federal government’s P3 entity, PPP Canada, requires a long-term operations or a finance component to be included as a precondition for consideration for grant funding through their P3 Canada Fund (in practice, both operations and financing are preferred). The potential for significant grant funding through this program for organic processing facilities may impact an owner’s decisions about which procurement model to choose. 13.5 General Procurement Considerations Choosing the most effective project procurement and project delivery system for a complex infrastructure project requires an understanding of the spectrum of proven contracting methodologies, and accompanying insight to how varying methodologies can align with project-specific needs and risk allocation (e.g., cost, schedule, and design) between owners, designers, builders, and operators. 13-8 13. Organics Processing Facility Procurement Approaches Evaluating the benefits of a given procurement and project delivery model should consider several criteria that are essential to defining a successful procurement and follow-on project: • • • • • • • Transparent. All procurement processes, methodologies, and selection criteria must be fair, objective, and transparent to the professional services and construction community. Cost-Effective. Any procurement methodology should ensure that the owner is receiving best value for the services and construction being purchased. To the extent possible, services should be priced, and price should be evaluated as part of the selection methodology. Objective-Focused. Procurement selection strategies should be based on clearly defined evaluation criteria that mirror project challenges and opportunities for project success. Efficient. The cost for implementing the procurement process should be minimized in favour of using funding to maximize delivery of actual project scope. Similarly, the bidding community’s resources should be respected by minimizing, to the extent practical, the cost to propose on work. Timely. The duration of the procurement processes should be minimized, allowing for sufficient response time from bidders and a reasonable time period to evaluate proposals without other undue delays. Valuable time should be conserved and made available for execution of project scope. Inclusive. The overall procurement process should ensure that local subconsultants and subcontractors have equal access to project scope for which they are qualified. Projects should be packaged for wide participation, especially for alternative delivery models that might otherwise preclude local firms from at-risk work. Compatible. Procurement methodologies must remain consistent with existing regulatory and procurement policies unless specific changes are approved to accommodate identified alternative delivery benefits. A successful procurement process also has a transparent scoring methodology that drives proposers to solutions that meet the owner’s needs at the best life-cycle cost, with an understanding of the available capital budgets for the project. 13-9 14. Odour Control and Management Controlling odours is perhaps the greatest challenge the organic waste processing industry faces. Often, when plant operations are suspended or there are conflicts over plant siting, odours and concern over potential odour impacts are the cause. The composting and anaerobic digestion (AD) processes are inherently odorous because odorous volatile products are created by the decomposition process. However, a properly designed operation can effectively manage and treat these odours to eliminate or significantly reduce nuisance impacts on neighbours. This section provides details on odour sources, odour measurement, and best practices for managing and treating these odours effectively at organic waste processing facilities. Specifically, the following aspects of odour management and control are addressed: • • • • 14.1 Section 14.1, Odours Sources Section 14.2, Sampling and Measuring Odours Section 14.3, Predicting Offsite Odour Impacts Section 14.4, Treatment Technology Options Odours Sources Every step in the composting and AD processes presents a potential source of odours, although odours are generally most apparent at the start of these processes and diminish with time. Odours from organic processing facilities can be categorized generally according to how and when they are generated, as shown in Table 14-1. Table 14-1: Three odour source categories Category Description Occurrence Active Odour that exists when material is being actively handled, such as during shredding, mixing, and screening. During working hours Continuous Odour originates while aerating and storing materials, whether from point sources, such as aeration fan exhaust or tank/vessel vents, or area sources, such as pile and windrow surface emissions. Generally much more significant than active or housekeeping sources. 24/7 Housekeeping Odours can originate during every processing step due to material spills; unclean equipment; and condensate, digestate, and leachate on ground surfaces. These odour sources can persist after daily activity has stopped, but are generally easily remedied through cleanup of the odorous materials. 24/7 Notes: 24/7—24 hours per day, 7 days per week 14-1 14. Odour Control and Management Table 14-2 summarizes the source and type of typical odours from composting and AD facilities. Table 14-2: Typical odour sources at composting and anaerobic digestion facilities Odour sources Category Waste material transport and storage Trucks en route Active Trucks parked onsite Active Tipping operations Active Untreated ventilation from storage facilities Continuous Open conveyors Active Spillage from trucks Housekeeping Spillage around storage facilities Housekeeping Puddles from truck washing Housekeeping Waste material tracked around site on truck tires Housekeeping Mixing Surface emissions from front-end loading or batch mixers Active Untreated emissions from continuous mixers Active Spilled mix Housekeeping Mix residue on equipment Housekeeping Compost pile building and digester loading Surface emissions from material handling activities Active Mix spillage Housekeeping Residue left on equipment Housekeeping Large clumps of waste from poor mixing Continuous Processing Venting of tanks and sumps Continuous Fugitive emissions from treatment vessels and aeration systems Continuous Surface emissions from active composting piles Continuous Leachate puddles at the base of composting piles Housekeeping Digestate dewatering and storage Active Leakage and ponding of condensate, leachate, and digestate Housekeeping (WEF et al ., 2009) 14-2 14. Odour Control and Management Table 14-3 summarizes the most common odour compounds, common sources, and pathways of formation. Table 14-3: Odour types and sources Class compounds Likely source Formation/release pathway Inorganic sulphur (hydrogen sulphide) Leachate, septic wastes, biosolids Anaerobic reduction of sulphate to sulphide, or anaerobic breakdown of amino acids Organic sulphur (mercaptans) Wastes subjected to anaerobic conditions Anaerobic and aerobic breakdown of amino acids Organic sulphides Composting Aerobic oxidation of mercaptans Inorganic nitrogen (ammonia) Processing of feedstocks with C:N ratio less than 15:1 (e.g., food waste and green grass) Anaerobic decomposition of organic nitrogen; volatilization at high pH or temperature Organic nitrogen (amines) Composting Anaerobic decomposition of acids Fatty acids Wastes subjected to anaerobic conditions Anaerobic decomposition Aromatics Preliminary and primary waste processing, and composting Breakdown of lignins Methylethyl ketone Composting, wood-based bulking agents Breakdown of lignins Terpenes Composting, wood-based bulking agents Present in wood products, such as woodchips and sawdust (Vershueren, 1983) Notes: C:N—carbon to nitrogen 14.2 Sampling and Measuring Odours Composting and AD facility odours result from a number of compounds acting together to produce subjective responses from the human olfactory system. Due to the large number of compounds involved, analyzing the concentrations of individual compounds is of limited use in determining odour impacts. However, analyzing for specific compounds (e.g., ammonia) may be useful to guide the selection of the proper odour control treatment technology. 14.2.1 Sample Collection Collection of odorous air samples from stacks, vessels, and ducts is generally straightforward. Similarly, it is relatively simple to collect air samples from negatively aerated compost piles directly from ducting downstream of the compost pile. However, to directly measure odours with any degree of accuracy, specific sampling protocols must be followed. There are two standard pieces of equipment used for collecting samples, flux chambers and hoods. 14-3 14. Odour Control and Management Flux Chamber Collecting odour samples released by static piles of materials (e.g., incoming feedstock, composting windrows, and product stockpiles) as a result of ambient air sweeping across their surface is challenging. Normally, a flux chamber is used in this situation in accordance with United Stated Environmental Protection Agency sampling protocols. The flux chamber is placed on a representative pile surface, and surface emission air is collected in a nonreactive, nonodorous Tedlar bag (or equivalent). A vacuum chamber is used to pull air out of the flux chamber into the Tedlar bag via Teflon tubing. Photo 14-1: Vacuum chamber and Tedlar bag © CH2M HILL Hoods Composting piles and biofilters that are being positively aerated by fans can be sampled using a hood placed over a representative area, as shown in Photo 14-2. Specific protocols must be followed to obtain representative samples. In this case, it is particularly important to ensure that sample extraction rates do not exceed the rate at which air is exhausted from the compost pile, or resulting samples will not be representative (i.e., they would have higher odour concentrations). 14.2.2 Odour Concentration Measurements Once collected, odours in the air samples are qualified by measuring the “odour strength” or “odour concentration” in accordance with a standard methodology. The protocol outlined in ASTM International (ASTM) E-679-04 (2011) is the most commonly accepted methodology in Canada and the United States. It involves using prequalified odour panellists to sniff decreasingly diluted (increasingly concentrated) air samples until an odour can be detected. Photo 14-2: Sampling hood being used to collect odour samples from an aerated compost pile © CH2M HILL When measured using the ASTM protocol, the odour concentration is reported in terms of dilutions to threshold (D/T). The D/T value is equal to the volume ratio of odour-free air to sample air in a mixture for which half of the odour panellists can first detect an odour and half cannot. For example, a D/T value of 1000 means that 50% of people with average sensitivity can detect an odour while sniffing a mixture containing 1 litre (L) of odorous sample air mixed with 999 L of odourfree air. Odour panel analysis is the most direct method of quantifying how odorous gases impact the human nose. Photo 14-3: Olfactometer © St. Croix Sensory, Inc. 14-4 14. Odour Control and Management While this method is effective for measuring odour strength, it does not distinguish between individual compounds or the relative offensiveness of the odour. The “hedonic tone” is sometimes used in conjunction with odour concentration to rate the pleasantness or unpleasantness of an odour sample. The hedonic tone is a subjective measure of odour offensiveness/pleasantness (on a scale from –10 to +10) that is made by odour panellists at the same time that odour concentration is measured. The character of an odour can also be determined by comparing to a list of standard descriptors (e.g., earthy, fruity, fishy), as shown in Figure 14-1. Figure 14-1: Odour wheels are used to provide descriptors of an odorous character (Adapted with permission: Rosenfeld et al., 2007) 14-5 14. Odour Control and Management 14.3 Predicting Offsite Odour Impacts To assess the potential offsite odour impact, odour emission rates and physical parameters of the various sources at the facility need to be defined. Odour emissions are determined by collecting air samples and analyzing the odour characteristics in a laboratory, as described in the previous section. The odour analysis results can then be combined with physical and process parameters related to specific sources to develop odour emission rates for each source. Total odour emissions from the facility as a whole can be calculated as the sum of emissions from individual sources. As an example, Table 14-4 shows the relative odour emissions from various sources at an outdoor aerated static pile composting facility. Emission rates can be used into computerized atmospheric dispersion models to assess a facility’s potential odour impacts on neighbours. The output from the modelling process is normally shown as isopleths overlain on aerial photos or site plans, as shown in Figure 14-2. A detailed discussion of odour modelling methods is beyond the scope of this document. However, readers can find further information in texts such as Water Environment Federation’s Control of Odors and Emissions from Wastewater Treatment Plants (2004). Dispersion modelling can also be a useful tool for comparing different processing and treatment technologies, and containment and facility layout options. Consideration should be given to completing odour modelling during planning and design of medium to large waste processing facilities (e.g., more than 20 000 tonnes per year [tpy] of feedstocks) to determine the potential impact on neighbours before facilities are built. 14-6 Table 14-4: Example odour source summary from an outdoor aerated static pile composting facility Source Contribution to total odour emissions (%) Compost piles 61.7 Curing piles 13.3 Compost storage piles 12.9 New chips storage piles 4.2 Recycled chips storage piles 3.5 Mixing area 2.4 Screened chips piles 1.3 Drying pile being built 0.6 Screened compost piles 0.1 TOTAL 100 (Murray and Thompson, 1986) Figure 14-2: Odour model isopleths for planned composting operation © CH2M HILL 14. 14.4 Odour Control and Management Treatment Technology Options Once building air and process emissions are contained and captured, they can be treated to reduce or remove odour compounds. Within the organics processing industry, gas-phase treatment technologies, such as wet scrubbers, carbon adsorption, and biofiltration, have been successfully used in many installations. Such technologies either transfer gaseous contaminants (odours) into the liquid phase by absorption or adsorption, or oxidize the contaminants, or both. Each of the gas-phase technologies has specific applications. It is important that facility designers, operators, and regulators have an appreciation of the benefits and limitations of these systems. Table 14-5 provides a summary description of these technologies, and further details are presented in the following subsections. Table 14-5: Gas-phase odour control technology summary Method Description Target compounds Wet scrubbers Packed-bed tower or atomized mist scrubbers wash odorous compounds from the air stream into a liquid scrubbing solution Reduced sulphur compounds and organic-based compounds Carbon adsorption Odorous compounds are removed by adsorption on activated carbon Wide array of compounds; not effective on ammonia Biofilters Odorous air is treated by passing it through biofilter media, combining absorption, adsorption, and biological oxidation of odorous compounds; can be enclosed or unenclosed Wide array of compounds, including reduced sulphur compounds, ammonia, and organic odours 14.4.1 Wet Scrubbers Wet scrubbers include both packed-bed tower scrubbers and atomized mist scrubbers. These systems have been used to treat odorous air from wastewater treatment plants and organic waste processing facilities for many years. Packed-bed tower scrubbers typically consist of a vertical, cylindrical, corrosion-resistant vessel containing 2 to 4 metres (m) of inert plastic packing media. Odorous air is usually passed upward through the packing, and water or an acid solution is sprayed downward over the plastic media to contact the odorous air. The water or acid solution is collected in a sump and recirculated. Makeup water or acid solution are automatically added as necessary to maintain the proper conditions for contaminant removal, and spent solution Figure 14-3: Typical packed-bed tower wet scrubber is periodically removed. Spent solution must be handled and treated as wastewater. A mist eliminator mounted at the outlet gas location minimizes droplets of water or acid solution from escaping the system. Figure 14-3 shows a schematic representation of a typical packed-bed tower wet scrubber. 14-7 14. Odour Control and Management Figure 14-4: Typical atomized mist scrubber Photo 14-4: Packed-bed tower wet scrubber at composting facility © CH2M HILL Photo 14-5: Atomized mist scrubber © CH2M HILL Packed-bed tower scrubbers can be designed with multiple stages for removal of specific contaminants. For example, composting odours may require a first-stage scrubber using an acidic scrubbant liquid to remove ammonia and amines. This may be followed by one or more stages using sodium hypochlorite to oxidize reduced sulphur compounds. For hydrogen sulphide removal, the traditional packed-bed tower scrubber uses both sodium hydroxide (to promote hydrogen sulphide absorption into the liquid phase) and sodium hypochlorite (to oxidize the hydrogen sulphide to elemental sulphur or sulphate). In an atomized mist scrubber, as shown in Figure 14-4, very small atomized water/chemical solution droplets are sprayed into the airstream and allow for contact between the odorous gas and the liquid. The main difference between atomized mist and packed-bed tower systems is that no recirculation of the liquid occurs in the former, so the chemical solution is used once and then is discarded. This results in constant overflow of chemical solution that has odorant compounds dissolved into solution that drains down a sewer for further treatment. Atomized mist scrubbers, while generally effective, are slow to respond to rapid variations in odorous gas concentration. Table 14-6 provides an overview of the two systems. 14-8 14. Odour Control and Management Table 14-6: Packed-bed tower and atomized mist scrubber system advantages and disadvantages Advantages Disadvantages • Effective removal of sulphur and amine compounds • Requires periodic cleaning • Small space requirement • Can be impacted by freezing conditions • Effective on varying odour loads • Chemical handling and related costs • Cost-effective for high flow rates • Limited effectiveness on some organic-based compounds • Dual-stage required for multiple odorous compound types, like compost odours 14.4.2 Carbon Adsorption Like wet scrubbers, carbon adsorbers have been used effectively in the odour control industry for many years. Carbon adsorber vessels used for wastewater and organic waste processing odour control applications are generally either deep-bed adsorbers, where odorous air is directed vertically through a minimum 1-m bed of media, or radial-flow adsorbers, where the flow is directed horizontally through a bed of media and is collected at the outer annular space or the inner central column. Figure 14-5 is a schematic of a dual, deep-bed carbon adsorber. Due to the high levels of ammonia and amines that can be present in exhaust emissions from source separated organics processing applications, carbon adsorption is not effective by itself for treating these emissions. However, this technology is effective for treating hydrogen sulphide and other sulphur compounds. Carbon adsorption units are also useful for treating air released from underground leachate storage tank vents. Figure 14-5: Typical dual-bed carbon adsorption system 14-9 14. Odour Control and Management The major variable in the selection of carbon treatment systems is the type of activated carbon media used. Catalytic carbon has been developed that greatly increases carbon’s capacity to remove low-molecularweight hydrogen sulphide, potentially increasing the lifetime of the media when hydrogen sulphide is present. This type of media is more common than the caustic-impregnated carbon that was historically used, because of the difficulties in handling and disposing of spent caustic-impregnated carbon. Table 14-7 provides a system overview. Table 14-7: Carbon adsorption system advantages and disadvantages Advantages Disadvantages • Effective removal of low concentrations of sulphur compounds • Requires periodic media replacement, especially at high concentration of odorous compounds • Small space requirement • Moisture and particulate sensitive • Effective on wide range of odour compounds • Not effective on amine and ammonia compounds • Simple operation • Media replacement is expensive and can be labour intensive 14.4.3 BiofilterSystems Biofiltration has become the most popular choice for treating odorous airstreams from composting and organic waste processing facilities. While there have been many successful applications in recent years, there have also been some notable failures, particularly during the developmental phases of this technology. However, the technology has evolved so that with proper design and operation, biofilters are an effective odour control technology. Biofilters have successfully removed a wide range of inorganic and organic compounds from gas streams. Testing has shown that properly designed and operated biofilters at composting facilities routinely remove 90 to 95% of the incoming odours. Easily biodegradable odorous compounds, such as hydrogen sulphide, can be removed to a level of 99% or better with biofilters. Adsorption and Absorption Adsorption is the attraction between the outer surface of a solid particle and a contaminant, while absorption is when the solid assimilates the contaminant into its physical structure. Biofilters treat odorous compounds through a combination of adsorption, absorption, biological degradation, and oxidation. Contaminants are either adsorbed onto the surface of the biofilter media or absorbed by the thin, fixed film of liquid (biofilm) surrounding the media particles. Once the odorous compounds are trapped, they become the food source for the microbial ecosystem within the media. Microorganisms in the biofilm oxidize the contaminants and use energy released for maintenance of their own cell material and growth. The primary microorganisms in the filter media are bacteria and fungi. These organisms consume the odorous compounds and, in turn, become the foundation of a more complex food chain existing in the media. 14-10 14. Odour Control and Management Table 14-8 provides a biofilter system overview. Table 14-8: Biofilter system advantages and disadvantages Advantages Disadvantages • Highly effective on a wide variety of odorous compounds • Requires media replacement (every 2 to 4 years for organic media and 10 years for synthetic media) • Simple to operate and maintain • Large space requirement • No chemicals required • Moisture content of biofilter media needs to be monitored • Effective on varying odour loads • Pressure drop through media increases as media ages • Low O&M cost • Discharged air can have residual media odour (e.g., woodchips) Notes: O&M—operations and maintenance Table 14-9 provides a summary of the key operating parameters for biofilter systems. Table 14-9: Biofilter system key operating parameters Parameter Range Inlet air temperature Less than 40°C Moisture content of biofilter media 40–70% Odorous air loading rate 1–3.3 m3/min/m2 EBRT 45 to 60 seconds Notes: °C—degrees Celsius EBRT—empty bed residence time m3/min/m2—cubic metres per minute per square metre Photo 14-6: Unenclosed biofilter at a composting facility © CH2M HILL UnenclosedBiofilters A typical unenclosed biofilter consists of a media bed containing contaminant-degrading microorganisms, a media support structure, a foul-air distribution system, and some method of controlling the media moisture content. Figure 14-6 is a simplified schematic of a typical unenclosed biofilter system. Figure 14-6: Typical unenclosed biofilter system 14-11 14. Odour Control and Management The biofilter’s media can consist of various natural materials, including bark, woodchips, soil, peat, compost, and sand; or synthetic material, such as granulated carbon, ceramics, perlite, plastics, or lava rock. The media is spread loosely and evenly over the top of the support structure/ air distribution system. Typically, the airstream to be treated is distributed through the bottom of the biofilter bed and forced upward through the media. The moist filter media provides physical and chemical conditions appropriate for the treatment of the odorous compounds. Moisture control is one of the most important tools in the maintenance of biofilter media. Media that is too dry will not support a diverse and robust microbial community. Media that is too wet can become too dense and compact, resulting in reduced porosity and airflow. If the air that flows through the biofilter is not humidified to near 100% relative Photo 14-7: Water can be added to humidity, moisture is rapidly stripped from the media. The net effect is biofilter media using sprinklers, but care must be taken not to overwater the negative impacts to the microorganisms and reduced odour treatment biofilter media © CH2M HILL efficiency. Control of moisture in the biofilter media is typically provided using atomized mist scrubbers to prepare the inlet airstream, and/or wetting the biofilter media using spray irrigation systems. A minimum bed depth is required to provide the residence time needed to adequately transfer compounds from the airstream to the medium. Typical design bed depths are 1.25 to 1.5 m, although depths up to 2.4 m have been used. Deeper bed depths result in smaller biofilter footprints, but they also have higher pressure losses, creating the need for more powerful aeration fans. EBRT is the theoretical time that the foul air would be in contact with the filter media, assuming that air flows up through 100% of the occupied biofilter volume, as if the media were not there. True residence time is the time that the foul-air contacts media while flowing up through the interstitial spaces of the media. The EBRT will always be greater than the true residence time. The EBRT is typically used to size biofilter systems, and should be at least 45 seconds. Sometimes overlooked is the need to drain any surplus liquid generated by the biofiltration process from the bottom of the biofilter. Rain and snow falling on the biofilter’s surface can also lead to surplus liquid in the media. If inadequate drainage is provided, this liquid may build up in the biofilter and reduce air flow and treatment performance. Because the liquid may also be slightly acidic, it cannot be released to the environment. Rather, it should be considered as leachate and sent to an appropriate waste treatment process. Eventually, organic media used in these biofilters will degrade to the point that air flow is impeded and odour treatment efficiencies are reduced. For example, woodchip biofilter media typically requires replacement after 2 to 4 years. Depending upon the layout and design of the biofilter, the media can usually be removed and replaced with front-end loaders or excavators in a matter of days. EnclosedBiofilterSystems Several manufacturers provide enclosed biofilter systems, similar to that shown in Photo 14-8, that are sold as packages. These packages typically contain the air distribution piping, instrumentation and control 14-12 14. Odour Control and Management systems, and media. Automated humidity controls are also typically included in package systems. Treated air from these types of biofilter systems is often discharged through a stack, which enables monitoring of emissions and assists in further dispersion and dilution of emissions. Figure 14-7 is a schematic of a typical, enclosed biolfiter system. Enclosed systems often use proprietary media manufactured from synthetic materials. The proprietary media provides a high surface area for absorption, adsorption, and biogrowth formation. Photo 14-8: Enclosed biofilter system at a composting facility © Biorem Technologies Inc. Since they are enclosed and include humidity controls, these biofilters are not subject to the same degree of moisture fluctuation as unenclosed systems (e.g., as a result of precipitation or surface evaporation). This results in more consistent odour treatment performance. Enclosed biofilters also often have a smaller footprint than unenclosed biofilter systems designed to treat the same air volume, because they can be built with a deeper bed (i.e., greater than 1.5 m). Enclosed biofilters are generally more costly than unenclosed biofilters with the same treatment capacity, especially if lower loading rates are used (i.e., flow rate per m2 of biofilter surface area). However, the lifespan of the media (e.g., 5 to 10 years) reduces the overall life-cycle costs of these systems. Figure 14-7: Enclosed biofilter system 14-13 15. Nuisance Management and Controls As described in Chapter 14 and elsewhere, odours are the primary nuisance condition associated with composting and anaerobic digestion facilities, and it is appropriate that odour controls receive rigorous attention during a project’s planning, design, and operational phases. However, concern over odours should not divert resources from the management of other possible nuisances. If left unchecked, these other nuisance conditions can be as detrimental as odours to community acceptance of the facility. This chapter provides a brief overview of the other nuisances that can be caused by organic waste processing facilities, including: • • • • Section 15.1, Dust Section 15.2, Litter Section 15.3, Noise Section 15.4, Insects, Birds, and Animals Dust Sources ■ Receiving and handling dry feedstocks and amendments ■ Grinding and mixing during preprocessing ■ Turning dry windrows ■ Compost screening ■ Loading finished compost on trucks 15.1 Dust Dust sources at organic processing facilities are numerous. One of the most significant contributors is from handling dry feedstocks, amendments, and dry compost. These materials can be found throughout the site, but feedstock receiving and processing areas, compost curing areas, and screening operations are particularly susceptible to dust generation. Other notable sources of dust include wood grinding, truck loading areas, and traffic driving on unpaved roads and working surfaces. Dust generated by organic waste processing activities needs to be controlled for several reasons. Probably the most important reason relates to the health of site personnel and visitors, since airborne dust and particulate matter can irritate both eyes and lungs. Dust can also negatively affect mechanical and electrical equipment performance, and increase maintenance requirements. For example, dust can clog radiators and air intakes on mobile equipment and cause increased wear on machine bearings and hydraulic cylinders. Dust that settles in electrical equipment and in site equipment engine compartments also increases fire and electrical failure risks. ■ Compost bagging operations Photo 15-1: Dust can quickly clog radiators on windrow turners and other equipment, and lead to overheating © CH2M HILL Dust Impacts ■ Respiratory and eye irritation for workers and visitors ■ Accumulation on surfaces, becoming a fire hazard ■ Operational effects on mechanical equipment and increased maintenance requirements ■ Premature and/or catastrophic failure of electrical equipment ■ Contribution to, and acceleration of, the biological corrosion process The best way to manage dust generation is through process controls. By maintaining optimal moisture conditions during the active 15-1 15. Nuisance Management and Controls composting and curing processes, dust generation can be reduced, since fine compost particles do not normally become airborne when moisture levels are in excess of 45%. It may be unavoidable to grind or otherwise handle dry feedstocks and amendments prior to moisture conditioning and processing. In these situations, dust can be controlled using water misting systems and building enclosures, and if the processing is done indoors, through properly designed ventilation systems. Of these options, misting systems are an attractive approach from a capital cost and operations perspective. However, misting systems cannot be used in unheated buildings in the winter, and they may not always be effective outdoors, since the mist can be dispersed by a slight breeze. Dust Control Measures ■ Dampen dry loads ■ Enclose duty areas, and install proper ventilation ■ Pave onsite roads ■ Sweep or wash roads and working pads ■ Maintain a clean site Care must also be taken in the design of the misting system so that the quantity of water used does not lead to wet floors, which can create slip hazards for site personnel. As well, wet or saturated organics materials on the floor can quickly become a source of odours. When trucks are loaded, some material inevitably spills onto the ground. Eventually, this material dries out and becomes friable, and can become a source of dust when disturbed. The problem is compounded where trucks are consistently loaded at the same locations. Photo 15-2: Roof-mounted and directional misting systems installed inside buildings and around equipment are effective at controlling dust levels © CH2M HILL Unpaved roads and working pads can also contribute significantly to dust from the gravel or soils from which they are constructed or as a result of material spilled that dries out and becomes airborne. Facility operational staff prefer paved surfaces because they are easier to clean regularly so dust is reduced. At facilities without hard surfaced roads and working pads, periodic watering is a common means of controlling dust. However, this must be done with caution, since excess water can pond if the surface is uneven and become an odour source, and the water can contribute to leachate quantities. 15-2 Photo 15-3: Unpaved roads and working pads can be a major source of dust © CH2M HILL 15. 15.2 Litter Organic waste processing facility litter usually comprises paper, plastic bags, and other film plastics that are delivered as part of the feedstock mixture. Since there is less material in the feedstocks that contribute to litter, it is generally less of a problem than at landfills and recycling facilities. The exception is facilities that process feedstocks with a high paper content, or programs that collect feedstocks in plastic bags. Nuisance Management and Controls Litter Sources ■ Film plastic and paper that arrives with feedstocks ■ Amendment recovery (screening operations) ■ Final product screening If left unchecked, litter becomes an eyesore that detracts from the community’s overall impression of the facility. Unmanaged and windblown litter can also strain relationships with neighbours. It is reasonable to expect that litter will primarily be generated at an organic waste processing facility in the receiving and preprocessing areas, and during any screening operations. However, turning outdoor composting and curing windrows can also release litter, particularly if the piles are dry. The first step in managing litter is to control sources directly. Design features that allow for control include building enclosures and fences around processing operations, and litter vacuum attachments on processing equipment. To supplement controls, chain-link or grid fencing can be installed around the site’s perimeter to prevent windblown litter from migrating offsite. Trees and bushes around the site’s perimeter are also effective at capturing litter, and may be more aesthetically pleasing to neighbours. However, litter caught in trees’ higher branches is very visible and often difficult to remove. Operation controls are equally, if not more, important in managing litter. For example, if doors and curtains are not closed, enclosures lose their effectiveness. Similarly, it may be necessary to avoid unloading or handling certain materials during high winds, or set up temporary fences downwind of unloading areas. It is important that operations staff regularly clean litter from any fencing. Not only do litter accumulations reflect poorly on the facility, but they can increase the wind resistance of the fencing and lead to bending of posts, overturning of portable fencing, or other damage. Photo 15-4: Enclosures around screener discharge conveyors help to contain litter © Scott Gamble Photo 15-5: Vacuum systems can be used to remove litter from material on conveyor belts © CH2M HILL Litter Controls ■ Enclose receiving and processing areas ■ Keep doors to tipping and processing areas closed ■ Install permanent litter control fences ■ Use temporary or portable litter fences ■ Regularly clean litter from fences, trees, and property Measures to control litter should also focus on site access roads. It is common to make arrangements with the local municipality to establish and enforce litter control bylaws, and to apply surcharges for arriving loads that are not adequately secured. Regular litter collection along access roads is also a recommended practice. 15-3 15. Nuisance Management and Controls 15.3 Noise Provincial health and safety regulations require that all facilities manage noise to prevent site personnel and visitor short- and longterm hearing damage. Noise control is also needed to prevent other unsafe conditions from being masked. For example, the noise from a loud piece of equipment may drown out alarms associated with automated equipment startups, or backup alarms on mobile equipment. Provincial health and safety regulations are not concerned with the impacts that nuisance noises (i.e., noises below harmful levels from a health perspective but that are readily detectable) have on neighbours’ quality of life. In some jurisdictions, municipal bylaws have been enacted to control nuisance noises, but these are generally intended to prevent them from occurring during the night and early morning when residents are asleep. Despite the possible lack of regulations, designers and operators should still endeavour to prevent and manage these nuisance noises, as they can strain neighbour relations and turn public opinion against the facility. Noise Sources ■ Collection vehicles ■ Shredders/grinders ■ Wheel loaders ■ Windrow turners ■ Hydraulic power units/motors and gears ■ Aeration fans Noise Reduction Techniques ■ Properly operate equipment (e.g., engine rpm) ■ Properly maintain equipment ■ Enclose loud, stationary equipment ■ Provide adequate buffers around the facility ■ Install acoustical berms or fences around the site perimeter ■ Plant trees and other foliage around the site perimeter Common sources of nuisance noises include: • • • • • • Vehicle engine sounds when delivering feedstocks and amendments or removing products from site Vehicle tailgates banging as they open and close Site equipment engine noise, such as from front-end loaders and grinders Backup alarms Warning alarms on processing equipment Aeration fans (particularly during startup) Photo 15-6: Soil berms and trees help reduce noise impacts, as well as improve visual appearances © CH2M HILL Many of the noise control measures are operational: not running trucks and equipment engines at high rotations per minute (rpm), ensuring mufflers are properly maintained, and repairing washboarded roads to reduce vehicle chassis noise. Designers can contribute by designing roadways that are less susceptible to rutting and washboarding, reducing the slopes of roadways as much as possible (thereby reducing vehicle engine noise during travel uphill on the roads), and establishing appropriate speed limits. Acoustical barriers in the form of fences, earthen berms, and vegetation can be installed around the facility or in key locations. It may also be possible to equip specific processing and aeration equipment with some form of acoustical dampening. Alternatively, equipment can be placed within appropriately designed buildings or enclosures that reduce offsite noise levels. 15-4 15. 15.4 Nuisance Management and Controls Insects, Birds, and Animals Whether it is because feedstocks provide a food source or because processing operations generate heat, it is a reality that organic waste processing facilities are an attractant to insects, birds, and other animals, such as mice and rats, raccoons, skunks, coyotes, and bears. Even processing grass, leaves, and brush, which are often thought of as relatively innocuous feedstocks, can attract insects, birds and animals. The primary concern related to insects, birds and Photo 15-7: Birds and animals are attracted to the heat from animals is the potential spread of pathogens and the composting process, as well as to food wastes © CH2M HILL diseases. In this context, they are vectors for the spread of diseases. A secondary concern is that Animal Controls birds and animals can scatter feedstocks around the facility site or onto ■ Clean and maintain organic processing facilities regularly; adjacent properties. Larger animals, such as bears and cougars, also maintain good housekeeping pose a physical threat to site personnel and visitors. As with other nuisance conditions, the primary means of controlling insects, birds, and animals is to follow sound operational practices. First among these is implementing good housekeeping and maintaining a clean site. Quickly processing and covering feedstocks that are potential food sources is also important at outdoor composting facilities. Larger animals, such as bears and coyotes, can be deterred and managed through the use of perimeter fencing of sufficient height and density. In some cases, these fences may need to be augmented with electrical fencing and/or be partially buried to prevent animals from burrowing underneath. Fencing is not appropriate for deterring small animals, such as rats and mice, and operational controls (e.g., traps) may have to be used. Birds are more difficult to control, since they can fly over fences and other barriers that deter animals. Bird cannons that produce loud noises on a random schedule can be incorporated into the facility by designers and operators. However, the noise from these cannons can annoy neighbours, and the effectiveness of noise makers as a control method over the long term is questionable. ■ Regularly clean surfaces that come into contact with feedstocks (especially food) ■ Control the composting process, since many animal are attracted to the organic matter on the surface of the compost pile ■ Install perimeter fencing to deter larger animals Non-Auditory Bird Controls ■ Enclose food waste receiving areas ■ Process and cover food wastes quickly ■ Install metal and mirrored flashers ■ Install reflective tape and streamers ■ Install netting and overhead lines ■ Use hawk and owl silhouettes ■ Employ canine and predatory bird patrols ■ Install windmills 15-5 15. Nuisance Management and Controls There are several non-auditory bird control measures that can be incorporated into the facility, such as adapting the design of site buildings and structures to minimize potential perches; installing mist netting inside enclosures, and using air curtains or other barriers on overhead doors; installing coils or spikes on horizontal surfaces; installing windmills with surfaces that reflect visible or ultraviolet light; installing streamers and flags; and installing overhead wires above operating areas to disrupt flight patterns. Relative to birds, insects are much easier to control. Insect control focuses primarily on flies and mosquitoes, both of which are vectors for disease and the spread of pathogens. Mosquitoes lay their eggs in standing water; thus, they are attracted to surface water ponds, open tanks, and water collected in ditches, ruts, and depressions. While it is not cost-effective to cover surface water ponds, tanks can normally be covered, or screens can be placed over openings and vents. Repairing damaged roads and pads, and regular regrading of working areas, can help prevent standing water accumulation. Flies are attracted to decaying feedstocks. They are also attracted to the heat given off by the composting process; flies often lay their eggs on the outer surface of the compost pile where temperatures are above ambient, but not high enough that they kill the fly larvae. The primary means of controlling flies is to process feedstocks as quickly as possible, thereby exposing eggs to heat or other conditions that kill the larvae before they hatch. Flies can also be controlled with various fly traps and bug zappers. Fly infestations at outdoor composting facilities are often encountered but can be controlled by turning windrows every two or three days for a period of a week. Turning exposes the fly eggs and larvae to the higher temperatures inside the windrows, and breaks the fly population reproductive cycle. 15-6 Photo 15-8: Rutted surfaces limit access, attract insects, and are a source of odour © CH2M HILL Insect Controls ■ Cover tank inlets and vents ■ Regularly regrade roads and outdoor working pads to prevent standing water ■ Ensure ditches are properly graded and free of silt or debris that would prevent water from draining ■ Process feedstocks quickly ■ Maintain proper process temperatures ■ Turn windrows regularly during active composting to break insect reproductive cycles 16. Compost Quality Standards Feedstocks recovered from the municipal solid waste stream and used to make compost may potentially contain nonorganic or other noncompostable materials. In response, regulators and industry have worked together in Canada to create standards for finished compost product quality that protect human health and prevent environmental degradation. These standards have also supported the growth of the composting industry in Canada by setting minimum product requirements for all producers, helping to increase customer confidence. The standards enacted by regulatory agencies typically focus on the protection of public health and the environment. Criteria or specifications related to compost aesthetic characteristics (e.g., texture, colour, or aroma) and plant growth-related characteristics (e.g., pH, soluble salts, or nutrient content) are more often industry-developed and voluntary in nature. Photo 16-1: Noncompostable materials commonly found in lawn and yard waste feedstocks © CH2M HILL In Canada, the following standards have been jointly developed to govern compost quality: • • • The Fertilizer Act Canadian Council of Ministers of the Environment (CCME) Guidelines for Compost Quality Bureau de Normalisation du Québec (BNQ) Organic Soil Conditioners—Composts Table 16-1 summarizes the categories that each standard covers. As a result of the foresight of the agencies involved, these standards are closely harmonized, so if one standard is met, it is relatively easy to meet the requirements of the others. In addition to these standards, several Canadian provinces have adopted guidelines or criteria under the authority of their respective environmental and waste management legislation. These provincial standards are also essentially harmonized with the three main standards and in some cases are verbatim. 16-1 16. Compost Quality Standards Table 16-1: Compost quality standards overview Canadian Food Inspection Agency Fertilizer Act CCME Guideline for Compost Quality BNQ Organic Soil Conditioners—Composts Maximum trace element concentrations P P P Maturity P P P Pathogens P P P Foreign matter (including sharps) P P P Moisture content and OM P Labelling P P Notes: OM—organic matter This chapter covers the following: • • • • • 16.1 Section 16.1, Fertilizer Act Section 16.2, CCME Guidelines for Compost Quality Section 16.3, BNQ Organic Soil Conditioners—Composts Section 16.4, Provincial Regulatory Requirements Section 16.5, Compost Quality Alliance Fertilizer Act In Canada, the Fertilizer Act and Regulations set safety standards and labelling requirements for all fertilizer and complementary products (including compost), as described in this section. The Canadian Food Inspection Agency (CFIA) is responsible for the administration and enforcement of the Fertilizer Act, Fertilizer Regulation, and associated Trade Memoranda. 16.1.1 Quality Standards Compost product quality standards are mandated by the federal government through the Fertilizer Act and the associated Fertilizer Regulation and Trade Memoranda. The Fertilizer Regulation requires that any compost sold in Canada or imported into Canada meet the minimum quality requirements outlined in CFIA-issued Trade Memoranda, most notably T-4-93 and T-4-120. CFIA Trade Memoranda ■ Developed under the authority of the Fertilizer Regulation ■ Contain detailed information on the requirements and protocols needed to comply ■ Are legally enforceable documents T-4-93 contains standards for trace element concentrations in composts. Specifically, it establishes the maximum acceptable cumulative addition rates for several trace elements that can be added to soils over a 45-year period. Standards for chromium and copper are not contained in T-4-93; however, interim standards 16-2 16. Compost Quality Standards have been developed by the CFIA’s Fertilizer Safety Office and are published in T-4-120. Tables 16-2 and 16-3 provide a summary of the trace element standards from both trade memoranda. T-4-120 contains a number of additional requirements and criteria for compost products, which Table 16-3 also summarizes. Table 16-2: Summary of CFIA trace element standards (from T-4-93 and T-4-120) Maximum acceptable trace element concentrations in products (mg/kg dry weight) Maximum acceptable cumulative metal additions to soils (kg/ha) Arsenic 75 15 Cadmium 20 4 Chromium – 210 Cobalt 150 30 Copper – 150 Lead 500 100 Mercury 5 1 Molybdenum 20 4 Nickel 180 36 Selenium 14 2.8 Zinc 1850 370 Notes: kg/ha—kilograms per hectare mg/kg—milligrams per kilogram Table 16-3: Summary of additional CFIA compost quality standards (from T-4-120) Parameter Standard Maturity Composts must be mature in order to meet the definition of “compost” as set out in the Fertilizer Regulation. It is the manufacturer’s responsibility to demonstrate compost maturity using scientifically valid methods. Moisture content Less than 65% OM Greater than 15% Pathogens: • Salmonella Nondetectable • Fecal coliform Less than 1000 MPN per gram of total solids Sharp objects Composts should not contain sharp objects, such as glass or metal, in a size and shape that can cause injury. Notes: MPN—Most Probable Number In addition to these criteria, the Trade Memoranda contain instructions for sampling compost products and identify the specific analytical methods that the CFIA have approved for use. CFIA staff routinely samples compost products to verify that they meet the Fertilizer Regulation and Trade Memoranda standards. This is accomplished through random inspections and product sampling at composting facilities. 16-3 16. Compost Quality Standards 16.1.2 Labelling The CFIA also has a secondary mandate to protect consumers by enforcing mandatory minimum product labelling requirements from the Fertilizer Regulation, including: • • • • • Product name Producer information A guarantee of the minimum quantity of OM and the maximum moisture content of the product Nutrient grade (e.g., concentration of nitrogen, phosphorus, and potassium in the product) if any type of nutrient value claim is made or implied Directions for use and cautionary statements There are further protocols for label sizes and fonts, as well as an extensive set of rules surrounding claims that can and cannot be made on the label. The label must also provide a lot number for the product in the event that a product recall is required. 16.2 CCME Guidelines for Compost Quality The CCME is an intergovernmental forum of federal and provincial/territorial government representatives who work together to discuss and take joint action on environmental issues with national implications. The CCME’s goal is to encourage consistent standards, practices, and legislation across Canada. The CCME first published its Guidelines for Compost Quality (the Guidelines) in 1996, following discussion and collaboration with the provinces, Environment Canada, and Agriculture Canada. An updated version of the Guidelines was published in 2005 following consultation with these government agencies and industry representatives. Two sets of criteria exist within the Guidelines that allow compost to be classified as either Category A or Category B. Compost that meets all of the Category A criteria can be used in any application, including, but not limited to, applications for: • • • Agricultural and residential land Horticultural operations Nursery industry Use of compost that meets the Category B criteria may be limited by some provinces due to the presence of sharp foreign matter or higher trace element concentrations. It should be noted that the CCME’s trace element criteria for Category B compost are harmonized with the trace element criteria outlined in the CFIA Fertilizer Regulation. As Table 16-4 demonstrates, the Guidelines include specific criteria for trace elements, pathogen levels, maturity, foreign matter and sharp foreign matter, and organic compounds. The criteria for pathogen levels, maturity, and organic compounds are identical for both Categories A and B. 16-4 16. Compost Quality Standards Table 16-4: Summary of CCME Guidelines for Compost Quality Category A Category B Maximum concentration within product (mg/kg dw) Maximum concentration within product (mg/kg dw) Maximum cumulative additions to soil (kg/ha) Trace elements Arsenic 13 75 15 Cadmium 3 20 4 Chromium 210 1060 210 Cobalt 34 150 30 Copper 400 757 150 Lead 150 500 100 Mercury 0.8 5 1 Molybdenum 5 20 4 Nickel 62 180 36 Selenium 2 14 2.8 Zinc 700 1850 370 Pathogensa Compost produced solely from yard waste must meet PFRP criteriaa or the following pathogen content limits: Salmonella Less than 3 MPN/4-g (dw) Fecal coliform Less than 1000 MPN/g (dw) Compost produced from all other feedstocks must meet PFRP criteria and the pathogen content limits. Foreign matter and sharp foreign matter Foreign matter Less than or equal to 1 piece greater than 25 mm in any dimension per 500 mL Less than or equal to 2 pieces greater than 25 mm in any dimension per 500 mL Sharp foreign matter None greater than 3 mm in any dimension per 500 mL Less than or equal to 3 pieces per 500 mL, 12.5-mm maximum dimension Maturity/stability All compost will be mature and stable at the time of sale and distribution. To be considered mature and stable, it must be cured for a minimum of 21 days, and meet one of the following requirements: • Respiration rate less than or equal to 400 mg O2/kg VS (or OM) per hour • CO2 evolution rate less than or equal to 4 mg C-CO2/kg OM per day • Temperature rise above ambient less than 8°C Organic compounds Avoid composting feedstocks with high concentrations of persistent bio-accumulating organic contaminants. Notes: a To meet PFRP criteria for in-vessel and ASP composting, maintain material at operating conditions of 55°C or greater for 3 consecutive days . For windrow composting, maintain material at a temperature of 55°C or greater for at least 15 consecutive days during the composting period . During the high-temperature period, turn the windrow at least 5 times . °C—degrees Celsius ASP—aerated static pile C-CO2—carbon-carbon dioxide dw—dry weight g—gram mL—millilitre mm—millimetre O2—oxygen PFRP—Process to Further Reduce Pathogens VS—volatile solids 16-5 16. Compost Quality Standards 16.3 BNQ Organic Soil Conditioners—Composts The BNQ is a Quebec-based organization that is part of the National Standards System of Canada. The BNQ’s mandate is to develop national standards; certify products, processes, and personnel; and certify environmental management systems. Within the National Standards System of Canada, responsibility for establishing national standards for organic soil supplements has been delegated to the BNQ. The BNQ published its first national standard (CAN/BNQ 413-200, Organic Soil Conditioners—Composts) in 1997 through a consensus-based approach involving product manufacturers, users, government agencies, and interested parties. The standard was reviewed and updated in 2005. Since the BNQ standard was developed through the National Standards System of Canada rather than being enacted under federal legislation, it has no regulatory standing. Therefore, compost producers can choose to adopt it voluntarily, or choose not to adopt it at all. The standard establishes three categories of compost (AA, A, and B), and includes criteria for physical characteristics (e.g., moisture, OM, foreign matter, sharps); chemical characteristics (e.g., trace elements); maturity; and biological characteristics (e.g., fecal coliform and Salmonella). Table 16-5 presents a summary of specific criteria contained in the BNQ standard. Table 16-5: Summary of BNQ compost quality criteria (cont’d) Category AA Category A Category B Maximum concentration within product (mg/kg dw) Maximum concentration within product (mg/kg dw) Maximum concentration within product (mg/kg dw) Trace elements Arsenic 13 13 75 Cadmium 3 3 20 Chromium 210 210 – Cobalt 34 34 150 Copper 400 400 – Lead 150 150 500 Mercury 0.8 0.8 5 Molybdenum 5 5 20 Nickel 62 62 180 Selenium 2 2 14 Zinc 700 700 1850 Pathogens Salmonella Less than MPN/4-g (dw) Fecal coliform Less than 1000 MPN/g (dw) 16-6 16. Compost Quality Standards Table 16-5: Summary of BNQ compost quality criteria (cont’d) Category AA Category A Category B Maximum concentration within product (mg/kg dw) Maximum concentration within product (mg/kg dw) Maximum concentration within product (mg/kg dw) Foreign matter and sharp foreign matter Foreign matter content Less than or equal to 0.01% dw Less than or equal to 0.5% dw Less than or equal to 1.5% dw Foreign matter content with maximum dimension greater than 12.5 mm but less than 25 mm 0 Not applicable Not applicable Foreign matter content with maximum dimension greater than 25 mm 0 Less than or equal to 1 Less than or equal to 2 Sharp foreign matter No sharp foreign matter less than 3 mm No sharp foreign matter greater than 3 mm • No sharp foreign matter greater than 3 mm if product is sold in bags • No sharp foreign matter greater than 12.5 mm, and less than or equal to 3 pieces of sharp foreign matter less than 12.5 mm per 500 mL, if product is bagged Maturity/stability All compost will be mature and stable at the time of sale and distribution. To be considered mature and stable, it must be cured for a minimum of 21 days, and meet one of the following requirements: • Respiration rate less than or equal to 400 mg O2/kg VS (or OM) per hour • CO2 evolution rate less than or equal to 4 mg C-CO2/kg OM per day • Temperature rise above ambient less than 8°C Moisture content Less than 65% Less than 65% Less than 65% Greater than 50% dw Greater than 30% dw Greater than 30% dw OM The criteria for most physical and chemical characteristics for Categories A and B are harmonized with the CCME and CFIA standards. The criteria for Category AA are the same as for Category A, except for the foreign matter criteria, which are more stringent. This reflects the intent that compost meeting Category AA is more suitable for bagging. 16-7 16. Compost Quality Standards The BNQ standard also includes detailed sampling methods and references to analytical method standards published by other standard-setting agencies (for example, the United States Environmental Protection Agency and ASTM International). These sampling and analytical methods are adopted by reference in the CCME Guidelines. In addition to publishing the national standard, the BNQ also runs a voluntary certification program for compost producers. 16.4 Provincial Regulatory Requirements As previously mentioned, several provinces have also enacted compost product quality standards in their respective regulations. In most cases, these standards are partially or wholly based on the CCME’s criteria. Many provinces also base their regulatory approach on the premise that mature compost, which has met the province’s minimum quality criteria, should not pose environmental concerns when land-applied. If these criteria are not met, the material is considered to be waste and must be disposed of at a provincially approved waste management facility. 16.5 Compost Quality Alliance The Compost Quality Alliance (CQA) is a voluntary program, developed and managed by the Compost Council of Canada. The CQA does not establish a set of product quality criteria. Instead, the program’s goal is to improve consumer confidence in compost products through the use of standardized methods for testing and reporting product characteristics. The program has the benefit of helping consumers select the right compost for the intended use and supports regulatory compliance within the industry. Figure 16-1: CQA Logo © Compost Council of Canada The CQA program focuses on final product quality instead of the process used to make the product. CQA participants follow prescribed sampling frequencies (based on annual production levels) and reporting methods, and through an annual licensing arrangement, use the CQA logo on packaging and product promotion. Products marketed under the CQA banner are tested to ensure they meet the appropriate federal and provincial regulatory guidelines. Producers that are members of the CQA program must test their products in Canadian or American laboratories that are involved in the Compost Analysis Proficiency (CAP) Program. CAP is a laboratory quality assurance program, managed through the United States Composting Council, which is used to calibrate and evaluate laboratory performance. The Test Methods for Examination of Composting and Compost form the basis of the analytical test methods used in the CQA and CAP programs. 16-8 17. Compost Market Considerations To market compost products successfully, it is necessary to understand the unique characteristics of the compost being produced and how it will be used (including both application methods and rates). It is also important to identify the market segments expected to purchase the compost and any products competing for a share of those markets. This chapter broaches these topics, as well as general market planning concepts. Specifically, the following topics are addressed: • • • • • • Section 17.1, Compost Markets Section 17.2, Market Development and Planning Section 17.3, Distribution Options Section 17.4, Bulk Versus Bagged Product Sales Section 17.5, Competing Products Section 17.6, Transportation Chapter 16 provides additional information related to compost product quality standards. 17.1 Compost Markets Several viable markets (or market segments) exist for compost. This section breaks compost markets into eight segments in order to better discuss their nuances and relative experience with compost. 17.1.1 Agriculture Agriculture is typically considered the largest potential market for compost, but it is greatly undeveloped in most geographic areas. Farmers would benefit from consistently adding organic matter to their crop soils. Instead, they often use only chemical fertilizers, or they use animal waste generated on their own farm to help alleviate overall waste management concerns. Compost has often been supplied by composters to farmers free of charge so that larger volumes of compost can be distributed with minimal effort. Compost Parameters of Importance for Agricultural Applications ■ Rich in nutrients (N,P,K) ■ Rich in organic matter ■ Low in biological (pathogens) and chemical contaminants (heavy metals) Overall, compost has been more successfully marketed: • • • In areas with light or sandy soils To organic farmers To farmers producing higher-value crops 17-1 17. Compost Market Considerations Compost is used on organic farms or in the production of higher-value crops, such as vegetables and berries, because these types of crops are more costly for farmers to manage on a per hectare basis. Compost Uses for Agriculture ■ Soil additive for field crops, vegetables, and fruit crops ■ Component of raised planting bed soil mixes Extensive research has been completed over the past decade on the ■ Component of greenhouse crop benefits of using compost on a variety of agricultural crops, illustrating soil mixes compost’s ability to improve crop yield and/or improve crop size ■ Organic and/or certified organic fertilizer and quality. However, farmers often compare the nutrient content of compost (typically 1 to 2% nitrogen [N]) to high-nitrogen chemical fertilizers. In most instances, compost cannot win in this comparison because chemical (inorganic) fertilizers have more nitrogen, are less expensive on a cost per kilogram (kg) of nitrogen basis, and are easier to apply. With that said, rising chemical fertilizer costs, as well as compost’s ability to buffer acidic soils, can make this economic comparison closer. It is helpful to illustrate compost’s ability to improve the overall health and long-term productivity of soils, or to improve the lower productivity areas of the farm. Compost does improve soil quality through the addition of organic matter (OM) and nutrients (most in slow-to-release form). However, as certified organic and sustainable farming continues to expand, both based on reducing chemical inputs and improving soil health, paying agriculture markets for compost should expand. Among the different groups of compost users, farmers are also somewhat risk-adverse, partially due to healthy skepticism, but also based on economic realities. As the agricultural community has suffered economically, it has been more difficult to get it to invest in products that improve long-term soil health but may not provide an immediate financial return. Additional research and demonstration projects illustrating the benefits of compost use, when applied at lower application rates, must be encouraged by the composting industry. Lower application rates better fit into traditional farming practices and meet farmers’ economic requirements. Application rates for compost use vary widely in agriculture, depending on crop type and soil conditions. 17.1.2 Erosion and Sediment Control Erosion and sediment control is one of the fastest growing uses for compost, especially in geographic regions where managing erosion and sediment loss as a means of protecting surface waters is a priority. Compost for this use must be coarse (woody). Markets for this compost-based technology include landscaping, general construction, and roadside development. Compost Parameters of Importance in Erosion and Sediment Control Applications ■ Stable and mature if vegetated ■ Free from inert contamination (plastic, glass) ■ Proper particle size distribution (coarse compost) Using compost as a soil blanket for mulching slopes, or as a pyramidal berm, is more effective than typical technologies, such as sediment fencing, straw bales, and woven blankets, and can compete economically. Compost used in this application also encourages quick and extensive vegetation establishment, which is often the long-term goal on sites treated with erosion and sediment control measures. The most difficult, and often most costly, aspect of using compost for erosion and sediment control is its physical application, though this has been vastly improved through the development of specialized application equipment. Compost used for this purpose is typically confined to areas affected by water that 17-2 17. moves over land down a slope in an unconcentrated form (not in channel-flow conditions). Compost placed in filter socks, manufactured using a tubular mesh material to encase the coarse compost, may be used in situations where water is in a concentrated flow. Both compost filter berms and socks are also used as a barrier to retain soil on construction sites, or to restrict soil movement of sloped areas (typically 2:1 slopes or less). Research by universities and private organizations has shown that these compost-based methods can be 10 to 20 times more effective than traditional methods at removing soil particles found in the runoff water. Compost Market Considerations Photo 17-1: Blower trucks are commonly used to place or spread compost for erosion control applications © Rexius Forest By-Products Inc. Compost Uses for Erosion and Sediment Control ■ Soil blanket (for slopes) Compost blankets are typically applied in a 25- to 50-millimetre (mm) layer, while berms are typically 300-mm high by 600-mm wide. 17.1.3 Landscaping ■ Filter berms ■ Media for vegetation ■ Media for filter socks The landscape industry has proven to be one of the largest paying markets for compost. It purchases compost in both bulk and bagged form, and uses it for a variety of purposes. Landscapers primarily use compost as a soil amendment, but also use it as a manufactured topsoil component, as a turf topdressing, and as decorative mulch. Compost is popular among landscapers because of its versatility and its efficacy in a variety of applications. The product is also cost-competitive with other products currently used (e.g., screened topsoil and peat), and its use appears to reduce plant loss on landscaping projects, reducing overall project costs. Compost Parameters of Importance in Landscaping Applications ■ Stable and mature Landscapers are less risk-adverse than other groups of compost users, meaning they are more willing to try new products. However, landscapers have product characteristic requirements (based on their specific application) as well as delivery-related requirements (because their projects vary in size and location). As the industry is seasonal, they require suppliers to deliver product when needed. Compost is typically applied in a 25- to 50-mm layer for garden bed and turf establishment, and is then incorporated into the soil to a depth of 150 to 200 mm. 17.1.4 Reclamation Compost is also used to reclaim low-quality or damaged soils (e.g., landfill closures, quarry and brownfield reclamation, and oil fields), or those contaminated with a variety of chemical contaminants (e.g., petroleum hydrocarbons and heavy metals). ■ Free from inert contamination (plastic, glass) ■ Low in odour Compost Uses for Landscaping ■ Flower/garden bed establishment ■ Planter mix component (e.g., raised flower beds and rooftop mixes) ■ Tree/shrub backfill mix component ■ Manufactured topsoil component ■ Decorative plant mulch ■ Turf establishment/renovation and maintenance ■ Turf topdressing ■ Organic fertilizer 17-3 17. Compost Market Considerations Compost is not only a product that can improve the physical, chemical, and biological characteristics of “dead” soils (soils with no carbon or nitrogen cycles), but also provides a biological method to degrade specific petroleum-based contaminants and reduce the bioavailability of heavy metals. Often, the use of compost in reclamation applications is very economically viable, and also allows for the treatment of soil onsite (in situ) instead of removing large volumes of soil, only to replace it with imported soils. Provincial regulations govern the reclamation of damaged soils, so need to be consulted when planning projects. Compost is typically applied in a 25- to 75-mm layer for vegetation establishment, and is then incorporated into the soil to a depth of 150 to 300 mm. 17.1.5 Reselling Resellers represent a variety of business types, including: garden centres, landscape supply yards, mass merchandisers, stone companies, topsoil dealers, and home centres. Some resellers can sell only bagged or only bulk products, while others may carry both. Companies that resell compost products require different types of assistance, and have needs specific to their size, location, and type of clientele. Compost Parameters of Importance in Reclamation Applications ■ Stable and mature ■ Rich in OM Compost Uses for Reclamation ■ Manufactured topsoil component ■ Soil additive (upgrading marginal soils) ■ Bioremediation of contaminated soils (e.g., heavy metals and petroleum-based contaminants) ■ Remediation of organically dead soil ■ Landscape plants and turf establishment ■ Agricultural/energy crop establishment Compost Parameters of Importance for Reselling Applications ■ Stable and mature ■ Free from inert contamination (plastic, glass) ■ Low in odour Compost Uses for Reselling Resellers often prefer stocking and distributing “branded” products, as these products have name recognition, making them easier to sell. Branding is more difficult for bulk (unpackaged) products, since there is no bag or other advertising that accompanies the product. Some resellers prefer private label products packaged under their own name. ■ Resale for landscape applications ■ Resale for general turf applications Compost can be promoted to resellers as a versatile product that is somewhat new to the mainstream lawn and garden industry. Compost can also be promoted and marketed as a more environmentally friendly product that can be sold with bulk topsoil and mulch products. Careful consideration must be given to how resellers are positioned and the composition of their customer base (e.g., some resellers specialize in selling to the general public or to professional end-users, like landscapers, while others sell to both). Both considerations can impact compost’s sales potential. 17.1.6 Topsoil Manufacturing Topsoil manufacturing, also known as soil blending, has become a large paying market for compost. Compost has become more popular in this application because consistent supplies of high-quality topsoil 17-4 Compost Parameters of Importance for Topsoil Manufacturing ■ Stable and mature ■ Rich in OM 17. are becoming more difficult to obtain. Lower-quality peat products have been used in soil blends for many years. Topsoil suppliers use compost to create OM-enriched blends if they are seeking to diversify their product line or improve the quality of lower-grade soil sources. Although topsoil suppliers often have a need to improve the quality of their raw soil (or improve its consistency), they are also very cost-conscious because their products are more generic and are sold primarily by price. Compost Market Considerations Compost Uses for Topsoil Manufacturing ■ Topsoil component for typical landscape and general turf applications ■ Sports turf media component (e.g., high-tech athletic fields and golf courses) ■ Environmental media component (e.g., rooftop and rain gardens) Similar to the composting industry, supplying topsoil is a volume-based ■ Specialized landscape and planter mix component business: large volumes of product must be marketed and sold for success, since unit price is somewhat low. Interestingly enough, the growth of the soil-blending industry may hinge on offering higher-tech products, as there is a growing need for blended-soil products produced for use in specific applications (e.g., sports turf, landscape planters, and environmental remediation). Compost can comprise between 10 to 50% (by volume) of a blended-soil product, although 20 to 30% is more typical. 17.1.7 Turf Application Compost has been used successfully for many years in turf establishment, maintenance, and renovation. A variety of residential, commercial/industrial, roadside, and sports turf compost applications exist. Using compost as a means to improve soil characteristics and hold water allows for more extensive rooting and quick establishment of a variety of grass species. Compost is primarily used as a soil amendment in this application, but may also be used as a seeding media in topdressing applications. Compost can also be used to supply slow-to-release nutrients (especially nitrogen) often costly to turf managers, since turf requires substantial fertilization. Turf managers use compost to assure the long-term success of their turf project, as it is seen as an acceptable method to improve soil characteristics for both sandy and heavy, clay soils. More recently, the use of compost as a turf topdressing has become popular on commercial and sports turf; therefore, the ability to provide access to specialized spreading equipment will assist in developing this market. Compost Parameters of Importance for Turf Applications ■ Stable and mature ■ Free from inert contamination (plastic, glass) ■ Weed free Compost Uses for Turf Applications ■ Soil additive for turf establishment ■ Soil additive for turf renovation ■ Turf topdressing (or topdressing component) ■ Seed germination media ■ Golf green and tee construction mix component ■ Athletic field construction mix component ■ Turf divot media (or divot component) ■ Organic fertilizer (nitrogen, iron) Sports turf managers use compost for many of the same purposes as organizations that manage general turf. However, sports turf sites experience intensive use conditions, causing wear on the turf and soil compaction. Although compost has been used in golf course construction to a limited degree for several years, its use in this application, as well as in athletic field construction and maintenance, is becoming more commonplace today. Golf courses are beginning to use compost as an alternative to peat products in sand-based media because of its ability to supply and maintain nutrients, as well as to suppress a variety of soil-borne diseases. 17-5 17. Compost Market Considerations Compost is typically applied in a 25- to 50-mm layer for turf establishment, and is then incorporated into the soil to a depth of 150 to 200 mm, or applied to the surface of the soil as a topdressing in a 6- to 12-mm layer. 17.1.8 Wholesale Nurseries The use of compost in nursery production may be the most extensively researched. Compost can be used as a component for greenhouse and container media, as well as a soil amendment in field, nursery, and nursery bed production. Culturally, nursery growers are familiar with the use of peat- or bark-based products and preblended media products; however, these products are typically devoid of plant-available nutrients and possess a lower pH. For this reason, the extensive use of compost in nursery media (horticultural substrate) requires some training. Using compost requires modification to typical practices used for years to produce crops (e.g., fertilization, watering, and liming). Research projects over the past decade have proven that using high-quality compost can assist in establishing healthier, larger plants, often in a shorter period of time, and can provide the benefit of supplying micronutrients and suppressing soil-borne disease organisms. Research has also shown that in field nursery applications, compost use can reduce the typical cropping cycle (producing slower-to-grow, woody plants in less time), and can be used as an effective means to avoid taking the fields out of production in order to allow them to sit fallow. Nursery growers are probably the most risk-adverse and conservative end-users because their operations are not typically diversified, and their economic livelihood is often dependent on a crop that is grown over a few months each year. Compost is typically blended at an inclusion rate of 20 to 35% (by volume). Compost Parameters of Importance in Wholesale Nursery Applications ■ Very stable and mature ■ Low in electrical conductivity (soluble salts) ■ Very consistent in its characteristics Compost Uses for Wholesale Nurseries ■ Component of greenhouse or container mixes ■ Soil additive for field nurseries ■ Soil additive for nursery beds ■ Nursery bed and/or field nursery mulch (coarse compost) ■ Organic fertilizer By using the market segment-related background information discussed so far in this chapter, as well as the following information on application rates and suggested product characteristics, composters should be able to position their product more effectively within the marketplace. 17.2 Market Development and Planning Composting facilities often have difficulty developing their compost marketing and distribution programs during the early days of facility operation due to poor market planning, lack of effective sales activity, and an overall lack of market development understanding. Deciding whether to attempt to recover processing costs through tipping fee revenue alone or generate additional revenues by systematically marketing the product is a major consideration for distributing compost. Certainly, the main incentive for selling compost is financial. Additional revenues allow for greater 17-6 17. Compost Market Considerations overall profitability of a privately operated facility, or can be applied to reduce the overall cost of operating a publicly operated facility. Many practitioners believe that the greatest benefit of a planned and assertive compost marketing program is protecting the innate value of the product; whereas self-use and give-away programs do not protect compost’s value because these programs still require additional management and incur additional costs that are not recoverable. A good understanding of the marketplace and producing products that meet end-user technical requirements are important factors in developing strong markets for compost products. Proper market planning is also important in efficiently developing a successful market. Experience has shown that facilities that do not invest resources (e.g., time, effort, and money) into market development have a much greater frequency of failure. Facilities that produce large volumes of compost need to begin marketing efforts early in the process and commit greater resources towards the effort. Market planning is critical for larger composting facilities with the imperative that finished product be cycled out on an ongoing basis. By developing a marketing plan, sales can be approached pragmatically, allowing staff to better understand the demographic nuances of the geographic market area. More importantly, developing a successful marketing plan saves time and money. The marketing plan is simply a guide to the sales and marketing program. It should be modified as information and experience are gained, and competitive forces change. Some facets of a basic compost marketing plan are unique to the compost industry, whereas others are common to any marketing plan. Table 17-1 presents an outline for a basic compost marketing plan. Table 17-1: Basic compost marketing plan outline Components Required actions Compost production/ facility management Develop a quality assurance plan; consider product certification and registration, and storage and loading procedures Market research Quantify and/or qualify potential market segments, identify competition, determine if any product stigmas exist, and evaluate prices of similar and competing products Product research Determine if any university or field research is required to test or demonstrate product attributes and benefits, complete a literature search, and develop an internal product testing program Promotion Identify opportunities for promotion to target sales audience (e.g., attend trade conferences, publish articles, and develop a logo), and consider methods to both generate leads and create name recognition Education Develop programs to educate target markets, professionals, or groups that create specifications (e.g., landscape architects), as well as internal facility staff Sales/distribution Determine target market segments and geography; develop pricing structure; consider distribution options and determine methods; and create literature, and sales and target marketing programs The quantity of compost produced, the available program resources (budget and staff), and specific market conditions help determine which of these aspects must be an actual part of the marketing plan, and to what extent. 17-7 17. Compost Market Considerations 17.3 Distribution Options Various compost distribution options exist, and a variety of decisions must be made relative to product distribution. A decision that should be made early in the development of a composting program is who will be responsible for the distribution of the product: internal marketing staff or a specialized company (like an advertising or public relations agency). The greatest benefits to having internal staff market the product include that the composter: • • Distribution Factors ■ Quantity of compost produced ■ Current/future staffing ■ Staff sales and technical skills ■ Facility financial requirements and goals ■ Overall resources Is in ultimate control of the marketing program, and can better react to the ongoing requirements of the facility Receives the highest revenue for the product, since it does not have to share revenues or pay an outside company However, hiring a marketing firm is likely to provide more immediate and efficient product distribution due to its industry understanding and contacts. 17.4 Bulk Versus Bagged Product Sales Compost can be sold in both bulk and bagged form, as well as blended with a variety of other materials to create new and innovative products. Many composters are lured to the concept of bagging compost, even though the majority of compost distributed is in bulk form. While bagging has the potential for increased revenue and better name recognition (branding), the overall convenience in handling and usage of bagged product is probably the greatest advantage if retail sales are to be more extensively pursued. The convenience of bagged compost may also lead to more widespread usage by landscapers. Table 17-2 provides a comparison of the two ways to sell compost. Table 17-2: Bulk and bagged sales advantages and disadvantages Form Advantages Disadvantages Bulk • Lower cost to manufacture, so can sell at lower price • More difficult to brand • More affected by weather • Less financial risk • Lower innate value • Simplified delivery • Simplified storage Bagged • Improved marketability to small customers (e.g., retail/ homeowners) • Increased costs • Easier to handle—at least with smaller endusers • Involves complicated delivery logistics and infrastructure • Higher innate value (increased revenue on a per-unit basis) • Need mature, stable compost with low moisture • Improved name recognition (easier to brand) 17-8 • Increased financial risk 17. Compost Market Considerations It should be noted, however, that some composters have gone into bagging only to fail because they did not understand the complexities of the bagged product industry and underestimated the additional costs necessary for bagging. The compost to be packaged must be mature, with a moderate to low moisture content to avoid moulding in the bag. Packaging size and strength must also be considered to assure that it can be properly handled by the buyer. Further, labelling regulations should be strictly adhered to when developing packaging language. Before committing to bagging compost, complete market research. Selling bagged compost can improve a composter’s ability to market the product and increase its value, but there are many additional costs involved with bagging, as well as storage and distribution logistics. Small- to mid-sized composters can often generate greater profit through the sale of bulk product. 17.5 Competing Products An important component of market development is understanding competing products. Compost is often compared to peat, since both of the products can be used in many of the same applications. However, each product has its advantages and disadvantages when used in specific applications. Compost can also be compared to topsoil, bark, and fertilizers, depending on how it is being utilized. It is important to understand how compost compares to these products when communicating with specific market segments. 17.6 Transportation Product transportation is an important and basic service that most successful composters carefully manage. Developing an efficient transportation and delivery infrastructure is important to assisting compost sales and sales staff. Most compost applications are seasonal in nature and time dependant, so on-time delivery is critical. It is necessary to have access to the proper equipment to handle peak production and sales periods (seasons), and the specific type and size of equipment necessary to transfer product to the customer’s specific location. The majority of composters do not get into the compost transportation business because they want to—they do it because it improves compost sales. Further, many composters do not own or operate trucking equipment; they simply contract out to trucking companies and manage the logistics on behalf of their customers. Owning and operating the equipment requires a totally different skill set and that, along with staffing, equipment needs, and insurance coverage, can provide some significant barriers to entry. It may be best to identify and then align with several area transportation companies that can provide the service required, and focus on producing and selling compost. Transporting bulk and bagged product is quite different. With bulk compost, a full truckload (5 to 100 cubic metres [m3], depending on the delivery truck type) is typically purchased. With bagged product, many customers do not purchase a full truckload of one type of bagged compost product. Therefore, if a compost producer is serious about bagging, they will likely be required to produce a series of bagged products (e.g., soil amendment, topsoil, potting mix, and mulch). By offering their customers a variety of products (a product line), they can more easily fill an order large enough to deliver competitively. 17-9 18. System Selection This Technical Document’s preceding chapters provided detailed information on the specific components and technologies available for managing municipal solid waste (MSW) organics. The purpose of this chapter is to demonstrate how these various components can be brought together with existing or planned programs to form an integrated system. This chapter also shows how organics management can complement other components of the waste management system, identify whether effects on collection and residual disposal will be significant, and define the key community benefits gained by embarking on an organics management program. This chapter covers: • • • 18.1 Section 18.1, Factors to Consider Section 18.2, Common Technology Combinations Section 18.3, Evaluation of Program and Technology Combinations Factors to Consider Many factors influence which organic waste collection programs and processing technologies to implement, including the community’s waste diversion targets, the desired level of convenience for the system user, processing facility site selection, commitments to greenhouse gas (GHG) reductions, and costs. The relative importance of these factors help to determine which technologies are most appropriate, such as a composting system, an anaerobic digestion (AD) system, or a combination of both. The effects of technology combinations on a community’s or region’s integrated system should also be evaluated. Determining the size of the processing facility is another key consideration, which is heavily dependent on the types and quantities of feedstocks diverted through the collection program, as well as the location of the proposed processing facility. Once the program and technology are decided upon, how they integrate into the existing waste management system should be considered. In particular, implications on staffing and possible reallocation of staff, capital and operating costs, funding methods, and changes to operating budgets must be determined. 18.2 Common Technology Combinations The intent of this chapter is not to recommend the best integrated system but to show how integrated systems can be developed, and outline a means to determine the best solution for a particular situation. As it would be impractical to list all possible technology combinations and define how they affect the various aspects of an integrated system or how they help achieve desired goals, five common technology 18-1 18. System Selection combinations have been selected and are described to demonstrate how to apply and combine the information provided in preceding chapters. These technology combinations are not intended to be all-inclusive but represent the most common integrated systems. These systems may apply directly to the reader’s situation, but it is more likely that they will be modified or new system options developed that are a better fit for regional conditions. The list of systems presented range from the simplest form of leaf and yard waste (L&YW) composting, to more sophisticated systems suitable mainly for larger metropolitan areas with ambitious diversion and GHG reduction goals. Table 18-1 provides a high-level summary of the organic system components. Table 18-1: Common MSW organics technology combinations Feedstock Option Processing method L&YW Food waste 1 P 2 3 Product(s) Composting AD O Windrow N/A Compost P P Combined processing in an actively aerated system N/A Compost P P L&YW processed in windrows N/A Compost Food waste processed separately in an actively aerated system 4 P P L&YW processed in windrows Food waste processed in an AD system; digestate is composted Compost and energy 5 P P L&YW processed in windrows Food waste co-digested in existing AD system at WWTP; digestate is composted Compost and energy Notes: WWTP—wastewater treatment plant Curbside collection and transfer programs/methods also need to be considered during the development of organics management systems. Not only do the specific materials included within source-separated organic (SSO) collection programs help to define the processing systems, but curbside collection truck routing, collection truck fleet size, and transfer requirements can strongly influence overall system costs. In some cases, collection and transfer costs have a greater impact on overall system costs than processing facility construction and operational costs. Each of these systems, along with the impacts that they have on the overall waste management system, is described in the following sections. The impacts are divided into the following categories: • • • 18-2 Waste quantity: types and typical quantities of organic wastes that can be diverted from the MSW stream Waste diversion potential: some systems are more effective at diverting organics from the waste stream Collection program: ease of collection, considering collection methods and collection streams 18. • • • • • • System Selection User convenience: level of effort required by waste generators to sort and prepare SSO for collection Compost quality: level of feedstock quality control Compost markets: effect on supply, price, and ease of selling compost Energy: energy consumption or recovery (e.g., renewable energy production) GHG reductions: GHG reduction potential depends on the level of organics diversion from landfills, energy consumption within the integrated system, and the production of renewable energy Relative costs: capital and operating cost requirements Since the technology combinations are highly variable, some of the impacts also vary. The effects of different technology combinations on the waste management system organics program are presented on a qualitative basis. Equally important is how existing infrastructure can affect the selection of technology combinations for organics management. For example, a recently acquired collection vehicle fleet may limit the selection of composting technologies to those that do not require new collection equipment; or a wastewater treatment system with enough AD capacity to also handle food waste could eliminate the need for new in-vessel composting infrastructure. 18.2.1 Combination 1: Collection and Windrow Composting of L&YW Only This is a well-understood program that has been implemented by many municipalities in Canada. It allows for diversion of L&YW (low diversion rate) generated by single-family households and professional landscaping companies that service multifamily and commercial properties. The quantities of L&YW generated are seasonal, with peaks (on a weight basis) typically occurring in the late spring/early summer and the fall, with the lowest quantities collected during the winter. Food waste organics from the residential and commercial sectors are not covered by this combination. Figure 18-1 illustrates how Combination 1 fits into an overall waste management system, and Table 18-2 provides a summary of key program measures. Typical applications for Combination 1 are small communities with limited budgets, or areas with predominantly single-family households, which are serviced by municipal waste collection systems. However, there are also larger cities that have implemented and rely on this type of diversion program. Table 18-2: Combination 1: Collection and windrow composting of L&YW only (cont’d) Combination 1 Collection and windrow composting of L&YW only Waste quantity 500 to 30 000 tpy of L&YW Waste diversion potential Only L&YW is diverted. Food waste is not diverted and is disposed of via landfilling. Collection program Separate source segregation and curbside collection of L&YW requires more effort by program participants, and extra truck trips for collection. However, the collection is seasonal (spring through fall). Use of drop-off depots is appropriate in most cases. Depots are easier and less costly to manage than curbside programs. However, participation and diversion rates would be low compared to curbside programs, which are more convenient. 18-3 18. System Selection Table 18-2: Combination 1: Collection and windrow composting of L&YW only (cont’d) Combination 1 Collection and windrow composting of L&YW only User convenience Convenience (thus, the quantity of L&YW diverted) depends on the collection program. Drop-off programs are generally less convenient and do not capture as much material, but are less costly than curbside programs. Curbside programs divert more material, but the higher convenience may not encourage onsite organic waste reduction practices (e.g., home composting). Compost quality Compost produced from L&YW is generally a high-quality product, especially when plastic bags are not allowed in the collection program. This material is generally suitable for unrestricted use. Compost markets Product is easily sold when quantities are small. Many communities already have some degree of L&YW composting, markets are established, and the product is accepted. Larger programs may need to distribute products into two or more markets, and be aware of competing regional products (e.g., topsoil and peat). Energy Low energy usage, since simple technology is employed, but also no production of renewable energy. GHG reductions Obtained from landfill diversion and compost use. The type of collection program and associated diversion rate dictates GHG reductions, as well as other environmental benefits. In this scenario, food waste would still be landfilled so would contribute to landfill gas generation. Relative costs Seasonal composting of L&YW offers the lowest relative overall system costs. Notes: tpy—tonnes per year Figure 18-1: Combination 1: Collection and windrow composting of L&YW only 18-4 18. System Selection 18.2.2 Combination 2: Combined Collection and Composting of Food Waste with L&YW in an Actively Aerated Composting System The next logical step is to add the food waste generated in single- and multifamily households, commercial businesses (e.g., restaurants, grocery stores, and food processors), and institutions (e.g., hospitals and schools). Food waste is one of the largest remaining components in the waste stream currently being landfilled in most communities, so is a target for collection and utilization. In this technology combination, food waste organics and L&YW are collected together through curbside programs. The materials are delivered to one or more central facilities where they are composted together using an actively aerated technology that is appropriate for the quantities of material (e.g., covered aerated static piles, tunnels, agitated beds, or others, as described in Chapter 5). Figure 18-2 illustrates how Combination 2 fits into an overall waste management system, and Table 18-3 summaries key program measurements. Figure 18-2: Combination 2: Combined collection and composting of food waste with L&YW in an actively aerated composting system 18-5 18. System Selection Table 18-3: Combination 2: Combined collection and composting of food waste with L&YW in an actively aerated composting system Combination 2 Combined collection and composting of food waste with L&YW in an actively aerated composting system Waste quantity 1 000 to 150 000 tpy of SSO Waste diversion potential Can accept virtually all food waste and L&YW materials, so results in high waste diversion. Collection program Inclusion of food waste increases the potential for nuisances and the need for frequent collection. Drop-off depots are generally not appropriate for collection of feedstock that includes food wastes. Community-based depots may be feasible in smaller communities, but experience with this approach is limited. Curbside programs are more common, but generally require the use of a rigid container, particularly if automated collection is to be employed. The size of the rigid container required (and also whether additional materials placed in paper bags will be collected) depends on how much L&YW is produced, and whether the program’s goal is to collect all of the L&YW or only a limited amount. Programs can be adapted to commercial sources, although the quantity of L&YW from these sources is often significantly lower than from residential sources. User convenience Combined collection of food waste and L&YW is one of the most convenient organic waste diversion programs for residents, since there is less work required to sort and prepare the organics for collection. Large containers are needed to accommodate high quantities of L&YW generated in peak periods, but these containers will be largely empty in the winter when only food waste is generated. Maintaining regular collection during the winter is important to maintaining high levels of participation. Compost quality Compost produced from food waste and L&YW is generally a high-quality product suitable for unrestricted use. As with the previous combination, compost product quality is improved if plastic bags are not allowed in the collection program. Compost markets Markets need to be developed early in the process. For larger programs, a sudden large supply of compost could depress soil amendment markets, at least in the short term, having an adverse effect on project economics and, perhaps, resulting in stockpiles of unsold compost. Energy No renewable energy is produced, but composting technologies are net users of energy. GHG reductions Keeping food waste and L&YW out of landfills provides medium to high GHG benefits compared to landfilling, where organics generate landfill gas. GHG benefits are maximized when high diversion rates are achieved. Relative costs Many composting technologies are available to process the combination of food waste and L&YW. The choice of technology depends on the quantities of feedstock, seasonal variations, and siting considerations (see Chapter 8). Processing costs are less than those of systems that involve AD, but more than systems that rely exclusively on outdoor windrow composting. Typical applications and variations 18-6 For small- to mid-scale programs (e.g., less than 15 000 tpy), a variation of this combination may include processing through windrow composting with an enclosed receiving area. 18. System Selection 18.2.3 Combination 3: Collection and Actively Aerated Composting of Food Waste, and Separate Collection and Windrow Composting of L&YW As shown in Figure 18-3, this approach requires separate collection programs for food wastes and L&YW, which has the obvious impact of raising overall collection costs. However, separating food waste composting from L&YW composting has the potential to reduce processing costs. Food wastes are generated at a fairly constant volume year-round. A system built to collect and process them could be operated at near 100% capacity all year long to maximize diversion. L&YW varies seasonally in terms of both quantities and composition. If collected together with food waste, the combined material can vary dramatically throughout the year, leading to the composting system being underutilized for several months of the year, and also raising operating costs. The success of using windrow composting to process L&YW is well-documented. This approach also has relatively low capital and operating costs; thus, there is merit in separating L&YW materials. The smaller volume of food waste can then be processed in a smaller and more efficient compost facility designed to run at capacity for most of the year. Figure 18-3 illustrates how this combination integrates into the overall waste management system. Figure 18-3: Combination 3: Collection and actively aerated composting of food waste, and separate collection and windrow composting of L&YW 18-7 18. System Selection Table 18-4 provides a summary of key program measures. Table 18-4: Combination 3: Collection and actively aerated composting of food waste, and separate collection and windrow composting of L&YW (con’t) Combination 3 Collection and actively aerated composting of food wastes, and separate collection and windrow composting of L&YW Waste quantity 5 000 to 150 000 tpy of SSO Waste diversion potential Can accept virtually all organic feedstocks, so results in high diversion rates. Collection program Inclusion of food waste in the collection program increases the potential for nuisances. Dropoff depots are generally not appropriate for collection of feedstock that includes food wastes. Curbside food waste diversion programs require regular and frequent collection. However, removing organic waste from the MSW stream means that it may be possible to reduce the collection frequency for the remaining garbage, particularly during winter. Separate collection of food waste and L&YW often requires additional truck trips for collection. Collection of L&YW is not necessary during the winter in most areas of Canada. Drop-off depots can be used to complement curbside collection of L&YW, allowing for reduced frequency of curbside collection during summer (e.g., biweekly instead of weekly) or limiting the quantity of material that can be set out at the curb. Since food waste is produced in relatively consistent quantities throughout the year, it may be feasible and more cost-effective to collect it at the same time as another material (e.g., garbage and recyclables) using a dual-compartment collection truck. This approach requires that the destination for the two materials be relatively close to each other. Collection of food waste from commercial sources can be integrated into this system, but often requires financial incentives and/or regulatory measures (e.g., organic waste disposal bans and tipping fee surcharges) to increase ICI sector participation. User convenience Separate curbside collection of food waste and L&YW requires two containers or bags (in addition to containers/bags needed for residual waste and recyclable services), which can be problematic for residents with small or constrained properties. Scheduling of organics, waste, and recyclables collection pickups on an alternating week basis can reduce collection costs, but can lead to confusion for residents if not well advertised. Compost quality Composts produced from L&YW and SSO are generally high-quality products suitable for unrestricted use. Compost markets Same as Combination 2, as well as being able to offer different types of compost for different applications, which may help sell product. Product quality is a benefit. Energy Providing two parallel collection programs results in higher energy usage. However, this can be offset if the collection frequency of the remaining garbage is reduced. Processing L&YW through a windrow system results in a smaller actively aerated composting system relative to Combination 2; therefore, energy consumption is generally lower. This combination does not result in the production of renewable energy. GHG reductions 18-8 Keeping organics out of landfills provides medium to high GHG benefits compared to landfilling, where organics generate landfill gas. 18. System Selection Table 18-4: Combination 3: Collection and actively aerated composting of food waste, and separate collection and windrow composting of L&YW (con’t) Combination 3 Relative costs Collection and actively aerated composting of food wastes, and separate collection and windrow composting of L&YW Collection costs may be higher relative to a system where food waste and L&YW waste are collected together. If the food waste and L&YW composting facilities are completely separate, some duplication of overhead is likely, increasing overall system processing costs. If both operations are located at the same site, the windrow operation can be used for food waste curing, as well as L&YW composting. This sharing of overhead and resources can reduce overall system processing costs. Overall, processing costs are less expensive than systems that involve AD, but more expensive than processing systems that exclusively use outdoor windrow composting. Typical applications and variations This combination is particularly appropriate for large urban areas where food waste can be collected in small containers using dual-compartment trucks, and where transfer stations or processing facilities for food waste and the co-collected material are close together. It is typically not feasible to site an outdoor windrow composting facility, even one that processes only L&YW, in a heavily urbanized area. This combination favours a windrow facility that is a significant distance from urban areas. If the program is implemented within a large region or metropolitan area, it may be possible to develop several smaller processing facilities and reduce overall collection costs by reducing hauling distances. Another option is to complete the active composting of food waste in an enclosed facility located in an urban area, and transfer the material to the remote L&YW composting facility for curing and final screening. Notes: ICI—industrial, commercial, and institutional 18-9 18. System Selection 18.2.4 Combination 4: Collection and Processing of Food Waste in an AD Facility, and Separate Collection and Windrow Composting of L&YW In this technology combination, the emphasis is on generation of energy and GHG reductions. Food waste organics, which are most suitable for AD, are collected separately, as in Combination 3, but instead of being in-vessel composted, they are anaerobically digested to create a biogas that can be used to displace fossil fuels. The digestate from the AD system typically needs to be composted before it can be used as soil amendment. L&YW organics continue to be composted separately. Figure 18-4 illustrates the overall waste management system for Combination 4. As for Combination 3, collection systems will likely be impacted by separating the L&YW from the food waste organics at the source, since they will have to be collected separately. Table 18-5 summaries key program measurements. Figure 18-4: Combination 4: Collection and processing of food waste in an AD facility, and separate collection and windrow composting of L&YW 18-10 18. System Selection Table 18-5: Combination 4: Collection and processing of food waste in an AD facility, and separate collection and windrow composting of L&YW Combination 4 Collection and processing of food waste in an AD facility, and separate collection and windrow composting of L&YW Waste quantity 10 000 to 150 000+ tpy of SSO Waste diversion potential Same as Combination 3 Collection program Same as Combination 3 User convenience Same as Combination 3 Compost quality Composts produced from L&YW and digested SSO are generally high-quality products suitable for unrestricted use. Compost markets Compost produced from L&YW can be used in a wide range of markets. Digestate is generally also of high quality (after required treatment), although volumes are lower due to energy extraction. Energy Biogas generation from AD is a form of renewable energy that can be used to produce and displace electricity consumed by composting systems, or to produce a fossil fuel alternative for use in industrial heating or as a vehicle fuel. Where electricity is not produced through renewable means (e.g., hydroelectricity), converting biogas to a fossil fuel replacement results in higher environmental benefits. GHG reductions High GHG benefits due to the diversion of organics from landfills and the generation of renewable energy, which can displace fossil-fuel-based energy. Relative costs The capital and operating costs of AD systems are generally very high, depending on the economies of scale, and it takes a long time to create enough revenue from the sale of energy to help repay capital costs. Generally, this approach is more expensive to implement than a system that composts collected food waste and L&YW separately. However, opportunities for energy credits, green funding, and local energy use can make this option cost-competitive when all direct and indirect cost benefits are taken into account in a full life-cycle assessment. Typical applications and variations As with Combination 3, the food waste processing facility may be easier to site in a densely populated area where footprint and setback distances are critical issues. The economics associated with biogas utilization options are generally preferable when the AD facility is sited in an urban area. The capacity factor is of particular importance, since economies of scale are more substantial with AD than with composting. Digestate from the AD system generally needs further treatment (e.g., composting) to create a high-quality soil amendment that can be used to improve soil conditions. Transfer and processing of the digestate at a standalone facility or at the L&YW composting facility are both options that can be implemented. 18-11 18. System Selection 18.2.5 Combination 5: Collection and AD of Food Waste at the Local WWTP with Biosolids, and Windrow Composting of L&YW at a Separate Facility This combination of technologies makes use of any excess capacity of existing AD infrastructure that is typically used at a municipality’s WWTP to treat biosolids and produce biogas. With no need for a separate AD facility, this approach benefits from a reduction in capital costs when food waste can be accommodated at the WWTP with only minor modifications. Studies have shown that this can be a very cost-effective way to manage food waste organics. This technical strategy is sometimes recommended in engineering studies; therefore, it is included as one of the potential combinations in this document. In this system, L&YW would be collected and composted separately, as shown in Figure 18-5. Table 18-6 outlines key program measurements. Figure 18-5: Combination 5: Collection and AD of food waste at the local WWTP with biosolids, and windrow composting of L&YW at a separate facility 18-12 18. System Selection Table 18-6: Combination 5: Collection and AD of food waste at the local WWTP with biosolids, and windrow composting of L&YW at a separate facility Combination 5 Collection and AD of food waste at the local WWTP with biosolids, and windrow composting of L&YW at a separate facility Waste quantity 20 000 to 150 000+ tpy Waste diversion potential Same as Combination 3 Collection program Same as Combination 3 User convenience Same as Combination 3 Compost quality Compost produced from L&YW is a high-quality product generally suitable for unrestricted use. Compost produced from the combination of food waste and biosolids would have many beneficial properties but may contain higher concentrations of some trace elements. Regulations in some provinces may limit the use and/or application rates of this product. Compost markets Compost made from L&YW can be used in a wide range of markets. Depending on local requirements, regulations, and public perception, compost made from biosolids may or may not have markets. Energy This option offers a high degree of energy recovery, since biogas is recovered from the food waste and the biosolids. The biogas generated can be used to produce and displace electricity consumed by the WWTP. GHG reductions High GHG benefits due to the diversion of organics from landfills and the generation of renewable energy that can displace fossil-fuel-based energy. Relative costs Utilizing existing or slightly expanded and modified anaerobic digesters at WWTPs results in lower capital costs and some economies of scale with operating costs. From a capital and operational perspective, this option may be competitive with in-vessel composting systems, since revenue from the sale of energy is generally higher than from the sale of soil amendment. Seasonal composting of L&YW offers a low overall system cost impact. 18.3 Evaluation of Program and Technology Combinations The five common combinations of organic waste diversion and processing programs described in the previous section represent the most common integrated systems, and provide for a range of diversion rates. Table 18-7 provides a summary of the qualitative characteristics of these common technology combinations. Once systems have been fully defined, the next step of the evaluation and decision process is to analyze the systems using a uniform set of region-specific environmental and social criteria to determine the relative value of the systems. There are numerous methods for completing valuations of environmental and social impacts of programs and projects. These range from simple, three-level rating systems (e.g., high, medium, and low) to processes that involve complex rating schemes, weighting of criteria, and stakeholder voting processes. An in-depth discussion of these various methods is beyond the scope of this Technical Document. Parallel to the value analysis, a system life-cycle assessment of capital and operating costs is also normally prepared to define financial impacts. The combination of value and financial assessments for each system then allows evaluators and decision-makers to identify the preferred system. Regardless of the evaluation process used, it is important to include all stakeholders in the decision process, and to recognize and incorporate or address their opinions. The evaluation process should also be consensus-based so that the input of all stakeholders is given equivalent weighting. 18-13 5. Aerobic 18. System Selection Processing Technologies Table 18-7: Common technology combinations: summary of qualitative characteristics No. Technology combination Waste quantity (SSO tpy) Waste diversion potential User convenience Compost quality Compost markets Energy GHG reductions Relative costs 1 Collection and windrow composting of L&YW only 500 to 30 000 Low Low to medium High High N/A Low Low 2 Combined collection and composting of food waste with L&YW in an actively aerated composting system 1 000 to 150 000 High High High Medium N/A Medium to high Medium 3 Collection and actively aerated composting of food waste, and separate collection and windrow composting of L&YW 5 000 to 150 000 High Medium High Medium to high N/A Medium to high Medium 4 Collection and processing 20 000 to 150 000 of food waste in an AD facility, and separate collection and windrow composting of L&YW High Medium High Medium to high Medium to high High High 5 Collection and AD of food waste at the local WWTP with biosolids, and windrow composting of L&YW at a separate facility 20 000 to 150 000 High Medium Medium to high Medium to high Medium to high High Medium to high Notes: N/A—not applicable 18-14 References Agro Énergie. 2012. Pelletizing. Alexander, Ron. 2003. The Practical Guide to Compost Marketing and Sales. 1st ed. R. Alexander Associates, Inc. Arsova, L. 2010. Anaerobic digestion of food waste: Current status, problems and an alternative product. Unpublished master’s thesis. Columbia University. May. ASTM International (ASTM). 2011. Standard Practice for Determination of Odor and Taste Thresholds by a Forced-Choice Ascending Concentration Series Method of Limits. ASTM E-679-04 (2011). BioCycle. 2002. “Harnessing Energy from Manures and Bean Curd in Japan.” The BioCycle Guide to Anaerobic Digestion. JG Press. Bogg, Jeff/ZeroWaste Energy. Vice President. 2012. Personal Communication Tom Kraemer/CH2M HILL. April 24. Bujoczek, G. 2001. Influence of Ammonia and Other Abiotic Factors on Microbial Activity and Pathogen Inactivation During Processing of High-Solid Residues. Doctoral thesis. University of Manitoba. Bureau de Normalisation du Québec (BNQ). 2005. Organic Soil Conditioners—Composts . (Amendements Organiques—Composts). CAN/BNQ 0413-200-2005. January. Bureau de Normalisation du Québec (BNQ). 2007. Compostable Plastic Bags—Certification Program. BNQ 9011-911/2007. September. California Integrated Waste Management Board (CIWMB). 2008. Current Anaerobic Digestion Technologies Used for Treatment of Municipal Organic Solid Waste. Prepared for the California Environmental Protection Agency. March. Cammack, Richard, Teresa Atwood, Peter Campbell, Howard Parish, Tony Smith, John Stirling, and Frank Vella, eds. 2006. Oxford Dictionary of Biochemistry and Molecular Biology. 2nd. ed. August. Canadian Council of Ministers of the Environment (CCME). 2005. Guideline for Compost Quality. Canadian Food Inspection Agency (CFIA). 1985. Fertilizers Act. R.S.C., c. F-10. Canadian Food Inspection Agency (CFIA). 1993. The Fertilizer Act and Regulations: Trade Memorandum T-4-93: Standards for Metals in Fertilizer and Supplements. R-1 References Canadian Food Inspection Agency (CFIA). 2009. The Fertilizer Act and Regulations: Trade Memorandum T-4-120: Regulation of Compost. Canadian Food Inspection Agency (CFIA). 2011. Fertilizer Regulations. C.R.C., c. 666. Canadian Gas Association (CGA). 2012. Biomethane Guidelines for the Introduction of Biomethane into Existing Natural Gas Distribution & Transmission Systems. Standing Committee on Operations, Biomethane Task Force. February. Central Marin County. 2011. Central Marin County Commercial Food-to-Energy (F2E) Program. Presented at the California Biomass Collaborative, Oakland, California. April 6. CH2M HILL Canada Limited (CH2M HILL). The City of Calgary 2010 Residential Waste Composition Study. Prepared for the City of Calgary. May. Chynoweth, D.P., et al. 1993. “Biochemical Methane Potential of Biomass and Waste Feedstocks.” Biomass Energy. Vol. 5. Clarke, W.P. 2000. “Cost-benefit analysis of introducing technology to rapidly degrade municipal solid waste.” Waste Management & Research. 18(6). CM Consulting. 2007. Measuring the benefits of composting source separated organics in the Region of Niagara. Prepared for the Region of Niagara. December. Cornerstone Environmental Group, LLC (Cornerstone). 2011. Small Landfill Gas to Compressed Natural Gas Vehicle Fuel Project. Presented by Mark J. Torresani at the 11th Annual Biocycle Renewable Energy from Organics Recycling Conference, Madison, Wisconsin. October 31. Coward, H.F. and G.W. Jones. 1952. “Limits of Flammability of Gases and Vapors.” Bulletin 503 Bureau of Mines. United States Department of the Interior. Washington, DC: United States Government Printing Office Eder B., and H. Schulz. 2006. Biogas Practice: Fundamentals, Planning, Construction, Examples, Economics. 3rd ed. Staufen, Germany: Ökobuch Verlag. Erdal, Z.K., F. Soroushian, P. Cambiaso, and E. Whitman. 2006. Steps to Implementation of Biosolids and Manure Management and Bioenergy Recovery through Co-Digestion with Food Waste. Proceedings from WEF/AWWA Joint Residuals and Biosolids Management Conference. Cincinnati: Water Environment Federation/American Water Works Association. Federation of Canadian Municipalities (FCM). 2009. Getting to 50% and Beyond: Waste Diversion Success Stories from Canadian Municipalities. Green Municipal Fund. Fisheries and Oceans Canada (DFO). 1985. Fisheries Act. R.S.C., c. F-14. GPI Atlantic. 2004. The Nova Scotia GPI Solid Waste-Resource Accounts. July. R-2 References Graubard, D., William Rouleau, and Jean Bogner. 2011. Cost-Effective Technologies for Removing H2S from Landfill Gas. Merichem. Heguy, D., and J. Bogner. 2011. Cost-Effective Hydrogen Sulfide Treatment Strategies for Commercial Landfill Gas Recovery: Role of Increasing C&D (Construction and Demolition) Waste. Merichem. ICF Consulting (ICF). 2005. Determination of the Impact of Waste Management Activities on Greenhouse Gas Emissions: 2005 Update. Final Report. Prepared for Environment Canada and Natural Resources Canada. October 31. International Energy Agency (IEA). 2008. From Biogas to Green Gas, The Netherlands. IEA Bioenergy Task 37. Kelleher, Maria. 2007. “Anaerobic Digestion Outlook for MSW Streams.” BioCycle. Vol. 48, No. 8. August. Kennedy/Jenks Consultants. 2008. Methane Capture Feasibility Study—City of San Rafael and Central Marin Sanitation Agency. December. Kocar, G., and A. Eryasar. 2007. “An Application of Solar Energy Storage in the Gas: Solar Heated Biogas Plants.” Energy Sources. Part A, 29:1513–1520. Luning L., E.H. van Zundert, and A.J. Brinkmann. 2003. “Comparison of dry and wet digestion for solid waste.” Water Sci . Technol. 48(4). McCartney, D.M., and J.A. Oleszkiewicz. 1993. “Competition Between Methanogens and Sulfate Reducers: Effect of COD: Sulfate Ratio and Acclimation.” Water Environment Research. Vol. 65. Metcalf and Eddy. 2002. Wastewater Engineering. 4th ed. McGraw Hill. Moffatt, Brandon/Stormfisher Biogas. 2011. Personal communication with Tom Kraemer/CH2M HILL. October. Morawski, C. 2008. “The New ‘Eco-Currecy’.” Solid Waste & Recycling. December/January. Morris, J. 2005. “Comparative LCAs for Curbside Recycling Versus Either Landfilling or Incineration with Energy Recovery.” The International Journal of Life Cycle Assessment. Vol. 10, No. 4. Murray, C.M., and J.L. Thompson. 1986. “Strategies for Aerated Pile Systems.” BioCycle. 7, 22. July. Ostrem, Karena. 2004. Greening Waste: Anaerobic Digestion for Treating the Organic Fraction of Municipal Solid Wastes. Master’s thesis. Columbia University. May. Owens, J.M, and D.P. Chynoweth. 1993. “Biochemical Methane Potential of MSW Components.” Water Sci . Technol. Vol. 27. Palmisano, Anna, and Morton Barlaz. 1996. Microbiology of Solid Waste. CRC Press. R-3 References Pierce, J. 2005. Siloxane quantification, removal and impact on landfill gas utilization facilities. Presentation at the 8th Annual Landfill Methane Outreach Program Conference and Project Expo, Baltimore, Maryland. January 10–11. R. Alexander Associates, Inc. 2003. National Erosion/Sediment Control Specifications for Composted Products. Recycling Council of Alberta. 2006. Municipal Solid Waste (MSW) Options: Integrating Organics Management and Residual Treatment/Disposal. April. Rittman, B.E., and P. McCarty. 2001. Environmental Biotechnology: Principles and Applications. McGraw Hill. Rosenfeld, P.E., J.J. Clark, A.R. Hensley, and I.H. Suffet. 2007. “The use of an odour wheel classification for the evaluation of human health risk criteria for compost facilities.” Water Sci . Technol. 55(5). Seereeram, Shanta. 2004. Anaerobic Digestion Trials. Smith Bellerby Limited. 2007. Recycling household food waste—The Low Carbon approach. August 30. Speece, R.E. 2008. Anaerobic Biotechnology and Odor/Corrosion Control for Municipalities and Industries. Archae Press. Steffen, R., O. Szolar, and R. Braun. 1998. Feedstocks for Anaerobic Digestion. Vienna, Austria: Institute for Agrobiotechnology, Tulln University of Agricultural Sciences. September 30. Transport Canada. 1985. Aeronautics Act. R.S.C., c. A-2. Tsilemou, K., and D. Panagiotakopoulos. 2006. “Approximate cost functions for solid waste treatment facilities.” Waste Management & Research. 24(4). United States Occupational Safety and Health Administration (OSHA). 2005. “Hydrogen Sulfide (H2S).” OSHA Fact Sheet. October. Verma, Shefali. 2002. Anaerobic Digestion of Biodegradable Organics in Municipal Solid Wastes. Doctoral thesis. Columbia University. Verschueren, K. 1983. Handbook of Environmental Data on Organic Chemicals. 2nd ed. Van Nostrand Reinhold Company. Water Environment Federation (WEF). 2004. Control of Odors and Emissions from Wastewater Treatment Plants. Alexandria, Virginia: WEF Press. Water Environment Federation (WEF). 2009. Design of Municipal Wastewater Treatment Plants. American Society of Civil Engineers (ASCE), and Environmental & Water Resources Institute. Alexandria, Virginia: WEF Press. R-4 References Wheless, E. and J. Pierce. 2004. Siloxanes in Landfill and Digester Gas Update. Proceedings of the 2004 Solid Waste Association of America Landfill Gas Symposium. Zhang et al. 2007. “Characterization of food waste as feedstock for anaerobic digestion.” Bioresource Technology. Vol. 98. R-5 Glossary Active Composting Area Aerated Static Pile (ASP) Aeration Aerobic Conditions Anaerobic Conditions Anaerobic Digestion (AD) Amendment Biodegradation Biogas Buffer Zone Bulking Agent Carbon-to-Nitrogen (C:N) Ratio Compost Composting G-1 Glossary Contaminant Contamination Curing Curing Area Digestate Digester Effluent Empty Bed Residence Time (EBRT) Feedstock Feedstock Preparation Area Food Waste Forced Aeration Foreign Matter Free Air Space (FAS) Groundwater G-2 Glossary High-Solids-Slurry Digester High-Solids-Stackable Digester Humus Inoculum In-Vessel Composting Leachate Leaf and Yard Waste (L&YW) Liner Mature Compost Mesophilic Micronutrients Microorganism Moisture Content Municipal Solid Waste (MSW) G-3 Glossary Passive Aeration Pathogens pH Phytotoxic Plug-Flow Porosity Pressure Swing Adsorption Process to Further Reduce Pathogens (PFRP) Processing Area Putrescible Receiving Area Residence/Retention Time Retention Pond Runoff G-4 Glossary Screening Sharp Foreign Matter (Sharps) Source-Separated Organics (SSO) Source Separation Stability (of Compost) Stable Compost Stackable Static Pile Thermophilic Tipping Fees Trace Elements Turning Volatile Organic Compounds (VOCs) Naturally occurring or synthetic chemical compounds that have a high vapour pressure during ordinary conditions, causing large amounts of molecules to evaporate and enter the surrounding air, resulting in odours. Volatile Solids G-5 Glossary Water Content Wet (Low-Solids) Digester Windrow Working Surface G-6


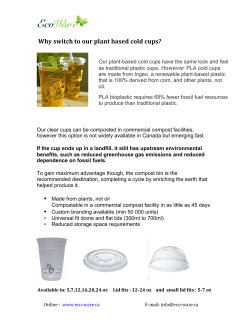


© Copyright 2026