
OPEC
Monthly Oil Market Report
15 January 2015
Feature article:
Monetary policies and their impact on the oil market
Oil market highlights
1
Feature article
3
Crude oil price movements
5
Commodity markets
12
World economy
17
World oil demand
37
World oil supply
45
Product markets and refinery operations
63
Tanker market
70
Oil trade
74
Stock movements
82
Balance of supply and demand
90
Oil market highlights
Crude Oil Price Movements
The OPEC Reference Basket averaged $59.46/b in December, following a decline of
$16.11 or 21%. In annual terms, the Basket averaged $96.29/b in 2014, representing a
decline of $9.58 from the previous year. ICE Brent in December plunged $16.36 to stand at
$63.27/b, averaging $99.45/b for the year. Nymex WTI lost $16.52 to stand at $59.29/b in
December, for a yearly value of $92.97/b. The Brent-WTI spread stood at $3.98/b.
World Economy
World economic growth for 2014 and 2015 remains unchanged from the previous
month at 3.2% and 3.6%, respectively. The OECD growth estimate is unchanged at
1.8% for 2014, but the 2015 forecast has been revised to 2.2% from 2.1%. The
forecasts for China and India remain unchanged at 7.2% and 5.8% in 2015,
respectively.
World Oil Demand
Global oil demand is estimated to have grown by 0.95 mb/d in 2014, representing an
upward revision of 20 tb/d from the previous month. The adjustment mainly reflects
better-than-expected oil demand data from OECD America and China. In 2015, world
oil demand is anticipated to rise by 1.15 mb/d, following an upward revision of 30 tb/d
due to expectations of higher oil requirements in OECD America and Other Asia.
World Oil Supply
Non-OPEC oil supply is estimated to have grown by 1.98 mb/d in 2014, following an
upward revision of 260 tb/d from the previous report, driven by higher than expected
growth seen at the end of the year. In 2015, non-OPEC oil supply is projected to grow
by 1.28 mb/d, representing a downward revision of 80 tb/d from the previous report.
OPEC NGLs and non-conventional liquids are expected to average 6.03 mb/d in 2015,
up from 5.83 mb/d in 2014. In December, OPEC crude oil production averaged
30.20 mb/d, according to secondary sources, an increase of 0.14 mb/d over the
previous month.
Product Markets and Refining Operations
Product markets in the Atlantic Basin weakened in December as margins were affected
by the drop in the gasoline and middle distillates cracks amid an oversupply of gasoline
in the region. The Asian market experienced only a slight drop as increased distillate
supplies were offset by winter seasonal demand and the positive performance at the
top and bottom of the barrel.
Tanker Market
Freight rates for dirty tankers saw mixed movements in December. VLCCs continued to
realise the gains seen since the beginning of 4Q14, increasing by 16% from the month
before. The improvements seen in VLCC freight rates came as a result of an active
market and high Asian tonnage demand. Both Suezmax and Aframax saw a negative
performance, declining by 9% and 29%, respectively, on average from a month earlier.
OPEC spot fixtures dropped by 9.2% from the previous month to average 11.63 mb/d.
Stock Movements
OECD commercial oil stocks fell in November by around 10 mb to stand at 2,710 mb. At
this level, inventories were 20.3 mb higher than the last five-year average. Crude
indicated a surplus of 38.2 mb, while product stocks remained 17.9 mb below the
five-year average. In terms of days of forward cover, OECD commercial stocks stood at
58.7 days, one day above the five-year average.
Balance of Supply and Demand
Demand for OPEC crude is estimated at 29.1 mb/d in 2014, representing a revision of
0.2 mb/d from the last report. In 2015, required OPEC crude is projected at 28.8 mb/d,
following a downward adjustment of 0.1 mb/d.
OPEC Monthly Oil Market Report – January 2015
1
2
OPEC Monthly Oil Market Report – January 2015
Monetary policies and their impact on the oil market
Since the recession in 2009, monetary policies of the developed economies have been an influential
driver of commodity markets. The extraordinary monetary stimulus measures taken have increased
monetary supply significantly, affecting commodity markets through three channels. Firstly, low-yields in
developed economies led to increased capital flows into emerging and, to some extent, developing
economies. This supported higher GDP growth in these countries and increased demand for
commodities. Secondly, the low interest rate environment allowed for considerable investments to
expand commodity production. Finally, inexpensive funding and concerns about higher inflation led to
increased speculative and hedging investment flows into commodity markets, particularly in oil and gold.
These measures supported commodity markets up to around 1H13, after which they were negatively
impacted by expectations of a tapering by the US central bank, in combination with excess supply,
decelerating inflation, and sluggish growth in the emerging economies. In contrast to other commodity
markets, the oil market remained relatively stable up to the middle of last year, when it followed the
downward trend of other growth sensitive commodities such as industrial metals (Graph 1).
40
2009
2,000
1,500
2010
2011
2012
2013
2014
Sources: Federal Reserve Board, ICE and Haver Analytics.
US dollar index (RHS)
Euro-zone CPI
Japan CPI
Nov 14
Sep 14
Jul 14
2,500
US assets
(RHS)
60
May 14
3,000
80
Mar 14
3,500
Jan 14
4,000
ICE Brent
(LHS)
100
Nov 13
4,500
Index
115
110
105
100
95
90
Sep 13
1H 13
120
% change y-o-y
5.0
4.0
3.0
2.0
1.0
0.0
-1.0
Jul 13
US$ bn
5,000
May 13
R2 (2009-13) = 0.73
Mar 13
US$/b
140
Graph 2: US dollar index (trade weighted) and
consumer price index in selected areas
Jan 13
Graph 1: Correlation between Brent and US assets
US CPI
Asia-Pacific EM CPI
Sources: Federeal Reserve Board, Statistical Office of European
Communities and Haver Analytics.
The policies of major central banks will remain an important factor to monitor in the current year. An
expected interest rate rise by the Fed by the end of the first half and contrary policies by the European
Central Bank (ECB) and the Bank of Japan (BoJ) will continue to impact global economic growth. Given
the inflation-dampening effect of the sharp decline in oil prices, central banks may have more flexibility in
keeping or increasing interest rates and for pursuing other monetary policies (Graph 2). In the case of
the ECB, more accommodative policies may have to be adopted in the face of deflationary pressure.
These differing policies have already had a substantial effect on currency markets and thus impacted oil
markets. The strong appreciation of the US dollar was one of the factors behind the recent decline in oil
prices; however, the depreciation of the euro, the yen and some emerging market currencies has so far
limited the positive impact on oil demand. Furthermore, an increase in US interest rates would make
borrowing costs for different industries more expensive, including those for oil.
In the emerging markets, China’s central bank also recently lowered key interest rates in a push to
support economic growth. With currently less inflationary pressure, this move and potentially further
monetary supply measures are expected to support growth at above 7%, leading to rising crude oil
demand. In India, the recent decline in oil prices has provided some room for the country’s central bank
to lower its interest rate in order to support the economy, potentially leading to higher crude oil demand.
Some risk to oil demand growth in the emerging and developing economies might still come if the US
central bank were to raise interest rates earlier or faster than currently anticipated, as this might lead to
significant capital outflows from these countries, impacting their economic and oil demand growth. At the
same time, structural reforms in the emerging and developing economies could also impact oil demand
in 2015.
OPEC Monthly Oil Market Report – January 2015
3
4
OPEC Monthly Oil Market Report – January 2015
Crude Oil Price Movements
Crude Oil Price Movements
The OPEC Reference Basket (ORB) ended December down 21% to its lowest
value since May 2009. In the second half of 2014, the ORB lost about half its
value amid an imbalance in oil market supply/demand fundamentals. In
December, the ORB dropped $16.11 to $59.46/b and its yearly value was down
$9.58 to $96.29/b. Oil futures tumbled sharply by more than a hefty 20% to their
lowest values in more than five-and-a-half years amid an enduring bearish
market environment, particularly from the supply side that has surrounded the
oil market for six months now. The ICE Brent contract plunged $16.36 m-o-m to
$63.27/b, ending 2014 at an average of $99.51/b. The Nymex WTI contract lost
$16.52 to $59.29/b, while its yearly value dropped to $93/b. Meanwhile,
speculative bets on a rebound in oil prices rose sharply over the month,
particularly for ICE Brent, as crude oil prices reached a five-year low. The spread
between ICE Brent and Nymex crude has been shrinking since mid-December,
when ICE Brent's premium stood above $5/b, as the global glut has weighed
more heavily on ICE Brent than Nymex crude. For December the Brent-WTI
spread averaged $3.89/b.
OPEC Reference Basket
The ORB registered a fresh five-and-a-half-year low, falling by more than $15 in
December to settle at an average of $59.46/b, its lowest point since May 2009. Oil
prices continued to fall amid a fundamental imbalance, as world oil production was up
by nearly 2 mb/d in 2014, but demand growth slowed to less than 1 mb/d. Prices fell
sharply in December, even though unrest in Libya prompted a suspension of output at
two large fields in the country. Production increases in Russia and elsewhere
overshadowed drops in Libya's oil output. Russia's oil output hit a post-Soviet high,
averaging 10.58 mb/d, up 0.7%. Negative economic data from China and Russia and a
stronger US dollar also contributed to downward pressure on crude oil prices. For the
year, the ORB shed about $10 amid a six-month-long sell-off that began in June on
concerns of oversupply and lower demand growth. Global production has been rising
more rapidly than refiners can absorb it. North American output is 1.7 mb/d higher than
the previous year, more than enough to meet expected growth in demand. In addition,
a 600,000 b/d surge in Libyan production over the summer left reported crude stocks at
a five-and-a-half-year high at the end of October, as extra crude cargoes reached
refineries in the middle of the maintenance season. This flurry of bearish factors during
the second half of the year pushed the ORB value, along with global crude oil prices, to
more than five-year lows, with the Basket losing nearly half of its value over the course
of six months starting in June 2014, falling from $107.89/b in June to $59.46/b in
December.
On a monthly basis, the ORB fell to an average of $59.46/b in December, down
$16.11, or 21.3%, the sharpest month-on-month drop since the financial turmoil of
2008. On a yearly basis, the Basket was lower in 2014 by $9.58 compared with 2013.
The Basket’s yearly value stood at $96.29/b compared with the $105.87/b average of
the previous year, 9% lower.
OPEC Monthly Oil Market Report – January 2015
5
Crude Oil Price Movements
Graph 1.1: Crude oil price movement, 2014-2015
US$/b
US$/b
OPEC Basket
WTI
09 Jan
02 Jan
26 Dec
19 Dec
12 Dec
05 Dec
28 Nov
21 Nov
14 Nov
07 Nov
31 Oct
40
24 Oct
40
17 Oct
50
10 Oct
60
50
03 Oct
60
26 Sep
70
19 Sep
80
70
12 Sep
80
05 Sep
90
29 Aug
100
90
22 Aug
100
15 Aug
110
08 Aug
120
110
01 Aug
120
Brent Dated
All ORB component values slipped sharply in December as oil benchmark prices
continued to fall to record lows. The main benchmarks – North Sea Dated Brent,
US light sweet marker WTI, Dubai and Oman – have all lost about $16.50 over the
month.
Atlantic Basin light sweet crude markets remained bearish over the month despite
lower Libyan production. Low European refinery demand amid weak gasoline and
naphtha margins pressured West African crudes; around 35 million Nigerian barrels
remained unsold. Angolan grades have predominantly sold out, supported by robust
Chinese buying, though values have fallen for heavier Angolan grades, as they
compete with cheaper Mideast Gulf supplies.
Although weak Chinese economic indicators and excess supply weighed on the
Mideast Gulf market, Dubai's wider discount to North Sea Dated and relatively low
official selling prices have left it more appealing to Asia Pacific refiners than Atlantic
Basin imports.
Meanwhile, US demand for heavy Latin American crudes retreated as domestic
medium sour grade Mars became more heavily discounted against ICE Brent.
Brent-related Basket components Saharan Blend, Es Sider, Girassol and Bonny Light
dropped $16.80 or 21.2% in December to $62.53/b, accumulating about $49 in losses
since June. Middle Eastern spot components and multi-destination grades fell by
$15.80 each, accumulating around $48 on average in losses since June 2014.
Regarding Latin American ORB components, Oriente slipped $15.66 or 22.5%, while
Merey dropped by $17.25 or 25.2% in December.
On 14 January, the OPEC Reference Basket stood at $41.65/b.
6
OPEC Monthly Oil Market Report – January 2015
Crude Oil Price Movements
Table 1.1: OPEC Reference Basket and selected crudes, US$/b
Nov 14
75.57
76.07
73.94
80.10
78.90
78.68
74.46
74.04
75.43
68.42
77.85
69.52
79.60
Dec 14
59.46
60.13
57.94
63.81
61.53
61.83
58.99
58.25
59.48
51.17
62.27
53.86
62.93
Change
Dec/Nov
-16.11
-15.94
-16.00
-16.29
-17.37
-16.85
-15.47
-15.79
-15.95
-17.25
-15.58
-15.66
-16.67
Other Crudes
Brent
Dubai
Isthmus
LLS
Mars
Minas
Urals
WTI
78.90
76.33
79.04
79.64
75.76
75.92
78.92
76.04
62.53
60.25
59.74
61.90
58.15
59.95
61.53
59.50
-16.37
-16.08
-19.30
-17.74
-17.61
-15.97
-17.39
-16.54
108.62
105.45
105.16
107.33
102.24
107.41
108.00
97.96
99.08
96.71
93.65
96.92
92.93
98.68
98.08
93.26
Differentials
Brent/WTI
Brent/LLS
Brent/Dubai
2.86
-0.74
2.57
3.03
0.63
2.28
0.17
1.37
-0.29
10.67
1.30
3.17
5.82
2.16
2.37
OPEC Reference Basket
Arab Light
Basrah Light
Bonny Light
Es Sider
Girassol
Iran Heavy
Kuwait Export
Marine
Merey
Murban
Oriente
Saharan Blend
Year-to-date
2014
2013
105.87
96.29
106.53
97.18
103.60
94.45
111.36
100.85
108.51
98.51
109.14
99.19
105.73
96.18
105.04
95.32
105.32
96.39
96.66
86.88
108.21
99.45
97.74
87.31
109.38
99.68
Note: Arab Light and other Saudi Arab ian crudes as well as Basrah Light preliminarily b ased on American
Crude Market (ACM) and sub ject to revision.
Sources: Platt's, Direct Communication and Secretariat's assessments.
The oil futures market
A sell-off in global oil markets amid a burst of bearish factors pushed crude oil futures
to more than five-year lows during December trading. ICE Brent settled down a hefty
$16.36 at $63.27/b, while Nymex WTI lost $16.52 to finish the month at an average of
$59.29/b. Over the month, both benchmarks declined by a massive 21% and 22%,
respectively.
ICE Brent and Nymex WTI have lost nearly half their value since their peak in June
when they were at $111.97/b and $105.15/b, respectively. The bearish sentiment in the
oil market persists as it faces an increasing overhang of at least 1 mb/d. The sell-off
across other asset classes triggered by the oil price decline, weighed on oil. The
announcement that Russian exports hit a record 526.75 million mt in 2014
(10.58 mb/d), coupled with production increases in Iraq, which offset a large drop in
Libyan production, added to the bearish tone in the global market. Continued unrest in
Libya added to the significant disruption that the Libyan oil sector has been suffering
from in recent months.
The dollar also strengthened, contributing to downward pressure on crude futures, after
the euro hit a low against the dollar not seen since 2006. Moreover, on the economic
front, negative news emerged from China as HSBC/Markit’s Flash Manufacturing PMI
fell to 49.5 in December, the first sub-50 reading since April. Additionally, Russia’s
OPEC Monthly Oil Market Report – January 2015
7
Crude Oil Price Movements
central bank hiked interest rates from 10.5% to 17% in an attempt to stem the rouble’s
rapid weakening. For the year, ICE Brent averaged $99.51/b, down $9.25 or 8.5% from
2013, while Nymex WTI lost $4.97 or 5.1%, averaging $93/b.
Crude oil futures prices weakened further in the second week of January. On
14 January, ICE Brent stood at $48.69/b and Nymex WTI at $48.48/b.
Speculative bets on a rebound in oil prices rose sharply over the month, particularly in
ICE Brent, as crude oil prices reached a five-year low. Investor inflows into funds that
track crude oil exceeded four-year highs on speculation that prices would rebound from
a five-year low. ICE Brent net length positions increased a hefty 75% to 115,571
contracts during the last week in December, according to figures from the ICE Futures
Europe exchange. This is due to the combination of a 27,058 rise in long positions and
22,540 reduction in short positions.
Hedge funds and money managers also made bullish bets on a rising US crude oil
market, increasing net length by almost 25% over the month. Net long US crude
futures and options positions during the month increased to 199,388 lots, US
Commodity Futures Trading Commission (CFTC) data show. Long speculative
positions in Nymex WTI increased 5.2% to 259,613 lots, while short positons
decreased by 29% to 60,225 lots. Moreover, total futures and options open interest
volume in the two markets increased in December by 499,177 lots to 4.6 million
contracts.
Graph 1.3: ICE Brent price vs.
speculative activity, 2013-2015
'000 Contracts
US$/b
110
400
100
350
90
300
80
250
70
200
60
150
40
100
Dec 13
Jan 14
Feb 14
Mar 14
Apr 14
May 14
Jun 14
Jul 14
Aug 14
Sep 14
Oct 14
Nov 14
Dec 14
Jan 15
50
Managed money net long positions (RHS)
WTI (LHS)
Source: CFTC.
US$/b
120
110
100
90
80
70
60
50
40
'000 Contracts
300
250
200
150
100
50
0
Dec 13
Jan 14
Feb 14
Mar 14
Apr 14
May 14
Jun 14
Jul 14
Aug 14
Sep 14
Oct 14
Nov 14
Dec 14
Jan 15
Graph 1.2: Nymex WTI price vs.
speculative activity, 2013-2015
Managed money net long positions (RHS)
ICE Brent (LHS)
Source: IntercontinentalExchange, Inc.
The daily average traded volume during December for Nymex WTI contracts
decreased slightly by 589 lots to average 641,751 contracts. ICE Brent daily traded
volume also fell by 65,786 contracts to 596,517 lots. The daily aggregate traded
volume in both crude oil futures markets decreased by 66,375 contracts in December
to around 1.24 million future contracts, equivalent to around 1.24 billion barrels per day.
The total traded volume in Nymex WTI contracts increased to 14.12 million lots, while
the ICE Brent volume dropped slightly to 13.12 million contracts over the month.
8
OPEC Monthly Oil Market Report – January 2015
Crude Oil Price Movements
The futures market structure
Both ICE Brent and Nymex WTI feature term structures in contango, a sign of ample
supply pushing prompt prices below longer-dated contracts. However, ICE Brent's
contango has been steeper than that of Nymex crude. Long-term markets have also
seen steep price drops. This suggests that the market expects output growth to exceed
demand recovery expectations this year. The contango shape is allowing traders on
both sides of the Atlantic to profit from cash-and-carry deals.
Nymex crude's contango has not been as deep as ICE Brent's term structure, but has
still been enough to justify crude storage in Cushing, Oklahoma. The latest estimates
put Cushing stocks at 30.8 mb versus a capacity of around 80.0 mb, leaving plenty of
room for additional storage. Buying WTI for storage at Cushing and selling futures
contracts should make the cash-and-carry trade profitable. Doing so would mean
increased demand for WTI for storage purposes.
The widening contango in the crude oil market is also reviving interest in Asia for the
hiring of ships to store crude at sea, taking advantage of lower prices and the current
supply glut. Besides Brent, the contango in the Asian sour crude market has also
recently widened, reflecting an oversupplied market and an expected drop in demand
for crude ahead of the region's refinery maintenance season. By month end, the firstmonth discount to the second month was 85¢/b and 50¢/b for ICE Brent and
Nymex WTI, respectively. The Dubai cash-to-swap spread, also known as M1–M3, was
at a contango of nearly $3/b.
Graph 1.4: Nymex WTI and ICE Brent forward curves, 2014
US$/b
90
US$/b
90
80
80
70
70
60
60
50
1FM
2FM
3FM
4FM
5FM
6FM
ICE Brent: 26 Nov 14
Nymex WTI: 26 Nov 14
7FM
8FM
9FM
10FM
11FM
50
12FM
ICE Brent: 26 Dec 14
Nymex WTI: 26 Dec 14
FM = future month.
The spread between ICE Brent and Nymex WTI crudes has been shrinking since midDecember, when ICE Brent's premium stood above $5/b as the global glut weighed
more heavily on ICE Brent than Nymex WTI. The ICE Brent-Nymex WTI crude spread
moved into a new phase that will see the differential swing between positive and
negative, but within a tight range. This new normal stands apart from the last few years,
in which ICE Brent traded at a consistent premium over Nymex WTI crude, reaching as
high as $28/b, when physical constraints limited crude from the US midcontinent and
Canada from reaching refining centers on the US Gulf Coast (USGC). But significant
capacity expansion has allowed flows from major producing regions in the US and
Canada to reach the USGC, which shut out imports, pushing these crudes back into
the international market and putting downward pressure on ICE Brent prices.
OPEC Monthly Oil Market Report – January 2015
9
Crude Oil Price Movements
In a similar vein, US crude exports have climbed higher, providing an outlet for
additional production that would otherwise have added to the country's stockpiles.
US crude exports soared to 487,000 b/d in November, up from 360,270 b/d in October.
In July, US crude exports topped 400,000 b/d, the highest since the 1950s. Mexico's
state-owned Pemex requested permission from the US Department of Commerce to
import up to 100,000 b/d of light crude and condensate from the US. In return, Mexico
will export heavy Mexican crudes to be processed at US refineries. The prompt
ICE Brent-Nymex WTI spread stood at $3.89/b on average in December.
Table 1.2: Nymex WTI and ICE Brent forward curves, US$/b
Nymex WTI
26 Nov 14
26 Dec 14
1st FM
73.69
54.73
2nd FM
73.76
55.13
3rd FM
73.82
55.59
6th FM
74.06
57.14
12th FM
74.59
60.47
26 Nov 14
26 Dec 14
1st FM
77.75
59.45
2nd FM
78.18
60.22
3rd FM
78.70
61.07
6th FM
80.08
63.52
12th FM
81.91
67.16
ICE Brent
FM = future month.
The light sweet/medium sour crude spread
Sweet/sour differentials widened significantly in Europe and Asia, while on the USGC
the spread was almost flat.
In Asia, the sweet/sour spread – represented by the Tapis/Dubai spread – widened
once more over the month, supported by relatively firm refining margins in the Asia
Pacific region, particularly for jet-kerosene and diesel. Colder weather boosted
Japanese demand for kerosene as a heating fuel, supporting margins. Refiners have
benefited from falling oil prices, with losses in product markets lagging crude falls.
Higher freight rates have limited arbitrage sales from West of Suez, while demand from
Japan, Taiwan and Thailand has been firm. This lent support to Asia Pacific light sweet
crude, as arbitrage opportunities to move West African crudes to Asia weakened.
Meanwhile, relatively low official selling prices and excess supply weighed on Mideast
Gulf marker Dubai. Tapis’ premium over Dubai increased 60¢ to $6.23/b in December.
In Europe, Russian medium sour Urals crude weakened to a discount of more than
$1/b to North Sea Dated as demand for the grade waned. Refiners are running down
crude stocks towards the end of the year, and even a tight Urals export programme has
done little to support prices this month. Moreover, the resumption of Iraqi Kirkuk crude
exports through Turkey also pressured the medium sour crude market in the
Mediterranean. Meanwhile, North Sea crude loading is expected to fall by around 4% in
January. Shipments of North Sea Dated grades Brent, Forties, Oseberg and Ekofisk
are scheduled to decline by 6% to just 890,000 b/d. The 2¢/b Urals premium over Brent
in November flipped into a $1/b discount in December.
In the USGC, the Light Louisiana Sweet (LLS) premium over medium sour Mars
narrowed by about 15¢ to around $3.75/b. Both US deepwater grades LLS and sour
Mars came under sell-off pressure as some traders offloaded crude ahead of refinery
maintenance season, while others geared down inventory before year-end taxes.
Meanwhile, US demand for heavy Latin American crudes retreated as domestic
medium sour grade Mars became more heavily discounted against ICE Brent. Mars’
discount to ICE Brent widened by $1.25/b.
10
OPEC Monthly Oil Market Report – January 2015
Crude Oil Price Movements
Graph 1.5: Brent Dated vs. Sour grades (Urals and Dubai) spread, 2014-2015
US$/b
US$/b
Dubai
OPEC Monthly Oil Market Report – January 2015
09 Jan
02 Jan
26 Dec
19 Dec
12 Dec
05 Dec
28 Nov
21 Nov
14 Nov
07 Nov
31 Oct
24 Oct
17 Oct
-4
10 Oct
-4
03 Oct
-2
26 Sep
-2
19 Sep
0
12 Sep
0
05 Sep
2
29 Aug
2
22 Aug
4
15 Aug
4
08 Aug
6
01 Aug
6
Urals
11
Commodity Markets
Commodity Markets
In December, energy commodities saw sharp declines due to falling crude oil
prices, and the non-energy group also showed drops in both base metals and
agricultural commodities. On the other hand, precious metals recovered on the
perceived economic weakness in the Euro-zone.
Trends in selected commodity markets
During the month, the US dollar continued appreciating due to the strength of the
US economy relative to Japan and the Euro-zone, adding downward pressure to
commodities. The potential tightening of monetary policy in the US put pressure on
precious metals during 2H14, however, the perceived weakness of other major
developed economies supported some modest recoveries in their prices during the
month. Manufacturing prospects declined in the US (ISM PMI at 55.5 vs. 58.7 in
November) and China (PMI at 49.6 vs. 50.0 in November), were unchanged in Japan
(PMI at 52.0), and were slightly up in the Euro-zone (PMI at 50.6 vs. 50.1), adding
pressure to the group of metals.
Agricultural prices declined during the month as the US Department of Agriculture
(USDA) continued reporting global ample supplies, while weather conditions improved
in South America. Wheat provided some support to the group of grains, as new
sanitary regulations and export duty enacted by the Russian government could
potentially limit exports. Soy prices declined as the Brazilian crop was estimated to be
larger than previously expected due to improved weather conditions in the producing
regions. Corn prices were stable as ethanol prices in the US declined due to low oil
prices, but the USDA anticipates increased use of corn for feed in the European Union.
Base metals prices declined on weak manufacturing readings across major economies
and due to the drop in energy prices, which represents an important share of their cost.
Copper prices experienced their largest decline since March as China’s manufacturing
sector showed a deceleration, and new home prices declined, albeit at a slower pace
than in the previous month, according to the National Bureau of Statistics. Aluminium
prices experienced their steepest decline of the year following the fall in energy prices,
signalling lower production costs. Iron ore weakened at its lowest rate since May 2009
as major producing companies continued to add new capacity to displace higher cost
competitors.
Energy prices decreased due to a sharp drop in crude oil in an oversupplied market.
Natural gas hub prices also experienced declines in Europe and the US on mild
weather conditions. In Europe, underground inventories were at 75.85% of capacity at
the end of December, versus 68.53% a year before – according to data from Gas
Infrastructure Europe; in absolute terms, they are 17.5% larger than a year before. In
the US, mild weather conditions reduced demand for power generation and allowed for
steady gas production with the effect of decreased withdrawals from inventories.
Among developments that will require close monitoring are the impact of central bank
interventions in Japan and the Euro-zone, which could further weaken the US dollar in
the short term, and the impact of measures by the Chinese government to support the
housing market, which could provide support to metal prices. Further improvements in
weather conditions in the southern hemisphere could provide additional downward
pressure to some agricultural commodities.
12
OPEC Monthly Oil Market Report – January 2015
Commodity Markets
Table 2.1: Commodity price data, 2014
Monthly averages
% Change
Unit
Commodity
Oct 14
Nov 14
Dec 14
Oct/Sep
Nov/Oct
Dec/Nov
106.2
63.7
86.1
3.8
93.3
98.0
100.7
459.0
835.0
424.0
92.9
163.1
245.4
0.4
88.9
1,946.2
6,737.5
81.0
2,034.3
15,812.4
19,830.4
2,276.8
96.3
62.6
77.0
4.1
93.6
98.3
103.0
486.0
830.0
449.0
98.0
178.7
258.7
0.4
90.4
2,055.6
6,712.9
74.0
2,030.2
15,807.1
20,033.5
2,253.2
78.4
62.2
60.7
3.4
91.2
96.7
101.2
465.7
816.3
444.0
99.6
178.7
269.6
0.3
86.3
1,909.5
6,446.5
68.0
1,938.1
15,962.1
19,829.7
2,175.8
-8.9
-3.4
-10.2
-3.7
-1.1
-0.4
-0.6
-1.9
-1.9
-1.9
0.0
0.0
0.7
4.5
-3.1
-2.2
-2.0
-1.7
-3.9
-12.3
-6.0
-0.8
-9.3
-1.8
-10.6
8.7
0.3
0.3
2.3
5.9
-0.6
5.9
5.5
9.6
5.4
-3.3
1.6
5.6
-0.4
-8.6
-0.2
0.0
1.0
-1.0
-18.6
-0.5
-21.2
-16.3
-2.5
-1.7
-1.8
-4.2
-1.6
-1.1
1.7
0.0
4.2
-5.3
-4.6
-7.1
-4.0
-8.1
-4.5
1.0
-1.0
-3.4
1,222.5
17.2
1,175.3
16.0
1,200.6
16.3
-1.1
-6.6
-3.9
-7.0
2.2
2.1
World Bank commodity price indices (2010 = 100)
Energy
Coal, Australia
Crude oil, average
Natural gas, US
Non Energy
Agriculture
Food
Soybean meal
Soybean oil
Soybeans
Grains
Maize
Wheat, US, HRW
Sugar, world
Base Metal
Aluminum
Copper
Iron ore, cfr spot
Lead
Nickel
Tin
Zinc
Precious Metals
Gold
Silver
$/mt
$/bbl
$/mmbtu
$/mt
$/mt
$/mt
$/mt
$/mt
$/kg
$/mt
$/mt
$/dmtu
$/mt
$/mt
$/mt
$/mt
$/toz
$/toz
Source: World Bank, Commodity price data.
Average energy prices decreased by 18.6% m-o-m in December due to a 21.2%
decrease m-o-m in crude oil as the sell-off accelerated during the month on continuing
oversupply and a strong US dollar. Natural gas prices also declined sharply in the US −
on average by 16.3% m-o-m − while average import prices increased in Europe by
10.4% during the month.
Graph 2.1: Major commodity price indices, 2013-2014
Index
160
Index
160
140
140
120
120
100
100
80
80
Base year 2010 = 100
Energy
Non-energy
Agriculture
Base metals
HH natural gas
Gold
Dec 14
Nov 14
Oct 14
Sep 14
Aug 14
Jul 14
Jun 14
May 14
Apr 14
Mar 14
Jan 14
Feb 14
Dec 13
Nov 13
Oct 13
Sep 13
Aug 13
Jul 13
Jun 13
May 13
Apr 13
Mar 13
Feb 13
60
Jan 13
60
Food
Source: World Bank, Commodity price data.
OPEC Monthly Oil Market Report – January 2015
13
Commodity Markets
Agricultural prices decreased by 1.7% due to a 1.8% decrease in food, a 2.4%
decrease in beverages and a 0.9% drop in raw materials. Oil and fats prices dropped
with soybeans, soybean oil and soymeal, declining by 1.1%, 1.6% and 4.2%,
respectively, due to a better-than-expected crop in South America and lower demand
growth in China. Grains recovered during the month on the strength of wheat prices,
which increased by 4.2% due to potential export restrictions from Russia.
Base metals decreased by 4.6% m-o-m with declines among all group components
with the exception of nickel. Aluminium decreased by 7.1% m-o-m while copper
declined by 4.0% after the slide in energy prices and the slowdown in manufacturing in
China during the month. Iron ore prices declined by 8.1% due to an oversupplied
market.
Precious metals prices recovered by 2.1% in December. Average gold prices
increased by 2.1% m-o-m after showing significant volatility during the month on the
influence of divergent monetary policies across major developed economies. Silver
prices also recovered during the month to increase by 2.2%
Graph 2.2: Inventories at the LME
'000 Tonnes
'000 Tonnes
Dec 14
Nov 14
Oct 14
Sep 14
5,500
Aug 14
5,500
Jul 14
6,000
Jun 14
6,000
May 14
6,500
Apr 14
6,500
Mar 14
7,000
Feb 14
7,000
Jan 14
7,500
Dec 13
7,500
Sources: London Metal Exchange and Haver Analytics.
In December, the Henry Hub natural gas price decreased after above-average
temperatures translated into smaller withdrawals from inventories. The average price
decreased by 67¢, or 16.3%, to $3.43 per million British thermal units (mmbtu), after
trading at an average of $4.1/mmbtu the previous month.
The US Energy Information Administration (EIA) said utilities withdrew 26 billion cubic
feet (Bcf) of gas from storage during the week ending 26 December, below market
expectation of a 38 Bcf decrease. Total gas in storage stood at 3,220 Bcf, which is
2.4% below the previous five-year average. Last month it was 9.8% below that
average.
14
OPEC Monthly Oil Market Report – January 2015
Commodity Markets
Investment flows into commodities
The total open interest volume (OIV) in major US commodity markets decreased to
8.0 million contracts in December, with the OIV declining for crude oil by 1.0%,
agriculture by 3.7%, copper by 7.8%, precious metals by 12.5%, natural gas by 1.2%
and livestock by 7.2%.
Graph 2.3: Total open interest volume
'000 contracts
'000 contracts
7,500
7,000
7,000
Oct 14
Jul 14
Jun 14
Apr 14
Feb 14
Jan 14
Dec 14
7,500
Nov 14
8,000
Sep 14
8,000
Aug 14
8,500
May 14
8,500
Mar 14
9,000
Dec 13
9,000
Source: US Commodity Futures Trading Commission.
Total net length speculative positions in select commodities increased by 9.6%
m-o-m to 818,510 contracts in December due to increases in net long positions on
crude oil, agriculture and precious metals, and declines in natural gas, livestock and
copper.
Agricultural OIV was down 3.7% m-o-m to 4,453,740 contracts in December.
Meanwhile, money manager net long positions in agriculture increased by 20.6% to
403,396 lots, continuing the upward momentum that started in October of 2014.
Henry Hub natural gas OIV decreased by 1.2% m-o-m to 939,338 contracts in
December. Money managers switched their stance to a net short position of 28,772 lots
in December as warmer-than-average temperatures in the US translated into small
storage withdrawals.
Graph 2.4: Speculative activity in key commodities, net length
'000 contracts
'000 contracts
Agriculture
Gold
WTI
Natural gas
Livestocks
Dec 14
Nov 14
-100
Oct 14
-100
Sep 14
100
Aug 14
100
Jul 14
300
Jun 14
300
May 14
500
Apr 14
500
Mar 14
700
Feb 14
700
Jan 14
900
Dec 13
900
Copper
Source: US Commodity Futures Trading Commission.
OPEC Monthly Oil Market Report – January 2015
15
Commodity Markets
Graph 2.5: Speculative activity in key commodities, as% of open interest
%
%
40
40
30
30
20
20
10
10
0
0
Gold
Agriculture
WTI
Livestocks
Copper
Dec 14
Nov 14
Oct 14
Sep 14
Aug 14
Jul 14
Jun 14
May 14
Apr 14
Jan 14
Feb 14
Mar 14
-10
Dec 13
-10
Natural gas
Source: US Commodity Futures Trading Commission.
Copper OIV declined by 7.8% m-o-m to 155,099 contracts in December. Money
managers slightly increased their net short position to 5,022 versus 2,739 lots the
previous month.
Table 2.2: CFTC data on non-commercial positions, ‘000 contracts
Open interest
Net length
Nov 14
Dec 14
Nov 14
% OIV
Dec 14
% OIV
1,463
951
4,627
596
168
596
8,402
1,449
939
4,454
522
155
553
8,073
187
17
334
47
-3
165
747
13
2
7
8
-2
28
9
202
-29
403
102
-5
145
819
14
-3
9
20
-3
26
10
Crude oil
Natural gas
Agriculture
Precious metals
Copper
Livestock
Total
Source: US Commodity Futures Trading Commission.
Gold OIV decreased by 12.7% m-o-m to 372,876 contracts in December. Money
managers almost doubled their net length in gold to 84,074 lots on the potential delay
of interest rate hikes in the US due to weakness in other developed economies.
Graph 2.6: Inflow of investment into commodities, 2012-2014
US$ bn
140
120
100
80
60
40
20
0
1Q
2Q
3Q
4Q
1Q
2Q
2012
Agriculture
3Q
4Q
1Q
2013
Copper
Gold
2Q
3Q
Oct
Nov
2014
Natural gas
WTI crude oil
Source: US Commodity Futures Trading Commission.
16
OPEC Monthly Oil Market Report – January 2015
World Economy
World Economy
The global growth forecast remains unchanged at 3.6% in 2015, compared to
3.2% last year, as the global economy is expected to continue its recovery.
Improving underlying demand in the US, in combination with an ongoing
tentative recovery and the expectation of additional monetary supply in the Eurozone, as well as monetary, fiscal and structural stimulus in Japan, are all
expected to be supportive. Consequently, the OECD growth forecast has been
raised from 2.1% to 2.2% for 2015. While lower oil prices could theoretically turn
out to be an additional supportive factor for global economic growth, the
negative effects for oil producing countries seem to be offsetting the positive
effects for consumer countries. While some growth enhancing effects have
become obvious already in the US, a further positive impact in consumer
countries might materialise later in the year. China’s latest lead indicators point
to potential lower growth in 2015 compared to last year, while India is forecast to
provide some room to the upside. Brazil and Russia are currently seen to be
lagging amid the global momentum. Some growth risk will remain apparent with
the danger of prolonged deflation in the Euro-zone, continued volatility in foreign
exchange markets, ongoing challenges for commodity producer countries and
geopolitical issues.
Table 3.1: Economic growth rate and revision, 2014-2015, %
World
OECD
US
Japan Euro-zone
China
India
Brazil
Russia
2014E*
3.2
1.8
2.4
0.2
0.9
7.4
5.5
0.2
0.3
Change from
previous month
0.0
0.0
0.2
-0.2
0.1
0.0
0.0
-0.2
0.0
2015F*
3.6
2.2
2.9
1.2
1.2
7.2
5.8
1.0
0.0
Change from
previous month
0.0
0.1
0.3
0.0
0.1
0.0
0.0
-0.2
-0.7
* E = estimate and F = forecast.
OECD
OECD Americas
US
The US economy has continued its considerable recovery in the 3Q14 and seems to
be continuing this momentum into the current year. The final 3Q14 GDP growth
number has been revised to a seasonally adjusted annualized rate (SAAR) of 5% q-o-q
from a SAAR of 3.9% q-o-q previously. This comes after already 4.6% growth in the
2Q14. Personal consumption expenditures were particularly strong at a SAAR of 3.2%
q-o-q, clearly above the average growth pattern of past years and contributing
2.2 percentage points (pp) to the total quarterly growth number. Also, government
consumption expenditures were clearly the highest since 2011 at a SAAR growth of
4.4% q-o-q and a growth contribution of 0.8 pp. This momentum is forecast to continue
as the labour market also continued improving and consumer sentiment is pointing at
an ongoing underlying positive demand trend. Some concern about the health of the
recovery of the labour market has been raised due to the fact that hourly wage growth
has been relatively subdued. This will need some monitoring. But for the time being, it
could be offset by falling energy prices, which positively affects household incomes and
OPEC Monthly Oil Market Report – January 2015
17
World Economy
increases their spending ability. The Federal Reserve Board (Fed) will certainly closely
monitor this development as is it is forecast to possibly raise interest rates before the
end of the first half of the year. But if subdued earnings growth continues, currently low
inflation would allow the Fed to be more flexible in its monetary policy and probably
wait somewhat longer. Some downside risk from the international situation, which could
lead to a more accommodative monetary policy, has also been highlighted in the latest
Fed meeting minutes, particularly mentioning the weakening oil prices and other
economic factors. However, the Fed saw this risk nearly balanced by upside potential.
The labour market has significantly improved over the past months and the latest
batch of data confirms this trend. The unemployment rate fell to 5.6% in December.
Non-farm payrolls grew by 252,000 in December, after upwardly revised 353,000
non-farm jobs from November. The share of the long-term unemployed remained at
around November’s level, standing at 31.9% in December. Some soft spots in the
labour market remain. The participation rate was almost unchanged from the last
month and stood at only 62.7%. Moreover, seasonally adjusted hourly earnings grew
by only 1.6% y-o-y. On a monthly basis, they fell by 0.3% m-o-m. The low yearly growth
rate was the lowest since December 2012.
The housing market continues recovering, but at a slowing pace. Prices have risen by
4.5% y-o-y in October, slightly higher than in September when they grew by 4.4%
y-o-y, as reported by the Federal Housing Finance Agency. Positively, existing home
sales have continued improving in November, growing by 2.0% y-o-y, after an October
level of 2.3% y-o-y.
Consumer confidence rose to 92.6 in December from 91 in November, based on the
Conference Board’s consumer confidence index. The Purchasing Manager’s Index
(PMI) for the manufacturing sector, as provided by the Institute of Supply Management
(ISM), fell to 55.5 from 58.7, but clearly still remains above the growth-indicating
50 level. The ISM for the services sector, which contributes more than 70% to the
economy, also retraced somewhat to 56.2 from 59.3 in November, which is still
considered a high reading.
Graph 3.1: Manufacturing and non-manufacturing ISM indices
Index
60
56.2
55.5
55
50
ISM manufacturing index
Dec 14
Nov 14
Oct 14
Sep 14
Aug 14
Jul 14
Jun 14
May 14
Apr 14
Mar 14
Feb 14
Jan 14
45
ISM non-manufacturing index
Sources: Institute for Supply Management and Thomson Reuters.
18
OPEC Monthly Oil Market Report – January 2015
World Economy
With the latest growth dynamic, the 2015 GDP growth forecast has been revised to
2.9% from 2.6% in the previous month. After strong quarterly numbers, the 2014
estimate has also been revised from 2.2% to 2.4%. Some further upside potential might
become visible in the coming months and the situation will be closely monitored.
Canada
In Canada, improvements continue as well, along with the US, which is by far the
largest export market for the relatively much smaller Canadian economy. This is visible
in industrial production. But the momentum has slightly decelerated. After industrial
production rose by 5.7% y-o-y in June – the largest increase since September 2011 – it
grew by only 3.0% y-o-y in November. The PMI for manufacturing in December fell
slightly to 53.9 in December from 55.3 in November. The positive momentum continues
and has been reflected in a 2015 GDP growth forecast revision to 2.4% from 2.3%. The
growth estimate for 2014, however, remains unchanged at 2.3%.
OECD Asia-Pacific
Japan
The latest set of revised GDP data indicated an ongoing challenge in the Japanese
economy after April’s sales tax increase. GDP growth rates have now been confirmed
to be negative for two consecutive months – i.e. leading the economy into a technical
recession. Growth in the 2Q14 was down by a SAAR of 6.7% q-o-q and in the 3Q14 fell
by a SAAR of 1.9% q-o-q. The need for further reforms led to snap elections in
December, which confirmed the current government. Given the still challenging
situation, and the new fiscal spending abilities after the rise in tax revenues and
expectations of a lower fiscal deficit, the newly elected government has initiated a new
record budget, which includes fiscal spending measures. The reduction in the budget
deficit might also be supported by rising corporate revenues, amid the slide of the yen,
and may also be supported by declining energy prices, which are expected to have a
positive effect on the country’s import bills. So the government has more room now to
delay the second round of its envisaged sales tax increase from this year to probably
2017.
However, so far the core aim of lifting inflation is only partially being achieved and
further initiatives will be needed in order for it to be successful. Core inflation (excluding
the sales tax increase) is currently below 1%, according to the government’s
calculations and, therefore, clearly misses the 2% target. An important aspect in this
connection is that earnings growth is still clearly below total inflation of 2.4% and
therefore the spending ability of private households has shrunk over the past months.
This situation is forecast to improve this year, but the development will need close
monitoring. Structural reforms of the country’s relatively inflexible labour market could
be a supportive factor that could make positive developments more sustainable. Beside
domestic issues, external trade has improved. But as Japan’s most important Asian
trading partner – China – continues decelerating, the situation is only improving slightly.
Moreover, the Bank of Japan (BoJ) had announced further monetary stimulus
measures at the end of last year. These will be unprecedented measures and their
future success is unknown. This challenging situation has also been mirrored in the
latest BoJ’s Tankan survey. While it shows that business sentiment has largely
improved over the last 12 months, it has recently receded slightly again.
The domestic demand situation has improved over the last several months and is
expected to continue doing so, despite remaining fragile. Retail trade increased by only
0.4% y-o-y in November, lower that October’s increase of 1.4% y-o-y and September’s
OPEC Monthly Oil Market Report – January 2015
19
World Economy
rise of 2.3%. A similar trend becomes obvious in foreign demand, which continued
recovering in November, when exports rose by 4.9% y-o-y, but less than the October
level of 9.6% y-o-y. Moreover, industrial production remained sluggish on a yearly
comparison. It fell by 3.8% y-o-y in November after a decline of 0.8% in October.
Graph 3.2: Japanese PMI indices
Graph 3.3: Japanese consumer confidence
index, NSA
Index
Index
58
46
Manufacturing PMI
56
44
54
42
52.0
51.7
52
50
40
38
48
Services PMI
36.7
Dec 13
Jan 14
Feb 14
Mar 14
Apr 14
May 14
Jun 14
Jul 14
Aug 14
Sep 14
Oct 14
Nov 14
Dec 14
Sources: Markit, Japan Materials Management
Association and Haver Analytics.
Nov 12
Jan 13
Mar 13
May 13
Jul 13
Sep 13
Nov 13
Jan 14
Mar 14
May 14
Jul 14
Sep 14
Nov 14
36
46
Sources: Cabinet Office of Japan and
Haver Analytics.
Positively, the PMI numbers as provided by Markit show that the manufacturing PMI in
December remained at 52, the same as in November. Also, the very important services
sector increased to 51.7 from 50.6 in November.
While Japan continues its recovery, the near-term effects of its monetary stimulus
programme will need close monitoring. The considerable decline in the 2Q and the 3Q
led to a downward revision of this year’s growth expectation from 0.4% to 0.2%. Given
the stimulus measures currently in place, expectations of a recovery remain unchanged
and the growth forecast has been kept at 1.2%.
South Korea
The South Korean economy continues to grow at a solid pace, while slightly
decelerating as it is also impacted by its most important trading partners in the Asian
region. GDP in the 3Q14 has been released at 3.3% y-o-y, which is slightly below the
rate seen in 2Q14 and 1Q14. Export growth increased significantly in December at
8.3% y-o-y, after 1.2% y-o-y in November and 1.4% y-o-y in October. The current
dynamic roughly confirms the 2014 growth forecast of 3.4%. It is expected to stand at
this level also in 2015.
OECD Europe
Euro-zone
In the Euro-zone, the situation is slightly improving. This can be seen in the fact that
the latest discussions in Germany about a potential exit of Greece from the Euro-zone
– a scenario that depends on the outcome of the upcoming general elections in Greece
– has been pursued in a relatively calm tone. The gradual recovery has also become
visible in the latest GDP growth numbers. GDP growth for the 3Q14 stood at a SAAR of
0.2% q-o-q, slightly better than the 2Q14 number of 0.1% q-o-q. While lead indicators
are pointing at some improvements in Germany, the situation in France has not
20
OPEC Monthly Oil Market Report – January 2015
World Economy
significantly improved and Italy, which remains in recession, is the main laggard among
the largest three economies.
Beside the European Commission’s recently announced infrastructure spending plan,
the European Central Bank (ECB) has also announced that it will get further engaged
in supporting the Euro-zone, indicating that it will increase the monetary base by
around a third – from €2 trillion to €3 trillion. However, the implementation of this
operation needs close monitoring since past initiatives by the ECB to support lending
have not been as successful as initially hoped for, given the weakness of the banking
sector. The intended balance sheet expansion will need more initiatives, as the size of
the balance sheet in December stood only at €2.2 billion, increasing by €150 billion in
that month. The largest part of this increase was due to the new credit facilities that the
ECB introduced in the second half of 2014. The most recently published inflation
number of -0.2% y-o-y for December might be another important factor for the ECB to
engage sooner, and more quickly, in additional extraordinary monetary policies. The
ECB’s inflation forecast also stands at only 0.8% for 2015, a number that is significantly
below its target level of around 2%. While this low inflation rate is mainly influenced by
adjustments in the peripheral economies, it is also affected, to some extent, by large
economies such as Germany, and by factors like the fall in oil prices, which is certainly
an important factor in recent price developments, as well.
Moreover, the monetary transmission channels still seem impaired. Loan growth
rates to the private sector remain negative on a yearly basis, but, on a positive note,
the decline rates become less negative. Hence, an improvement is becoming visible.
While lending has been in decline for almost three years, it has started to show some
improvements. Lending to the private sector has again declined on a yearly basis in
November, when it fell by 1.4% y-o-y. But this is much less than in the 1H14, when it
declined by more than 2%. Also, potentially necessary capital requirements have kept
banks from providing lending facilities.
Beside the impaired monetary transmission channels of the banking sector and low
inflation, both issues attributed to the ECB’s current work programme, low aggregate
demand, which has been significantly impacted by the high unemployment level,
constitutes another serious issue. The unemployment rate stood for the fourth
consecutive month at 11.5% in November.
Graph 3.5: Euro-zone consumer price index
and lending activity
% change y-o-y
Sources: Markit and Haver Analytics.
OPEC Monthly Oil Market Report – January 2015
0%
-2%
-1%
-4%
CPI (LHS)
Dec 14
0%
Jun 14
Dec 13
Jan 14
Feb 14
Mar 14
Apr 14
May 14
Jun 14
Jul 14
Aug 14
Sep 14
Oct 14
Nov 14
Dec 14
48
1%
Dec 12
50.6
2%
Jun 12
Manufacturing PMI
50
2%
Dec 11
51.6
4%
Jun 11
52
3%
Jun 10
Services PMI
6%
Dec 10
54
% change y-o-y
4%
Dec 09
56
Dec 13
Index
Jun 13
Graph 3.4: Euro-zone PMI indices
MFI lending (RHS)
Sources: Statistical Office of the European
Communities, European Central Bank and
Haver Analytics.
21
World Economy
While in general the situation remains fragile, recent PMI numbers point at a
continuation of modest growth. The latest PMI for manufacturing has improved slightly,
increasing to 50.6 in December compared to 50.1 in November. The PMI for the
important services sector increased as well to 51.6 in December from 51.1 in
November.
While the recovery in the Euro-zone improved in 2014 compared to 2013, it remains
fragile. Given the latest improved numbers, the GDP growth forecast for 2014 has
been raised to 0.9%. Also, the 2015 forecast has been slightly adjusted to now stand at
1.2%, compared to 1.1% in the previous month.
UK
The United Kingdom’s economy continues recovering. Lead indicators point at an
ongoing positive dynamic. The PMI for manufacturing fell only slightly to 52.6 in
December, compared the 53.3 in November and October. After a strong momentum in
the 1H14, this dynamic is slowing down slightly, while remaining firm, particularly when
compared to the Euro-zone. While also somewhat lower than in the 1H14, industrial
production in the UK grew by 1.1% y-o-y in November, after a rise of 0.9%
y-o-y in October. The 2014 GDP growth forecast remains unchanged at 2.9%. The
GDP growth forecast for 2015 also remains unchanged at 2.5%.
Emerging and Developing Economies
For the year 2014, the economy of Brazil grew in 1Q14 at almost the same rate as in
1Q13 – but then started to contract in the 2Q14 and the 3Q14 on yearly comparison. In
the first three quarters of 2014, gross fixed capital formation declined, whereas growth
of private consumption stayed positive though on a downwards path. The services
sector, which accounts for nearly 65% of total GDP, was in contraction in the last three
months of 2014 as well as in two other months of the year. The manufacturing sector
shrank over the past seven months. Inflation was increasing almost throughout the
entire year, starting at 5.3% in January and registering 6.3% in November. The
benchmark interest rate increased from 10.5% at the beginning of 2014 to 11.75% in
December. A consideration of actual 2014 data prompts a downwards revision to last
year’s GDP estimate of 0.2%. The GDP growth forecast for 2015 is also revised down
to 1% on the back of an apparent lack of economic measures aimed at easing the
economy’s capacity limitation.
For 2014, the economy of Russia grew in the first three quarters by the slowest rate
since 2009, though it was better than expected due to significantly lower imports and
higher agricultural production. The economic situation has notably deteriorated this
year on the back of geopolitical tensions which have prompted huge capital outflows
from the country amounting to more than $85 billion. The ruble slid by nearly 51% since
July on increasing tensions and a worsening trade balance. Inflation, in turn, nearly
doubled, increasing from 6.5% at the beginning of the year to 11.3% in December. The
central bank raised its benchmark interest rate five times in 2014, from 5.5% in January
to 17% in December, in a vain attempt to limit currency depreciation and reduce the
risk of hyperinflation. As a result, growth in retail sales has declined notably to less than
2% in the 2H14. The manufacturing sector, despite having temporarily benefited from
import-substitution policies during July-November, is back in the contraction territory in
December for the seventh consecutive month. Likewise, the services sector sent signs
of deceleration during eight months of 2014. The situation of having no positive
breakthroughs in the geopolitical arena and an abating outlook of the country’s trade
22
OPEC Monthly Oil Market Report – January 2015
World Economy
balance in 2015 will push down the GDP forecast. Indeed, this month’s GDP growth
forecast is pared back to 0% in 2015, while the 2014 estimate is unchanged at 0.3%.
India’s economic growth has picked up above 5% in the last couple of quarters. The
new government promised economic reforms to improve the investment climate. India’s
trade deficit widened in November, as an increase of gold and non-oil, non-gold
imports more than fully offset the impact of lower oil prices. Although gold imports
remain a concern, it seems the current account deficit will remain below the
government's threshold. Indian goods producers ended 2014 in high gear with
business conditions in December improving at their quickest pace in the past two
years. The accelerated growth of the manufacturing sector was reflected by a faster
expansion in output, new business and foreign orders.
At the end of 2014, Chinese economic activity has continued to lose momentum. The
flash December PMI reading and November data released last week confirm that the
economy has been slowing through the 4Q14 but non-manufacturing PMI increased
and it seems it will be around 7%. China will focus on deepening reforms with the goal
of having immediate economic benefits in 2015, although the country is delaying
meaningful implementation of some major items.
Table 3.2: Summary of macroeconomics performance of BRIC countries
GDP growth
rate
2014E* 2015F*
Brazil
Russia
India
China
0.2
0.3
5.5
7.4
1.0
0.0
5.8
7.2
Consumer price
index, % change
y-o-y
2014
6.3
7.6
7.3
2.1
Current account
balance, US$ bn
Government fiscal
balance, % of GDP
Net public debt,
% of GDP
2015
2014
2015
2014
2015
2014
2015
6.7
7.5
6.2
2.3
-83.4
51.0
-42.6
243.7
-80.1
22.1
-46.7
226.4
-5.0
0.5
-4.3
-3.0
-4.4
-0.8
-4.1
-3.0
62.3
7.0
51.0
16.8
63.0
7.6
49.4
18.6
Sources: OPEC Secretariat, Consensus Economics, Economic Intelligence Unit, Financial Times and Oxford.
* E = estimate and F = forecast.
Brazil
The value of Brazilian exports plunged 16.1% y-o-y in December. This marks the fifth
consecutive decline in exports, which have been badly hurt by the currency and debt
issues in Argentina, Brazil’s third largest export destination. In addition, the softening
prices of a wide range of commodities in recent months has played a role in reducing
exporters’ income. On the other hand, the healthy state of the US economy helped
push the value of exports to the US up by nearly 25% y-o-y in November.
Consumer price inflation was at 6.3% in November, unchanged from a month earlier,
while the central bank increased its benchmark interest rate by 50 bp to 11.75% in
December. The consumer confidence index continued sending grim signals last
month with the index below 100 points and nearly at its lowest since April 2009, despite
the minor increase from November’s reading.
OPEC Monthly Oil Market Report – January 2015
23
World Economy
Graph 3.6: Brazilian merchandise exports
Graph 3.7: Brazilian consumer confidence
index
Index
% change y-o-y
130
20%
125
10%
120
0%
115
110
-10%
105
-16.1%
100
95
-25.0%
97.5
May 14
Nov 13
May 13
Nov 12
May 12
Nov 11
May 11
Nov 10
May 10
Nov 09
Nov 08
Source: Ministério do Desenvolvimento, Indústria e
Comércio Exterior and Haver Analytics.
May 09
90
Dec 13
Jan 14
Feb 14
Mar 14
Apr 14
May 14
Jun 14
Jul 14
Aug 14
Sep 14
Oct 14
Nov 14
Dec 14
-30%
Nov 14
-20%
Sources: Fundação Getúlio Vargas and Haver
Analytics.
Not surprisingly, the services sector extended the contraction it experienced in both
October and November into December. The HSBC Services PMI index ended 2014 at
49.1, slightly higher than November’s 48.5. The index showed a decline in business
activity across the private sector at a slower pace, alongside an expansion in new
business for the second month in a row. Intensified cost pressures were also reported.
Graph 3.8: Brazilian PMIs
Graph 3.9: Brazilian consumer confidence
index
Index
Index
52
130
Services PMI
52
125
51
120
51
50.2
115
110
50
50
49.1
105
100
49
Dec 14
98.8
95
Dec 13
Jun 13
Dec 12
Jun 12
Dec 11
Jun 11
Dec 10
Jun 10
Jun 09
Dec 09
Dec 14
Oct 14
Nov 14
Sep 14
Aug 14
Jul 14
Jun 14
Apr 14
May 14
Mar 14
Feb 14
Jan 14
Dec 13
Sources: HSBC, Markit and Haver Analytics.
Dec 08
90
48
Dec 14
Manufacturing
PMI
Jun 14
49
Sources: Fundação Getúlio Vargas and Haver
Analytics.
As for the manufacturing sector, the PMI survey revealed an increase in the sector’s
new orders in December for the first time in nine months that brought the index back
into the expansion territory. The HSBC manufacturing PMI posted 50.2 in December,
up from 48.7 a month earlier. This marks the first above-50 reading since August. Firms
also reported a slower pace of production decline. The economy of Brazil is still running
at nearly full manpower capacity, with the unemployment rate fluctuating narrowly
below 5% during most of the year. The unemployment rate stood at 4.8% in December.
A consideration of actual 2014 data prompts a downwards revision to the year’s GDP
estimate to 0.2% from 0.4% earlier. The GDP growth forecast for 2015 is also revised
24
OPEC Monthly Oil Market Report – January 2015
World Economy
down to 1.0% from 1.2% on the back of an apparent lack of significant economic
measures aimed at attracting more foreign investment.
Russia
The central bank hiked its benchmark interest rate in December to 17%, up from 9.5%
in November, in an effort to limit currency depreciation and tame inflation.
Nevertheless, the ruble depreciated sharply last month by 21% against the US dollar.
In December 2014, the ruble reached its lowest value since December 1998 on the
back of plunging export revenues and continued financial sanctions. Overall, the ruble
lost more than 55% of its value in 2014. As a result, inflation hovered around 11.4% in
December, up from 9.1% a month earlier.
Retail sales increased slightly in November to grow 1.8% y-o-y hovering below the 2%
level since June 2014. In comparison, 2013 showed an average growth rate of nearly
4%. The unemployment rate increased to 5.2% in November from 5.1% in October,
signaling the third consecutive increase after nine months of being either stable or
declining.
Graph 3.10: US dollar and Russian ruble
exchange rate
Graph 3.11: Russian ruble inflation vs.
interest rate
%
19.0
US$/RUB
0.035
17.0
17.0
0.030
15.0
0.025
13.0
11.4
11.0
0.020
9.0
0.015
7.0
Interest rate
Inflation rate
Dec 14
Oct 14
Aug 14
Jun 14
Apr 14
Feb 14
Dec 13
Source: Thomson Reuters.
Dec 13
Jan 14
Feb 14
Mar 14
Apr 14
May 14
Jun 14
Jul 14
Aug 14
Sep 14
Oct 14
Nov 14
Dec 14
5.0
0.010
Sources: Federal State Statistics Service, Central
Bank of Russia and Haver Analytics.
Increasing inflationary pressures started to take their toll on the manufacturing sector,
which reported a slowing down momentum in December for the first time in six months.
The HSBC Manufacturing PMI registered 48.9 last month, down from 51.7 in
November. The drop mainly reflects a slowdown in demand, job creation and inputs
inventory. The survey showed input prices accelerating at their quickest rate since
October 1998 together with the fastest rise in output prices in the series’ history (since
January 2003). The services sector was no better than the manufacturing sector in
December. The HSBC Russia Services PMI of December 2014 posted 45.8, up slightly
from 44.5 in November. For the second month in a row, the survey showed that there
are more firms anticipating a deceleration in business activities in the next 12 months
than those expecting growth. Firms attributed their pessimism to economic instability,
inflation, a difficult investment climate and the impact of sanctions.
OPEC Monthly Oil Market Report – January 2015
25
World Economy
Graph 3.12: Russian PMIs
48.9
Manufacturing PMI
Dec 14
Nov 14
Oct 14
Sep 14
Aug 14
Jul 14
Jun 14
May 14
Apr 14
Mar 14
Feb 14
45.8
Jan 14
Dec 13
Index
56
54
52
50
48
46
44
42
40
Services PMI
Sources: HSBC, Markit and Haver Analytics.
As pointed out in December’s Monthly Oil Market Report, the situation of no positive
breakthroughs in the geopolitical arena and an abating outlook of the country’s trade
balance in 2015 will push down the GDP forecast. Indeed, this month’s GDP growth
forecast is pared back to 0% in 2015, while the estimate for 2014 is unchanged at
0.3%.
India
India’s economic growth has picked up above 5% in the last couple of quarters. The
new government promised economic reforms to improve the investment climate. It has
already made some progress such as: ending diesel price subsidies, implementing
reforms in the labour market, passing a long-awaited insurance bill, encouraging
greater private participation in coal production and financial sector reforms. These
changes will be driven by:
Easing inflation. The economy has also received a significant and unexpected boost
from falling commodity prices positively impacting inflation.
Terms of trade. The terms of trade in India decreased to 60.20 index points in 2014
from 61.90 index points in 2013. The terms of trade in India averaged 81.41 index
points from 2000 until 2014, reaching an all-time high of 100 index points in 2000 and a
record low of 60.20 index points in 2014.
Monetary Policy. Despite the sharp fall in inflation in recent months and pressure from
the government and businesses, the Reserve Bank of India (RBI) did not cut the policy
rate at its meeting on 2 December.
The weakness in the IP index in October is extremely disappointing, particularly given
that many factors, including the stronger PMI and strong core-sector growth pointed to
the probable expansion of industrial activity during the month. Combined with fresh
positive consumer price inflation data showing consumer price index inflation easing to
4.4% y-o-y in November, the latest industrial output reading makes an even stronger
case for the RBI to start easing monetary policy in the next few months. But
manufacturing activity momentum accelerated to a two-year high in December, led by a
healthy increase in new domestic orders as well as from abroad.
26
OPEC Monthly Oil Market Report – January 2015
World Economy
India’s November trade deficit widened to $16.8 billion from $13.3 billion in October, as
an increase of gold and non-oil, non-gold imports more than fully offset the impact of
lower oil prices. Both these dynamics played out: oil imports dropped to $11.7 billion
from $12.4 billion in October. The first surprise was that gold and silver imports surged
further from $4.9 billion in October to $6.3 billion in November. The rise in imports of
primary and intermediary goods mainly used in production is encouraging, particularly
given the latest abysmal industrial production data that showed India's industry output
shrinking 4.2% y-o-y in October, with its manufacturing component declining 7.6%.
However, as these numbers are still preliminary, it is still too soon to declare a recovery
in investment and manufacturing, with the latter expected to continue showing uneven
performance from month to month.
November trade data follows last week's balance of payments release, which showed
India's current account deficit to have widened to 2.1% of GDP in July–September, up
from 1.7% in the previous quarter. Although gold imports remain a concern, it seems
the current account deficit will remain below the government's threshold of 2.5% of
GDP in 2014 and 2015. The other surprise was a 14.1% m-o-m seasonally adjusted
spike in non-oil, non-gold imports, pushing trend growth to 26.2% y-o-y. This sharp
bounce and other high frequency data for November – notably auto production, credit
growth, and the manufacturing and services PMIs – suggest that domestic demand
may be firming, in contrast to the weakness of October’s industrial production. That
said, strong non-oil, non-gold import growth over the past few months could be
attributed, in part, to the 9% appreciation of the real rupee exchange rate over the last
year, on strong capital inflows and a large balance of payments surplus.
Graph 3.13: Indian GDP growth
Graph 3.14: Indian exports and imports
% change y-o-y
5.7%
5.3%
6
4.7%
5
4.6%
3.8%
4
3
2
1
3Q 14
2Q 14
1Q 14
4Q 13
3Q 13
2Q 13
1Q 13
4Q 12
3Q 12
2Q 12
1Q 12
0
Sources: National Informatics Centre (NIC) and
Haver Analytics.
US$ bn
50
43.0
42.8
45
40.1
39.3
37.5
40
35
28.4
26.6
30 26.8
26.0
25.3
25
20
15
10
5
0
Jul 14 Aug 14 Sep 14 Oct 14 Nov 14
Exports
Imports
Sources: Ministry of Commerce and Industry and
Haver Analytics.
Exports in India increased to $26.0 billion in November from $25.3 billion in October.
Imports in India also increased to $42.8 billion in November from $39.3 billion in
October. Imports increased 26.79% y-o-y, driven by a 5.6 times jump in gold
purchases.
OPEC Monthly Oil Market Report – January 2015
27
World Economy
Graph 3.15: Indian gold imports
US$ bn
8
Graph 3.16: Indian trade balance
US$ bn
0
6
Percentage
600%
5.6 times
450%
4
300%
-4
2
150%
-6
0
0%
-8
Nov 14
Sep 14
Jul 14
May 14
Jan 14
Mar 14
Nov 13
Jul 13
Sep 13
Mar 13
-150%
May 13
-2
-2
-10.9
-10
-12
-13.3
-14.6
-14
-14.0
-16.9
-16
Gold imports (LHS)
-18
% change y-o-y (RHS)
Jul 14
Sources: Ministry of Commerce and Industry and
Haver Analytics.
Aug 14 Sep 14 Oct 14 Nov 14
Sources: Ministry of Commerce and Industry and
Haver Analytics.
India recorded a trade deficit of $16.9 billion in November, the highest trade gap in
eighteen months.
Indian goods producers ended 2014 in high gear with business conditions improving at
their quickest pace in two years in December. The accelerated growth of the
manufacturing sector was reflected by faster expansions in output, new business and
foreign orders. The latest data also painted a brighter picture in terms of prices, as
inflationary pressures eased during the month.
Graph 3.17: Indian PMIs
Graph 3.18: Indian industrial production
Index
60
4%
54.5
52.9
51.1
54
52
50
Total
industrial production
6%
3.2%
2%
2.0%
0%
-2%
Sources: HSBC, Markit and Haver Analytics.
Nov 14
Aug 14
Manufacturing IP
May 14
-8%
Feb 14
44
Nov 13
-6%
Aug 13
46
Nov 12
-4%
Dec 12
Feb 13
Apr 13
Jun 13
Aug 13
Oct 13
Dec 13
Feb 14
Apr 14
Jun 14
Aug 14
Oct 14
Dec 14
48
May 13
56
8%
Manufacturing PMI
Composite PMI
Services and activity PMI
Feb 13
58
% change y-o-y
Sources: Central Statistical Organisation of India
and Haver Analytics.
India’s PMI climbed to a two-year high of 54.5 in December, up from 53.3 in the prior
month. Business conditions improved at a faster pace during the month, with the
sharpest expansion seen in consumer goods. The latest data reflected reports of
improving demand in December, as new orders increased for the fourteenth
consecutive month. Moreover, the rate of expansion was marked overall and was the
fastest since the end of 2012. Reflective of further growth of output and new orders,
input buying among Indian goods producers increased in December. The rate of
expansion accelerated to the highest level in the current 14-month sequence of growth.
Subsequently, the pace of pre-production inventory building picked up to the sharpest
28
OPEC Monthly Oil Market Report – January 2015
World Economy
level in more than two years. Furthermore, stocks of finished goods held by Indian
manufacturers rose at their fastest rate since the survey began in April 2005.
Meanwhile, contrasting with continued growth of production and incoming new work,
staffing levels in India’s manufacturing economy declined in December. That followed
two successive months of slight job creation, although the pace of contraction was a
fraction overall. Job losses were evident in two of the three surveyed sub-sectors, with
the sole exception being intermediate goods.
Inflation is expected to remain within the 6.0-6.5% target range over next five years,
well below the double-digit rates seen over the past few years. Lower inflation should
support domestic demand and encourage investment. Both the wholesale price index
(WPI) and the consumer price index (CPI) inflation measures fell to a five-year low in
October as a result of lower prices for food and fuel. Moreover, since then, global oil
prices have continued to fall and are now expected to stay relatively low for a
prolonged period. With favourable base effects tapering off from December onwards,
the November CPI inflation reading may end the moderating trend, and December’s
CPI is likely to show a mild uptick in inflation. However, the underlying factors should
continue to remain favourable, largely reflecting softer global oil prices, sufficient food
supply and still weak domestic demand.
Graph 3.19: Indian inflation vs. repo rate
Repo rate
CPI higher target bond
Wholesale price index (WPI)
Dec 14
Nov 14
Oct 14
Sep 14
Aug 14
Jul 14
Jun 14
May 14
Apr 14
Mar 14
Feb 14
Jan 14
Dec 13
Nov 13
Oct 13
Sep 13
Aug 13
Jul 13
Jun 13
May 13
Apr 13
Mar 13
Feb 13
Jan 13
%
12
10
8
6
4
2
0
-2
Consumer price index (CPI)
CPI lower target bond
WPI confort zone
Sources: Ministry of Commerce and Industry, Reserve Bank of India and Haver Analytics.
Coupled with a recent shocking industrial production data showing India's industrial
output having tanked 4.2% y-o-y in October, the fresh CPI reading makes an even
stronger case for the RBI to start easing monetary policy in early 2015. With a larger
share of oil in the wholesale price basket (fuel and power alone account for 15% here,
as opposed to 11% in the consumer basket), it is no surprise that WPI inflation is
moderating faster than the CPI. The data shows soft global oil prices over the previous
months and has moved India's WPI into a deflationary territory in November. Following
better than expected November inflation readings (both wholesale and retail), the
December inflation data may be critical for the RBI's decision on future monetary policy
stance. The RBI's governor, R. Rajan, kept the leading repurchase rate unchanged at
8% in November, hinting at possible rate cuts early in 2015. However, should
December’s inflation continue to moderate despite the dissipating favourable base
effects, the RBI may act outside the policy review cycle, cutting rates as soon as midJanuary 2015.
The GDP growth expectation remains unchanged at 5.5% in 2014 and 5.8% in 2015.
OPEC Monthly Oil Market Report – January 2015
29
World Economy
China
In the end of year 2014, Chinese economic activity continues to lose momentum. The
flash December PMI reading and the November data released last week, confirm that
the economy has been slowing through the 4Q and it seems it will be around 7.0%.
The expectation for GDP growth in 2014 remains unchanged at 7.4% to 7.3% but
decreases for 2015 from 7.2% to 7.0%.
In terms of GDP revisions in 2013, the National Bureau of Statistics of China (NBS)
announced the revised GDP for 2013 on 19 December following the third economic
census. After this revision, the size of China's economy in 2013 increased about 3.4%
from the previously reported of CN¥56.9 trillion to CN¥58.8 trillion ($9.4 trillion). The
latest revision is a much smaller increment than earlier upward revisions of 16.8% and
4.4% following the past two censuses of 2004 and 2008, respectively. The NBS also
announced that this revision could affect the size of 2014 GDP but would not
substantially affect GDP growth, which was 7.4% through September compared to the
official target of about 7.5%.
Table 3.3: GDP revision after the third national economic census (NEC), CN¥ trillion
Before NEC
After NEC
Revision
(% change)
2013 GDP
Primary industry
Secondary industry
Tertiary industry
56.9
5.7
25.0
26.2
58.8
5.5
25.7
27.6
3.4%
-3.5%
2.8%
5.3%
2013 GDP per capita
41.9
43.3
3.4%
Sources: IHS Energy and NBS.
On 18 December, the Chinese premier called for the development of financing
guarantees to ease financing burdens on small enterprises and rural farmers. He also
called for local governments in China to establish more government-supported
financing guarantee institutions with private fund engagement, and to support them by
providing favourable taxation and risk compensation. Moreover, officials at the meeting
also stressed the importance of improving regulations and preventing risks from
financing guarantees.
China will focus on deepening reforms which will have immediate economic benefits in
2015, although the country is notably delaying meaningful implementation of some
major items. Chinese policy-makers at the Central Economic Work Conference agreed
on nine priority areas for reform in 2015, emphasising the need to ensure that reform is
supportive of growth. Those areas include: capital markets, market access for private
banks, administrative approval, investment, pricing, monopolies, franchising, and
government-purchased services, and outbound investment. Officials also mentioned
state-owned enterprise reform but did not include it on the high-priority list. The notice
also mentioned establishing a system to evaluate reform and better communicate
actual reform measures to the public. It seems all of the items mentioned are hugely
important for efficiency. Two of the most important reform areas in China are financial
and state-owned enterprise reform.
Foreign direct investment (FDI) in China rebounded into growth territory in November
due to improving completed investment in the still relatively fast growing services
sector. Cumulative completed FDI in China reached $106.2 billion last month, up 0.7%
y-o-y. This compares with a 1.2% y-o-y decline through October. Investment in
manufacturing contracted by 13.3% y-o-y compared with a 15.1% contraction in
30
OPEC Monthly Oil Market Report – January 2015
World Economy
October, while investment in services grew by 7.9% y-o-y compared with 6.6% y-o-y
growth in October. Manufacturing and services accounted for 33.8% and 55.1%,
respectively, of FDI into China.
Graph 3.20: Chinese RMB exchange rate
Graph 3.21: Chinese foreign reserves, NSA
CN¥/100US$
%
US$ bn
%
670
660
650
640
630
620
610
600
590
580
1%
4,200
0%
4,000
-1%
3,800
35%
30%
25%
20%
15%
10%
5%
0%
-2%
-3%
-4%
3,600
3,400
-5%
3,200
-6%
3,000
1Q 3Q 1Q 3Q 1Q 3Q 1Q 3Q
11 11 12 12 13 13 14 14
1Q 3Q 1Q 3Q 1Q 3Q 1Q 3Q
11 11 12 12 13 13 14 14
Exchange rate (LHS)
Foreign exchange (LHS)
% change y-o-y (RHS)
% change y-o-y (RHS)
Sources: State Administration of Foreign Exchange
and Haver Analytics.
Sources: State Administration of Foreign Exchange
and Haver Analytics.
China’s 3Q14 foreign exchange reserve number seems to have come in below
expectations. Reserve levels actually fell from $3.99 trillion in the 2Q to $3.89 trillion in
3Q. A strong dollar was the main reason behind China’s foreign reserves decline. In
the 3Q, the US dollar index appreciated by 7.7%, so the value of non-US dollar assets
in the foreign reserves depreciated when exchanged to US dollars. This is primarily a
change in book value and the decline does not reflect any real overseas cash outflow.
China’s foreign exchange reserves decreased to $3,888 billion in September 2014 from
$3,969 billion in August. Foreign exchange reserves in China averaged $722.85 billion
from 1980 until 2014, reaching an all-time high of $3,993 billion in June 2014. They hit
a record low of $2.3 billion back in December 1980.
Net new financing in China improved slightly in November relative to October, although
it remains in line with a trend of weaker overall financing levels and a shift away from
shadow banking throughout 2014. According to data issued by the People's Bank of
China (PBoC), net new financing last month totaled CN¥1.15 trillion ($185 billion). This
compares to CN¥662.7 billion in November or CN¥1.23 trillion in the previous year. Net
new shadow banking flows contributed 2% to new financing, compared to large drains
earlier this year or nearly one-third of net new financing in the previous year. In late
November, the PBoC adjusted benchmark interest rates in an effort to reduce financing
costs. But since then, interbank rates have risen and reports indicate that besides
mortgages most applied loan rates are not significantly lower. Moreover, a brief and
rapid surge in the equity market is now proving to be speculative rather than
sustainable, potentially dulling the net contribution of new financing via stocks during
the first weeks of December. Over the past three months, total new financing growth
was -16% y-o-y and besides a brief surge during June and July, new financing has
been in contraction since July 2013. This largely arises from a large wave of debt
maturing in 2014, a headwind which is expected to intensify in 2015.
OPEC Monthly Oil Market Report – January 2015
31
World Economy
Graph 3.22: Chinese GDP growth rate
Graph 3.23: Contribution to Chinese GDP
% change y-o-y
10
8
7.8%
8
7.7%
7.5%
7.4% 7.3%
3.1
6
5.7
0
4.0
3.6
4Q 13
3Q 13
2Q 13
1Q 13
-0.2
Net exports of goods and services
Gross capital formation
Final consumption expenditure
3Q 14
2Q 14
1Q 14
4Q 13
3Q 13
2Q 13
1Q 13
4Q 12
3Q 12
2Q 12
1Q 12
5
1Q 14
-1.4
-2
6
0.8
3.0
4
2
7
3.6
3Q 14
9
2Q 14
% change y-o-y
Sources: China National Bureau of Statistics and
Haver Analytics.
Source: China's National Bureau of Statistics and
Haver Analytics.
In terms of trade, exports expanded by 4.9% y-o-y in November compared to 11.5% in
October, significantly deeper than the moderate deceleration that was expected.
Imports also slowed down substantially, falling from a 4.6% y-o-y expansion in October
to a 6.5% y-o-y contraction in November. The largest points of weakness in exports
were those regarding Hong Kong, where trade slowed from 24% to 0.9% growth, and
to the United States, which slowed from 10.1% to 2.2% growth. Together, those two
partners account for about 53% of all Chinese exports.
Slowing import growth hit ASEAN, the EU and South Korean exporters hardest.
Slowing export growth will negatively affect real growth primarily through slowing
demand for manufactured goods. This makes it likely that industrial output, at least
within the manufacturing segment, will show further weakness in November.
Given the even steeper fall in import growth (only partly fuelled by lower oil prices), the
contribution of net exports to real growth may moderate to a lesser extent. During
October and November, China's trade surplus grew over the previous year's level by
$17.5 billion on average. This compares to average monthly gains of $22.4 billion
during the 3Q.
Graph 3.24: Chinese CPI and PPI
Graph 3.25: Chinese imports and exports
% change y-o-y
20%
15%
5%
Sources: China National Bureau of Statistics and
Haver Analytics.
Nov 14
Sep 14
Jul 14
May 14
Mar 14
Jan 14
Nov 13
0%
CPI
CPI lower target bond
PPI
Interest rate
32
8.5%
10%
Sep 13
Jul 13
May 13
Mar 13
Jan 13
% change y-o-y
8
6
4
2
0
-2
-4
-1.6%
-5%
-10%
1Q 2Q 3Q 4Q 1Q 2Q 3Q 4Q
2013
Exports
2014
Imports
Sources: China Customs and Haver Analytics.
OPEC Monthly Oil Market Report – January 2015
World Economy
In December 2014, China's manufacturing purchasing managers index (PMI) stood at
49.95, 0.4 percentage points (pp) lower from last month, slightly lower than the
threshold, indicating that the basic trend of China's manufacturing sector is slowing.
Non-manufacturing PMI, however, stood at 54.1, up by 0.2 pp over the previous month,
and 4.1 pp higher than the threshold, having slightly risen for two consecutive months,
indicating that the development trend of China's non-manufacturing sector has risen
steadily. Looking at various industries, the non-manufacturing PMI for the services
industry was at 53.3, up 0.7 pp over the previous month, indicating that growth in the
service industry has accelerated. New orders index stood at 50.5, up by 0.4 pp over the
previous month, higher than the threshold, indicating a rise in non-manufacturing
market demand, and the growth rate has accelerated.
Graph 3.26: Chinese PMI
Graph 3.27: Chinese industrial production
Index
% change y-o-y
54
11%
53
52
10%
Composite PMI
51.4
51
9%
50
8%
49.7
49
7%
48
7.2%
Sources: HSBC, Markit and Haver Analytics.
Nov 14
Oct 14
Sep 14
Aug 14
Jul 14
Jun 14
Apr 14
May 14
Mar 14
Jan 14
Feb 14
Dec 13
Nov 13
6%
Dec 13
Jan 14
Feb 14
Mar 14
Apr 14
May 14
Jun 14
Jul 14
Aug 14
Sep 14
Oct 14
Nov 14
Dec 14
47
Manufacturing PMI
Sources: China National Bureau of Statistics and
Haver Analytics.
OPEC Member Countries
Business activities in Saudi Arabia’s non-oil producing private sector continued in
expansionary territory last month. The SABB HSBC Saudi Arabia PMI registered 57.9
in December, up from 57.6 in November. The index was supported by quicker growth in
output and employment rise. New orders posted a slower pace of growth in December.
Graph 3.28: Saudi Arabia and UAE: manufacturing PMIs
Index
65
60
58.4
57.9
55
Saudi Arabia
Dec 14
Nov 14
Oct 14
Sep 14
Aug 14
Jul 14
Jun 14
May 14
Apr 14
Mar 14
Feb 14
Jan 14
Dec 13
Oct 13
Nov 13
Sep 13
Aug 13
Jul 13
Jun 13
May 13
Apr 13
Mar 13
Feb 13
Jan 13
Dec 12
50
UAE
Sources: SAAB, HSBC, Markit and Haver Analytics.
OPEC Monthly Oil Market Report – January 2015
33
World Economy
In the United Arab Emirates, the non-oil producing private sector signaled a sustained
improvement in business conditions in December with the PMI at 58.4, up from 58.3 in
November. The survey showed output growing by the second fastest pace in the
series’ history, together with acceleration in the growth of new orders and a solid rise in
employment.
Other Asia
The manufacturing sector in Indonesia slowed in December with the sector’s index
weakening to a record low. The manufacturing PMI of December decreased to 47.6,
from 48 in November, on the back of output and new orders contraction. Furthermore,
the lower fuel subsidy resulted in stronger cost pressures on manufacturers. Indonesia
posted a $426 million trade deficit in November 2014, dropping from a surplus of
$20 million in the preceding month and from a $789 million a year earlier. Exports and
imports declined by 14.6% and 7.3% y-o-y, respectively.
Malaysia reported a 11.13 billion ringgit trade surplus in November of 2014 compared
to a 9.88 billion ringgit a year earlier as exports increased more than imports. Exports
rose 2.1% y-o-y to in November supported mainly by rise in shipments of electrical and
electronic products, while imports increased 0.1% y-o-y.
In Vietnam, the manufacturing sector expanded further last month on sharper
increases in production and new business. In addition, the sector maintained its robust
job creation performance. Firms reported an ease in inflationary pressures last month.
Graph 3.29: Manufacturing PMIs in Other Asia
Index
54
52.7
52
50
48
47.6
46
Vietnam
Dec 14
Nov 14
Oct 14
Sep 14
Aug 14
Jul 14
Jun 14
May 14
Apr 14
Mar 14
Feb 14
Jan 14
Dec 13
Nov 13
Oct 13
Sep 13
Aug 13
Jul 13
Jun 13
May 13
Apr 13
Mar 13
Feb 13
Jan 13
44
Indonesia
Sources: HSBC, Markit and Haver Analytics.
Africa
In South Africa, the trade gap decreased to 5.7 billion rand in November from a
revised 21.6 billion rand shortfall in the previous month, due to a sharp drop in imports.
Imports shrank faster than exports by 18.7% over the previous month, while exports
decreased 5.3%. The annual inflation rate eased to 5.8% in November 2014 from 5.9%
in the previous two months due to lower food and transport costs. On a monthly basis,
consumer prices were flat, following a 0.2% increase in the October. Business activities
in the country’s private sector continued to expand in December, though at a slower
pace than the previous month. While new export orders rose by strongest rate in
22 months, output and new orders fell for the first time since July 2014.
34
OPEC Monthly Oil Market Report – January 2015
World Economy
In Egypt, the annual inflation rate rose to 10.1% in December 2014 from 9.1% in
November. Yet core inflation eased for the fourth straight month to 7.7% from 7.8% in
the previous period. On a monthly basis, consumer prices fell 0.1%, following a 1.5%
drop in November. In contrast, the core CPI grew by 0.3% compared to -0.2% in
November. The country’s private sector sent another encouraging signal last month,
with the PMI rising to 51.4 in December from 50.7 in November.
Graph 3.30: PMIs in South Africa and Egypt
Index
54
52
51.4
50.2
50
48
46
South Africa
Dec 14
Nov 14
Oct 14
Sep 14
Aug 14
Jul 14
Jun 14
May 14
Apr 14
Mar 14
Feb 14
Jan 14
Dec 13
44
Egypt
Sources: HSBC, Reuters Telerate and Haver Analytics.
Latin America
Argentina’s GDP shrank 0.8% y-o-y in the 3Q14 on the back of a fall in exports,
investments and private consumption. Exports fell by 8.4% y-o-y and imports dropped
by 15.2% y-o-y, according to preliminary estimates. Gross fixed capital formation
decreased by 4.7% y-o-y and private consumption shrank by 1.4% y-o-y. In contrast,
government expenditure rose 1% y-o-y.
In Chile, the central bank left the monetary policy interest rate on hold at 3% in
December. The economy there is experiencing a slowing momentum on the back of a
fall in capital expenditures of around 10% y-o-y in the 3Q14. This fall was led by a
nearly 25% drop in investment on machinery and equipment. The GDP contracted
0.8% in the 3Q, following growth of 2.7% and 1.9% in the 1Q and the 2Q, respectively.
Transition region
In Poland, the GDP expanded at a seasonally adjusted 0.9% q-o-q in the 3Q14, better
than the 0.7% q-o-q growth reported for the 2Q14. Growth was supported by a rise in
investment and consumption. The unemployment rate increased to 11.4% in November
2014 from 11.3% in October. It was the first rise in ten months as fewer jobs were
created. The manufacturing economy continued on last month’s upswing despite the
slight decrease in the sector’s PMI. The index posted 52.8 in December, down from
53.2 in November. The survey confirmed solid growth in production and new business,
while input price inflation is broadly unchanged from the previous month.
In the Czech Republic, the manufacturing sector expanded in December, though by
the slowest pace in 17 months. The manufacturing PMI dropped to 53.3 in December
from 55.6 a month earlier. The survey showed a solid rise in production, new orders,
exports and employment but all at lower rates.
OPEC Monthly Oil Market Report – January 2015
35
World Economy
Graph 3.31: Manufacturing PMIs in transition region
Index
58
56
54
53.3
52.8
52
50
48
46
Czech Republic
Dec 14
Nov 14
Oct 14
Sep 14
Aug 14
Jul 14
Jun 14
May 14
Apr 14
Mar 14
Feb 14
Jan 14
Dec 13
Nov 13
Oct 13
Sep 13
Aug 13
Jul 13
Jun 13
May 13
Apr 13
Mar 13
Feb 13
Jan 13
44
Poland
Sources: HSBC, Markit and Haver Analytics.
Oil prices, US dollar and inflation
The US dollar continued appreciating versus all major currency counterparts on
average in December. It gained 2.6% versus the yen, 1.2% compared to the euro,
0.8% versus the pound sterling and 1.2% to the Swiss franc. Moreover, and of great
importance, is the continued decline of currencies in emerging markets. The Russian
ruble continued declining in December by 21% m-o-m. The Brazilian real also
continued depreciating by 3.6% m-o-m on average in December, while the Indian
rupee fell by 1.7% m-o-m on average. Currencies from other emerging and developing
economies have also been impacted. Given some uncertainty about the future
monetary policy of the US Fed, the volatility in currency markets is expected to
continue.
In nominal terms, the price of the OPEC Reference Basket (ORB) declined by a
monthly average of $16.11/b, or 21.3%, from $75.57/b in November to $59.46/b in
December. In real terms, after accounting for inflation and currency fluctuations, the
ORB fell by 20.6%, or $9.95/b, to $38.35/b from $48.30/b (base June 2001=100). Over
the same period, the US dollar gained 1.0% against the import-weighted modified
Geneva I + US dollar basket * while inflation remained flat.
*
The ‘modified Geneva I+US$ basket’ includes the euro, the Japanese yen, the US dollar, the pound sterling and the
Swiss franc, weighted according to the merchandise imports of OPEC Member Countries from the countries in the
basket.
36
OPEC Monthly Oil Market Report – January 2015
World Oil Demand
World Oil Demand
World oil demand growth for 2014 was revised up by 20 tb/d to average
0.95 mb/d, bringing total oil demand to 91.15 mb/d. The upward revision was
broadly a result of better-than-expected data for OECD America and China in
4Q14. For 2015, growth is expected to be around 1.15 mb/d, higher by 30 tb/d
from the previous month’s report, reaching 92.30 mb/d as result of upward
adjustments to oil demand data in OECD America and Other Asia.
World oil demand in 2014 and 2015
Table 4.1: World oil demand in 2014, mb/d
Change 2014/13
Growth
%
0.10 0.41
0.13 0.70
-0.20 -1.50
-0.18 -2.12
-0.28 -0.61
Americas
of which US
Europe
Asia Pacific
Total OECD
2013
24.08
19.27
13.61
8.32
46.01
1Q14
23.87
19.16
13.01
8.85
45.73
2Q14
23.76
19.02
13.46
7.65
44.86
3Q14
24.37
19.52
13.75
7.69
45.81
4Q14
24.73
19.90
13.39
8.38
46.50
2014
24.18
19.40
13.40
8.14
45.73
Other Asia
of which India
Latin America
Middle East
Africa
Total DCs
11.06
3.70
6.50
7.81
3.63
29.00
11.08
3.85
6.42
8.07
3.75
29.31
11.37
3.80
6.69
7.93
3.75
29.74
11.34
3.63
6.98
8.39
3.63
30.34
11.33
3.84
6.74
7.89
3.78
29.74
11.28
3.78
6.71
8.07
3.73
29.79
0.22
0.08
0.21
0.26
0.10
0.79
1.99
2.18
3.29
3.31
2.74
2.73
FSU
Other Europe
China
Total "Other regions"
4.49
0.64
10.07
15.20
4.39
0.64
10.08
15.11
4.24
0.60
10.56
15.39
4.63
0.64
10.31
15.58
4.91
0.72
10.83
16.45
4.54
0.65
10.45
15.64
0.05
0.01
0.38
0.44
1.14
2.05
3.77
2.92
Total world
Previous estimate
Revision
90.20
90.20
0.00
90.15
90.16
0.00
90.00
90.01
-0.01
91.73
91.81
-0.08
92.69
92.52
0.17
91.15
91.13
0.02
0.95
0.93
0.02
1.06
1.04
0.02
Totals may not add up due to independent rounding.
OECD Americas
The most recent available monthly US oil demand data for October implies y-o-y gains
in oil requirements of around 1.7%, after a slightly decreasing September and a third
quarter similar to the first and second quarters of 2014. There are, moreover, distinct
trends in October data which cannot be overlooked. Demand for gasoline rose strongly
by around 0.25 mb/d or equivalent to 2.8% y-o-y, supported by an improving economy
and lower fuel prices and in line with increasing figures for mileage and new automobile
registrations. The upward trend in gasoline demand is a new phenomenon since
October, and seems to have continued in November and December, according to
preliminary weekly data.
October distillate requirements continued their healthy growth trajectory in line with
rising industrial production activities. Demand in residual fuel oil rose sharply by
0.03 mb/d, or 9.4% y-o-y, for the first time since 1Q13. Demand for residual fuel oil
seems to be remaining strong during 4Q14. Finally, demand for aviation fuels
continued to be healthy in October. Covering ten months in 2014, the US oil demand
picture is in line with general economic recovery in the country, with more oil required in
the industrial and transportation sectors.
OPEC Monthly Oil Market Report – January 2015
37
World Oil Demand
Graph 4.1: US oil consumption, y-o-y changes
All other
Distllates
Gasoline
Dec 14
Nov 14
Oct 14
Sep 14
Aug 14
Jul 14
Jun 14
Apr 14
May 14
Mar 14
Feb 14
Jan 14
Dec 13
Nov 13
Oct 13
Sep 13
Aug 13
Jul 13
Jun 13
May 13
Apr 13
Mar 13
Feb 13
Jan 13
Dec 12
tb/d
1,400
1,200
1,000
800
600
400
200
0
-200
-400
-600
-800
Total oil
Preliminary weekly data for November and December extends the existing overall
picture, with the majority of main product categories rising. Developments in 2015
US oil demand remain strongly dependent on the development and further recovery of
the US economy, with risks skewed more to the upside compared with the previous
month, mainly as a result of the low oil price environment, which favors oil usage,
particularly in the transportation and industrial sectors.
In Mexico, November usage was slightly down. Growing demand for residual fuel oil,
distillates and jet fuel was more than offset by shrinking demand for gasoline. Mexican
oil demand is expected to grow slightly in 2015 and risks are skewed more to the
upside compared with the previous month, primarily due to the dependence of the
country’s economy on the US.
The latest Canadian data for October shows gains in gasoline and residual fuel oil
requirements. The 2015 projections for Canadian oil demand remain unchanged from
those of the previous month.
In 2014, OECD Americas’ oil demand grew by 0.10 mb/d compared with 2013.
For 2015, OECD Americas’ oil demand is projected to grow more by 0.19 mb/d
compared with 2014.
Graph 4.2: Quarterly world oil demand growth
tb/d
2,000
1,500
1,000
500
0
-500
-1,000
1Q
2Q
3Q
2013
OECD
38
4Q
1Q
2Q
3Q
2014
estimate
Non-OECD
4Q
1Q
2Q
3Q
4Q
2015
forecast
Total world
OPEC Monthly Oil Market Report – January 2015
World Oil Demand
OECD Europe
Bearish sentiment in European oil demand seems to be endless, with September
being the only positive month during 2014. October data shows oil demand in the
region declining again, particularly for the European Big 4 consumers and despite
rising industrial production figures and automobile sales. Moreover, early indications for
November again show losses for European Big 4 oil demand of around 0.15 mb/d.
With data available for 11 months in 2014, oil demand in the Big 4 shows losses of
approximately 0.17 mb/d. From January to November gasoline remained flat, while
LPG, distillates and fuel oil were on the decline.
Some positive news of late is that European auto sales continued their positive
momentum in November, with an overall 1.4% y-o-y increase and with positive
momentum in almost all major markets, notably Spain, the UK and Italy. In addition, the
current low crude price environment seems to have supported gasoline demand in the
region, which showed a slightly declining picture at the end of 2014, compared with a
much more pessimistic trajectory some months ago.
Careful hopes for an improvement in 2015 European oil demand originate in
anticipated improvements for the overall economy in combination with a very low oil
demand baseline in the region. On the other side, heavy taxation on oil usage and
concerns about budget deficits in several countries of the region pose a significant
downside risk for future oil demand. General expectations for the region’s oil demand
during 2015 have generally improved since the previous month’s projections, in part as
a result of the current low oil price environment.
In 2014, European oil demand shrank by 0.20 mb/d, while oil demand in 2015 is
projected to decrease again, but to a lesser extent, by 0.10 mb/d.
Table 4.2: Europe Big 4* oil demand, tb/d
LPG
Gasoline
Jet/Kerosene
Gas/Diesel oil
Fuel oil
Other products
Total
Nov 14
386
1,077
679
3,216
287
912
6,557
Nov 13
391
1,083
753
3,246
282
953
6,708
Change form Nov 13
-5
-6
-74
-30
5
-41
-151
Change form Nov 13, %
-1.4
-0.5
-9.9
-0.9
1.9
-4.3
-2.3
* Germany, France, Italy and the UK.
OECD Asia Pacific
Japanese oil demand in November decreased sharply by 0.43 mb/d y-o-y with all
main product categories declining, particularly gasoline, diesel oil, residual fuel oil and
direct crude burning. Increasing usage of natural gas and coal for electricity generation
continued in November and natural gas seemed to account for losses in demand for
LPG and naphtha. In December, early indications are mixed, with automobile
registrations growing and industrial production falling. Moreover, Japan’s nuclear
regulator has granted safety clearance for two more reactors in the Takahama nuclear
station. Currently four reactors could restart within 2015.
The outlook risks for 2015 Japanese oil demand remain unchanged from the previous
month’s forecasts and are determined by the degree of coal and gas usage for
electricity generation as well as by the number of nuclear plants that will rejoin
operation during 2015.
OPEC Monthly Oil Market Report – January 2015
39
World Oil Demand
Table 4.3: Japanese domestic sales, tb/d
LPG
Gasoline
Naphtha
Jet fuel
Kerosene
Gasoil
Fuel oil
Other products
Direct crude burning
Nov 14
450
909
836
84
348
584
499
61
114
Change from Nov 13
-34
-49
-22
11
-57
-45
-115
-7
-109
Change from Nov 13, %
-7.1
-5.1
-2.6
14.5
-14.1
-7.1
-18.7
-9.9
-49.0
3,886
-427
-9.9
Total
In South Korea, November demand was down, y-o-y. Growing petrochemical
activities, which called for increasing naphtha requirements as well as strong jet fuel
demand, have been more than offset by shrinking demand in all other main product
categories, particularly residual fuel oil and kerosene. The outlook for South Korean oil
consumption during 2015 remained unchanged compared with the previous month’s
projections.
OECD Asia Pacific 2014 oil consumption shrank by 0.18 mb/d. The downward trend
will continue in 2015, but to a lesser degree, by 0.12 mb/d.
Other Asia
In India, demand for oil jumped in November, making it the month with the secondhighest growth in 2014. Oil demand rose by 0.18 mb/d – or just below 5% – compared
with the same period in 2013. Lower retail prices, better weather conditions and
general improvements in the country’s macroeconomic indicators gave a boost to
product demand. This development was led by strong growth in LPG, which continues
to be one of the major components driving growth.
Graph 4.3: Changes in Indian oil demand, y-o-y
tb/d
500
400
300
200
100
0
-100
-200
LPG
Gasoline
Kerosene
Diesel oil
Fuel oil
Nov 14
Oct 14
Sep 14
Aug 14
Jul 14
Jun 14
May 14
Apr 14
Mar 14
Feb 14
Jan 14
Dec 13
Oct 13
Nov 13
Sep 13
Aug 13
Jul 13
Jun 13
May 13
Apr 13
Mar 13
Feb 13
Jan 13
Dec 12
Nov 12
-300
Other products
As stated in previous monthly reports, subsidies for LPG were increased in 2014,
resulting in increased demand for the product; growth in November was well above the
14% mark. Gasoline also contributed to growth, rising by more than 3% y-o-y.
However, this growth was lower compared with year-to-date data. This is can be
attributed to a slowdown in vehicle sales – specifically two-wheeler sales – which, after
40
OPEC Monthly Oil Market Report – January 2015
World Oil Demand
falling in October by around 9% y-o-y, continued to fall in November by 3% y-o-y.
Diesel demand picked up pace, growing by around 3% y-o-y after two months of
decline as a result of slower agriculture and fishing activities due to harsh weather
conditions.
Diesel retail prices were fully deregulated in 2014 to move with international prices.
However, the steep decline in international prices is also assumed to have an impact
on diesel demand, not to mention supporting industrial activities, which have improved
compared with previous months.
Fuel oil demand growth was also positive, rising by more than 2% y-o-y, while 2014
year-to-date growth figures ˗˗ excluding November data ˗˗ hint to a decline in growth of
close to 8% compared with the same period in 2013.
Table 4.4: Indian oil demand by main products, tb/d
LPG
Gasoline
Kerosene
Diesel oil
Fuel oil
Other products
Total oil demand
Nov 14
662
402
316
1,648
246
638
Nov 13
578
388
325
1,600
240
598
Change
84
14
-9
48
6
41
Change, %
14.5
3.6
-2.8
3.0
2.3
6.8
3,911
3,729
183
4.9
In Indonesia, oil demand rose during the month of October 2014 by around 10 tb/d,
with all products in positive territory with the exception of diesel oil – which was flat –
and fuel oil, which declined. As highlighted in the previous monthly report, Indonesia
announced the removal of fuel subsidies, to take effect in November 2014. This should
have an impact on product consumption going forward in 2015.
Looking forward, risks for 2015 in Other Asia’s oil demand growth are expected to be
balanced with a slight positive effect from India as a result of overall improvement in
economic activity along with lower oil prices, lending support to product demand.
In Indonesia and Malaysia, subsidies on transportation fuels and the degree of their
reduction may influence oil demand growth, however, lower international prices at this
stage should moderate the impact.
Other Asia’s oil demand is anticipated to grow by 0.22 mb/d in 2014. As for 2015, oil
demand is forecast to be 0.25 mb/d higher than in 2014.
Latin America
In Brazil, November oil demand saw a decrease in consumption of around 11 tb/d or
around minus 0.5% y-o-y. It declined after two months of exceptionally high growth
resulting from drought conditions in the northern part of the country, prompting
additional requirements for carbon-based fuels.
Gasoline consumption declined slightly by around 6 tb/d or below 1% y-o-y. A decline
in car sales – by around by 8% y-o-y – as well as the end of an election campaign,
were the major contributing factors to the downward trend. Diesel demand also
weakened, down by 36 tb/d, or more than 3% y-o-y for the same reasons, plus slower
economic activity in the country, which was apparent from industrial production data.
On the other hand, fuel oil demand rose by 19 tb/d, or more than 20% y-o-y. This was a
OPEC Monthly Oil Market Report – January 2015
41
World Oil Demand
consequence of power utility plants switching to fuel oil to compensate for losses in
hydroelectric power.
Table 4.5: Brazilian inland deliveries, tb/d
Nov 14
Nov 13
Change
Change, %
LPG
Gasoline
Jet/Kerosene
Diesel
Fuel oil
Alcohol
223
743
131
1,029
112
244
228
749
126
1,065
93
232
-5
-6
5
-36
19
13
-2.1
-0.8
3.6
-3.4
20.6
5.5
Total
2,482
2,492
-11
-0.4
In Argentina, October saw positive oil demand. Transportation fuels, apart from diesel
oil, were on an increasing trend. LPG and other products also positively impacted oil
demand growth; LPG rose by almost 12% and other products increased by around 4%.
Looking forward, 2015 risks are currently skewed to the downside, as economic
development in the region’s major consuming nation – Brazil – is expected to slow with
government spending anticipated to be lower to control the budget deficit. The
continuation of lower oil prices as well as unusual weather conditions should moderate
the impact.
Latin American oil demand is anticipated to grow in 2014, by 0.21 mb/d. During 2015,
oil demand growth is forecast to drop slightly from 2014 levels, increasing by
0.20 mb/d.
Middle East
In Saudi Arabia, November oil demand was characterized by increases across the
barrel with “other products” and fuel oil leading by more than 61% and 27% y-o-y,
respectively. Demand for fuel oil for power generation continued to increase, despite
the end of the fuel oil demand season, as it seems to have been preferred over direct
crude burning for power generation. In addition, strong growth in transportation fuels
gasoline and diesel was apparent, supported by gains in auto sales; 4Q14 data show
an increase in auto sales of more than 5% y-o-y.
Oil demand in Iraq continued its declining trend in November, losing more than 40 tb/d
or just below 7% y-o-y. Year-to-date it is now firmly in the negative, with a drop in
consumption of just below 6% compared with the same period in 2013. Consumption in
Iraq steadily increased in 2013 until mid-2014, prior to the rise of geopolitical concerns
in the country.
The outlook for 2015 Middle East oil demand depends very much on the level of the
overall economy and government spending plans, with risk slightly skewed to the
downside.
For 2014, Middle East oil demand growth is anticipated to hover around 0.26 mb/d,
while oil demand in 2015 is projected to grow by 0.29 mb/d.
42
OPEC Monthly Oil Market Report – January 2015
World Oil Demand
Graph 4.4: Oil demand growth in the Middle East, y-o-y
tb/d
tb/d
400
400
300
300
200
200
100
100
0
0
-100
-100
1Q12
2Q12
3Q12
4Q12
Saudi Arabia
1Q13
2Q13
Iran, I.R.
3Q13
4Q13
Kuwait
1Q14
2Q14
UAE
3Q14
Others
China
In China, November oil demand growth came up strong, marking a continuation of the
upward trend in oil demand during the second half of 2014. November Chinese oil
demand was predominantly characterized by high LPG demand for the petrochemical
sector – growing by a remarkable 30% y-o-y, rising gasoline consumption in the road
transportation sector – growing by 9% y-o-y, increasing jet fuel demand for the air
transportation sector – growing by 2% y-o-y, as well as increasing diesel oil demand for
the agriculture and fishing sectors – increasing by 4% y-o-y. Furthermore, a declining
trend in the consumption of residual fuel oil has been reversed and showed marginal
growth of 1% y-o-y.
Graph 4.5: Chinese gasoil and gasoline demand growth, y-o-y
%
20
15
10
5
0
-5
-10
Gasoline
Nov 14
Oct 14
Sep 14
Aug 14
Jul 14
Jun 14
May 14
Apr 14
Mar 14
Feb 14
Jan 14
Dec 13
Nov 13
Oct 13
Sep 13
Aug 13
Jul 13
Jun 13
May 13
Apr 13
Mar 13
Feb 13
Jan 13
Dec 12
Nov 12
-15
Gasoil
According to statistics and analysis of the China Association of Automobile
Manufacturers (CAAM), sales of passenger vehicles were up by around 1.8 million
units, representing an increase of approximately 2.3% y-o-y. Growth in sales continued
on a downward trend, below the October figure of 2.8%. Overall growth in sales for the
period January to November stood at 6% y-o-y, lower than the corresponding period in
2013, which experienced growth of 9% y-o-y. Factors which cap and may further
reduce gasoline consumption are measures geared towards increasing the quality of
transportation fuels with the aim of lowering air pollution in major cities, in addition to
OPEC Monthly Oil Market Report – January 2015
43
World Oil Demand
recent increases in the taxation of oil product usage. Looking forward, the outlook for
2015 remains relatively unchanged since the previous month, with similar factors
pointing to the downside mainly focused on a possible economic slowdown and
implementation of measures to limit transportation fuel consumption.
Graph 4.6: Changes in Chinese apparent oil demand, y-o-y changes
tb/d
tb/d
1,000
1,000
800
800
600
600
400
400
200
200
0
0
-200
-200
-400
-400
-600
Jan
Feb
Mar
Apr
May
Jun
Historical range
Jul
Aug
Sep
Oct
2013
Nov
-600
Dec
2014*
* Forecast.
On the other hand, additional propylene dehydration plants (PDH) which require
propane as a feedstock, and developments in refining capacity could be considered
factors that might push oil demand estimates higher.
For 2014, Chinese oil demand is anticipated to grow by 0.38 mb/d, while oil demand
in 2015 is projected to increase again by 0.31 mb/d.
Table 4.6: World oil demand in 2015, mb/d
Change 2015/14
%
Growth
0.19
0.79
0.16
0.83
-0.10
-0.71
-0.12
-1.51
-0.03
-0.06
Americas
of which US
Europe
Asia Pacific
Total OECD
2014
24.18
19.40
13.40
8.14
45.73
1Q15
24.06
19.32
12.92
8.76
45.74
2Q15
23.93
19.15
13.38
7.57
44.87
3Q15
24.57
19.69
13.64
7.56
45.77
4Q15
24.92
20.07
13.28
8.20
46.40
2015
24.37
19.56
13.31
8.02
45.70
Other Asia
of which India
Latin America
Middle East
Africa
Total DCs
11.28
3.78
6.71
8.07
3.73
29.79
11.32
3.95
6.61
8.35
3.84
30.13
11.63
3.91
6.89
8.19
3.84
30.55
11.62
3.76
7.18
8.69
3.72
31.20
11.57
3.96
6.95
8.17
3.87
30.56
11.53
3.89
6.91
8.35
3.82
30.61
0.25
0.12
0.20
0.29
0.09
0.83
2.24
3.05
2.94
3.53
2.41
2.77
FSU
Other Europe
China
Total "Other regions"
4.54
0.65
10.45
15.64
4.43
0.65
10.39
15.46
4.27
0.60
10.87
15.75
4.67
0.65
10.63
15.95
4.95
0.73
11.12
16.80
4.58
0.66
10.75
15.99
0.04
0.01
0.31
0.35
0.88
1.08
2.94
2.27
Total world
Previous estimate
Revision
91.15
91.13
0.02
91.33
91.30
0.03
91.17
91.15
0.02
92.92
92.96
-0.04
93.76
93.58
0.18
92.30
92.26
0.05
1.15
1.12
0.03
1.26
1.23
0.03
Totals may not add up due to independent rounding.
44
OPEC Monthly Oil Market Report – January 2015
World Oil Supply
World Oil Supply
Non-OPEC oil supply is estimated to have averaged 56.22 mb/d in 2014, an
increase of 1.98 mb/d y-o-y, up by 0.26 mb/d over the previous report, driven by
growth in 4Q14 from the US, Russia, the UK, Brazil, Vietnam, Kazakhstan and
Latin America others as well as the upward revisions in OECD, DCs and FSU in
general. Non-OPEC oil supply in 2015 is projected to grow by 1.28 mb/d, mostly
in 1H15, down 80 tb/d from the previous assessment, to average 57.49 mb/d.
OPEC NGL production is forecast to grow by 0.18 mb/d to average 5.83 mb/d in
2014, following growth of 80 tb/d in 2013. In December, OPEC production
increased by 142 tb/d to average 30.20 mb/d, according to secondary sources. As
a result, preliminary data indicates that global oil supply increased by 22 tb/d in
December to average 93.16 mb/d.
Estimate for 2014
Non-OPEC supply
Non-OPEC oil supply is estimated to have averaged 56.22 mb/d in 2014, an increase
of 1.98 mb/d over 2013, indicating an upward revision by 0.26 mb/d from the previous
MOMR. Within the quarters, non-OPEC oil supply encountered upward revisions in all
four quarters. The mostly updated production data for 4Q led to this adjustment, as well
as revisions in the other three quarters in the US, in 2Q in Canada, Latin America
Others and Bahrain, and in 3Q in Canada, the UK, India, Malaysia, Trinidad & Tobago,
Bahrain and FSU others.
Graph 5.1: Regional non-OPEC supply growth, y-o-y
mb/d
mb/d
1.8
1.8
13/12
1.5
14/13
15/14
1.5
1.2
1.2
0.9
0.9
0.6
0.6
0.3
0.3
0.0
0.0
-0.3
-0.3
OECD
America
OECD
Europe
OECD Asia
Pacific
Other
Asia
Latin
Middle East
America
Africa
FSU
Non-OPEC supply in 2014 saw two contrary developments: strong growth from
OECD Americas and Latin America, as well as FSU, Africa, China and Asia Pacific,
while other regions saw declines. OECD Americas’ oil supply growth estimate of
1.71 mb/d in 2014 was the highest on record, while declines of 0.07 mb/d in Other Asia
represented the largest contractions. Non-OPEC oil supply growth was revised up by
0.26 mb/d to 1.98 mb/d compared to the last MOMR.
On a quarterly basis, non-OPEC supply in 2014 is estimated at 55.64 mb/d,
55.93 mb/d, 56.23 mb/d and 57.06 mb/d, respectively.
OPEC Monthly Oil Market Report – January 2015
45
World Oil Supply
The non-OPEC supply revision in 4Q was due to higher-than-expected production,
mainly in the US and Russia, and partially due to upward revisions in in all countries.
The supply profiles of the US, the UK, Denmark, India, Malaysia, Thailand, Vietnam,
Latin America Others, Bahrain, Russia, Kazakhstan, FSU Others and China were
revised up, while downward revisions were made to Brunei, Oman and Azerbaijan.
Strong growth in OECD Americas was supported by tight crude and unconventional
NGLs, while declines in the other regions were driven mainly by political, technical and
weather-related factors. Disruptions mainly affected output from Mexico, Syria,
Colombia, Indonesia, the UK and the Sudans.
According to preliminary and estimated data, total non-OPEC supply in 4Q14 increased
by 1.64 mb/d over the same period a year earlier. During 2H14, non-OPEC supply
increased by 1.67 mb/d compared with the same period of the previous year.
Table 5.1: Non-OPEC oil supply in 2014, mb/d
Americas
of which US
Europe
Asia Pacific
Total OECD
2013
18.14
11.23
3.58
0.48
22.20
1Q14
19.16
12.00
3.75
0.50
23.41
2Q14
19.79
12.83
3.51
0.50
23.80
3Q14
20.09
13.16
3.40
0.51
24.00
4Q14
20.35
13.41
3.62
0.51
24.48
2014
19.85
12.86
3.57
0.50
23.93
Change
14/13
1.71
1.63
-0.01
0.02
1.73
Other Asia
Latin America
Middle East
Africa
Total DCs
3.59
4.78
1.36
2.40
12.13
3.55
4.87
1.34
2.44
12.21
3.52
4.93
1.34
2.41
12.20
3.47
5.11
1.36
2.40
12.34
3.54
5.20
1.33
2.39
12.46
3.52
5.03
1.34
2.41
12.30
-0.07
0.25
-0.02
0.01
0.17
FSU
of which Russia
Other Europe
China
Total "Other regions"
Total Non-OPEC production
Processing gains
13.41
10.51
0.14
4.24
17.78
52.11
2.13
13.48
10.59
0.14
4.24
17.86
53.47
2.16
13.36
10.55
0.14
4.27
17.76
53.77
2.16
13.39
10.52
0.14
4.20
17.73
54.07
2.16
13.53
10.65
0.14
4.29
17.96
54.90
2.16
13.44
10.58
0.14
4.25
17.83
54.05
2.16
0.03
0.07
0.00
0.01
0.04
1.94
0.03
Total Non-OPEC supply
Previous estimate
Revision
54.24
54.23
0.01
55.64
55.59
0.05
55.93
55.78
0.15
56.23
55.91
0.32
57.06
56.50
0.56
56.22
55.95
0.27
1.98
1.72
0.26
OECD
Total OECD oil supply in 2014 is estimated to grow by 1.73 mb/d to average
23.93 mb/d, indicating an upward revision of 0.21 mb/d from the last MOMR. Output in
4Q reached 24.48 mb/d, with an increase of 1.58 mb/d compared with the same
quarter in 2013. The upward revision came from OECD Americas and OECD Europe,
while OECD Asia Pacific registered unchanged data compared to the last MOMR.
On a quarterly basis, total OECD supply is estimated to average 23.41 mb/d,
23.80 mb/d, 24.00 mb/d and 24.48 mb/d, respectively.
46
OPEC Monthly Oil Market Report – January 2015
World Oil Supply
Graph 5.2: OECD’s quarterly production
Graph 5.3: OECD’s quarterly production,
annual comparison
mb/d
mb/d
26
26
25
25
24
24
23
23
22
22
21
21
20
19
20
1Q
1Q12
2Q12
3Q12
4Q12
1Q13
2Q13
3Q13
4Q13
1Q14
2Q14
3Q14
4Q14
1Q15
2Q15
3Q15
4Q15
19
2Q
3Q
4Q
2012
2013
2014
2015
OECD Americas
OECD Americas’ oil supply is estimated to average 19.85 mb/d, showing growth of
1.71 mb/d compared with last year. It is projected to increase by 1.04 mb/d in 2015
over the previous year — lower than 2013 growth but the highest among all non-OPEC
regions — to average 20.89 mb/d, representing a downward revision of 0.16 mb/d from
the previous month. The US and Canada’s supply are both expected to grow in 2014,
while that of Mexico is estimated to decline by 90 tb/d. On a quarterly basis,
OECD America’s oil supply in 2014 is estimated to average 19.16 mb/d, 19.79 mb/d,
20.09 mb/d and 20.35 mb/d, respectively.
US
US total oil supply is estimated to increase by 1.63 mb/d to average 12.86 mb/d in
2014, representing an upward revision of 0.18 mb/d from the last MOMR. US liquids
production was pegged at 13.40 mb/d in October, higher y-o-y by 1.72 mb/d and up
m-o-m by 70 tb/d, with crude output higher by 65 tb/d. Support came from a postmaintenance ramp up in Alaska, where production rose to a five-month high of
0.54 mb/d. Crude output rose above 9 mb/d for the first time since March 1986, higher
y-o-y by 1.36 mb/d, due to the continuation of tight crude production. US oil output is
expected to fall in the coming months due to reductions in active drilling rigs from
1 November 2014 to 7 January 2015, including 66 rigs at the Permian basin, 33 rigs at
Willston, North Dakota and 16 rigs at Eagle Ford. The production from Gulf of Mexico
(GOM) is not expected to decline in 2015 due to a number of startups and ramp-ups of
projects already initiated in 2014. Nevertheless, GOM output in October fell to
1.42 mb/d, lower by 23 tb/d than September’s output.
Elsewhere, in North Dakota, oil production fell to average 1.18 mb/d due to the
implementation of new flaring regulations as opposed to a pullback from producers in
light of falling prices. Moreover, Bakken producers now face additional costs in addition
to the flaring; all crudes must be treated and tested before shipment by rail to reduce
the explosion risks in derailments. The order requires compliance with a series of
temperature and pressure parameters, restricting the vapour pressure of crude oil to
13.7 psi, 1 psi below the national standard. This will be enforceable as of 1 April 2015
and will add approximately $1.5-2.0/b to costs. The impact of these regulations will not
be experienced until 2Q15. Fringe producers with a higher NGL content in their output
OPEC Monthly Oil Market Report – January 2015
47
World Oil Supply
will be particularly impacted and may be forced to shut in output due to the lack of
infrastructure to capture the NGL.
With ample transportation infrastructure and nearby demand centres, Eagle Ford
producers are at an advantage relative to those at the Bakken site. Therefore, the
impact from lower prices may not be as significant as for the producers in the north.
Texas is a main source of much of the production growth experienced in onshore oil.
The Eagle Ford play has three main sections: the oil window in the north (64%), the
‘wet gas’ (NGLs and condensates) window below that (14%), and the dry gas window
in the south (22%). According to the Texas Railroad Commission (RRC), the main
liquid areas are in Wilson, La Salle, DeWitt, Gonzales, McMullen and Dimmit counties.
Indeed, of the 32 counties making up the Eagle Ford, just six account for 89% of its
output. It is expected that Eagle Ford crude (and NGLs) production will average
1.27 mb/d this year, up y-o-y by 0.18 mb/d. Texas RRC data for October placed Texas
county crude and condensate output at 3.2 mb/d, with y-o-y growth rates at 0.62 mb/d.
Within that, Eagle Ford output averaged 1.71 mb/d, higher y-o-y by 0.59 mb/d, with
condensate production making up 0.5 mb/d of the Eagle Ford total, up y-o-y by
0.14 mb/d.
Graph 5.4: US quarterly production
Graph 5.5: US quarterly production,
annual comparison
mb/d
mb/d
15
15
14
14
13
13
12
12
11
11
10
10
9
1Q
1Q12
2Q12
3Q12
4Q12
1Q13
2Q13
3Q13
4Q13
1Q14
2Q14
3Q14
4Q14
1Q15
2Q15
3Q15
4Q15
9
2Q
3Q
4Q
2012
2013
2014
2015
Permian basin total output was 1.69 mb/d, higher y-o-y by 0.43 mb/d, according to
RRC data. Permian shale output increased by 0.2 mb/d this year to 0.37 mb/d,
compared to growth of 50 tb/d in 2013. The Permian accounts for almost one-third of
US drilling activity, with Baker Hughes data showing 527 rigs active in the basin,
compared to 460 a year earlier. In the Midland basin, horizontal activity is focused on
the Wolfcamp and Spraberry layers, which cover eight counties in West Texas. There
is greater potential for drilling efficiencies to be realized in the Midland basin, as only
60% of new wells drilled in the layer are pad wells, compared to just over 80% in the
Eagle Ford. There is also disparity between drilling efficiencies in the Eagle Ford and
Permian basins, with a horizontal rig in the Eagle Ford able to drill a well in 13 days,
versus 25 days in the Permian. This can be attributed to the proliferation of pad drilling
in the Eagle Ford (pad wells have risen from 38% of total wells drilled in 2011 to over
80% today).
New projects that started to come online in 4Q14 (peak production capacity of
0.26 mb/d) should boost GOM output at year end. The Cardamom (50 tboe/d) project
came online in September; mid-November saw the commencement of first oil at
48
OPEC Monthly Oil Market Report – January 2015
World Oil Supply
Chevron and Hess’ Tubular Bells development, which is expected to produce roughly
50 tboe/d by year end. Anadarko’s Lucius project produced first oil in December and
finally, Jack St. Malo also started up in December with a peak capacity of 0.1 mb/d.
Thus, averaged across the year, GOM volumes are unlikely to grow by much more
than 0.1 mb/d, as high decline rates at existing fields offset much of the new additions.
Overall, it is expected that in 1H15, y-o-y growth will accelerate to 0.15 mb/d, supported
by 4Q14 ramp-ups.
One area also likely to be impacted is US Gulf Coast (USGC) NGL output. Some
producers have started shifting rigs away from NGLs/liquids into dry gas production in
regions such as Haynesville in response to lower crude prices. The latter is believed to
offer better returns. NGL prices have fallen by some 35% and Eagle Ford rig counts
have declined by 18 since July.
Graph 5.6: US annual liquids production and annual growth
mb/d
12.86
16
Percentage
13.81
14%
14
12%
12
10%
10
8%
8
6%
6
4%
4
1.63
2
0.95
0
2%
0%
2008
2009
2010
US annual production
2011
2012
Y-o-y growth
2013
2014
2015
(estimate) (forecast)
% change y-o-y growth (RHS)
Source: OPEC Secretariat.
In general, with rig counts declining in major tight crude production regions, producers
are likely to cut back on drilling activity, particularly in the fringe areas, as capex is
being reduced, which will ultimately reduce growth rates, albeit with a time lag.
NGL output across the US is at risk, with some rigs already moving to dry gas plays.
On a quarterly basis in 2014, US oil supply is expected to stand at 12.00 mb/d,
12.83 mb/d, 13.16 mb/d and 13.41 mb/d, respectively.
Canada and Mexico
Oil supply in Canada registered growth of 0.18 mb/d in 2014 to average 4.18 mb/d,
unchanged compared to the previous month. Canadian oil output was revised down by
10 tb/d and 14 tb/d in 2Q14 and 4Q14, respectively, and 3Q14 was revised up by
24 tb/d. Rigs searching for oil in Canada fell by 25 to 190 at the end of the second
week of December, the lowest on a seasonal basis since 2009. Usually 1Q and 4Q
have the highest output in Canada due to the seasonal pattern, but under current price
conditions, it is very difficult to predict how much of the marginal barrels will come on
stream in the next months.
Oil sand extraction in Alberta and Duvernay shale are among the highest break-even
price areas in the world to produce. Approximately one-fourth of oil sand projects are at
risk as prices fall over a sustained period. The wells are more costly to drill than in the
US because of the remote locations and higher labour costs, hence, operational costs
are twice that of the GOM’s breakeven. Heavy Western Canadian Select, among the
OPEC Monthly Oil Market Report – January 2015
49
World Oil Supply
world’s lowest priced crudes, fell below $40/b last December for the first time in five
years.
On a quarterly basis, Canada’s supply in 2014 is estimated to average 4.27 mb/d,
4.11 mb/d, 4.16 mb/d and 4.20 mb/d, respectively.
Graph 5.7: Canada’s annual liquids production and annual growth
mb/d
Percentage
5
8%
4.34
4.18
4
6%
3
4%
2
2%
1
0.18
0.16
0%
0
-1
-2%
2008
2009
2010
Canada annual production
2011
2012
Y-o-y growth
2013
2014
2015
(estimate) (forecast)
% change y-o-y growth (RHS)
Source: OPEC Secretariat.
Mexico’s oil supply reached an average of 2.80 mb/d in 2014, showing a decline of
90 tb/d, unchanged from the previous month’s estimation. Mexican liquids output
declined by 10 tb/d m-o-m, to 2.72 mb/d in November, with y-o-y declines at a steep
0.16 mb/d. Preliminary figures of crude output for December already show output
unchanged at 2.36 mb/d. Crude output was steady m-o-m at its record low of
2.36 mb/d, lower y-o-y by 0.15 mb/d. In 2013, Mexico produced 2.52 mb/d of crude oil,
consisting of 1.37 mb/d of heavy crude, 0.85 mb/d of light crude and 0.31 mb/d of
super light grade. A total of 2.89 mb/d was produced, including 0.36 mb/d of NGLs in
2013. Oil declines were led by heavy crude production, which was lower by 0.13 mb/d
compared to a year earlier, as production from the Cantarell field dropped by 73 tb/d
compared to last November.
Graph 5.8: Mexico’s annual liquids production and annual growth
mb/d
Percentage
3.5
0%
2.80
3.0
2.73
2.5
-1%
-2%
2.0
-3%
1.5
-4%
1.0
-5%
0.5
-6%
0.0
-0.5
2008
2009
2010
Mexico annual production
2011
2012
Y-o-y growth
2013
-0.07
-0.09
2014
2015
(estimate) (forecast)
-7%
% change y-o-y growth (RHS)
Source: OPEC Secretariat.
50
OPEC Monthly Oil Market Report – January 2015
World Oil Supply
On the other hand, light oil output also started decreasing in 4Q14, due to declines at
mature fields such as Ligero Marino, which dropped by 0.11 mb/d. Mexico also hopes
to increase light crude output by opening up the energy sector next year. Contract
terms were released in December for 14 shallow field blocks that are expected to yield
more than 80 tb/d. Nevertheless, crude output is expected to continue falling in 2015.
In November 2014, Ku-Maloob-Zaap, Cantarell, Chu and Ligero Marino were the most
productive fields with average output of 0.86 mb/d, 0.28 mb/d, 0.26 mb/d and
0.12 mb/d, respectively.
On a quarterly basis, Mexico’s supply in 2014 is seen to average 2.87 mb/d, 2.85 mb/d,
2.77 mb/d and 2.73 mb/d, respectively.
OECD Europe
Total OECD Europe oil supply, which declined by 0.20 mb/d to average 3.58 mb/d in
2013, decreased by only 10 tb/d from the previous year to average 3.57 mb/d in 2014,
revised up by 10 tb/d from the previous MOMR. Output from the region is expected to
continue on an upward trend in 1Q15. 4Q14 was revised up by 60 tb/d due to higher
output of Norway, the UK and even Denmark.
OECD Europe is expected to see quarterly supply of 3.75 mb/d, 3.51 mb/d, 3.40 mb/d
and 3.62 mb/d, respectively.
Norway’s oil supply increased by 0.05 mb/d from the previous year to average
1.89 mb/d in 2014, unchanged from the previous MOMR. Preliminary production
figures for November 2014 indicate an average production of about 1.94 mb/d of oil,
NGLs and condensate. November’s output was 20 tb/d less than in October 2014,
however output in 4Q14 was higher than 3Q14 by 80 tb/d, at 1.94 mb/d. Out of this,
1.47 mb/d was oil, 0.35 mb/d was NGLs and 0.12 mb/d was condensate. According to
the monthly report of the Norwegian Petroleum Directorate (NPD), the Fram H-Nord,
Gullfaks Sør, Oseberg Sør, Skarv, Skuld, Ula and Visund fields had reduced production
in November due to technical problems. So far this year, oil production is about 1%
above the NPD’s prognosis and about 2% higher than at the same time in 2013.
On a quarterly basis, Norway’s production is seen to average 1.96 mb/d, 1.79 mb/d,
1.86 mb/d and 1.94 mb/d, respectively.
Graph 5.9: Norway’s annual liquids production and annual growth
mb/d
Percentage
3.0
4%
2%
2.5
1.89
2.0
0%
1.91
-2%
1.5
-4%
1.0
-6%
0.5
0.05
0.0
0.02 -8%
-10%
-0.5
-12%
2008
2009
2010
Norway annual production
2011
2012
Y-o-y growth
2013
2014
2015
(estimate) (forecast)
% change y-o-y growth (RHS)
Source: OPEC Secretariat.
OPEC Monthly Oil Market Report – January 2015
51
World Oil Supply
The UK’s oil supply registered an average of 0.85 mb/d, representing a decline of
20 tb/d in 2014, y-o-y, revised up by 20 tb/d from the previous MOMR. Total UK
production in 2014 consisted of 0.78 mb/d of crude oil and 0.06 mb/d of NGLs.
UK November liquids production eased m-o-m by 70 tb/d to 0.78 mb/d, lower y-o-y by
90 tb/d, despite the completion of field maintenance and steady, albeit slightly lowerthan-usual, output from the Buzzard field at around 0.17 mb/d.
However, outages at smaller fields weighed, e.g. the 25 tb/d Huntington field has been
offline since October, and its restart was delayed until end-December with full
production slated to resume by January 2015. Thus, November Forties loadings fell
back to below 0.4 mb/d as seven cargoes were delayed. This trend continued into
December as the Buzzard field suffered a small outage, severe weather caused
production to be shut-in at platforms (e.g. Buchan Alpha), and loadings were
suspended at the Sullon Voe port during parts of the month.
On a quarterly basis, UK oil output in 2014 is estimated to average 0.97 mb/d,
0.90 mb/d, 0.71 mb/d and 0.84 mb/d, respectively.
Graph 5.10: UK annual liquids production and annual growth
mb/d
Percentage
2.0
0%
1.5
-5%
0.85
1.0
0.83
0.5
-10%
-15%
0.0
-20%
-0.02
-0.02
-0.5
-25%
2008
2009
2010
UK annual production
2011
2012
Y-o-y growth
2013
2014
2015
(estimate) (forecast)
% change y-o-y growth (RHS)
Source: OPEC Secretariat.
OECD Asia Pacific
OECD Asia Pacific’s oil supply is expected to increase by 20 tb/d in 2014 to average
0.50 mb/d, which is unchanged from the previous month. Australia’s oil supply is likely
to increase by 20 tb/d in 2014, while New Zealand’s production is forecast to show an
increase by less than 10 tb/d from a year earlier.
On a quarterly basis, total OECD Asia Pacific oil supply is expected to average
0.50 mb/d, 0.50 mb/d, 0.51 mb/d and 0.51 mb/d, respectively.
Australia’s oil supply increased by 20 tb/d to average 0.42 mb/d in 2014, unchanged
from the last MOMR. The updated production data was not changed in the fourth
quarter. Australia’s oil production outlook for 2015 could follow the same trend as in
2014 on expected healthy oil from new start-up projects. However, the forecast risk in
2015 is on the high side due to the IOC’s budget cuts for investment in the upstream,
as well as issues related to logistics and unplanned shutdowns due to the weather.
On a quarterly basis, Australia’s oil supply is seen to stand at 0.41 mb/d, 0.42 mb/d,
0.42 mb/d and 0.42 mb/d, respectively.
52
OPEC Monthly Oil Market Report – January 2015
World Oil Supply
Developing countries
Total developing countries’ (DCs’) oil output reached 12.30 mb/d in 2014, indicating
an increase of 0.17 mb/d, revised up by 40 tb/d from the last MOMR. Growth in 2014 is
expected after a significant decline in 2013, due mainly to political, technical and
weather-related factors. According to preliminary data, supply averaged 12.46 mb/d in
4Q14, up by 0.19 mb/d from the same period a year earlier.
On a quarterly basis, total oil supply in DCs is estimated to average 12.21 mb/d,
12.20 mb/d, 12.34 mb/d and 12.46 mb/d, respectively.
Total DCs’ oil supply is projected to grow by 0.17 mb/d to average 12.47 mb/d in 2015,
representing an upward revision of 40 tb/d from the previous month. This growth is
supported mainly by Latin America, Other Asia and the Middle East, while Africa’s
supply is seen to drop during the year.
On a quarterly basis, total oil supply in the DCs in 2015 is projected to average
12.65 mb/d, 12.50 mb/d, 12.44 mb/d and 12.30 mb/d, respectively.
Graph 5.11: Developing Countries’
quarterly production
Graph 5.12: Developing Countries’
quarterly production, annual comparison
mb/d
mb/d
12.7
12.7
12.6
12.6
12.5
12.5
12.4
12.4
12.3
12.3
12.2
12.2
12.1
12.1
12.0
12.0
11.9
11.8
11.9
1Q
1Q12
2Q12
3Q12
4Q12
1Q13
2Q13
3Q13
4Q13
1Q14
2Q14
3Q14
4Q14
1Q15
2Q15
3Q15
4Q15
11.8
2Q
2012
2014
3Q
4Q
2013
2015
Other Asia
Other Asia’s oil production is estimated to decrease by 70 tb/d in 2014 to average
3.52 mb/d, representing a downward revision in growth by 20 tb/d from the previous
MOMR. Other Asia’s supply was revised up during 4Q14 by 50 tb/d, and this was partly
carried over to 2015.
On a quarterly basis, Other Asia’s supply in 2014 is forecast to average 3.55 mb/d,
3.52 mb/d, 3.47 mb/d and 3.54 mb/d, respectively.
India’s oil supply is estimated to be stagnant in 2014 with an average of 0.87 mb/d,
revised up by 10 tb/d from the previous month. 4Q14 was revised up by 10 tb/d to
average 0.87 mb/d.
Thailand’s production is also expected to be flat at 0.36 mb/d in 2014, unchanged from
the previous MOMR. 4Q14 remained unchanged.
OPEC Monthly Oil Market Report – January 2015
53
World Oil Supply
Indonesia’s oil production is expected to decrease by 40 tb/d in 2014 to average
0.91 mb/d, flat from the previous MOMR. 4Q14 remained unchanged.
Malaysia’s supply is projected to experience an increase in 2014 of 10 tb/d to average
0.68 mb/d, constituting an upward revision of 10 tb/d from the last MOMR. Due to
strong production in 4Q14, supply was revised up by 20 tb/d to an average of
0.69 mb/d.
Oil production in Vietnam declined by 20 tb/d to average 0.36 mb/d in 2014, revised up
by 10 tb/d from the last MOMR. And finally Brunei’s oil supply is estimated to decline
by 10 tb/d to average 0.12 mb/d in 2014.
Latin America
Latin America’s oil supply is estimated to grow by 0.25 mb/d to average 5.03 mb/d in
2014, revised up by 20 tb/d from the last MOMR. In 2015, supply is forecast to grow by
0.14 mb/d to average 5.17 mb/d, representing an upward revision of 20 tb/d.
Latin America is the third-highest driver of growth among all the non-OPEC regions.
It is expected that Brazil and Latin America Others will contribute to growth in 2014,
while output from Argentina and Colombia is likely to experience a decline of 10 tb/d
and 20 tb/d in 2014 to average 0.66 mb/d and 1.01 mb/d, respectively.
On a quarterly basis, Latin America’s supply in 2014 is expected to stand at 4.87 mb/d,
4.93 mb/d, 5.11 mb/d and 5.20 mb/d, respectively.
Brazil’s supply is estimated to average 2.90 mb/d in 2014, indicating an increase of
0.26 mb/d over the previous year, with an upward revision of 10 tb/d from the previous
MOMR, mainly due to an upward adjustment on production data from 4Q14. Oil output
exclusively from Petrobras’ fields in Brazil increased to average 2.46 mb/d in
November, 30 tb/d down from the record 2.49 mb/d October output. Nevertheless,
liquids output, excluding biofuels, was up by 10.3% within 11 months compared to the
same period of a year earlier. According to Petrobras’ announcement, maintenance
stoppages and temporary shutdowns at seven platforms affected production in
November. Nevertheless, pre-salt production reached another record high of 0.67 mb/d
on 28 November, following the start-up of six offshore wells and the 0.15 mb/d FPSO
Ilhabela, which will reach peak output in 2H15. The mature Campos basin saw output
rise y-o-y by 0.13 mb/d due to a programme designed to offset declines.
Graph 5.13: Brazil’s annual liquids production and annual growth
mb/d
Percentage
3.5
3.06
2.90
10%
3.0
8%
2.5
6%
2.0
1.5
4%
1.0
0.26
0.5
2%
0.15
0%
0.0
-0.5
-2%
2008
2009
2010
Brasil annual production
2011
2012
Y-o-y growth
2013
2014
2015
(estimate) (forecast)
% change y-o-y growth (RHS)
Source: OPEC Secretariat.
54
OPEC Monthly Oil Market Report – January 2015
World Oil Supply
On a quarterly basis, Brazil’s supply in 2014 is expected to stand at 2.73 mb/d,
2.84 mb/d, 2.98 mb/d and 3.06 mb/d, respectively.
Middle East
Middle East oil supply is estimated to decrease by 0.02 mb/d in 2014 from the
previous year to average 1.34 mb/d, unchanged from the previous MOMR.
Oman, non-OPEC’s biggest producer in the region, is estimated to continue its
production at a level of 0.94 mb/d in 2014, the same level as in 2013.
Syria’s output is expected to drop by 30 tb/d in 2014 to average 30 tb/d. This
downward movement is due to the country’s current political situation, which is
associated with a high level of risk. Thus, Syrian oil production is expected to drop by
50 tb/d in 2014.
Yemen’s production is also expected at 0.14 mb/d in 2014, unchanged from a year
earlier.
Oil production in Bahrain is expected to increase in 2014 by 10 tb/d to average
0.23 mb/d, representing an upward revision of 10 tb/d.
The Middle East supply forecast is associated with a very high level of risk, mainly due
to political factors, which could dramatically change the outlook in either direction.
On a quarterly basis, Middle East supply in 2014 is seen to average 1.34 mb/d,
1.34 mb/d, 1.36 mb/d and 1.33 mb/d, respectively.
Africa
Africa’s oil supply is projected to average 2.41 mb/d in 2014, a small increase of
10 tb/d from the previous year, in spite of a positive revision of 10 tb/d in 4Q14,
unchanged from the previous MOMR. Oil production in the Sudans and Equatorial
Guinea is expected to increase, while oil output of other African countries will remain
steady or see a minor decline in 2014. Oil supply in 2015 is expected to average
2.41 mb/d, remaining steady from 2014, revised up by 20 tb/d from the previous
MOMR.
On a quarterly basis, Africa’s oil supply in 2014 is expected to average 2.44 mb/d,
2.41 mb/d, 2.40 mb/d and 2.39 mb/d, respectively.
FSU, other regions
Total FSU oil supply is estimated to increase by 30 tb/d in 2014 to average 13.44 mb/d,
with an upward revision of 20 tb/d in growth from the previous month. This revision was
due mainly to updated production figures from 4Q14. The production data of Russia,
Kazakhstan and FSU others encountered upward revisions in 4Q14 that partly carried
over to 2015. A downward revision of 13 tb/d was also made to Azerbaijan’s 4Q14
production data.
On a quarterly basis, total supply from the FSU in 2014 is seen to average 13.48 mb/d,
13.36 mb/d, 13.39 mb/d and 13.53 mb/d, respectively.
OPEC Monthly Oil Market Report – January 2015
55
World Oil Supply
FSU’s oil production, with the exception of FSU others, is forecast to decline in 2015, to
average 13.41 mb/d.
On a quarterly basis, FSU total oil output in 2015 is anticipated to average 13.52 mb/d,
13.41 mb/d, 13.35 mb/d and 13.36 mb/d, respectively.
Russia
Despite financial sanctions and the impact of the falling global oil price, Russia’s
preliminary data on oil supply indicates a record high of 10.67 mb/d led by PSA
operators, mainly by small companies, increasing by 40 tb/d in December. Rosneft’s
output declined m-o-m by 10 tb/d, while the other Russian majors’ output remains
stagnant in December.
Russia’s liquids production is estimated to increase by 0.07 mb/d in 2014 to average
10.58 mb/d, representing an upward revision of 20 tb/d from the previous MOMR.
Graph 5.14: Russia’s annual liquids production and annual growth
mb/d
Percentage
12
10.58
10.57
3.0%
10
2.5%
8
2.0%
6
1.5%
4
1.0%
2
0.5%
0.07
0
0.0%
-0.01
-2
2008
2009
2010
Russia annual production
2011
2012
Y-o-y growth
2013
-0.5%
2014
2015
(estimate) (forecast)
% change y-o-y growth (RHS)
Source: OPEC Secretariat.
In 2014, output from new fields was struggling to compensate for declining production at
mature fields, particularly in the Western Siberian region. Keeping oil output high has
been a priority for the government, although Russian companies have been faced with
IOC cooperation stoppages. The Vankor project, which was mainly responsible for the
growth achieved in previous years, did not reach its peak of 0.5 mb/d in 2014, but is
expected to reach an average of 0.46 mb/d in 2016. Eastern Siberian fields have been a
key source of incremental growth in output. 2015 output could decline y-o-y by over
0.1 mb/d, given the impact of sanctions, low prices and no large projects expected to
come online, making declines from Western Siberian assets more apparent. Russian
crude exports fell to a record low of 3.35 mb/d, lower m-o-m and y-o-y by 0.6 mb/d, due
to the export duty being cut from 59% in 2014 to 42% in 2015. Bad weather at Russian
ports exacerbated this decline.
On a quarterly basis, Russia’s 2014 supply is estimated to average 10.59 mb/d,
10.55 mb/d, 10.52 mb/d and 10.65, mb/d, respectively.
56
OPEC Monthly Oil Market Report – January 2015
World Oil Supply
Graph 5.15: Russia’s quarterly production
Graph 5.16: Russia’s quarterly production,
annual comparison
mb/d
mb/d
10.7
10.7
10.6
10.6
10.5
10.5
10.4
10.4
10.3
10.3
10.2
1Q
1Q12
2Q12
3Q12
4Q12
1Q13
2Q13
3Q13
4Q13
1Q14
2Q14
3Q14
4Q14
1Q15
2Q15
3Q15
4Q15
10.2
2Q
2012
2014
3Q
4Q
2013
2015
Caspian
Kazakhstan’s oil supply decreased by 20 tb/d over the previous year to average
1.62 mb/d in 2014, revised down by 10 tb/d from the previous MOMR, despite an
upward revision of 10 tb/d in 4Q14. Kazakhstan’s output increased m-o-m by 0.14 mb/d
to 1.72 mb/d in November due to the end of maintenance in September and October.
Oil production from the Tengiz complex rebounded to a three-month high.
On a quarterly basis in 2014, output will average 1.65 mb/d, 1.57 mb/d, 1.61 mb/d and
1.64 mb/d, respectively.
Azerbaijan’s oil supply is estimated to decrease by 10 tb/d over the previous year to
average 0.85 mb/d in 2014, unchanged from the previous MOMR. Output in November
was lower m-o-m by 20 tb/d at 0.83 mb/d, hence the 4Q14 was revised down by
13 tb/d to average 0.84 mb/d.
On a quarterly basis in 2014, Azerbaijan’s oil output is estimated to average 0.85 mb/d,
0.87 mb/d, 0.86 and 0.84 mb/d, respectively.
Oil supply in FSU Others, mainly in Turkmenistan, was revised up by 8 tb/d and 11 tb/d
in 3Q and 4Q14, respectively. The total output in 2014 is expected to be unchanged
from last year at 0.39 mb/d.
Other Europe’s oil supply is estimated to remain flat from 2012 to average 0.14 mb/d
and continue at this level in 2014.
China
China’s supply is estimated to grow by 10 tb/d over the previous year to average
4.25 mb/d in 2014, unchanged from the previous month. Chinese crude oil output
reached a record high of 4.37 mb/d, rising for the fourth straight month and higher y-o-y
by 90 tb/d, the strongest growth since June 2013. A revision in 4Q was introduced to
adjust for updated production. Following declines at the Daqing and Changqing fields in
October, production stabilized in November, while CNOOC’s Wenchang 13-6 field
ramped up, having started up in August. The offshore Enping 24-2 FPSO also started
OPEC Monthly Oil Market Report – January 2015
57
World Oil Supply
up in late October at an initial rate of 8 tb/d and will reach peak production of 40 tb/d in
2017. The Panyu 34-1/35-1/35-2 gas fields started up in early December and may
boost some condensate volumes at the margin. 4Q14 output, which was at its highest
level in 2014 at 4.29 mb/d, decreased by 10 tb/d compared to 4Q13. Nonetheless,
across 2014, Chinese oil production is likely to be flat y-o-y, despite the start-up of
three major oil fields — offshore Kenli 3-2 and Panyu 10-2/5/8 as well as the
Wencheng 13-6 projects in the South China Sea — as underlying decline rates remain
high. In 2015, however, production is expected to rise as the new projects from 2014
continue to ramp up.
On a quarterly basis, China’s supply in 2014 is seen to average 4.24 mb/d, 4.27 mb/d,
4.20 mb/d and 4.29 mb/d, respectively.
Graph 5.17: China’s annual liquids production and annual growth
mb/d
Percentage
5.0
4.5
4.0
3.5
3.0
2.5
2.0
1.5
1.0
0.5
0.0
-0.5
4.31
4.25
0.01
2008
2009
2010
China annual production
2011
2012
Y-o-y growth
2013
2014
(estimate)
0.07
8%
7%
6%
5%
4%
3%
2%
1%
0%
-1%
2015
(forecast)
% change y-o-y growth (RHS)
Source: OPEC Secretariat.
Forecast for 2015
Non-OPEC supply
Non-OPEC oil supply is forecast to grow by 1.28 mb/d in 2015 to average 57.49 mb/d,
indicating a downward revision of 80 tb/d from the previous report. There were various
upward and downward revisions applied to nearly all quarters of 2014 oil supply
estimations for non-OPEC producers, which were partially carried over to 2015.
Non-OPEC supply growth in 2015 is expected to experience increases in all the
quarters of 2015 on a y-o-y basis, but at a slower pace. The main factors for the lower
growth prediction in 2015 are lower oil price expectations, the declining number of
active rigs in North America, the decrease in drilling permits in the US and the
reduction in IOCs’ 2015 spending plans.
Another indication of uncertainty in the production growth outlook in the coming months
would be the number of active rigs around the world, particularly in those regions in
which the oil production breakeven point is much higher than the current oil prices from
unconventional sources. According to the latest report of Baker Hughes, the US drilling
rig count plunged by 61 units — almost entirely land-based oil rigs — to settle at
1,750 rigs working during the week ended 9 January. The average US rig count for
December was 1,882, down 43 from November but up 111 from December 2013.
Horizontal drilling rigs decreased by 35 units to 1,301. Directional drilling rigs dropped
14 units to 161.
58
OPEC Monthly Oil Market Report – January 2015
World Oil Supply
Canada, coming off a 48-unit loss last week, more than rebounded with a 158-unit
spike to 366. Oil rigs represented the bulk of that gain, rocketing 129 units to 181.
Gas rigs were up 29 units to 185. Canada still has 111 fewer rigs compared with this
week a year ago.
On a regional basis, OECD Americas is expected to have the highest growth by
1.04 mb/d, followed by Latin America, China, Other Asia, OECD Asia Pacific and the
Middle East, while FSU is seen to decline. By country, growth is expected to come
mainly from the US, Canada, Brazil and China, while oil supply from Mexico, the UK,
Indonesia, Egypt and FSU is seen to decline. The risk and uncertainties associated
with the supply forecast due to the oil price fall remain high, especially for the US,
Canada, Russia, Norway and the UK.
On a quarterly basis, non-OPEC supply in 2015 is expected to average 57.69 mb/d,
57.37 mb/d, 57.30 mb/d and 57.61 mb/d, respectively.
Table 5.2: Non-OPEC oil supply in 2015, mb/d
Americas
of which US
Europe
Asia Pacific
Total OECD
2014
19.85
12.86
3.57
0.50
23.93
1Q15
20.69
13.61
3.68
0.53
24.90
2Q15
20.80
13.81
3.53
0.54
24.87
3Q15
20.94
13.88
3.42
0.53
24.89
4Q15
21.14
13.92
3.64
0.50
25.28
2015
20.89
13.81
3.57
0.53
24.99
Change
15/14
1.04
0.95
0.00
0.02
1.06
Other Asia
Latin America
Middle East
Africa
Total DCs
3.52
5.03
1.34
2.41
12.30
3.60
5.22
1.37
2.46
12.65
3.56
5.16
1.36
2.42
12.50
3.52
5.19
1.34
2.40
12.44
3.47
5.12
1.33
2.37
12.30
3.54
5.17
1.35
2.41
12.47
0.02
0.14
0.01
0.00
0.17
FSU
of which Russia
Other Europe
China
Total "Other regions"
Total Non-OPEC production
Processing gains
13.44
10.58
0.14
4.25
17.83
54.05
2.16
13.52
10.62
0.14
4.30
17.96
55.52
2.17
13.41
10.58
0.14
4.28
17.83
55.20
2.17
13.35
10.54
0.14
4.30
17.79
55.13
2.17
13.36
10.52
0.14
4.36
17.86
55.44
2.17
13.41
10.57
0.14
4.31
17.86
55.32
2.17
-0.03
-0.01
0.00
0.07
0.03
1.27
0.01
Total Non-OPEC supply
Previous estimate
Revision
56.22
55.95
0.27
57.69
57.10
0.59
57.37
57.05
0.32
57.30
57.33
-0.03
57.61
57.75
-0.14
57.49
57.31
0.19
1.28
1.36
-0.08
Revisions to the 2015 forecast
In addition to historical revisions, there were a few offsetting adjustments to the 2015
non-OPEC supply forecast. The US total oil supply forecast in 2015 was revised down
by 100 tb/d, Canada revised down by 60 tb/d, and Norway, the UK, Sudans, Egypt,
Oman and Trinidad & Tobago each down by 10 tb/d, compared to the last MOMR.
However, due to the change in the baseline, total supply growth indicated a decline.
Nevertheless, growth is expected for some countries in 2015, due to already planned
projects, particularly offshore as well as strategic projects, which have been
implemented since 1H14 and will continue to be implemented.
US oil production is anticipated to average 13.81 mb/d in 2015, indicating slower
growth, by 0.95 mb/d, y-o-y. It has been revised down by 100 tb/d compared to last
month’s prediction as the steep drop in global oil prices could endanger the marginal
OPEC Monthly Oil Market Report – January 2015
59
World Oil Supply
barrel’s output from unconventional sources (i.e. tight crude and unconventional
NGLs), as well as the oil extracted from “stripper wells”. Moreover, the Bakken
production in North Dakota is subject to follow the new rail transportation safety
standards for crude oil that stipulate operating standards for oil-conditioning equipment
at the well to separate fluids into gas and liquids. These regulations will go into effect
as of 1 April, potentially slowing production and increasing costs.
Tight crude producers are aware that the typical oil wells in shale plays decline 60%
annually, and this loss will be recouped only by drilling new wells. As drilling subsides
due to high costs and a potentially sustained low oil price, production could be
expected to follow, possibly late in 2015.
On a quarterly basis, US liquids supply in 2015 is expected to average 13.61 mb/d,
13.81 mb/d, 13.88 mb/d and 13.92 mb/d, respectively.
Canada’s oil output is forecast to average 4.34 mb/d in 2015, an increase of 0.16 mb/d
over the previous year, but with a downward revision of 60 tb/d compared with the
previous MOMR. This revision comes on the back of weak production figures late in
4Q14, which were carried over to 2015. Despite the downward revision that had an
impact on 2014 supply estimates, Canada’s oil production outlook in 2015 remains
steady on expected conventional oil, but the output from unconventional sources could
be affected gradually by sustained low oil prices.
On a quarterly basis, Canada’s oil supply in 2015 is expected to average 4.34 mb/d,
4.26 mb/d, 4.30 mb/d and 4.47 mb/d, respectively.
Oil production in FSU, particularly in Russia, could decline in 2015 given the impact of
sanctions, low prices and no large projects expected to come online, making declines
from Western Siberian assets more apparent. Nevertheless, as seen in December,
Russian oil output increased by 30 tb/d, m-o-m, led by PSA operators, despite a drop
of 90 tb/d in Rosneft output. Therefore, the production outlook for the coming months is
uncertain.
Preliminary predictions indicate that Russian oil output in 2015 on a quarterly basis
would be at 10.62 mb/d, 10.58 mb/d, 10.54 mb/d and 10.52 mb/d, respectively.
The FSU total output in 2015 on a quarterly basis is forecast at 13.52 mb/d,
13.41 mb/d, 13.35 mb/d and 13.36 mb/d, respectively.
Since many fields in the North Sea region are old and reaching the end of their lives,
from an engineering point of view, the decision to cease production is often irreversible,
and also lengthy and costly. Accordingly, it is possible for some platforms to share their
cost burden with other linked fields. Norway’s oil output in 2014 could grow compared
to a year earlier with the help of higher investment, and the UK could slow down the
annual decline rate in 2014.
No growth is forecast for OECD Europe in 2015 compared to 2014 and on a quarterly
basis, output is forecast at 3.68 mb/d, 3.53 mb/d, 3.42 mb/d and 3.64 mb/d,
respectively.
In Brazil, despite the fall in oil prices, Petrobras reported record output of 2.47 mb/d in
December, with pre-salt output reaching another record high of 0.7 mb/d. However,
future projects could be at risk. The company is expected to cut Capex this year, which
could temper growth from 2H15.
60
OPEC Monthly Oil Market Report – January 2015
World Oil Supply
OPEC NGLs and non-conventional oils
OPEC natural gas liquids (NGLs) and non-conventional oils were estimated to average
5.83 mb/d in 2014, representing growth of 0.18 mb/d over the previous year. In 2015,
OPEC NGLs and non-conventional oil are projected to average 6.03 mb/d, an increase
of 0.20 mb/d over the previous year. There are no changes in the 2014 estimation and
2015 predictions for OPEC NGLs and non-conventional production compared with the
last MOMR.
Table 5.3: OPEC NGLs + non-conventional oils, 2012-2015
Total OPEC
2012 2013
5.57 5.65
Change
13/12
0.08
1Q14
5.73
2Q14
5.79
3Q14
5.86
4Q14 2014
5.93 5.83
Change
Change
15/14
14/13 2015
0.18 6.03
0.20
OPEC crude oil production
According to secondary sources, total OPEC crude oil production averaged 30.20 mb/d
in December, an increase of 142 tb/d over the previous month. Crude oil output
increased mostly from Iraq, while production showed the largest drop in Libya.
According to secondary sources, OPEC crude oil production, not including Iraq, stood
at 26.59 mb/d in December, down by 0.14 mb/d over the previous month.
Table 5.4: OPEC crude oil production based on secondary sources, tb/d
Algeria
Angola
Ecuador
Iran, I.R.
Iraq
Kuwait
Libya
Nigeria
Qatar
Saudi Arabia
UAE
Venezuela
Total OPEC
OPEC excl. Iraq
2013
1,159
1,738
516
2,673
3,037
2,822
928
1,912
732
9,586
2,741
2,356
2014
1,151
1,653
542
2,764
3,262
2,775
474
1,911
724
9,684
2,757
2,333
2Q14
1,158
1,646
541
2,768
3,266
2,786
222
1,895
729
9,675
2,749
2,337
3Q14
1,167
1,690
543
2,758
3,150
2,794
614
1,949
733
9,747
2,791
2,329
4Q14 Oct 14 Nov 14 Dec 14
1,152 1,157 1,158 1,143
1,675 1,722 1,656 1,647
546
539
543
556
2,757 2,750 2,755 2,765
3,415 3,295 3,331 3,616
2,724 2,758 2,699 2,714
683
887
673
489
1,901 1,881 1,919 1,902
700
714
698
688
9,611 9,650 9,584 9,599
2,742 2,741 2,722 2,762
2,325 2,329 2,323 2,324
Dec/Nov
-15.4
-9.3
13.0
9.5
285.1
14.6
-184.1
-17.3
-9.9
14.5
40.0
1.8
30,198 30,029 29,772 30,264 30,231 30,423 30,062 30,204
27,161 26,767 26,506 27,114 26,817 27,127 26,731 26,589
142.4
-142.7
Totals may not add up due to independent rounding.
OPEC Monthly Oil Market Report – January 2015
61
World Oil Supply
Table 5.5: OPEC crude oil production based on direct communication, tb/d
2013
1,203
1,701
526
3,576
2,980
2,922
993
1,754
724
9,637
2,797
2,786
Algeria
Angola
Ecuador
Iran, I.R.
Iraq
Kuwait
Libya
Nigeria
Qatar
Saudi Arabia
UAE
Venezuela
Total OPEC
OPEC excl. Iraq
2014
1,192
1,652
557
3,121
3,110
2,867
480
1,803
709
9,713
2,794
..
31,599
28,619
2Q14
1,190
1,616
557
3,194
3,118
2,885
228
1,821
710
9,715
2,770
2,826
3Q14
1,196
1,709
557
3,003
3,076
2,876
571
1,724
720
9,769
2,881
..
.. 30,630
.. 27,512
..
..
4Q14 Oct 14 Nov 14 Dec 14
1,179 1,175 1,190 1,173
1,726 1,751 1,691 1,735
560
557
563
561
3,020 3,010 3,000 3,050
3,141 3,054 3,009 3,356
2,807 2,831 2,790 2,800
735
920
761
525
1,800 1,822 1,733 1,842
682
680
681
684
9,644 9,690 9,610 9,630
2,790 2,691 2,763 2,917
..
..
..
..
..
..
..
..
..
..
Dec/Nov
-17.0
44.0
-1.7
50.0
347.0
10.0
-235.7
109.1
2.7
20.1
153.9
..
..
..
..
..
Totals may not add up due to independent rounding.
.. Not availab le.
World oil supply
Preliminary data indicates that global oil supply increased by 0.02 mb/d to average
93.16 mb/d in December 2014 compared with the previous month. The growth of
OPEC production in December increased global oil output, which was partially offset by
a decrease in non-OPEC supply. The share of OPEC crude oil in total global
production increased slightly to 32.4% in December, compared with the previous
month. Estimates are based on preliminary data for non-OPEC supply as well as
OPEC NGLs and non-conventional from direct communications, while estimates for
OPEC crude production come from secondary sources.
Graph 5.18: OPEC and world oil supply
mb/d
31
mb/d
94
OPEC crude production (LHS)
62
Dec 14
Nov 14
Oct 14
Sep 14
Aug 14
Jul 14
Jun 14
May 14
Apr 14
Mar 14
Feb 14
Jan 14
Dec 13
Oct 13
Nov 13
89
Sep 13
26
Aug 13
90
Jul 13
27
Jun 13
91
May 13
28
Apr 13
92
Mar 13
29
Feb 13
93
Jan 13
30
World supply (RHS)
OPEC Monthly Oil Market Report – January 2015
Product Markets and Refinery Operations
Product Markets and Refinery Operations
Product markets softened in the Atlantic Basin during December as margins were
affected by the drop in the gasoline and middle distillates cracks amid an oversupply of
gasoline in the region.
The supply side was fuelling bearish sentiment due to higher refinery runs in the
region, amid inventories in the US exhibiting a sharp increase to reach the highest
levels seen during the last years. In addition, the bearish sentiment was boosted by
expectations of lower exports to Latin America with rising refinery runs and new
capacity coming on line in Brazil.
Meanwhile, the Asian market slightly weakened during December as increasing
supplies outweighed firm regional demand, causing gasoline and middle distillate crack
spreads to drop. However, the small recovery seen in fuel oil and naphtha prevented
refinery margins from falling further.
Graph 6.1: Refinery margins, 2013-2014
US$/b
US$/b
WTI (US Gulf)
Dubai (Singapore)
Arab Heavy (US Gulf)
LLS (US Gulf)
Dec 14
Nov 14
-5
Oct 14
-5
Sep 14
0
Aug 14
0
Jul 14
5
Jun 14
5
May 14
10
Apr 14
10
Mar 14
15
Feb 14
15
Jan 14
20
Dec 13
20
Brent (Rotterdam)
US product markets continued weakening during December, and margins suffered a
sharp drop due to higher losses seen in the gasoline crack spreads as the pressure
coming from the supply side outweighed the stronger performance of domestic
gasoline demand. US refinery runs continued rising and inventories showed a sharp
increase during the month to reach the highest levels seen in the last years. The
refinery margin for WTI crude in the USGC showed a sharp loss of more than $5 to
average less than $1/b in December. Meanwhile, the margin for Light Louisiana Sweet
(LLS) crude in the USGC averaged $4/b during December, exhibiting a sharp drop of
around $5.
European refining margins lost ground during December due to weak domestic
demand amid a lack of export opportunities, as ample supplies in the Atlantic Basin
pressured European gasoline crack spreads amid increasing inventories and lack of
support from the winter season. The refinery margin for Brent crude in Northwest
Europe lost more than $2 to average around $3/b in December.
Asian refining margins dropped slightly during December on the back of losses seen in
the gasoline and middle distillates cracks as the strong seasonal demand within the
region was partially outweighed by increasing supplies from several countries in the
region.
OPEC Monthly Oil Market Report – January 2015
63
Product Markets and Refinery Operations
Refinery margins in Singapore showed a slightly loss of almost 50¢ from the previous
month to average around $4.5/b in December.
Refinery operations
Refinery utilization rates in the US continued their upward trend and despite several
outages, refinery utilization averaged 92.1% during December, an increase of about
3 percentage points (pp) from a month earlier, the highest level seen during the last ten
years (y-o-y basis ). However, increasing throughputs caused a sharp rise in gasoline
inventories.
Graph 6.2: Refinery utilisation rates, 2013-2014
50
US
EU-16
Japan
Dec 14
50
Nov 14
60
Oct 14
60
Sep 14
70
Aug 14
70
Jul 14
80
Jun 14
80
May 14
90
Apr 14
90
Mar 14
100
Feb 14
100
Jan 14
%
Dec 13
%
Singapore
European refinery runs averaged around 80% of refining capacity in November,
corresponding to a throughput of 10.2 mb/d, some 150 tb/d higher than the previous
month, taking advantage of the healthy margins seen since July, following the return of
several refineries from autumn maintenance. However, the refinery sector in Europe
continues under pressure due to weaker domestic demand, along with increased
competition, mainly in the middle distillates market.
Chinese refinery levels averaged around 10.2 mb/d in November, around 100 tb/d
higher than the previous month, to meet the increasing seasonal demand in the region,
amid strong diesel demand, driven by infrastructure projects under development by the
government. Refinery runs in Singapore for November averaged around 88%, while
Japanese throughputs averaged 92% of capacity in December, 4 pp higher than a
month earlier. This increase in Japanese refinery utilization has led to higher distillates
exports in the last months .
US market
US gasoline demand stood at around 9.2 mb/d in December, about 50 tb/d lower than
the previous month and 500 tb/d higher than the same month a year earlier.
The gasoline crack continued weakening in December, due to pressure coming from
the supply side, despite strong domestic demand and higher requirements from Latin
America. Nationwide, inventories continued to increase sharply to jump more than
25 mb during December, reaching a level not seen in more than three years due to
rising refinery runs and increasing import volumes.
64
OPEC Monthly Oil Market Report – January 2015
Product Markets and Refinery Operations
Some export opportunities were seen heading to Asia due to wide open US West
Coast (USWC)/ Singapore arbitrage spreads, and Mexican imports from the West
Coast have been on the rise as Pemex is locking in volumes prior to turnaround at the
Selina Cruz plant in January. However, export opportunities were outweighed by
elevated crude runs.
US gasoline cracks suffered a sharp drop, pressured by the bearish environment also
fuelled by expectations of lower seasonal demand amid lower exports to Latin America
in the coming weeks, with the end of the holiday season. The gasoline crack spread
saw a sharp loss of $7 to average $11/b in December.
Graph 6.3: US Gulf crack spread vs. WTI, 2013-2015
US$/b
US$/b
40
40
30
30
20
20
10
10
0
0
Prem.Gasoline Unl.93
Jet/Kero
Gasoil/Diesel (0.05%S)
Jan 15
Dec 14
Nov 14
Oct 14
Sep 14
Aug 14
Jul 14
Jun 14
May 14
Apr 14
Mar 14
Feb 14
Jan 14
-10
Dec 13
-10
Fuel oil (180c)
Middle distillate demand stood at around 3.8 mb/d in December, around 40 tb/d lower
than the previous month and 60 tb/d lower than the same month a year earlier.
The middle distillate market weakened in the US during December due to low domestic
demand amid pressure coming from the supply side, with inventories exhibiting a sharp
jump of more than 20 mb during December, on the back of higher output from
refineries with greater yields and higher runs.
Another factor contributing to increasing inventories was the rising volume of imports to
the US East Coast (USEC) to compensate lower inflows from the US Gulf Coast
(USGC) due to limitations in pipeline capacity from the USGC to PADD 1.
Despite some spot cold snaps, a mild winter has not yet granted much support to
heating oil demand. Additionally, little support is expected from exports to Latin
America, with increasing refinery runs, amid new capacity coming online in Brazil.
The USGC gasoil crack lost $4 versus the previous month, to average around $13/b in
December.
At the bottom of the barrel, the fuel oil crack gained some ground on the back of a
tightening environment as US stocks declined by some 5 million barrels amid strong
VGO demand from Canada and South America.
The fuel oil crack in the USGC gained 50¢ during December.
OPEC Monthly Oil Market Report – January 2015
65
Product Markets and Refinery Operations
European market
Product markets in Europe lost the recovery seen the previous month due to weak
domestic demand amid a lack of export opportunities, causing pressure on inventories
and thus impacting gasoline and middle distillate crack spreads.
The gasoline market weakened in Europe as ample supplies in the Atlantic Basin
pressured European gasoline margins amid increasing inventories not only in the US,
but increasing gasoline output in Europe as well, causing a sharp rise in AmsterdamRotterdam-Antwerp (ARA) hub inventories during December.
In addition, export opportunities for steady volumes to Latin America and the Middle
East were somehow limited during December, while low domestic demand continued
pressuring margins.
The gasoline crack spread against Brent lost around $6 to average $11/b in December.
The light distillate naphtha crack continued to be weak as domestic petrochemical
demand remained thin amid strong economic competition from lower LPG prices.
Graph 6.4: Rotterdam crack spreads vs. Brent, 2013-2015
US$/b
US$/b
30
30
20
20
10
10
0
0
Prem.Gasoline Unl.98 ppm
Jet/Kero
Gasoil 10 ppm
Jan 15
Dec 14
Nov 14
Oct 14
Sep 14
Aug 14
Jul 14
Jun 14
May 14
Apr 14
Mar 14
-20
Feb 14
-20
Jan 14
-10
Dec 13
-10
Fuel oil (1.0%S)
Middle distillate cracks lost the ground gained the previous month due to weak
domestic demand amid increasing supplies.
So far the winter season has not encouraged gasoil demand in European countries as
much of Europe is experiencing mild temperatures. In addition, supply continued to
rise, with refineries running above 80% amid increasing inflows to the region, causing
ARA hub inventories to increase, thus exerting pressure on the market.
Another bearish factor has been the expectation of increasing Russian ULSD exports
to Europe after a planned reduction in the export duty, which will take place in January,
amid adaptation of Russian pipeline infrastructure to maximize ULSD exports.
The gasoil crack spread against Brent crude at Rotterdam lost $2.5/b versus the
previous month, to average around $15/b in December.
At the bottom of the barrel, fuel oil cracks remained broadly unchanged over the
previous month and the market remained weak as high freight rates limited arbitrage to
66
OPEC Monthly Oil Market Report – January 2015
Product Markets and Refinery Operations
Asia amid expectations of the impact of ECA specifications on demand and the
expected reduction in the LSFO premium to HSFO.
The Northwest European fuel oil crack kept the previous month’s level of around minus
$13/b in December.
Asian market
The Asian market slightly weakened during December as increasing supplies
outweighed firm regional demand, causing gasoline and middle distillate crack spreads
to drop. However, the small recovery seen in fuel oil and naphtha prevented refinery
margins from falling further.
The Singapore gasoline crack lost some ground in December due to pressure from the
supply side, with elevated export levels seen from Japan, China and South Korea,
which outweighed strong regional demand and caused inventories in Singapore to rise,
keeping the market pressured.
News about the unplanned shut down of some conversion units at Mailiao refinery due
to technical difficulties lent limited support as it was offset by expectations of potential
Chinese demand deceleration in the coming weeks with an upcoming rise in
consumption taxes; China is joining other Asia Pacific countries in taking advantage of
falling global oil prices to implement policy changes. Under the new arrangement,
gasoline taxes will rise from 1 yuan per liter (0.16 USD) to 1.2 yuan per liter according
to Platts.
The gasoline crack spread against Dubai crude in Singapore dropped more than $2 to
average $9.3/b in December.
The Singapore naphtha crack continued to be weak as market sentiment remained
bearish due to a supply overhang in the region. However, naphtha cracks recovered
some ground on the back of stronger buying interest supported by firm downstream
ethylene margins, though the uptick was limited by expectations of higher Western
arbitrage volumes in the coming weeks.
Graph 6.5: Singapore crack spread vs. Dubai, 2013-2015
US$/b
US$/b
30
30
20
20
10
10
0
0
Prem.Gasoline Unl.92
Jet/Kero
OPEC Monthly Oil Market Report – January 2015
Gasoil 50 ppm
Jan 15
Dec 14
Nov 14
Oct 14
Sep 14
Aug 14
Jul 14
Jun 14
May 14
Apr 14
Mar 14
-20
Feb 14
-20
Jan 14
-10
Dec 13
-10
Fuel oil 180 CST
67
Product Markets and Refinery Operations
At the middle of the barrel, cracks partially retained the recovery seen the previous
month on the back of strong seasonal demand within the region, though exhibiting a
slight drop, pressured by the supply side.
The middle distillates market continued to be supported by higher seasonal demand
from several countries in the region, amid some export opportunities to Egypt and
Yemen, and gasoil cracks remained healthy, despite losing some ground. Additional
support came from maintenance at the Mailiao refinery in Taiwan, which is expected to
limit spot availability in the coming weeks. However, this was offset by increasing
refinery levels in countries like China and Japan. This comes amid additional refining
capacity due online in India and the Middle East, which will exert some pressure on the
middle distillate market in Asia.
The gasoil crack spread in Singapore against Dubai showed a loss of 80¢ versus the
previous month’s levels to average around $18/b in December.
The fuel oil market continued to recover, while the Singapore market recovered from
the collapse of a major bunker supplier in the region.
However, any uptick was limited by expected higher inflows to the region in the coming
weeks once new regulations in the ECAs come into force, as the Asian market will
become the recipient of more Western volumes.
The fuel oil crack spread in Singapore against Dubai gained 20¢ to average minus $6/b
in December.
Table 6.1: Refinery operations in selected OECD countries
Refinery throughput, mb/d
US
France
Germany
Italy
UK
Euro-16
Japan
Oct 14
15.34
1.15
1.86
1.18
1.10
10.10
3.06
Nov 14
15.99
1.11
1.86
1.28
1.08
10.20
3.28
Dec 14
16.41
3.55
Refinery utilization, %
Change
Dec/Nov
0.42
0.27
Oct 14
86.10
76.50
82.77
55.63
71.83
78.88
69.08
Nov 14
89.10
73.39
82.86
60.40
71.04
80.10
88.50
Change
Dec 14 Dec/Nov
92.12
3.02
-
-
92.20
3.70
Sources: OPEC statistics, Argus, Euroilstock inventory report, IEA, EIA/DoE, METI and PAJ.
68
OPEC Monthly Oil Market Report – January 2015
Product Markets and Refinery Operations
Table 6.2: Refined product prices, US$/b
US Gulf (Cargoes FOB):
Naphtha
Premium gasoline
(unleaded 93)
Regular gasoline
(unleaded 87)
Jet/Kerosene
Gasoil
(0.2% S)
Fuel oil
(1.0% S)
Fuel oil
(3.0% S)
Rotterdam (Barges FoB):
Naphtha
Premium gasoline
(unleaded 98)
Jet/Kerosene
Gasoil/Diesel
(10 ppm)
Fuel oil
(1.0% S)
Fuel oil
(3.5% S)
Mediterranean (Cargoes FOB):
Naphtha
Premium gasoline*
Jet/Kerosene
Gasoil/Diesel*
Fuel oil
(1.0% S)
Fuel oil
(3.5% S)
Singapore (Cargoes FOB):
Naphtha
Premium gasoline
(unleaded 95)
Regular gasoline
(unleaded 92)
Jet/Kerosene
Gasoil/Diesel
(50 ppm)
Fuel oil
(180 cst 2.0% S)
Fuel oil
(380 cst 3.5% S)
Oct 14
Nov 14
Dec 14
Change
Dec/Nov
84.91
111.91
93.35
104.05
101.84
77.96
73.15
76.80
93.98
84.40
97.79
93.48
69.39
63.74
55.61
70.76
61.52
76.12
72.66
53.27
48.88
-21.19
-23.22
-22.88
-21.67
-20.82
-16.12
-14.86
78.61
103.90
105.32
102.35
76.50
75.06
69.44
95.79
98.35
96.25
65.55
65.66
54.22
73.31
81.09
77.45
49.59
49.44
-15.22
-22.48
-17.26
-18.80
-15.96
-16.22
75.96
99.57
102.34
101.58
76.56
75.70
66.15
91.37
95.54
95.41
66.33
65.65
50.28
68.70
77.58
77.48
50.62
48.88
-15.87
-22.66
-17.96
-17.92
-15.71
-16.77
79.79
101.17
98.19
101.56
101.30
79.24
77.41
71.86
90.44
87.94
96.41
95.46
71.68
70.38
56.33
71.91
69.58
78.36
78.45
55.52
54.60
-15.53
-18.53
-18.36
-18.05
-17.01
-16.16
-15.78
* Cost, insurance and freight (CIF).
Sources: Platts and Argus Media.
OPEC Monthly Oil Market Report – January 2015
69
Tanker Market
Tanker Market
In December, dirty tanker spot freight rates were mixed. While VLCC rates
registered gains compared with the previous month, spot freight rates for
Suezmax and Aframax dropped from a month earlier. In the VLCC sector, a
generally positive trend was detected, pushing freight rates up for all reported
routes. VLCC freight rates continued their recovery in December, as was seen in
the previous couple of months, mainly on the back of higher tonnage demand for
Far East destinations. The VLCC market saw strong activity during December,
with freight rates encountering gains in different regions. On average, VLCC
freight rates increased by 16% from the previous month, while Suezmax and
Aframax rates registered drops of 9% and 29%, respectively.
Clean tanker spot freight rates increased by 11% on average in December
compared with the previous month, mainly as a result of freight gains registered
in West of Suez, which rose by 18% on the back of a firmer Western market,
while East of Suez rates showed a decline of 4% from the previous month. In an
annual comparison, all clean tanker freight rates were up over one year ago.
Spot fixtures
Global fixtures dropped by 7.5% in December, compared with the previous month.
OPEC spot fixtures also declined by 1.18 mb/d or 9.2%, averaging 11.63 mb/d,
according to preliminary data. The drop in fixtures was registered in several regions, as
fixtures in the Middle East to both east- and west-bound destinations were lower, as
were fixtures outside of the Middle East, which averaged 4.18 mb/d in December, down
by 0.03 mb/d from one month ago. Compared with the same period one year earlier,
global fixtures indicated a drop of 14% in December.
Table 7.1: Tanker chartering, sailings and arrivals, mb/d
Oct 14
Nov 14
Dec 14
Change
Dec 14/Nov 14
Spot Chartering
All areas
OPEC
Middle East/East
Middle East/West
Outside Middle East
18.20
12.91
7.09
1.65
4.17
18.09
12.81
6.18
2.42
4.21
16.73
11.63
5.34
2.11
4.18
-1.36
-1.18
-0.84
-0.31
-0.03
Sailings
OPEC
Middle East
24.16
17.80
23.71
17.36
23.36
17.02
-0.36
-0.34
Arrivals
North America
Europe
Far East
West Asia
9.58
12.62
8.38
4.64
9.69
12.66
8.88
4.35
9.70
12.43
8.89
4.28
0.01
-0.23
0.00
-0.07
Sources: Oil Movements and Lloyd's Marine Intelligence Unit.
70
OPEC Monthly Oil Market Report – January 2015
Tanker Market
Sailings and arrivals
Preliminary data showed that OPEC sailings remained down by 1.5% in December,
averaging 23.36 mb/d, which is 0.65 mb/d or 2.7% lower than the same month a year
earlier. December arrivals in North America and the Far East increased over the
previous month, while European and West Asian arrivals declined by 0.23 mb/d
and 0.07 mb/d, respectively, to average 8.89 mb/d and 4.28 mb/d.
Spot freight rates
VLCC
For the VLCC sector, the market continued with the gains seen since the beginning of
the fourth quarter in 2014, as market activity remained high, while vessel availability
fluctuated often. However, ship owners showed a constant resistance to lower freight
rates, even when the tonnage list lengthened, as rates were expected to continue to
rise despite occasional softer momentum during the month.
.
Graph 7.1: Monthly averages of crude oil spot freight rates
Worldscale
180
Worldscale
180
Mediterranean/Northwest Europe (Aframax)
Middle East/Far East (VLCC)
Dec 14
Nov 14
20
Oct 14
40
20
Sep 14
40
Aug 14
60
Jul 14
80
60
Jun 14
100
80
May 14
100
Apr 14
120
Mar 14
140
120
Feb 14
140
Jan 14
160
Dec 13
160
West Africa/USGC (Suezmax)
Spot freight rates for tankers operating on the Middle East-to-East route registered the
highest increase among all reported routes. VLCC spot freight rates for tankers
operating on the Middle East-to-East route increased by WS13 or 22% in December
compared with the previous month. This increase was supported by high tonnage
demand for Asian requirements, affecting loading in the Middle East and West Africa.
Thus, VLCC spot freight rates for tankers operating on the West Africa-to-East route
increased in December from a month earlier to average WS64 points, up by WS7
points or 12% from the previous month. Winter seasonal requirements from the West
improved tonnage demand and supported VLCC spot freight rates on the Middle Eastto-West long-haul route in December to average WS36, up 10% from the previous
month.
OPEC Monthly Oil Market Report – January 2015
71
Tanker Market
Suezmax
In a contrary pattern to VLCC, Suezmax spot freight rate developments were negative
in December, as average rates dropped by 9%, compared with the previous month.
The biggest rate drop was seen for Suezmax operating on the West Africa-to-US route,
which fell by 13%. Rates for tankers operating on Northwest Europe-to-US routes
decreased by 4%. December started with a drop in freight rates for West African cargo
loadings. However, the declining trend was halted by a firming VLCC market and
increased delays at the Turkish Straits, all of which helped to stabilize the Suezmax
market and prevent further drops in freight rates. Freight rates in the West dropped as
tonnage demand to the region was often sparse during the month, affected somewhat
by the holiday season. Tonnage builds, reduced delays in the Black Sea and limited
prompt requirements were some of the factors that caused Suezmax freight rates to
drop in several regions.
Table 7.2: Spot tanker crude freight rates, Worldscale
Crude
Middle East/East
Middle East/West
West Africa/East
West Africa/US Gulf Coast
Northwest Europe/US Gulf Coast
Indonesia/East
Caribbean/US East Coast
Mediterranean/Mediterranean
Mediterranean/Northwest Europe
Size
1,000 DWT
Oct 14
Nov 14
230-280
270-285
260
130-135
130-135
80-85
80-85
80-85
80-85
47
26
51
75
60
90
129
93
85
56
33
57
98
73
110
153
168
160
Change
Dec 14 Dec 14/Nov 14
69
36
64
85
70
113
109
103
96
13
3
7
-13
-3
4
-44
-65
-65
Sources: Galb raith’s tanker market report and Platts.
Aframax
Aframax spot freight rates experienced their biggest decline in December from one
month earlier, compared with dirty tankers in other classes. The average rate fell by
29% on reported routes. Aframax freight rates in the East were the only exception,
showing gains on the Indonesia-to-the-East route by 3% to average WS113 points. In
the West, all freight rates registered a notable decline from a month earlier; the
Caribbean-to-US rate dropped by 29% from the previous month, despite stable activity
in that region. This was barely enough to stabilize rates for some time before they
dropped as the market approached the holiday season, falling in both directions of the
Mediterranean. Mediterranean-to-Mediterranean and Mediterranean-to-Northwest
Europe rates declined by 39% and 40%, respectively. These declines partially resulted
from reduced activity due to holidays, with no effect seen from the limited pre-holiday
rush when the market remained fairly steady.
72
OPEC Monthly Oil Market Report – January 2015
Tanker Market
Clean spot freight rates
In the clean sector, tankers on several routes registered gains in December as seen in
previous months. December started with long range (LR)-2 vessels experiencing
steady activity to the East while LR-1 tankers had a slower start, with limited activity in
different regions. Medium-range (MR) rates flattened at the beginning of the month
following high levels achieved at the end of the previous month. Following a soft start to
the month, the clean tanker market briefly firmed across different classes, as LR and
MR freight rates strengthened and availability tightened while inquiries increased.
MR tanker availability turned date sensitive and premiums were achieved ahead of the
ice-breaking season.
Freight rates in the East remained weak as the market moved slowly, while tonnage
availability increased in the Middle East. Rates for tankers operating on the Middle
East-to-East route dropped by 9% compared with the previous month and rates for the
Singapore-to-East route remained flat from one month earlier to average WS120 points
in December.
Graph 7.2: Monthly average of clean spot freight rates
Worldscale
Middle East/Far East
Northwest Europe/USEC
Dec 14
Nov 14
Oct 14
Sep 14
50
Aug 14
50
Jul 14
100
Jun 14
100
May 14
150
Apr 14
150
Mar 14
200
Feb 14
200
Jan 14
Worldscale
250
Dec 13
250
Mediterranean/Mediterranean
On the other hand, West of Suez freight rates showed improved sentiment on all
reported routes. Clean West of Suez spot freight rates gained 18% in December to
average WS216 points, Rates seen on the Northwest Europe-to-US route registered
the highest gain, increasing by 20% to average WS193 points. The Mediterranean-toMediterranean and Mediterranean-to-Northwest Europe routes saw similar gains of
18% and 17%, respectively.
Table 7.3: Spot tanker product freight rates, Worldscale
Products
Middle East/East
Singapore/East
Northwest Europe/US East Coast
Mediterranean/Mediterranean
Mediterranean/Northwest Europe
Size
1,000 DWT
Oct 14
Nov 14
30-35
30-35
33-37
30-35
30-35
123
115
132
155
165
126
119
161
188
198
Change
Dec 14 Dec 14/Nov 14
115
120
193
223
233
-11
0
32
35
35
Sources: Galb raith’s tanker market report and Platts.
OPEC Monthly Oil Market Report – January 2015
73
Oil Trade
Oil Trade
Preliminary data for the month of December shows that US crude oil imports
increased to average 7.52 mb/d, up by 198 tb/d from last month, but down by
251 tb/d from the same month last year. US monthly product imports increased
slightly from last month’s level to average 2.14 mb/d, the highest level seen since
May 2014; on an annual basis, they increased by 374 tb/d or 21%. In November,
Japan saw a decline in its crude oil imports m-o-m by 233 tb/d or 7% to average
3.07 mb/d. Y-o-y, crude imports dropped by 644 tb/d or 17%. India’s crude oil
imports declined in November from the previous month by 201 tb/d or 9%, while
y-o-y, there was an increase of 109 tb/d or 3% to average 3.67 mb/d. India’s
product imports dropped as well in November by 21 tb/d or 4% to average
456 tb/d, yet, y-o-y, they increased by 144 tb/d or 46%. China’s crude oil imports
rose by 512 tb/d in November, following the drop seen the month before. China’s
product imports also increased from the previous month to average 962 tb/d, up
by 36 tb/d or 4% m-o-m, while dropping slightly by 3 tb/d or 0.3% y-o-y.
US
In December, preliminary data showed that US crude oil imports increased to
average 7.52 mb/d, up by 198 tb/d from last month, but were down by 251 tb/d from the
same month last year. For the whole year, US crude imports were 361 tb/d lower.
US product imports increased slightly from last month’s level to average 2.14 mb/d,
the highest level seen since May 2014. On an annual basis, they increased by 374 tb/d
or 21%. For 2014, product imports declined by 12%.
Graph 8.1: US imports of crude and petroleum products
mb/d
2.5
mb/d
8.0
7.5
7.0
6.5
6.0
5.5
5.0
4.5
2.0
1.5
1.0
0.5
Others*
Jet fuel/kerosene
Propane/propylene
Fuel oil
Dec 14
Nov 14
Oct 14
Sep 14
Aug 14
Jul 14
Jun 14
May 14
Apr 14
Mar 14
Feb 14
Jan 14
Dec 13
0.0
Gasoline
Crude (RHS)
*Others: Contains natural gas liquids, liquefied refinery gases (LRG's), other liquids and all finished petroleum products
except gasoline, jet fuel/kerosene, fuel oil and propane/propylene.
In December, US product exports were 119 tb/d less than seen a month ago to
average 3.4 mb/d. On an annual basis, product exports were lower than a year before
by 994 tb/d or 23%. As a result, US total net imports increased in December to
average 5.9 mb/d.
74
OPEC Monthly Oil Market Report – January 2015
Oil Trade
Graph 8.2: US exports of crude and petroleum products
tb/d
5,000
tb/d
450
400
350
300
250
200
150
100
50
0
4,000
3,000
2,000
1,000
Others*
Jet fuel/kerosene
Propane/propylene
Fuel oil
Dec 14
Nov 14
Oct 14
Sep 14
Aug 14
Jul 14
Jun 14
May 14
Apr 14
Mar 14
Feb 14
Jan 14
Dec 13
0
Gasoline
Crude (RHS)
*Others: Contains natural gas liquids, liquefied refinery gases (LRG's), other liquids and all finished petroleum products
except gasoline, jet fuel/kerosene, fuel oil and propane/propylene.
In October, the top first and second crude suppliers to the US maintained the same
order as last month. Canada remained the premier crude supplier to the US accounting
for 43% of total US crude imports, yet with a decrease of 79 tb/d in exports to the US
compared to the month before. Saudi Arabia, which maintained its position as the
second largest supplier to the US in December, also saw a drop in its exports to the US
by 178 tb/d. Mexico came in as the third top supplier, accounting for 10% of total
US crude imports, however its exports to the US were lower by 82 tb/d from the
previous month.
Crude imports from OPEC Member Countries decreased in October from last month,
dropping by 484 tb/d or 17%, accounting for 34% of total US crude imports. Similarly,
US product imports from OPEC Member Countries declined by 103 tb/d or 32% from
last month.
As for the product supplier share, Canada and Russia maintained their positions as
first and second suppliers to the US, accounting for 22% and 16%, respectively.
Looking at US crude imports by region, in October 2014, US crude imports from
North America averaged 3 mb/d, continuing to make it the top regional supplier,
followed by Latin America, which exported 2.2 mb/d in October to the US. Imports from
the Middle East and Africa declined from last month. The Middle East came in as the
third regional supplier with an average of 1.4 mb/d, while imports from Africa were
down from last month to average 314 tb/d.
Table 8.1: US crude and product net imports, tb/d
Crude oil
Total products
Total crude and products
Oct 14
6,754
-1,961
4,793
Nov 14
6,930
-1,856
5,074
Dec 14
7,139
-1,244
5,895
Change
Dec 14/Nov 14
209
612
821
Turning to crude imports by PADD, in PADD 1, crude imports were lower from Africa
and Latin America by 74 tb/d and 2 tb/d, respectively, from last month. Imports from
PADD 2 remained mostly sourced from North America as they averaged 2 mb/d.
PADD 2 imports from the Middle East averaged 30 tb/d. PADD 3 sourced their imports
mainly from Latin America and the Middle East. In October, imports from the
Middle East were 18% lower than the previous month, and imports from Latin America
OPEC Monthly Oil Market Report – January 2015
75
Oil Trade
were 5% lower. PADD 4 continued to cover its imports from North America, averaging
245 tb/d in October, however, they decreased by 37 tb/d from a month ago. PADD 5
West Coast imports were sourced mainly from the Middle East, which exported
432 tb/d to PADD 5 in October, followed by Latin America and North America, which
exported 330 tb/d and 215 tb/d, respectively.
Japan
In November, Japan saw a decline in its crude oil imports m-o-m by 233 tb/d or 7% to
average 3.07 mb/d, the lowest level since June 2014. On an annual basis, crude imports
dropped by 644 tb/d or 17%.
As for crude supplier shares, Saudi Arabia and the United Arab Emirates maintained
their positions as top crude suppliers to Japan as seen in October, accounting for 31%
and 26%, respectively. However, both suppliers saw declines in their monthly exported
volumes to Japan by 20% and 6%, respectively. On the other hand, Russia, Qatar and
Kuwait raised their exports to Japan by 19%, 11% and 7%, respectively, from the
previous month.
Product imports increased m-o-m in November by 188 tb/d or 37%, while y-o-y, they
decreased by 28 tb/d or 6%, despite product sales dropping by 7.8% from a year earlier.
Graph 8.3: Japan’s imports of crude and petroleum products
tb/d
mb/d
1,200
5
1,000
4
800
3
600
2
400
Others*
LPG
Naphtha
Fuel oil
Nov 14
Oct 14
Sep 14
Aug 14
Jul 14
Jun 14
May 14
Apr 14
Mar 14
Feb 14
0
Jan 14
0
Dec 13
1
Nov 13
200
Crude oil
*Others: Contains gasoline, jet fuel, kerosene, gasoil, asphalt and paraffin wax.
Product exports increased in November by 24 tb/d or 4.5% m-o-m, and by 54 tb/d or
11% y-o-y. Year-to-date, they decreased by 10 tb/d or 2% as a result of a decline in
Japan’s net trade imports by 68 tb/d or 4.5% to average 32 mb/d, the lowest level seen
since June 2014.
76
OPEC Monthly Oil Market Report – January 2015
Oil Trade
Graph 8.4: Japan’s exports of petroleum products
tb/d
600
tb/d
500
500
400
400
300
300
200
200
100
100
600
Fuel oil
Gasoil
Jet fuel
Nov 14
Oct 14
Sep 14
Aug 14
Jul 14
Jun 14
May 14
Apr 14
Mar 14
Feb 14
Jan 14
Dec 13
0
Nov 13
0
Others*
*Others: Contains LPG, gasoline, naphtha, kerosene, lubricating oil, asphalt and paraffin wax.
Table 8.2: Japan’s crude and product net imports, tb/d
Sep 14
3,340
11
3,351
Crude oil
Total products
Total crude and products
Oct 14
3,310
-9
3,301
Change
Nov 14/Oct 14
-233
165
-68
Nov 14
3,077
156
3,233
China
China’s crude oil imports rose in November following the drop of the previous month,
increasing by 512 tb/d to average 6.2 mb/d. On an annual comparison, they increased
by 452 tb/d or 8% from last year’s level. Year-to-date, the numbers dictate an increase
of 490 tb/d or 9%.
Graph 8.5: China’s imports of crude and petroleum products
tb/d
tb/d
1,600
8,000
1,400
7,000
1,200
6,000
1,000
5,000
800
4,000
600
3,000
400
2,000
200
1,000
Others
Diesel
LPG
Fuel oil
Naphtha
Asphalt
Gasoline
Crude (RHS)
Nov 14
Oct 14
Sep 14
Aug 14
Jul 14
Jun 14
May 14
Apr 14
Mar 14
Feb 14
Jan 14
Dec 13
0
Nov 13
0
Jet fuel
China imported higher volumes in November from all of its main suppliers, with the
exception of its prime supplier Saudi Arabia, which showed lower exports to China in
November by 102 tb/d. Regarding crude imports from other origins, in November, top
suppliers to China maintained their positions from the previous month. Saudi Arabia,
OPEC Monthly Oil Market Report – January 2015
77
Oil Trade
Angola and Russia came in as first, second and third suppliers to China, accounting for
16%, 14% and 13% of total Chinese imports, respectively.
China’s product imports rose as well from the previous month to average 962 tb/d,
up by 36 tb/d or 4% m-o-m, while they dropped by a slight 3 tb/d or 0.3% y-o-y.
As for China’s crude exports, in November, China did not export any crude as seen in
the previous two months.
Graph 8.6: China’s exports of crude and petroleum products
tb/d
tb/d
1,000
100
80
800
60
600
40
400
20
200
0
Others
Diesel
LPG
Fuel oil
Naphtha
Asphalt
Gasoline
Crude (RHS)
Nov 14
Oct 14
Sep 14
Aug 14
Jul 14
Jun 14
May 14
Apr 14
Mar 14
Feb 14
Jan 14
Dec 13
-20
Nov 13
0
Jet fuel
China’s product exports saw a monthly drop of 145 tb/d or 17%, while they increased
by 118 tb/d or 20% compared to the previous year’s level.
Accordingly, China’s net oil trade increased by 693 tb/d or 12% on a monthly basis
and by 355 tb/d or 6% compared to a year ago.
Table 8.3: China’s crude and product net imports, tb/d
Crude oil
Total products
Total crude and products
Sep 14
6,729
363
7,092
Oct 14
5,688
81
5,769
Nov 14
6,200
262
6,462
Change
Nov 14/Oct 14
512
181
693
India
India’s crude oil imports declined in November from the previous month by 201 tb/d
or 9%, while y-o-y, they increased by 109 tb/d or 3% to average 3.67 mb/d.
India’s product imports also dropped in November by 21 tb/d or 4% to average
456 tb/d, yet y-o-y, they increased by 144 tb/d or 46%. The monthly drop came as a
result of a decrease in imported volumes of petrol and LPG in November by 71% and
6%, respectively.
78
OPEC Monthly Oil Market Report – January 2015
Oil Trade
Graph 8.7: India’s imports of crude and petroleum products
tb/d
tb/d
600
5,000
500
4,000
400
3,000
300
2,000
200
1,000
100
Nov 14
Oct 14
Sep 14
Aug 14
Jul 14
Jun 14
May 14
Apr 14
Mar 14
Feb 14
Jan 14
Dec 13
0
Nov 13
0
Others
LPG
Naphtha
Gasoline
Kerosene
Gasoil
Fuel oil
Crude (RHS)
India’s product exports decreased in November compared to the previous month by
2.4% to average 1.5 mb/d, while y-o-y, they increased by 150 tb/d or 11%. The monthly
drop was the result of lower exported volumes of diesel and petrol, which declined by
7% and 5%, respectively, from a month earlier.
Graph 8.8: India’s exports of petroleum products
tb/d
tb/d
2,000
2,000
1,500
1,500
1,000
1,000
500
500
Fuel oil
Gasoil
Jet fuel
Gasoline
Naphtha
Nov 14
Oct 14
Sep 14
Aug 14
Jul 14
Jun 14
May 14
Apr 14
Mar 14
Feb 14
Jan 14
Dec 13
0
Nov 13
0
Others
As a result, India’s net trade imports declined by 185 tb/d or 7% m-o-m, while they
increased by 103 tb/d or 4% y-o-y in November to average 2.6 mb/d.
Table 8.4: India’s crude and product net imports, tb/d
Crude oil
Total products
Total crude and products
Sep 14
3,901
-1,044
2,857
Oct 14
3,876
-1,079
2,797
Nov 14
3,675
-1,062
2,612
Change
Nov 14/Oct 14
-201
17
-185
Note: India data tab le does not include information for crude import and product export b y Reliance Industries.
OPEC Monthly Oil Market Report – January 2015
79
Oil Trade
FSU
In November, total crude oil exports from FSU declined by 108 tb/d or 1.8% to
average 5.8 mb/d.
Total shipments from the Black Sea dropped as shipments from Novorossiysk dropped
by 68 tb/d or 12% to average 516 tb/d. Total Baltic Sea exports also dropped by 51 tb/d
in November as shipments from both the Primorsk port terminal and the Ust Luga port
terminal were lower than last month. Druzhba pipeline total shipments declined by
23 tb/d to average 993 tb/d/d, and Kozmino shipments also dropped by 80 tb/d or 14%
to average 496 tb/d.
Exports through the Lukoil system declined from the previous month in the Barents
Sea where the Varandey offshore platform reported a drop of 14 tb/d, while in the Baltic
Sea, the Kalinigrad port terminal increased slightly by 5 tb/d.
Baltic Sea total exports increased by 206 tb/d from October, mainly as the Novorossiyk
port terminal (CBC) increased its exports by 202 tb/d. In the Mediterranean Sea, BTC
supplies showed a decline of 141 tb/d or 23% from the previous month to average
458 tb/d.
As for Russian product exports, FSU total product exports gained 395 tb/d or 13%
from last month to average 3.4 mb/d. The increase in product exports came as all
product categories rose, but the most significant gains were seen in gasoil, fuel oil and
VGO.
80
OPEC Monthly Oil Market Report – January 2015
Oil Trade
Table 8.5: Recent FSU exports of crude and petroleum products by source, tb/d
2013
2Q 14
3Q 14
Oct 14
Nov 14
739
739
535
204
672
672
494
178
570
570
409
162
584
584
437
146
516
516
372
144
Baltic Sea total
Primorsk port terminal - total
of which: Russian oil
Others
Ust-Luga port terminal - total
of which: Russian oil
Others
1,546
1,083
1,007
76
463
342
121
1,433
942
942
0
490
295
196
1,288
799
799
0
489
315
174
1,350
847
847
0
503
339
164
1,299
803
803
0
496
327
169
Druzhba pipeline total
of which: Russian oil
Others
1,032
1,000
32
998
966
32
1,025
993
32
1,015
983
32
993
961
32
Pacific ocean total
Kozmino port terminal - total
434
434
474
474
552
552
575
575
496
496
China (via ESPO Pipeline) total
China Amur
321
321
304
304
321
321
325
325
325
325
4,071
3,881
3,757
3,849
3,628
2013
2Q 14
3Q 14
Oct 14
Nov 14
111
111
116
116
125
125
135
135
121
121
19
19
12
12
16
16
12
12
16
16
Transneft system
Europe
Asia
Black Sea total
Novorossiysk port terminal - total
of which: Russian oil
Others
Total Russian crude exports
Lukoil system
Europe
and North
America
Europe
Barents Sea Total
Varandey offshore platform
Baltic Sea Total
Kalinigrad port terminal
2013
2Q 14
3Q 14
Oct 14
Nov 14
Russian Far East total
Aniva bay port terminal
De Kastri port terminal
259
114
145
289
116
173
235
103
133
254
92
161
305
114
191
Central Asia total
Kenkiyak-Alashankou
239
239
233
233
230
230
207
207
214
214
Baltic sea total
Novorossiysk port terminal (CPC)
Supsa port terminal
Batumi port terminal
Kulevi port terminal
853
704
76
53
20
943
818
70
42
14
1,003
886
90
27
0
895
784
97
14
0
1,101
986
101
14
0
Mediterranean sea total
BTC
641
641
594
594
683
683
599
599
458
458
2013
198
9
189
2Q 14
46
9
38
3Q 14
24
7
17
Oct 14
12
7
6
Nov 14
12
7
5
6,392
6,116
6,073
5,963
5,855
2013
122
390
11
857
1,415
263
2Q 14
129
515
11
1,005
1,522
259
3Q 14
129
515
11
1,005
1,522
259
Oct 14
87
472
0
797
1,420
224
Nov 14
126
506
2
943
1,509
309
3,058
3,441
3,441
3,000
3,395
9,450
9,557
9,557
8,963
9,250
Other routes
Asia
Europe
Russian rail
Russian rail
of which: Russian oil
Others
Total FSU crude exports
Products
Gasoline
Naphtha
Jet
Gasoil
Fuel oil
VGO
Total FSU product exports
Total FSU oil exports
Sources: Argus Nefte Transport and Argus Glob al Markets.
OPEC Monthly Oil Market Report – January 2015
81
Stock Movements
Stock Movements
OECD commercial oil stocks fell by 10.0 mb in November to stand at 2,710 mb,
still nearly 100 mb higher than the same time a year ago, and 20.3 mb above the
latest five-year average. Crude indicated a surplus of around 38.2 mb, while
product stocks remained 17.9 mb below the previous five-year average. In terms
of days of forward cover, OECD commercial stocks stood at 58.7 days, 1.0 day
higher than the latest five-year average. Preliminary data for December shows
US total commercial oil stocks rose by 27.8 mb to stand at 1,149 mb. With this
build, they were nearly 80 mb above the latest five-year average and around
84.0 mb higher than in the same period a year ago. Within components,
commercial crude and product stocks saw a build of 3.1 mb and 24.7 mb,
respectively. The latest information for November showed Chinese total oil
commercial inventories fell by 7.9 mb to stand at 383.4 mb, though they stood
25.6 mb above a year ago at the same time. Within components, both commercial
crude and product stocks fell by 4.9 mb and 3.0 mb, respectively.
OECD
The latest information for November shows that total OECD commercial oil stocks
fell by 10.0 mb, reversing the build of the previous four months. At 2,710 mb,
inventories are nearly 100 mb higher than at the same time a year earlier, and 20.3 mb
above the latest five-year average.
Within components, commercial crude stocks were down by 15.3 mb, while product
stocks rose by 5.3 mb in November versus the previous month. At 1,320 mb,
OECD commercial crude stocks were 32.8 mb above the same time a year earlier
and 38.2 mb higher than the latest five-year average. Despite this stock draw,
commercial crude stocks in the OECD remained comfortable after accumulating nearly
90 mb since the beginning of 2014. This was driven by surging non-OPEC supply. The
contango in major benchmarks also encouraged refineries to build more crude
inventories.
Graph 9.1: OECD’s commercial oil stocks
mb
mb
2,850
2,850
2,800
2,800
2,750
2,750
2,700
2,700
2,650
2,650
Max/Min
2009-2013
2,600
2,600
2,550
2,550
2,500
Jan
Feb
Mar
2013
82
Apr
May
Jun
2014
Jul
Aug
Sep
Oct
Nov
2,500
Dec
Average 2009-2013
OPEC Monthly Oil Market Report – January 2015
Stock Movements
OECD product inventories rose by 5.3 mb in November to end the month at
1,390 mb. At this level, they stood 65.4 mb higher than a year ago at the same time,
while still remaining 17.9 mb below the seasonal norm. The build in OECD product
stocks in November mainly reflected higher refinery output in OECD countries.
In terms of days of forward cover, OECD commercial stocks fell by 0.4 days in
November from the previous month to stand at 58.7 days, still 1.0 day higher than the
latest five-year average. Within the regions, OECD Americas’ days of forward cover
stood 1.4 days higher than the historical average of 57.9 days in November, and OECD
Asia Pacific stood at 1.7 days above the seasonal average to finish the month at
46.8 days. At the same time, OECD Europe indicated a surplus of 0.2 days, averaging
68.2 days in November.
In the same month, commercial stocks in OECD Americas fell by 5.3 mb to stand at
1,403 mb. At this level, they represented a surplus of 51.3 mb above the seasonal
norm and 53.6 mb above the same time a year earlier. Within components, crude and
product inventories fell by 2.7 mb and 2.6 mb, respectively.
At the end of November, crude commercial oil stocks in OECD Americas fell, ending
the month at 712 mb, which is 52.7 mb above the latest five-year average and 29.2 mb
higher than the same time a year earlier. The fall in commercial crude stocks was
mainly driven by higher US crude oil refinery input, averaging nearly 16.0 mb/d in
November, or about 500,000 b/d more than a month earlier. A further drop in US
commercial crude stocks was limited by higher crude imports as well as increased US
domestic crude production.
Product stocks in OECD Americas also fell in November to stand at 691 mb. At this
level, they indicated a slight surplus of 0.8 mb above the seasonal norm, and were
22.1 mb higher than the same time a year earlier. The fall in product stocks came
mainly from strong demand in the US and greater exports to Latin America.
OECD Europe’s commercial stocks rose by 2.7 mb in November to stand at 890 mb.
This is 25.4 mb higher than the same time a year ago, but 42.5 mb below the latest
five-year average. The total stock build came from products, which increased by
5.4 mb, while crude abated this build, falling by 2.7 mb.
OECD Europe’s commercial crude stocks fell in November, following a build of
24 mb in October, to stand at 375 mb. At this level, crude inventories stood at around
6.8 mb below the same period a year earlier and 16.5 mb less than the latest five-year
average. This drop was driven by higher European refinery runs combined with unrest
in Libya, leading to lower production in that country.
In contrast, OECD Europe’s commercial product stocks rose by 5.4 mb in
November to stand at 515 mb. Despite this stock draw, European stocks were 32.1 mb
above a year ago at the same time, but still 26.0 mb lower than the seasonal norm.
OECD Asia Pacific commercial oil stocks fell by 7.4 mb in November, reversing the
build of the previous four consecutive months to stand at 417 mb. At this level,
OECD Asia Pacific commercial oil inventories are 21.5 mb higher than a year ago, and
9.3 mb above the five-year average. Within components, product stocks rose by
2.5 mb, while crude inventories fell by 9.9 mb. Crude inventories ended the month of
November at 233 mb, standing 10.3 mb above a year ago and 2.0 mb above the
seasonal norm. OECD Asia Pacific’s total product inventories ended November at
184 mb, indicating a surplus of 11.2 mb from a year ago, 7.3 mb above the seasonal
norm.
OPEC Monthly Oil Market Report – January 2015
83
Stock Movements
Table 9.1: OECD’s commercial stocks, mb
Crude oil
Products
Total
Sep 14
1,303
1,415
2,719
Oct 14
1,335
1,385
2,720
Nov 14
1,320
1,390
2,710
Change
Nov 14/Oct 14
-15.3
5.3
-10.0
Nov 13
1,287
1,325
2,612
58.7
59.1
58.7
-0.4
56.6
Days of forward cover
EU plus Norway
Preliminary data for November shows that total European stocks rose by 2.7 mb,
reversing the drop of the previous two months to stand at 1,075.2 mb. This is 10.4 mb
or 1.0% above the same time a year ago, but still 15.6 mb or 1.4% below the latest
five-year average. The total stock build came from products, which increased by
5.4 mb, while crude abated this build, falling by 2.7 mb.
European crude inventories fell in November, reversing the build of the previous two
months to stand at 474.0 mb. Despite this drop, crude inventories stood at 8.4 mb or
1.8% above the latest five-year average. However, they remained 4.5 mb or 0.9%
below the same period one year earlier. Higher European refinery runs, which rose by
around 150,000 b/d from the previous month to stand at 10.3 mb/d, were behind the
drop in crude oil stocks. Unrest in Libya, leading to a cut in production there also
supported the drop in crude oil inventories.
Graph 9.2: EU-15 plus Norway’s total oil stocks
mb
mb
1,180
1,180
1,160
1,160
1,140
1,140
Max/Min
2009-2013
1,120
1,120
1,100
1,100
1,080
1,080
1,060
1,060
1,040
Jan
Feb
Mar
2013
Apr
May
Jun
2014
Jul
Aug
Sep
Oct
Nov
1,040
Dec
Average 2009-2013
In contrast, OECD Europe’s product stocks rose by 5.4 mb in November, reversing
the drop of the previous two months. At 601.2 mb, European stocks were 14.9 mb or
2.5% above a year earlier at the same time, though they remained 23.9 mb or 3.8%
below the seasonal norm. All products experienced builds, with the exception of
naphtha.
Gasoline stocks rose slightly by 0.7 mb in November to end the month at 108.8 mb. At
this level, gasoline stocks showed a surplus of 1.8 mb or 1.6% above a year earlier,
though still 2.3 mb or 2.1% below the seasonal norm. The build mainly reflects higher
gasoline output in Europe, combined with higher gasoline imports.
84
OPEC Monthly Oil Market Report – January 2015
Stock Movements
Distillate stocks also rose by 2.3 mb, ending November at 394.0 mb. With this stock
build, they indicated a surplus of 12.2 mb or 3.2% compared with a year ago in the
same period and 5.0 mb or 1.3% above the five-year average. The build came mainly
from higher refinery runs combined with healthy gasoline exports from former Soviet
Union refineries.
Residual fuel oil stocks also rose by 2.8 mb in November, reversing the build of the
previous two months. At 73.8 mb, residual fuel oil stocks were 2.3 mb or 3.0% below
the same time a year ago and 20.9 mb or 22.1% less than the seasonal average. Weak
bunker demand, combined with lower exports to the Asia Pacific region, were behind
the build in residual fuel stocks.
In contrast, naphtha stocks fell by 0.4 mb in November to stand at 24.6 mb,
representing a surplus of 3.2 mb or 15.1% above a year ago at the same time and
5.7 mb or 18.7% below the latest five-year average.
Table 9.2: EU-15 plus Norway’s total oil stocks, mb
Crude oil
Gasoline
Naphtha
Middle distillates
Fuel oils
Total products
Total
Change
Nov 14/Oct 14
-2.7
0.7
-0.4
2.3
2.8
5.4
2.7
Nov 14
474.0
108.8
24.6
394.0
73.8
601.2
1,075.2
Oct 14
476.7
108.1
25.1
391.7
71.0
595.8
1,072.5
Sep 14
473.0
107.2
25.5
395.8
71.6
600.1
1,073.1
Nov 13
478.5
107.1
21.4
381.8
76.1
586.3
1,064.8
Sources: Argus and Euroilstock.
US
Preliminary data for December shows that total commercial oil stocks rose by
27.8 mb, reversing the fall of the previous two months to stand at 1,149 mb. With this
build, they were nearly 80 mb or 7.5% above the latest five-year average and 85.0 mb
or 8.0% higher than in the same period a year earlier. Within components, commercial
crude and product stocks saw a build of 24.7 mb and 3.1 mb, respectively.
Graph 9.3: US weekly commercial crude oil stocks
mb
mb
400
400
380
380
360
360
Max/Min
2010-2014
340
340
320
320
300
300
1
4
7
10
2014
13
16
19
22
25
2015
OPEC Monthly Oil Market Report – January 2015
28
31
34
37
40
43
46
49
52
Average 2010-2014
85
Stock Movements
US commercial crude stocks rose in December to stand at 382.4 mb. At this level,
crude commercial stocks finished the month at 24.7 mb or 6.9% above the same time a
year earlier, remaining 40.3 mb or 11.8% above the latest five-year average. The build
in commercial crude stocks was mainly driven by higher crude imports, which rose by
around 198 tb/d to stand at 7.52 mb/d. Ongoing higher US domestic production also
contributed to the build in US crude commercial stocks. However, the surge in
US crude oil refinery input by nearly 400,000 b/d to average 16.4 mb/d, limited any
further build. Refineries operated at around 92.1% of capacity in December, 3.0 pp
higher than the previous month. Crude at Cushing, Oklahoma, rose by more than 8 mb
in December to stand at to 32.1 mb, narrowing the gap with the same time a year
earlier to about 8.0 mb, down from 19.0 mb the previous month.
In December, total US product stocks surged sharply by 24.7 mb to end the month at
766.6 mb. With this stock build, product stocks were 60 mb or 8.5% above the levels
seen at the same time a year ago, showing a surplus of 40 mb or 5.4% above the
seasonal norm. With the exception of residual fuel oil, all products experienced builds.
Gasoline stocks rose by 28.6 mb, ending December at 237.2 mb, which was 9.1 mb
or 4.0% higher than the same period a year ago and 12.2 mb or 5.4% above the latest
five-year average. The build came mainly from higher gasoline output, which increased
by around 100,000 b/d, reaching 9.6 mb/d. Higher demand limited a further stock build
in gasoline.
Distillate stocks rose by 20.8 mb in December following a drop over the previous
two months. At 136.9 mb, they were 9.6 mb or 7.6% less than the same period one
year earlier, though still indicating a deficit of 11.4 mb or 7.7% with the five-year
average. The build in middle distillate stocks mainly reflected higher output, which
increased by nearly 350,000 b/d to average 5.2 mb/d.
Graph 9.4: US weekly distillate stocks
mb
mb
180
180
170
170
160
160
Max/Min
2010-2014
150
150
140
140
130
130
120
120
110
110
100
100
1
4
7
10
2014
13
16
19
22
25
2015
28
31
34
37
40
43
46
49
52
Average 2010-2014
Jet fuel stocks also rose by 2.1 mb, ending December at 37.8 mb, which is 0.6 mb or
1.5% higher than the same month a year ago, though remaining 3.2 mb or 7.7% below
the latest five-year average. In contrast, residual fuel oil stocks fell by 4.5 mb in
December to end the month at 33.1 mb, which is 4.6 mb or 12.2% lower than the
previous year in the same period, and 3.8 mb or 10.3% below the seasonal norm. This
build is mainly attributed to higher residual fuel demand.
86
OPEC Monthly Oil Market Report – January 2015
Stock Movements
Table 9.3: US onland commercial petroleum stocks, mb
Oct 14
382.0
203.2
120.1
36.9
36.3
1,139.1
691.0
Crude oil
Gasoline
Distillate fuel
Residual fuel oil
Jet fuel
Total
SPR
Nov 14
379.3
208.6
116.2
37.6
35.7
1,121.2
691.0
Dec 14
382.4
237.2
136.9
33.1
37.8
1,149.0
691.0
Change
Dec 14/Nov 14
3.1
28.6
20.8
-4.5
2.1
27.8
0.0
Dec 13
357.1
228.0
127.5
38.1
37.2
1,065.4
696.0
Source: US Energy Information Administration.
Japan
In Japan, total commercial oil stocks fell by 7.4 mb in November, reversing the build
of the previous three months to stand at 172.1 mb. Despite this fall, Japanese
commercial oil inventories are 12.4 mb or 7.8% higher than a year ago, and 1.9 mb or
1.1% below the five-year average. Within components, product stocks rose by 2.5 mb,
while crude stocks fell by 9.9 mb.
Japanese commercial crude oil stocks fell in November, following a build in October,
to stand at 96.4 mb. Despite this drop, they were 6.8 mb or 7.5% above year-ago levels
at the same time, and 1.6 mb or 1.7% above the seasonal norm. The stock draw in
crude oil was driven by lower imports, which fell by around 233 tb/d or 7.0% to average
3.1 mb/d; this is 17.3% lower than the previous year at the same time. Higher refinery
throughputs also contributed to the fall in crude oil inventories. Indeed, refinery
throughputs rose by nearly 220,000 b/d to average 3.3 mb/d in November. Direct crude
burning in power plants rose by 13.5% in November compared with the previous
month, averaging 97.0 tb/d, but still showing a decline of 55% over the same period a
year earlier.
Graph 9.5: Japan’s commercial oil stocks
mb
mb
190
190
180
180
Max/Min
2009-2013
170
170
160
160
150
150
140
Jan
Feb
Mar
2013
Apr
May
Jun
2014
Jul
Aug
Sep
Oct
Nov
140
Dec
Average 2009-2013
In contrast, Japan’s total product inventories rose by 2.5 mb in November, reversing
the drop of the previous month to stand at 75.8 mb. At this level, product stocks are
5.7 mb or 8.1% above the same time a year ago, showing a surplus of 0.3 mb or 0.4%
with the five-year average. The build was driven by higher refinery output, which rose
by 220,000 b/d or 7.4% to average around 3.2 mb/d in November. Higher product
imports also contributed to the build in product inventories. However, the rise of 7.8% in
OPEC Monthly Oil Market Report – January 2015
87
Stock Movements
product sales limited further build in product inventories. All products witnessed a stock
build.
Distillate stocks rose by 1.1 mb in November to stand at 36.5 mb. At this level,
distillate stocks were 2.7 mb or 8.0% above the same period a year ago and 0.6 mb or
1.7% higher than the seasonal average. Within distillate components, kerosene and
gasoil experienced a build, while jet fuel saw a stock draw. Kerosene inventories rose
by 6.6% on the back of higher output, which increased by 22% from the previous
month. Gasoil also rose by 2.8% on lower domestic sales, combined with higher
output. In contrast, jet fuel stocks fell by 6.2% driven mainly by lower production, which
declined by almost 16%.
Total residual fuel oil stocks also rose by 0.4 mb in November to stand at 16.2 mb,
which is 1.9 mb or 13.0% above a year ago and 0.4 mb or 2.7% higher than the latest
five-year average. Within fuel oil components, fuel oils A and B.C rose by 23.8% and
12.2%, respectively. The build was mainly driven by higher output. Naphtha stocks
rose by 0.9 mb to finish the month of November at 12.4 mb, indicating a surplus of
1.9 mb or 18.6% compared with a year ago at the same time, 1.5 mb or 14.1% higher
than the seasonal norm. The stock build came mainly from higher imports, which
increased by 19.5% in November from the previous month. Gasoline stocks remained
almost unchanged, ending November at 10.7 mb. At this level, they were 0.9 mb or
7.5% less than at the same time the previous year and 2.3 mb or 17.4% below the fiveyear average.
Table 9.4: Japan’s commercial oil stocks*, mb
Crude oil
Gasoline
Naphtha
Middle distillates
Residual fuel oil
Total products
Total**
Sep 14
98.2
10.4
12.0
35.0
17.4
74.8
173.0
Oct 14
106.3
10.6
11.5
35.4
15.7
73.3
179.6
Nov 14
96.4
10.7
12.4
36.5
16.2
75.8
172.1
Change
Nov 14/Oct 14
-9.9
0.0
0.9
1.1
0.4
2.5
-7.4
Nov 13
89.6
11.5
10.4
33.8
14.3
70.1
159.7
* At end of month.
** Includes crude oil and main products only.
Source: Ministry of Economy, Trade and Industry, Japan.
China
The latest information for November showed Chinese total oil commercial
inventories fell by 7.9 mb, following a drop of 9.8 mb in October to stand at 383.4 mb.
Despite this stock draw, Chinese inventories were 25.6 mb above the previous year at
the same time. Within components, both commercial crude and product stocks fell by
4.9 mb and 3.0 mb, respectively. At 260.2 mb, crude commercial stocks represented a
surplus of around 29.0 mb when compared with the same period one year earlier. The
draw in crude commercial stocks came mainly from higher crude runs, while higher
imports limited a further drop in crude oil stocks.
Total product stocks in China also dropped by 3.0 mb in November for the sixth
consecutive month to stand at 123.1 mb. At this level, Chinese product stocks were
3.3 mb below a year ago at the same time. The fall in product stocks could be due to
lower refinery output. All products dropped, with the bulk of the fall coming from diesel
oil, which declined by 2.4 mb to end November at 53.9 mb. Both gasoline and
88
OPEC Monthly Oil Market Report – January 2015
Stock Movements
kerosene inventories indicated a drop of 0.3 mb, finishing November at 55.6 mb and
13.7 mb, respectively.
Table 9.5: China’s commercial oil stocks, mb
Crude oil
Gasoline
Diesel
Jet kerosene
Total products
Total
Sep 14
267.0
59.0
59.3
15.8
134.0
Oct 14
265.1
55.8
56.3
14.0
126.2
Nov 14
260.2
55.6
53.9
13.7
123.1
Change
Nov 14/Oct 14
-4.9
-0.3
-2.4
-0.3
-3.0
Nov 13
231.3
55.1
59.0
12.4
126.5
401.1
391.3
383.4
-7.9
357.8
Source: OPEC Secretariat analysis.
Singapore and Amsterdam-Rotterdam-Antwerp (ARA)
At the end of November, product stocks in Singapore fell by 3.0 mb following a slight
drop the previous month to stand at 39.1 mb. At this level, product stocks in Singapore
indicated a surplus of 1.0 mb or 2.6% over the same period the previous year. All
products indicated a drop, with the bulk of the fall coming from fuel oil stocks.
Residual fuel oil stocks fell by 2.6 mb in November to stand 16.8 mb. At this level,
residual fuel oil stocks stood at 3.7 mb or 18.1% below the same period one year
earlier. Lower residual fuel oil imports to Singapore were the main driver behind the
drop in fuel oil stocks.
Both light and middle distillates fell by 0.2 mb in November. At 11.1 mb, light
distillate stocks stood at 0.7 mb or 7.1% above the same time a year ago. Middle
distillate stocks ended November at 11.2 mb indicating a surplus of 4.0 mb or nearly
50% above a year earlier at the same time.
Product stocks in ARA fell slightly by 0.7 mb in November, following a drop of 2.6 mb
in October to stand at 33.7 mb. Despite this stock draw, product stocks in ARA stood at
7.5 mb or 28.5% above a year ago at the same time. Within products, the picture was
mixed; naphtha and fuel oil went up, while gasoline, jet fuel oil and gasoil witnessed a
drop.
Gasoline stocks fell by 0.7 mb to stand at 3.7 mb, which is 1.8 mb or 33% lower than in
the same period a year earlier. Gasoil also fell by 1.2 mb for the second month, ending
November at 18.8 mb. Despite this stock draw, they remained 6.4 mb or 50% higher
than the same period one year earlier. The fall in gasoil inventories could be attributed
to some improvement in regional demand. Jet fuel oil stocks also fell by 0.4 mb,
ending November at 4.3 mb, which is 1.3 mb or 41% higher than a year ago at the
same time. In contrast, residual fuel oil and naphtha stocks rose by 0.7 mb and
0.8 mb, respectively. At 4.4 mb, residual fuel oil stocks are 0.2 mb or 5.2% less than a
year ago at the same time. Naphtha stocks stood at 2.5 mb at the end of November,
nearly three times the level experienced in November 2013.
OPEC Monthly Oil Market Report – January 2015
89
Balance of Supply and Demand
Balance of Supply and Demand
Demand for OPEC crude in 2014 was revised down by 0.2 mb/d from the previous
report to stand at 29.1 mb/d, which is 1.2 mb/d lower than the 2013 level. In 2015,
demand for OPEC crude was also revised down by 0.1 mb/d to stand at
28.8 mb/d, representing a decline of 0.3 mb from the estimated 2014 level.
Estimate for 2014
Demand for OPEC crude for 2014 was revised down by 0.2 mb/d from the previous
report, mainly reflecting an upward adjustment to non-OPEC supply. The first and
second quarters were revised down by 0.1 mb/d and 0.2 mb/d, respectively, while the
third and the fourth quarters were revised down by 0.4 mb/d each. Demand for
OPEC crude is estimated to be 29.1 mb/d in 2014, representing a decrease of 1.2 mb/d
from the 2013 level. The first and the second quarters are estimated to show a decline
of 1.0 mb/d and 1.9 mb/d, respectively, versus the same period one year ago. The third
quarter is estimated to decline by 1.2 mb/d while the fourth quarter is expected to fall
by 0.7 mb/d compared with the same quarter in 2013.
Table 10.1: Summarized supply/demand balance for 2014, mb/d
2013
90.20
1Q14
90.15
2Q14
90.00
3Q14
91.73
4Q14
92.69
2014
91.15
54.24
5.65
59.89
55.64
5.73
61.37
55.93
5.79
61.72
56.23
5.86
62.09
57.06
5.93
63.00
56.22
5.83
62.05
Difference (a-b)
30.31
28.79
28.28
29.65
29.70
29.11
OPEC crude oil production
Balance
30.20
-0.11
29.84
1.05
29.77
1.49
30.26
0.62
30.23
0.53
30.03
0.92
(a) World oil demand
Non-OPEC supply
OPEC NGLs and non-conventionals
(b) Total supply excluding OPEC crude
Totals may not add up due to independent rounding.
Forecast for 2015
The demand for OPEC crude in 2015 was also revised down by 0.1 mb/d to stand at
28.8 mb/d, which is 0.3 mb/d less than the estimated 2014 level. The first and second
quarter were revised down by 0.6 mb/d and 0.3 mb/d, respectively. In contrast, the
fourth quarter was revised up by 0.3 mb/d. The third quarter remained unchanged
compared with the previous report. The first and second quarters were expected to
decline by 1.0 mb/d and 0.5 mb/d, respectively, compared with the same period one
year earlier. The third quarter is projected to see negative growth of 0.1 mb/d, while the
fourth quarter is expected to increase by 0.3 mb/d.
Table 10.2: Summarized supply/demand balance for 2015, mb/d
(a) World oil demand
Non-OPEC supply
OPEC NGLs and non-conventionals
(b) Total supply excluding OPEC crude
2014
91.15
56.22
5.83
62.05
1Q15
91.33
57.69
5.89
63.58
2Q15
91.17
57.37
5.98
63.35
3Q15
92.92
57.30
6.08
63.38
4Q15
93.76
57.61
6.18
63.79
2015
92.30
57.49
6.03
63.52
Difference (a-b)
29.11
27.75
27.82
29.54
29.97
28.78
OPEC crude oil production
Balance
30.03
0.92
Totals may not add up due to independent rounding.
90
OPEC Monthly Oil Market Report – January 2015
Balance of Supply and Demand
Graph 10.1: Balance of supply and demand
mb/d
mb/d
31
31
30
30
29
29
28
28
27
27
26
26
1Q14
2Q14
3Q14
4Q14
OPEC crude production
OPEC Monthly Oil Market Report – January 2015
1Q15
2Q15
3Q15
4Q15
Required OPEC crude
91
Table 10.3: World oil demand and supply balance, mb/d
2011
2012
2013
1Q14
2Q14
3Q14
4Q14
2014
1Q15
2Q15
3Q15
4Q15
2015
OECD
46.4
45.9
46.0
45.7
44.9
45.8
46.5
45.7
45.7
44.9
45.8
46.4
45.7
Americas
24.0
23.6
24.1
23.9
23.8
24.4
24.7
24.2
24.1
23.9
24.6
24.9
24.4
Europe
14.3
13.8
13.6
13.0
13.5
13.7
13.4
13.4
12.9
13.4
13.6
13.3
13.3
World demand
Asia Pacific
8.2
8.5
8.3
8.8
7.7
7.7
8.4
8.1
8.8
7.6
7.6
8.2
8.0
DCs
27.3
28.3
29.0
29.3
29.7
30.3
29.7
29.8
30.1
30.5
31.2
30.6
30.6
FSU
4.3
4.4
4.5
4.4
4.2
4.6
4.9
4.5
4.4
4.3
4.7
5.0
4.6
Other Europe
0.6
0.6
0.6
0.6
0.6
0.6
0.7
0.7
0.6
0.6
0.6
0.7
0.7
China
9.4
9.7
10.1
10.1
10.6
10.3
10.8
10.4
10.4
10.9
10.6
11.1
10.8
88.1
89.0
90.2
90.2
90.0
91.7
92.7
91.2
91.3
91.2
92.9
93.8
92.3
OECD
20.2
21.1
22.2
23.4
23.8
24.0
24.5
23.9
24.9
24.9
24.9
25.3
25.0
Americas
15.5
16.7
18.1
19.2
19.8
20.1
20.4
19.9
20.7
20.8
20.9
21.1
20.9
4.1
3.8
3.6
3.8
3.5
3.4
3.6
3.6
3.7
3.5
3.4
3.6
3.6
(a) Total world demand
Non-OPEC supply
Europe
Asia Pacific
0.6
0.6
0.5
0.5
0.5
0.5
0.5
0.5
0.5
0.5
0.5
0.5
0.5
DCs
12.6
12.1
12.1
12.2
12.2
12.3
12.5
12.3
12.7
12.5
12.4
12.3
12.5
FSU
13.2
13.3
13.4
13.5
13.4
13.4
13.5
13.4
13.5
13.4
13.3
13.4
13.4
Other Europe
0.1
0.1
0.1
0.1
0.1
0.1
0.1
0.1
0.1
0.1
0.1
0.1
0.1
China
4.1
4.2
4.2
4.2
4.3
4.2
4.3
4.2
4.3
4.3
4.3
4.4
4.3
Processing gains
2.1
2.1
2.1
2.2
2.2
2.2
2.2
2.2
2.2
2.2
2.2
2.2
2.2
52.4
52.9
54.2
55.6
55.9
56.2
57.1
56.2
57.7
57.4
57.3
57.6
57.5
5.4
5.6
5.6
5.7
5.8
5.9
5.9
5.8
5.9
6.0
6.1
6.2
6.0
(b) Total non-OPEC supply
and OPEC NGLs
57.8
58.4
59.9
61.4
61.7
62.1
63.0
62.0
63.6
63.3
63.4
63.8
63.5
OPEC crude oil production
(secondary sources)
29.8
31.1
30.2
29.8
29.8
30.3
30.2
30.0
Total supply
87.6
89.6
90.1
91.2
91.5
92.4
93.2
92.1
Balance (stock change and
miscellaneous)
-0.5
0.6
-0.1
1.1
1.5
0.6
0.5
0.9
Commercial
2,605
2,663
2,566
2,584
2,652
2,719
SPR
1,536
1,547
1,584
1,586
1,581
1,580
Total
4,141
4,210
4,150
4,170
4,233
4,298
825
879
909
954
914
952
Total non-OPEC supply
OPEC NGLs +
non-conventional oils
OECD closing stock levels (mb)
Oil-on-water
Days of forward consumption in OECD
Commercial onland stocks
57
58
56
58
58
58
SPR
33
34
35
35
35
34
Total
90
92
91
93
92
92
8.9
8.8
8.9
9.1
9.1
8.8
8.6
8.9
9.1
9.1
8.7
8.4
8.8
30.3
30.5
30.3
28.8
28.3
29.6
29.7
29.1
27.8
27.8
29.5
30.0
28.8
Memo items
FSU net exports
(a) - (b)
Note: Totals may not add up due to independent rounding.
92
OPEC Monthly Oil Market Report – January 2015
Table 10.4: World oil demand/supply balance: changes from last month's table* , mb/d
2011
2012
2013
1Q14
2Q14
3Q14
4Q14
2014
1Q15
2Q15
3Q15
4Q15
2015
-
-
-
-
-
-0.1
0.2
-
-
-
-
0.2
-
World demand
OECD
Americas
-
-
-
-
-
-
0.2
-
-
-
-
0.2
0.1
Europe
-
-
-
-
-
-
-
-
-
-
-
-
-
Asia Pacific
-
-
-
-
-
-
-
-
-
-
-
-
-
DCs
-
-
-
-
-
-
-0.1
-
-
-
-
-0.1
-
FSU
-
-
-
-
-
-
-
-
-
-
-
-
-
Other Europe
-
-
-
-
-
-
-
-
-
-
-
-
-
China
-
-
-
-
-
-
0.1
-
-
-
-
0.1
-
(a) Total world demand
-
-
-
-
-
-0.1
0.2
-
-
-
-
0.2
-
World demand growth
-
-
-
-
-
-0.1
0.2
-
-
-
-
-
-
-
-
-
-
0.1
0.3
0.3
0.2
0.4
0.1
-0.2
-0.2
-
Non-OPEC supply
OECD
Americas
-
-
-
-
0.1
0.3
0.3
0.2
0.4
0.1
-0.2
-0.2
-
Europe
-
-
-
-
-
-
-
-
-
-
-
-
-
Asia Pacific
-
-
-
-
-
-
-
-
-
-
-
-
-
DCs
-
-
-
-
-
-
0.1
-
0.1
0.1
0.1
0.1
0.1
FSU
-
-
-
-
-
-
0.1
-
0.1
0.1
0.1
-
0.1
Other Europe
-
-
-
-
-
-
-
-
-
-
-
-
-
China
-
-
-
-
-
-
-
-
-
-
-
-
-
Processing gains
-
-
-
-
-
-
-
-
-
-
-
-
-
Total non-OPEC supply
-
-
-
-
0.2
0.3
0.6
0.3
0.6
0.3
-
-0.1
0.2
Total non-OPEC supply
growth
-
-
-
-
0.1
0.3
0.5
0.3
0.5
0.2
-0.3
-0.7
-0.1
OPEC NGLs +
non-conventionals
-
-
-
-
-
-
-
-
-
-
-
-
-
(b) Total non-OPEC supply
and OPEC NGLs
-
-
-
-
0.2
0.3
0.6
0.3
0.6
0.3
-
-0.1
0.2
OPEC crude oil production
(secondary sources)
-
-
-
-
-
-
-
-
Total supply
-
-
-
-
0.2
0.3
-
-
Balance (stock change and
miscellaneous)
-
-
-
-
0.2
0.4
-
-
Commercial
-
-
1
1
1
-3
SPR
-
-
-
-
-
-3
Total
-
-
1
1
1
-6
-
-
-
-
-
-
OECD closing stock levels (mb)
Oil-on-water
Days of forward consumption in OECD
Commercial onland stocks
-
-
-
-
-
-
SPR
-
-
-
-
-
-
Total
-
-
-
-
-
-
FSU net exports
-
-
-
-
-
-
0.1
-
0.1
0.1
0.1
0.1
0.1
(a) - (b)
-
-
-
-0.1
-0.2
-0.4
-0.4
-0.2
-0.6
-0.3
-
0.3
-0.1
Memo items
* This compares Table 10.3 in this issue of the MOMR with Table 10.3 in the December 2014 issue.
This table shows only where changes have occurred.
OPEC Monthly Oil Market Report – January 2015
93
Table 10.5: OECD oil stocks and oil on water at the end of period
2011
2012
2013
3Q12
4Q12
1Q13
2Q13
3Q13
4Q13
1Q14
2Q14
3Q14
2,605
2,663
2,566
2,728
2,663
2,665
2,661
2,700
2,566
2,584
2,652
2,719
1,308
1,365
1,316
1,385
1,365
1,349
1,378
1,404
1,316
1,311
1,382
1,410
905
901
869
917
901
904
873
884
869
875
878
887
Closing stock levels, mb
OECD onland commercial
Americas
Europe
392
396
381
427
396
412
409
412
381
399
392
421
1,536
1,547
1,584
1,542
1,547
1,581
1,577
1,582
1,584
1,586
1,581
1,580
Americas
697
696
697
696
696
697
697
697
697
697
692
692
Europe
426
436
470
433
436
472
471
472
470
470
471
471
Asia Pacific
414
415
417
414
415
413
409
413
417
418
419
417
4,141
4,210
4,150
4,271
4,210
4,246
4,238
4,282
4,150
4,170
4,233
4,298
825
879
909
844
879
942
871
932
909
954
914
952
57
58
56
59
58
59
58
58
56
58
58
59
Americas
55
57
55
58
57
57
57
58
55
55
57
57
Europe
66
66
65
67
68
65
63
65
67
65
64
66
Asia Pacific
46
48
46
49
45
53
51
48
43
52
51
50
33
34
35
33
34
35
34
34
35
35
34
34
Americas
30
29
29
29
29
29
29
29
29
29
28
28
Europe
31
32
35
32
33
34
34
35
36
35
34
35
Asia Pacific
49
50
51
47
47
53
51
48
47
55
54
50
90
92
91
92
92
93
92
92
91
93
92
93
Asia Pacific
OECD SPR
OECD total
Oil-on-water
Days of forward consumption in OECD
OECD onland commercial
OECD SPR
OECD total
94
OPEC Monthly Oil Market Report – January 2015
Table 10.6: Non-OPEC supply and OPEC natural gas liquids, mb/d
US
Canada
Mexico
OECD Americas*
Norway
UK
Denmark
Other OECD Europe
OECD Europe
Australia
Other Asia Pacific
OECD Asia Pacific
Total OECD
Brunei
India
Indonesia
Malaysia
Thailand
Vietnam
Asia others
Other Asia
Argentina
Brazil
Colombia
Trinidad & Tobago
L. America others
Latin America
Bahrain
Oman
Syria
Yemen
Middle East
Chad
Congo
Egypt
Equatorial Guinea
Gabon
South Africa
Sudans
Africa other
Africa
Total DCs
FSU
Russia
Kazakhstan
Azerbaijan
FSU others
Other Europe
China
2011 2012 2013
9.0 10.0 11.2
3.5
3.8
4.0
2.9
2.9
2.9
15.5 16.7 18.1
2.0
1.9
1.8
1.1
1.0
0.9
0.2
0.2
0.2
0.7
0.7
0.7
4.1
3.8
3.6
0.5
0.4
0.5
0.1
0.1
0.1
0.6
0.6
0.5
20.2 21.1 22.2
0.2
0.2
0.1
0.9
0.9
0.9
1.0
1.0
0.9
0.7
0.7
0.7
0.3
0.4
0.4
0.4
0.4
0.4
0.2
0.2
0.2
3.6
3.7
3.6
0.7
0.7
0.7
2.6
2.6
2.6
0.9
1.0
1.0
0.1
0.1
0.1
0.3
0.3
0.3
4.7
4.7
4.8
0.2
0.2
0.2
0.9
0.9
0.9
0.2
0.1
0.4
0.2
0.2
0.1
1.7
1.5
1.4
0.1
0.1
0.1
0.3
0.3
0.3
0.7
0.7
0.7
0.3
0.3
0.3
0.3
0.2
0.2
0.2
0.2
0.2
0.4
0.1
0.2
0.3
0.3
0.3
2.6
2.3
2.4
12.6 12.1 12.1
13.2 13.3 13.4
10.3 10.4 10.5
1.6
1.6
1.6
1.0
0.9
0.9
0.4
0.4
0.4
0.1
0.1
0.1
4.1
4.2
4.2
3Q14 4Q14 2014
13.2 13.4 12.9
4.2
4.2
4.2
2.8
2.7
2.8
20.1 20.4 19.9
1.9
1.9
1.9
0.7
0.8
0.9
0.2
0.2
0.2
0.7
0.7
0.7
3.4
3.6
3.6
0.4
0.4
0.4
0.1
0.1
0.1
0.5
0.5
0.5
24.0 24.5 23.9
0.1
0.1
0.1
0.9
0.9
0.9
0.9
0.9
0.9
0.7
0.7
0.7
0.4
0.4
0.4
0.4
0.4
0.4
0.2
0.2
0.2
3.5
3.5
3.5
0.7
0.7
0.7
3.0
3.1
2.9
1.0
1.0
1.0
0.1
0.1
0.1
0.3
0.3
0.3
5.1
5.2
5.0
0.2
0.2
0.2
1.0
0.9
0.9
0.0
0.0
0.0
0.1
0.1
0.1
1.4
1.3
1.3
0.1
0.1
0.1
0.3
0.3
0.3
0.7
0.7
0.7
0.3
0.3
0.3
0.2
0.2
0.2
0.1
0.1
0.1
0.3
0.3
0.3
0.3
0.3
0.3
2.4
2.4
2.4
12.3 12.5 12.3
13.4 13.5 13.4
10.5 10.7 10.6
1.6
1.6
1.6
0.9
0.8
0.9
0.4
0.4
0.4
0.1
0.1
0.1
4.2
4.3
4.2
Change
Change
14/13 1Q15 2Q15 3Q15 4Q15 2015
15/14
1.6 13.6 13.8 13.9 13.9 13.8
1.0
0.2
4.3
4.3
4.3
4.5
4.3
0.2
2.7
-0.1
2.7
2.7
2.7
2.7
-0.1
1.7 20.7 20.8 20.9 21.1 20.9
1.0
0.0
2.0
1.9
1.8
2.0
1.9
0.0
0.0
0.9
0.8
0.8
0.9
0.8
0.0
0.0
0.2
0.2
0.2
0.2
0.2
0.0
0.0
0.7
0.7
0.7
0.7
0.7
0.0
0.0
0.0
3.7
3.5
3.4
3.6
3.6
0.0
0.4
0.5
0.4
0.4
0.4
0.0
0.0
0.1
0.1
0.1
0.1
0.1
0.0
0.0
0.5
0.5
0.5
0.5
0.5
0.0
1.7 24.9 24.9 24.9 25.3 25.0
1.1
0.0
0.1
0.1
0.1
0.1
0.1
0.0
0.0
0.9
0.9
0.9
0.9
0.9
0.0
0.0
0.9
0.9
0.9
0.9
0.9
0.0
0.0
0.7
0.7
0.7
0.7
0.7
0.0
0.0
0.4
0.4
0.4
0.4
0.4
0.0
0.0
0.4
0.4
0.4
0.3
0.4
0.0
0.0
0.2
0.3
0.3
0.3
0.3
0.0
-0.1
3.6
3.6
3.5
3.5
3.5
0.0
0.0
0.7
0.7
0.7
0.7
0.7
0.0
0.3
3.1
3.0
3.1
3.0
3.1
0.2
0.0
1.0
1.0
1.0
1.0
1.0
0.0
0.0
0.1
0.1
0.1
0.1
0.0
0.1
0.0
0.4
0.3
0.3
0.3
0.3
0.0
0.2
5.2
5.2
5.2
5.1
5.2
0.1
0.0
0.2
0.2
0.2
0.2
0.2
0.0
0.0
0.9
0.9
0.9
0.9
0.9
0.0
0.0
0.0
0.0
0.0
0.0
0.0
0.0
0.0
0.1
0.1
0.1
0.1
0.1
0.0
0.0
1.4
1.4
1.3
1.3
1.3
0.0
0.0
0.1
0.1
0.1
0.1
0.1
0.0
0.0
0.3
0.3
0.3
0.3
0.3
0.0
0.0
0.7
0.7
0.7
0.7
0.7
0.0
0.0
0.3
0.3
0.3
0.3
0.3
0.0
0.2
0.2
0.2
0.2
0.2
0.0
0.0
0.0
0.2
0.1
0.1
0.1
0.1
0.0
0.1
0.3
0.3
0.3
0.3
0.3
0.0
0.0
0.3
0.3
0.3
0.3
0.3
0.0
0.0
2.5
2.4
2.4
2.4
2.4
0.0
0.2 12.7 12.5 12.4 12.3 12.5
0.2
0.0 13.5 13.4 13.3 13.4 13.4
0.0
0.1 10.6 10.6 10.5 10.5 10.6
0.0
0.0
0.0
1.6
1.6
1.6
1.6
1.6
0.0
0.9
0.8
0.8
0.8
0.8
0.0
0.0
0.4
0.4
0.4
0.4
0.4
0.0
0.0
0.1
0.1
0.1
0.1
0.1
0.0
0.0
4.3
4.3
4.3
4.4
4.3
0.1
Non-OPEC production
50.3
50.7
52.1
54.1
54.9
54.1
1.9
55.5
55.2
55.1
55.4
55.3
1.3
Processing gains
Non-OPEC supply
OPEC NGL
OPEC non-conventional
OPEC (NGL+NCF)
Non-OPEC &
OPEC (NGL+NCF)
2.1
52.4
5.2
0.1
5.4
2.1
52.9
5.4
0.2
5.6
2.1
54.2
5.4
0.2
5.6
2.2
56.2
5.6
0.3
5.9
2.2
57.1
5.7
0.3
5.9
2.2
56.2
5.6
0.3
5.8
0.0
2.0
0.2
0.0
0.2
2.2
57.7
5.6
0.3
5.9
2.2
57.4
5.7
0.3
6.0
2.2
57.3
5.8
0.3
6.1
2.2
57.6
5.9
0.3
6.2
2.2
57.5
5.8
0.3
6.0
0.0
1.3
0.2
0.0
0.2
57.8
58.4
59.9
62.1
63.0
62.0
2.2
63.6
63.3
63.4
63.8
63.5
1.5
* Chile has been included in OECD Americas.
Note: Totals may not add up due to independent rounding.
OPEC Monthly Oil Market Report – January 2015
95
Table 10.7: World Rig Count
US
Canada
Mexico
2010 2011 2012 2013
1,541 1,881 1,919 1,761
347 423 366 354
97
Americas
94
106
106
1,985 2,398 2,391 2,221
78
79
72
-7
-170 2,400 2,140 2,374 2,396
2,425
2,327
-98
17
14
-3
20
17
87
18
85
UK
19
16
18
17
-1
15
17
15
17
17
20
3
Europe
94
118
119
135
16
135
146
148
148
149
146
-3
21
17
24
27
3
28
27
25
25
26
24
-2
-151 2,563 2,314 2,547 2,569
2,600
2,497
-103
2
2,100 2,532 2,534 2,383
2
93
18
Asia Pacific
17
0
Change
Dec/Nov
-44
-47
Norway
Total OECD
17
Change
13/12 1Q14 2Q14 3Q14 4Q14 Nov 14 Dec 14
-158 1,780 1,852 1,904 1,912
1,925
1,881
-12
526
202
385
406
421
374
15
16
Other Asia
248
239
217
219
2
230
221
231
229
229
231
Latin America
205
195
180
166
-14
164
176
174
174
175
177
2
Middle East
156
104
110
76
-33
84
85
82
79
81
77
-4
Africa
Total DCs
Non-OPEC rig count
Algeria
Angola
19
2
7
16
9
27
30
24
29
31
31
0
628
540
513
477
-36
504
512
511
511
516
516
0
-187 3,067 2,826 3,058 3,080
3,116
3,013
-103
-2
2,727 3,072 3,047 2,860
25
31
36
47
11
49
46
48
48
51
49
9
10
9
11
2
16
16
14
14
13
14
1
Ecuador
11
12
20
26
6
25
25
26
21
19
18
-1
Iran**
52
54
54
54
0
54
54
54
54
54
54
0
Iraq**
36
36
58
83
25
89
93
75
59
60
61
1
Kuwait**
20
57
57
58
1
60
60
68
69
69
71
2
Libya**
16
8
12
15
3
15
10
8
8
9
7
-2
Nigeria
15
36
36
37
1
35
31
32
36
38
37
-1
Qatar
9
8
8
9
1
11
11
11
10
9
9
0
Saudi Arabia
67
100
112
114
3
125
132
137
143
143
146
3
UAE
13
21
24
28
4
30
33
37
38
39
38
-1
Venezuela
70
122
117
121
3
121
114
122
106
102
102
0
342
494
542
602
60
629
624
631
605
606
606
0
3,069 3,566 3,589 3,462
-127 3,696 3,450 3,689 3,685
3,722
3,619
-103
Oil
1,701 2,257 2,654 2,611
-43 2,819 2,687 2,851 2,820
2,850
2,748
-102
Gas
1,325 1,262
OPEC rig count
Worldwide rig count*
of which:
Others
43
49
886
746
-140
780
671
744
776
784
782
-2
52
109
57
99
95
96
91
90
90
0
Note:
Totals may not add up due to independent rounding.
na:
Not available.
Sources: Baker Hughes Incorporated & Secretariat's estimates.
96
* Excludes China and FSU.
** Estimated figure when Baker Hughes Incorporated did
not reported the data.
OPEC Monthly Oil Market Report – January 2015
Contributors to the OPEC Monthly Oil Market Report
Editor-in-Chief
Omar S. Abdul-Hamid, Director, Research Division
email: [email protected]
Editor
Hojatollah Ghanimi Fard, Head, Petroleum Studies Department
email: [email protected]
Analysts
Crude Oil Price Movements
Eissa Alzerma
email: [email protected]
Commodity Markets
Hector Hurtado
email: [email protected]
World Economy
Afshin Javan
email: [email protected]
Imad Alam Al-Deen
email: [email protected]
Joerg Spitzy
email: [email protected]
World Oil Demand
Hassan Balfakeih
email: [email protected]
World Oil Supply
Mohammad Ali Danesh
email: [email protected]
Product Markets and Refinery Operations
Elio Rodriguez
email: [email protected]
Tanker Market and Oil Trade
Anisah Almadhayyan
email: [email protected]
Stock Movements
Aziz Yahyai
email: [email protected]
Technical and editorial team
Aziz Yahyai
email: [email protected]
Douglas Linton
email: [email protected]
Data services
Adedapo Odulaja, Head, Data Services Department ([email protected]),
Hossein Hassani, Statistical Systems Coordinator ([email protected]),
Pantelis Christodoulides (World Oil Demand and Stock Movements),
Klaus Stoeger (World Oil Supply), Harvir Kalirai (World Economy),
Mouhamad Moudassir (Product Markets and Refinery Operations),
Mohammad Sattar (Crude Oil Price Movements),
Anna Gredinger (Tanker Market and Oil Trade)
Editing, production, design and circulation
Alvino-Mario Fantini, Maureen MacNeill, Scott Laury, Viveca Hameder,
Hataichanok Leimlehner, Evelyn Oduro-Kwateng, Andrea Birnbach
OPEC Monthly Oil Market Report – January 2015
97
Disclaimer
The data, analysis and any other information contained in the Monthly Oil Market Report (the
“MOMR”) is for informational purposes only and is not intended as a substitute for advice from
your business, finance, investment consultant or other professional. The views expressed in the
MOMR are those of the OPEC Secretariat and do not necessarily reflect the views of its
Governing Bodies and/or individual OPEC Member Countries.
Whilst reasonable efforts have been made to ensure the accuracy of the MOMR’s content, the
OPEC Secretariat makes no warranties or representations as to its accuracy, currency
reference or comprehensiveness, and assumes no liability or responsibility for any inaccuracy,
error or omission, or for any loss or damage arising in connection with or attributable to any
action or decision taken as a result of using or relying on the information in the MOMR.
The MOMR may contain references to material(s) from third parties whose copyright must be
acknowledged by obtaining necessary authorization from the copyright owner(s). The OPEC
Secretariat shall not be liable or responsible for any unauthorized use of third party material(s).
All rights of the Publication shall be reserved to the OPEC Secretariat, including every exclusive
economic right, in full or per excerpts, with special reference but without limitation, to the right to
publish it by press and/or by any communications medium whatsoever, including Internet;
translate, include in a data base, make changes, transform and process for any kind of use,
including radio, television or cinema adaptations, as well as sound-video recording, audio-visual
screenplays and electronic processing of any kind and nature whatsoever.
Full reproduction, copying or transmission of the MOMR is not permitted in any form or by any
means by third parties without the OPEC Secretariat’s written permission, however the
information contained therein may be used and/or reproduced for educational and other noncommercial purposes without the OPEC Secretariat’s prior written permission, provided that
OPEC is fully acknowledged as the copyright holder.
98
OPEC Monthly Oil Market Report – January 2015
OPEC Basket average price
US$/b
down 16.11 in December
December 2014
59.46
November 2014
75.57
Year 2014
96.29
December OPEC crude production
up 0.14 in December
mb/d, according to secondary sources
December 2014
30.20
November 2014
30.06
Economic growth rate
per cent
World
OECD
US
Japan
Euro-zone
China
India
2014
3.2
1.8
2.4
0.2
0.9
7.4
5.5
2015
3.6
2.2
2.9
1.2
1.2
7.2
5.8
Supply and demand
2014
mb/d
14/13
2015
15/14
World demand
91.2
1.0
World demand
92.3
1.2
Non-OPEC supply
56.2
2.0
Non-OPEC supply
57.5
1.3
5.8
0.2
OPEC NGLs
6.0
0.2
29.1
–1.2
28.8
–0.3
OPEC NGLs
Difference
Difference
OECD commercial stocks
mb
Sep 14
Oct 14
Nov 14
Nov 14/Oct 14
Oct 13
Crude oil
1,303
1,335
1,320
–15.3
1,287
Products
1,415
1,385
1,390
5.3
1,325
Total
2,719
2,720
2,710
–10.0
2,612
58.7
59.1
58.7
–0.4
56.6
Days of forward cover
Next report to be issued on 9 February 2015.


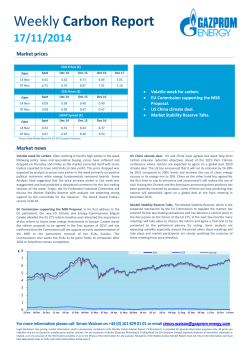


© Copyright 2026