
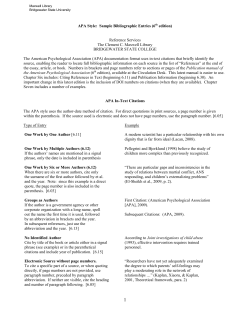
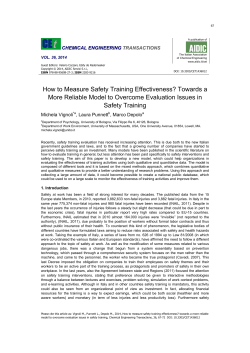
Full Text - Proceedings of the Royal Society B
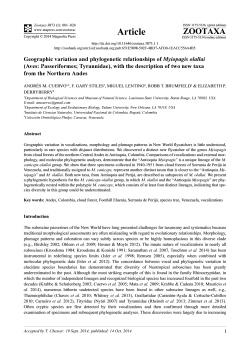
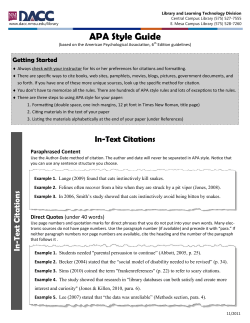
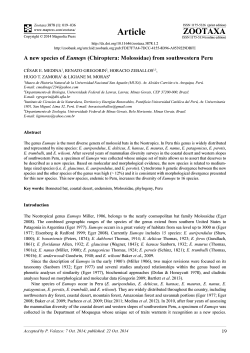
Downloaded from http://rspb.royalsocietypublishing.org/ on January 21, 2015
rspb.royalsocietypublishing.org
A phylogenetic backbone for Bivalvia: an
RNA-seq approach
Research
Vanessa L. Gonza´lez1,†, So´nia C. S. Andrade1,‡, Ru¨diger Bieler2,
Timothy M. Collins3, Casey W. Dunn4, Paula M. Mikkelsen5,
John D. Taylor6 and Gonzalo Giribet1
Cite this article: Gonza´lez VL, Andrade SCS,
Bieler R, Collins TM, Dunn CW, Mikkelsen PM,
Taylor JD, Giribet G. 2015 A phylogenetic
backbone for Bivalvia: an RNA-seq approach.
Proc. R. Soc. B 282: 20142332.
http://dx.doi.org/10.1098/rspb.2014.2332
Received: 20 September 2014
Accepted: 11 December 2014
Subject Areas:
taxonomy and systematics, evolution
Keywords:
phylogenomics, mollusca, bivalves,
phylogenetics
Author for correspondence:
Gonzalo Giribet
e-mail: [email protected]
1
Museum of Comparative Zoology, Department of Organismic and Evolutionary Biology, Harvard University,
Cambridge, MA 02138, USA
2
Integrative Research Center, Field Museum of Natural History, Chicago, IL 60605, USA
3
Department of Biological Sciences, Florida International University, Miami, FL 33199, USA
4
Department of Ecology and Evolutionary Biology, Brown University, Providence, RI 02912, USA
5
Paleontological Research Institution and Department of Earth and Atmospheric Sciences, Cornell University,
Ithaca, NY 14850, USA
6
Department of Life Sciences, The Natural History Museum, London SW7 5BD, UK
Bivalves are an ancient and ubiquitous group of aquatic invertebrates with an
estimated 10 000–20 000 living species. They are economically significant as a
human food source, and ecologically important given their biomass and
effects on communities. Their phylogenetic relationships have been studied
for decades, and their unparalleled fossil record extends from the Cambrian
to the Recent. Nevertheless, a robustly supported phylogeny of the deepest
nodes, needed to fully exploit the bivalves as a model for testing macroevolutionary theories, is lacking. Here, we present the first phylogenomic approach
for this important group of molluscs, including novel transcriptomic data for
31 bivalves obtained through an RNA-seq approach, and analyse these data
with published genomes and transcriptomes of other bivalves plus outgroups.
Our results provide a well-resolved, robust phylogenetic backbone for Bivalvia with all major lineages delineated, addressing long-standing questions
about the monophyly of Protobranchia and Heterodonta, and resolving the
position of particular groups such as Palaeoheterodonta, Archiheterodonta
and Anomalodesmata. This now fully resolved backbone demonstrates that
genomic approaches using hundreds of genes are feasible for resolving
phylogenetic questions in bivalves and other animals.
1. Introduction
†
Present address: Department of Invertebrate
Zoology, National Museum of Natural History,
Smithsonian Institution, Washington,
DC 20013, USA.
‡
Present address: Departamento de Zootecnia,
ESALQ-USP, Piracicaba, SP 13418-900, Brazil.
Electronic supplementary material is available
at http://dx.doi.org/10.1098/rspb.2014.2332 or
via http://rspb.royalsocietypublishing.org.
Among the most important groups of invertebrates are bivalves, a clade of molluscs of extraordinary impact on human endeavours, even in the biomedical field
[1,2]. For example, bivalves are a source of animal protein for humans, and major
commercial fisheries have long existed worldwide. The world production of
bivalves (i.e. oysters, clams, cockles, scallops and mussels) has been steadily
increasing since the 1990s to reach 13.6 million metric tonnes (mt) in 2005, comprising about 2.3% of the total world export of fisheries products [3].
Ecologically, owing to their filter-feeding habits, bivalves are major players in
coastal ecosystems and reefs, and they constitute one of the dominant groups
of macrofauna in the deep sea [4]. It is thus not surprising that many scholars
have tried to understand bivalve relationships, using shell morphology and anatomy [5–13], fossils [14–17], and, more recently, molecular sequence data
[12,13,18–21]. The most recent of these studies incorporates novel morphological
and molecular sequence data from up to nine molecular markers [13], and largely
complements prior studies. This later study agrees with prior ones on many key
aspects of bivalve phylogeny, including monophyly of the crown group Bivalvia,
monophyly of the bivalves with enlarged and complex gills (Autobranchia), and
& 2015 The Authors. Published by the Royal Society under the terms of the Creative Commons Attribution
License http://creativecommons.org/licenses/by/4.0/, which permits unrestricted use, provided the original
author and source are credited.
Downloaded from http://rspb.royalsocietypublishing.org/ on January 21, 2015
(a) Taxon sampling
Transcriptome data were obtained for 40 molluscan taxa, including
31 newly sequenced bivalve transcriptomes that had been selected
based on prior studies [13,20,25] to maximize the diversity of
living bivalve lineages (electronic supplementary material, table
S1). Full genome data were included for the gastropod Lottia gigantea
[33] and for the pteriomorphian Pinctada fucata [34]. All six major
bivalve lineages were represented by at least two species: Protobranchia (3), Pteriomorphia (6), Palaeoheterodonta (3), Archiheterodonta
(3), Anomalodesmata (2) and Imparidentia (17). Tissues were preserved in three ways for RNA work: (i) flash-frozen in liquid
nitrogen and immediately stored at 2808C; (ii) immersed in at
least 10 volumes of RNAlater (Ambion) and frozen at 2808C or
2208C; (iii) transferred directly into Trizol reagent (Invitrogen,
Carlsbad, CA) and immediately stored at 2808C.
(b) RNA isolation and mRNA extraction
Total RNA was extracted using standard protocols. Following
mRNA purification, samples were treated with Ambion turbo
DNA-free DNase to remove residual genomic and rRNA contaminants. Quantity and quality (purity and integrity) of mRNA were
assessed using a NanoDrop ND-1000 UV spectrophotometer
(c) Next-generation sequencing
Next-generation sequencing (NGS) was carried out using the
Illumina HiSeq 2000 platform (Illumina Inc., San Diego, CA) at
the FAS Center for Systems Biology at Harvard University.
After mRNA extraction, SuperScript III reverse transcriptase
was used to amplify cDNA gene products. cDNA was ligated
to Illumina TruSeq RNA multiplex adaptor sequences using
the TruSeq RNA sample prep kit (Illumina). No more than six
adaptors were used per individual multiplexed sequencing
run. Size-selected cDNA fragments of 250– 350 bp excised from
a 2% agarose gel were amplified using Illumina PCR primers
for paired-end reads (Illumina), and 15 cycles of the PCR programme comprising 988C for 30 s, 988C for 10 s, 658C for 30 s
and 728C for 30 s, followed by an extension step of 5 min at 728C.
The concentration of the cDNA libraries was measured with
the qubit dsDNA high-sensitivity (HS) assay kit using the qubit
fluoremeter (Invitrogen). The quality of the library and size selection was checked using the HS DNA assay in a DNA chip for
Agilent Bioanalyzer 2100 (Agilent Technologies). Concentrations
of sequencing runs were normalized based on final concentrations
of fragmented cDNA. Illumina sequenced paired-end reads were
101 bp. Raw read sequence data have been deposited in NCBI’s
sequence read archive (SRA) database: BioProject PRJNA242872.
(d) Data processing
Illumina HiSeq 2000 pair-end reads obtained ranged from 7 867 647
to 51 464 822 per taxon. Data (unprocessed reads) obtained from the
SRA database (http://www.ncbi.nlm.nih.gov/sra) were downloaded as raw reads and processed in the same manner as the
newly generated transcriptome data. Quality of reads was visualized with FastQC (http://www.bioinformatics.bbsrc.ac.uk/
projects/fastqc). Initial removal of low-quality reads and TruSeq
multiplex index adaptor sequences (Illumina) was performed
with TRIM GALORE! v. 0.3.1 (http://www.bioinformatics.babraham.ac.uk/projects/trim_galore), setting the quality threshold to
minimum Phred score of 30. Illumina TruSeq multiplex adaptor
sequences were trimmed, specific to the adaptor used in sequencing
with the paired-end data flag. A second round of quality threshold
filtering (minimum Phred 35) as well as removal of rRNA sequence
contamination was conducted in AGALMA v. 0.3.2 using the
‘pre-assemble’ pipeline [35].
(e) De novo assembly
Quality-filtered and sanitized high-quality reads (electronic supplementary material, table S1) were assembled with the Trinity
de novo Assembler (release 13 07 2011) with 100 GB of
memory and a path reinforcement distance of 50 [36]. The
number of contigs, the mean contig length, the N50 and the
maximum contig length were reported for each de novo assembly
(electronic supplementary material, table S1). Contigs were
mapped against the Swissprot database using the BLASTX program
of the BLAST suite, and the number of contigs returning blast
hits was quantified (electronic supplementary material, table
S1). All nucleotide sequences were translated with TRANSDECODER
using default parameters [37]. Subsequent peptide translations
were filtered for redundancy and uniqueness using CD-HIT
v. 4.6.1 under default parameters, and a 95% similarity threshold
[38]. Genome data from Lottia gigantea and Pinctada fucata were
incorporated using predicted peptide sequences obtained from
public sources. Predicted peptides were further processed, selecting only one peptide per putative unigene, by choosing the
2
Proc. R. Soc. B 282: 20142332
2. Material and methods
(ThermoFisher Scientific, Wilmington, MA). Quantity of mRNA
was also assessed by qubit fluorometer (Invitrogen) and using an
Agilent Bioanalyzer 2100 system with the ‘mRNA pico series II’
assay (Agilent Technologies, Santa Clara, CA).
rspb.royalsocietypublishing.org
the division of Autobranchia into the clades Pteriomorphia,
Palaeoheterodonta and Heterodonta. The clade Heteroconchia
(consisting of Palaeoheterodonta, Archiheterodonta and Euheterodonta) is likewise broadly supported in recent molecular
analyses [13]. However, recent molecular data based on mitochondrial genes [21–24] have proposed relationships that are
at odds with previously published work based on ribosomal
genes and morphology, and with more recent phylogenetic
work based on nuclear genes [20].
This increasing resolution of bivalve relationships (excepting the mitochondrial studies) is certainly encouraging [13],
but several key questions remain debated. One of these is the
monophyly of Protobranchia, a group of bivalves with primitive ctenidia, comprising many deep-sea species, whose
relationships were recently reviewed [25]. Although traditionally considered one of the subclasses of bivalves, several
molecular analyses have found paraphyly of protobranchs
with respect to Autobranchia (see a summary of hypotheses
in [25]). Monophyly of its three main groups (Solemyida, Nuculida and Nuculanida) was, however, recently supported in a
large analysis using a phylogenomic approach [26]. Another
recalcitrant issue concerns the relationships among the heteroconchian lineages, Palaeoheterodonta, Archiheterodonta and
Euheterodonta. The traditional view places Palaeoheterodonta
as sister group to Heterodonta, composed of Archiheterodonta
and Euheterodonta [11,12]. However, molecular analyses have
also supported a divergence of Archiheterodonta prior to the
split of Palaeoheterodonta and Euheterodonta [13], or even a
clade composed of Archiheterodonta and Palaeoheterodonta
[8,20]. Finally, although the monophyly of Pteriomorphia and
Euheterodonta, respectively, is largely undisputed, the internal
relationships of both groups remain poorly supported, despite
considerable phylogenetic effort for pteriomorphians [27–29]
and heterodonts [30–32]. Resolving these relationships is key
for further evolutionary and ecological studies using bivalves
as models, including dating and inference of the evolution of
lineages through time, to study extinction and diversification
patterns, and for using them as models for biogeography.
>75% occupancy
supermatrix 3
>50% occupancy
supermatrix 2
>37.5% occupancy
1377
3. Results and discussion
729
173
Maximum-likelihood tree searches on the three occupancy data
matrices were conducted with RAXML v. 7.2.7 [43]. Maximumlikelihood analyses in RAXML specified a model of protein evolution with corrections for a discrete gamma distribution with the
LG model [44] to conduct the tree searches, with 100 independent replicates. Bootstrap resampling was conducted for 100
replicates using a rapid bootstrapping algorithm [45] specifying
a model of protein evolution with corrections for a discrete
gamma distribution using the WAG model [46], and were thereafter mapped onto the optimal tree from the independent
searches. Concomitantly, tree searches were conducted for all
three data matrices in PHYLOBAYES MPI v. 1.4e [47] using the
site-heterogeneous CAT þ GTR model of evolution [48]. Four
independent chains were run for 5077– 28 310 cycles, and the
initial cycles discarded as burn-in were determined for each
analysis using the ‘tracecomp’ executable, with convergence
assessed using the maximum bipartition discrepancies across
chains (maxdiff , 0.3).
In order to quantify gene tree incongruence, visualizations of
the dominant bipartitions among individual loci (based on the
ML gene tree topologies) were conducted by constructing supernetworks using the SuperQ method selecting the ‘balanced’
edge-weight with ‘Gurobi’ optimization function, and applying
no filter [49]. This methodology decomposes all gene trees into
quartets to build supernetworks where edge lengths correspond
to quartet frequencies. Resulting supernetworks were visualized
in SPLITSTREE v. 4.13.1 [50]. Supernetworks were inferred for all
three datasets: (i) 1377 loci, (ii) 729 loci and (iii) 173 loci.
gene occupany
(g) Phylogenetic and gene tree analyses
1
species
Phylogenomic analyses to investigate animal relationships
have flourished in the past decade [51 –53], and a series of
tools, driven by NGS technologies, have increased dramatically the size of datasets applied to phylogenetic questions,
including molluscan relationships [26,54 –56]. It is within
this framework of combining NGS technologies and phylogenomic techniques that we decided to re-investigate the last
genes
(a) A phylogenomic dataset for bivalves
Proc. R. Soc. B 282: 20142332
Orthology assessment was conducted using OMA STANDALONE v.
0.99t [39,40], on 64 CPUs of a cluster at Harvard University, FAS
Research Computing (odyssey.fas.harvard.edu), using default
parameters, except with a minimum alignment score of 200, a
length tolerance ratio of 0.75 and a minimum sequence length
of 100. A total of 68 828 informative putative orthogroups
(more than four taxa) were obtained; orthogroups and genes
are referred to interchangeably. Resultant gene clusters were
aligned with MAFFT [41] prior to concatenation.
We constructed three phylogenetic supermatrices (figure 1)
from the translated amino acid sequences. Supermatrices were
constructed based on gene occupancy threshold filters—meaning
that a gene was selected if found in more than or equal to the
established threshold; a 50% threshold would select all genes
present in 50% or more of the included taxa. The more than
37.5%, 50% and 75% gene occupancy matrices were then
trimmed with GBLOCKS [42] to cull regions of dubious alignment
to be used in downstream phylogenetic reconstructions. Data
used in downstream analyses have been deposited in Dryad
(http://dx.doi.org/10.5061/dryad.v31ms).
Lottia gigantea
Corbicula fluminea
Ennucula tenuis
Solemya velum
Mytilus edulis
Mya arenaria
Arctica islandica
Lyonsia floridana
Neotrigonia margaritacea
Atrina rigida
Galeomma turtoni
Gadila tolmiei
Hiatella arctica
Greenland neomeniomorph
Lampsilis cardium
Arca noae
Placopecten magellanicus
Diplodonta sp.
Cardites antiquata
Cycladicama cumingi
Octopus vulgaris
Polymesoda caroliniana
Glossus humanus
Astarte sulcata
Chiton olivaceus
Mercenaria campechiensis
Myochama anomiodes
Sphaerium nucleus
Laevipilina hyalina
Lamychaena hains
Donacilla cornea
Margaritifera margaritifera
Eucrassatella cumingii
Pinctada fucata
Phacoides pectinata
Neocardia sp.
Cyrenoida floridana
Yoldia limatula
Cerastoderma edule
Lasea adansoni
(f ) Orthology assignment and matrix construction
3
rspb.royalsocietypublishing.org
supermatrix 1
longest isoform (i.e. longest ORF) per Trinity subcomponent
using a Python script.
Figure 1. Schematic of the three supermatrices analysed in this study: supermatrix 1 (white: .37.5% gene occupancy, 1377 genes, 46.1% missing data), supermatrix 2 (blue: .50% gene occupancy, 729 genes, 35.4% missing data),
supermatrix 3 ( pink: .75% gene occupancy, 173 genes, 16% missing data).
Downloaded from http://rspb.royalsocietypublishing.org/ on January 21, 2015
Downloaded from http://rspb.royalsocietypublishing.org/ on January 21, 2015
Transcriptomic-scale analyses of the three datasets (173 genes,
16% missing data; 729 genes, 35.4% missing data; to 1377
genes, 46.1% missing data) resulted in robust resolution and
stable relationships of all major bivalve lineages (see table 1),
corroborating some traditional results based on non-numerical
cladistic analyses of palaeontological and morphological data
[9,11,14] and recent phylogenetic analyses of bivalves. This
constitutes the most comprehensive phylogenetic dataset to
date for inferring deep relationships within Bivalvia, resulting
in robust support in all analyses for higher-level taxonomic
relationships for Bivalvia and its major lineages Autobranchia,
Heteroconchia and Heterodonta (figure 2; electronic
supplementary material, figure S1).
All phylogenetic analyses, irrespective of the data matrix
or the model of sequence evolution analysed, recovered
highly congruent topologies throughout Bivalvia, including
all currently recognized bivalve subclasses and their major
divisions (figure 2; table 1; electronic supplementary
material, figure S1)—the deep backbone of the bivalve tree.
Analysis of the three datasets recovered monophyly of Protobranchia, irrespective of the method or model of protein
evolution used, but the smallest matrix did not obtain maximum support for Protobranchia (96% bootstrap support;
posterior probability ¼ 0.99). Likewise, the supernetwork
representation of the gene trees, designed to demonstrate
putative gene conflict, shows a topology compatible with
that of the phylogenetic trees, although the edge separating
the outgroups, Protobranchia (red) and Pteriomorphia
(green), is short in this case (figure 3), therefore pointing at
some sort of discrepancy between some individual gene
trees and the concatenated datasets.
A major controversy in molecular studies of bivalve
relationships has been the relationships between three wellestablished clades within Heteroconchia: Palaeoheterodonta,
Archiheterodonta and Euheterodonta. Archiheterodonta
(c) Remaining gaps in our understanding of bivalve
relationships
Monophyly of Protobranchia was supported in previous
molluscan phylogenomic analyses [26,55], and in recent
Sanger-based molecular analyses of bivalves [13,20]. The
latest molecular analysis of protobranch relationships using
traditional molecular markers found it difficult to resolve the
4
Proc. R. Soc. B 282: 20142332
(b) Bivalve relationships resolved
and Euheterodonta have been traditionally grouped in the
subclass Heterodonta. Palaeoheterodonta includes two main
lineages: the diverse freshwater mussels (of conservation
importance) and the marine-living fossil Neotrigonia [57],
only known from Australian waters [58]. Archiheterodonta
includes three families of primitive, exclusively marine
asiphonate species [59]. Euheterodonta divides into Anomalodesmata—a group with unusual morphology prominent
in the deep-sea and including the only lineage of carnivorous
bivalves [60]—and Imparidentia [13], the latter including
some of the best-known bivalves and most of the commercial
species (excluding mussels, oysters and their relatives, which
are members of Pteriomorphia). A recent debate in the literature involved the resolution of these three heteroconchian
clades, with most traditional studies supporting the palaeontological view of an early branching of Palaeoheterodonta,
but some more recent molecular studies supporting either
an early split of Archiheterodonta, or a sister group relationship of Palaeoheterodonta and Archiheterodonta [13,20].
Our phylogenomic analyses recover the traditional monophyly of Heterodonta (Archiheterodonta as sister group to
Euheterodonta), and the DNA sequence-based division of
Euheterodonta into Anomalodesmata and Imparidentia, closing decades of debate in the bivalve literature. Gene tree
analyses identified some conflict here, but the edge separating Palaeoheterodonta (orange) from Archiheterodonta þ
Euheterodonta is longer than that placing Archiheterodonta
(navy blue) with Palaeoheterodonta (figure 3).
Internal resolution of Imparidentia has been difficult to clarify using traditional Sanger-based markers and morphology
[12,13,31,32], but many relationships find full support in all
our phylogenomic datasets, whether based on concatenation
or on gene trees. Salient resolved nodes include the sister
group relationship of Lamychaena hians (Gastrochaenidae) to
the non-lucinid Imparidentia, one of the most problematic
families to place in bivalve phylogenies [13] owing to the modifications imposed by their hard-substratum boring habits. The
relationship of Arctica islandica to Glossus humanus also receives
maximal support herein, as does the monophyly of Ungulinoidea (Cycladicama cumingi and Diplodonta sp.). One of the
best-supported imparidentian clades is Cyrenoidea (formerly
Corbiculoidea), a group here represented by Corbicula fluminea,
Cyrenoida floridana and Polymesoda caroliniana. Cyrenoidea, a
group of bivalves largely adapted to low-salinity environments,
had already found support in previous molecular analyses
[13,20,61], a finding here corroborated, and one that conflicts
with many traditional classifications of bivalves. The position
of all other Imparidentia is largely congruent with previous
hypotheses [13,20], and finds absolute support (100% bootstrap
and 1.00 posterior probability) in at least some of the analyses,
especially for the largest datasets. These include clades such as
Neoheterodontei [32], which receives maximal support from
the analyses of the two largest matrices, and many of its
subclades (figure 3).
rspb.royalsocietypublishing.org
major unresolved nodes in bivalve phylogeny and address
the specific questions of protobranch monophyly, the interrelationships of the heteroconchian lineages and the internal
relationships of Imparidentia—a clade composed of Myoida
and most of the former Veneroida [13]. We thus generated
a new dataset, entirely based on transcriptome and genome
data (electronic supplementary material, table S1), and constructed multiple matrices from 173 to 1377 genes, and with
a gene occupancy ranging between more than 37.5% and
more than 75% (see Material and methods; figure 1 and
table 1) to investigate these previously unresolved nodes of
the bivalve tree of life. These represent the largest (in
number of genes; up to 1377) and most complete (in terms
of gene occupancy; more than 84%) datasets applied to
resolving questions in molluscan relationships.
Concatenated supermatrices were compiled using a
threshold of percentage gene occupancy. The number of genes
present in each supermatrix varied by taxon, with the most
genes being represented in two protobranch taxa, Ennucula
tenuis and Solemya velum (figure 1). All three supermatrices contain data for all of the 40 species included in the study, though
taxa varied in gene representation (electronic supplementary
material, table S2). Taxa with the fewest parsed characters
were Cerastoderma edule and Yoldia limatula, with only 25.2%
and 23.6% of the total genes present in the largest supermatrix.
Downloaded from http://rspb.royalsocietypublishing.org/ on January 21, 2015
---
---
100 100 96
1 1 0.99
85 81 52
0.63 0.68 0.73
Protobranchia
Pteriomorpha
Bivalvia
98 100 100
-- -- -98 100 -1 1 0.98
Ennucula tenuis
Yoldia limatula
Neocardia sp.
Arca noae
Mytilus edulis
Placopecten magellanicus
Atrina rigida
Pinctada fucata
Autobranchia
Heteroconchia
Neotrigonia margaritacea
Lampsilis cardium
Margaritifera margaritifera
Cardites antiquata
Astarte sulcata
Eucrassatella cumingii
Palaeoheterodonta
Archiheterodonta
Lyonsia floridana
Anomalodesmata
Myochama anomioides
Phacoides pectinata
Euheterodonta
Lamychaena hians
Imparidentia
Hiatella arctica
100 100 94
Lasaea adansoni
1 1 ––
Galeomma turtoni
Cerastoderma edule
BS 1377 729 173
Sphaerium
nucleus
PP 1377 729 173
100 100 – –
1 1
1
Mya arenaria
100 100 – –
Donacilla cornea
100 100 100
1 1 ––
=
1.00 1.00 1.00
85 – – – –
Cycladicama cumingi
1 1 ––
Diplodonta sp.
100 – – 99
1 1 ––
Mercenaria campechiensis
100 100 – –
74 – – 89
1 1 ––
Glossus humanus
1 1 ––
gene occupancy per taxon
Arctica islandica
1377
100 100 99
Corbicula fluminea
1 1 ––
729
173
BL
Cyrenoida floridana
100 100 89
0.06
Polymesoda
caroliniana
1 1
1
Heterodonta
Neoheterodontei
Figure 2. Phylogenetic hypothesis based on the analysis of supermatrix 1 (.37.5% occupancy; 1377 genes; 231 823 amino acids; 46.6% missing data) under the
ML method and PROTGAMMALG model. The main bivalve lineages are illustrated in different colours and all taxonomic names used in the text are indicated at
different nodes. Circles in nodes indicate maximum support for all ML and PHYLOBAYES analyses; otherwise, the bootstrap support values and posterior probabilities are
indicated on each node. Circles on tips indicate the number of genes represented for each terminal for the three data matrices analysed. Likelihood scores for the
three supermatrices are: .37.5% 2lnL ¼ 3 858 777.48; .50% 2lnL ¼ 2 099 078.28; .75% 2lnL ¼ 517 419.93.
internal relationships of the major protobranch lineages (Solemyida, Nuculida and Nuculanida), but mostly retrieved a
sister group relationship of Nuculida and Nuculanida, with
Solemyida as their external clade [25]. This relationship is evident in all analyses for the three largest matrices studied here,
in which Nuculida and Nuculanida form a clade. However,
support for this relationship is low (figure 2), and gene conflict
is strong in this part of the tree (figure 3, red), although this
could be owing to the poor library quality for Yoldia limatula
(figures 1 and 2). Expanded taxon sampling may help to definitively resolve the internal relationships of the earliestbranching bivalve clade, but our approach nevertheless
resolves the monophyly of the clade with high support.
The relationships among some imparidentian families still
remain unclear, because this study was designed to test the
deep divergences among the main lineages of bivalves, and
not particular imparidentian families. This phylogenomic
approach, however, resolves several unsettled aspects of heterodont phylogeny, including the position of the previously
difficult to place Gastrochaenidae and Cardiidae, and supporting several groups, including Neoheterodontei, bringing great
promise on how to investigate relationships among the bivalve
families of higher branches. Our approach thus sets the stage
for testing the phylogenetic placement of unstable families
such as Thyasiridae and Chamidae, among others. Future
attention should now be directed to broadening the sampling
within Pteriomorphia and Imparidentia.
(d) A resolved bivalve tree of life?
Whereas some discordance of traditional relationships of
Bivalvia has persisted in the literature, especially between
Proc. R. Soc. B 282: 20142332
Bivalvia
Octopus vulgaris
Chiton olivaceus
Gadila tolmiei
Greenland Neomeniomorpha
Solemya velum
5
rspb.royalsocietypublishing.org
80 --- -55 --- --
Laevipilina hyalina
Lottia gigantea
---
outgroups
55 --- --
Downloaded from http://rspb.royalsocietypublishing.org/ on January 21, 2015
6
supermatrix 2
supermatrix 3
rspb.royalsocietypublishing.org
supermatrix 1
Proc. R. Soc. B 282: 20142332
>37.5% gene occupancy
0.1
>50% gene occupancy
0.1
>75% gene occupancy
0.1
Figure 3. Supernetwork representation of quartets derived from individual ML gene trees, for three different supermatrices. Phylogenetic conflict is represented by
reticulations. Edge lengths correspond to quartet frequencies.
Table 1. Summary of support values for phylogenetic relationships of major bivalve lineages for all six analyses of the three supermatrices.
matrix occupancy
>37.5%
>50%
>75%
number of loci
1377
729
173
alignment size (AA)
missing data (%)
231 823
46.6
117 190
35.4
27 732
16.1
monophyly of (BS/PP)
RAXML
PHYLOBAYES
RAXML
PHYLOBAYES
RAXML
PHYLOBAYES
Bivalvia
Autobranchia
100
100
1.0
1.0
100
100
1.0
1.0
100
100
1.0
1.0
Heteroconchia
Heterodonta
100
100
1.0
1.0
100
100
1.0
1.0
100
100
1.0
1.0
Euheterodonta
100
1.0
100
1.0
100
1.0
Protobranchia
Pteriomorpha
100
100
1.0
1.0
100
100
1.0
1.0
96
100
0.99
1.0
Palaeoheterodonta
Archiheterodonta
100
100
1.0
1.0
100
100
1.0
1.0
100
100
1.0
1.0
Anomalodesmata
Imparidentia
100
100
1.0
1.0
100
100
1.0
1.0
100
100
1.0
1.0
Downloaded from http://rspb.royalsocietypublishing.org/ on January 21, 2015
In the beginning, phylogenomic approaches in animals were
applied to deep evolutionary questions to resolve, for
example, relationships among the animal phyla [51,52], but
costs were prohibitive for attempting more focused taxonomic studies. The past few years have seen an explosion
of phylogenomic studies now focusing on many different
animal phyla or in sections of these phyla [26,54,55], but
many of these still added one or a few species to pre-existing
datasets (often incomplete or mixing genomes, transcriptomes and ESTs), or were relatively small. In fact, in our
tree, we can easily spot the first libraries sequenced for this
study, as they include the taxa with the smallest gene representation (figure 2), highlighting the rapid improvement
of RNA-seq techniques even at very short time scales.
Another particularity of the bivalve tree is the apparent lack
of major conflict typically shown in many other recent phylogenomic datasets that appear to be more sensitive to missing data,
Acknowledgements. This research was conducted as part of the PhD
Thesis of V.L.G., and was supported by internal funds from the
Museum of Comparative Zoology. Special thanks are extended to
two other Harvard institutions, the FAS Center for Systems Biology
and the FAS Research Computing group, for continuous support
with laboratory and computation resources. Alicia R. Pe´rez-Porro
and Ana Riesgo were instrumental during the initial steps of the transcriptomics research, and Prashant Sharma and Christopher Laumer
assisted with analytical questions. Felipe Zapata kindly assisted with
many of the early analyses with Agalma. Ana Glavnic is acknowledged for organizing the Neotrigonia collecting trip. Many BivAToL
colleagues participated in the sampling for this project. V.L.G., R.B.
and G.G. designed research; V.L.G. and S.C.S.A. performed research
and analysed data; V.L.G., R.B., T.M.C., P.M.M., J.D.T. and G.G.
collected samples and designed the taxon sampling; R.B., T.M.C.,
C.W.D., P.M.M., J.D.T. and G.G. developed the underlying grant proposals and did the preliminary work that made this study possible;
V.L.G., R.B. and G.G. wrote the paper. All authors read and
approved the manuscript.
Funding statement. This research was supported by the Bivalve Assembling the Tree-of-Life project (http://www.bivatol.org), supported
by the U.S. National Science Foundation (NSF) AToL program
(grants DEB-0732854/0732903/0732860) and by NSF DEB-0844596
and 0844881: Collaborative Research: Resolving Old Questions in
Mollusc Phylogenetics with New EST Data and Developing General
Phylogenomic Tools.
References
1.
Faust C, Stallkecht D, Swayne D, Brown J. 2009
Filter-feeding bivalves can remove avian influenza
viruses from water and reduce infectivity. Proc. R.
Soc. B 276, 3727–3735. (doi:10.1098/rspb.
2009.0572)
2.
Elshahawi SI et al. 2013 Boronated tartrolon
antibiotic produced by symbiotic cellulosedegrading bacteria in shipworm gills. Proc. Natl
Acad. Sci. USA 110, E295– E304. (doi:10.1073/pnas.
1213892110)
3.
Pawiro S. 2010 Bivalves: global production and
trade trends. In Safe management of shellfish and
harvest waters (eds G Rees, K Pond, D Kay,
J Bartram, J Santo Domingo), pp. 11– 19. London,
UK: IWA Publishing.
7
Proc. R. Soc. B 282: 20142332
(e) Bivalve phylogenomics
gene selection and effects of heterotachy, compositional biases
and other confounding factors in phylogenomic reconstruction
[65–67]. This made our study relatively straightforward, as we
were able to show that neither missing data nor matrix size,
nor the different evolutionary models taking into account site
heterogeneity, identified any major conflicts. To a large extent,
the individual gene trees for all matrices also showed congruence
with the concatenated datasets, supporting the major finding of a
well-resolved backbone for Bivalvia. This is, however, not the
case for the outgroup taxa, which are poorly resolved and
show inconsistent results among analyses, although one clade,
composed of Neomeniomorpha and Scaphopoda, received full
support in all analyses (figure 2; electronic supplementary
material, figure S1). The latter clade is at odds with any previous
relationship proposed for such taxa, and Scaphopoda tends to be
unstable in other published phylogenomic trees [26,54,56]. This
probably results from the absence of Chaetodermomorpha in
the datasets, allowing an attraction of the long-branched
Neomeniomorpha and the unstable Scaphopoda.
To date, few studies have been published with the
amount of novel data presented here (31 new transcriptomes)
for an analysis below the phylum level (but see our gastropod
study [56]), yet such an effort is now perfectly feasible. At this
rate, if tissues become available, sequencing hundreds of
bivalves in this fashion should be an achievable community
effort. We hope that our tree (and publicly available associated data) serves as a catalyst for continuing to advance
knowledge of the bivalve evolutionary chronicle.
rspb.royalsocietypublishing.org
hypotheses based on morphological, palaeontological and molecular datasets, here we provide a robust resolution of deep
bivalve lineages. Our transcriptomic data corroborate many traditional taxonomic groupings based on disparate sources of
data, from fossils to molecules, and highlight that historical discordance among bivalve classification is often not due to the
choice of palaeontological versus neontological, or molecular
versus morphological sets of characters proper, but contingent
on basing taxonomic decisions on single or a few preferred character systems. For example, palaeontologists favoured an early
split of Palaeoheterodonta and Heterodonta, and an early divergence of Archiheterodonta within Heterodonta [14], whereas
some recent molecular analyses challenged this arrangement
[13,20]. On the other hand, neither palaeontologists nor
morphologists have placed Anomalodesmata nested within
Euheterodonta, a result that is prevalent in nearly all molecular
analyses. Our enlarged molecular datasets corroborate the latter
molecular-based position of Anomalodesmata, but support the
traditional palaeontological proposal for the early divergence
of Heteroconchia.
A resolved bivalve tree of life allows us to address subsequent
evolutionary questions for which bivalves are ideal study subjects owing to their ubiquity in all water systems, latitudes and
depths. For example, protobranchs have been used as models
to study extinction and diversification because they preserve
the signature of the end-Permian mass extinction [25]. Owing
to their rich and old fossil record, bivalves have been used in
large-scale macroevolutionary studies [62–64]. By combining
an exemplary fossil record, extensive morphological knowledge,
and the available genomic and transcriptomic (mostly provided
here) resources now covering all major bivalve clades, we can not
only provide a solid phylogenetic framework for bivalves but
also begin to explore many other key aspects of their evolution.
Downloaded from http://rspb.royalsocietypublishing.org/ on January 21, 2015
4.
6.
7.
9.
10.
11.
12.
13.
14.
15.
16.
17.
18.
19.
33.
34.
35.
36.
37.
38.
39.
40.
41.
42.
43.
44.
45.
46.
47.
18S and 28S rRNA genes. Zool. Scr. 36, 587 –606.
(doi:10.1111/j.1463-6409.2007.00299.x)
Simakov O et al. 2013 Insights into bilaterian
evolution from three spiralian genomes. Nature
493, 526–531. (doi:10.1038/nature11696)
Takeuchi T et al. 2012 Draft genome of the pearl
oyster Pinctada fucata: a platform for understanding
bivalve biology. DNA Res. 19, 117–130. (doi:10.
1093/dnares/dss005)
Dunn CW, Howison M, Zapata F. 2013 Agalma: an
automated phylogenomics workflow. BMC
Bioinformatics 14, 330. (doi:10.1186/1471-210514-330)
Haas BJ et al. 2013 De novo transcript sequence
reconstruction from RNA-seq using the Trinity
platform for reference generation and analysis.
Nat. Protoc. 8, 1494– 1512. (doi:10.1038/nprot.
2013.084)
Grabherr MG et al. 2011 Full-length transcriptome
assembly from RNA-Seq data without a reference
genome. Nat. Biotechnol. 29, 644–652. (doi:10.
1038/Nbt.1883)
Fu LM, Niu BF, Zhu ZW, Wu ST, Li WZ. 2012 CD-HIT:
accelerated for clustering the next-generation
sequencing data. Bioinformatics 28, 3150–3152.
(doi:10.1093/Bioinformatics/Bts565)
Altenhoff AM, Gil M, Gonnet GH, Dessimoz C. 2013
Inferring hierarchical orthologous groups from
orthologous gene pairs. PLoS ONE 8, e53786.
(doi:10.1371/journal.pone.0053786)
Roth ACJ, Gonnet GH, Dessimoz C. 2008 Algorithm
of OMA for large-scale orthology inference. BMC
Bioinformatics 9, 518. (doi:10.1186/1471-21059-518)
Katoh K, Toh H. 2008 Recent developments in the
MAFFT multiple sequence alignment program. Brief.
Bioinf. 9, 286 –298. (doi:10.1093/bib/bbn013)
Castresana J. 2000 Selection of conserved blocks
from multiple alignments for their use in
phylogenetic analysis. Mol. Biol. Evol. 17, 540 –552.
(doi:10.1093/oxfordjournals.molbev.a026334)
Stamatakis A. 2006 RAxML-VI-HPC: maximum
likelihood-based phylogenetic analyses with
thousands of taxa and mixed models. Bioinformatics
22, 2688 –2690. (doi:10.1093/bioinformatics/
btl446)
Le SQ, Gascuel O. 2008 An improved general
amino acid replacement matrix. Mol. Biol. Evol. 25,
1307– 1320. (doi:10.1093/molbev/msn067)
Stamatakis A, Hoover P, Rougemont J. 2008 A rapid
bootstrap algorithm for the RAxML web servers.
Syst. Biol. 57, 758–771. (doi:10.1080/
10635150802429642)
Whelan S, Goldman N. 2001 A general empirical
model of protein evolution derived from multiple
protein families using a maximum-likelihood
approach. Mol. Biol. Evol. 18, 691–699. (doi:10.
1093/oxfordjournals.molbev.a003851)
Lartillot N, Rodrigue N, Stubbs D, Richer J. 2013
PhyloBayes MPI: phylogenetic reconstruction with
infinite mixtures of profiles in a parallel
environment. Syst. Biol. 62, 611–615. (doi:10.1093/
Sysbio/Syt022)
8
Proc. R. Soc. B 282: 20142332
8.
20. Sharma PP et al. 2012 Phylogenetic analysis of four
nuclear protein-encoding genes largely corroborates
the traditional classification of Bivalvia (Mollusca).
Mol. Phylogenet. Evol. 65, 64 –74. (doi:10.1016/j.
ympev.2012.05.025)
21. Plazzi F, Ribani A, Passamonti M. 2013 The
complete mitochondrial genome of Solemya velum
(Mollusca: Bivalvia) and its relationships with
Conchifera. BMC Genomics 14, 409. (doi:10.1186/
1471-2164-14-409)
22. Plazzi F, Passamonti M. 2010 Towards a molecular
phylogeny of mollusks: bivalves’ early evolution as
revealed by mitochondrial genes. Mol. Phylogenet. Evol.
57, 641–657. (doi:10.1016/j.ympev.2010.08.032)
23. Plazzi F, Ceregato A, Taviani M, Passamonti M. 2011
A molecular phylogeny of bivalve mollusks: ancient
radiations and divergences as revealed by
mitochondrial genes. PLoS ONE 6, e27147. (doi:10.
1371/journal.pone.0027147.t001)
24. Sto¨ger I, Schro¨dl M. 2013 Mitogenomics does not
resolve deep molluscan relationships (yet?). Mol.
Phylogenet. Evol. 69, 376–392. (doi:10.1016/j.
ympev.2012.11.017)
25. Sharma PP, Zardus JD, Boyle EE, Gonza´lez VL,
Jennings RM, McIntyre E, Wheeler WC, Etter RJ,
Giribet G. 2013 Into the deep: a phylogenetic
approach to the bivalve subclass Protobranchia. Mol.
Phylogenet. Evol. 69, 188–204. (doi:10.1016/j.
ympev.2013.05.018)
26. Smith S, Wilson NG, Goetz F, Feehery C, Andrade
SCS, Rouse GW, Giribet G, Dunn CW. 2011 Resolving
the evolutionary relationships of molluscs with
phylogenomic tools. Nature 480, 364–367. (doi:10.
1038/nature10526)
27. Steiner G, Hammer S. 2000 Molecular phylogeny of
the Bivalvia inferred from 18S rDNA sequences with
particular reference to the Pteriomorphia. In The
evolutionary biology of the Bivalvia (eds EM Harper,
JD Taylor, JA Crame), pp. 11– 29. London, UK: The
Geological Society of London.
28. Matsumoto M. 2003 Phylogenetic analysis of the
subclass Pteriomorphia (Bivalvia) from mtDNA COI
sequences. Mol. Phylogenet. Evol. 27, 429–440.
(doi:10.1016/S1055-7903(03)00013-7)
29. Malchus N. 2004 Constraints in the ligament
ontogeny and evolution of pteriomorphian Bivalvia.
Palaeontology 47, 1539– 1574. (doi:10.1111/j.00310239.2004.00419.x)
30. Williams ST, Taylor JD, Glover EA. 2004 Molecular
phylogeny of the Lucinoidea (Bivalvia): nonmonophyly and separate acquisition of bacterial
chemosymbiosis. J. Moll. Stud. 70, 187–202.
(doi:10.1093/mollus/70.2.187)
31. Taylor JD, Glover EA, Williams ST. 2005 Another
bloody bivalve: anatomy and relationships of
Eucrassatella donacina from south western Australia
(Mollusca: Bivalvia: Crassatellidae). In The marine
flora and fauna of esperance, Western Australia (eds
FE Wells, DI Walker, GA Kendrick), pp. 261–288.
Perth, Australia: Western Australian Museum.
32. Taylor JD, Williams ST, Glover EA, Dyal P. 2007 A
molecular phylogeny of heterodont bivalves
(Mollusca: Bivalvia: Heterodonta): new analyses of
rspb.royalsocietypublishing.org
5.
Gage JD, Tyler PA. 1991 Deep-sea biology: a natural
history of organisms at the deep-sea floor.
Cambridge, UK: Cambridge University Press.
Purchon RD. 1959 Phylogenetic classification of the
Lamellibranchia, with special reference to the
Protobranchia. Proc. Malacol. Soc. 33, 224 –230.
Stasek CR. 1963 Synopsis and discussion of the
association of ctenidia and labial palps in the
bivalved Mollusca. The Veliger 6, 91– 97.
Purchon RD. 1978 An analytical approach to a
classification of the Bivalvia. Phil. Trans. R. Soc.
Lond. B 284, 425–436. (doi:10.1098/rstb.
1978.0079)
Purchon RD. 1987 Classification and evolution of the
Bivalvia: an analytical study. Phil. Trans. R. Soc. Lond.
B 316, 277–302. (doi:10.1098/rstb.1987.0028)
Waller TR. 1990 The evolution of ligament systems
in the Bivalvia. In The Bivalvia: proceedings of a
memorial symposium in honour of Sir Charles
Maurice Yonge, Edinburgh, 1986 (ed. B Morton), pp.
49 –71. Hong Kong: Hong Kong University Press.
Salvini-Plawen LV, Steiner G. 1996 Synapomorphies
and plesiomorphies in higher classification of
mollusca. In Origin and evolutionary radiation of the
Mollusca (ed. JD Taylor), pp. 29 –51. Oxford, UK:
Oxford University Press.
Waller TR. 1998 Origin of the molluscan class
Bivalvia and a phylogeny of major groups. In
Bivalves: an eon of evolution. Palaeobiological
studies honoring Norman D. Newell (eds
PA Johnston, JW Haggart), pp. 1–45. Calgary,
Canada: University of Calgary Press.
Giribet G, Wheeler WC. 2002 On bivalve phylogeny:
a high-level analysis of the Bivalvia (Mollusca)
based on combined morphology and DNA sequence
data. Invertebr. Biol. 121, 271–324. (doi:10.1111/j.
1744-7410.2002.tb00132.x)
Bieler R et al. 2014 Investigating the bivalve tree of
life—an exemplar-based approach combining
molecular and novel morphological characters.
Invertebr. Syst. 28, 32 –115. (doi:10.1071/IS13010)
Newell ND. 1965 Classification of the Bivalvia. Am.
Mus. Novit. 2206, 1– 25.
Cope JCW. 1997 The early phylogeny of the class
Bivalvia. Palaeontology 40, 713–746.
Carter JG, Campbell DC, Campbell MR. 2000
Cladistic perspectives on early bivalve evolution. In
The evolutionary biology of the Bivalvia (eds
EM Harper, JD Taylor, JA Crame), pp. 47 –79.
London, UK: The Geological Society of London.
Cope JCW. 2000 A new look at early bivalve
phylogeny. In The evolutionary biology of the
Bivalvia (eds EM Harper, JD Taylor, JA Crame),
pp. 81 –95. London, UK: The Geological Society
of London.
Steiner G, Mu¨ller M. 1996 What can 18S rDNA do
for bivalve phylogeny? J. Mol. Evol. 43, 58 –70.
(doi:10.1007/BF02352300)
Campbell DC. 2000 Molecular evidence on the
evolution of the Bivalvia. In The evolutionary biology
of the Bivalvia (eds EM Harper, JD Taylor, JA Crame),
pp. 31 –46. London, UK: The Geological Society of
London.
Downloaded from http://rspb.royalsocietypublishing.org/ on January 21, 2015
56.
57.
59.
60.
61. Taylor JD, Glover EA, Williams ST. 2009 Phylogenetic
position of the bivalve family Cyrenoididae—
removal from (and further dismantling of ) the
superfamily Lucinoidea. The Nautilus 123, 9–13.
62. Roy K, Jablonski D, Valentine JW. 2000 Dissecting
latitudinal diversity gradients: functional groups and
clades of marine bivalves. Proc. R. Soc. Lond. B 267,
293–299. (doi:10.1098/rspb.2000.0999)
63. Valentine JW, Jablonski D, Kidwell S, Roy K. 2006
Assessing the fidelity of the fossil record by using
marine bivalves. Proc. Natl Acad. Sci. USA 103,
6599– 6604. (doi:10.1073/pnas.0601264103)
64. Krug AZ, Jablonski D, Valentine JW. 2008 Speciesgenus ratios reflect a global history of diversification
and range expansion in marine bivalves. Proc. R. Soc.
B 275, 1117–1123. (doi:10.1098/rspb.2007.1729)
65. Ferna´ndez R, Hormiga G, Giribet G. 2014
Phylogenomic analysis of spiders reveals
nonmonophyly of orb weavers. Curr. Biol. 24,
1772– 1777. (doi:10.1016/j.cub.2014.06.035)
66. Dell’Ampio E et al. 2014 Decisive data sets in
phylogenomics: lessons from studies on the
phylogenetic relationships of primarily wingless
insects. Mol. Biol. Evol. 31, 239 –249. (doi:10.1093/
molbev/mst196)
67. Rokas A, Williams BL, King N, Carroll SB. 2003
Genome-scale approaches to resolving incongruence
in molecular phylogenies. Nature 425, 798– 804.
(doi:10.1038/nature02053)
9
Proc. R. Soc. B 282: 20142332
58.
opisthobranch paraphyly and key evolutionary steps
in a major radiation of gastropod molluscs. Mol.
Phylogenet. Evol. 69, 764–771. (doi:10.1016/j.
ympev.2013.07.001)
Zapata F, Wilson NG, Howison M, Andrade SCS,
Jo¨rger KM, Schro¨dl M, Goetz FE, Giribet G,
Dunn CW. 2014 Phylogenomic analyses of deep
gastropod relationships reject Orthogastropoda.
Proc. R. Soc. B 281, 20141739. (doi:10.1101/
007039)
Checa AG, Salas C, Harper EM, Bueno-Pe´rez JDD.
2014 Early stage biomineralization in the
periostracum of the ‘living fossil’ bivalve
Neotrigonia. PLoS ONE 9, e90033. (doi:10.1371/
journal.pone.0090033)
Prezant RS. 1998 Subclass Palaeoheterodonta
introduction. In Mollusca: the southern synthesis.
Fauna of Australia. vol. 5 (eds PL Beesley, GJB Ross,
A Wells), pp. 289 –294. Melbourne, Australia: CSIRO
Publishing.
Gonza´lez VL, Giribet G. 2014 A multilocus
phylogeny of archiheterodont bivalves (Mollusca,
Bivalvia, Archiheterodonta). Zool. Scr. 44, 41 –58.
(doi:10.1111/zsc.12086)
Harper EM, Hide EA, Morton B. 2000 Relationships
between the extant Anomalodesmata: a cladistic
test. In The evolutionary biology of the Bivalvia (eds
EM Harper, JD Taylor, JA Crame), pp. 129– 143.
London, UK: The Geological Society of London.
rspb.royalsocietypublishing.org
48. Lartillot N, Philippe H. 2004 A Bayesian mixture
model for across-site heterogeneities in the aminoacid replacement process. Mol. Biol. Evol. 21,
1095–1109. (doi:10.1093/molbev/msh112)
49. Gru¨newald S, Spillner A, Bastkowski S,
Bogershausen A, Moulton V. 2013 SuperQ:
computing supernetworks from quartets. IEEE/ACM
Trans. Comput. Biol. Bioinf. IEEE, ACM 10, 151–160.
(doi:10.1109/TCBB.2013.8)
50. Huson DH, Bryant D. 2006 Application of phylogenetic
networks in evolutionary studies. Mol. Biol. Evol. 23,
254–267. (doi:10.1093/molbev/msj030)
51. Philippe H, Lartillot N, Brinkmann H. 2005
Multigene analyses of bilaterian animals corroborate
the monophyly of Ecdysozoa, Lophotrochozoa and
Protostomia. Mol. Biol. Evol. 22, 1246– 1253.
(doi:10.1093/molbev/msi111)
52. Dunn CW et al. 2008 Broad phylogenomic sampling
improves resolution of the animal tree of life.
Nature 452, 745 –749. (doi:10.1038/nature06614)
53. Hejnol A et al. 2009 Assessing the root of bilaterian
animals with scalable phylogenomic methods.
Proc. R. Soc. B 276, 4261 –4270. (doi:10.1098/rspb.
2009.0896)
54. Kocot KM et al. 2011 Phylogenomics reveals deep
molluscan relationships. Nature 447, 452 –456.
(doi:10.1038/nature10382)
55. Kocot KM, Halanych KM, Krug PJ. 2013
Phylogenomics supports Panpulmonata:


© Copyright 2026