
Assessment of Glacial Lake outburst floods in Tawang Basin
Assessment of Glacial Lake outburst
floods in Tawang Basin
ISPRS TC VIII Mid-Term Symposium 2014
Operational Remote Sensing Applications: Opportunities, Progress and Challenges”
December 9-12, 2014
Presented By,
Hyderabad, India
Rupasree Panda
KIIT UNIVERSITY
Rupasree Panda a, Suman Kumar Padhee b, Subashisa Dutta c
GLOF in General:
• In the Himalayan region, major rivers are originating from glaciers.
• Rapid retreat of glaciers creates many precarious glacial lakes in the
Himalayan region
• The lakes located at the snout of the glacier are mainly dammed by the
lateral or end moraine. Thus forms a moraine-dammed glacial lake,
typically narrow and high reducing structural strength is formed.
• Breaching and the instantaneous discharge of water from such lakes
causes catastrophic downstream flash flooding, GLOF enough to create
enormous damage in the downstream areas.
• GLOF have direct impact on the commissioned hydropower projects and
the population living in the downstream area.
Possible triggers and causes for GLOF:
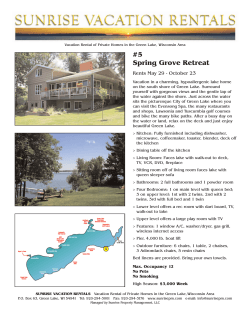
Study Area and data used:
Tawang Region
Geographical area
3447 km2
Main river line
Tawang chu
Tributaries
Nyukcharong chu
Mago chu
•
•
•
•
Landsat-8 medium to high resolution multispectral
scenes , (OLI, TIRS,Maximum cloud cover of 9 %)
SRTM DEM (Shuttle Radar Topographic Mission
Digital Elevation Model)
Google Earth scenes.
Field survey:
─ Cross section data was accessed mainly at the
proposed HEP sites and some distance up to the
accessible upstream.
METHODOLOGY
• All the images were brought to a common coordinate system i.e. UTM zone
46N.
• OLI bands (1-7) were converted from DN to reflectance and TIRS bands (10
and 11) were converted from DN to radiance and then radiance to brightness
temperature.
Methodology (contd.):
Identification of Glacial Lake
Methodology (contd.):
Vulnerability Analysis
• Categorization by:•
Area:
Larger area means more volume of water it will hold which
will evolve into high discharge at the downstream.
•
Slope:
Gentle slope >> lower depletion of snow cover
Moderate slope >> faster depletion of snow cover
•
Stream Order: Ordering of the stream is based on the degree of
branching.
•
Proximity:
It is possible that a lake is not located on a stream, yet its
proximity to a stream might make it vulnerable, so buffer
of 500 m was analysed.
•
Elevation:
More prone to receive water from glacier retreat.
•
OVERALL: Sum of weights of all the attributes
Methodology (contd.):
GLOF Simulation:
DAM BREAK model in HEC-RAS
Input Data and Model Setup:
• Glacial Lake depth and volume calculated from empirical
relationship related to area of the lake.
• Cross-sections of river from dam site (containing lake) up to
location downstream of the dam to which the study is required.
• Elevation-volume relationship.
• Manning’s roughness coefficient for different reaches of the river.
Upstream Boundary
The Lake has been represented in the model by elevationcumulative volume relationship. An initial inflow was given to run
the model.
Downstream Boundary
The normal depth has been used as the downstream boundary for
the model setup
Estimation of GLOF
• Suitable breach parameter for GLOF was accessed using DAM-BREAK
simulation.
• The dynamic routing given by Barre De Saint Venant ,1871 as
i) Conservation of Mass (Continuity) Equation
(∂Q/∂X) +∂ (A+ A0) / ∂t -q =0
ii) Conservation of Momentum Equation
(∂Q/∂t)+ {∂ (Q2/A)/∂X} + g A ((∂h/∂X) +Sf +Sc) =0
• Input Data:
Lake Volume and depth: From International centre for Integrated mountain
development (ICIMOD) for various kinds of lakes and Chrstian Huggels
formula especially for moraine dammed lakes of the Himalaya.
Manning’s roughness coefficient=0.055 and 0.06
Cirque lake - 10 m
Lateral moraine lake - 20 m
Trough valley lake – 25m
Moraine lake- 30 m
Blocking lake and glacier erosion lake- 40 m
D 0.140 A0.42
V 0.140 A1.42
Breach Parameters for GLOF simulation:
Breach Parameters for GLOF Simulation
•
The breach characteristics input to dam break models are i) Final bottom width of
the breach, ii) Final bottom elevation of the breach, iii) Left and right side slope
of the breaching section iv) Full formation time of breach, and v) Reservoir level
at time of start of breach.
B = 2 to 4 hw
Federal Energy Regulatory Commission (FERC) 1987:
tf = 0.1 to 1 hr
Where, B = Average breach width in meters;
tf = failure time in hours.
B = 2.5 hw + Cb
Von Thun and Gillelte formula (1990):
tf = B / 4hw for erosion resistant
Where, Cb = 18.3 for reservoir storage between
=B/(4hw + 61) for highly erodible
1.23 MCM to 6.17 MCM
hw = height of water above breach invert at failure
Froehlich’s formula (1995 b):
hb= height of breach (m)
K0= 1.4 for overtopping and 1.0 for piping
B 0.1803K oVw0.32 hw0.19
14
Delineated Watershed
Contd...
Catchment area of the rivers up to the
project sites:
Nyukcharong Chu
2007 km2
Mago Chu
830 km2
Delineated watersheds of Nyukcharong Chu and Mago Chu.
Use of NDWI for Delineating Water Features
NDWI using NIR and Green bands (Green- NIR / Green+ NIR), which
gives potential water layer (level 1), as shown in figure below:
The main aim was to obtain the
most precise delineation of lakes with
some ice on water and turbid lakes
with minimum misinterpretation error.
NDWI representing potential water layer
(level 1)
Object Based Approach for Distinguishing Snow Region and No
Snow Region
Spectral Test:
NDSI>
0.15,Brightness
Temperature < 3.8,
Band5 > 0.11 and
Band 3 > 0.1)
potential snow layer in ERDAS Imagine 9.2 model maker
Potential Snow Layer
Potential Snow Layer Map
Extraction of No Snow area
from total watershed was done
using Arc-GIS.
Supervised Classified Map For Identification of Various
Spectral Classes
Output from maximum likelihood
type supervised classification of
FCC (5, 6, 4) for the study area
Water Layer Extracted Out from Supervised Classified
Image
from the supervised classification
of FCC (5,6,4), it can be seen that
hill shadow creates illusion with
the lakes/water body
Result from Combination of Above Described Approaches
Potential water layer (Level 2)
of the study area.
Final Potential Water Layer (Level 3)
Final potential water layer (level 3)
•Intersection of Potential water
layer (Level 2) and Water layer
that was extracted from
classified Image, is the final
potential water layer (level 3)
•Potential water layer (level 3)
was overlaid to Google earth for
identification of lake location
accurately.
•Identified lakes were then
digitized on Google earth to get
the surface area.
Identified Lakes (37)in the Study Area (Surface
area>0.1km2)
Vulnerability Analysis
• Nyukcharong Chu stream originates from a large lake having an
area approximately 22.66 km2. The lake appears to have a
permanent outlet in the river Nyukcharong Chu. Thus, there are very
rare chances of a GLOF event from this lake. Hence, this lake is also
not considered for further study.
• Remaining 36 lakes have been selected for further analysis for
assessing the potential of causing GLOF. The parameters considered
for analysis are:
Range of parameters for the identified Lakes:
Area
0.1 km2 to 2.354 km2
Slope
0.6% to 44.1%
Stream Order
1 to 4
Proximity
500m buffer
Elevation
Lake centre elevation
Vulnerable Lakes
• The lakes classified as ‘Not vulnerable or ‘low vulnerability’ do
not require any further study. However the lakes having
‘Medium vulnerability ‘high vulnerability’ must be analysed
further for GLOF.
• There are 5 lakes which show ‘Medium vulnerability’. These
lakes are more prone to glacial outburst flood due to their
geographical settings.
• The remaining 2 lakes, one is in Nyukcharong Chu catchment
(Lake ID-7) and other in Mago Chu catchment (Lake ID-20)
was taken for further GLOF analysis.
Assessment of GLOF hydrograph at HEP site
• GLOF hydrograph takes 2 hr to reach from Lake site to Mago chu
HEP site and 1 hr 10 min to nyukcharong chu barrage site
Figure 1: Routed Hydrograph from the Lake ID-7 to Barrage Site
Hydraulic Parameters along the Nyukcharong Chu Reach
Monsoon( 40cumec): 1.5m/sec
GLOF (2453cumec) :9m/sec
Monsoon : Mixed Flow
GLOF
:Mixed Flow
Velocity Variation along the Nyukcharong Chu Reach
Froude Number Variation along the Nyukcharong Chu Reach
Stream Power Variation along the Nyukcharong Chu Reach
Shear Stress Variation along the Nyukcharong Chu Reach
Hydraulic Parameters : Nyukcharong and Mago Chu Reach
Hydraulic Depth Variation along the Nyukcharong Chu
Reach
Hydraulic Depth Variation along the Mago Chu Reach
Top Width Variation along the Nyukcharong Chu Reach
Top Width Variation along the Mago Chu Reach
(contd..)
Hydraulic Parameters along the Mago Chu Reach
Monsoon( 50cumec): 1.2m/sec
GLOF (2125cumec) :5m/sec
Monsoon: Sub critical
GLOF : Mixed Flow
Velocity Variation along the Mago Chu Reach
Froude Number Variation along the Mago Chu Reach
Stream Power Variation along the Mago Chu Reach
Shear Stress Variation along the Mago Chu Reach
29
CONCLUSIONS
Satellite imagery
Empirical Formula
Area and Geographical Setting
Depth and Volume of lake
Critical breach parameter (B, Tf)
Dam Break Model Setup
Here HEP are designed for
100yr Flood
GLOF discharge >> 100yr flood
Factor of safety , Modify the
design discharge
GLOF peak at Lake site
Hydrodynamic Routing
GLOF peak at
project Site and
travel time
estimation along
the reach
GLOF Impact on Hydropower Project Site
• Instead of adopting conventional reservoir based hydropower
projects, a run-of-river environmental friendly project needs to
be employed for reducing the impact of GLOFs.
• Machine operated gated structures, that to be regularly
operated, in the (half an hour basic) should be planned.
• Gated structures with little ponding will also be a good
substitute of traditional Hydro dams. In such scheme, the
normal course of the river will remain un-altered.
• Run-of-River project should put debris removal structures.
References
•
•
•
•
•
•
•
•
Bajracharya, B., Shrestha, A.B., Rajbhandari, L. (2007)."Glacial Lake Outburst Floods in the
Sangarmatha Region"International Mountain Society, Vol.27 (4):336-344.
Bolch, T., Kamp, U. (2006)."Glacier Mapping in High Mountains Using DEM's, Landsat and
ASTER Data" proceeding of 8th International symposium on High Mountain Remote Sensing
Cartography.
Bolch, T., Peters, J., Yegorov, A., Pradhan, B., Buchroither, M., Balagoveshcensky,
V.(2011)."Identification of potentially dangerous glacial lakes in the northern Tien Shan"
Springer Science +Business Media B.V.,Net Hazards, 59:1691-1714.
Claguea. J., Evans.S.G., (2000). A review of catastrophic drainage of moraine-dammed lakes
in British Columbia. Quat. Sci. Rev. 19, 1763-1783.
Dahms S. H. (2006) “Moraine dam failures and glacial lake outburst floods”
Huggel C, kaab A, Haeberli W., Teysseire P, Paul F. (2002) Remote sening based assessment of
hazards from glacier lakeoutbrusts: a case study in the Swiss Apls. Can Geotech J
2002;39(2):316-30.
Huggel, C; Haeberli, W; Kääb, A; Bieri, D; Richardson, S (2004) ‘An assessment procedure for
glacial hazards in the Swiss AlpsCanadian Geotechnical Journal 41: 1068-1083.
Integrated Mountain Development (ICIMOD), Mountain Environment and Natural
Resounformation Systems (2001) “Inventory of Glaciers, Glacial Lakes and Glacial Lake
outbFloods, Monitoring and Early Warning Systems in Hindu Kush-Ht imalayan Region
32
Bhutan”.
33


© Copyright 2026