
Patents as a Spur to Subsequent Innovation: Evidence from
Patents as a Spur to Subsequent Innovation:
Evidence from Pharmaceuticals
Duncan Gilchrist∗
Harvard University
January 16, 2015
Abstract
This paper examines how an incumbent’s patent protection acts as an implicit subsidy
towards non-infringing substitutes. I analyze whether classes of pharmaceuticals whose
first entrant has a longer period of market exclusivity (time between approval and generic
entry) see more innovation. Instrumenting for exclusivity using plausibly exogenous
delays between patent filing and the start of clinical trials, I find that a one-year increase
in first in class exclusivity increases subsequent entry by 0.2 drugs. The effect is stronger
for drugs targeting conditions for which demand is more price-elastic, and for drugs
that are lesser advances.
∗
Contact: [email protected]. I am especially grateful for the advice and encouragement of David
Cutler, Michael Luca, and Andrei Shleifer. For helpful comments and suggestions, I additionally thank
Philippe Aghion, Kate Baicker, Natalie Bau, Lanier Benkard, Ernie Berndt, Dan Carpenter, Michael Chernew,
Thomas Covert, Liran Einav, Richard Freeman, Peter Ganong, Jerry Green, Shane Greenstein, Rob Huckman,
Haiden Huskamp, Simon Jaeger, Larry Katz, Mark Lemley, Greg Lewis, Robin Lee, Josh Lerner, Jon Levin,
Hong Luo, Eric Maskin, Ariel Pakes, Genevieve Pham-Kanter, Benjamin Roin, Martin Rotemberg, Al Roth,
Bhaven Sampat, Emily Glassberg Sands, Vicki Sato, Ariel Dora Stern, Heidi Williams, Thomas Wollmann,
and Ali Yurukoglu, as well as seminar participants at the Harvard IO lunch, the Harvard HCP Seminar,
and the NBER Productivity Seminar. I thank David Friedman, Michael Lanthier, Kevin Sharer, Stuart
Watt, and Jeff Way for sharing their insight into the FDA, the pharmaceutical industry, and patent law.
Finally, I am thankful to Kevin Garewal for his assistance in obtaining the data for this project and I
gratefully acknowledge financial support from the Harvard Business School Doctoral Program. Data licensing
disclaimers follow. The statements, findings, conclusions, views, and opinions contained and expressed herein
are not necessarily those of IMS Health Incorporated or any of its affiliated or subsidiary entities. The
statements, findings, conclusions, views, and opinions contained and expressed in this article are based in
part on data obtained under license from the following IMS Health Incorporated or affiliate information
service(s): IMS National Sales Perspectives, 1992-2013, IMS Health Incorporated. All Rights Reserved.
R
c
AHFS
Pharmacologic/Therapeutic Classification used with permission. 2014,
the American Society of
R
Health-System Pharmacists, Inc. (ASHP) The Data is a part of the AHFS Drug Information
; ASHP is not
responsible for the accuracy of transpositions from the original context.
1
Introduction
Research dating back at least as far as Nordhaus (1967) has analyzed the role of intellectual
property protection in incentivizing innovation. The motivation for such protection tends to
be the idea that without property rights, the free market might underinvest – relative to the
socially optimal level – in the costly development of new technologies. The tradeoff is that
bestowing a firm with market power leads to prices which are statically inefficient, driving a
wedge between the allocation which is realized and that which is socially optimal.
Traditional models think of an incumbent’s intellectual property protection, such as a
patent, as inhibiting, or at the minimum dis-incentivizing, entry in the same market by another
firm.1 In this paper, I propose a novel channel through which patents impact innovation, and
show that in fact the reverse can be true: an incumbent’s patent can actually spur competing
innovation. In brief, if patents are narrow, so that an incumbent’s patent does not inhibit a
differentiated innovator’s entry directly, yet it does provide market power to the incumbent
by inhibiting perfect imitation, then an innovator’s profitability may be tied both to the
incumbent’s patent protection as well as to its own; i.e., the innovator may benefit from the
incumbent’s patent protection. In fact, if fixed costs are high and the innovator’s product is
not substantially more desirable than the incumbent’s, then the innovator’s decision to enter
may be almost exclusively determined by the incumbent’s remaining protection.
My focus is within the pharmaceutical sector, a sector which is the single largest in terms
of domestic R&D, and also a sector in which advances are believed to have contributed
substantially to improving public health.2 The channel outlined above is straightforward
to articulate in this setting: the question is the extent to which the generic version of an
existing treatment impedes the development of a novel competing drug. This channel has
been identified in the popular press as a prominent consideration for firms directing R&D
investments toward new drug development: e.g., Parker (2013) suggests that, in 2013, the
impending availability of a generic version of Ambien (a blockbuster drug for insomnia),
made it less appealing for competitors to develop new drugs targeting the same condition.3
I analyze the impact of patents on innovation through precisely this channel. In particular,
focusing within pharmacologic classes of closely related drugs, I show that the length of time
1
Indeed, in the theoretical literature, patents incentivize innovation specifically because they provide
protection from imitation. The theoretical literature on patents, discussed below, is substantial – see, e.g.
Nordhaus (1967, 1969, 1972); Scherer (1972); Fudenberg et al. (1983); Klemperer (1990); Gilbert and Shapiro
(1990); Gallini (1992); Green and Scotchmer (1995). Scotchmer (1991) provides a helpful review.
2
The NSF reports the pharmaceutical sector makes up nearly 20% of industrial R&D (NSF (2012)) and,
e.g., Lichtenberg (2007) estimates that drugs approved in recent years are extraordinarily cost-effective,
reducing mortality at a net cost of less than $20,000 per life year saved.
3
A specific quotation is reproduced in Appendix Section A.1.
1
between the first in class drug’s (FIC’s) approval and its generic’s entry has an economically
and statistically significant causal impact on the number of new drugs that subsequently
come to market in that class. That is, I show that the longer the period of time for which
the FIC has market exclusivity versus its generic, the more subsequent innovation occurs in
that class.4
I begin by analyzing a simple theoretical model that motivates the setting and clarifies
how an incumbent’s patent impacts the investment decision of a subsequent entrant. As is
the case in pharmaceuticals, in the model patents are narrow and do not inhibit the entry of
differentiated substitutes. Rather, the role of patents in the model is to provide firms with
the agency to set their own prices; after patents expire, generic entry is assumed to occur
and prices fall. The model shows how the entrant’s profitability, and thus initial investment
decision, is affected by the incumbent’s patent. Moreover, the model predicts that the size
of the effect is moderated by properties of demand and of the products themselves: the
effect of the incumbent’s patent on the entrant’s investment decision is increasing in the
price-sensitivity of consumers, and decreasing in the quality difference between the two drugs.
Intuitively, the importance of the incumbent’s patent for the entrant is increased if demand is
price-elastic, while it is mitigated if the new drug is substantially better than the incumbent’s.
My empirical analysis, which makes up the remainder of the paper, analyzes the model’s
predictions. I focus on pharmacologic classes of new molecular entities (NMEs), groupings
of pharmaceuticals which are closely related in chemical composition and in physiological
effect but which are differentiated at the molecular level. This method of categorizing drugs
provides me with a principled procedure with which to identify groups of drugs that are
sufficiently similar to be substitutes in the eyes of prescribers and patients, yet are sufficiently
differentiated so that each NME requires its own costly clinical trials to be marketed and
one NME’s patent protection does not preclude the entry of the others.5 I assemble a rich
dataset which includes, for NMEs belonging to classes with first in class approval in the
period 1987-2011, approval dates, annual sales, market sizes, dates of clinical development,
dates of filing and expiration for key patents, and, importantly, whether a generic version has
been approved and, if so, when.
4
I refer to innovation which is not first in class as “subsequent” throughout. Although the phrase
“follow-on” is perhaps more grammatically convenient, it would be misleading because it is often used to
describe innovation which is cumulative, e.g. as in Sampat and Williams (2014). Similarly, innovation which
is called “sequential” usually refers to innovation which builds on its predecessors, as in Bessen and Maskin
(2009).
5
Getting any NME to market is costly because the FDA requires proof of safety and efficacy; a commonly
cited figure is that the total capitalized cost of a new drug is on the order of $1B (DiMasi et al. (2003)). This
differs from the low cost of bringing a generic to market, which I return to below. The channel I describe
could equally affect complements as well as substitutes, but I do not analyze complements because I am
without a principled method for categorizing them.
2
The model requires that sales respond to competition within class (else the entry of one
drug’s generic would not erode the profits of another) and that entry is sequential (else drugs
would enter the market simultaneously, leading patent lifetimes to be aligned), so I first look
to the data for evidence of these characteristics in the market for pharmaceuticals. Though
causal identification of the first factor is difficult, I provide anecdotal and descriptive evidence
consistent with the hypothesis that the generic entry of one drug in a class reduces the sales
of another. Next, I show that drug development is a highly staggered process: nearly 40%
of approved drugs only begin the often decade-long process of clinical development after
the first in class has been approved. Finally, I show that, consistent with the model’s main
prediction, very few new drugs come to market after the FIC has gone generic.
I turn next to my main empirical analysis, which examines how the length of FIC
exclusivity impacts subsequent innovation in the same class. I start by discussing potential
challenges to identification. While exclusivity typically ends after the expiry of a key patent,
the specific timing of that patent’s expiry relative to approval (i.e., exclusivity) is determined
by many factors, some of which are idiosyncratic, while others are market-related. For
example, as Budish et al. (2014) insightfully leverage to study the effect of commercialization
lags on clinical trial investments, exclusivities tend to be eroded by the length of clinical trials.
If the length of clinical trials is correlated among drugs in the same class, then exclusivities
may be as well, and this would confound estimates generated by simply regressing entry on
FIC exclusivity. My analysis exploits two strategies to handle the potential for endogeneity
in market exclusivity.
First, I show that controlling directly for the two main ways in which endogeneity
might enter – market size (and profitability) and the length of clinical trials – does little to
change the estimates. Furthermore, if market exclusivities were endogenously related to class
characteristics, then they should be correlated within class, and this is not born out in the
data.
Second, I conduct an instrumental variables analysis which exploits the combined facts
that (1) the path of drug development can be hard to predict, yet (2) patent filing is defensive.6
The first means firms sometimes discover molecules before they know specifically what to do
with them, and the second means that firms are incentivized to file patents early. The end
result is that firms sometimes file patents on a molecule well in advance of its progression
to clinical trials (contrasting with a strategy in which firms maximize market exclusivity by
filing patents as late as possible).
6
A well known example of the first phenomenon is the story of Viagra’s discovery. The Viagra molecule
was originally discovered as a treatment for angina, but in the course of clinical review (for angina) it was
discovered that men taking the drug found themselves unexpectedly erect.
3
I use these delays between patent filing and the start of clinical review as an instrument for
market exclusivity. I show empirically that they are not related to patent characteristics such
as claims and citations, nor are they related to market characteristics such as ex-post annual
sales. They are, however, related to factors which are indicative of initial uncertainty and
disruptions in the development process, such as the length of time between when the patent
was filed and when it is first transferred to another entity (e.g., in a licensing agreement),
as well as whether the patent was transferred to a new assignee in a merger transaction.
Importantly, they are not correlated within pharmacologic classes. Since a story about
the endogeneity of these delays requires that they are somehow related to a class-specific
unobservable, that they are uncorrelated within class means a confounding factor would have
to be at once idiosyncratic to FIC drugs, unrelated to subsequent entrants, yet also related
to total entry. While I cannot rule out such a story, it is not an easy one to tell.
The results, across both IV and non-IV specifications with and without controls, consistently show that a one year increase in first in class exclusivity yields a 25-30% increase in
subsequent entry, or about 0.2 drugs. This is a large effect: it implies that a one standard
deviation increase in first in class exclusivity doubles subsequent entry. The appendix presents
a battery of robustness tests which show that the results are not particularly sensitive to
sample restrictions, to specification choices, and that they survive a placebo test where I look
at the effect of last in class exclusivity on prior entry.
Finally, I analyze the model’s predictions that the effect of FIC exclusivity on subsequent
entry should be moderated both by the price elasticity of demand as well as by the magnitude
of quality improvements. I proxy for price elasticity using patient incomes as well as whether
a drug treats a chronic condition and find, consistent with the model’s prediction, that the
effect is strongest among price-elastic populations. Next, I proxy for advances in quality by
asking whether new drugs receive priority review status from the FDA, a status granted to
molecules found to be exceptionally promising in clinical trials.7 Again, consistent with the
model’s prediction, I find that FIC exclusivity has a significantly stronger impact on the
number of subsequent entrants that do not receive priority review than on those that do (and
I cannot distinguish the latter effect from zero).
Prior theoretical work on patents, such as the seminal papers on optimal patent characteristics by Klemperer (1990) and Gilbert and Shapiro (1990), does not allow for the effect
I analyze. The models vary but a common theme is that firm profits are primitives; i.e.,
pricing and profits are not endogenously determined in competitive equilibrium as a function
7
A priority review designation accelerates approval decisions – the FDA goal is to complete a priority
review in 6 months. However, it does not affect the level of evidence as to a drug’s safety and efficacy required
for approval.
4
of market structure. This set up rules out the potential for one drug’s patent protection to
affect another’s entry decision through its pricing.
The empirical literature has similarly overlooked this effect. Indeed, the majority of
empirical work on patents has focused on patenting as an outcome of the innovative process.8
Taking the reverse approach, I contribute to a sparse body of empirical research that
considers and finds evidence for how the characteristics of patents manifest themselves in
new innovations. Sakakibara and Branstetter (2001) and Lerner (2002) actually find patent
laws have only limited impacts on innovation; with respect to research that finds evidence of
the opposite, I am aware only of Moser (2005), who shows that 19th century patent laws
influenced the geographic distribution of inventors.
Of course, the idea that competition in itself might affect new product introduction is not
new. Indeed, it has received considerable attention specifically in the pharmaceutical setting
by researchers trying to explain why the number of new drugs approved annually in the
United States has fallen since 1996 despite continued growth in R&D expenditure.9 Scannell
et al. (2012) describe the competition factor in pharmaceutical development as the “better
than the Beatles” problem: new drugs are only worth developing if they are more effective
than past successes (in apparent contrast with the music industry). And other empirical work
supports a link between competition and investment: Civan and Maloney (2009) show that
that early stage investment is positively correlated with the price of approved drugs in the
same therapeutic area, and concurrent work by Branstetter et al. (2014) shows generic entry
in a therapeutic area is associated with declines in early stage investment. This research
supports the thrust of my findings. However, to my knowledge, no existing research has
articulated and analyzed the fundamental link between the characteristics of patent protection
and these downstream effects.
The remainder of the paper proceeds as follows: I open in Section 2 with a model to
formalize the effect that an incumbent’s patent protection has on subsequent entry. Section 3
introduces the data and Section 4 provides descriptive analysis and background on the
pharmaceutical industry. In Section 5, I describe my empirical strategy before presenting
estimates of the impact of an incumbent’s patent protection on subsequent entry. Section 6
analyzes how my estimates are related to class characteristics and, finally, Section 7 concludes.
8
Griliches (1998) provides a review and a discussion of the evidence for and against this design.
This has been called a “crisis” – see Pammolli et al. (2011) and the references cited therein. Cockburn
(2007) provides an elegant analysis and discussion of some of the possible forces at work. The perplexing slow
down in productivity is sometimes called “Eroom’s Law”, contrasting with the well-known Moore’s law in
the semiconductor industry.
9
5
2
A Model
In this section, I develop a simple model to show how an incumbent’s patent protection
affects the entry incentives of a subsequent innovator. I first present the set up and then
discuss its assumptions and its implications.
2.1
Preliminaries
The model has two periods t = 0, 1 and two players. The incumbent A is present in the
market in both periods. At t = 0, the potential entrant B must decide whether or not to
pay a fixed development cost F in order to enter at t = 1. At t = 1, prices are set in static
Bertrand-Nash equilibrium and profits are realized.
There is no uncertainty and no discounting, so B’s decision at t = 0 is simple: B enters if
the value of entry, i.e., profit less development cost, is at least 0. Formally,
VBentry = πB (pA , pB ) − F ≥ 0 ⇔ B enters.
(1)
If B enters, it benefits from patent protection at t = 1, and is able to set its price pB at
whatever level it chooses.
However, A is not necessarily on patent at t = 1. If A does have patent protection, then
A chooses pA optimally. If A does not have patent protection, then generic competition
exogenously pushes A’s price down, though it can be no lower than unit production costs
c, which are symmetric for both A and B. Altogether, this means that A’s price at t = 1
is somewhere on the interval between c and its optimal duopoly price (in the case that B
enters) or monopoly price (in the case that B does not enter). For simplicity, I do not model
the process of generic entry and my analysis instead takes the price of A as given; I think of
the level of A’s price as directly influenced by its patent protection. My focus, then, is on the
value that B accords with entry and specifically how that value is influenced by A’s price.
A’s patent protection is assumed to be sufficiently narrow to not directly impact B’s ability
to enter. This captures the reality in pharmaceutical development, where patents are narrow:
pharmaceutical patents generally only provide protection against identical substitutes (e.g.,
the same molecule) and not differentiated substitutes (e.g., molecules that share features and
treat the same condition, but are not identical). I do not model generic entry explicitly for
the sake of simplicity, but my set up is motivated by the fact that once patents have expired,
it is not costly for generic competitors to enter the market and such entry tends to happen
rapidly, reducing prices paid on the order of 90% in the year or two following patent expiry.10
10
Reiffen and Ward (2005) estimate the fixed cost of generic entry is roughly $300,000. This is very small
6
The channel through which patent protection impacts competition in my model – by not
directly inhibiting entry, but rather by influencing prices – distinguishes my analysis from
prior research, such as Klemperer (1990) and Gilbert and Shapiro (1990).11
I model the demand side through a discrete choice framework, in which a unit mass of
consumers must pick one drug to consume, and consumers differ according to their price
sensitivities. Specifically, consumer i receives utility from drug j according to its quality level
δj and price pj :
1
uij = δj − pj .
(2)
αi
Price sensitivities are parametrized the αi ’s, which are distributed exponentially in the
population with mean λ. The parameter λ > 0 captures the dispersion of price sensitivity
in the population.12 If λ is higher, then consumers are on average less price-sensitive. For
simplicity, I assume that B’s quality is exogenously higher than A’s, i.e. that δB > δA , and I
write the difference in qualities ∆ = δB − δA . This demand framework captures the idea that
drugs are differentiated and that consumers differ in how they value quality relative to price.
To summarize, at t = 0, the potential entrant B must decide whether or not to pay the
fixed cost F to enter at t = 1. If B enters, it benefits from patent protection, but it competes
with the incumbent A which is priced between c and its optimal level, depending on its patent
protection and the ensuing extent of generic competition. The model has three parameters:
pA is A’s price and its level reflects the extent of A’s patent protection, λ reflects the extent
to which consumers are insensitive to price, and ∆ reflects how much higher B’s quality is
than A’s.
A few comments are in order before proceeding to the results. First, the model assumes
fixed costs are high relative to profits and that patent protection is meaningful. As discussed
previously, these are key characteristics of the pharmaceutical market. Second, the model
assumes that demand for B is meaningfully affected by the price of A. It is not necessarily
obvious that this is true in the market for pharmaceuticals, where consumers might have
such strong preferences for one drug over another that prices are largely irrelevant. Third,
the model assumes that entry is sequential and not simultaneous. This too is important:
an alternative view of drug development is one in which competitors simultaneously race
to market so that they enter at the same time – leading the entrant’s patent to expire at
relative to the $1B cost of drug development cited earlier. Berndt (2002) provides a review of the evidence on
generic entry.
11
I am not aware of a paper that characterizes optimal patent characteristics when pricing is endogenous
(i.e., where patent expiration of one product impacts the profitability of another). However, that patents do
not preclude entry in my model means it shares features with Gallini (1992), where inventors can pay a fee to
“innovate-around” patent-protected incumbents.
12
The choice of exponential distribution is motivated by the skewness of real incomes. An alternative
interpretation of αi is that all consumers have the same price sensitivity but that quality sensitivity varies.
7
the same time as the incumbent’s. I address the last two of these assumptions in Section 4
and show that indeed, closely related drugs appear to be substitutes and that much of drug
development is sequential in nature.
2.2
Entry Incentives and Implications
I first solve for B’s best-response pricing and profits before analyzing the properties of B’s
value function. Looking to demand, consumer i prefers B to A if δB − α1i pB > δA − α1i pA , i.e.
−pA
αi > p B ∆
. This means aggregate demand for drug B is
Z
DB (pA , pB ) =
∞
pB −pA
∆
α
pB − pA
1
exp −
dα = exp −
.
λ
λ
λ∆
(3)
B’s first order condition then yields:
pBR
B = λ∆ + c
⇒
VBentry
= (λ∆ + c) exp
pA − c
− 1 − F.
λ∆
(4)
This simple models yields the following three intuitive predictions.
(1) B’s entry value is increasing in A’s price:
∂VBentry
> 0.
∂pA
(5)
The first comparative static is quite natural: the higher A’s prices, the higher B’s profits.
This implies that B’s incentives to enter are higher when A does not face generic competition.
The majority of my empirical results, presented in the following sections, focus precisely on
analyzing how subsequent entry is affected by the incumbent’s patent protection.
The second and third comparative statics analyze the extent to which price sensitivity
(parametrized by λ) and quality differences (parametrized by ∆) affect B’s entry value.
(2) The effect of A’s price on B’s entry value is decreasing in λ:
∂ 2 VBentry
< 0.
∂pA ∂λ
(6)
The second comparative static shows that the influence of A’s price on B’s profits is moderated
by population price sensitivities. As price sensitivities become more dispersed (i.e., as λ
grows), the influence of A’s price on B’s profits decreases. This is intuitive: the more priceinelastic consumers are, the more willing they are to pay for a higher quality product, which
8
lessens the impact of A’s price on B’s profitability. This implies that an incumbent’s patent
protection has less impact on subsequent entry when consumers are less responsive to pricing.
(3) The effect of A’s price on B’s entry value is decreasing in ∆:
∂ 2 VBentry
< 0.
∂pA ∂∆
(7)
The third comparative static shows an analogous pattern is true for quality differences: the
larger the quality gap between A and B (as measured by ∆), the less the influence of A’s
price on B’s profits. This too is intuitive – drugs that are significant clinical advances should
not be highly impacted by an incumbent’s patent protection because the difference in quality
increases demand for the new drug. I analyze the empirical implications of these last two
predictions in the penultimate section of this paper.
With this expository framework and its predictions in mind, I next discuss my data. My
empirical analysis follows.
3
Data
I analyze how the number of drugs approved in a pharmacologic class is influenced by the
first in class drug’s market exclusivity. In the following, I briefly explain each of the main
data sources and its contribution, before providing an overview of the sample’s composition
and some summary statistics. Appendix Section B provides an extended discussion of the
data.
I begin with data from the FDA that classifies all NMEs approved in the United States
between 1987 and 2011 into pharmacologic classes.13 For all drugs, I then obtain the date
of first approval and first generic entry (if generic entry has occurred) from the FDA’s
Drugs@FDA database and the FDA’s Orange Book, respectively. Only 38% of drugs in the
sample have gone generic as of the end of 2013, so I supplement realized exclusivities with
a measure of expected exclusivity. I do this by identifying, for each drug, the single patent
most likely to inhibit generic entry (typically pertaining to a drug’s active ingredient); I then
proxy for the date of expected generic entry using this patent’s expiry date.14 Altogether,
13
See Lanthier et al. (2013). I focus exclusively on non-biologic drugs approved in the U.S., and in order
to ensure data completeness, I exclude classes in which the FIC was approved prior to 1987. The U.S. is not
the only market for pharmaceuticals but it is by far the largest, accounting for over 50% of global sales in
2000 (WHO (2004)).
14
Additional details are given in the appendix, but my methodology for identifying this patent is inspired
by Hemphill and Sampat (2012) and exploits the fact that the Hatch-Waxman Act of 1984 allows firms to
extend a single patent to make up for up to half the time spent in clinical trials; I use the expiry date of the
extended patent. Empirically, the expiration of extended patents is highly predictive of generic entry: for
9
of the 293 drugs in my sample which belong to 156 classes, I have a measure of exclusivity
for 237, of which 127 are first in class. Next, I collect data on the timing of clinical trials,
market sizes, and sales:
(1) Timing of Clinical Trials: Details on when pharmaceuticals begin development
is generally proprietary, but a prerequisite for a patent extension to make up time lost in
clinical trials is that firms publicly certify the beginning and end of clinical development.15 I
collect these data from the Federal Register.
(2) Market Size: My main measure of market size is inspired by Acemoglu and Linn
(2004)’s analysis of the effect of market size on pharmaceutical development. In particular,
using data from the Medical Expenditure Panel Survey, I identify the total annual US
prevalence of each class’s primary ICD-9 condition code. That is, I identify the number of
US individuals who suffer from a specific condition, and call this prevalence market size.16
(3) Sales: To capture the price dimension of profitability, I use data from IMS Health’s
National Sales Perspective which detail total annual U.S. sales for the 1000 top selling drugs
each year from 1992-2012.
Before turning to the summary statistics, I note that the categorization of “first in class”
I use differs slightly from the FDA’s formal categorization. This is motivated by the fact
that, in some cases, multiple drugs are approved very early on and sometimes one of the
early entrants is considerably more effective than the others. In these cases, the technical
definition of first in class does not coincide with the market’s focal early entrant. A poignant
example is given by the class of atypical antipsychotics: The first entrant, Clozaril, was
approved in 1989 but Clozaril’s mass-market appeal was severely limited because it produces
a potentially fatal side effect in 1-2% of patients (Alvir et al. (1993)). The second atypical
antipsychotic, Risperdal, had no such severe side effects and was granted priority review
status; after its approval in 1993, Risperdal rapidly became the standard of care, with annual
sales that were nearly 50% higher than Clozaril’s just one year after approval (Finkel (2012)).
Though Clozaril was technically the FIC, it was largely irrelevant (as a competitor) for future
entrants. Thus, in cases in which multiple drugs entered early on in short succession, my
the 81 drugs in my sample that have gone generic and have a patent for which an application for extension
was filed, the R2 from a regression of realized exclusivity on exclusivity predicted by the extended patent is
0.95. In robustness tests presented in the appendix, I also show that my results are robust to restricting the
sample to only those classes for which I have realized exclusivities.
15
The term clinical denotes development in humans, as opposed to laboratory or computational-based
development. These data were first analyzed by Keyhani et al. (2006).
16
As I note in the Appendix, I have experimented with other measures of market size and find they have
little influence on my results. Budish et al. (2014) similarly find their results are robust to conditioning on
different measures of market size.
10
strategy is to focus on what I call the effective FIC, which is the authentic FIC unless the
authentic FIC is immediately followed by a priority review drug, in which case it is that drug.
The effective FIC differs from the authentic FIC in 32 cases and is approved an average of
3.0 years after the authentic FIC. I probe the sensitivity of my results to this definition in
Appendix Section E.1; it should come as no surprise that my results are strongest for classes
in which the definitions of authentic and effective FIC coincide. For brevity, I refer to the
effective FIC simply as the FIC.
To summarize, the sample consists of all non-biologic drugs that belong to classes with first
approval in the period 1987-2011. Altogether, the sample consists of 156 classes representing
293 drugs. In practice, since my data on market exclusivities and the dates marking the
beginning of clinical development (used to compute the instrument) are not complete, I
restrict my analysis to the 111 classes for which I have that data, representing 252 drugs
(although this too I probe in Appendix Section E.1).
I present summary statistics on the sample in Table 1. The table consists of three panels
which respectively present statistics by class (Panel A), then by drug for FIC drugs only
(Panel B), and finally by drug but for all drugs (Panel C). Looking first to the by-class figures
in Panel A, the first row shows that class sizes are generally small but that they are skewed –
the mean number of entrants subsequent to the FIC is 0.73 (and the median 0) while the
maximum is 7. Mean clinical development times, in the second row, have a mean of 8.31 years
and standard deviation of 3.81 years. Mirroring class size, market size and maximum annual
revenue are highly skewed: the mean market size is about 8 million, while the largest is 45.5
million.17 The by-drug figures in Panels B and C show similar patterns; mean exclusivities
in both panels are just below 12 years and average times in clinical development are about
8 years. I forgo discussion of the length of time between patent filing and the beginning of
clinical development (my instrument for market exclusivity) until Section 5.2.
4
Facts About Competition and Entry
This section provides descriptive analysis of entry in the pharmaceutical industry. I first
probe two of the model’s main assumptions: that generics in class influence demand for
other (differentiated) branded drugs, and that pharmaceutical development is sequential and
not characterized by a single race to market. I then show that, consistent with the model’s
first prediction, subsequent entry is substantially less likely to occur after the FIC has gone
generic.
17
There are fewer than 111 observations in the fifth row because my revenue data only contains revenues
for one or more drugs in 88 of the 111 classes.
11
4.1
Generic Competition in Class
Although others have documented the fact that competition within a class of drugs – measured,
e.g., by the number of distinct molecules – impacts sales (see, e.g. Lichtenberg and Philipson
(2002)), to my knowledge there is no evidence on the specific impact of generic competition
in class on profitability. However, that the availability of one drug’s generic negatively affects
the sales of different drugs in the same class is crucial for my argument; if these drugs are
not close substitutes, the mechanism exposited by the model could not be rationalized by the
data.
Causally estimating the impact of one drug’s generic on the sales of others is difficult.
Although exploiting an event-study framework around the time of generic entry might seem
appealing at first glance, it is not clear that such a framework is appropriate because the
timing of generic entry is not random.18 Thus, my strategy in this section is to provide
descriptive and anecdotal evidence.
I begin with a case study. Lipitor was the fifth drug approved in the class of statin drugs
(technically, HMG-CoA reductase inhibitors), which primarily treat conditions associated
with cardiovascular disease. Lipitor came to market in 1996 and quickly achieved blockbuster
status – by the time it went generic in November of 2011, Lipitor had sold more than any
other medicine, with global sales of $125B over 14.5 years (Associated Press (2011)). However,
Lipitor’s sales did not grow monotonically over the period of its branded life; instead, Lipitor
sales peaked in 2006, when two of its closest competitors, the statins Zocor and Pravachol,
went generic. The press expected this to be a turning point for Lipitor’s sales (see Appendix
Section A.2), and indeed it was, as visualized in Figure 1a.19 Though it may not be causal,
the relationship between Lipitor’s sales and the generic entry of its competitors is striking,
with sales falling 25% from peak from 2006-2010. Lipitor was the best-selling drug of all time;
presumably if one drug was to be able to defend itself against its competitors’ generics, it
would have been Lipitor.
An analogous relationship is present across drug classes. In Figure 1b, I plot the log of
annual sales against the timing of first in class generic entry (so that year 0 denotes the year
of FIC generic entry), averaged across classes.20 Here, we see a similar downward trend that
starts when the FIC goes generic. While this is not a causal test, and other events affect the
results (e.g., some subsequent entrants themselves go generic three years after the FIC), the
18
Even on a relatively short timescale (e.g., one year in advance), generic entry may be anticipated in
important ways (e.g., through changes in marketing strategy of the type analyzed by Ellison and Ellison
(2011)).
19
The source for this sales data is IMS Health’s publicly available Top-Line Market Data, available at
www.drugs.com.
20
I take logs before averaging because (as described in Section 3) drug sales show substantial skew.
12
sales data do suggest that generic competition in a class impacts the sales of other drugs.
4.2
The Timing of Development Decisions
The model analyzed earlier assumed that the second firm’s entry decision was made after
the first firm had sunk its own fixed costs and entered. That development decisions are
sometimes sequential (as opposed to simultaneous) is important for the theory advanced in
this paper; otherwise, dates of generic entry would be aligned and it would be implausible
that one drug’s generic would deter the entry of another. My data, which detail the dates
that drugs entered clinical trials for the first time, speaks to this point.
Figure 2 presents a histogram which examines the timing of the start of clinical development
for subsequent entrants. The horizontal axis is normalized so that development start times
are relative to the FIC’s approval (at time = -1) and FIC generic entry (at time = 0). The
chart shows a large proportion – nearly 40% – of subsequent entrants do not begin clinical
development until the FIC is approved. This is important because although the start date
of clinical development is public after approval for approved drugs, the extent to which
pre-approval development decisions are public information is not clear; in the period before
FIC approval, market participants may have believed they were all pursuing approval in
tandem.21 However, approval is highly publicized so firms starting trials then could not have
mistakenly believed they could be first to market.
The figure also shows that no new drugs begin development after the FIC has gone generic
(there is no mass to the right of time = 0). This is consistent with the model’s prediction
that the incumbent’s generic reduces incentives for new firms to enter, as well as with what
Kevin Sharer, the former CEO of Amgen, told me: “Once we enter generic land, there’s no
incentive [to develop new drugs]” (quoted with permission, April 15, 2014).
4.3
The Timing of Subsequent Entry
If new drugs tend to be less profitable once the FIC has gone generic, then the long run
profitability of any given drug should be lower the later it enters (as the clock ticks on
the FIC’s exclusivity). All else equal, this should create a downward gradient in new drug
approvals over time, with few approvals after the FIC has lost exclusivity.22 I analyze this
21
Development decisions are often described as competitive intelligence, although at some level once a
human subject pool has been recruited and used in testing it is harder to keep secret, especially since investors
may require notification. Databases like Adis R&D Insight, Pharmaprojects, and Thomson Reuters Cortellis
purport to collect exactly this type of information, though the extent to which their data are collected
contemporaneously versus after the fact is not clear, nor is the extent to which they are complete.
22
Though I do not do so because it complicates the exposition slightly, it is easy to extend the model so
that B has patent protection for T periods, t of which are periods of duopoly (while both A and B are on
13
prediction in Figure 3, which shows a histogram of the timing of non-FIC approvals relative
to the FIC’s generic entry, where as before the horizontal axis is normalized within classes
so that time = -1 corresponds to when the FIC enters and time = 0 corresponds to when
the FIC goes generic. The plot shows that entry timing is negatively correlated with FIC
exclusivity, with nearly two thirds of non-FIC drug approvals occurring before just half of the
FIC’s branded lifetime has expired. The right half of the histogram is almost empty: very
few new drugs come to market in classes in which the FIC has gone generic. In Appendix
Section D, I analyze this relationship in regression form and find that the correlation between
the number of new entrants and remaining FIC exclusivity is statistically significant.23
5
Main Results
I have presented evidence that drugs in the same class appear to be substitutes, that entry
decisions are made sequentially, and that subsequent entry rarely occurs once the FIC has
gone generic. These findings lay the foundation for this paper’s thesis, which is that longer
FIC exclusivity increases subsequent entry. This section presents my main results. I first
describe my empirical framework before discussing potential confounders, my instrument,
and the results.
5.1
FIC Exclusivity and Subsequent Entry
My empirical strategy examines how the exclusivity of FIC drugs impacts subsequent
innovation. Formally, with j indexing drug classes, I estimate regressions of the form,
SubsEntrantsj = α + βF ICExclj + γ 0 Xj + εj ,
(8)
where SubsEntrantsj is the number of entrants subsequent to the FIC, F ICExclj is the
FIC’s market exclusivity, and Xj is a vector of controls. Given the count nature of drug
launches, I estimate quasi-maximum likelihood (QML) Poisson models, and since my data
patent), and T − t periods in which B competes with A’s generic. Since B’s profits are strictly greater when
A is on patent, B’s entry incentives are increasing in t.
23
I do not have an instrument for the time remaining on the FIC’s patent, so I do not interpret this
analysis causally. The ideal instrument for this context would be something that unpredictably and randomly
invalidates a branded incumbent’s patents. Such a shock would enable an event-study analysis where the
strategy would be to ask if entry is reduced after an incumbent’s patents are randomly invalidated. One
possibility for an instrument which has been exploited in prior research analyzing the financial impact of
generic entry (see Panattoni (2011) and Jacobo-Rubio (2014)) is the outcomes of Paragraph IV lawsuits,
which are sometimes precursors to generic entry. However, the sample of such lawsuits is small and neither
the timing nor the outcomes of Paragraph IV lawsuits appear to be random – they tend to occur shortly
after a drug’s active ingredient patent has expired and often result in generic entry.
14
are as of 2011 and some classes started earlier than others, I include FIC approval year fixed
effects throughout.24
Figure 4a illustrates the raw relationship between subsequent entry and FIC exclusivity
without controls and shows that there is indeed a strong positive correlation. However, the
slope of that graph should not necessarily be interpreted as causal; understanding specifically
what determine a drug’s market exclusivity is helpful for understanding where biases could
enter. Figure 5 visualizes the typical sequence of events in drug development for a drug that
progresses from discovery all the way to patent expiry. A prospective drug starts in pre-clinical
development and testing, which usually takes place in the lab. After an Investigational New
Drug (IND) Application is approved by the FDA, the drug progresses into the period of
regulatory review characterized by human clinical trials. If trials are viewed as successful in
proving safety and efficacy, a New Drug Application (NDA) is submitted to the FDA. In the
case of approval, the drug is marketed exclusively by its developer until it “goes generic” when
the first generic enters the market.25 Federal law guarantees that NMEs are protected from
generic entry for a minimum of five years after a drug is first approved, but in general entry
is restricted for longer because of patent protection. As a legal matter, patents pertaining to
active ingredients generally need to be filed before the beginning of clinical trials – once the
drug has been administered to humans, its novelty (required for enforceable patenting) can
be questioned.
Altogether, this means there are three main factors that influence the length of exclusivity.
The first factor pertains to the timing of approval, in the middle of Figure 5: As Budish et al.
(2014) point out, since patent lengths are fixed at 20 years (plus applicable extensions, which
tend to be minor), an important component of market exclusivity is simply the time a drug
spends in trials (“commercialization lag”, in their words). From the start of clinical trials,
the clock is ticking toward patent expiry, so long trials tend to reduce exclusivity. Thus,
to the extent that trial lengths are correlated within classes, then they could bias β in the
estimation of Equation (8).26 This means it is important that I control for the length of
24
Some classes have had very few years to allow for subsequent entry, so in Appendix Section E.4 I show
that restricting the sample to only those classes in which the data include at least 10 years after FIC entry
does not affect the results. I also note here that including fixed effects in a non-linear model typically leads
to an incidental parameters problem. In Poisson models, this can be corrected using Hausman et al. (1984)’s
transformation, which I apply throughout.
25
Though I focus only on approved drugs, the likelihood that any individual drug candidate progresses all
the way from the start of clinical review to approval is not high – on average, Hay et al. (2011) estimate it is
less than 10%.
26
For example, if trials in class j are short, then drugs in class j all have long exclusivities, so that
F ICExclj is larger. Keeping with the example, long exclusivities in class j presumably mean it is more
profitable, so if fixed costs are similar across classes then total entry in j is higher, meaning SubsEntrantsj
is larger. Then the positive relationship I observe between F ICExclj and SubsEntrantsj could be due to
the fact that classes with shorter trials are more attractive.
15
clinical review.
The second factor influencing exclusivity is the timing of generic entry. This factor
pertains to the end point on the right-hand side of Figure 5. For example, the innovator may
be able to file new auxiliary (yet enforceable) patents, e.g., on the molecule’s salt forms or
the manufacturing process, which make it difficult for generics to enter even after the AI
patent has expired. In some cases, the firm selling a branded drug might even contract with
generic entrants to stay out of the market in what is called a “reverse payment settlement.”27
Since the extent of any such manipulation is presumably driven by profitability, I control for
market sizes and additionally present an analysis which controls for sales.
Third and finally, the timing of the AI patent’s filing relative to the start of clinical
development is not always the same. Variation in the filing date affects the left-hand side
of Figure 5. As I explain below, scientific uncertainty leads the gap between patent filing
and the start of trials to exhibit substantial variation which is orthogonal to other class
characteristics. This provides the basis for my instrument.
However, before proceeding to the IV analysis, I present results which control for the
first two factors: time in trials and market size. Figure 4b shows that conditioning on these
controls, as well as fixed effects for the year of FIC approval (since some classes are older
than others), does not remove the positive relationship between subsequent entry and first in
class exclusivity.28
As an additional test for endogeneity in market exclusivity, I ask whether market exclusivities are positively related within classes. The motivation underlying this test is that if some
factor confounds the estimated relationship between F ICExclj and SubsEntrantsj , then
presumably that factor would also influence the exclusivity of other drugs in class j. This test
can only be operationalized for classes in which there is at least one subsequent entrant, but it
still provides insight into how much exclusivity is determined by factors that are idiosyncratic
to a drug versus common to a class. I implement this test by estimating an OLS model where
the outcome is the exclusivity of drug k and the independent variables are the exclusivity of
drug l, as well as my baseline controls for market size, time in trials, and year of FIC approval
fixed effects, for all pairwise combinations of drugs k and l belonging to the same class.
The coefficient estimate on the exclusivity of drug l is -0.0089 with standard error 0.0366,
where the standard error is robust and clustered by class.29 Overall, this suggests that after
27
Hemphill (2007, 2009) provide extensive description and analysis of reverse payment settlements.
The relationship is slightly weakened in the linear model presented in the figure, but it is actually
strengthened in the corresponding Poisson estimates which are presented, with controls added sequentially, in
the first three columns of Table 3. However, I forgo an extended discussion of these estimates until I take up
all of my main results in Section 5.3.
29
Appendix Figure C.1 visualizes a similar relationship by plotting the exclusivities of subsequent entrants
against the exclusivities of FIC drugs (not all pairwise exclusivities). Panel A shows that without controls the
28
16
conditioning on time in development and market size, the potential for endogeneity in naive
estimation of Equation (8) is likely to be limited. Nevertheless, I pursue clean identification
in the IV analysis below.
5.2
IV Strategy
I have shown that there is a strong relationship between FIC exclusivity and subsequent entry,
and that this relationship is not diminished by conditioning on time in trials and market size.
I have also shown that exclusivity is not significantly correlated among drugs within the same
class; this means an endogeneity story would require some external factor which impacts
both subsequent entry and FIC exclusivity but not the exclusivity of other drugs. However,
clean identification in this setting is possible through use of an instrument which exploits
the third principal factor determining market exclusivity: the timing of patent filing. This
section explains the logic underlying this instrument before presenting an empirical analysis
of the instrument itself.
5.2.1
The Timing of Patent Filing
Patent lifetimes are fixed, so the date of a drug’s AI patent filing has a strong influence on
the drug’s exclusivity. So what determines the timing of patent filing?
Firms are incentivized to file patents as late as possible (which, to ensure novelty, is the
day before the beginning of clinical trials) because doing so maximizes future exclusivity.
However, the reality is that patents are sometimes filed substantially in advance of the start
of clinical trials. The summary statistics presented in Table 1 show that, for FIC drugs,
patents are filed at median 4.43 years before clinical trials begin.30 Interviews with patents
experts and R&D directors suggest that this is no surprise. They point me towards three
primary factors that contribute to it.
First, there can be agency problems within firms. In particular, the career motives of
scientists and the motives of the larger organization are not necessarily aligned. Scientists
receive acclaim through research presented in papers and in conferences. Firms support
these endeavors, but they place a high value on intellectual property and tend to require
that patents be filed before new results are made public. Together, this means patents may
relationship is weak and statistically insignificant. Conditioning on mean development time in class, market
size, and year of FIC approval fixed effects leads to a weak negative association, as visualized in Panel B.
30
The date on which intellectual property protection is first sought is actually called a patent’s priority
date. Priority dates are sometimes called “effective filing dates” and determine expiration dates. More detail
on the differences between priority and filing dates are found in Appendix Section B.4. For simplicity, I refer
to the priority date throughout as the filing date.
17
be filed at a time that suits the scientist – before the firm is prepared to undertake clinical
review.
Second, there can be larger organizational frictions. The pharmaceutical industry has been
characterized by a tremendous amount of merger and acquisition activity in recent decades
(see, e.g., Deloitte (2009)). A major organizational shock like an acquisition presumably
complicates strategic decision making and might slow the progression from the lab to clinical
review. Below, I show empirically that mergers are associated with longer delays from patent
filing to the start of trials.
Third, and perhaps most importantly, the science of drug development is highly uncertain
while the patent system forces firms to act defensively. That is, the trajectory of a drug’s
development is not necessarily linear – a molecule is sometimes initially thought to treat
one condition when it later turns out to be better at treating another.31 Yet the owner of a
patent is whichever firm filed it first, and the discounted gain of waiting an extra year to file,
i.e., an extra year of exclusivity twenty years in the future, may be low relative to the loss
incurred if another firm files the patent first. This means firms file patents as soon as it is
known that a molecule may be of commercial interest, but before it is necessarily clear what
that commercial interest will be.
Consider, e.g., the path to approval of Arava, a drug presently marketed for rheumatoid
arthritis. The active ingredient in Arava was first discovered and patented in the late 1970s
by researchers searching for new agricultural pesticides (Oh and O’Connor (2013)). In
1985, researchers experimenting with rats believed Arava might have potential for use in
transplantation (Hoi and Littlejohn (2005)). However, it was not until 1993 that the drug
first entered clinical development – for arthritis. By the time Arava was approved in 1998, its
patent was already about to expire. The FDA’s exclusivity minimums kept generics out for
almost 7 years – about half of the mean exclusivity of almost 12 years in my sample. However,
that Arava’s development was delayed well past its initial discovery does not appear to be
the result of low sales expectations: at the time of approval, financial analysts estimated that
Arava’s annual sales could exceed $800 million by 2003 (WSJ (1998)). Consistent with the
thesis of this paper, Arava has now been off patent for almost a decade and there has been
no entry aside from Arava in its class.
5.2.2
Identification Strategy
My IV strategy exploits gaps between when patents are first established on a molecule and
the beginning of clinical trials. Specifically, my instrument for market exclusivity is the
time between the date on which intellectual property protection was first sought and the
31
Recall the case of Viagra in Footnote 6.
18
date marking the beginning of clinical development. I denote the instrument for drug i by
zi = tDevStart,i − tP atentF iling,i . Large, positive values of zi reflect molecules that are discovered
substantially before they are commercialized. For example, the gap between Arava’s patent
filing date and the start of clinical development was 15 years (1978 through 1993), and
its market exclusivity was subsequently just 7 years. Figure 6 shows a histogram of the
instrument for FIC drugs. Much of the mass is just above 0, reflecting patent filing shortly
before the beginning of trials.32 However, there is also a right tail in which drugs like Arava
are found.
Formally, identification requires that Corr(zj , εj ) = 0. That is, identification requires that
delays between patent filing and the start of clinical development for FIC drugs are unrelated
to other factors that affect entry in the class. Although this cannot be tested directly, in the
following two sections I provide two pieces of evidence to its effect. First, I ask descriptively
how the instrument relates to patent characteristics. I find no evidence that delays between
patent filing and the start of development signal anything about patent characteristics like
claims or citations, but they are related to factors like merger activity. Second, to dispel
concerns that the instrument might be picking something up about unobserved profitability,
I ask whether the instrument is related to sales in class, and, in a test like that used in my
analysis of market exclusivities, I ask also whether the instrument is significantly correlated
within class. I find no evidence for either.
5.2.3
The Instrument and Patent Characteristics
I analyze the relationship between the instrument and patent characteristics in Table 2.
Columns (1)-(3) respectively ask whether the instrument is correlated with the patent’s
number of claims, its number of citations, and the number of other patents that cite it.
The sample is the full sample of 189 drugs for which I observe the date on which clinical
development begins (and thus am able to compute a value for the instrument). Reflecting
the count nature of these outcome variables, I estimate QML Poisson models. The point
estimates are neither economically nor statistically significant in all cases.33 This suggests
these patents were not in some sense less “important” ex-ante, as judged by claims and
citations, nor ex-post, as judged by the number of other patents referencing the patent in
32
In fewer than 4% of cases, calculation of the instrument yields a negative value, reflecting a filing date
that occurs after the beginning of clinical trials. Since this might reflect that the patent identified by my
methodology is not an active-ingredient patent, I am hesitant to use these values and set the value of the
instrument in these cases to 0. However, leaving the instrument at its original values or dropping these
observations altogether does not affect the main results. I note also that the mass in the histogram would be
located closer to 0 if I focused on true filing dates, as these are always weakly greater than priority dates.
33
The results are similar if I focus on FIC drugs only.
19
question.34
Next, in columns (4)-(6), I ask whether the instrument is related to reassignment of
patent ownership, which is tracked by Thomson Innovation.35 Column (4) estimates an OLS
model of a dummy for reassignment on the instrument and shows that the instrument is
not statistically nor economically related to reassignment. In column (5), I ask whether
the instrument is related specifically to reassignment involving a merger, and this time
the estimate is positive and statistically significant at the 10% level. Finally, in column
(6) I analyze how the instrument relates to the length of the time between filing and first
reassignment, a measure which I view as a proxy for the degree of initial uncertainty. The
estimated coefficient is strong and positive.36 Altogether, Table 2 shows that drugs with large
zi ’s appear to have patents that are similar to those of other drugs, except that they are
more likely to have been involved in a merger and that they took longer to make it from the
filer’s hands into those new of a owner. These results suggest large zi are likely to originate
from organizational changes and scientific uncertainty, rather than from particularities of the
patent itself.
5.2.4
The Instrument and Class Characteristics
The evidence analyzed above provides context for the instrument but it does not speak
directly to the question of exogeneity: the instrument might still reflect something about a
class that influences both FIC exclusivity and total entry. For example, capacity-constrained
firms might put lower priority on less profitable markets, or it may simply be more difficult
to develop new drugs in some classes than others.
I examine the first possibility in Figure 7a, where I proxy for profitability using the log
of the maximum annual revenue earned by any drug in a class, and ask how that relates
to the instrument for FIC drugs. (I condition on my baseline controls: FIC approval year
fixed effects, market size, and mean development time in class.) The figure shows there is no
significant relationship between between class sales and the time between patent filing and
the start of development for the FIC.37
Though the instrument is not related to class sales does not mean it is not related to
34
Patent importance is frequently measured by patent citations, e.g. as in Hall et al. (2005).
Technically, I examine changes in patent assignee. Such changes can represent licensing agreements in
addition to changes in ownership.
36
In columns (5) and (6), the sample is conditional on any reassignment, so the number of observations
drops from 189 to 165.
37
I choose the maximum annual revenue earned by any drug in the class as a proxy for profitability because
this figure reflects whether a given class could possibly be a top seller. However, the results are similar if
I instead proxy for profitability with the maximum of the FIC drug’s annual sales. I additionally show in
Appendix Section E.5 that controlling directly for sales in my main regressions does not affect the results.
35
20
other class-specific unobservables, and this possibility is difficult to rule out completely. To
address it, I implement a test similar to that presented earlier: I ask whether the instrument
is correlated within classes. In particular, I estimate an OLS model where the outcome is
zk , the independent variables are zl and my baseline controls, and there is an observation
for all pairwise combinations of drugs k and l belonging to the same class. The estimated
coefficient on the market exclusivity of drug l is -0.00375 with standard error 0.0471, where
the standard error is robust and clustered by class. In Figure 7b, I visualize a similar analysis,
but this time restrict the sample to ask only how the instrument for subsequent entrants
compares with the instrument for FIC drugs (again, conditional on my baseline controls).
The figure shows the estimated relationship is economically and statistically insignificant. I
conclude that the instrument is unlikely to be picking up class-specific unobservables. I next
present the first stage and then turn to the results.
5.2.5
The First Stage
Figure 8 presents the first stage, where both axes are conditional on my baseline controls.
The relationship between the instrument and FIC exclusivity is strong – a one year change
in the value of the instrument is associated with 0.45 fewer years of exclusivity – and the
plot shows that the relationship remains strong across the support of the instrument. The
associated F-statistic is 43.52.
5.3
Results
In the previous sub-sections, I explained the sources of variation underlying a drug’s market
exclusivity and I presented evidence analyzing the potential for endogeneity in exclusivities. I
then proceeded to explain the logic behind my instrumental variable and presented evidence
analyzing its relationship with patent and market characteristics, before finally presenting the
first stage. This section presents my main results on how FIC exclusivity affects subsequent
entry.
Table 3 presents the estimates, with results from Poisson models in the first set of three
columns and from Poisson-IV models in the second set of three columns. Because of the
Poisson’s non-linearity, I implement the IV using 2-stage residual inclusion.38 All standard
errors are robust and the second stage IV standard errors are corrected for the two stage design
using the methodology of Murphy and Topel (1985) and Hardin (2002). All specifications
include fixed effects for the year of FIC approval. The first specification in each set of
38
The Poisson’s non-linearity means that simply plugging predicted values from the first-stage into the
second-stage yields inconsistent estimates. I implement a control function methodology as detailed in
Wooldridge (2002) and Imbens and Wooldridge (2007).
21
columns includes only the year of FIC approval fixed effects, and then in subsequent columns
I incrementally add my baseline controls. Corresponding first stage estimates are reported
below the IV results.
In all cases, I estimate a strong, positive and statistically significant effect of the FIC’s
exclusivity on subsequent entry. The point estimates remain relatively consistent as controls
are added. The Poisson-IV results are slightly larger in magnitude than the Poisson results,
but they are also less precise, and the differences between the coefficients are not statistically
significant. Overall, the estimates show a one-year increase in FIC exclusivity yields a 25-30%
increase in subsequent entry in class. Poisson models estimate proportional effects, so to
ease interpretation of the results, I present in the fifth row of the table the main exclusivity
coefficient multiplied by the mean of the dependent variable. These estimates, which I refer
to as “scaled”, are in units of subsequent drugs per year of first in class exclusivity. The
estimates presented in columns (3) and (6) show one additional year of first in class exclusivity
yields approximately 0.18 to 0.25 more subsequent drugs. This is a relatively large effect.
For example, it implies that if FIC exclusivities were just one standard deviation shorter
(about 3 years), the number of subsequent entrants in the average class would be reduced to
zero. Or, in the other direction, the estimates imply that increasing FIC exclusivities by one
standard deviation would double the number of subsequent entrants.
5.4
Robustness Checks
Appendix Section E presents five sets of robustness checks which verify the robustness of my
main results; these are omitted here for brevity. First, I show that the main Poisson results
remain similar when the sample restrictions described in Section 3 are relaxed or modified.
Second, I show that the main Poisson analysis survives placebo tests which analyze the role
of the exclusivities of non-FIC drugs on entry. Third, I investigate the robustness of the main
IV estimates. In particular, I present the reduced form of the second stage and show the IV
estimates are robust to a linear specification. Fourth, since some classes in my data have had
only a few years to accumulate new entrants, I show that the Poisson and Poisson-IV results
are unchanged when the sample is restricted to only those classes which have had at least
10 years for subsequent to entry to occur. Fifth, to ensure my results are not confounded
by class profitability, I show that the Poisson and Poisson-IV results are unchanged when I
control directly for sales.
22
6
Price Elasticities and Quality Levels
Having shown that FIC exclusivity influences subsequent entry, I turn to the second and third
predictions of the model: that the FIC’s patent should have a greater impact on subsequent
entry when (1) demand is more elastic and when (2) the entrant is a less significant clinical
advance.
6.1
Interaction with Price Elasticity
I first analyze how the effect of FIC exclusivity on subsequent entry is related to price
elasticities. I do not directly observe price elasticities and they are difficult to infer directly
from the data without imposing strong structural assumptions. Thus, my strategy is simply
to use two proxies for price elasticity. The first proxy is a dummy that captures whether a
drug treats a chronic condition and the second is the mean household income of patients.
Denoting the price elasticity proxy for class j by Dj , I then estimate the same model as before
but include a linear term for Dj and also the interaction of F ICExclj and Dj . Formally, I
estimate Poisson models of the form,
SubsEntrantsj = α + βF ICExclj + ψDj + φF ICExclj × Dj + γ 0 Xj + εj .
(9)
The following provides more detail on my measures and then describes the results.
6.1.1
Chronic Conditions
My first price elasticity proxy is an indicator variable that captures whether a class of drugs
treats a chronic condition (as opposed to one that is acute). This is is motivated by prior
evidence that demand for acute care tends to be inelastic.39 This is intuitive: the marginal
value of a single, one-time treatment for a chronic condition is likely lower (or at least less
salient) than for an acute condition. Moreover, treatment for chronic conditions takes place
over longer periods of time, giving patients more opportunity to seek out lower cost options.
To determine whether a given class treats a chronic condition, I augment my data with
the Chronic Condition Indicator distributed by the Agency for Healthcare Research and
Quality’s Healthcare Cost and Utilization Project (HCUP). This specifies whether a specific
ICD-9 code pertains to a chronic condition, allowing me to create a dummy for each class
which designates whether it treats a chronic condition. For example, the code 185 designates
39
Newhouse and the Insurance Experiment Group (1993) presents results from the RAND experiment;
Ringel et al. (2002) reviews this literature.
23
prostate cancer and is classified as chronic, while 041 designates a bacterial infection and is
not chronic.40 Overall, 83% of classes are classified as treating chronic conditions.
The results are reported in columns (1) and (2) of Table 4, Panel A, with the first column
presenting Poisson estimates and the second column presenting Poisson-IV estimates.41 The
results show that, consistent with the theory, the estimated effect of FIC exclusivity on
subsequent entry is significantly stronger for chronic conditions – in fact, the effect seems to
be largely driven by chronic conditions, as the non-interacted effect is small and statistically
indistinguishable from 0.
6.1.2
Household Income
My second proxy for price elasticity is the mean household income of patients. The idea is
simple: consumers with higher incomes are likely to be less sensitive to prices. That price
elasticities are related to income has a long tradition in the industrial organization literature
and is straightforward to derive out of a standard demand framework.42
To perform this analysis, I compute the average household income of patients in each
ICD-9 code using data from MEPS.43 The resulting measure appears consistent with existing
evidence on the incidence of specific conditions by socio-economic status. For example, ICD-9
code 250 designates diabetes mellitus and has a mean household income of about $50,000,
while 692 designates eczema and has a mean household income of about $80,000.44
I then estimate models which are analogous to those estimated for chronic conditions
except that they use the log of mean household income as Dj . The results are reported in
columns (3) and (4) of Table 4, Panel A, again with the first column presenting Poisson
estimates and the second column presenting Poisson-IV estimates. Consistent with the theory,
the interaction effect is significantly negative: i.e., the effect of FIC exclusivity on subsequent
entry is significantly stronger for conditions more prevalent among lower income patients.45
Indeed, the estimates suggest that the effect is moderated substantially by income: the effect
on subsequent entry of an extra year of FIC exclusivity is 13% in classes where patient
incomes are 10% higher than average, while it is 43% in classes where patient incomes are
40
Technically, ICD-9 185 is “malignant neoplasm of prostate” and 041 is “bacterial infection in conditions
classified elsewhere and of unspecified site.”
41
I now have two endogenous variables, so I need two instruments. Since the instrument is not binary, I
follow convention and include as the second instrument the square of the first.
42
See, e.g. Berry et al. (1995) for a derivation and Ackerberg et al. (2007) for a review.
43
Appendix Section B.5 provides additional detail.
44
Brancati et al. (1996) find that diabetes is more prevalent among low SES populations while Fu et al.
(2014) find the opposite is true of eczema. ICD-9 692 technically refers to “contact dermatitis and other
eczema.”
45
It is also worth noting that the coefficient on the log of mean household income is positive: intuitively,
classes in which patients are relatively higher income see more entry (conditional on market size).
24
10% lower.46
6.2
Interaction with Quality
The third comparative static signed by the model is the interaction of quality with patent
protection: the model predicts an incumbent’s exclusivity should have a lesser effect on drugs
which are substantially better than those already on the market.
As Kesselheim et al. (2013) write, quantifying differences in quality between drugs is
difficult; prior work has looked at a variety of measures including the number of citations a
drug receives in the medical literature, the number of citations its main patent receives, or
simply its sales. I take a direct approach, which is to ask whether a drug received a priority
review designation from the FDA.47
I perform this analysis by estimating Equation (8) once more, but this time I separate
subsequent entrants according to whether they received priority review status. The results
are reported in Panel B of Table 4. The first two columns respectively report Poisson
and Poisson-IV estimates analyzing the effect of FIC market exclusivity on the number of
subsequent entrants which are priority review, while the third and fourth columns do the
same for non-priority review drugs. The results in the fourth to last row, which reports the
exclusivity coefficients scaled by the mean of the dependent variable, are consistent with
the theory: the estimated effect of FIC exclusivity on subsequent priority review entrants is
roughly one-twentieth of that on subsequent non-priority review entrants. The differences
between these effects are significant at the 1% level. In other words, the FIC’s exclusivity
only impacts subsequent entry for non-priority review drugs.
7
Conclusion
This paper shows that patents have important effects on the direction of pharmaceutical
innovation. Specifically, I show that the length of an incumbent’s patent protection has a
positive impact on subsequent entry: an extra year of FIC exclusivity leads to an estimated
25-30% increase in subsequent drug approvals in the same class, which equates to about 0.2
46
Mean annual household income is $64,000 in the sample.
I am not the first to proxy for important advances using priority review status: among others, Lanthier
et al. (2013) and Dranove et al. (2014) implement similar approaches. A different approach would be to
estimate changes in consumer surplus using a full structural model, e.g., with a framework as in Petrin (2002)
who evaluates the welfare impact of the introduction of the minivan. Others have tried to estimate the
welfare impact of drug introductions (e.g., Arcidiacono et al. (2013)) but it is difficult to capture horizontal
differences across drugs – and the value of such differences to consumers – with the data that are available.
47
25
drugs. The effect is stronger for classes for which demand is more elastic and for drugs which
are lesser clinical advances.
My work has implications for how researchers and policymakers weigh the benefits and
disadvantages of patents. A simple framework that determines the optimal level of patent
protection by comparing a single would-be innovator’s incentives with the (subsequent) social
cost imposed by that innovator’s patent protection fails to account for the dynamic incentives
that the initial innovator’s patent protection provides to subsequent innovators. This paper
shows that properly weighing the pros and cons of patent protection means taking into
account not only how a single firm’s patents impacts its own incentives but also how those
incentives are shaped by other firms’ patents.
Prior work has not taken this second effect into consideration. For example, Kremer (1998)
proposes to eliminate the monopoly distortion created by patenting by having the government
buy out important patents through an auction mechanism. But doing away with patents
means shutting down precisely the effect I describe.48 My results show that implementing
such a mechanism would significantly change the incentives of subsequent entrants.
Of course, given the high fixed costs of drug development, it is not clear that a reduction
in entry would decrease welfare. My analysis focuses on the number of alternatives available
within a class of drugs – an outcome of direct and salient relevance to consumers – but I do
not attempt to quantify how patents impact social surplus because characterizing the welfare
effects of a change in patent length is difficult without strong assumptions about supply and
demand. The extent to which the effect I identify is influenced by incentives for business
stealing not clear, even though it may be tempting to read into the fact that my findings
are less pronounced for priority review drugs: this is an industry known for its outliers and
history shows it is not true that drugs which were neither first in class nor priority review
– i.e., the subsequent entrants I find are most affected by FIC exclusivity – are necessarily
unimportant, at least with respect to sales.49 For example, Singulair and Celexa did not
receive priority review and were, respectively, fourth and fifth to market in their classes, yet
both drugs’ annual sales surpassed $4B.50
More generally, this paper has implications for how intellectual property is characterized.
Traditional research identifies two independent levers in patent design: length – how long a
patent remains in force – and breadth – the extent to which a patent “covers” a field. This
paper shows that this characterization is too simple because it fails to account for the fact that
48
If Kremer (1998)’s mechanism were implemented, FIC drugs would be available immediately after
approval at marginal cost, so their market exclusivities would be effectively set to zero.
49
Bloom et al. (2013) provide evidence that business stealing does play an important role in the market
valuations of pharmaceutical manufacturers.
50
This figure comes from publicly available IMS Health data available at www.drugs.com.
26
length and breadth are linked through elasticities of substitution. For example, if increasing
the length of an incumbent’s patent protection increases the value of entry for differentiated
substitutes, then shorter patents are, effectively, more broad.51 Deeper understanding of this
competition-induced connection between length and breadth may yield new insights into how
intellectual property protection should be designed by the “economist-as-engineer” (Roth
(2002)) to shape innovation.
The focus in this paper has been on small-molecule drugs and the paper’s logic hinges
on the fact that generics are chemically equivalent to approved drugs yet they are cheap to
introduce once patents have expired. However, biologic drugs (which are more considerably
more complex at the molecular level) are an increasingly important part of the pharmaceutical
market and the precise notion of a “generic” biologic drug – called a biosimilar – has not yet
been established by regulators. My work suggests there is nuance to this definition because
the extent of biosimilar competition is likely to have important present and future impacts
on biopharmaceutical innovation.
Finally, the fundamental question considered in this paper is the extent to which the
cheap availability of existing products can undermine incentives to create new products.
Such a situation is unlikely to occur in contexts in which innovation progresses rapidly, or is
even accelerating. But that new generations of pharmaceuticals are cannibalized by generic
alternatives suggests a need for a broader understanding of the relationship between the
design of intellectual property protection and the speed of innovation.
References
Acemoglu, Daron and Joshua Linn, “Market Size in Innovation: Theory and Evidence
from the Pharmaceutical Industry,” Quarterly Journal of Economics, 2004, 119 (3), 1049–
1090.
Ackerberg, Daniel, Lanier C Benkard, Steven Berry, and Ariel Pakes, “Econometric
Tools for Analyzing Market Outcomes,” Handbook of Econometrics, 2007, 6, 4171–4276.
Alvir, Jose Ma J., Jeffrey A. Lieberman, Allan Z. Safferman, Jeffrey L. Schwimmer, and John A. Schaaf, “Clozapine-Induced Agranulocytosis,” The New England
Journal of Medicine, 1993, 329 (3), 162–167.
51
This line of reasoning bears some resemblance to that articulated by O’Donoghue et al. (1998), who
argue that in certain cases, what matters is not true patent life but rather the length of time a product has
on patent until a new product is developed which completely displaces the old product. They call this length
of time, “effective” patent life. However, they do not consider how the development of the new product might
actually be deterred by the expiration of the old product’s patent – i.e., the subject of this paper.
27
Arcidiacono, Peter, Paul B Ellickson, Peter Landry, and David B Ridley, “Pharmaceutical Followers,” International Journal of Industrial Organization, 2013, 31 (5),
538–553.
Associated Press, “Lipitor Becomes World’s Top-Selling Drug,” Crain’s New York Business,
2011, December 28.
Berenson, Alex, “Merck Loses Protection for Patent on Zocor,” The New York Times,
June 23 2006, June 23.
Berndt, Ernst R, “Pharmaceuticals in U.S. Health Care: Determinants of Quantity and
Price,” The Journal of Economic Perspectives, 2002, 16 (4), 45–66.
Berry, Steven, James Levinsohn, and Ariel Pakes, “Automobile Prices in Market
Equilibrium,” Econometrica, 1995, 63 (4), 841–890.
Bessen, James and Eric Maskin, “Sequential Innovation, Patents, and Imitation,” RAND
Journal of Economics, 2009, 40 (4), 611–635.
Bloom, Nicholas, Mark Schankerman, and John Van Reenen, “Identifying Technology Spillovers and Product Market Rivalry,” Econometrica, 2013, 81 (4), 1347–1393.
Brancati, F. L., P. K. Whelton, L. H. Kuller, and M. J. Klag, “Diabetes Mellitus,
Race, and Socioeconomic Status: A Population-Based Study,” Annals of Epidemiology,
Jan 1996, 6 (1), 67–73.
Branstetter, Lee, Chirantan Chatterjee, and Matthew J Higgins, “Killing the
Golden Goose or Just Chasing it Around the Farmyard?: Generic Entry and the Incentives
for Early-Stage Pharmaceutical Innovation,” Working paper, 2014.
Budish, Eric, Benjamin N Roin, and Heidi Williams, “Do Firms Underinvest in
Long-Term Research? Evidence from Cancer Clinical Trials,” American Economic Review,
forthcoming, 2014.
Civan, Abdulkadir and Michael T Maloney, “The Effect of Price on Pharmaceutical
R&D,” The B.E. Journal of Economic Analysis & Policy, 2009, 9 (1), 1–22.
Cockburn, Ian M., “Is the Pharmaceutical Industry in a Productivity Crisis?,” in Josh
Lerner and Scott Stern, eds., Innovation Policy and the Economy, Vol. 7 MIT Press 2007,
pp. 1–32.
Deloitte, “Acquisitions versus Product Development: An Emerging Trend in Life Sciences,”
Technical Report, Deloitte, Inc. 2009.
DiMasi, Joseph A, Ronald W Hansen, and Henry G Grabowski, “The Price of
Innovation: New Estimates of Drug Development Costs,” Journal of Health Economics,
2003, 22 (151–185).
28
Dranove, David, Craig Garthwaite, and Manuel Hermosilla, “Pharmaceutical Profits
and Innovation: Evidence from Medicare Part D and the Biotechnology Sector,” Working
paper, 2014.
Ellison, Glenn and Sara Fisher Ellison, “Strategic Entry Deterrence and the Behavior
of Pharmaceutical Incumbents Prior to Patent Expiration,” American Economic Journal:
Microeconomics, February 2011, 3 (1), 1–36.
Finkel, Rhona, “The Atypical History of Atypical Antipsychotics,” Drug Information and
Side Effects Database, 2012, September 9, 2012.
Fu, T., E. Keiser, E. Linos, R. M. Rotatori, K. Sainani, B. Lingala, A. T. Lane,
L. Schneider, and J. Y. Tang, “Eczema and Sensitization to Common Allergens in the
United States: A Multiethnic, Population-Based Study,” Pediatric Dermatolology, 2014, 31
(1), 21–26.
Fudenberg, Drew, Richard J. Gilbert, Joseph E. Stiglitz, and Jean Tirole, “Preemption, Leapfrogging and Competition in Patent Races,” European Economic Review,
1983, 22 (1), 3–31.
Gallini, Nancy T, “Patent Policy and Costly Imitation,” RAND Journal of Economics,
1992, 23 (1), 52–63.
Gilbert, Richard and Carl Shapiro, “Optimal Patent Length and Breadth,” RAND
Journal of Economics, 1990, 21 (1), 106–112.
Green, Jerry R and Suzanne Scotchmer, “On the Division of Profit in Sequential
Innovation,” RAND Journal of Economics, 1995, 26 (1), 20–33.
Griliches, Zvi, “Patent Statistics as Economic Indicators: A Survey,” in Zvi Griliches, ed.,
R&D and Productivity: The Econometric Evidence, University of Chicago Press, 1998,
pp. 287–343.
Hall, Bronwyn H, Adam Jaffe, and Manuel Trajtenberg, “Market Value and Patent
Citations,” RAND Journal of economics, 2005, pp. 16–38.
Hardin, James W., “The Robust Variance Estimator for Two-Stage Models,” The Stata
Journal, 2002, 2 (3), 253–266.
Hausman, Jerry A, Bronwyn H Hall, and Zvi Griliches, “Econometric Models for
Count Data with an Application to the Patents-R&D Relationship,” Econometrica, 1984,
52 (4), 909–938.
Hay, Michael, Jesse Rosenthal, David Thomas, and John Craighead, “BIO /
BioMedTracker: Clinical Trial Success Rates Study,” Technical Report, BioTechnoloy
Industry Association 2011.
Hemphill, C Scott, “Drug Patent Settlements Between Rivals: A Survey,” Working paper,
2007.
29
, “Paying for Delay: Pharmaceutical Settlement as a Regulatory Design Problem,” New
York University Law Review, 2009, 1553, 101–167.
and Bhaven N Sampat, “Evergreening, Patent Challenges, and Effective Market Life
in Pharmaceuticals,” Journal of Health Economics, 2012, 31, 327–339.
Hoi, Albert A and Geoffrey Littlejohn, “Leflunomide,” in Richard O. Day, Daniel E.
F¨
urst, Piet L. C. M. van Riel, and Barry Bresnihan, eds., Antirheumatic Therapy: Actions
and Outcomes Progress in Inflammation Research, Birkh¨auser Basel, 2005, pp. 199–219.
Imbens, Guido W. and Jeffrey M Wooldridge, “What’s New in Econometrics? Control
Function and Related Methods,” NBER Lectures, 2007, 1, 1–27.
Jacobo-Rubio, Ruben, “The Private Value of Entry and Deterrence in the US Pharmaceutical Industry,” Working paper, 2014.
Kesselheim, A S, B Wang, and J Avorn, “Defining “Innovativeness” in Drug Development: A Systematic Review,” Clinical Pharmacology & Therapeutics, 2013, 94 (3),
336–348.
Keyhani, Salomeh, Marie Diener-West, and Neil Powe, “Are Development Times for
Pharmaceuticals Increasing or Decreasing?,” Health Affairs, 2006, 25 (2), 461–8.
Klemperer, Paul, “How Broad Should the Scope of Patent Protection Be?,” RAND Journal
of Economics, 1990, 21 (1), 113–130.
Kremer, Michael, “Patent buyouts: A mechanism for encouraging innovation,” Quarterly
Journal of Economics, 1998, 113 (4), 1137–1167.
Lanthier, Michael, Kathleen L Miller, Clark Nardinelli, and Janet Woodcock,
“An Improved Approach to Measuring Drug Innovation Finds Steady Rates of First-in-Class
Oharmaceuticals, 1987-2011,” Health Affairs, August 2013, 32 (8), 1433–1439.
Lerner, Josh, “Patent Protection and Innovation Over 150 Years,” NBER Working Paper
8977, 2002.
Lichtenberg, Frank R, “The Impact of New Drugs on US Longevity and Medical Expenditure, 1990-2003: Evidence from Longitudinal, Disease-Level Data,” American Economic
Review, 2007, 97 (2), 438–443.
and Tomas J Philipson, “The Dual Effects of Intellectual Property Regulations: Withinand Between- Patent Competition in the US Pharmaceuticals Industry,” NBER Working
Paper 9303, 2002.
Moser, Petra, “How Do Patent Laws Influence Innovation? Evidence from NineteenthCentury World Fairs,” American Economic Review, 2005, 95 (1214–1236).
Murphy, Kevin M and Robert H Topel, “Estimation and Inference in Two Step
Econometric Models,” Journal of Business and Economic Statistics, 1985, 3 (4), 370–379.
30
Newhouse, Joseph P and the Insurance Experiment Group, Free for all? Lessons
from the RAND Health Insurance Experiment, Harvard University Press, 1993.
Nordhaus, William D., “The Optimal Life of a Patent,” Cowles Foundation Discussion
Papers 241, Cowles Foundation for Research in Economics, Yale University 1967.
Nordhaus, William D, “An Economic Theory of Technical Change,” American Economic
Review, 1969, 59 (2), 18–28.
, “The Optimal Life of a Patent: Reply,” American Economic Review, 1972, 62 (3), 428–431.
NSF, Science and Engineering Indicators 2012, National Science Foundation, 2012.
O’Donoghue, Ted, Suzanne Scotchmer, and Jacques-Fran¸cois Thisse, “Patent
Breadth, Patent Life, and the Pace of Technological Progress,” Journal of Economics &
Management Strategy, 1998, 7 (1), 1–32.
Oh, Jiwon and Paul W O’Connor, “An Update of Teriflunomide for Treatment of
Multiple Sclerosis,” Therapeutics and Clinical Risk Management, January 2013, 9, 177–90.
Pammolli, Fabio, Laura Magazzini, and Massimo Riccaboni, “The Productivity
Crisis in Pharmaceutical R&D,” Nature Reviews Drug Discovery, June 2011, 10 (6),
428–38.
Panattoni, Laura E, “The Effect of Paragraph IV Decisions and Generic Entry Before
Patent Expiration on Brand Pharmaceutical Firms,” Journal of Health Economics, January
2011, 30 (1), 126–45.
Parker, Ian, “The Big Sleep,” The New Yorker, 2013, December 9.
Petrin, Amil, “Quantifying the Benefits of New Products: The Case of the Minivan,”
Journal of Political Economy, August 2002, 110 (4), 705–729.
Reiffen, David and Michael R Ward, “Generic Drug Industry Dynamics,” The Review
of Economics and Statistics, 2005, 87 (1), 37–49.
Ringel, Jeanne S, Susan D Hosek, Ben A Vollaard, and Sergej Mahnovski, “The
Elasticity of Demand for Health Care: A Review of the Literature and its Application
to the Military Health System,” Technical Report, RAND National Defense Research
Institute 2002.
Roth, Alvin E, “The Economist as Engineer: Game Theory, Experimentation, and Computation as Tools for Design Economics,” Econometrica, 2002, 70 (4), 1341–1378.
Sakakibara, Mariko and Lee Branstetter, “Do Stronger Patents Induce More Innovation? Evidence from the 1998 Japanese Patent Law Reforms,” RAND Journal of Economics,
2001, 32 (1), 77–100.
Sampat, Bhaven N and Heidi Williams, “How Do Patents Affect Follow-On Innovation:
Evidence From the Human Genome,” Working paper, 2014.
31
Scannell, Jack W, Alex Blankley, Helen Boldon, and Brian Warrington, “Diagnosing the Decline in Pharmaceutical R&D Efficiency,” Nature Reviews Drug Discovery,
2012, 11 (March), 191–200.
Scherer, F M, “The Optimal Life of a Patent,” American Economic Review, 1972, 62 (3),
422–427.
Scotchmer, Suzanne, “Standing on the Shoulders of Giants: Cumulative Research and the
Patent Law,” Journal of Economic Perspectives, 1991, 5, 29–41.
WHO, The World Medicines Situation, World Health Organization, 2004.
Wooldridge, Jeffrey M, Econometric Analysis of Cross Section and Panel Data, Cambridge,
MA: The MIT Press, 2002.
WSJ, “FDA Advisory Panel Recommends Approving Hoechst Arthritis Drug,” The Wall
Street Journal, 1998, August 7.
32
Figures and Tables
Revenue ($Bn)
5
6
7
Mean Log Revenue of Subs. Entrants ($Bn)
2.66
3.25
3.97
Figure 1: Generic Entry and Sales of Subsequent Entrants
Last Year Before
FIC Generic Available
3
2.18
4
Zocor & Pravachol
Generics Enter
2000
2002
2004
2006
2008
-5
2010
-4
-3
Year
(a) Sales of Lipitor
-2
-1
0
FIC Generic
Time (years)
1
2
3
(b) Sales of All Subsequent Entrants
Notes: These figures respectively show plots of the annual sales over time. Panel A plots annual US sales for
Lipitor, where the data come from IMS Health’s publicly available Top-Line Market Data. Panel B shows the
mean of log annual sales of subsequent entrants relative to the time of the FIC’s generic entry. The sample is
as described in Section 3.
Figure 2: Timing of Clinical Development for Subsequent Entrants
0
Start of Clinical Development
for Subsequent Entrants
5
10
39%
-2.5
-1.8
FIC Clin. Dev.
(Mean)
-1
FIC Approval
-.5
0
.5
FIC Generic Entry
Time Normalized by FIC's Market Exclusivity
Notes: This figure shows a histogram of the timing of the start of clinical development for subsequent entrants
relative to FIC generic entry, where the x-axis is denominated by the FIC’s market exclusivity so that -1
corresponds to FIC approval and 0 corresponds to FIC generic entry. The start of clinical development is
defined as the date on which an Investigational New Drug Application, a required precursor to the start of
human clinical trials, is approved. The sample is as described in Section 3.
33
0
5
Subsequent Entrants
10
15
20
Figure 3: Timing of Subsequent Entry
-1
FIC Approval
-.5
0
FIC Generic Entry
.5
1
Time Normalized by FIC's Market Exclusivity
Notes: This figure shows a histogram of the timing of subsequent entry relative to FIC generic entry, where
the x-axis is denominated by the FIC’s market exclusivity so that -1 corresponds to FIC approval and 0
corresponds to FIC generic entry. The sample is as described in Section 3. The relationship visualized here is
analyzed empirically in Appendix Section D.
4
8
Figure 4: Subsequent Entry and First in Class Exclusivity
Resid. Number of Subs. Entrants in Class
-2
0
2
Atypical antipsychotics
Number of Subs. Entrants in Class
0
2
4
6
HMG-CoA reductase inhibitors
Serotonin (5-HT)1B/1D receptor agonists
-4
-2
SSRIs
5
10
15
Market Exclusivity of FIC (years)
20
-8
Coef: 0.150, SE: 0.0344
-4
0
4
Resid. Market Exclusivity of FIC (years)
8
Coef: 0.108, SE: 0.0244
(a) Unresidualized
(b) Residualized
Notes: Panel A figure shows a plot of the number of entrants subsequent to the FIC drug against the FIC
drug’s market exclusivity. Classes with at least 5 subsequent entrants are labeled. Panel B shows a plot of
the residualized number of entrants subsequent to the FIC against the FIC’s residualized market exclusivity.
Residuals are conditional on year of FIC approval fixed effects, mean development time, and market size, and
the specification of the controls and sample are as described in Section 3. The slope of the line of best-fit and
its associated robust standard error are presented in the bottom left of the figure. The sample is as described
in Section 3.
34
Figure 5: Timeline of Drug Development
Begin Dev.
IND Appr.
NDA
Subm.
Appr.
Generic Entry
Time
Pre-Clinical (Rats, etc.)
Regulatory Review (Testing & Approval Phase;
Human Trials)
Market Exclusivity
Patent Expiry & Generic Entry
Patent Filing
20 Years + Extension
IND = Investigational New Drug
NDA = New Drug Application
Notes: This figure shows the typical timeline of drug development. In particular, it depicts how market
exclusivity, which is defined as the time between NDA approval and generic entry, is impacted by the timing
of patent filing.
0
10
Frequency
20
30
40
Figure 6: Histogram of the Time from Patent Filing to Clinical Development
-10
0
10
Time from Patent Filing to Clinical Development (years)
20
Notes: This figure shows a histogram of the time from patent filing to the start of clinical development for
FIC drugs. The start of clinical development is defined as the date on which an Investigational New Drug
Application, a required precursor to the start of human clinical trials, is approved. The sample is as described
in Section 3.
35
-4
-5
Resid. Instrument: Subs. Entrants
0
5
10
Resid. Log of Max Annual Revenue (by Class)
-2
0
2
4
15
Figure 7: Evidence on the Validity of the Instrument
-5
0
5
Resid. Instrument: FIC Drugs
10
15
-5
Coef: -0.024, SE: 0.040
0
5
Resid. Instrument: FIC Drugs
10
Coef: 0.124, SE: 0.214
(a) Comparing Class Sales with the Time from (b) Comparing the Time from Patent Filing to
Patent Filing to Clinical Dev. for FIC Drugs Clinical Development for Subs. and FIC Drugs
Notes: These figures respectively plot class sales against the instrument for FIC drugs and the instrument
for drugs subsequent to the FIC against the instrument for FIC drugs. The instrument is the time between
patent filing and clinical development and all measures are conditional on year of FIC approval fixed effects,
mean development time, and market size. The measure of class sales is the log of the maximum of annual
sales for all drugs in the class. The specification of the controls and sample are as described in Section 3 and
the slope of the line of best-fit and its associated robust standard error clustered by drug class are presented
in the bottom left of each figure.
-10
Resid. Market Exclusivity of FIC (years)
-5
0
5
Figure 8: Relationship Between Market Exclusivity and Time from
Patent Filing to Clinical Development
-5
0
5
10
Resid. Time from Patent Filing to Clinical Development (years)
15
Coef: -0.445, SE: 0.0675
Notes: This figure shows a plot of the residualized first-stage relationship between a FIC drug’s market
exclusivity and the time between its patent filing and start of clinical development. Residuals are conditional
on year of FIC approval fixed effects, mean development time, and market size, and the specification of the
controls and sample are as described in Section 3. The slope of the line of best-fit and its associated robust
standard error are presented in the bottom left of the figure.
36
Table 1: Summary Statistics
Number of Subsequent Entrants in Class
Mean Time in Clinical Development (yrs)
Market Size (1,000,000s)
Maximum Annual Revenue ($1,000,000s)
Mean
0.73
8.31
7.88
1,000.12
Median
0
7.53
3.22
364.96
Panel A: By Class
Std Dev
Min
1.39
0
3.81
0.78
10.51
0.08
1,665.66
26.84
Max
7
26.97
45.55
8,558.62
N
111
111
111
88
Market Exclusivity (yrs)
Time in Clinical Development (yrs)
Patent Filing to Clinical Development (yrs)
Maximum Annual Revenue ($1,000,000s)
Mean
11.81
7.98
5.25
708.79
Panel B: By Drug, First in Class Only
Median
Std Dev
Min
Max
12.65
3.16
5.00
18.32
6.98
4.06
0.78
26.97
4.43
3.87
0.00
20.39
245.35
1,227.84
24.51
7,064.03
N
111
111
111
85
Market Exclusivity (yrs)
Time in Clinical Development (yrs)
Patent Filing to Clinical Development (yrs)
Maximum Annual Revenue ($1,000,000s)
Mean
11.61
8.21
4.95
841.37
Median
12.66
7.24
4.35
287.82
Panel C: By Drug, All
Std Dev
Min
3.25
5.00
3.88
0.78
3.62
0.00
1,418.35
13.80
N
196
192
189
166
Max
18.32
26.97
20.39
8,558.62
Notes: This table presents summary statistics for the main sample of 111 drug classes as described in Section 3.
Panel A presents statistics by drug class, Panel B by drug for FIC drugs only, and finally Panel C presents
statistics for all drugs. There are fewer than 111 observations in the rows describing maximum annual
revenues because I only observe revenues for 88 classes and 85 drugs of the 111 classes analyzed. Panel C also
faces sample restrictions: of the 252 drugs in the sample, I only observe market exclusivity for 196, the timing
of clinical development for 192, the value of the instrument for 189 observations, and finally revenues for 166.
37
Table 2: Patent Characteristics and the Time between Patent Filing and Clinical Development
Dependent Variable is
Number of Number of
Claims
Citations
(1)
Patent Filing to 0.00476
Clinical Dev. (yrs) (0.0188)
Estimation
Mean of Dependent Variable
N
Number of
Patents
Citing
Time from
(1/0): Any
(1/0):
Filing to
Patent Reassigned First Reass.
Reassign. In Merger
(yrs)
(2)
-0.0348
(0.0277)
(3)
-0.0155
(0.0187)
(4)
-0.00279
(0.00703)
(5)
0.0169*
(0.00955)
(6)
0.338**
(0.143)
Poisson
Poisson
Poisson
OLS
OLS
OLS
16.19
18.93
79.70
0.885
0.182
5.358
189
189
189
189
165
165
Notes: This table examines the relationship between patent characteristics and the instrument, which is the
time between patent filing and clinical development. The start of clinical development is defined as the date
on which an Investigational New Drug Application, a required precursor to the start of human clinical trials,
is approved. Columns (1)-(3) respectively present Poisson models of the relationship between the instrument
and the patent’s number of claims, number of citations, and number of other patents that cite it. Columns
(4)-(6) examine whether the instrument is related to reassignment by estimating OLS models. Column (4)
regresses a dummy for any reassignment on the instrument, column (5) regresses a dummy for whether that
patent was ever reassigned in a merger transaction on the instrument, and column (6) regresses the time from
filing to first reassignment on the instrument. The sample is the full of drugs for which I observe the start
of clinical development. Specifications (5) and (6) are conditional on any reassignment, so the number of
observations drops from 189 to 165. Poisson models are estimated by quasi-maximum likelihood and robust
standard errors are reported in parentheses. *** p<0.01, ** p<0.05, * p<0.1.
38
Table 3: Estimates of the Effect of First in Class Exclusivity on Subsequent Entry
Dependent Variable is Number of Subsequent Entrants in Class (mean = 0.73)
Market Exclusivity of FIC (years)
QML Poisson Models
(1)
(2)
(3)
0.229***
0.243***
0.251***
(0.0604)
(0.0631)
(0.0613)
QML Poisson-IV Models
(4)
(5)
(6)
0.411**
0.335***
0.337***
(0.181)
(0.128)
(0.128)
Mean Development Time
Market Size
Year of FIC Approval Fixed Effects
no
no
yes
yes
no
yes
yes
yes
yes
no
no
yes
yes
no
yes
yes
yes
yes
Exclusivity Coef x Mean of Dep Var
0.167
0.177
0.183
0.300
0.245
0.246
Estimates from the First Stage:
Patent Filing to Clinical Dev. (years)
-
-
-
-0.284***
(0.0653)
-0.442***
(0.0669)
-0.445***
(0.0675)
F-Statistic
-
-
-
18.84
43.55
43.52
111
111
111
111
111
111
N
Notes: This table presents estimates of the effect of first in class exclusivity on subsequent entry. Columns
(1)-(3) present results from quasi-maximum likelihood Poisson models which incrementally add controls for
mean development time in class and market size. Columns (4)-(6) replicate columns (1)-(3) but instrument
for FIC market exclusivity using the time between patent filing and the start of clinical development, where
the start of clinical development is defined as the date on which an Investigational New Drug Application, a
required precursor to the start of human clinical trials, is approved. All models are conditional on year of
FIC approval fixed effects. The IV models are implemented using a control function and first stage estimates
are presented in the final rows of the table. The sample and controls are specified as described in Section 3.
Robust standard errors are reported in parentheses and standard errors for the IV models are corrected for
the two-stage design as described in the text. *** p<0.01, ** p<0.05, * p<0.1.
39
Table 4: Demand Elasticities and Priority Review Designations
Panel A: Interaction Effects
Dependent Variable is Number of Subsequent Entrants in Class
Market Exclusivity of FIC (years)
Chronic
Chronic x Market Exclusivity of FIC (years)
(1)
-0.00510
(0.120)
-2.702
(1.853)
0.251*
(0.136)
(2)
0.0694
(0.134)
-3.616*
(1.975)
0.322**
(0.148)
Log Income
Log Income x Market Exclusivity of FIC (years)
Mean Development Time
Market Size
Year of FIC Approval Fixed Effects
Estimation
F-Statistic from the First Stage
N
(3)
16.49**
(6.654)
(4)
16.66***
(6.050)
19.00**
(8.174)
-1.472**
(0.601)
18.98**
(7.379)
-1.480***
(0.544)
yes
yes
yes
yes
yes
yes
yes
yes
yes
yes
yes
yes
Poisson
-
Poisson-IV
21.22
Poisson
-
Poisson-IV
20.49
111
111
111
111
Panel B: By Priority Review Designation
Dependent Variable is Number of
Dependent Variable is Number of
Subs. Priority Entrants in Class
Subs. Non-Priority Entrants in Class
(1)
0.101
(0.0761)
(2)
0.168
(0.256)
(3)
0.298***
-0.0779
(4)
0.425***
(0.157)
Mean Development Time
Market Size
Year of FIC Approval Fixed Effects
yes
yes
yes
yes
yes
yes
yes
yes
yes
yes
yes
yes
Mean of Dependent Variable
Exclusivity Coef x Mean of Dep Var
0.09
0.009
0.09
0.015
0.64
0.191
0.64
0.272
Poisson
111
Poisson-IV
43.52
111
Poisson
111
Poisson-IV
43.52
111
Market Exclusivity of FIC (years)
Estimation
F-Statistic from the First Stage
N
Notes: Panel A replicates the base analysis in Table 3 but analyzes, in columns (1) and (2), the interaction
of FIC exclusivity with a dummy for whether an ICD-9 code is a chronic condition, and in columns (3)
and (4), the interaction of FIC exclusivity with the log of mean income of patients in that ICD-9. Panel B
replicates the base analysis in Table 3 but splitting new drugs by Priority-Review status, an expedited review
status granted by the FDA for drugs that are expected to present significant clinical advances. Results are
from Poisson and Poisson-IV models estimated by quasi-maximum likelihood. The instrument, which is the
difference in time between the patent’s filing date and the start of clinical development, is implemented as a
control function. The sample and controls are specified as described in Section 3. Robust standard errors
are reported in parentheses and standard errors for the IV models are corrected for the two-stage design as
described in the text. *** p<0.01, ** p<0.05, * p<0.1.
40
Appendices for Online Publication
Appendix A
Anecdotal Evidence
This section reproduces two quotes from the popular press.
A.1
Belsomra vs. Ambien
The following quote from The New Yorker reproduces the explanation given by a Merck
neuroscientist in response to a question about how Merck evaluated the decision to pursue
the development of Belsomra, a competitor to the blockbuster insomnia drug, Ambien. The
quote suggests Merck was concerned about the fact that a generic version of Ambien would
be available shortly.
The perception at that time was, “You have a lot of medications available – should
we be working on this? How large was the population of insomniacs poorly served
by Ambien? Should Merck invest in a market dominated by a drug that, within a
few years, would become a cheap generic? ”
Parker (2013), emphasis added
A.2
Lipitor vs. Zocor
The following quote from The New York Times suggests Lipitor was expected to lose market
share to Zocor’s generic, when it became available.
Today, Merck’s cholesterol-lowering drug Zocor loses its United States patent
protection, becoming the largest-selling drug yet to be opened to cheap generic
competition.
That change will cost Merck billions of dollars a year. But it could be nearly
as damaging to Pfizer, whose rival cholesterol drug, Lipitor, is the world’s most
popular medicine, with global sales last year of $12 billion.
Berenson (2006), emphasis added
41
Appendix B
Data Appendix
This section provides more detail as to how I compute various components of the data set
described in Section 3.
B.1
Dates of Approval and Generic Entry
Dates of first approval come from New Drug Applications (NDAs) in the Drugs @ FDA
database. Next, I obtain the date of first generic entry, if available, by matching drugs by
active ingredient to Abbreviated New Drug Applications (ANDAs) in the FDA’s Approved
Drug Products with Therapeutic Equivalence Evaluation (the Orange Book). Following
Hemphill and Sampat (2012), I include only generic alternatives with therapeutic equivalence
ratings of “A” to ensure that the date of generic entry used corresponds to the date a generic
alternative became available that is chemically equivalent to the branded drug.
B.2
Expected Exclusivity
Firms sometimes file dozens of patents on a single drug so identifying key patents by hand
is difficult. My strategy is to exploit the fact that the Hatch-Waxman Act of 1984 allows
pharmaceutical manufacturers to extend a single patent for as much as half of the time
a drug spent in development. As Hemphill and Sampat (2012) note, patents selected for
extension typically pertain to active ingredients – i.e., the extended patent is typically a
drug’s primary patent. Indeed, Hemphill and Sampat (2012) codify patents for drugs that
went generic in the 2000’s and find that the extended patent represents the patent on the
drug’s active-ingredient in 79% of drugs analyzed. I obtain a list of extended patents from
the USPTO, and the dates of filing and expiration for each patent from Thomson Innovation.
I additionally note here that the FDA provides a floor of 5 years of market exclusivity for
any new molecular entity, so I impute a market of 5 years for the 18 drugs that receive less
than 5 years of exclusivity from the patent extension. This is conservative, since the floor of
five years is often supplemented by additional extensions for pediatric indications and for
orphan drugs.
B.3
Market Size
My measure of market size is derived from the total number of patients afflicted by the
primary condition treated by class of drugs. Using the Medical Expenditure Panel Survey’s
(MEPS) Prescribed Medicines data, I first determine the ICD-9 code that is most commonly
associated with each class of drugs. Cleaning the Prescribed Medicines data is cumbersome
42
because the same drug often is often listed with several different names, so I aggregate the
MEPS data by matching prescribed medications listed in MEPS with an extensive list of
drug names and NDC codes provided by the American Society of Health-System Pharmacists
(AFHS). The match rate is roughly 95%. The Prescribed Medicines files do not include
records for drugs in 38 classes, likely because they are drugs prescribed in inpatient settings.
For these classes, I identify primary ICD-9s from FDA approval documents.
Then, using the MEPS Medical Conditions data, I compute the national prevalence of
that ICD-9 in each year. My main measure of market size is then the mean market size for
that ICD-9, averaged over the period 1996-2011 for which MEPS data are available. I use
the average of market size to capture market sizes over the entire period; using market sizes
in the year of approval, or year before approval, does not affect the main results.
B.4
Patent Start and Expiry Dates
The patent priority date, sometimes called the “effective filing date” is the earliest date date
any claim listed in the patent was filed. A patent’s priority date is always no later than its
filing date. If all claims are submitted for the first time in the application for the patent
at issue, then the priority date is the same as its filing date. However, if some claims were
filed in other patent applications, then the priority dates can be substantially earlier than
the filing date of the patent at issue. This can occur, for example, because the patent filer
seeks to delay publication of claims, or simply because the patent filer keeps adding claims to
subsequent patent applications. It can also occur if a firm files a patent in one country and
then later files the same patent in another – the earlier date is the priority date. I focus on
priority dates because they reflect the first time intellectual property protection was sought
and cannot be manipulated.
B.5
Household Incomes
Household incomes come from the Full Year Consolidated data files, which I match to ICD-9
codes in the Medical Conditions files. To avoid the endogeneity of demand choices, I use
incomes from the year before the first in class was approved. Since the MEPS data only
begin in 1996, I use 1996 incomes for classes in which the first in class was approved before
1996, and I deflate incomes to constant 2000 dollars using the GDP deflator provided by the
St. Louis Fed.
43
Appendix C
Appendix Figures
5
-10
Market Exclusivity: Subsequent Entrants
10
15
Resid. Market Exclusivity: Subs. Entrants
-5
0
5
20
Figure C.1: Market Exclusivities Within Class
5
10
15
Market Exclusivity: FIC
20
-4
Coef: 0.237, SE: 0.153
-2
0
Resid. Market Exclusivity: FIC
2
4
Coef: -0.190, SE: 0.182
(a) Unresidualized
(b) Residualized
Notes: These figures respectively show plots of the market exclusivities of entrants subsequent to the FIC
against the market exclusivities of the FIC. Panel A shows the relationship without controls, and Panel B
shows the relationship conditional on mean development time, market size, and year of FIC approval fixed
effects. The specification of the controls and sample are as described in Section 3. The slope of the line of
best-fit and its associated robust standard error clustered by drug class are presented in the bottom left of
each figure.
44
Appendix D
Panel Analysis
This section presents a panel analysis of entry timing relative to FIC exclusivity. In particular,
I analyze how entry in class j in year t relates to the first in class exclusivity remaining in
that year, conditional on time since first in class launch fixed effects and class fixed effects.
Formally, the model is:
N umEntryjt = α + βF ICExclRemjt + γt + ζj + jt .
(10)
The independent variable F ICExclRemjt takes the same value as the independent variable
of interest in my main analysis, F ICExclj , in the year in which the first in class enters (t = 0)
but then counts down until first in class generic entry occurs; thereafter, the variable takes
on a value of 0. Since I am conditioning on time since FIC launch and class fixed effects, the
estimate of β tells us how entry relates to first in class exclusivity, conditioning on average
entry across classes in year t and average entry within class j.
The sample is the same as the main sample described in Section 3, aside from the fact
that since I am not conducting an IV analysis, I do not restrict to only those classes for which
I have data on the instrument. Thus, I have 127 classes. It is important to note the panel
constructed with these data is not balanced because I do not observe the same number of
years since FIC launch for all classes. For example, although I observe whether any entry
occurs 10 years after FIC launch for classes that experienced FIC launch in 2000, I do not
for classes that experienced FIC launch in 2005. In Appendix Table D.1, presented below, I
present results from regressions that handle the censoring problem in a variety of different
ways.
The first column presents results from a Poisson model estimated on the unbalanced panel,
while the second does the same but restricts the panel to only those classes that experienced
FIC launch no later than 2001. This restriction reduces the number of classes to 82 but also
makes the sample more balanced. Columns (3) and (4) replicate the analysis in columns (1)
and (2) but estimate OLS regressions. Finally, in the fifth column, I handle the censoring
problem formally by estimating a Tobit (censored) regression. The results from this model
need to be interpreted with caution, however, because Tobit models are non-linear so they
suffer from the incidental parameters problem in the presence of fixed-effects. Altogether,
although effect magnitudes vary slightly across regressions, the results show that entry tends
to occur when the FIC has more exclusivity remaining. This is consistent with the evidence
visualized in Figure 3.
45
Table D.1: Remaining First in Class Exclusivity and the Timing of Subsequent Entry
Dependent Variable is Number of Subsequent Entrants in Class in Year
Remaining Market Exclusivity
of FIC (years)
Drug Class Fixed Effects
Time Since Launch Fixed Effects
QML Poisson Models
(1)
(2)
0.375*
0.375*
(0.208)
(0.208)
yes
yes
Sample Restriction Uncensored
OLS Models
(3)
(4)
0.0158***
0.0159***
(0.00597)
(0.00595)
Tobit Model
(5)
0.0374***
(0.00741)
yes
yes
yes
yes
yes
yes
yes
yes
Uncensored &
FIC Approval
≤ 2001
Uncensored
Uncensored &
FIC Approval
≤ 2001
All
Mean of Dependent Variable
0.067
0.073
0.067
0.073
0.036
Number of Classes
N
127
1,639
82
1,376
127
1,639
82
1,376
127
3,048
Notes: This table presents panel model results from regressions of the number subsequent entrants approved
in a given year on the remaining exclusivity of the FIC drug conditional on drug class fixed effects and time
since launched fixed effects. Observations are censored if an observation’s associated year takes place after the
sample ends in 2011. Columns (1) and (2) present Poisson models estimated by quasi-maximum likelihood.
Column (1) includes only uncensored observations and column (2) truncates the sample further to include
only uncensored observations for which at least 10 years of entry data post-FIC launch are observed. Columns
(3) and (4) replicate columns (1) and (2) using OLS models. As an additional robustness check, column (5)
presents results from a Tobit model that includes all observations. Note that the Tobit model suffers from the
incidental parameters problem so estimates are inconsistent and should be interpreted accordingly. Robust
standard errors clustered at the drug class level are reported in parentheses. *** p<0.01, ** p<0.05, * p<0.1.
46
Appendix E
Robustness Tests
This section probes the robustness of the estimates presented in Table 3 and proceeds in five
parts. First, I explore the role of the sample restrictions described in Section 3, namely in the
definitions of market exclusivity and of first in class drugs. Second, I conduct placebo tests
which analyze the role of the exclusivities of non-FICs drugs on entry. Third, I investigate
the robustness of the IV estimates. Fourth, since some classes in my data have had only
a few years to accumulate new entrants, I show the Poisson and Poisson-IV results are
unchanged when the sample is restricted to only those classes which have had at least 10
years for subsequent to entry to occur. Fifth, to ensure my results are not confounded by
class profitability, I show that the Poisson and Poisson-IV results are unchanged when I
control directly for sales.
E.1
Sample Definitions
It is useful to remind the reader of how my data are constructed. First, recall that my baseline
measure of market exclusivity is a constructed measure: it is the realized market exclusivities
for the 56 first in class drugs which have gone generic, and for the others it is expected
market exclusivity computed using patent expiry dates. Second, recall that although my data
includes this measure for 127 classes, I restrict my baseline analysis to the 111 classes for
which I additionally have values of the instrument. Third, recall that I focus on the effective
FIC, not the authentic FIC.
Panel A of Appendix Table E.1 probes these three choices, one after the other. I focus
here on Poisson (not Poisson-IV) specifications because the sample in my main analysis is
limited by data on the instrument; it is only by focusing on non-IV specifications that I
am able to relax the sample restrictions. For the same reason, these specifications do not
include controls aside from year of FIC approval fixed effects. For ease of comparison, the
first column repeats my base case analysis from specification (1) of Table 3, and the third and
second to last rows respectively report the mean of the dependent variable (which changes
with the sample) and the exclusivity coefficient multiplied by the mean of the dependent
variable. Since these are Poisson regressions, it is this last number which is comparable across
columns because it is in units of subsequent entrants per year of FIC exclusivity.
47
Table E.1: Robustness of Poisson Estimates to Sample Specification and Placebo Tests
Panel A: Robustness of Sample Restrictions
Dependent Variable is Number of Subsequent Entrants in Class
Market Exclusivity of FIC (years)
Year of FIC Approval Fixed Effects
(1)
0.229***
(0.0604)
(2)
0.137**
(0.0651)
(3)
0.162**
(0.0633)
(4)
0.165**
(0.0682)
(5)
0.0500
(0.0503)
(6)
0.322***
(0.103)
yes
yes
yes
yes
yes
yes
Authentic
FIC &
Restr. to
Classes with
Priority
Next
Authentic FIC
& Excluding
Classes with
Priority Next
Col (3) and
All Expected
Missing
Exclusivities Exclusivity is
14 yrs
Sample Restriction or
Exclusivity Measure
Base
Realized
Exclusivities
Only
Mean of Dependent Variable
Exclusivity Coef x Mean of Dep Var
0.730
0.167
1.500
0.206
0.827
0.134
0.731
0.121
2.632
0.132
0.719
0.232
111
56
127
156
19
96
N
Panel B: Placebo Tests
Dependent Variable is Num of Subs. Entrants Following
Any Drug (mean = 1.07)
The FIC (mean = 2.37)
Market Exclusivity (years)
(1)
0.0701
(0.0482)
Market Exclusivity of FIC (years)
(2)
-0.0237
(0.0520)
0.202***
(0.0687)
Market Exclusivity of LIC (years)
Year of FIC Approval Fixed Effects
yes
Sample Restriction
Excl. Coef x Mean of Dep Var
FIC Excl. Coef x Mean of Dep Var
LIC Excl. Coef x Mean of Dep Var
N
yes
(3)
(4)
-0.0196
(0.0470)
0.108
(0.0678)
0.00942
(0.0441)
yes
yes
Have Exclusivity for
Last in Class
All Drugs
0.075
-
-0.021
0.216
-
-0.045
0.256
0.021
196
196
35
35
Notes: This table presents robustness checks on the sample and definition of FIC in Panel A, and placebo
tests in Panel B. All regressions include year of FIC approval fixed effects. Panel A, column (1) repeats the
base analysis from column (1) of Table 3, where the sample is restricted to include only observations for
which the time of the start of clinical trials is known. The sample in column (2) is further restricted to only
observations for which generic entry is actually observed. Column (3) includes the 16 additional observations
for which the data include a measure of FIC exclusivity but not the timing of the start of clinical trials.
Column (4) codes FIC exclusivity as 14 years for observations that are missing it. Column (5) restricts the
sample to only those classes for which a priority review drug immediately succeeded the authentic FIC drug
and codes the FIC exclusivity as the authentic FIC’s exclusivity, and column (6) restricts the sample to only
those classes for which a priority review drug did not immediately succeeded the authentic FIC drug. Panel
B, column (1) repeats the base case analysis but includes one observation for all drugs (so long as that class’s
FIC exclusivity is known), and column (2) repeats column (1) but includes a separate control for the FIC’s
exclusivity. Columns (3) and (4) restricts the sample to classes for which the data include the last in class’s
exclusivity. Robust standard errors are presented in parentheses and standard errors in Panel B, columns (1)
and (2) are clustered at the class level. *** p<0.01, ** p<0.05, * p<0.1.
48
I begin with the measure of market exclusivity and the sample restrictions. Column (2)
reports results from the same regression as in column (1), but with the sample restricted
to only those observations for which I observe realized market exclusivity. Next, column
(3) expands the baseline sample to additionally include the 16 classes for which I have a
measure of exclusivity but no value for the instrument. In both cases, the coefficient on
exclusivity moves slightly but remains positive and statistically significant at the 5% level. In
column (4) I conduct an additional test where I expand my sample to include all 156 classes,
replacing the data points for which I have no measure of FIC exclusivity with the 14-year
threshold suggested by Keyhani et al. (2006).52 The scaled estimate in column (4) has a
smaller magnitude (0.121 versus 0.167 in my baseline case), but the relationship remains
positive and statistically significant. Overall, I infer that my main effects are robust to
alternative definitions of exclusivity.
The last two columns of Appendix Table E.1, Panel A analyze my definition of first in
class. In column (5), I restrict the sample to the classes for which my definition of FIC and
authentic FIC do not coincide, and analyze how the authentic FIC’s exclusivity relates to
subsequent entry. As expected, the exclusivity of these drugs has a weaker relationship with
subsequent entry: the scaled estimate is positive (0.132) but it is smaller than that of the base
case, and it is not statistically significant (but the sample is very small). However, column
(6) presents results from classes in which effective and authentic FIC drugs are the same.
Here the scaled estimate is larger (0.232) and highly significant (though it is not significantly
larger than that in column (5)).53 I infer that while my focus on effective FIC drugs appears
to accentuate the results, it is not driving them.
E.2
Placebo Tests
I conduct two sets of tests which probe the extent to which the exclusivities of non-FIC drugs
are related to subsequent entry.
In the first test, I replicate my main analysis, but instead of including only one observation
per class, I include one observation for each of the 196 drugs for which I have a measure of
exclusivity. In other words, for each drug j, the independent variable is drug j’s exclusivity
52
This is motivated by the fact that 14 years is the maximum exclusivity obtained through a patent
extension, so drugs that already have 14 or more years of exclusivity would not receive an extension and
would thus not have an exclusivity measure in my data. Using 14 years in place of the missing exclusivities
represents a worst case scenario as these drugs presumably have longer exclusivities – to the extent that
exclusivity and subsequent entry are positively related, censoring exclusivity at 14 years should attenuate the
results.
53
The number of observations in columns (5) and (6) do not add up to 127 because I do not have
exclusivity measures for 12 authentic FIC drugs. It is not surprising these data are missing: these drugs are
less commercially important, so generics may be less likely to be aggressive in pursuing entry.
49
and the outcome is the number of entrants subsequent to drug j.54 Intuition predicts that
this regression should yield a positive relationship but that it should not be as strong as
that estimated using only FIC exclusivities (because the first generic should have an outsize
effect on prices and thus entry incentives). The results, presented in column (1) of Appendix
Table E.1, Panel B, show a small, positive, but statistically imprecise relationship between
subsequent entry and exclusivity for all drugs. However, in column (2) I add a control which is
the exclusivity of the FIC for class j. In column (2), the FIC’s exclusivity shows up as highly
significant and the exclusivity of non-FIC drops (the point estimate is actually negative). I
infer that FIC exclusivities are indeed most important in determining subsequent entry.
The second test investigates how the exclusivity of the last drug to enter in class relates
to the number of entrants subsequent to the FIC. That is, this test is the same as my baseline
analysis except that instead of focusing on the exclusivity of the first in class, I focus on the
exclusivity of the last in class (LIC). Clearly, the exclusivity of the LIC cannot directly affect
the number drugs in the class, so the coefficient should be zero; a non-zero coefficient would
suggest endogeneity. For this test, I restrict the sample to classes that have at least two
drugs in them, else the LIC is the same as the FIC. Only 50 classes satisfy this requirement,
of which I only have an exclusivity measure for the LIC for 35. The results are presented
in column (3). As expected, the scaled coefficient on LIC exclusivity (-0.045) is small (in
fact, negative), and statistically insignificant. To make sure that this result is not an odd
artifact of this sample, in column (4) I estimate the same regression but this time include
also the first in class’s exclusivity. The scaled estimate on FIC exclusivity (0.256) is close to
that estimated in my main sample, but the scaled estimate on LIC exclusivity remains close
to zero (0.021). Both are imprecisely estimated but the sample is small. I interpret this as
additional evidence that endogeneity is limited in this context.
E.3
Robustness of IV Estimates
In this section, I probe the robustness of my IV results. I first provide evidence that they are
strongest for classes in which the delay between patent filing and the start of trials is large.
This is reassuring since it seems unlikely that marginal changes in the date of patent filing
for classes in which the date of patent filing already takes place immediately before the start
of trials should have a substantive impact on exclusivity and thus subsequent entry. Second,
I show that there is a strong relationship in the reduced form of the second stage, and third
that the results remain similar in linear, as opposed to Poisson, regression specifications.
Table E.2 presents the estimates. All regressions include my full set of controls: devel54
I cluster standard errors by drug class for these regressions.
50
opment time, market size, and year of FIC approval fixed effects. The first column shows
my baseline result from column (6) of Table 3, and then the second column includes only
classes for which the value of the instrument is greater than its median of 4.43 years. The
scaled coefficient in the second column is approximately 50% larger than that in the first
column, suggesting the marginal effect of FIC exclusivity on subsequent entry is larger for
drugs for which delay between filing and development is larger (though I note the difference
in coefficients is not statistically significant). Next, the third column presents results from
the reduced form of the second stage (for my baseline sample of 111 classes): I estimate a
Poisson regression where the outcome is the number of subsequent entrants in class and the
independent variable is the instrument. The estimated coefficient is significant at the 10%
level and implies that a one year delay between patent filing and the beginning of development
for the FIC is associated with a 7% decrease in subsequent entry.
To ensure my IV results are not due to the functional form of the Poisson model, in
columns (4)-(6) I replicate the analysis in columns (1)-(3) but using a linear framework.
Since the outcome is a count variable and is highly skewed (which motivates my use of
the Poisson framework), the outcome in these regressions is the log of 1 + the number of
subsequent entrants. Columns (4) and (5) present results from linear IV models, while column
(6) presents the reduced form of the second stage estimated by OLS. Although the scaled
estimates move slightly, all remain statistically significant.55
55
My non-IV results are also robust to a linear specification – see Figure 4.
51
Table E.2: Robustness of IV Estimates
Dependent Variable is Number of
Subsequent Entrants in Class
QML Poisson-IV
QML Poisson
Market Exclusivity of FIC (years)
(1)
0.337***
(0.128)
(2)
0.482***
(0.184)
Patent Filing to Clinical Dev. (years)
(3)
Dependent Variable is Log(1+Number of
Subsequent Entrants in Class)
Linear IV
OLS
(4)
0.0583**
(0.0277)
(5)
0.0988**
(0.0394)
-0.0692*
(0.0357)
(6)
-0.0261*
(0.0140)
Mean Development Time
Market Size
Year of FIC Approval Fixed Effects
yes
yes
yes
yes
yes
yes
yes
yes
yes
yes
yes
yes
yes
yes
yes
yes
yes
yes
Sample Restriction
Base
Instr. >
Median
Base
Base
Instr. >
Median
Base
Mean of Dependent Variable (levels)
Exclusivity Coef x Mean of Dep Var
0.73
0.246
0.78
0.376
0.73
-
1.73
0.100
1.78
0.174
1.73
-
F-Statistic from the First Stage
N
43.52
111
19.68
56
111
24.94
111
15.99
56
111
Notes: Columns (1) and (2) present results from Poisson-IV models estimated by quasi-maximum likelihood
and using a control function for the instrument, which is the difference in time between the patent’s filing date
and the start of clinical development. The first column repeats the analysis from column (6) of Table 3, while
the second column restricts the sample so that the value of instrument must be greater than its median of
4.43 years. The third column presents results from a Poisson regression of the second stage outcome variable
on the instrument. Next, columns (4)-(6) repeat the analysis in columns (1)-(3) but in a linear-IV/OLS
framework, where the outcome is the log of 1+ the number of subsequent entrants. All regressions include
controls for mean development time in class, market size, and year of FIC approval fixed effects. The sample
and controls are specified as described in Section 3. All standard errors are robust, and standard errors in
the Poisson-IV models (which are estimated by two-stage residual inclusion) are corrected for the two-stage
design as described in the text. *** p<0.01, ** p<0.05, * p<0.1.
E.4
Base Case with Sample Restricted to Classes Starting No
Later than 2001
In this section, I repeat the base analysis presented in Table 3 but restrict to the 62 classes
that started no later than 2001. The motivation for the restriction is to ensure that all classes
included in the analysis have had sufficient time to mature and see subsequent entry. The
results are presented in Appendix Table E.3, below.
Although the restricted sample is substantially smaller than that used in the main analysis,
and this weakens the first stage of the IV analysis and generally decreases precision, the point
estimates presented here are remarkably comparable to in my main analysis. Estimates in
columns (3) and (6), which are conditional on my full set of controls, suggest respectively
that an extra year of FIC exclusivity is associated with a 27% and 37% increase in subsequent
52
entry. Relative to my full sample, the classes analyzed in this table are on average larger, so
the scaled coefficients are also slightly larger than those presented in Table 3. Altogether, I
conclude that, if anything, including classes that started after 2001 dampens my main results.
Table E.3: Base Analysis with Sample Restricted to Classes Starting No Later than 2001
Dependent Variable is Number of Subsequent Entrants in Class for Classes such
that FIC Approval Occured No Later than 2001 (mean =1.18)
Market Exclusivity of FIC (years)
QML Poisson Models
(1)
(2)
(3)
0.224***
0.241***
0.248***
(0.0660)
(0.0699)
(0.0690)
QML Poisson-IV Models
(4)
(5)
(6)
0.473**
0.403**
0.402**
(0.206)
(0.161)
(0.160)
Mean Development Time
Market Size
Year of FIC Approval Fixed Effects
no
no
yes
yes
no
yes
yes
yes
yes
no
no
yes
yes
no
yes
yes
yes
yes
Exclusivity Coef x Mean of Dep Var
0.264
0.284
0.293
0.558
0.476
0.474
62
62
62
11.96
62
18.91
62
20.01
62
F-Statistic from the First Stage
N
Notes: This table repeats the base analysis presented in Table 3 but restricts to the 62 classes that started
no later than 2001. Columns (1)-(3) present results from quasi-maximum likelihood Poisson models which
incrementally add controls for mean development time in class and market size. Columns (4)-(6) replicate
columns (1)-(3) but instrument for FIC market exclusivity using the time between patent filing and the
start of clinical development, where the start of clinical development is defined as the date on which an
Investigational New Drug Application, a required precursor to the start of human clinical trials, is approved.
All models are conditional on year of FIC approval fixed effects. The IV models are implemented using a
control function and first stage estimates are presented in the final rows of the table. The sample and controls
are specified as described in Section 3 aside from the sample restriction. Robust standard errors are reported
in parentheses and standard errors for the IV models are corrected for the two-stage design as described in
the text. *** p<0.01, ** p<0.05, * p<0.1.
E.5
Base Case Controlling for Sales
In this section, I show my main results do not appear to be driven by drug or class profitability.
I do this by repeating the base analysis presented in Table 3 but controlling for sales, for
which I employ two measures. The first is the log of the maximum annual revenue ever earned
by the first in class, and the second is the log of the maximum annual revenue ever earned by
any drug in given class. These measures respectively capture the extent to which the first
in class is a top-earner as well the extent to which a class is attractive from a market size
perspective.
The results are presented in Appendix Table E.4, with Panel A analyzing the control
for FIC revenue and Panel B analyzing the control for class revenue. I do not have these
measures for all classes, so I present first my base case results (without the control) on the
restricted sample for which I do have the measures. In particular, the first set of two columns
in each panel present Poisson results, while the second set of two columns present results
53
from Poisson-IV models, and the first column in each set does not include the control while
the second does. Altogether, including the control for sales does not have a statistically nor
economically significant effect on the point estimates. I infer that my results are not related
to class profitability.
Table E.4: Base Analysis Controlling for Sales
Dependent Variable is Number of Subsequent Entrants in Class
Panel A: Controling for Max Annual Revenue of FIC
Market Exclusivity of FIC (years)
QML Poisson Models
(1)
(2)
0.224***
0.170**
(0.0808)
(0.0840)
QML Poisson-IV Models
(3)
(4)
0.380**
0.374**
(0.173)
(0.171)
Max Annual Revenue of FIC
Mean Development Time
Market Size
Year of FIC Approval Fixed Effects
no
yes
yes
yes
yes
yes
yes
yes
no
yes
yes
yes
yes
yes
yes
yes
Mean of Dependent Variable
Exclusivity Coef x Mean of Dep Var
0.871
0.195
0.871
0.148
0.871
0.331
0.871
0.326
85
85
17.59
85
18.16
85
F-Statistic from the First Stage
N
Panel B: Controling for Max Annual Revenue in Class
Market Exclusivity of FIC (years)
QML Poisson Models
(1)
(2)
0.200***
0.229**
(0.0767)
(0.0972)
QML Poisson-IV Models
(3)
(4)
0.279*
0.261
(0.159)
(0.188)
Max Annual Revenue in Class
Mean Development Time
Market Size
Year of FIC Approval Fixed Effects
no
yes
yes
yes
yes
yes
yes
yes
no
yes
yes
yes
yes
yes
yes
yes
Mean of Dependent Variable
Exclusivity Coef x Mean of Dep Var
0.886
0.177
0.886
0.203
0.886
0.247
0.886
0.231
88
88
17.61
88
17.38
88
F-Statistic from the First Stage
N
Notes: This table repeats the base analysis presented in columns (3) and (6) of Table 3 but adds controls for
sales. In Panel A, the control for sales is the log of the maximum annual revenue ever earned by the FIC, and
in Panel B, the control for sales is the log of the maximum annual revenue ever earned by any drug in that
class. The sample is restricted to those classes for which the sales measure is available throughout each panel.
Columns (1) and (2) present results from quasi-maximum likelihood Poisson models and columns (3) and
(4) replicate columns (1) and (2) but instrument for FIC market exclusivity using the time between patent
filing and the start of clinical development, where the start of clinical development is defined as the date on
which an Investigational New Drug Application, a required precursor to the start of human clinical trials,
is approved. All models are conditional on year of FIC approval fixed effects, mean time in development,
and market size. The IV models are implemented using a control function and first stage estimates are
presented in the final rows of the table. The sample and controls are specified as described in Section 3.
Robust standard errors are reported in parentheses and standard errors for the IV models are corrected for
the two-stage design as described in the text. *** p<0.01, ** p<0.05, * p<0.1.
54


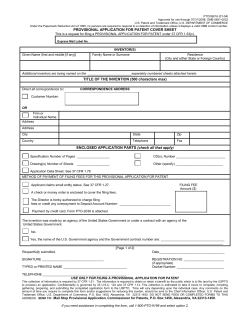


© Copyright 2026