
Statistics on Adoption in the United States Kathy S. Stolley
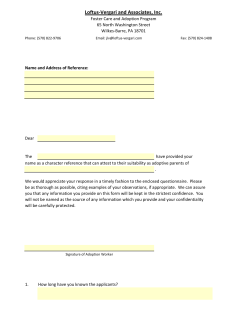
Statistics on Adoption
in the United States
Kathy S. Stolley
Abstract
Adoption is a topic of crucial importance both to those directly involved and to
society. Yet, at this writing, the federal government collects no comprehensive
national statistics on adoption. The purpose of this article is to address what we do
know, what we do not know, and what we need to know about the statistics on
adoption. The article provides an overview of adoption and describes data available
regarding adoption arrangements and the characteristics of parents who relinquish
children, of children who are adopted or in substitute care, and of adults who seek
to adopt. Recommendations for future data collection are offered, including the
establishment of a national data collection system for adoption statistics.
Kathy S. Stolley, M.A.,
is an instructor in the
Department of Sociology
and Criminal Justice at
Old Dominion University, Norfolk, VA.
A
doption is an issue of vital importance for all persons involved in
the adoption triangle: the child, the adoptive parents, and the
birthparents. According to national estimates, one million children in the United States live with adoptive parents,1 and from 2%1,2 to
4%3 of American families include an adopted child.
Adoption is most important for infertile couples seeking children and
children in need of parents. Yet adoption issues also have consequences
for the larger society in such areas as public welfare and mental health.
Additionally, adoption can be framed as a public health issue, particularly
in light of increasing numbers of pediatric AIDS cases and concerns
regarding drug-exposed infants, and “boarder” babies available for adoption. Adoption is also often supported as an alternative to abortion.
Limitations of Available
Data
Despite the importance of adoption to
many groups, it remains an underresearched area and a topic on which the
data are incomplete. Indeed, at this writing, no comprehensive national data on
adoption are collected by the federal government. Through the Children’s Bureau
and later the National Center for Social
Statistics (NCSS), the federal government
collected adoption data periodically between 1944 and 1957, then annually from
1957 to 1975. States voluntarily reported
summary statistics on all types of finalized
adoptions using data primarily drawn
from court records. The number of states
and territories participating in this reporting system varied from year to year, ranging from a low of 22 in 1944 to a high of
52 during the early 1960s.4 This data collection effort ended in 1975 with the dissolution of the NCSS.
The Future of Children ADOPTION Vol. 3 • No. 1 - Spring 1993
27
More recently, the federal government
has undertaken several data collection efforts of a more limited scope.5 Since 1983,
the American Public Welfare Association
(APWA) has been funded by the Administration for Children and Families
(ACF)—formerly the Office of Human
Development Services—to collect national data on adoption and substitute
care through the Voluntary Cooperative
Information System (VCIS). Although the
establishment of this ongoing data collection system is a positive step, it is still limited in that all reporting is voluntary and
often incomplete, and states use their own
definitions when reporting data. Additionally, the VCIS includes data only on those
children who are in, or have passed
through, the public child welfare system.6
Most of these children are adopted
through public agencies, which handled
only 39% of all unrelated domestic adoptions or 19% of total domestic adoptions
in 1986. Private agency adoptions are only
occasionally voluntarily reported by states,
and independent adoptions are not reported in any way.
The National Center for State Courts
(NCSC) was funded by the Children’s Bureau to administer the Adoption Information Improvement Project (AIIP) in order
to assess the feasibility of, and protocol
for, collection of national adoption data.
To locate sources of adoption information and reporting ability, state data on
the number of legalized adoptions are
obtained from social service agencies, bureaus of vital records, and courts. This
project has demonstrated wide variations
in record-keeping procedures (even
among agencies within the same state)
which make estimating total adoptions
difficult.7
Private organizations such as the National Council for Adoption (NCFA)—formerly the National Committee for
Adoption—also collect voluntary data on
adoption. The NCFA collected state data
in 1982 and 1986. Although these data
offer much of the most current information available on adoption in the United
States, they are also incomplete. While
some data were provided by every state and
the District of Columbia, data on all requested items was provided by only 22
states. (An additional 16 states reported
data on more than half of the requested
items.) Because of the wide variation in
state adoption data (as noted above),
some data were estimated and some partial counts or undercounts are suspected.8
As these recent data collection efforts
suggest, the source of adoption statistics
affects the inclusiveness and the completeness of the data. This may be especially
apparent in the case of independent adoptions. If adoption agencies must be relied
upon as a major source of adoption statistics, an underrepresentation of independent adoptions may result because
these arrangements do not fall under the
auspices of the reporting agencies.
Other information regarding adoption must be drawn from a variety of research studies targeting or including
adoption issues as part of their focus. Small
samples, which are not representative of
the American population as a whole, are
informative in providing information on
various aspects of the adoption process.
However, they do not allow national estimates to be made regarding statistics on
various aspects of adoption. Also, research
findings from these studies can be misleading if inappropriate generalizations are
made about the larger population not represented by the study at hand.
Other data come from national surveys, such as the National Survey of Family
Growth (NSFG), the National Survey of
Families and Households (NSFH), and
the National Health Interview Survey
(NHIS), which focus on various aspects of
fertility-related behaviors, health, or family life. The recent addition of adoption
questions in such large-scale surveys is a
useful step in the data collection process;
however, these surveys are primarily targeted at gathering a variety of information rather than focusing specifically on
adoption. Additionally, they permit only
28
THE FUTURE OF CHILDREN - SPRING 1993
estimates of statistical information regarding adoption. This may be problematic in
that adoption, like abortion, may be underreported in such self-report surveys.
Also, because adoption is a relatively rare
event, the number of adoptions included
even in these national surveys is so small
that some statistical analyses cannot be
performed reliably.
In light of this lack of comprehensive
statistical information, there has been a
movement toward the reinstatement of a
national data collection system which will
eventually replace the VCIS. Section 9943
of the Omnibus Budget Reconciliation
Act (OBRA) of 1986 (Public Law 99-509)
added section 479 to Title IV-E of the
Social Security Act requiring the federal
government to develop a national reporting system on adoption and foster care.
An Advisory Committee on Adoption and
Foster Care Information was established,
and its recommendations, as well as those
of the Secretary of the Department of
Health and Human Services (DHHS) and
information provided by the AIIP, resulted in DHHS-proposed regulations for
program implementation as published in
the Federal Register on September 27,
1990.9 This data collection system was to
be implemented by October 1991 but, as
of this writing, is still not functioning.
An Overview of Adoption
in the United States
In actual practice, adoption encompasses
two different types of arrangements. It occurs through both formal and informal
processes. Formal adoption occurs when a
legal recognition of a parental relationship is made. Informal adoption occurs
Figure 1
National Estimates: Total Number of Adoptions, 1944-1990*
*The data on the above graph were drawn from various sources which relied on different data
collection techniques. Also, the completeness of reported data varied from year to year. Thus, a rigid
integration of adoption trends from these estimates should be avoided.
**Domestic adoptions only
Source: For 1944-1975 estimates, see Maza, P. Adoption Trends: 1944-1975. Child Welfare Research
Notes #9, Washington, DC: Administration for Children, Youth, and Families, 1984. For 1982 and 1986
estimates, see National Committee for Adoption, Washington, DC. 1989 Adoption Factbook. Washington, DC: NCFA, 1989. The 1987 and 1990 estimates are from forthcoming data provided by the
National Center for State Courts.
29
Statistics on Adoption in the United States
when the birthmother allows another person (or persons), usually another family
member, to take parental responsibility
for her child without obtaining legal approval or recognition of that arrangement.10 Informal adoption arrangements
involving networks of real and fictive kin
appear to be widespread in the black community.11 However, there is a marked lack
of information about the prevalence and
particularities of such arrangements.
Therefore, the data presented here deal
only with formal adoption as practiced in
the United States.
into two categories: related adoptions and
unrelated adoptions. Related adoptions
include stepparent adoptions and those
cases in which a child is adopted by a
nonparent relative. Such adoptions may
often formalize a preexisting parenting
arrangement for the child. Unrelated
adoptions are those in which a nonrelative
child is adopted. Therefore, unrelated
adoptions are more likely to involve a real
change in parenting for the child with the
establishment of new parenting and sibling relationships for the child and the
adoptive family.
An examination of national estimates
of the number of formal adoptions reveals
that there were 50,000 total adoptions in
1944 (see figure 1). The number of adoptions steadily increased, hitting a peak of
175,000 in 1970, then declining to 104,088
domestic adoptions in 1986, according to
NCFA data.4,8(See box 1 for an overview
of 1986 data.) Based on AIIP data, there
were an estimated 118,529 total adoptions
in the United States in 1990.12
The number of related adoptions increased from 38,200 in 1951 to 91,141 in
4,8
1982 (see figure 2) . However, according
to NCFA data, this number dropped
markedly to 52,931 in 1986.8 Because the
majority of related adoptions involve stepparents (primarily stepfathers) adopting a
stepchild, this drop may be a reflection of
the decreasing rates of remarriage in the
United States13or may indicate that fewer
stepparent families are undertaking formal adoption.
For a more complete picture of adoption in the United States, the number of
total formal adoptions must be divided
During that same time period, the
number of unrelated adoptions increased
Box 1
Numbers of Adoptions and Adoption Arrangements for 1986
Number of
domestic
adoptions
Total domestic adoptions
Related adoptions
104,088
52,931
Percent
of total
domestic
adoptions
—
50.9%
Percent of
unrelated
domestic
adoptions
—
—
51,157
49.1%
—
Public agency
20,064
19.3%
39.2%
Private agency
15,063
14.5%
29.4%
Individually arranged
16,040
15.4%
31.4%
Unrelated adoptions
Unrelated placements
Infant adoptions
(under 2 years of age)a
Special needs adoptionsa
International adoptionsb
24,589
13,568
10,019
—
—
—
48.1%
26.5%
16.4%
a The categories of infant and special needs adoptions are not mutually exclusive
and may include some of the same children,
b Domestic unrelated adoptions plus foreign adoptions total to 61,176 unrelated
adoptions occurring in 1986. The table above includes only domestic adoptions for
all other values.
Source: National Committee for Adoption, 1989 Adoption Factbook. Washington, DC:
NCFA, 1989.
THE FUTURE OF CHILDREN - SPRING 1993
30
Figure 2
from 33,800 in 1951 to a high of 89,200 in
1971. That number then declined to
49,700 in 1974 and has remained close to
the 50,000 mark since that time.4 In 1986,
the number of unrelated domestic adoptions occurring in the United States was
51,157.8 Thus, these latest estimates reveal
a rather even division between related and
unrelated adoptions.
doubled since that time. This percentage
has remained relatively stable at 38% or
39% since 1972.4,8
Adoption Arrangements
The percentages of independently arranged adoptions declined to a low of 21%
of all unrelated adoptions in 1971 and
1972 then fluctuated, rising to 31% in
1986. However, this is still a substantially
lower percentage of placements than were
independently arranged in 1951.4,8 The
decline in independent adoptions reflects
actions undertaken by states to clarify
placement regulations after groups such
as the Child Welfare League of America
expressed concern over problems with independent adoptions. Additionally, Senate hearings during the early 1950s on
black market adoptions also brought at-
The means by which adoptive placements
are made have also undergone a great deal
of change during the past four decades (as
shown in figure 3). In 1951, 18% of unrelated adoptions were arranged through
public agencies, 29% were arranged
through private agencies, and 53% were
independently arranged (meaning a third
party, such as a doctor, attorney, or member of the clergy, handled adoption arrangements between the birthmother and
the adoptive parents). The percentage of
adoptions arranged through public agencies increased slowly and has more than
Private agency adoptions also increased, accounting for 40% or more of
all unrelated adoptions from 1962
through 1973. However, since 1973, the
percentage of private agency adoptions
has declined, returning to 29% in 1986.4,8
Related and Unrelated Domestic Adoptions, 1951-l986
Source: For 1951-1975 data, see Maza, P. Adoption Trends: 1944-1975. Child Welfare Research Notes
#9, Washington, DC: Administration for Children, Youth, and Families, 1984. For 1982 and 1986 data, see
National Committee for Adoption. 1989 Adoption Factbook. Washington, DC: NCFA, 1989.
Statistics on Adoption in the United States
tention to the issue of agency versus independent adoption.4
Thus, recent estimates indicate that almost two-fifths (39%) of all unrelated domestic adoptions are handled by public
agencies. Independently arranged adoptions and those handled by private agencies account for similar percentages of
unrelated domestic adoptions (31% and
29%, respectively). Of the 104,088 total
domestic adoptions occurring during
1986, 19.3% were unrelated adoptions arranged by public agencies, 14.5% were
unrelated adoptions arranged by private
agencies, and 15.4% were unrelated adoptions which were arranged by private individuals. The other 50.9% of adoptions
were related adoptions.8
Disrupted Arrangements
Disrupted adoptions are those in which
the child is removed from the home before the adoption is legalized. This is contrasted to adoptive dissolution, or the
breaking of already legalized adoptions.
There are no national estimates available
31
on the numbers or percentages of disrupted or dissolved adoptions. Instead,
information on adoption disruption
comes from a variety of studies. Thus, estimates of the number of disrupted adoptions vary widely based on the population
sampled and the calculation techniques
used; however, research indicates that disruption rates are increasing.
One review of the literature on adoption disruption suggests that this is a reflection of the concentration in the
pre-1970 research on placements of very
young, nonhandicapped, white children.
Of such adoptions, only 1.9% disrupted.14
More recently, with the emphasis on
placement of children with special needs
(as discussed below), higher rates of disruption are reported, ranging widely from
3% to 53% depending on the group being
studied and the calculating techniques
being used.14,15 “Current estimates indicate that approximately 10% to 13% of all
adoptive placements disrupt.“16 Placements of older children and children with
records of more previous placements and
Figure 3
Placement Arrangements of Unrelated Adoptions, 1951-1986
by Percentage
Source: For 1951-1975 data, see Maza, P. Adoption Trends: 1944-1975. Child Welfare Reference Notes
#9, Washington, DC: Administration for Children, Youth, and Families, 1984. For 1982 and 1986 data,
see National Committee for Adoption. 1989 Adoption Factbook. Washington, DC: NCFA, 1989.
THE FUTURE OF CHILDREN - SPRING 1993
32
longer stays in the foster system are more
likely to disrupt.14
Although accurate figures are also not
available on what happens to children after adoptive disruption, it does appear that
many do go on to a successful adoptive
placement.14 This implies that it is crucial
that children be moved through the placement system as quickly as possible, rather
than kept in the system for extended periods. These figures also suggest that a disrupted adoption does not mean that the
child is “not adoptable.” Rather, it implies
that adoptive parents should be fully informed and prepared for the challenges
that adoptions of such children might
pose.
Relinquishment of
Children for Adoption
Data on women who voluntarily relinquish
their children for adoption are rather limited, and our knowledge of relinquishment must be pieced together from a
variety of sources. Demographic research
indicates that women who choose to make
an adoption plan are often from backgrounds of higher socioeconomic status
and express higher educational aspirations than their counterparts who choose
to parent their child. Additionally, women
who relinquish their babies tend to come
from intact families which are supportive
of the placement decision and have not
experienced teenage pregnancies of other
women in the family. The child’s father
also has a strong influence on the young
woman’s decision.17
Most unmarried mothers choose to
parent their child. Indeed, the percentage
of premarital births being placed for
adoption has declined over the past two
decades.
Infants (particularly healthy white infants) are more in demand than older
children in the adoption “market.” The
majority of children placed for adoption
are placed before age one (81%), and 86%
are under two years of age.¹ Data gathered
by the NCFA show that almost half (24,589
or 48.1%) of the unrelated domestic adoptions completed in 1986 involved children
under the age of two.8
The vast majority of children placed
for adoption are, and traditionally have
been, premarital births. According to the
1982 National Survey of Family Growth
(NSFG), 88% of all babies placed for adoption are born to never-married mothers.
Six percent of placements are by previously married mothers, and 6% are
placed by currently married women.²
Nonetheless, most unmarried mothers
choose to parent their child. Indeed, the
percentage of premarital births being
placed for adoption has declined over the
past two decades (see figure 4). Before
1973, almost 9% of all premarital births
were placed for adoption. For premarital
births occurring from 1973 through 1981,
this percentage decreased to 4%; for births
from 1982 through 1988, it decreased even
further to 2%.18
The data reveal that this decrease has
largely been the result of declining percentages of white women placing their
children for adoption. Relinquishment of
premarital births among blacks has consistently been very low (less than 2%). However, among whites, over 19% of all
premarital births were relinquished before 1973, but just over 3% were relinquished from 1982 through 1988.
Several other childbearing trends have
been tied to the decline in the number of
infants placed for adoption. Some have
argued that the increase in abortions performed each year after the 1973 Roe v.
Wade decision may account, in part, for the
decline. However, the numbers of abortions leveled off during the 1980s, remaining around 1.5 to 1.6 million per year from
1979 through 1988. 19 Because declines in
relinquishment rates continued during
the 1980s, this suggests that factors other
than abortion resulted in this trend.
Interestingly, this decline is occurring
even though birthrates are increasing
among unmarried women.20 Fewer premarital conceptions are being legitimated
by marriage before birth.21 Additionally,
trends in earlier sexual initiation among
teenagers²² combined with later marriages¹³ result in more unmarried women
being exposed to the risk of pregnancy for
longer periods of time.
The increase in the number of unmarried mothers coupled with high divorce
rates has resulted in a situation where
single-parent families make up an increasing proportion of all American families. It
is estimated that at least one-half of all
33
Statistics on Adoption in the United States
children will spend part of their childhood
in a single-parent family.²³ Greater support
(both social and financial) may exist for
such families from parents and society.
Peer pressure may even contribute to some
young unmarried mothers choosing to
24
parent their child. Taken together, these
trends suggest changing attitudes toward
single mothers and a decrease in the stigma
of unwed motherhood in recent years.
Additionally, some have observed that
pregnancy counselors may not emphasize
the adoption option with young women.25
Characteristics of
Adopted Children
Information regarding the characteristics
of children who are adopted is also limited. Data from the National Survey of
Family Growth and the National Health
Interview Survey offer some characteristics
of children adopted over a period of
time.1,2 However, data collected by the
American Public Welfare Association
through the Voluntary Cooperative Information System (VCIS) provide the only
Figure 4
Percentage of Premarital Births Placed for Adoption by Race and Birth Year
Source: Bachrach, C.A., Stolley, K.S., and London, K.A. Relinquishment of Premarital Births: Evidence from
National Survey Data. Family Planning Perspectives (January/February 1992) 24,1: Table 1, p. 29.
THE FUTURE OF CHILDREN - SPRING 1993
34
national data available on characteristics
of children within the child welfare system
who are in the process of being adopted.
These data are divided into three adoption statuses: children with finalized adoptions, children awaiting adoptive
placement, and children living in nonfinalized adoptive homes (see table 1). VCIS
estimates indicate that approximately
19,000 children in substitute care had their
adoptions finalized in 1988. When finalized almost 50% of these children were
between the ages of 1 and 5 years with only
6.2% being less than 1 year old. The median age for these children was 4.8 years.
The majority of children who had finalized
adoptions in 1988 were white (60.7%).
In only 8% of all adoptions are
the parents and children of
different races.
About 23% were black, 9.4% were Hispanic, and 5.7% were of other racial/ethnic backgrounds. Additionally, almost 60%
of these children had one or more “special
needs”—such as older age, physical disabilities, or emotional or behavioral problems—which could result in their being
more difficult to place for adoption.6
Of these children 40% were adopted
by people not related to them, while an
additional 37% were adopted by unrelated
former foster parents. Only 13.6% of these
children were adopted by relatives. For
more than 9% of these children, their
relationship to the adoptive parent(s) was
unknown.6
The characteristics of the estimated
18,000 children awaiting adoptive placement at the end of FY 1988 were somewhat
different from those of the adopted group.
The median age of this group was higher
at 8.3 years. A higher percentage of these
children were black (39.1%) , and a higher
percentage had one or more special needs
(63.5%). Almost 55% of these children
had been waiting two or more years to be
placed for adoption.6
Transracial Adoption
Federally published estimates on transracial adoption were last available in 1975.
Yet, in that year, fewer than half the states
even reported data on transracial adoptions.26 A more recent estimate of transracial adoption is derived from the 1987
National Health Interview Survey
(NHIS).¹ These data are limited to adoptions in which the child was still living in
the adoptive mother’s household at the
time the information was gathered.
According to these data, 92% of all
adoptions involve an adoptive mother and
child of the same race. Of all adoptions,
85% involve white mothers and children,
6% involve black mothers and children,
and 1% involve mothers and children of
other racial/ethnic backgrounds.
In only 8% of all adoptions are the
parents and children of different races.
An analysis of these transracial adoptions
reveals that most instances involve white
women adopting children of other races.
White women adopting black children
accounted for 1% of all adoptions, and
white adoption of children of races
other than white or black accounted for
5% of all adoptions. Mothers of other
races adopting white children accounted for only 2% of all adoptions.
Because these estimates no doubt include foreign-born children, the actual
incidence of transracial adoption among
children born in the United States may
be very low indeed.¹
International Adoption
Agency-sponsored adoption of children
from foreign countries began after World
War II with the adoption by U.S. citizens
of European and Japanese children. During the mid-1950s, in response to the number of children orphaned in the Korean
War, the Republic of Korea (South Korea)
became, and has remained, the major
source of foreign adoptions in the United
States. However, under pressure from Korean officials, the number of adoptions of
children from Korea declined during the
late 1980s.27 In recent years, other countries such as Colombia, Peru, India, the
Philippines, and Romania have provided
many children for adoption by American
parents.
According to NCFA data, there were
10,019 foreign adoptions in calendar year
1986, accounting for 16.4% of all unrelated
adoptions occurring in that year. More
than 60% of these children were infants
under one year of age.8 The availability of
infants makes foreign adoptions especially
attractive to many adopters.
During FY 1991, there were 9,008 foreign adoptions in the United States (see
table 2). More than 60% (or 5,409) of
35
Statistics on Adoption in the United States
Table 1
Selected Characteristics of Children in the Public Child Welfare System
by Placement Status of Child at the End of Fiscal Year 1988
Characteristic
Estimated Number of Children
Age
Under 1 year
Finalized
Adoptions
Awaiting
Adoptive
Placement
(in percentages)
Living in
Nonfinalized
Adoptive Home
19,000
18,000
17,000
(22)*
(22)*
(23)*
6.2
2.9
7.1
1-5 years
46.5
29.7
39.7
6-12 years
37.8
44.2
40.0
13-18 years
9.0
21.9
12.5
19 and over
0.3
1.2
6.0
Unknown
0.2
0.1
0.1
(29)*
(26)*
(26)*
Black
23.1
39.1
33.9
Hispanic
White
9.4
60.7
8.3
49.0
5.8
54.6
Others
5.7
2.9
4.3
Unknown
1.1
0.7
1.4
(28)*
(21)*
(20)*
Race/Ethnicity
Special needs status
1 or more special needs
59.2
63.5
54.1
None
38.4
36.5
45.8
2.4
0.0
0.1
Unknown
Relationship to adoptive
parents
(22)*
Relatives
13.6
N/A
N/A
Unrelated former foster parents
36.9
N/A
N/A
Unrelated others
40.2
N/A
N/A
9.3
N/A
N/A
Unknown
Length of time awaiting
adoptive placement
(21)*
0-6 months
N/A
14.3
N/A
6-12 months
N/A
N/A
1-2 years
N/A
N/A
N/A
14.5
15.6
N/A
54.6
1.0
N/A
N/A
2 or more years
Unknown
*Numbers in parentheses indicate the number of states reporting information on the child
characteristic in the subcategory immediately below.
Source: Tatara, T. Characteristics of Children in Substitute and Adoptive Care: A Statistical Summary
of the VClS National Child Welfare Base. Washington, DC: American Public Welfare Association,
1992.
THE FUTURE OF CHILDREN - SPRING 1993
36
Table 2
International Adoptions During Fiscal Year 1991
by Region and Country of Origin
Total foreign adoptions by American parents
9,008
Breakdown by geographic region and country of
origin of children adopted by American parents
2,761
Europe
Romania
2,552
Other Europe
209
3,194
Asia
Korea
1,817
India
448
Philippines
417
Other Asia
512
41
Africa
Ethiopia
18
Other Africa
23
16
Oceania
Kiribati
10
Other Oceania
6
1,047
North America*
Guatemala
324
Honduras
244
Other North America
479
South America
1,949
Peru
722
Colombia
527
Other South America
700
*For the purposes of this survey, North America includes other countries in Central America,
the Caribbean Islands, Mexico, and Canada.
Source: U.S. Immigration and Naturalization Service. Statistical Yearbook of the Immigration and
Naturalization Service, 1991. Washington, DC: U.S. Government Printing Office, forthcoming.
these adoptions were also of children
under one year of age. However, in 1991,
the number of children from Romania
skyrocketed with Romania providing
2,552 children for adoption by U.S. parents, a number far exceeding the 1,817
Korean children adopted by Americans
during that year.28
Special Needs Children
During the past decade, the federal government has placed a particular emphasis
on finding adoptive homes for all children
awaiting adoption in the United States.
Through the Adoption Assistance and
Child Welfare Act of 1980 (Public Law
37
Statistics on Adoption in the United States
96-272), the federal government has
attempted to encourage the adoption of
children traditionally considered hard to
place through subsidies for persons who
adopt these children with “special needs.”
Such programs include in this category
older children (with age specified by each
state), minority children, members of a
sibling group, and children with medical
problems, as well as children with physical,
mental, or emotional disabilities.
In 1986, some 13,568 children with
special needs were adopted. These special
needs adoptions accounted for 26.5% of
all unrelated domestic adoptions.8 Although some infants may be included in
this category, emphasis on children with
special needs is especially important in
light of the general decline in the availability of infants for adoption. It calls attention
to the needs and availability of other children and to the incentives which might
make the option available to more adoption seekers. Also, some evidence suggests
that preferential adopters (those with no
fertility problems who adopt for religious,
social, or humanitarian reasons) may be
more likely to select children with special
needs.29
Adoption Seeking
The exact number of persons seeking to
adopt a child is unknown at this time. The
only national estimates of adoption demand based on direct measures of adoption seekers are made from the 1988
National Survey of Family Growth
(NSFG).30 In that survey, women 15 to 44
years of age were asked if they had ever
sought to adopt a child. An estimated
2,031,000 women had taken the initial step
of contacting an agency or lawyer. Although 620,000 (or 31%) of these women
had actually adopted (some more than
once), only 204,000 (or approximately
10%) were currently seeking to adopt a
child. Thus, more than 1.2 million had
never adopted and were no longer seeking
to do so.³¹ Unfortunately, data are not
available regarding the reasons these
women did not adopt or why or at what
point they disengaged from the adoption
seeking process.³²
Average waiting times for adoption
cannot accurately be determined from any
available information. However, the figures indicate that the number of women
seeking to adopt surpasses the annual
number of unrelated adoptions by a ratio
of 3.3 to 1. The investigators suggest that
their findings are “roughly comparable”
with earlier NCFA estimates of waiting periods of two or more years to adopt
healthy, white infants.
Characteristics of Adopters
In most adoptions, the adoptive mother is
between the ages of 25 and 34.1,2 For the
35 and over age group, adopting drops off
sharply. Additionally, almost all adopting
parents are married at the time of the
adoption. One national survey conducted
in 1982 found that more than 99% of all
women who had adopted a child were
married at the time of the adoption.2
However, the results of other studies
utilizing a variety of much smaller, nonrepresentative samples have suggested
that the number of nonmarried persons
adopting has increased in recent years.
One literature review addressing family
composition in adoptions occurring between 1970 and 1988 suggests that, although the percentage of single-parent
adoptions in the studies varies as a result
of the sampling strategies used by the various researchers, the number of single-parent adoptions has increased during the
past two decades. Estimates of the percentage of single persons completing adoptions range from .5% to 4% in research
conducted during the 1970s and from 8%
to 34% in 1980s’ studies.15
Most of these single adoptive parents
are female. Additionally, single adoptive
parents are more likely to adopt older children than infants. They are also less likely
to adopt members of a sibling group, less
likely to have been a foster parent to the
adopted child, and tend to have lower
family incomes than couples who adopt.15
Additionally, it appears that “marital
status has little, if any, effect on adoption
outcome as it relates to disrupted or intact
adoptions. ”³³ Thus, a recommendation
may be supported to actively recruit single
adults as adoptive parents.15 This suggestion may be especially appropriate in light
of the decreasing proportion of infants
available for adoption, the current emphasis on special needs adoptions, and the
increasing proportion of single-parent
households overall.
Race is also an important characteristic
of those who adopt. According to 1987
NHIS data, although never-married white
and black women are similar in their rates
of adopting children (1.8% and 1.5%, re-
THE FUTURE OF CHILDREN - SPRING 1993
38
spectively), unrelated adoptions are more
common among white women while related adoptions appear to be somewhat
more common among blacks. Hispanic
women are much less likely ever to have
adopted any child than are their black or
white counterparts.¹
data collection system at the federal level
for all legalized adoptions as well as standardization of reporting (see box 2). National statistics on numbers and types of all
adoptions and placement arrangements
are necessary to identify and assess adoption trends and outcomes.
Also, women reporting higher levels of
education or family income are significantly more likely to have adopted, especially unrelated children. However, these
data also suggest that related adoption
may be more common among those with
lower educational or income levels. Thus,
a relationship may exist among race, poverty, and educational status. Although
data clearly demonstrate that unrelated
Comprehensive national statistics
would furnish policymakers and practitioners with solid information to facilitate
program planning, to develop policy, and
to design outcome evaluations of those
policies and practices. Such statistics
would include pertinent information
(such as numbers and characteristics,
including reason for relinquishment and
medical history) about the birthparents
who relinquish a child for adoption, as
well as similar information (including
numbers and characteristics such as any
special needs, permanency goals, and
placement history) about the children
who are relinquished.
As we approach the mid-1990s, the
nation still needs a comprehensive data
collection system at the federal level for
all legalized adoptions as well as
standardization of reporting.
adoptions occur more frequently among
whites and those of higher socioeconomic
status as measured by education and income, they also suggest that adoptions
among persons of color and those with
lower educational and income levels tend
to be adoptions of related children.¹
Needs and Suggestions
for Future Data Collection
Maza emphasizes the need for reliable national adoption statistics, including such
basic information as annual numbers of
adoptions, relinquishments, families waiting to adopt (and the length of their
waits), disruptions and dissolutions, the
numbers of adopted persons living in the
United States, and the characteristics of
those involved in the adoptive process.34
With the availability of information from
such sources as the American Public Welfare Association’s Voluntary Cooperative
Information System (VCIS), inclusion of
adoption on national surveys, and data
collection efforts of organizations such as
the National Council for Adoption
(NCFA), the statistical information available on adoption has greatly improved.
However, as we approach the mid-1990s,
the nation still needs a comprehensive
Case-specific data (the tracking of individual cases) as opposed to summary
statistics would be especially useful in
providing information about children as
they enter and move through foster care
and adoptive processes. Data identifying
the point of relinquishment would be
very important given that the age at
which a child enters and leaves the substitute care system, as well as his or her
length of time within that system, has an
impact on placement success. Currently,
the available national survey data provide some information as to percentages
of relinquished children but do not provide information regarding the child’s
age at relinquishment or length of stay
within the system (although some
sources, such as the VCIS, offer some
aggregate information on this point for
certain groups). Such knowledge would
be beneficial in program planning and
outcome evaluation.
Also, more information regarding
those on the third side of the triangle, the
adoption seekers, is crucial to developing
a full picture of adoption in the United
States. Unfortunately, tracing the movement of adoption seekers into and out of
the adoption system is currently not possible. The collection of case-level data regarding adoption seeking would not only
provide needed information on waiting
periods but could also offer some insight
into the reasons people stop seeking to
adopt. Some may stop because they con-
Statistics on Adoption in the United States
Box 2
Adoption Information Needed on a National Level
Information regarding the number of adoptions
State maintenance of minimum adoption information data base
Uniform definitions and methods for tallying total adoptions
Systematic reporting of all adoptions to a responsible federal agency with penalties for noncompliance
Case-specific data (confidentiality maintained)
Breakdown of placement arrangements (public, private, independent)
Data on relative versus nonrelative placements
Information regarding child characteristics
Numbers of children relinquished
Demographic information
Date of birth/age, racial and ethnic background, sex, religion, siblings
Special needs status (handicapped status as a separate category)*
Reasons for entry into substitute care
Length of time in substitute care system
Placement history
Current care arrangements
Available subsidies
Permanency goals (adoption, returning to birthparent, etc.)
Reasons for discharge from substitute care
Information regarding birthparents
Demographic information
Date of birth/age, racial and ethnic background, religion, education, income, marital status
Reason for termination of parental rights for birthmother and biological father (voluntary versus court-ordered)
Other children born/fathered and their current care status
Medical history
Drug use/abuse, genetic information, prenatal care
Information regarding adoption seekers
Numbers of persons seeking to adopt
Numbers who successfully adopt
Movement into and out of the adoption seeking process and the reasons for those movements
Demographic information
Date of birth/age, sex, racial and ethnic background, religion, income, marital status
Characteristics of desired children
Previous relationships of adopted children with adoptive parents (relative, foster parent, unknown)
Waiting times for adoptions
Subsidies received
Previous adoptions/placements
Information regarding adoption outcome
Numbers of adopted persons
Demographic information
Age, sex, racial and ethnic background, religion, income, marital status
Characteristics of adoptive family
Racial and ethnic background, religion, income, marital status
Disrupted adoptions
Dissolved adoptions
Postadoption services
* See Maza, P. Trends in National Data on the Adoption of Children with Handicaps. Journal of Children in
Contemporary Society (1990) 21,3-4: 131.
** For other discussions of needs and suggestions for future national data collection efforts, see Maza, P. What We
Do—and Don’t—Know About Adoption Statistics. Permanency Report, Child Welfare League of America. Permanent Families for Children (Spring 1985) 3,2:5; Department of Health and Human Services. Title IV-B and Title IV-E of
the Social Security Act: Data Collection for Foster Care and Adoption. Federal Register (Thursday, September 27,
1990) 55,188:39540-39571; Administration for Children, Youth and Families/Office of Human Development Services.
Report on the Advisory Committee on Adoption and Foster Care Information (October 1, 1987), Washington, DC.
39
THE FUTURE OF CHILDREN - SPRING 1993
40
ceive a child through natural means or the
use of various reproductive technologies;
some are successful in adopting; some are
rejected by agencies; and some may be
discouraged by the wait or the nonavailability of children with certain characteristics.
In addition to data on the formation
of adoptive relationships, national data regarding disruption and dissolution of such
arrangements are also needed. These data
are especially crucial in light of the evidence suggesting that disruptions are increasing as more emphasis is placed on
special needs adoption.
Unless data on all adoptions
are collected, much important
information will be lost.
As discussed above, existing statistics
are drawn from a variety of sources with
the result being that many of the data are
scattered. Although the NCFA has done a
commendable job of compiling these statistics into one source book and collecting
data on adoption, the establishment of a
national reporting system would assign a
federal governmental agency the task of
data collection and compilation of a comprehensive data base and publication series. This would provide convenient access
to such information by policymakers, practitioners, researchers, and other individuals interested in adoption while allowing
other organizations and agencies to direct
their resources toward goals other than
data collection, for example, more serviceoriented endeavors such as education and
advocacy.
The recently legislated national data
collection system could be a very positive
step if it is properly implemented.9 Unlike
the NCSS and VCIS, this new federal system would gather needed case-level data.
Thus, it would be a more flexible data
source in that some analyses would be possible that are now precluded by the existing aggregate data which can be
recombined only in limited ways.35 HOWever, the regulations (as proposed) require
the reporting of only those adoptions with
public welfare implications. Data on private and independent adoptions (60% of
all unrelated domestic adoptions and 30%
of total domestic adoptions in 19868) will
not be included unless voluntarily reported by states. Unless data on all adoptions are collected, much important
information will be lost.
Such a national data base could also
provide a good starting point for a better
understanding of the dynamics of the
adoption process itself: how, why, and
when people enter, move through, and
exit the substitute care system as either
birthparents, children in need of care, or
adoptive or foster parents. Effects of the
adoption and substitute care process and
outcomes for all involved need to be more
fully understood. Such a data base would
also provide a starting point for analyzing
some current trends in adoption, such as
the increasing numbers of foster parent
adoptions and “open” adoption arrangements. Conceivably, such a data base could
be expanded to include information
about “wrongful adoption” and searches
and reunions.
The implementation of a national data
base, in and of itself, would, of course, not
provide all the answers to questions about
adoption. However, it would provide a
more complete statistical picture of adoption in the United States than we are currently able to develop. It would also
provide a useful foundation for future research and evaluation of adoptive practices and outcomes. Additionally, the
implementation of such a program would
represent acknowledgment by the government of the importance of adoption and
demonstrate a commitment to developing
a more complete understanding and
broad-based research approach to substitute care and adoption.
The author gratefully acknowledges the assistance of Dr. Christine A. Bachrach, Dr.
Penelope L. Maza, Dr. Karen A. Polonko, and
The Future of Children editorial staff for their
helpful comments on earlier drafts of this paper.
1. Bachrach, C.A., Adams, P.F., Sambrano, S., and London, K.A. Advance data: Adoption in the
1980s. Advance data from vital and health statistics; no 181. Hyattsville, MD: National Center for Health Statistics, 1989.
2. Bachrach, C.A. Adoptive plans, adopted children, and adoptive mothers. Journal of Marriage
and the Family (May 1986) 48,2:243-53.
Statistics on Adoption in the United States
3. Moorman, J.E., and Hernandez, D.J. Married-couple families with step, adopted, and biological children. Demography (May 1989) 26,2:267-77.
4. Maza, P. Adoption trends: 1944-1975. Child Welfare Research Notes #9. Washington, DC: Administration for Children, Youth, and Families, 1984.
5. These efforts include federally funded studies of the foster care population such as the National Study of Social Services to Children and Their Families conducted in 1977 with funding from the U.S. Children’s Bureau, the Child Welfare League of America’s U.S. Foster
Care Population of 1980: Final Estimate, and the Child Welfare Indicator Survey conducted
in 1983 for the Office of Human Development Services. The Office of Civil Rights also
funded a survey of public welfare and social service agencies, the 1980 Children and Youth
Referral Survey [of] Public Welfare and Social Service Agencies, to obtain data related to
civil rights issues. These studies were conducted using differing sample populations and
data gathering methodologies. They provide data on various characteristics of substitute
care populations at one point in time only. An ongoing uniform data base is not provided.
For discussions of these data collection efforts, see Maza, P. Trends in national data on the
adoption of children with handicaps. Journal of Children in Contemporary Society (1990)
21,34:119-38. See also Tatara, T. Characteristics of children in substitute and adoptive care: A statistical summary of the VCIS National Child Welfare Data Base. Washington, DC: American Public
Welfare Association, 1992.
6. See note no. 5, Tatara, pp. 12-18, 28-29.
7. The collection of national data on adoption is difficult. States have been accorded the primary responsibility for regulating adoption. As a result, adoption practices vary from state
to state. States have enacted different laws and practices and developed various management information systems. Programs and services also vary in structure and scope, often using differing definitions and terminology as well. Such variations combined with concerns
for confidentiality make efforts to collect consistent national data more difficult than one
might at first expect. For a discussion of the NCSC’s efforts and types of problems encountered, see Flango, V.E. Agency and private adoptions, by state. Child Welfare (May/June
1990) 69,3:263-75.
8. National Committee for Adoption. 1989 Adoption Factbook. Washington, DC: NCFA, 1989.
9. Department of Health and Human Services. Title IV-B and Title IV-E of the Social Security
Act: Data collection for foster care and adoption. Federal Register (Thursday, September 27,
1990) 55,188:39540-39571.
10. Adoption workers and lawyers argue there is only formal adoption because adoption is a legal
status. “Informal adoption” is another form of permanent child caring.
11. Hill, R. Informal adoption among black families. Washington, DC: National Urban League, 1977;
Stack, C. All our kin. New York: Harper and Row, 1974.
12. Data forthcoming from the National Center for State Courts.
13. National Center for Health Statistics. Advance Report of Final Marriage Statistics, 1988. Monthly
vital statistics report. 40,4: Supplement. Hyattsville, MD: Public Health Service, 1991.
14. Festinger, T. Adoption disruption: Rates and correlates. In The psychology of adoption. D.M.
Brodzinsky and M.D. Schecter, eds. New York: Oxford University Press, 1990.
15. Groze, V. Adoption and single parents: A review. Child Welfare (May/June, 1991) 70,3:321-32.
16. See note no. 15, Groze, p. 324.
17. See, for example, Festinger, T.B. Unwed mothers and their decisions to keep or surrender
children. Child Welfare (1971) 50,5:253-63; Grow, L.J. Today’s unmarried mothers: The
choices have changed. Child Welfare (1979) 58,6:363-71; Kalmuss, D., Namerow, P.B., Cushman, L. Adoption versus parenting among young pregnant women. Family Planning Perspectives (1991) 23,1:17-23; Lightman, E., and Schlesinger, B. Pregnant adolescents in maternity
homes. In Pregnancy in adolescence: Needs, problems, and management. I.R. Stuart and C.F. Wells,
eds. New York: Van Nostrand Reinhold, 1982; McLaughlin, S.D., Manninen, D.L., and
Winges, L.D. Do adolescents who relinquish their children fare better or worse than those
who raise them? Family Planning Perspectives (1988) 20,1:25-32; Resnick, M.D., Blum, R.W.,
Bose, J., et al. Characteristics of unmarried adolescent mothers: Determinants of child rearing versus adoption. American Journal of Orthopsychiatry (October 1990) 60,4:577-84. See also
note no. 2, Bachrach.
18. Bachrach, C.A., Stolley, K.S., and London, K.A. Relinquishment of premarital births: Evidence from national survey data. Family Planning Perspectives (January/February 1992)
24,1:27-32,48.
41
THE FUTURE OF CHILDREN - SPRING 1993
42
19. Henshaw, S.K., and Van Vort, J. Abortion services in the United States, 1987 and 1988. Family
Planning Perspectives (May/June 1990) 22,3:102-108,142; Ventura, S.J., Taffel, S.M., and
Mosher, W.D. Estimates of pregnancies and pregnancy rates for the United States, 1976-85.
American Journal of Public Health (May 1988) 78,5:506-11.
20. National Center for Health Statistics. Advance Report of Final Natality Statistics, 1989. Monthly vital statistics report. 40,8: Supplement. Hyattsville, MD: Public Health Service, 1991.
21. O’Connell, M., and Rogers, C.C. Out-of-wedlock births, premarital pregnancies and their effect on family formation and dissolution. Family Planning Perspectives (July/August 1984)
16,4:157-62; See also note no. 18, Bachrach et al., Table 2, p. 30.
22. Forrest, J., and Singh, S. The sexual and reproductive behavior of American women: 19821988. Family Planning Perspectives (September/October 1990) 22,5:206-14; Hofferth, S.L.,
Kahn, J.R., and Baldwin, W. Premarital sexual activity among U.S. teenage women over the
past three decades. Family Planning Perspectives (March/April 1987) 19,2:46-53; Sonenstein,
F.L., Pleck, J.H., and Ku, L.C. Sexual activity, condom use and AIDS awareness among adolescent males. Family Planning Perspectives (1989) 21,4:152-58.
23. For a concise discussion of the intersection of these trends see Bianchi, S.M. America’s children: Mixed prospects. Population Bulletin (June 1990) 45,1:9-10.
24. Sandven, K., and Resnick, M.D. Informal adoption among black adolescent mothers. American Journal of Orthopsychiatry (April 1990) 60,2:210-24.
25. Mech, E. Orientations of pregnancy counselors toward adoption. In 1989 Adoption Factbook.
Washington, DC: National Committee for Adoption, 1989. Cited in note no. 8, pp. 143-47.
26. National Center for Social Statistics. U.S. Department of Health and Human Services. Adoptions in 1975. DHHS Pub. No. (SRS)77-03259. National Center for Social Statistics report
E-10 (1975). Public Health Service, 1977.
27. Altstein, H., and Simon, R.J. Intercountry adoption. New York: Praeger, 1991.
28. U.S. Immigration and Naturalization Service. Statistical Yearbook of the Immigration and
Naturalization Service, 1991. Washington, DC: U.S. Government Printing Office, forthcoming.
29. Feigelman, W., and Silverman, A.R. Chosen Children. New York: Praeger, 1983. See also the
Rosenthal article in this journal issue.
30. Bachrach, C.A., London, K.A., and Maza, P.L. On the path to adoption: Adoption seeking in
the United States, 1988. Journal of Marriage and the Family (August 1991) 53,3:705-18.
31. Estimates made on the basis of actual adoption seeking behavior may actually underestimate
the potential demand if barriers to adoption were removed. The number of persons who
would like to adopt a child may be somewhat higher than the number who feel they have
the necessary resources (both material and emotional) to be successful in the adoption seeking process. Also actual or perceived barriers, such as waiting lists, agency approval guidelines, financial costs, or low availability of children with certain characteristics, may
discourage would-be adopters from ever approaching an agency or lawyer about adoption
or actually making application.
32. These questions are being examined in Cycle V of the National Survey of Family Growth
(NSFG).
33. See note no. 15, Groze, p. 326.
34. Maza, P. What we do—and don’t—know about adoption statistics. Permanency report, Child
Welfare League of America. Permanent Families for Children (Spring 1985) 3,2:5.
35. Although the ability of states to provide the information required by the proposed rules has
been of concern, one study found that states “increasingly seem to accept the value and necessity of data collection as an integral part of their foster care and adoption program management” (see note no. 9, DHHS, p. 39546). As of 1988, 26 of 47 states responding to survey
questions reported already having automated data processing capabilities to meet future
data collection and storage requirements. All states reported already collecting some of the
proposed information, and 16 reported they already collected 80% or more of that data. Additionally, although the time states reported it would take for them to fully implement a
new data collection system (including training staff, modifying software, etc.) varied widely,
ranging from one or two months to three years, two-thirds (or 30 of the 47 states responding) reported that such a system could be implemented in one year or less. (See note no. 9,
DHHS, pp. 39546-39547).


© Copyright 2026