
Avison Young 2015 Forecast Commercial Real Estate Canada, U.S.
2014 ANNUAL REVIEW
Avison Young 2015 Forecast
Commercial Real Estate
Canada, U.S. and U.K.
Partnership. Performance.
Contents
Message from the CEO
3
Message from the President, U.S. Operations
5
Message from the Managing Directors
6
Property Management, Debt Capital Markets
& Real Estate Investment Banking
7
Canada Overview & Forecast
8
U.S. Overview & Forecast
10
Canada
Calgary
Edmonton
Guelph (Southwestern Ontario)
Halifax
Lethbridge
Montreal
Ottawa
Quebec City
Regina
Toronto
Toronto West (Mississauga)
Vancouver
Winnipeg
12
13
14
15
16
17
18
19
20
21
22
23
24
United States
Atlanta
Austin
Boston
Charleston
Chicago
Cleveland
Columbia
Columbus, OH
Dallas
Denver
Detroit
Fairfield County
Greenville
Houston
Las Vegas
Long Island
Los Angeles
New Jersey
New York
Oakland
Orange County
Philadelphia
Pittsburgh
Raleigh-Durham
Reno
Sacramento
San Diego County
San Francisco
San Mateo
South Florida
Tampa
Washington, DC
25
26
27
28
29
30
31
32
33
34
35
36
37
38
39
40
41
42
43
44
45
46
47
48
49
50
51
52
53
54
55
56
Europe
London, U.K.
57
Our Contacts
58
Message from the CEO
2015: A year for balancing risk and exploiting opportunity
Each year at Avison Young, we pride ourselves on providing
our clients with the best information, services and solutions.
At the core of our strategic efforts is a thoughtful look into
the future, which begins with our 2015 forecast. Whether you
are a tenant, owner, investor or lender, we see four factors
that warrant serious reflection in a top-down view of your
portfolio this year:
increase in capital flows from this
region to other parts of the world.
All of these conditions are set
against a global backdrop of the
lowest interest rates in history,
very low capitalization rates, and
record pricing in major and coastal markets.
•
Long-term level of demand for real estate as a core or
alternative investment and associated allocation shifts;
•
The obsolescence of certain types of real estate as the
pace of technology adoption increases;
•
Shifting operational and locational considerations driven
by changing demographics, urbanization and transit; and
•
Shifts in global monetary policy decisions, commodity
pricing, interest rates and inflation.
Real estate has earned its place as a core portfolio holding
and is producing favourable total returns against alternative
investment options. Increased allocations, combined with
an abundance of capital and historically low cap rates, have
pushed pricing in gateway markets to new record levels – in
some cases ahead of fundamentals. The industry is happy
to be the beneficiary of this rising and stable tide, but risks
develop when prosperity continues over longer periods.
Momentum alone can cause this cycle to continue for some
time, but global (free) monetary policies and mountains of
capital chasing yield should taper at some point. We believe
that an inflection point is beginning to take shape, and these
trends should be taken into account as our clients adjust their
property strategies.
Each of these factors will shape winners and losers from a
location and property performance standpoint in the years
ahead. In most of the developed world, we are currently
operating in a very positive environment – with liquidity
strong and transactional volumes at high levels, property
and employment fundamentals improving, and alternative
investment choices offering lower yields. These background
conditions suggest that now is the optimal time to take a
pause and assess where you might be able to balance risk,
take profits, and redeploy resources to exploit future market
opportunities.
Our enclosed market-by-market report will serve as a helpful
roadmap to what we see as the central themes in each of the
regions in which we operate. This introduction highlights
global trends that will amplify or dampen property and
portfolio performance in the near and medium terms.
Let’s take a moment to reflect on known risks: Despite the
perception that gateway markets offer baseline stability and
lower risks, the return of speculative construction in these
locations could result in both softer leasing conditions and
accelerated functional obsolescence pressures on landlords
and tenants occupying existing assets. At the same time,
momentum will likely keep these core markets’ prices rising
for some time in the future (as benchmark-bound investors
chase the index). Tenants experiencing sticker shock may see
some relief by reconfiguring into newly constructed assets, or
in considering locations in secondary markets.
Global demand remains high, but watch for focus shifts
Technology continues to re-shape utilization
The global real estate markets sit at different points in the post2008 cycle with tangible strength in North America and select
European markets. We see the Canadian real estate market
approaching its cyclical top, and there is broad-based growth in
the United States and Mexico. London is the force driving U.K.
deal velocity, and a stable-but-cautious Germany is supporting
the Eurozone and leading the fight against deflation. Many
pundits are anticipating a potential slowdown in Asia. We see
this slowdown as manifesting predominately through a large
Rising automation and e-commerce penetration are affecting
where work gets done, as are the urbanization trends and
changing tastes of millennials around the globe. These trends
unfold slowly due to lease terms, but we caution against
underestimating the strength of these forces. The office
tenant of the future is more seriously embracing mobile
technology, smaller space requirements and alternative
workplace strategies. Continued...
Avison Young 2015 Forecast
3
Message from the CEO
Message from the CEO continued...
The need for traditional amounts of square footage per
person is decreasing each day. Retailers are balancing the
older, traditional footprint with the change in retail buying
patterns, the efficiency of omni-channel distribution, and the
changing behaviour of millennials who will make up the largest
percentage of the workforce by 2020.
Showrooms and retail floorplates will continue to shrink as
technology is embraced and same-day delivery becomes
commonplace. There will always be a desire to shop for the
experience, but bets on large stores carry significant risk. The
growing need for omni-channel distribution, including logistics
and data-centre space for online sales, represents investment
strategies with future potential. Today’s retailer will replace
current offerings with higher levels of automation and services,
smaller stores and more real estate – just a different type.
Millennials’ impact – far beyond their years
Millennials could pose the biggest risk and opportunity as
their behaviours drive future planning and operating results.
The millennial is transient, but focused on live/work/play
opportunities in downtown areas. The urbanization of real
estate is a real trend with major development occurring to
meet the needs of millennials and empty nesters moving
to downtown cores and/or close to transit. This trend is
manifesting in small cities as well as global gateway centres.
Commodity prices, currency wars, interest rates – good
news or bad?
Oil prices impact the markets in multiple ways. Houston,
Denver and Calgary occupancy and related rental rates
could be undermined by downsizing (and failing) oil and
gas companies if pricing pressures continue unabated. This
situation could have a positive impact on consumer confidence
and global stock markets or fuel the fear of deflationary
pressures, depending on how sustained the current
commodities cycle proves to be.
When you combine the likely impact of interest-rate changes,
volatile oil and other commodity prices, demographic shifts,
technological developments, anticipated and unanticipated
government intervention and rising global conflicts and
terrorism, there is uncertainty (and, accordingly, opportunity)
at every turn.
4
Avison Young 2015 Forecast
What is clear is that the pricing boost generated by low interest
rates (negative real interest rates) has produced a significant
portion of the total returns for real estate investments during
the last 15 years and will eventually reverse course. The global
currency tug-of-war between the Yuan, Yen, Euro, Swiss Franc,
Pound, Canadian and U.S. dollars will continue for some time
– as a by-product of the shifting environment, not the cause.
We believe that interest-rate hikes will start in the U.S., which
should have the strength to undo the free money policy in 2016
(but they could start as early as the summer of 2015 with talk
“jawboning” them higher). The Federal Reserve could impact the
markets by talking about hikes, even before it follows up with
actual rate increases. Globally, interest rates will drift higher with
the impact modulated by currency movements, both in terms of
exchange rates and global capital flows.
At Avison Young, we believe that market corrections are healthy
and inevitable, and we seek to ensure that our clients understand
salient trends and are incorporating these thoughts into their
planning, strategies and tactics. Important undercurrents are
daily shaping the world in which we operate. With every risk
comes opportunity, if you are ahead of the change.
In 2014, Avison Young continued to build its platform to meet
the needs of our clients. We opened our first offices in the
United Kingdom and Germany and now have more than 1,700
people in 62 offices and have served clients in more than 30
countries.
Our client-service model eschews traditional business units
for Principal-led affinity group structures, and is deeply rooted
in our foundational beliefs (including global citizenship), and
aligns our best practices, experience and innovation with the
needs of our clients.
We wish you all a happy, healthy and prosperous 2015, and
look forward to doing business with you in the near future.
Sincerely,
Mark E. Rose
Chairman and CEO
Avison Young
Message from the
President, U. S. Operations
Strategic growth in a strengthening market
O
ur objectives for 2014 were aggressive, yet realistic in
terms of needed expansion into new markets when
compared with our desire to add depth of resources and
capabilities to existing markets. We found excellent partners
who fit our culture perfectly and expanded into new U.S.
markets in Orlando, Austin, Cleveland, Fairfield/Westchester,
Columbus, OH and Oakland in 2014. During that 12-month
period, we acquired Atlanta-based The Eidson Group, LLC,
Columbus OH-based PSB Realty Advisors, LLC, Austin-based
Commercial Texas, LLC, Sacramento-based Aguer Havelock
Associates, Inc., New Jersey-based Kwartler Associates,
Orlando-based MCRE, LLC and Miami-based Abood Wood-Fay
Real Estate Group, LLC.
Equally important was our ability to recruit top industry
professionals in virtually all of our service capabilities in
key markets such as Washington, DC, New York, New Jersey,
Southern and Northern California, Atlanta, Chicago and
numerous other markets. Overall, we began 2014 with nearly
1,000 employees in 29 U.S. markets, and ended 2014 with more
than 1,200 people in 34 U.S. markets. A few geographic holes
remain in our U.S. operation; however, we should be able to
address these early in 2015 given the progress we are currently
making.
Our best-in-class strategy, coupled with our Principal-led
approach, continues to be well-received by investor and
occupier clients, as evidenced by the rapid growth in our client
base and in our numerous new assignments representing
virtually all asset classes. With our recent corporate expansion
into key money-center markets in Europe, we are able to meet
our clients’ needs not only in North American markets, but
increasingly in markets overseas.
asset class for most institutional
(domestic and foreign) investors,
and the yields on quality assets
remain well above comparable
risk bonds. As such, we feel
that the demand for real estate
investments will be able to withstand a gradual uptick in
borrowing costs that will likely occur in 2015, and demand for
assets will continue to outpace supply.
Look for further improvement in office leasing fundamentals
overall, vacancy levels to maintain their gradual decline, and
rent growth through 2015 to drive values higher. In the multiresidential sector, vacancy may begin to creep upward in some
markets in 2015, although 2014 sales are on pace to reach
2013 total volume and this sector will continue to perform well
for some time. Retail continues to reconfigure itself to better
compete with the still burgeoning online retail market, and we
see excellent opportunities for well located power centers and
community centers. Finally, economic growth, New Panamaxcapable ports and e-commerce will drive gains in industrial
markets in 2015.
I hope that everyone has a very successful 2015. All of us at
Avison Young look forward to working with you to achieve all
of your objectives.
Sincerely,
Earl Webb
President, U.S. Operations
Avison Young
In 2013, we reported a recovery concentrated in coastal
markets, while 2014 witnessed widespread absorption and
recovery in leasing markets. Vacancy across all asset types
fell and, with a relatively robust employment environment,
rental rates increased, driving values higher. We must remind
ourselves that a good deal of this recovery in rents and asset
values is driven by the continued Federal Reserve policy of
low interest rates. With the end of quantitative easing (QE3)
in the second half of 2014, we should start to see a gradual
stabilization in bond rates and, in fact, may begin to see a slight
uptick in related borrowing costs as lenders begin to price in
forward rate increases. However, real estate remains a preferred
Avison Young 2015 Forecast
5
Message from the
Managing Directors
Growth stems from desire to serve clients and communities
I
n 2014, as Managing Directors, we guided Avison Young
through an unprecedented growth period in the firm’s
corporate history by opening new offices outside of North
America – in London and Thames Valley, U.K. and Frankfurt,
Germany. In addition, we continued our aggressive U.S.
expansion program through new-office openings, strategic
acquisitions and new hires; we widened our footprint by
building out our current platform and adding to our existing
business lines. We also strengthened our well-established
market share in Canada while capitalizing on increasing
Canadian institutional investment in the U.S. and overseas.
These accomplishments are just the highlights of a
comprehensive, ongoing global growth program driven by
our Principal-led, collaborative culture, best-in-class service
model and strong desire to put the client first in everything
that we do. While helping our clients and their businesses
achieve and exceed their goals, we recognize the need to
focus on more than the bottom line. In that vein, we have
also striven to improve our communities and assist the less
fortunate. As Managing Directors, we were extremely proud
to lead Avison Young’s first-annual Global Day of Giving in
October 2014, holding local philanthropic events in all of our
firm’s markets. We will steadily expand these efforts through
the openings of additional offices.
The Global Day of Giving, and many other community
events that Avison Young employees participate in each
year, demonstrate that we are about more than just doing
business. We understand the need to focus on sustainability,
philanthropy, open communication, inclusiveness, diversity,
leveraged technology and, at times, fun-filled social activities.
Ultimately, Avison Young’s achievements in business and
the community hinge on our people, who are outstanding
leaders within the company, industry and numerous
charitable organizations. Thanks to the recruitment
of established industry advisors and talented young
professionals performing key roles, our strategic expansion in
the U.S. filled in several key markets and service offerings in
2014. We will continue to provide a co-operative environment
where up-and-coming brokers can trade best practices,
develop relationships and support one another in their
growth and development at Avison Young.
Avison Young’s continued success at attracting and recruiting
6
Avison Young 2015 Forecast
top talent is evidenced by the growing list of name-brand
clients that retained our firm for ongoing projects. Our firm
thrives on its geographic, business and human diversity,
which has generated exceptional momentum throughout
2014 and into 2015. As a result, we continue to expand
our client base in an ever-changing global economic
environment. We have succeeded in assisting our diverse
clientele through a design-build approach, rather than a
cookie cutter one, in all Avison Young markets and asset
classes.
However, we recognize that there is still much more to do
– and improve upon. Canada, the U.S., U.K. and Germany
experienced post-recession improvement in 2014;
nevertheless, occupiers are focused on efficiency and cost
containment, and those trends will affect the industry for
several more years, especially as energy prices remain volatile.
That said, time spent with experts on forward planning,
innovation and challenges to the status quo will reap
exponential returns for business owners and tenants alike.
Most of our markets are at or near equilibrium, enabling us
to add significant value in strategic analysis and negotiation,
and deliver our distinctive capabilities. While 2014 was a very
successful year for our company and clients, 2015 will be even
better.
On behalf of our entire team, we thank you for your
trust, loyalty and respect. We also wish you a healthy and
prosperous new year – and look forward to generating more
growth opportunities for your business in 2015 and beyond.
Sincerely,
The Managing Directors
Avison Young
Thomas Aguer | Charlie Allen | James Becker
Michael Brown | Sean Cahill | Michael Church
Nick Cook | Christopher Cooper | Steve Dils | Martin Dockrill
Mark
Evanoff
|
David
Fahey
|
Mark
Fieder
Christopher Fraser | Jeffrey Heller | Rob Howell
Richard Jankowski | Michael Keenan | Randy Keller
Michael Kennedy | George Kingsley | Joseph Kupiec | Ken Lane
Greg Langston | John Linderman | Keith Lipton
Christopher Livingston | Doug Mereska | Arthur Mirante
Greg Morrison | Bruce Neel | Danny Nikitas | Denis Perreault
Scott Pickett | John Pinjuv | Ray Robinson | John Ross
Pike Rowley | Jonathan Satter | Wes Schollenberg | Ted Simpson
Nick Slonek | Michael Smith | Rand Stephens | Udo Stoeckl
Todd Throndson | Clay Witherspoon | Alec Wynne
Property Management
A
s sustainability and “greening programs” have become
the accepted standard for office property management,
e-commerce, mobile technology and customer interaction
are the new keys to success in retail management.
Meanwhile, the usage of industrial space is broadening to
include e-commerce distribution to provide faster delivery
times to customers – and property management is evolving
accordingly.
The movement of space utilization and cost-cutting that
has dominated the management of office properties in
recent years is now being embraced by industrial tenancies.
Operating costs have now become an important discussion
point in industrial lease negotiations.
With the densification of space utilization, management
must address issues related to air quality, tenant comfort,
elevator wait times and increased wear and tear on the
property. With e-commerce pick-up counters increasingly
available at retail stores, there is a greater need to manage
increased traffic flow in the form of both customer visits and
store merchandise deliveries.
The focus for property management in 2015 will be the
development and implementation of capital improvement
programs to reposition and renovate older product to
better compete with expected new developments. As
consumers embrace online shopping, retailers will continue
to consider the role of the store, exploring new formats and
store footprints. Industrial product is expected to continue
to evolve to meet user needs.
Peter Leroux
Executive VP, Managing Director
Real Estate Management Services
Debt Capital Markets
& Real Estate Investment Banking
D
espite minor upward bumps in 2014, the Government
of Canada’s 10-year benchmark bond rate trended
down steadily during 2014, a decline that accelerated in
October. This environment provided very attractive interest
rates for owners of real estate, while lenders scrambled
for the best product. Underwriting of debt saw little
change, with institutions exhibiting the usual bifurcation
of approaches to what is acceptable and unacceptable risk.
Given the solid performance of Canadian real estate, lenders
were hard-pressed to go elsewhere for yield, and 2015
should be a repeat performance, assuming the predicted
gentle rise in interest rates takes place.
Barring major unforeseen macro-level economic or
geopolitical events, U.S. lenders expect another strong
year in 2015. Given the amount of capital that lenders are
seeking to deploy (alongside the ever-increasing amount
of foreign capital entering the market), interest rates
are expected to remain relatively low and the lending
environment competitive. In order to increase production
levels of new debt originations, lenders are aggressively
pursuing opportunities – a situation that is keeping spreads
low and leverage levels high. Capital providers with
flexibility are considering structured solutions that allow
for increased capital deployment into individual assets by
funding gaps between senior debt and sponsor equity. With
the high level of liquidity, ease of capital in the marketplace
and projections for stable economic growth, lenders expect
an increase in year-over-year lending volume in 2015.
Norman Arychuk
Broker
Debt Capital Markets Group
Aaron Prager
Vice-President
Real Estate Investment Banking
Avison Young 2015 Forecast
7
Canada Overview & Forecast
Shifting dynamics to test Canada’s commercial real estate sector
After enjoying better-than-expected GDP growth in the third quarter
of 2014 and an unemployment rate in late 2014 that flirted with
pre-recession levels, Canada’s sound commercial real estate sector
will face headwinds in 2015. A weakening global economy, sliding
oil prices, burgeoning development and a possible U.S. Federal
Reserve-led interest-rate hike will create both risk and opportunity.
Demographics, technology and increasing space-planning
efficiency are transforming office market dynamics. To meet
demand, landlords are offering new, sustainable development and
refurbishing existing product to remain competitive. Undeterred
by supply-demand imbalances, developers are taking a long-term
view with more than 22 million square feet (msf) under construction
across Canada (55% preleased and representing 4.3% of existing
stock) – with 55% of the total in Toronto and Calgary. With more than
7 msf scheduled for completion in 2015, the Canadian office market
will see its vacancy rate rise to 10% by year-end 2015 from 9.4% in
late 2014.
Vacancy-challenged assets will see competition as occupiers
entertain a plethora of options and greater emphasis is placed
on optimizing and future-proofing premises. To support elevated
valuations, landlords will hold firm on rental rates, but will be under
pressure to increase incentives to retain and attract tenants. Urbansuburban battles will resume with transit-oriented sites the focus.
Urban intensification and retailers’ adaptation to e-commerce
continue to alter the retail landscape. Failure to adapt has led
to further closings and bankruptcy protection as retailers cull
underperforming stores, while foreign brands such as MUJI
from Japan put down roots and recent entrants (Target) rethink
their strategies. Marketing budgets are expected to increase as
stakeholders invest in physical and digital assets, as well as new
concepts, and measure consumer habits.
Major mall owners and retailers are broadening the consumer
experience, with “bricks-and-clicks” shopping options or new
dining experiences – something not available through the Internet.
SmartCentres , Walmart and IKEA are testing or deploying various
pick-up options for customers’ online orders, emphasizing their
desire to compete against online giants such as Amazon.
Loblaws’ and Canadian Tire’s REIT-conversion successes have led
Sears and HBC to contemplate monetizing their real estate (via REIT
formation or sale-leaseback) to bolster operations in a competitive
retail environment.
Largely sporting low, single-digit vacancy rates, Canada’s stable
8
Avison Young 2015 Forecast
industrial markets claimed eight of the 10 lowest vacancy rates
in North America. Growing demand from the U.S. and a weaker
Canadian dollar benefit the export sector, but declining oil prices
and volatility in global energy demand could put pressure on
resource-based Western Canadian markets, many of which currently
boast double-digit rental rates and slightly lower vacancy levels
versus the manufacturing-laden markets in the East.
Even with limited serviced land in some markets, almost 17 msf of
industrial product is under construction (30% preleased) – equating
to less than 1% of existing inventory. Although larger bay sizes and
higher clear heights are popular, small multi-bay product remains
in demand. Larger speculative projects aim to secure leases from
major domestic and U.S. retailers planning to expand or establish
distribution networks as part of e-commerce and omni-channel
strategies, blending warehouse/logistics and retail.
Leasing will remain steady, while development lifts the national
industrial vacancy rate to 4.6% by year-end 2015 from 4.2% in late
2014. Emphasis will be on perfecting the supply chain and securing
larger land parcels to develop more flexible product near future
transportation corridors and growing urban centres.
Dispositions continue to drive healthy investment in most Canadian
markets, while the lack of available quality product masks investors’
true acquisition potential. An estimated $22 billion of commercial
real estate sold through November 2014. REITs have lost some
steam, but pension funds and private investors have filled the void,
keeping capitalization rates low for core assets. Historically low yields
and limited supply will continue to lead some Canadian institutional
capital to look abroad, especially to the U.S., where some markets
are perceived as being undervalued. Investors not wishing to
buy abroad or engage in bidding wars have opted to pursue
development or redevelop existing assets to unlock value.
With the market at a short-term pricing top and limited product
available, anxious capital will weigh core versus value-add risk and
opportunity in light of escalating development, possible moderating
rental growth and higher interest rates. The latter may force some
over-leveraged owners to sell, offering reluctant buyers slightly
better prices – spurring a new wave of transactions and, ultimately, a
re-pricing of assets.
Bill Argeropoulos
Principal
Practice Leader, Research (Canada)
Office
Office
2014
2015F
2013
2014
2015F
W
in
ni
pe
g
2013
Va
nc
ou
ve
r
Ca
na
da
W
in
ni
pe
g
2015F
Va
nc
ou
ve
r
2014
T
(M oro
iss nt
iss o W
au e
ga st
)
2013
T
(M oro
iss nt
iss o W
au e
ga st
)
2015F
To
ro
nt
o
Re
gi
na
O
tta
w
a
M
on
tre
al
2014
To
ro
nt
o
Ha
lif
ax
On Gue
ta lp
rio h
)
2013
Re
gi
na
Qu
eb
ec
Ci
ty
O
tta
w
a
M
on
tre
al
7
Le
th
br
id
ge
(S
W
14%
Ha
lif
ax
On Gue
ta lp
rio h
)
Ed
m
on
to
n
Ca
lg
ar
y
Vacancy
Vacancy
Rate (%)
Rate (%)
Ha
lif
ax
On Gue
ta lp
rio h
)
Ca
na
da
W
in
ni
pe
g
Va
nc
ou
ve
r
T
(M oro
iss nt
iss o W
au e
ga st
)
To
ro
nt
o
Re
gi
na
Qu
eb
ec
Ci
ty
O
tta
w
a
M
on
tre
al
Le
th
br
id
ge
(S
W
Ed
m
on
to
n
Ca
lg
ar
y
Vacancy
Vacancy
Rate (%)
Rate (%)
20%
18%
20%
16%
18%
14%
16%
12%
14%
10%
12%
8%
10%
6%
8%
4%
6%
2%
4%
0%
2%
0%
Le
th
br
id
ge
(S
W
Ed
m
on
to
n
Ca
lg
ar
y
AreaArea
Under
Under
Construction
Construction
(msf)(msf)
Canada Overview & Forecast
Canada - Overall Office Vacancy Rate Comparison
Canada - Overall Office Vacancy Rate Comparison
Canada - Overall Industrial Vacancy Rate Comparison
12%
14%
Canada - Overall Industrial Vacancy Rate Comparison
10%
12%
8%
10%
6%
8%
4%
6%
2%
4%
0%
2%
0%
Canada - Area Under Construction
Canada - Area Under Construction
7
6
6
5
5
4
4
3
3
2
2
1
1
0
0
Industrial
Industrial
Avison Young 2015 Forecast
9
U.S. Overview & Forecast
Improving conditions bode well for U.S. commercial real estate in 2015
The U.S. economy expanded further in 2014 with business investment
bolstering economic progress. The national unemployment rate
was less than 6% near year-end; job growth accelerated in 2014 with
employment reaching pre-recession levels. The recent drop in oil
prices could hurt energy-driven markets, such as Houston, but could
also benefit consumers and the retail sector.
After a year of largely widespread occupier demand, rising
employment and improved real estate fundamentals, most U.S.
cities are forecasting further progress in 2015. As occurred in Canada,
the effects of modernization and improved efficiencies were felt as
occupiers looked to cut costs. Multi-residential development in the
U.S. has been robust for several years, while development of office
and industrial properties is on the rise. Renovation and repurposing
remain significant trends in many Central Business Districts (CBDs).
Supply-chain efficiencies and e-commerce are driving the need for
more warehouses and storage facilities.
Overall vacancy in the U.S. office markets that Avison Young tracks
(4.1 billion square feet (bsf)) has improved year-over-year (-50
basis points (bps)) and ended 2014 at 13.6%. All but eight markets
recorded lower rates compared with year-end 2013, and a flight to
quality persists. Office space under construction totaled 73.5 msf
at the end of 2014, up from 69.1 msf one year prior, although the
percentage of new construction in relation to existing total inventory
was virtually unchanged at nearly 2%.
The Avison Young markets with the most office space under
construction (6 msf or greater) are New York, Houston, Dallas and
Washington, DC. Preleasing is around 50% nationally as build-to-suit
activity is common with few projects being built on a speculative
basis. Nevertheless, many occupiers of these new buildings are
frequently moving from elsewhere within the market, so net
occupancy gains are not realized. Development is increasingly
focused on urban mixed-use projects as tenants’ desire for live/work/
play environments endures.
In the retail market, resilient absorption rates and receding vacancy
characterized the sector in 2014, with shopping centers the only
segment to register vacancy in the double digits. In addition to
labor-market improvements, consumer confidence is at its highest
level since the Great Recession. Retail construction did not intensify
in 2014 and, nationally, building starts were at their lowest point in
more than three years. With no near-term supply concerns, expect
upward pressure on rental rates to persist in 2015. Across the country,
there remains a high demand for retail in ubiquitous town center
developments, with retail center sales activity in 2014 up compared
with 2013. Most notable was Kimco Realty Corp.’s acquisition of
10
Avison Young 2015 Forecast
Blackstone Real Estate Partners’ portfolio, which includes 5.6 msf of
shopping centers spanning 11 U.S. markets. Also of note was the
expansion of grocery retailers with many markets reporting namebrand food store openings.
Avison Young’s industrial markets totaled 9.1 bsf at third-quarter 2014
with rising construction levels and overall vacancy of 7.2% supported
by a year of strong demand. At the end of 2014, a total of 93.3 msf
was under construction, a 37% increase from 2013 levels. While
noteworthy year-over-year, this amount is well under the historic
peak (2007) when 180 msf was under development. Cities that
comprise the bulk of the construction activity include Los Angeles,
Chicago, Atlanta, Philadelphia and Dallas. Tight market conditions
and a dearth of big-block opportunities are driving warehouse
construction by large occupiers such as Amazon.com, which has
projects proceeding in multiple U.S. markets.
Investment sales transactions were up considerably in 2014, and
third-quarter volume was 11% higher year-over-year with multiresidential and CBD office properties leading the gains. However,
investors are increasingly looking at secondary markets. Likewise,
multi-residential and CBD office assets recorded the sharpest cap-rate
decline even as all sectors trended lower. Foreign capital continued
to seek U.S. property acquisitions and, not surprisingly, the U.S.
Northeast, West Coast and Chicago areas garnered the largest share
of the nearly $50 billion invested. Canadian investors outpaced the
next closest sources of foreign investment – China and Norway – by
more than double.
In 2014, pricing recovered further and was bolstered by sustained low
interest rates. The potential for interest-rate increases in 2015 could
limit further price increases, and sellers may find themselves with
a larger gap in the bid-ask spread than existed in recent years. Still,
the availability of capital and attractive yields relative to other asset
classes will support demand for commercial real estate, and will likely
offset any increased cost of funds for the near term.
The maturing economic recovery led to tightening availability in all
sectors and positioned the U.S. commercial real estate market for
further growth in 2015.
Margaret Donkerbrook
Vice-President,
U.S. Research
U.S. - Overall Office Vacancy Rate Comparison
25%
Vacancy Rate (%)
20%
15%
U.S. Overview & Forecast
10%
5%
0%
25%
U.S. - Overall Office Vacancy Rate Comparison
Vacancy Rate (%)
20%
15%
10%
25%
U.S. - Overall Office Vacancy Rate Comparison
U.
S.
M
ar
ke
ts
0%
15%
10%
AY
Vacancy Rate (%)
5%
20%
2013
2014
2015F
5%
0%
14%
U.S. - Overall Industrial Vacancy Rate Comparison
Vacancy Rate (%)
12%
10%
8%
6%
4%
2013
2014
2015F
2013
2014
2015F
2%
AY
U.
S.
M
ar
ke
ts
0%
U.S. - Area
Canada
- AreaUnder
UnderConstruction
Construction
Area
Under
Construction
(msf)
Area
Under
Construction
(msf)
18
7
16
6
14
5
12
4
10
3
8
2
6
1
4
0
2
2013
2014
2015F
0
Office
Industrial
Avison Young 2015 Forecast
11
Calgary
Eighth Avenue Place
Nation-leading economic performance bolsters retail and multi-residential investment
C
algary boasts one of the most productive and best-paid
workforces in the country. Average weekly earnings increased
5.1% year-over-year to August 2014, and the population is
expected to reach more than 1.3 million by 2018, largely due
to immigration. With oil prices having dropped in response to
OPEC’s decision in late 2014 to maintain output levels, the market
is expected to experience some challenges in the next 12 to 24
months. However, the business community’s long-term outlook is
still positive.
Office
Overall vacancy within Calgary’s office leasing market rose in
2014, reaching 8.6% in the third quarter. Class AA space, however,
is extremely limited as appetite for the highest-quality product in
the Downtown market remains strong. Five projects comprising
3.9 msf of class AA office space are under construction downtown
and are 57% preleased.
Downtown vacancy surpassed 6%, rising due to large amounts
of sublease space being placed on the market. This increase can
be attributed to companies taking a more conservative approach
to their real estate by putting excess space on the market. Sublet
space is being used as a tactic by large companies to mitigate
their short-term exposure. Their strategy includes taking more
space than immediately necessary to allow for long-term growth,
then subleasing portions of it with staggered expiries to control
their future options.
Retail
At the end of the third quarter of 2014, the Calgary retail
environment remained very tight with 2.5% overall vacancy.
More than 600,000 sf of new retail projects are slated to come on
line between late 2014 and the end of 2015, with the majority
being grocery-anchored projects in Calgary’s newest residential
developments.
The arrival of U.S. retailers continued with Marshall’s and
Nordstrom entering the Calgary marketplace in 2014. Sporting
Authority, Cabela’s and Whole Foods are establishing a presence,
drawn to Calgary by an optimistic business outlook, low
unemployment and strong consumer spending.
12
Avison Young 2015 Forecast
Calgary Vacancy Rates
24%
22%
20%
18%
16%
14%
12%
10%
8%
6%
4%
2%
0%
2013
2014
Office
2015F
Industrial
Industrial
Industrial leasing and investment activity in 2014 continued
to be robust, reducing overall industrial vacancy to 3.9% in the
third quarter of 2014 and moving Calgary out of the oversupply
situation experienced in mid-2013.
Strong leasing activity began to narrow the delta between
closing rates and asking rates, becoming reminiscent of the 2007
market peak.
Investment
The Calgary market again witnessed robust investment sales
activity, with more than $1.8 billion allocated to land, industrial,
office, residential and retail property purchases. Calgary’s
retail market witnessed $280 million in investments of $2
million or greater through September 2014. The majority of
these investment dollars were generated by private investors
purchasing older street-front retail properties.
A noteworthy trend in Calgary is the number of new purposebuilt, multi-residential rental projects under construction in the
inner city. Serving as a litmus test for this trend will be the AURA
project by Intergulf-Cidex, the former Astoria project now under
AIMCo ownership, and the former Kai Tower (Oslo) project being
developed by Statesman. Several additional projects are being
planned by GWL on behalf of bcIMC, Embassy Bosa and QualexLandmark, among others.
Edmonton
Stantec Tower (Image Copyright EAD JV Inc.)
Edmonton market to remain strong despite oil uncertainty
E
dmonton’s long-term commercial real estate prospects were
excellent in 2014. Economic conditions remained favourable
through most of the year, yielding steady GDP growth of 4.9%
for the capital region. This figure is down marginally from 5.5%
in 2013 and 5.7% in 2012, but still surpasses the 2% seen in the
rest of Canada. Prospects are down slightly for 2015 as global oil
prices decrease, and politically motivated pipeline decisions have
introduced a modicum of uncertainty into the market. However,
even these worst-case scenarios forecast GDP in the Edmonton
region growing by 3% in 2015.
Office
In 2014, Edmonton’s office market had its most important year
since Downtown’s last building boom nearly three-and-a-half
decades ago. Two new office towers (the Stantec and Edmonton
Arena District towers) were announced. These projects followed
the announcement of the 600,000-sf Kelly Ramsey Building in
2013. Together, these three developments will add 1.8 msf of
class AA office space to the market in 2018-19.
Growing pains are expected through 2015 as landlords and
tenants adjust to new office market dynamics. Local landlords
have started upgrading their respective properties in an attempt
to brace the market against any significant sale-price and leaserate shocks.
Retail
The retail market remained a major source of real estate growth
in the city, buoyed significantly by low unemployment and
rising wages. Additionally, the capital region’s population grew
by roughly 37,000 people in 2014, including immigration (both
interprovincial and international) and natural population growth.
Power centres located near the city limits have been the primary
focus of development in order to service rapidly expanding
residential communities. Two developments bucking this trend
are the Edmonton Arena District and the Brewery District, both
of which will provide a new standard of high-end retail space in a
market that had started to show its age.
Edmonton Vacancy Rates
24%
22%
20%
18%
16%
14%
12%
10%
8%
6%
4%
2%
0%
2013
2014
Office
2015F
Industrial
Industrial
Edmonton’s industrial sector continued to be the primary
economic engine for the region. Industrial GDP grew at an
impressive 7.6% in 2014. Land, particularly in the Southeast
market, approached $900,000 per serviced acre, while average
rental rates for small, multi-bay properties reached $12 psf.
Servicing rates are also increasing (mainly as a result of higher
labour and materials costs) and can now run between $127,900
and $196,200 per acre. These levels compare with $115,000 and
$165,000, respectively, in Vancouver, which is a larger market.
Lower-than-forecast oil prices may put a damper on the rapid
pace of development in the industrial sector through 2015.
For tenants, however, this situation may offer some measure of
respite from a market that had been quickly heating up.
Investment
Investment properties continue to be hot commodities with cap
rates significantly exceeding 10-year bond yields. This situation
continues a long-term trend of falling cap rates, which have
decreased to the 6% range for industrial properties, 5.5% for
downtown offices and 5% for retail and residential. This trend
is likely to continue through 2015, although Alberta’s resourcereliant economy and falling oil prices have made investors slightly
more risk-averse.
Avison Young 2015 Forecast
13
Guelph (Southwestern Ontario)
125 Maple Grove Road, Cambridge
Market to show continued resurgence in 2015
T
he Southwestern Ontario market (made up of Guelph,
Kitchener, Cambridge, Waterloo and Brantford) has proven to
be attractive to investors. Tenants and owner/users in the market
have continued to expand, and companies from outside the
area are relocating or expanding into the region. This growth is
anticipated to continue in 2015.
Office
The office market has witnessed significant changes. With
large tech users such as BlackBerry, Google, Desire2Learn and
a multitude of start-ups calling Kitchener-Waterloo (commonly
known as “Canada’s Technology Triangle”) home, the impact of
the expansion and contraction of these companies shaped the
office market during 2014. Much of the absorption was in brickand-beam buildings, while aging downtown office buildings
experienced increased vacancy.
Significant vacancy in Kitchener’s downtown core and the
former BlackBerry portfolio continues to drive rental rates down,
providing ideal conditions for tenants. As well, there has been
a migration of office users outside of the core and closer to
Highway 401 in the South Kitchener and Cambridge markets,
where employees have an abundance of free parking and the
premises are easily accessible to commuters.
Retail
Following years of significant retail development in projects
such as Sportsworld in Kitchener and The Boardwalk in Waterloo,
there has been a slowdown in new ventures. The redevelopment
and repurposing of properties throughout the region for retail
use is being contemplated by developers and encouraged by
municipalities. Most recently, sites in Guelph and Cambridge not previously large retail nodes - have attracted large tenants
such as Sail and Costco.
Industrial
Demand in the industrial market grew significantly in 2014 with
a resurgence of manufacturing and distribution. A number of
properties, which were on the market for a year or more, were
absorbed with rates recovering from the previous year’s lows and
average rents for new buildings ranging between $5.75 and $6.25
psf and second-generation space leasing from $4.50 to $5.50 psf.
14
Avison Young 2015 Forecast
Guelph (SW Ontario) Vacancy Rates
24%
22%
20%
18%
16%
14%
12%
10%
8%
6%
4%
2%
0%
2013
2014
Office
2015F
Industrial
There has been an increase in tenants and buyers as well as new
industries (such as the production of medicinal marijuana) as
financing remained available to support growth in the industrial
sector. This absorption of space, as well as continued demand,
has spurred new development with such organizations as Cooper
Construction, Bentall and HOOPP all offering new buildings in the
market.
Investment
The investment market has been active, involving both local
private groups as well as large institutional investors looking
for value outside the Greater Toronto Area. Several investors are
betting on the continued growth of Southwestern Ontario as
they buy vacant buildings on a speculative basis and market the
sites for lease.
Industrial, office and retail assets were all actively traded in 2014.
This demand is expected to continue into 2015, with a likely
decline in available supply. Cap rates have hit pre-2007 records
in the low-to-mid 6% range for office and high 6% to 7% for
industrial. Many investors still see the potential upside of these
properties as tenant demand increases and rental rates follow
suit.
Halifax
Purdy’s Wharf
Nova Scotia in transition, but Halifax remains stable
R
ural Nova Scotia continues to attract media attention
outlining its struggles with immigration, an aging population
and failing municipalities. However, this is part of an economic
stabilization process. The province has learned it must react as a
coherent entity and replace redundant layers of administration
with lean and agile governance systems. Slight economic decline
is expected to continue in rural areas through 2015.
Halifax is the stable urban juggernaut of Atlantic Canada.
With high concentrations of government, military, privatesector regional headquarters and educational institutions, the
metropolitan area is expected to remain healthy for the near
future. Developers’ confidence in the city spurred construction
of commercial and multi-residential projects, which have led
to an overabundance of available space. Vacancy levels have
risen as a result of this construction boom, and a slowdown in
development is expected as the necessary absorption takes
place.
Office
Halifax’s office market experienced the most dramatic increase
in vacancy when compared with other sectors. In 2014, the
overall vacancy rate increased to 12.8%, a 400-bps increase yearover-year. This significant jump in vacancy can be attributed to
new developments in both the suburbs and downtown core.
Developments of note include Waterside Centre and the new
Nova Centre, which will house hospitality, office, retail, multiresidential and the new World Trade and Convention Centre.
Overall vacancy is expected to remain steady through 2015.
Commencements of the many approved office developments
have been postponed until further notice, and there is no
indication of any major business relocations, closures or
acquisitions in the market.
Retail
The retail leasing market remained reasonably flat in 2014 with
most tenant activity coming from regional and local businesses.
Many national retailers have been cautious on expansion within
Atlantic Canada, typically entering the market because of
lower density once other urban markets have been saturated.
The outlook for 2015 anticipates mild performance and stable
vacancy.
Halifax Vacancy Rates
24%
22%
20%
18%
16%
14%
12%
10%
8%
6%
4%
2%
0%
2013
2014
Office
2015F
Industrial
Industrial
The industrial market also experienced an increase in vacancy
during 2014, rising to 12.3% from 8.6%. The major cause of this
increase is directly related to the construction of new product.
Confidence from the development community also has led to
an overbuilt industrial market. Overall vacancy is expected to
retreat roughly 100 bps in 2015 as interest from the oil and gas
sector increases and Irving Shipbuilding’s National Shipbuilding
Procurement Strategy (NSPS) contract with the federal
government commences.
The amount of new industrial supply expected for 2015 is very
modest. Most of the planned construction includes owner/user
facilities. This situation will also assist with positive absorption
and bring the historically stable industrial market back to singledigit vacancy within the near future.
Investment
The wait-and-see policy of many REITs throughout Canada led to
moderate performance in the investment sector. Capitalization
rates remain steady throughout the multi-residential and
commercial sectors, averaging 5.5% to 7% across all asset classes
for quality product. Most believe the trend of compressed
cap rates has come to an end in Halifax. With interest rates
expected to climb, owners and investors will place an emphasis
on operations and cost-cutting in an attempt to keep cap rates
stable through 2015.
Avison Young 2015 Forecast
15
Lethbridge
Chinook Business Park
All sectors expected to remain stable in 2015
L
ethbridge’s commercial real estate market had another
record year in 2014 as all sectors performed well. Rental
rates and vacancy stabilized after several years of big gains
in some sectors (and despite declines in others), providing
improved confidence for developers and investors. Major new
projects, underway or being planned for the city’s west side
and Downtown, will bring heightened construction activity and
spin-off benefits. All sectors are expected to remain stable into
2015.
Office
Office vacancy is expected to stabilize in 2015. The office
market experienced 25,000 sf of negative absorption in 2014,
due to the downsizing of offices as part of a larger trend of
providing more flexible work environments. The first quarter
of 2015 looks strong for office leasing and absorption. Low
interest rates continue to support demand from office users
to purchase assets, but a lack of supply and rising prices are
turning potential buyers into tenants. Landlords, who have been
competing with sellers, are optimistic that positive movement
will occur in 2015.
Retail
Retail demand was strong in 2014. Further expansion continues
in South Lethbridge’s retail core with leasing nearly complete
in the final phase of Coulee Creek Common. West Lethbridge,
the newest and fastest growing part of the city, will see
the completion of West Gate, a six-acre development, and
construction of The Crossings commence in spring 2015. The
Crossings is a 60-acre development with the first 100,000-sf
phase consisting of grocery, pharmacy, family eatery and quickservice restaurant, medical, and dental users.
Overall retail supply is meeting demand, and developers are
optimistic about the growth anticipated in 2015.
Industrial
As expected at the end of 2013, the industrial market remained
balanced through 2014 with average rental rates and vacancy
holding steady. Sale pricing flattened after record increases
in 2012 and 2013. The largest source of activity emerged from
owner-users taking advantage of available credit to purchase
property.
By the second half of 2014, supply was very limited and strong
demand had pushed most users towards new construction.
16
Avison Young 2015 Forecast
Lethbridge Vacancy Rates
24%
22%
20%
18%
16%
14%
12%
10%
8%
6%
4%
2%
0%
2013
2014
Office
2015F
Industrial
With many business owners swapping lease payments for
mortgage payments, space in prime properties and older
buildings opened up but was backfilled quickly, resulting in
tough competition for developers marketing new projects.
This trend is expected to continue in 2015 and hold lease rates
steady (with slight downward pressure on rates a possibility).
Pricing will likely remain flat due to the availability of new
construction. Vacancy should remain stable due to a balanced
inventory and fewer speculative projects.
Investment
Low interest rates, along with plenty of capital, have kept cap
rates historically low, dropping them below what was predicted
for 2014. Multi-residential assets traded at less than 6% in 2014,
and retail product was in the low-to-mid 6% range. This trend is
expected to continue throughout 2015, as there is very limited
supply.
Office and industrial cap rates have risen 1% to 2% due to
lower institutional investor interest in these asset classes. The
challenge in the market is to find product that can be stabilized
and purchased as existing owners want to hold. Cap rates are
expected stay in this range, with dips still possible, as local and
regional investors are pressured to place capital in 2015.
In 2015, Lethbridge assets will likely continue to offer 8% to 9%
capitalization rates, but properties will be harder to find.
Montreal
Sun Life Building
Record number of transactions
F
or the past few years, economic activity has shown moderate
growth in the Greater Montreal Area (GMA). However, the real
estate market set a new record in 2014, exceeding the previous
record set in 2008, with an overall transaction volume greater
than $4 billion.
From a growth perspective, 2015 shows promise as U.S. economic
conditions keep improving, boosting export activity and keeping
prices in Canadian dollars attractive to American investors. In
addition, previously announced major infrastructure investments
will improve Montreal’s economy.
Office
Vacancy rates rose to 11.5% from 9.7% during 2014, largely due
to the addition of nearly 1 msf of new inventory, the conversion
of former industrial buildings to loft-style office space and the
rationalization of occupied premises by tenants at lease-renewal
time.
Given the drastic increase in available area in 2014 (in addition
to the 1.4 msf of office space currently under construction in 13
buildings and the projects still to come in the GMA), vacancy is
expected to rise to 12% in 2015.
Retail
Retail sales ticked up slightly in 2014. The popularity of small
neighbourhood and community centres is constantly decreasing
as they face fierce competition from regional centres, power
centres and lifestyle centres featuring American big-box retailers
and outlet stores. The impact of such competition results in a
rationalization of occupied space and a decrease in rental rates
for local retailers. Premium Outlets is the latest retail project to
open in the suburbs north of Montreal. Located in Mirabel, the
350,000-sf power centre includes 80 stores.
Industrial
The aging industrial inventory on the Island of Montreal has
been undergoing an important transformation recently. Nearly
2 msf was converted to office space, condominium units or retail
premises. Nonetheless, 1.2 msf of industrial space is currently
under construction in the GMA. However, the vacancy rate
remains at 6%.
.
Montreal Vacancy Rates
24%
22%
20%
18%
16%
14%
12%
10%
8%
6%
4%
2%
0%
2013
2014
Office
2015F
Industrial
Investment
In 2014, investment volume reached its highest point since 2008,
at more than $4 billion. The most significant transaction was
Cominar REIT’s $1.6 billion purchase of 11 shopping centres, three
office buildings and one industrial property (mainly in Quebec)
from Ivanhoé Cambridge.
Other significant transactions included the purchase of a 50%
interest in Quartier Dix30 in Brossard (valued at $400 million) by
Oxford Properties, and the sale of the 840,000-sf Bell Campus on
Nuns’ Island by KanAm Grund to a Korean fund for $300 million.
The Liberty portfolio in Ville Saint-Laurent, totalling 1.7 msf, sold
to a group of investors led by Canderel for $280 million, and
Ivanhoé Cambridge sold its 50% interest in the Sun Life Building
for $138 million. Griffintown’s main promoter, Devimco, also sold
two mixed-use properties totalling 315,000 sf to First Capital
Realty for $102.2 million.
After a record year in investment volume, market performance
is expected to be more modest in 2015. Nevertheless, Montreal’s
diversified economic sectors keep providing real estate investors
with great opportunities.
Improving economic conditions and the re-industrialization of
the U.S. could have a beneficial impact on the Montreal market
in the next few years. Industrial vacancy is expected to remain
stable in 2015.
Avison Young 2015 Forecast
17
Ottawa
Performance Court
Limited fallout expected from government cutbacks
A
s expected by many observers, the Ottawa market has
felt the sting from the Canadian government’s continuing
downsizing of the public service in advance of the federal
election scheduled for 2015. That said, sectors of the market
continue to perform, and those businesses working outside the
problem areas continue to invest in the local economy.
With 2015 being an election year, some fresh federal spending
could be forthcoming. Ottawa’s market is still in a holding pattern
with some sectors enjoying positive traction while others remain
stuck in neutral.
Office
The Ottawa office market continues to be under pressure as
Public Works and Government Services Canada (PWGSC) sheds
old and obsolete product in the wake of continuing government
downsizing. Vacancy rates in the greater Ottawa market continue
to rise and are expected to surpass 9% for the first time since the
fallout in the technology market early in the last decade. The tech
sector continues to improve with brisk leasing activity in West
Ottawa.
Although availability rates are up, real vacancy rates are in the
range of 10% as there are large blocks of space under contract
generating rent for their owners. The shadow vacancy rates
represented by the sublet market paint a misleading picture and,
in fact, this submarket continues to perform reasonably well. By
year-end 2015, the Kanata market could conceivably outperform
the downtown core in terms of real direct vacancy rates.
Retail
Ottawa’s retail market continues on its strong footing with low
vacancy rates despite the weaker employment picture. The
addition of 230,000 sf at the Rideau Centre is a boost to Ottawa’s
downtown as high-profile U.S. retailers establish beachheads in
the city. Also of note in 2014 was the addition of 293,000 sf to the
Tanger Outlet Mall – located across a highway from the Canadian
Tire Centre – with a hotel also planned for the site.
Industrial
Demand for industrial space remained strong in 2014 from both
investors seeking to purchase investment product and owner/
users seeking to acquire buildings. The ongoing limited supply of
available product across the region will keep sale prices moving
upward. Interestingly, there are a few speculative industrial
buildings that are scheduled to be available for early 2015. These
18
Avison Young 2015 Forecast
Ottawa Vacancy Rates
24%
22%
20%
18%
16%
14%
12%
10%
8%
6%
4%
2%
0%
2013
2014
Office
2015F
Industrial
“lease-only” buildings will have key characteristics that most
older industrial stock lacks, specifically 24-foot ceilings and dock
loading. Given the tight market, especially for acquisitions inside
the Greenbelt, cap rates are expected to continue to remain low.
Investment
Capital market activity remained stable through 2014 with
cap rates relatively unchanged across all asset classes. Multiresidential transactions led the way as cap rates in the sector
remained at historically low numbers. Given the large amount
of activity in recent years, owners’ pricing expectations have
increased and yields have fallen.
As vacancy rates in the office market continue to trend upwards
as government moves to higher-quality accommodations,
institutional landlords continue to battle for positioning in
the next phase of core office development. As the federal
government continues with its occupancy plan, obsolete product
is expected to be demolished or repurposed, and a flight to
quality will be the continuing theme among public and major
private-sector groups. This trend will prove to be the driving force
for new development activity.
Quebec City
Hôtel Loews Le Concorde
Real estate market remains stable as economic growth continues
E
conomic growth continued to define the Quebec City Region
(QCR) in 2014. The private sector has diversified considerably
during the past 10 years, allowing for a more vibrant market
emphasizing innovation and research and generating higher
employment levels. The strong presence of the public sector
(education, healthcare, public services) provides the area with
stable employment and, as a result, unemployment is among the
lowest in Canada (5.4%).
Overall, the real estate market performed well in 2014, with some
of the lowest vacancy rates in Canada. Rates are expected to
remain low and stable in 2015.
Office
With the delivery of approximately 1.7 msf of office space since
2010 in the QCR, new construction now represents just 140,000
sf. At the end of 2014, the vacancy rate reached 6.4%. During the
past few years, office market activity has expanded to new areas,
such as Lebourgneuf and Laurier Boulevard in the midtown area.
The recent spike in construction activity did not have a significant
impact on vacancy, which remains at an average of approximately
6% due to constant demand. A slight increase in the vacancy rate,
to 7%, is expected in 2015.
Retail
The retail market has undergone a significant change with
the arrival of power centres diversifying the types of retailers
operating in the area. Carrefour de la Bravoure, a new $50-million
project, opened in 2014. The project includes 40 stores in more
than 15 buildings. The largest shopping centre in the QCR,
Galeries de la Capitale, also announced a 150,000-sf expansion in
2015. Due to the slow growth of the retail sector during the past
few years, severe competition posed by big-box retailers and the
popularity of e-commerce, retailers are expected to rationalize
their occupied space at lower rental rates.
Quebec City Vacancy Rates
24%
22%
20%
18%
16%
14%
12%
10%
8%
6%
4%
2%
0%
2013
2014
2015F
Office
industrial land will also be made available and should generate
additional construction activity in 2015.
Investment
Significant investment transactions were concluded in the QCR in
2014. The 182,000-sf Beauport power centre ($46.7 million), the
125,000-sf Méricie Building ($18.5 million), the 36,000-sf centre
Halles du petit Quartier centre ($11.4 million), and Hôtel Loews Le
Concorde ($11.5 million) were sold. In addition, several parcels of
land were sold alongside Laurier Boulevard in Sainte-Foy for $11
million.
In terms of public investment, the construction of a new
$400-million amphitheatre is well underway. It is expected to fuel
the revitalization of the Lower City by attracting other companies.
In the mid-term, a new health complex, valued at more than $1
billion, will be delivered in stages between 2019 and 2025 on
the Hôpital de l’Enfant-Jésus site, which will include 760 hospital
beds.
Industrial
The QCR industrial market consists mainly of owner/users. There
are very few tenancies and assets available for sale. As a result,
rental rates and selling prices are approaching the cost of new
construction.
Due to the scarcity of available industrial land and increasing
demand, the Saint-Augustin-de-Desmaures industrial park will
expand to include a new 160-acre parcel south of Québec City
Jean Lesage International Airport. A limited amount of new
Avison Young 2015 Forecast
19
Regina
New Stadium at Evraz Place (rendering)
Economy remains strong; real estate reaches plateau
D
espite moderating in 2014, Saskatchewan’s economy
generated the fastest job growth and lowest unemployment
rates in Canada with employment up 3.5% year-over-year to
October 2014. Mixed messages on growth were prevalent in the
resource sector, partly due to declines in mining activity and
agricultural income. The economy is expected to rebound in
2015, based on a resumption of more typical production levels
in the mining and agricultural sectors, and higher exports of
manufactured goods due to a weaker Canadian dollar, while the
impact of lower oil prices remains undetermined.
Regina is expected to perform well, driven by large multi-year
projects such as the city’s $1-billion downtown revitalization
initiative (which includes a new stadium), a $1.2-billion major
highway bypass route underway to enhance export trade, a new
$181-million wastewater treatment plant and $74 million for new
university residences.
Population growth is expected to continue despite an ongoing
shortage of affordable housing for low-to-middle income earners.
Building permits will finish 2014 near record levels, perpetuating
a decade-long trend, as construction costs appear to have
plateaued.
Office
A balanced market emerged for both landlords and tenants
in 2014. Absorption was slow, and this trend is expected to
continue for the next few years. Increased vacancy due to new
construction and subsequent backfill space, consolidation of
government inventory, and previously non-competitive space
converting to competitive. The third-quarter 2014 vacancy
rate of 6.7% is expected to increase slightly to 7.1% (11.5% for
competitive inventory only) in 2015 as two new buildings under
construction are delivered. Net lease rates remained stable for
good-quality space, while class B space saw a retrenchment in
price and incentives emerge in order to attract tenants.
Retail
Retail growth continues in Grasslands, Regina’s premier retail
destination. New tenants arriving in the area in 2015 include the
Canadian Brewhouse, McDonalds, Ricky’s All Day Grill, SaskTel and
Willow Park Wine & Spirits. The city’s eastern retail corridor saw
minimal leasing activity in 2014, as new development land in the
area is limited. Eastside businesses were content with the location
as lease rates remained stable at approximately $18 psf to $25 psf.
20
Avison Young 2015 Forecast
Regina Vacancy Rates
24%
22%
20%
18%
16%
14%
12%
10%
8%
6%
4%
2%
0%
2013
2014
Office
2015F
Industrial
Newly constructed retail space in the Victoria east corridor and
Grasslands is commanding between $30 psf and $40 psf.
Industrial
Regina’s industrial inventory continued to grow during 2014 as
inventory reached approximately 17.3 msf. Vacancy was stable at
2.1% with a modest increase expected in 2015. Almost 300,000
sf is under construction as building continues in the new Ross
Industrial Park, the Global Transportation Hub (GTH), TransLink
Logistics Centre (located in the GTH), Parker Industrial Park
(northeast of Regina), Carson Business Park and Great Plains
Industrial Park (near White City).
Serviced land ranges from $160,000 to $450,000 per acre in the
capital region, while net lease rates on new space remain around
$12 psf to $14 psf.
Investment
The investment market was relatively slow in 2014 due to a
shortage of supply as activity focused on the sale of smaller
privately-held properties. Activity is expected to be slow, with
little to no change in cap rates for all asset classes, in 2015.
Toronto
Simpson’s Tower and Hudson’s Bay Store
Sound fundamentals to be tested by new development
T
he Greater Toronto Area (GTA) commercial real estate market,
though fundamentally sound, will begin to face the impact
of new development and backfill vacancy in 2015, especially on
the office and industrial fronts. The retail landscape will continue
its transformation, marrying bricks and clicks, while investors
strategically deploy capital with the likelihood of higher interest
rates in the near term.
Toronto Vacancy Rates
24%
22%
20%
18%
16%
14%
12%
10%
Office
8%
Uneven demand characterized the GTA office market for most
of 2014. The flight to quality in both existing and new buildings
is apparent, as is the ongoing space-rationalization trend. New
developments continued to attract the interest of corporate
users, as Sun Life Financial leased 300,000 sf at 1 York Street
and LoyaltyOne inked a deal for 172,000 sf at the Globe & Mail
Centre, both to be completed in 2016. The first two of seven new
downtown towers (RBC WaterPark Place and Bremner Tower)
opened in Downtown South. The banks have been busy and are
expected to stay active with several large requirements in play,
fuelling another development announcement in 2015.
4%
Countering the perceived downtown migration of tenants, the
suburbs reaffirmed their enduring appeal. The headquarters for
Sobeys and TJX are nearing completion, while KPMG and Aviva
have opted to remain in the suburbs, spurring new construction.
Development will lift GTA vacancy above 10% in 2015, while
tenants will have numerous affordable options.
Retail
Malls across the region are expanding and renovating to
attract and retain tenants and shoppers, motivated in part by
competition with e-commerce and the Canadian expansion
plans of U.S. retailers, including Nordstrom and Saks. Residential
development is increasing downtown retail demand,
encouraging retrofits of underutilized spaces and locations
beyond the traditional street front, such as Loblaws’ planned
20,000-sf location on the second storey of a condo building.
Target, traditionally in suburban locales, in 2014 announced a
two-storey, 145,000-sf store to anchor a multi-tower, mixed-use
development in downtown Toronto.
Industrial
Demand for modern, higher-clear-height space continues
to drive new speculative and design-build construction (5.7
msf underway). Toronto West remains the focus of most
6%
2%
0%
2013
2014
Office
2015F
Industrial
developer activity, with some renovating or replacing their
existing buildings and utilizing infill sites as the major industrial
submarkets – Mississauga and Brampton – offer increasingly
limited industrial land.
New multinationals (Costco, 1.1 msf ) are entering the Vaughan
market north of Toronto, putting upward pressure on rental rates.
SCI Logistics and Princess Auto ranked among the few large deals
of 2014. New completions in 2015 will likely cause a modest
vacancy increase, while a number of larger transactions are
expected to be completed.
Investment
The recurring theme of abundant capital chasing a limited supply
of quality product will continue in 2015. Through the first three
quarters of 2014, office and retail portfolio and single-asset sales
greater than $100 million powered investment sales volume to
more than $8 billion. Low cap rates for quality assets persist, and
while private investors and pension funds have filled some of the
void left by REITs, some buyers are undertaking development to
augment their growth strategies. REITs, while culling some assets,
were net buyers in 2014; however, pending interest-rate hikes
may curtail their purchasing power.
Blockbuster acquisitions including Bayview Village Shopping
Centre ($505 million) by bcIMC, Hudson’s Bay office and retail
sale/leaseback ($673 million) by Cadillac Fairview and 150 Bloor
Street West ($255 million) by the Spanish billionaire owner of Zara
underscored domestic and foreign interest in the GTA.
Avison Young 2015 Forecast
21
Toronto West (Mississauga)
1 Prologis Boulevard
Varied growth expected in 2015
I
nverse trajectories categorized the varied velocities of the
Toronto West market in 2014 with the industrial side gaining
strength in the wake of a slightly waning office market and an
underperforming retail sector. This situation, combined with a
highly competitive investment market, has 2015 projected to see
stratified gains and losses spread across all four major sectors.
Office
Leasing velocity in the Toronto West office market slowed its pace
in 2014 and is expected to continue on this slightly downward
trajectory. A major trend driving this change is the current flight
to quality in Toronto West. Tenants in today’s market are often
opting for newer, LEED-certified product over outdated and,
operations-wise, more costly class B and C units that may offer
lower net rents, but are simply unable to compete with the
streamlined efficiencies that new class A product can provide.
Compound this factor with a rising trend toward creating denser,
more economically efficient office spaces and the reasons for
Toronto West’s somewhat tepid office leasing market heading
into 2015 start to become more clear.
Retail
Retailers in the food, personal services and healthcare industries
have come off a strong year. These high-margin services have
been able to shield themselves from increasing rents imposed by
landlords, unlike their fixed-margin counterparts. As the number
of tenants able to meet these rents dwindles, the market is facing
stalled growth in rental rates.
Big-box vacancies, ensuing from some Best Buy and Staples store
closures, are also adding to the strain on the market. Even if such
corporations were to shrink their occupied space within their
stores, the remaining newly divided vacant spaces would not be
suitable to a number of tenants.
Industrial
The positive activity seen throughout 2014 has brought rental
and vacancy rates closer to pre-recession levels. Nevertheless,
a few gaps remain, primarily with respect to the 300,000-sfand-greater component of the market. The limited amount of
confirmed big-box lease deals in 2014 – significantly lower than
years prior to 2008 – is indicative of slowing tenant velocity.
The concern lies with how the market will respond when the
expected 3.9 msf of speculative development is completed in
2015.
22
Avison Young 2015 Forecast
Toronto West Vacancy Rates
24%
22%
20%
18%
16%
14%
12%
10%
8%
6%
4%
2%
0%
2013
2014
Office
2015F
Industrial
Beginning in 2015, developers are moving towards a few
prominent trends: renovating existing buildings, utilizing infill
sites and gradually shifting to accommodate smaller-sized
tenants (sub-120,000 sf ) in their big-box product.
Investment
The Toronto West investment market is very much a seller’s
market. Buyers are plentiful in an area where high-value assets
are dwindling and cap rates are shrinking, forcing asking rates
skyward and driving away potential private investors. The
migration of large, institutional corporate buyers into core
markets like downtown Toronto will continue in 2015, leaving
some of the suburban, more industrially geared product in the
hands of aggressive and active bidders, such as REITs.
Though the investment market is robust at present, the
movement of interest rates will be the ultimate determining
factor as to whether investors will see a softening or a further
spike in pricing in the Toronto West market.
Vancouver
Telus Garden
Healthy investment levels to remain part of tight BC market
H
ealthy demand for BC commercial real estate propelled sales
activity to the third-highest first-half deal and dollar volume
since at least 1998, despite a lack of trophy asset transactions and
a significant decline in industrial investment. Overall deal activity
in 2014, however, remained comparable with the record levels
of investment achieved in 2012 and 2013 due to a handful of
significant deals in the second half of the year.
While demand for all asset types is anticipated to remain strong
in 2015, limited supply is expected to increasingly constrain
deal flow while premium pricing remains standard, particularly
for quality, well-located product. Capitalization rates remain
compressed – for quality properties in primary markets – in all
asset classes.
Office
In 2014, a unique combination of factors, including government
dispositions, propelled office sales activity in BC, particularly
during the first half. Dispositions of smaller office assets (less than
$15 million) supported deal flow throughout the year with few
deals greater than $30 million and a handful of transactions larger
than $50 million.
With approximately 1.7 msf of office construction underway (in a
downtown market of 21.3 msf ) and more than 1 msf scheduled
for delivery by the end of 2014, expectations for 2015 remain
uncertain. Downtown vacancy is likely to exceed 10% by the
end of 2015, a significant increase from the 3.9% vacancy rate
recorded in 2012.
Retail
Unconventional non-market retail dispositions were responsible,
in large part, for deal activity in 2014. Deal velocity remained
healthy overall, while total dollar volume was on par with 2013
but muted compared with 2012. Premium assets in primary
markets (and increasingly secondary markets) remained difficult
to acquire as demand continued to outstrip supply. This trend
is expected to persist in 2015 as supply remains constrained;
however, purchasers are increasingly less likely to acquire assets
in secondary markets where pricing had echoed assets located in
primary markets.
Vancouver Vacancy Rates
24%
22%
20%
18%
16%
14%
12%
10%
8%
6%
4%
2%
0%
2013
2014
Office
2015F
Industrial
3.5% to 4% even as new inventory continued to be delivered
throughout the year. Government spending tied to port-related
transportation infrastructure and bullish sentiment based on
strengthening cargo flows through Port Metro Vancouver pushed
speculative construction to levels unseen in recent times. It
is anticipated that leasing activity will remain strong through
2015, due in part to the ongoing lack of sale product and limited
availability of industrial land.
Investment
Capital flows remained strong in the BC investment market in
2014 with limited availability of product serving as the primary
constraint restricting market activity. Private investors, both
local and foreign, stepped into the breach in a significant way to
maintain deal activity as REITs tentatively returned to the market
(as sellers) after beating a hasty retreat in 2013.
Institutions remained largely unable to deploy significant capital
due to a lack of investment-grade assets of scale. Private investors
and wealth management companies will remain at the heart
of the BC investment market in 2015 due in part to significant
stockpiles of accumulated capital that can rival some institutional
investors when the right asset becomes available.
Industrial
A lack of available supply hindered sales activity while new
speculative construction continued to expand Metro Vancouver’s
industrial market in 2014. Vacancy remained at approximately
Avison Young 2015 Forecast
23
Winnipeg
MTS Centre
Downtown Winnipeg continuing to be redefined
S
everal cranes are piercing Winnipeg’s skyline as a wide
range of new developments, including highrises and the
expansion of the RBC Convention Centre, redefine the city
core, a process kick-started by the return of the NHL to the city.
Winnipeg is also the proud home of the Canadian Museum for
Human Rights, which finally opened in September 2014 – a
project that was 11 years and $351 million in the making.
Huntingdon Capital and FAM REIT’s portfolio sale to Slate
Properties was big news in Winnipeg in 2014. This quiet
acquisition (for approximately $210 million) took the brokerage
community by surprise. Slate’s total assets are more than
$2 billion, with 102 properties and nearly 11.5 msf under
management.
Winnipeg’s residential and non-residential building permits
grew 9.5% to $900.6 million during the first six months of 2014
(the last six-month period for which figures are available). This
level outpaced the national average of 3.6% and represented
the strongest growth among metropolitan areas in Western
Canada. Commercial building permit values were up 52.6%
compared with 2013.
Office
Vacancy in class A and B space remains in an acceptable range,
albeit at its highest point in the past decade. However, class C
properties are another story, as a few of Winnipeg’s historical
buildings have seen vacancy rise. Current vacancy numbers
are acceptable for well-heeled and vacancy-tolerant existing
owners, but challenging for new buyers.
Class A is holding its own with renewals achieving $20 psf net.
New rental agreements are few and far between. Creative deals
are increasingly necessary for trophy tenants due to the high
cost of building out space. Class B owners are under pressure to
upgrade their buildings in order to compete for the few choice
tenants available. The provincial government remains occupied
with a much-anticipated 60,000-sf to 80,000-sf mandate for
Manitoba Liquor and Lotteries’ new downtown location. This
will likely have a positive effect on the market.
Retail
Winnipeg’s retail market comprises approximately 19.5 msf. In
the past few years, new power centre construction has added
more than 4 msf. All sectors, excluding shopping centres,
recorded a sharp rise in vacancy in 2013, a trend that continued
24
Avison Young 2015 Forecast
Winnipeg Vacancy Rates
24%
22%
20%
18%
16%
14%
12%
10%
8%
6%
4%
2%
0%
2013
2014
Office
2015F
Industrial
in 2014. Vacancy, however, remains below 5%. The opening of
a new Target store and the construction of another Walmart
coupled with a new neighbourhood centre by Hopewell
Developments kept the market busy, especially in Winnipeg’s
fast-growing south end.
Industrial
Winnipeg weathered the latest global economic downturn
quite well with only a 50-bps increase in industrial vacancy. The
industrial market has achieved equilibrium instead of being
skewed in favour of landlords as it typically has in the past.
Winnipeg’s industrial vacancy rate has remained well below 4%
for the past decade.
Investment
The investment market remains buoyant with several trophy
assets being acquired or under contract with plenty of suitors.
Cap rates remain similar to previous years with no rise in sight.
There is no shortage of investor interest and capital with choice
properties getting multiple bids. The rationalization of some
non-core assets by institutions will bring more inventory to the
market in 2015.
Atlanta
The Towers at Wildwood
Excitement returns to Atlanta’s commercial real estate market
A
tlanta’s commercial real estate market, at last, experienced
significant post-recession improvement in 2014. Year-overyear job growth exceeded 2% through the first three quarters
of the year, and Atlanta’s diverse economy, low cost of doing
business and affordable cost of living attracted institutional and
local investors and developers. Georgia has once again been
ranked the No. 1 state in the U.S. for business by Site Selection
magazine. Confidence in the local economy and expected
investor demand should drive commercial real estate activity in
2015.
Office
The office market (which consists of nearly 142 msf ) experienced
steady gains, attributed to sustained expansion among local
businesses and a steady influx of relocating tenants. Net
absorption through the first three quarters of 2014 totaled more
than 1.8 msf, exceeding the 2013 total by more than 400,000 sf.
Tenants occupying large blocks of space included WellStar Health
moving into 165,000 sf and 112,000 sf at 3624 Providence Road
and 793 Sawyer Road, respectively, and Vonage moving into
78,900 sf at The Towers at Wildwood in the Cumberland/Galleria
submarket.
While still elevated, vacancy is trending downward. At the end of
third-quarter 2014, the vacancy rate was 17.8%, down from 18.7%
at year-end 2013. Rent growth has been modestly positive since
2011. Market rents at the end of third-quarter 2014 averaged
$20.31 psf. An even better performance, including marked
improvement in rent growth, is expected for 2015. Buckhead,
Midtown and the Central Perimeter should remain the market’s
most active areas.
Retail
Retail vacancy ended the third quarter of 2014 at 8.8%, a 90-bps
decrease year-over-year, as absorption totaled 2.7 msf in the
first three quarters of the year. Although core markets witnessed
some improvement in vacancy rates and absorption, average
rental rates remained relatively stable at $12.17 psf.
The selective development of mixed-use projects, such as Avalon
in Alpharetta and Ponce City Market in Midtown, should remain
a focus of Atlanta-area retail development. This sector should
continue to tighten gradually while rental rates increase.
Atlanta Vacancy Rates
24%
22%
20%
18%
16%
14%
12%
10%
8%
6%
4%
2%
0%
2013
2014
Office
2015F
Industrial
Industrial
Atlanta’s industrial vacancy rate improved to 8.8% in thirdquarter 2014, down 220 bps from year-end 2013. Availability
is constrained in numerous submarkets, driving a wave of new
construction, more than 60% of which is speculative. Rental rates
climbed to $3.40 psf, up from $3.22 psf year-over-year. As rental
rates have increased, so has investor confidence.
The most active submarkets were I-20 West and I-85. Deliveries
scheduled for 2015 include IDI Gazeley’s 196,000 sf at Hamilton
Mill, Oakmont’s 604,900 sf, known as Skyline/20 West, and DCT’s
700,000 sf. IDI Gazeley has begun construction on an 840,000-sf
facility in Hamilton Mill, only to be matched by Ridgeline’s new
1.1-msf facility in Braselton and Weeks Robinson’s 1.5 msf in
Forest Park.
Investment
Investor interest remained strong in 2014, with more than $4
billion in transactions completed through the first three quarters.
Atlanta’s strengthening job market and improving real estate
fundamentals have attracted significant investor capital to the
region. Investment volume has increased over the last three
years, and that trend is expected to continue with prices moving
upward during 2015.
Avison Young 2015 Forecast
25
Austin
Frost Bank Tower
High demand, steady preleasing and strong economy buoy market
H
igh demand for space, steady preleasing activity and a strong
local economy brought an eventful year for Austin’s real
estate markets in 2014.
Continued high demand for office space brought another year
of increasing rental rates, decreasing vacancy and the start
of several new development projects across the city. Office
developers have kicked off more than 3 msf of projects – a strong,
albeit conservative, building boom. The trends of low vacancy
rates, record-level rental rates and moderate absorption are
expected to continue in 2015 as the market awaits new product.
Office
Austin’s commercial office market was characterized by high
demand for space and favorable preleasing trends in 2014.
Such factors prompted developers to launch numerous projects
around Austin, especially in the CBD, Northwest and Southwest
submarkets, most of which are set to deliver over the course
of 2015 and 2016. A handful of new product delivered in 2014,
including Colorado Tower and IBC Bank Plaza, in Austin’s CBD
most notably.
Looking forward, those watching Austin’s office market will keep
an eye on rising rental and occupancy rates and their effect on
demand through 2015. If the high demand for space seen in 2014
continues, the new developments delivering to the market in
2015 will likely have little influence on occupancy rates, resulting
in higher rental rates.
Retail
Nearly 1 msf of new retail space was built in Austin during 2014,
with almost another 500,000 sf under construction at the start of
2015. The strongest retail sectors over the course of 2014 were
shopping centers and general retail properties, both of which
recorded rising occupancy and upward rental-rate trends.
Overall, Austin’s retail market remained steady in 2014 with
vacancy rates hovering around 5%. Given the strong occupancy
and construction trends, along with rapid growth across the
entire metropolitan area, retail market activity appears set to
continue favorably in 2015.
Industrial
Austin’s industrial market saw promising activity in 2014.
Occupancy rates slowly climbed, closing out 2014 around 91%,
with rental rates rising as well. About 500,000 sf of industrial
product was delivered to the market in 2014 with approximately
26
Avison Young 2015 Forecast
Austin Vacancy Rates
24%
22%
20%
18%
16%
14%
12%
10%
8%
6%
4%
2%
0%
2013
2014
Office
2015F
Industrial
800,000 sf under construction heading into 2015. While this is
a relatively high level of construction activity for the industrial
market, it is important to note that nearly one-quarter of
that product is owner-occupied and will have little effect on
occupancy.
In 2015, the industrial market is expected to continue its steady
performance with decent preleasing activity and positive
absorption.
Investment
The commercial investment market in Austin had a strong
2014. Multi-residential investment activity was most notable
during the year, totaling more than $1.5 billion in volume. There
was significant investment activity in the office sector as well,
specifically in Austin’s CBD where the California State Teachers
Retirement System took full ownership of three high-profile
downtown buildings in the final quarter of the year. As the
economy and job growth continue to trend positively, Austin
looks set to remain competitive in the year ahead.
Boston
80 Causeway Street
Expectations remain high amid strong demand
E
conomic conditions in the Greater Boston commercial real
estate market remained robust at the end of 2014 as tenants
drove more than 13 msf of positive absorption since the middle
of 2011. Traditionally tracking well below national averages,
unemployment remains in the low 5% range as the area’s
renowned knowledge-worker base is in acutely high demand.
Expectations in Greater Boston remain high for 2015 given, in
part, an elevated perception of the market in a global context
and an optimistic outlook on the part of area business managers.
Certain macroeconomic concerns remain balanced locally by
the recent history of the region’s increasingly diverse mix of
industries, including those comprising the region’s occupancy
in the 2007 to 2009 mortgage crisis. Although the crisis had
profound effects nationally, it made little impact on the Greater
Boston market, outside of construction starts and the investment
sector.
Office
The Greater Boston office market experienced continued
increased demand throughout 2014. Asking lease rates rose
across the majority of asset quality levels, most notably for the
best assets in preferred locations. Examples include the Greenway
submarket in Boston and Kendall Square in Cambridge, where
lease rates approached record levels for the 2% of available space
now sought by the world’s most famous and deep-pocketed
technology companies. Construction starts were also notable
throughout the region, with the 2.7-msf construction pipeline
including build-to-suit projects for Goodwin Procter and PwC in
the Seaport District, and for Natixis at 888 Boylston Street in the
Back Bay.
With robust demand for office space expected to continue
throughout 2015, a lack of existing availability and competing
lifestyle uses for developable property will likely force users to
adjust patterns. Large users will increasingly be forced to devise
strategies up to three years before lease expirations and consider
build-to-suit options. High demand for top talent will accelerate
a trend toward more efficient uses of space to counter increasing
per-square-foot occupancy costs and absorption in secondary
locations.
Boston Vacancy Rates
24%
22%
20%
18%
16%
14%
12%
10%
8%
6%
4%
2%
0%
2013
2014
Office
2015F
Industrial
Retail
Greater Boston retail properties continued to experience rent
growth throughout 2014 in both prestigious center-city locations
and an emerging set of live/work/play environments, notably
deployed along Route 128 and at Assembly Row in the Ring. The
urban infill trend, national but especially notable in Boston, will
likely accelerate throughout 2015.
Industrial
Industrial demand remains strong, but entirely predicated on
product vintage and quality. The newest and most state-ofthe-art product has been nearly entirely absorbed; vacancy is
prevalent among older and more obsolete facilities. Logistics
services and larger retailers serving the prosperous consumer set
in New England have driven absorption in the area’s distribution
facilities. With better product nearly full, demand will likely shift
to other parts of the quality chain.
Investment
With the exception of the continued divestiture of the sizeable
Equity Office portfolio, investment focused on value-added
transactions in 2014. Core activity was limited compared with
preceding years, and properties traded at levels that required
aggressive pricing that appears sustainable given current leasing
conditions. In 2015, investment activity is expected to be highly
selective. Foreign capital with low cap-rate expectations will
potentially play a more visible buy-side role.
Avison Young 2015 Forecast
27
Charleston
Charleston Gateway Center
Region experiences continued growth
A
steady influx of new residents, traditional job growth,
expansion of tourism and improvement in new and emerging
sectors of the local economy bode well for the Charleston region.
Continued national and international accolades draw visitors
from around the world. A world-class deepwater port that serves
manufacturers, distributors, exporters and others is creating
opportunity throughout South Carolina. A burgeoning IT sector is
now competing with markets around the country. These factors,
and many others, create a strong and growing market in which to
invest, live, work and play. Charleston is on the world stage.
Office
Strong job growth and a dynamic influx of residents are driving
demand for office space. With limited supply available, vacancy
has been dropping for several years. The market is now responding
with new office product, build-to-suit opportunities and some
innovative reuse of existing and formerly obsolete buildings;
however, the supply of new and repurposed office product has
fallen behind demand. The result is higher lease rates and a
development surge in highly desired locations. This spike has not
gone unnoticed by investors, who are driving down capitalization
rates for high-profile properties.
Retail
Ranked as the No. 1 U.S. city by Condé Nast magazine, Charleston
has seen rapid growth in population and tourism, resulting in high
demand for additional retail space. Lease rates are continuing to
increase, and longer lease terms are being executed. To respond
to the growing demand, developers are attempting to build
additional space, much of which is not yet available. This situation
has forced retailers to wait for available space or choose less
desirable locations temporarily. The majority of the suburban
growth is occurring in the Mount Pleasant and Summerville
submarkets, along with Downtown Charleston as it reacts to
increased tourism and residents.
Industrial
The Charleston industrial market tightened dramatically in the
third quarter of 2014. Incoming businesses and expanding local
companies absorbed most of the existing spaces. Confident
companies obtaining low interest rates have moved forward with
purchasing owner-occupied sites, pushing sales pricing back to
replacement costs – a trend not seen since 2007.
While rents have come back to 2006 levels, they still have not risen
28
Avison Young 2015 Forecast
Charleston Vacancy Rates
24%
22%
20%
18%
16%
14%
12%
10%
8%
6%
4%
2%
0%
2013
2014
Office
2015F
Industrial
high enough to justify construction; however, with existing quality
space almost fully occupied, speculative construction should begin
on a broad basis in 2015. Key drivers, such as the local auto-aero
manufacturing cluster, the port, and the expanding services/
construction sectors will likely continue to contribute to growth.
Investment
Charleston continues to be on the radar of institutional and private
investors. Demand for investment-grade properties, especially
in prime locations with strong-credit tenants, heavily outweighs
supply, creating a highly advantageous market for sellers. Some
properties are receiving multiple offers above the asking price with
favorable closing conditions for the seller.
The investment market has seen steady or compressing
capitalization rates since the start of 2014. Cap rates for class A
office, class A industrial and full-service lodging have slightly
declined, while class A retail and class A multi-residential cap rates
have stayed steady.
For 2015, as long as the present factors compressing cap rates
exist – such as low interest rates, a positive economic outlook and
constrained supply – a continued low-cap-rate environment is
expected.
Chicago
300 N. LaSalle
Improving fundamentals drive investment market
P
ositive growth impacted all sectors within Chicago’s
commercial real estate markets in 2014. Employment jumped
90 bps year-over-year – up 38,300 jobs as of August 2014. The
professional and business services sectors continued to lead in job
creation, adding 18,600 jobs in the same period. Venture capital
funding within the metropolitan area witnessed a tremendous
uptick compared with the previous year, up 197.8% at midyear 2014 with total funding of $133 million, further solidifying
Chicago’s role as a thriving start-up hub. Site Selection magazine
named Chicago as the 2013 “Top Metro” for corporate relocations
and expansions. Looking forward, the Chicago market is expected
to record positive growth throughout 2015.
Chicago Vacancy Rates
24%
22%
20%
18%
16%
14%
12%
10%
8%
6%
4%
2%
0%
2013
Office
The Chicago office market continued to strengthen as vacancy
dipped 70 bps year-over-year to 13.4%. Healthy absorption within
the CBD made class A availability in desirable CBD submarkets
increasingly tight, encouraging tenants to look at alternate
submarkets – such as the Central Loop, which saw vacancy
decrease 200 bps.
Construction continued on the two speculative developments
within the West Loop submarket. Leasing interest remained strong
on both projects with 34% being preleased. The suburban office
market witnessed moderate absorption in 2014, and vacancy
remained relatively unchanged. Construction remains focused
on build-to-suits, such as Zurich North America’s new 734,000-sf
campus. Tech firms were involved in four of the six largest CBD
transactions in the third quarter, a trend likely to continue over the
next few years.
Retail
Retail demand grew as the improving local economy boosted
consumer spending. Big-box retailers are expanding into city
markets, primarily in growing neighborhoods with residential
development. The Maxwell, a recently completed retail
development in the South Loop submarket, attracted Nordstrom
Rack, Burlington Coat Factory and Dick’s Sporting Goods. Further
retail growth is anticipated throughout 2015.
2014
Office
2015F
Industrial
Industrial
Recovery in the industrial sector continued throughout 2014,
pushing values past pre-recession levels. At the end of thirdquarter 2014, year-to-date net absorption totaled 8.1 msf of space.
Vacancy fell to 8%, down 40 bps year-over-year. Rental rates
increased during the same period, up 4% and averaging $4.32 psf.
Construction activity has remained active across the market. There
were 14 buildings delivered in the first three quarters of 2014
totaling 4.2 msf, with nearly 15 msf under construction. The largest
project currently under construction is the 1.7-msf Michelin Tire
build-to-suit within the I-80 East submarket. With the influx of new
buildings being delivered during 2015, vacancy is expected to see
a minimal uptick in certain submarkets.
Investment
Investor appetite for industrial product grew dramatically during
2014. Transactional volume increased 76% year-over-year with
more than $2.3 billion transacted through three quarters. Core cap
rates continued to decline below pre-recession levels. Appetite
for non-core and value-add product is gaining momentum as
investors gain confidence with improving fundamentals.
Core CBD office product continued to trade aggressively as
vacancy across the CBD decreased. The Irvine Company purchased
300 North LaSalle for $850 million (or $652 psf) at 29% over the
2010 purchase price. As market fundamentals continue to improve,
investor demand will likely increase in both core and value-add
product.
Avison Young 2015 Forecast
29
Cleveland
One Cleveland Center
Every facet of market benefits from surge
W
ith a multi-billion-dollar development boom underway,
Cleveland is experiencing a level of momentum unseen in
a generation. Every facet of the real estate spectrum is enjoying
the benefits of this surge. Sparkling new convention facilities are
booked for years to come and will play host to the 2016 Republican
National Convention.
Cleveland’s world-class healthcare facilities are renowned
throughout the globe. The Cleveland Clinic, a multispecialty
academic medical center, is Cleveland’s largest private employer
and is considered one of the top hospitals in the United States.
The new health-tech corridor now contains three major healthcare
organizations (not including the Cleveland Clinic), four higher
education establishments, and more than 100 health-related
service companies and tech firms.
Cleveland is also experiencing an extensive residential construction
cycle, with more than 1.5 msf of office space currently being
converted for residential purposes. Downtown residency is higher
now than it has been in the past six decades. Multi-residential
rents have remained relatively low even though occupancy is
high. A diverse and dynamic real estate renaissance is underway in
Cleveland.
Cleveland Vacancy Rates
24%
22%
20%
18%
16%
14%
12%
10%
8%
6%
4%
2%
0%
2013
2014
Office
2015F
Industrial
decreased vacancy. After retail construction completions were
virtually non-existent in 2012 and 2013, the Lighthouse Village in
Lorain was finally completed in 2014.
Industrial
The local unemployment rate was 6.9% as of December 2014,
which is slightly above the state average of 5.7%. Stable political
leadership both locally and statewide will provide Cleveland with
the continuity necessary to build on the progress that the city has
enjoyed.
Cleveland’s industrial market continues to tighten with little
speculative development planned. Positive absorption and
increasing rental rates continue to be the norm. The vacancy rate
dropped to 6.9% in the third quarter of 2014, with class A vacancy
closer to 1.5%. Vacancy rates in 2015 are expected to decline by 20
bps. Major construction news includes TimkenSteel’s $41-million
facility, which broke ground in November 2014 near the company’s
Grambinus plant.
Office
Investment
A notable downtown lease in 2014 was signed by Brown Gibbons
Lang & Company, which took on 20,000 sf in One Cleveland Center.
The overall Cleveland office market has exceeded expectations and
recorded positive net absorption in five of the past six quarters. The
office vacancy rate dropped to 16.9% in the third quarter of 2014
from 17.2% at the end of 2013. Much of Cleveland’s construction
focus has been on the conversion of office buildings to residential
units to meet the demand for urban living. The $300-million
nuCLEus mixed-use project is scheduled to deliver more than
500,000 sf of new class A office space in late 2016.
A white-hot residential market has seen increased demand for
class B and C office product to be converted to multi-residential.
Downtown residency is expected to nearly double in the next
five years. Investors from outside the region continue to focus
on opportunities in the Cleveland office market as well. Market
capitalization rates continue to move downward; and with no
scheduled new deliveries for at least the next 18 months, that trend
should continue through 2015.
Retail
Cleveland’s retail market also reported positive absorption during
2014. As consumer confidence returns to the market, predictions
for 2015 include an increase in retail rental rates as well as
30
Avison Young 2015 Forecast
Columbia
The Hub at Columbia
Growth across all product types expected to continue
A
s South Carolina’s capital and largest city, Columbia is
experiencing positive growth among all property types.
Major economic drivers in Columbia include the University of
South Carolina, the state government and Fort Jackson, the
largest basic training facility for the U.S. Army. A growing student
body at the University of South Carolina has created additional
demand for housing and retail services downtown. Also, an
excellent highway system and proximity to the Port of Charleston
make Columbia an attractive area for manufacturing and logistics
companies. Overall, positive growth across all product types is
expected to continue in 2015.
Columbia
Columbia,
SCVacancy
VacancyRates
Rates
24%
22%
20%
18%
16%
14%
12%
10%
8%
6%
4%
2%
0%
2013
Office
The 2015 office outlook is for vacancy to decline and lease rates
to increase, with rental rates in the CBD approaching record
highs. A main driver of this trend is the repurposing of older
office buildings in the CBD into apartments and student housing.
This repurposing trend, combined with lower unemployment
and minimal new office construction, should lead to a tighter
downtown market, increased demand in suburban markets and
an increased interest in office development. Holder Properties
announced in 2014 that it will develop a new 130,000-sf class A
office building in the CBD.
Retail
As the economic recovery continues, the primary retail trend
in Columbia is the arrival of national brands in the area. After
the recent introduction of Whole Foods and Urban Outfitters,
announcements were made by Trader Joe’s, J.Crew, Nordstrom
Rack and Anthropologie for their first Columbia locations.
Also, Academy Sports recently opened its second Columbia
location. National retailers are expected to continue their
expansion into Columbia through 2015 and beyond as new
construction and adaptive reuse developments come online.
Combining this trend with local retail expansion, the outlook for
2015 is for stable-to-lower vacancy and higher rental rates.
2014
Office
2015F
Industrial
Industrial
The Columbia industrial market’s future growth will depend on
speculative development. With several manufacturing companies
expanding and others relocating facilities to the area, industrial
space has become much tighter with few large blocks of quality
space available for immediate occupancy.
Developers and county governments have responded to this
need for additional space by putting several industrial projects
under development; however, a large portion of this new space
has already been preleased. Tight availability and higher rents
are expected to continue until new speculative projects come on
stream to help balance supply and demand.
Investment
With capitalization rates on a national level continuing to decline,
institutional and large private investors have begun to focus
on smaller geographic markets that may have projects with
higher in-place returns and value-add components through
repurposing. This is certainly the trend in the market with
institutional investors acquiring multiple investment properties
in the area during 2014, especially within the industrial asset
class. A heightened interest in the area is expected to continue as
institutional investors look for ways to raise portfolio returns.
Avison Young 2015 Forecast
31
Columbus, OH
200 Civic Center Drive
Downtown market remains vibrant amidst low unemployment
T
he Columbus commercial real estate market continues to
improve as unemployment rates decline. The Columbus metro
area has a total population of 2 million people and is growing
1.3% annually. Top employers include Ohio State University, the
State of Ohio, JPMorgan Chase, OhioHealth and Nationwide
Mutual Insurance. Downtown Columbus, post-recession, remains
vibrant, helped by a strengthening Central Ohio economy,
favorable interest rates and a continued increase in the number
of CBD residential units.
Unemployment in the Columbus market, which was at 4.4% as
of December 2014, remains well below the national and state
average. The city’s major downtown private employers, including
Nationwide Mutual Insurance, AEP, Columbia Gas, State Auto
Insurance, Motorists Insurance Group and Grange Insurance, all
continue to grow both downtown and elsewhere in Central Ohio.
For the first time in decades, a major CBD multi-tenant, mixed-use
office building, 250 High, is under construction. Developed by
Daimler Group and Kaufman Development, the 12-story building
will include 120 apartments on the top six floors, five floors
comprising 136,000 sf of office space, and retail on the ground
floor.
Office
Notable lease transactions during 2014 included NBBJ’s 22,500sf deal at 250 South High Street and Assurex Global’s lease for
10,500 sf at 175 South Third Street. NiSource, the parent of
Columbia Gas, will lease 35,000 sf for back-office operations at
200 Civic Center Drive. CoverMyMeds, a healthcare software
company, is moving from 12,000 sf in an older CBD office building
to a 65,000-sf sublease in a major downtown class A office
building – the largest downtown lease of 2014.
The forecast for 2015 is for an additional drop in vacancy rates,
in both suburban and downtown markets, due to positive net
absorption.
Retail
The Central Ohio retail market experienced its tenth consecutive
quarter of positive absorption in 2014. Distinctive tenants that
have been entering the market are restaurant and fast food
chains. Key sales include the sale of the Trader Joe’s Center
(75,859 sf ) for $11.2 million and the disposition of Polaris
Commons (50,673 sf ), which sold for $6.6 million. On the
construction end, Giant Eagle grocer completed its 92,000-sf
32
Avison Young 2015 Forecast
Columbus Vacancy Rates
24%
22%
20%
18%
16%
14%
12%
10%
8%
6%
4%
2%
0%
2013
2014
Office
2015F
Industrial
location in Grandview Yard as well as a 92,622-sf location in
Dublin.
Industrial
The Columbus industrial market remained solid with vacancy
rates dropping to 5.9% in the third quarter of 2014 compared
with 6.8% at the end of 2013. However, these record-low vacancy
numbers are expected to rise slightly in 2015 once anticipated
construction projects are completed. Major leasing and
construction projects in 2014 included Nautilus leasing 253,000
sf for a new distribution center at 5415 Centerpoint Parkway
in Obetz and Southgate Corp., commencing construction of a
50,000-sf manufacturing building in Licking County.
Investment
There were 16 office-sale transactions in 2014 totaling 754,800
sf. The Canadian investment management company, I.M.C.
Diversified Inc., made headlines by purchasing the One Mill Run
class A office building (174,300 sf ) for $18 million. Alidade Capital,
a real estate private-equity company, purchased the United
Health Care Center (136,200 sf ) in Westerville for $12 million.
American Realty Capital Partners purchased 505 North Cleveland
Ave. (72,500 sf ) for $10 million.
Dallas
Future State Farm Campus
Market diversifies with new corporate expansions
T
he Dallas-Fort Worth (DFW) metro is the fourth-largest
metropolitan area in the nation and continued to grow and
diversify in 2014. There are currently 18 Fortune 500 companies
headquartered in DFW, and even more large corporate users
are focused on the area for future relocations. All economic
sectors (excluding manufacturing) experienced year-over-year
employment gains, which resulted in broad-based growth.
Unemployment fell to 5% in September 2014. The large amount
of growth is spurring construction as people continue to follow
jobs to the city. Broad-based growth in the DFW metro area is
expected to continue throughout 2015.
Office
The Dallas office market continues to be a top performer in the
nation. Absorption through the third quarter of 2014 totaled
more than 4 msf, already exceeding full-year 2013 absorption.
Driven by corporate relocations and expansions, more than
7.4 msf is currently under construction with 70% preleased.
The majority of activity is concentrated in large, mixed-use
developments in North Dallas, although Uptown and the CBD
remained active in 2014. Toyota is moving its North American
headquarters to Plano from California and is developing a
$300-million corporate campus at Legacy West.
Other significant expansions include State Farm, FedEx and
Raytheon. Due to healthy space gains, overall vacancy has
fallen to 14.6%. Average asking rates have increased to $21.21
psf. Asking rates are expected to continue increasing until new
construction becomes available in 2015.
Retail
Retail growth has begun to echo the region’s population, and
significant employment gains have boosted consumer spending.
Fueling this fire is Nebraska Furniture Mart’s Grandscape
development in The Colony. Development in 2014 was
concentrated in The Colony, Far North Dallas and Plano, where
the majority of corporate expansion is occurring. This trend
is expected to continue in 2015 as retailers address growing
demand and an expanding population to the north.
Dallas Vacancy Rates
24%
22%
20%
18%
16%
14%
12%
10%
8%
6%
4%
2%
0%
2013
2014
Office
2015F
Industrial
approximately 11 msf of absorption in 2014. Development has
largely shifted toward speculative construction as available space
has become increasingly limited. Due to its central location and
superior logistical routes, the DFW market is driven by warehouse
and distribution properties. Online retail growth will further
boost warehouse and distribution properties in DFW in the
coming years.
Some of the larger deals in 2014 were Procter & Gamble, WilliamsSonoma, Victory Packaging, AdvoCare and Cornerstone Systems.
New construction deliveries have slightly alleviated the tight
market. Vacancy is projected to increase moderately in 2015 as
more new space is delivered to the market.
Investment
Investors remained active in the Dallas market in 2014. Dallas,
considered to be one of the nation’s most dynamic markets, has
captured the interest of foreign investors looking to place capital
in a growing market. All asset classes are trading at healthy levels,
although core assets in prime locations continue to be favored
by investors. ULI and PwC, in their Emerging Trends in Real Estate
report, ranked DFW among the top five markets in the U.S. to
watch in 2015. Investment activity is expected to remain strong in
2015.
Industrial
The Dallas industrial market posted a solid year of gains in
2014. Development ramped up in 2014 with more than 9.1
msf currently under construction. The vacancy rate is at 6%,
pushing rental rates to historic highs. The market experienced
Avison Young 2015 Forecast
33
Denver
Republic Plaza
Steady economic growth will fuel CRE market in 2015
D
enver boasts one of the most competitive housing markets
in the United States. This fact was clearly reflected in the
success of the commercial real estate market during 2014. The
competition to acquire commercial properties was aggressive
during 2014 and will remain so in 2015.
Unemployment figures are also a good indicator for the market
as a whole, and with a 4% unemployment rate in Denver as
of September 2014, it is clear that the commercial real estate
sector is thriving. Economic gains will continue through 2015
as people continue to move to the area for the prime business
environment and job prospects.
Office
In recent years, the office market has been very successful – and
2014 was no exception. The vacancy rate dipped to 10.4% in the
third quarter of 2014 from 11.2% at year-end 2013. Additionally,
absorption increased 20% during the first three quarters of 2014
when compared with the same period in 2013.
In 2015, the Denver market will likely see more tenants moving
out to suburban properties, such as the Denver Tech Center, as
escalating rental rates for premium space in Downtown will be
too expensive for many tenants. The market will favor landlords
and tenants will see fewer concessions.
Retail
The retail market is slightly behind the curve in terms of
recovery, but is definitely on the upswing with increasing rental
rates and declining vacancy. Rental rates rose slightly in 2014
to $15.13 psf from $14.97 psf in 2013. Vacancy improved to
5.5% from 6.1% in 2013. There was not a lot of construction
activity, with approximately 260,000 sf under construction at
the conclusion of 2014. Development activity is expected to
intensify as space availability declines in 2015.
Industrial
Metro Denver’s industrial market was very active in 2014 with
the retail marijuana industry fueling much of the growth.
Vacancy rates continued to decline throughout 2014, ending
the year at a 14-year low of 4.6%. Additionally, average asking
rental rates increased 6.2% to $7.23 psf at the end of 2014
from 2013. As the industrial market continues to tighten
through 2015, it is expected that Denver will experience more
speculative development in the industrial sector - a trend not
witnessed in many years.
34
Avison Young 2015 Forecast
Denver Vacancy Rates
24%
22%
20%
18%
16%
14%
12%
10%
8%
6%
4%
2%
0%
2013
2014
Office
2015F
Industrial
Investment
Denver continues to see an upsurge in investor interest in the
market. As of the third quarter of 2014, the industrial investment
volume was already outperforming 2013 with approximately
$846 million in sales, while 2013’s full-year total was $544
million. Office sales were behind the pace set in 2013, with
$1.6 billion in trades as of the third quarter, while 2013 ended
with a significant investment of $2.5 billion in office properties.
Despite the decline in total office investment, some major
properties changed hands during the course of 2014, including
Republic Plaza ($480 million), Park Central ($213 million) and
the portfolio sale of Denver West Office Park ($120 million).
The multi-residential sector was again the strongest investment
asset class during 2014 with the $2.4 billion invested at the
conclusion of the third quarter exceeding the $2.2 billion annual
total from 2013. This trend is expected to continue through
2015 as the demand for multi-residential space surges as people
continue relocating to Denver.
Detroit
Compuware Building
Detroit reset gets a jump-start
W
ith the city’s much publicized bankruptcy plan approved
and in the rearview mirror, Detroit is driving the state
economy and not letting off the throttle – a situation which will
raise the tide for the entire southeast Michigan region. Detroit’s
most recognized street, Woodward Avenue, is making headlines
again with the construction of the M-1 Railway and a new arena
for the NHL’s Detroit Red Wings. Meridian Health announced it
will replace its planned 300,000-sf new development with the
acquisition of the 1.1-msf Compuware building in partnership
with Quicken Loans for an estimated $140 million. Fifth Third
Bank is moving its regional headquarters from Southfield, MI to
the One Woodward building.
With the resurgence of Detroit’s office market, broad-based
recovery of the automotive sector and the growth of the
medical and IT sectors, demand for urban living is at an all-time
high, and multinational investors are directing their attention
towards Detroit’s downtown.
Michigan’s unemployment rate fell to 7.2% in December 2014
from its peak of 14.1% during the recession in 2009. The recent
re-election of Republican Governor Rick Snyder will provide
continuity on a statewide economic recovery that has seen
multi-billion-dollar deficits turn into budget surpluses. Rightto-work legislation is starting to have an impact on business
attraction and employment growth.
Office
Detroit office vacancy continues to trend downward, dipping to
19.1% in late 2014 from 19.5% at year-end 2013. Expectations
for 2015 are for vacancy rates to continue decreasing at
this slow pace through continued absorption. Three major
construction projects are expected to complete in 2015, but
all are fully preleased. Regional developer Redico’s recent
announcement that it will acquire the dormant Bloomfield Park
development out of foreclosure gives some momentum to the
suburban office market.
Detroit Vacancy Rates
24%
22%
20%
18%
16%
14%
12%
10%
8%
6%
4%
2%
0%
2013
2014
Office
2015F
Industrial
midtown, a submarket of downtown, and is currently seeking a
second location.
Industrial
Detroit’s industrial market is continuing to show improvement.
Vacancy rates decreased to 8.4% in the third quarter of 2014
from 9.5% at year-end 2013. Continued progress in the
automotive sector has fueled this upward leasing trend. In late
2014, more than 1.2 msf of new industrial inventory was under
construction. Rental rates rose in 2014 due to the infusion of
higher-quality inventory.
Investment
The former Wayne County Building (250,000 sf ), built in
1897 and located in Downtown Detroit, sold to a New York
investment group for $13.4 million (100% vacant). GM acquired
the former Lowe Campbell Ewald building in Warren (150,000
sf ) for $2 million. I-Star’s recent offer to sell its remaining
interest in the One Detroit Center (957,000 sf ) to its part-owner,
Detroit Pension Fund (which currently has a 10% interest) for
$100 million, is probably the best indicator of market value.
Retail
With vacancy still below 10% in a market of more than 236
msf, rents rose slightly in 2014 due to the continued growth
of consumer confidence and consumer spending. Innovation
and sustainability seem to be leading the way. Fresh Thyme
Farmers Market is planning to open stores in Troy, Rochester
Hills, Northville and Farmington Hills. Whole Foods has been
experiencing enormous success at its current location in
Avison Young 2015 Forecast
35
Fairfield County
Metro Center
Retail and multi-family growth fuel positive outlook
A
lthough Fairfield County’s unemployment rate lags the
national average, the county’s rate continues to improve
- a sign that the local economy is strengthening as the private
sector adds new jobs. Fairfield County’s office leasing activity is
expected to continue to post modest gains in 2015.
Office
While office leasing velocity is slow, proximity to Manhattan,
a 24/7 urban lifestyle and strong demand for multi-residential
units are factors that should continue to attract a young and
qualified workforce to the region and propel the office market
forward. Overall vacancy edged down in the third quarter of
2014 to 21.2% from 21.8% at year-end 2013, and asking rents
remained steady throughout 2014.
The county benefitted from a myriad of lease transactions
fueled primarily by the technology, healthcare and financial
sectors. Recent top lease transactions included Catterton
leasing 51,000 sf in Greenwich, Stamford Hospital leasing 46,400
sf in Stamford, GE Capital leasing 42,700 sf in Norwalk and
Unilever leasing 30,000 sf in Shelton.
Retail
Retail development in Fairfield County could have a milestone
year in 2015 with the Norwalk and Bridgeport submarkets
leading the charge. In Norwalk, Lowe’s Home Improvement
signed a long-term ground lease for a 150,000-sf retail
superstore, which is under construction and slated for
completion in spring 2015. Waypointe, a mixed-use retail and
residential enclave currently under construction, has already
leased 41% of its 60,000 sf of retail space.
General Growth Partners is in the approvals process to build
the largest retail development project that Fairfield County has
experienced in the past several decades. The project will include
more than 750,000 sf of mixed-use retail, restaurants and a
high-end anchor, a 150-room hotel, educational and cultural
space, and 180,000 sf of public open space. In Bridgeport, Bass
Pro Shops, which signed a 150,000-sf lease, will be joined by
Starbucks and Chipotle to launch the much anticipated 55-acre
Steel Point development site.
Industrial
The Fairfield County industrial/flex market will continue
to evolve, attracting smaller high-tech firms looking for
an educated workforce and modern facilities. Information
36
Avison Young 2015 Forecast
Fairfield County Vacancy Rates
24%
22%
20%
18%
16%
14%
12%
10%
8%
6%
4%
2%
0%
2013
2014
2015F
Office
technology, biotech/healthcare and defense-related contractors
are actively looking in the Eastern Fairfield County market,
which should result in a tighter market and a general hike in
lease rates in 2015. New construction includes the 200,000-sf
Belimo Aircontrols building underway in Danbury and delivery
of the 167,000-sf Cervalis data center in Norwalk.
Investment
The first half of 2014 witnessed strong sales activity, with five
transactions totaling $146.6 million and a high average price
of $320 psf. Heading into the fourth quarter of 2014, however,
there was only one transaction, for $16.4 million. The year’s
largest deal occurred in June when the 372,000-sf Nyala Farms
Corporate Center in Westport sold for $130 million ($349 psf ).
Several new-construction apartment projects also traded
hands in Stamford for record numbers, with a high mean of
approximately $408,000 per unit. It is anticipated that multiresidential sales will continue to be strong well into 2015.
Greenville
RiverPlace
Diversification spurs development in all asset classes
T
he 10-county Upstate region of South Carolina boasts one of
the fastest-growing economies in the U.S. Southeast and has a
population of 1.3 million. The cost of living is approximately 10%
lower than the national average, and cultural and recreational
opportunities cater to a diverse range of tastes. Thanks to its topranked business climate, a world-class research environment and
a superb quality of life, diverse companies have found a home in
the Upstate area.
In the last decade, the economic drivers have expanded from
automotive and engineering companies to a more robust
diversification with growth in life sciences, research, plastics,
photonics, tourism and the service industry. This diversification
is spurring development in all four commercial real estate asset
classes.
Office
In 2014, the Greenville-Spartanburg area office market showed
remarkable resilience. Vacancy rates trended downward by the
end of 2014 toward late-2013 levels despite a mid-year 100-bps
climb in vacancy resulting from deliveries of new supply.
With job growth prospects looking healthy and the South
Carolina economy expected to continue to expand, office
vacancies are poised to fall further in 2015, despite additional
new class A supply.
Retail
Outpacing the national average, Greenville’s population growth,
combined with a strong economy and falling unemployment,
contributed to a strong 2014 for the Greenville-Spartanburg retail
market. Vacancy rates continued to decline, falling to 7% at the
end of the third quarter of 2014 from 7.4% in 2013. Fueled by its
renowned downtown, local charm and nascent tourism industry,
Greenville is primed to absorb several mixed-use and multiresidential developments slated for delivery in 2015.
GreenvilleSC
Vacancy
Rates
Greenville,
Vacancy
Rates
24%
22%
20%
18%
16%
14%
12%
10%
8%
6%
4%
2%
0%
2013
2014
Office
2015F
Industrial
space in 2014, contributing to speculative development
announcements. With 700,000 sf of class A supply slated for
delivery in the second quarter of 2015, prelease rates are above
80%.
Overall, limited class A inventory will likely drive average rental
rates higher, but availability of class B industrial space will keep
Greenville’s lease rates averaging $3.25 psf. Expansion of BMW,
Michelin and aerospace firms surrounding Boeing will continue
to drive export volumes in 2015. Vacancy rates are expected to
remain relatively flat at 8%, but distribution and export growth
are major contributors to market strength.
Investment
The strong appetite for stable, credit-tenant leased investments
has substantially compressed cap rates in core U.S. markets.
Institutional investors’ willingness to venture into tertiary markets
with strong fundamentals and higher risk-adjusted cap rates
will bode well for increased investment sales for the Greenville
market in 2015.
Likewise, infill development along Woodruff Road will
continue to drive new development and redevelopment in the
corridor. Positive absorption is also expected in the Anderson,
Powdersville and Simpsonville submarkets, as well as along the
Haywood, Laurens and Pelham Road corridors.
Industrial
Greenville’s industrial sector shows evidence of strong future
growth. The opening of the South Carolina Inland Port generated
new demand for high-quality distribution and manufacturing
Avison Young 2015 Forecast
37
Houston
Heritage Plaza
Market remains strong despite slip in oil prices
A
nalysts in Houston, which is dominated by the energy
industry, kept a close watch on oil prices in the last six
months of 2014. After peaking at $107 per barrel (bbl) in June,
prices fell below $60 per bbl late in the year. Although prices
aren’t expected to rebound to the $100 range anytime soon, a
repeat of the 1980s oil crash is not on the horizon either.
The post-recession energy boom elevated Houston to the
forefront of an international audience. Population and
employment rapidly expanded. Development during this
time was significantly preleased, and the city remained well
capitalized. ULI and PwC named Houston as the country’s No. 1
market to watch in 2015 in their Emerging Trends in Real Estate
report. If low oil prices persist, the Houston commercial real
estate market will see the effects in 2015, particularly from
merger and acquisition activity. However, fundamentals in the
city are strong, and commercial real estate industry experts
remain bullish on Houston’s long-term health.
Office
The energy boom continued to make its mark on the Houston
office market in 2014. Large-scale projects that have been in
the works for years came to fruition, resulting in impressive
numbers. As of the third quarter of 2014, more than 6.9 msf had
been absorbed, 7.3 msf of new product had been delivered, and
an additional 14.2 msf was under construction. Even though
the building boom delivered a large amount of space in 2014,
pent-up demand and significant preleasing have resulted in a
relatively steady vacancy rate of 10.3%.
Asking rates continue to grow at an accelerated pace, increasing
by 7.4% in the 12 months ending in September 2014 to $26.65
psf. Large-scale deals began to taper off, a trend that will likely
continue for the next few years. The delivery and absorption of
space currently under construction will lead to another strong
year in 2015.
Retail
Houston’s population boom and strong job growth are fueling
the retail market. The Grand Parkway Loop will be completed
in 2015, resulting in additional retail opportunities. Retail
vacancy is expected to decrease in 2015 as tenants capitalize on
increased consumer confidence and spending.
38
Avison Young 2015 Forecast
Houston Vacancy Rates
24%
22%
20%
18%
16%
14%
12%
10%
8%
6%
4%
2%
0%
2013
2014
Office
2015F
Industrial
Industrial
As one of the strongest industrial markets in the country,
Houston is characterized by significant absorption, low
vacancy and healthy rental-rate growth. The third quarter of
2014 represented the 15th consecutive quarter of positive net
absorption, 13 quarters of which recorded more than 1 msf.
Strong demand has pushed vacancy to a low 4.5%, and asking
rates have appreciated to $5.75 psf. New deliveries in 2015
will help alleviate the tight market, particularly in North and
Northwest Houston.
Investment
Houston’s economy has caught the attention of foreign and
domestic investors. The region is one of the largest secondary
markets and, according to Forbes, is poised to become the next
gateway city by 2023. In the largest transaction in 2014, AEW
Capital purchased a 90% stake in Heritage Plaza from Brookfield
Properties for $425.7 million. Well-located, quality product is
expected to continue to trade hands in record numbers in 2015.
Las Vegas
One Summerlin
Market poised for significant growth in 2015
T
he dynamic of Las Vegas underwent a significant shift in
2014. Thousands of locals and visitors alike flocked to the
new large-scale projects delivered in 2014: the LINQ shopping
district, the High Roller - the world’s tallest observation wheel
located on the Strip - the 1.6-msf mixed-use Downtown
Summerlin development and the SLS Las Vegas Hotel/Casino.
These additions to the landscape will greatly improve the
number of visitors coming to Las Vegas in the year ahead.
Las Vegas Vacancy Rates
24%
22%
20%
18%
16%
14%
12%
10%
8%
Office
6%
Office leasing activity was relatively flat in 2014. While vacancy
across the submarkets fluctuated, overall vacancy remained the
same. Tenants continued to take advantage of the vulnerable
market by finding higher-quality space at lower rates located
in more favorable locations. Leasing in lower-quality space has
remained slow due to the availability of higher-quality space
at reasonable prices. These trends are expected to continue
in 2015 until class A lease rates rise enough to direct activity
towards class B and C space.
2%
slated to break ground in early 2015. Two such projects are
Dermody Partners’ 420,000-sf speculative development in North
Las Vegas, as well as Panattoni Development Company’s two
230,000-sf speculative developments in the southwest.
Retail
Investment
The local retail market continues to build steam going
into 2015. The 1.6-msf, mixed-use Downtown Summerlin
development, which opened in November 2014, has become
a positive indicator for the valley. The second phase, which
will offer highrise condos and office space, will continue to
strengthen the project.
Multi-residential investments continue to gain momentum
from both local and national investors seeking higher yields.
Even during the Great Recession, Las Vegas gained at least
4,000 new residents per month. Following drastic improvement
in the local economy in 2013 and 2014, this population trend
is expected to increase in the years ahead. Multi-residential
occupancy is on the rise; and while not robust, development
activity has improved. Many existing apartment buildings are
primed for renovation and resale, while rents are still well below
pre-recession levels. Interest rates are projected to increase
moderately in 2015.
Another retail center located in the west submarket, Village
Square, has reached critical success in recent years. Westport
Capital invested more than $6.5 million in improvements, and
occupancy grew to 90% from 45% in just a few years. Sahara
Center, which opened in late 2014 and is also located in the
west, is a 220,000-sf center that features several big-box stores.
This recent significant growth bodes well for the Las Vegas retail
market in 2015.
4%
0%
2013
2014
Office
2015F
Industrial
Industrial
Much like the office market, industrial vacancy across the valley
continued to decline at a slow pace in 2014. It is very likely
that vacancy will dip below 9% in 2015. With a lack of available
contiguous space greater than 100,000 sf, and with many
large retail and entertainment projects completed in 2014,
demand for large warehouse/distribution space is expected
to be significant. There are several developers with projects
Avison Young 2015 Forecast
39
Long Island
Jericho Plaza
Demand gains momentum in all asset classes
H
istorically low interest rates continue to fuel an improving
economy and real estate market recovery on Long Island.
As Manhattan and the boroughs continue to experience
incredible demand on both the residential and commercial
sides, Long Island continues to be viewed as a viable
alternative. Demand is gaining momentum in all asset
classes with industrial and retail leading the pack. Active
industries continue to be pharmaceuticals, warehousing
and distribution, healthcare, leisure and hospitality, financial
services, professional and business services, construction, and
transportation and utilities. There continues to be limited new
construction deliveries and a diminishing supply of existing
inventory in certain sectors. This situation is contributing to a
continued positive outlook for 2015.
Long Island Vacancy Rates
24%
22%
20%
18%
16%
14%
12%
10%
8%
6%
4%
2%
0%
2013
2014
Office
2015F
Industrial
Office
Industrial
The Long Island office market, which comprises more than 40
msf of class A and B space, is still lagging other active sectors,
but continues to improve. The office market ended the third
quarter of 2014 with a vacancy rate of 16.7%, slightly lower than
the second quarter; however, third-quarter vacancy reflected
a slight increase year-over-year. In spite of this uptick, the
growing success of the healthcare, financial and energy sectors
has resulted in healthy activity in all submarkets. Asking and
effective rents are continuing their upward trends; and with
continued activity forthcoming, positive absorption and lower
vacancy rates should prevail in 2015.
Long Island has a unique industrial real estate market
comprising more than 131 msf of warehousing and distribution
with some regional manufacturing remaining. The industrial
market was the first sector to show signs of improvement with
the most significant growth coming in 2013 and 2014, bringing
the vacancy rate down to a healthy 9.9% for Long Island overall.
Retail
The Long Island retail market is continuing its robust expansion
with big-box users and arrivals of national and local retailers
on the rise. Florida-based retailer Stein Mart is opening its first
Long Island store and plans additional expansion in suburban
New York. Both small neighborhood centers and regional
shopping centers continue to lease up. This positive growth
trend is expected to continue in 2015 with tested retailers
continuing to expand and new players entering the market.
40
Avison Young 2015 Forecast
The vacancy for the Nassau and Suffolk submarkets, if broken
out, would be 9.7%. There is a severe lack of high-bay, largefootprint product on the market, and both leasing rates and
selling prices continue to rise. Activity is expected to continue
pushing further east in 2015 as availabilities to the west
dissipate.
Investment
Investment activity was slow-paced throughout the Long
Island marketplace in 2014 due exclusively to a lack of available
product. There is a huge appetite for large multi-residential
properties, although the opportunities are few and far between.
Any properties which come on the market are selling at strong
pricing levels with cap rates at historical lows for good product.
Activity has expanded to the fringe areas, and a number
of secondary office buildings were sold. Quality retail and
office product will likely continue to attract buyers in 2015 as
occupancy numbers continue to strengthen.
Los Angeles
Aon Tower
Industrial to lead in 2015 as office and retail follow
W
idespread economic improvement in the Los Angeles
market led to an increase in leasing and investment sales
activity in 2014. Creative office users led demand for office space
in markets such as West Los Angeles. Infill retail space garnered
strong interest as retailers demonstrated more confidence
regarding consumer spending. Strong retail e-commerce sales
translated to an increased demand for industrial space.
In 2015, a further decrease in the unemployment rate is expected,
and demand for commercial real estate product should remain
high. Meanwhile, cap rates for well-leased buildings should
continue to compress, providing an opportunity for investors to
seek development or value-add opportunities.
Los Angeles Vacancy Rates
24%
22%
20%
18%
16%
14%
12%
10%
8%
6%
4%
2%
0%
2013
Office
The Los Angeles office market showed positive momentum in
2014 and is expected to experience further vacancy decreases.
West Los Angeles led all submarkets in 2014 in terms of
performance. This trend is expected to continue well into 2015.
The Downtown Los Angeles office submarket has lagged;
however, a positive perception of this area is taking shape.
In the overall Los Angeles market, construction activity has
accelerated with several projects scheduled to be delivered in
2015. Strong leasing activity in markets such as West Los Angeles,
South Bay and Hollywood is expected to accommodate the
construction deliveries in 2015. By year-end 2015, the vacancy
rate for the entire Los Angeles market should remain below 18%
as a broad-based economic recovery accelerates in markets
outside of West Los Angeles.
Retail
In 2014, the retail vacancy hovered in the 8% range, an
improvement over that of 2013. The increase in the number
of mixed-use developments in the Los Angeles market has
presented an opportunity for retailers to locate in dense and
walkable environments.
2014
Office
2015F
Industrial
Industrial
In 2014, the importance of e-commerce to the industrial market
was evident in the large amount of leasing activity that was
dedicated to e-commerce distribution centers. The Los Angeles
and Long Beach port labor dispute could have short-term
implications on tenant demand and investor interest for industrial
space. In spite of this, the long-term forecast for the Los Angeles
industrial market is positive, as tenant demand is expected to
outpace the delivery of buildings and investors anticipate a
favorable 2015.
Investment
The average cap rate across all asset classes in 2014 was 6.1% as a
lack of product on the market pushed pricing up. Foreign capital
flows played a major role in investment sales activity in 2014. In
fact, the majority of capital originated from Asia, a trend that is
expected to continue throughout 2015.
There is a total of 1.8 msf of retail space scheduled to deliver
in 2015. Projects of note include The Village at Westfield in
Woodland Hills and Runway Playa Vista in Playa Vista. The
downsizing of big-box department stores is expected to continue
in 2015; however, demand for smaller-format stores in urban
areas is expected to gain momentum.
Avison Young 2015 Forecast
41
New Jersey
50 Bryla Street
Sustainable fundamentals spark optimistic outlook
N
ew Jersey’s strategic location, high median household
income, educated workforce and quality of life are some
of the sustainable fundamentals contributing to a stable and
healthy commercial real estate market. With additional tax
incentives, relatively low unemployment rates and an influx of
residents seeking respite from the high costs associated with
New York City, the outlook for New Jersey’s real estate market is
optimistic for 2015.
New Jersey Vacancy Rates
24%
22%
20%
18%
16%
14%
12%
10%
8%
Office
6%
Overall office vacancy dipped to 21.4% in the third quarter
of 2014 from 21.9% at year-end 2013. The downward trend is
a direct result of owners and investors throughout the state
repositioning assets by repurposing antiquated suburban office
buildings for alternative uses (medical, educational, etc.) or
upgrading existing office buildings with capital investments for
base building and/or common-area improvements.
2%
Office space occupancy is expected to increase by approximately
500,000 sf during 2015, in line with the 10-year average for
absorption. Fueling this absorption are companies continuing
to capitalize on tax and corporate incentives offered by the state
government and rising costs in New York City. New construction
consists solely of build-to-suit, preleased buildings for companies
looking to relocate from older assets, seeking tax incentives or
consolidating multiple locations.
Retail
Given the state’s lower unemployment and proximity to New
York City, the retail sector continues to expand. Continued
growth and strong activity in 2014 have brought investment sales
volume for retail properties nearly back to pre-recession levels.
Redevelopment of downtown areas and big-box-anchored strip
malls continues to be a common trend throughout the state.
Industrial
The industrial market enjoyed another strong year in 2014 with
approximately 6.4 msf of net absorption, which continued to help
stabilize the market. This significant absorption was up from a
four-year annual average of 2.8 msf in 2013. The vacancy rate was
11.9% as of the third quarter of 2014, down from 12.1% at the
end of 2013.
The New Jersey Turnpike/I-95 corridor, in which nearly all of
New Jersey’s new industrial construction is located, maintains
its importance as a distribution hub for the megalopolis of
42
Avison Young 2015 Forecast
4%
0%
2013
2014
Office
2015F
Industrial
the Northeast U.S. However, with 2.5 msf under construction,
certain submarkets may soon be oversupplied. Notwithstanding
the current robust construction cycle, industrial buildings
and industrial portfolio sales remain the most sought-after
component of the state’s real estate market.
Investment
Office building sales increased tremendously in 2014 with
$1.3 billion in transactions in the first half alone. Sellers and
buyers continued to take advantage of favorable financing
and historically low cap rates. With low pricing providing
opportunities for new owners, office buildings are being leased
up and resold, contributing to investment activity in the sector.
Industrial investments continue to be a primary focus for
institutional investors, which often results in bidding wars
(especially for newer assets that will retain their value). Owners
are often approached off market, as demand from investors and
owner/users is high.
Retail and office sales were the only two sectors to record an
increase in investment dollar volume in 2014, with cap rates for
both increasing slightly. With the fall in fuel prices, consumer
spending is expected to increase in 2015 and, in turn, stimulate
the retail real estate sector.
New York
1 World Trade Center
New York market running on all cylinders
N
ew York City’s economic surge continues to swell. The
U.S. Department of Labor reports that private-sector
employment in New York City grew by 105,400 jobs, or 3.1%,
to 3,515,200 for the 12-month rolling period ending August
2014. The city’s unemployment rate fell to 7.3% in August
2014, down 50 bps from July and 150 bps year-over-year.
Office
In Midtown, the class A vacancy rate improved to 10.8% in
the third quarter of 2014, a 100-bps decrease year-over-year.
Moderate leasing activity throughout the summer months
helped to decrease the vacancy rate. The Midtown average
class A asking rent was $80.13 psf in late 2014, its highest
recorded level since year-end 2008, when asking rents topped
$85.55 psf. Plaza continues to be the priciest submarket within
Midtown – and the entire New York market – at $133.58 psf.
The Midtown South market experienced the proverbial hot
summer, with overall vacancy tightening to 7.4% as of fall
2014, from 9.8% a year earlier. Led by the tech, advertising,
media and information (TAMI) sector, the largest lease was by
online review site Yelp for 152,200 sf at 11 Madison Avenue. At
225 Varick Street, website builder Squarespace also signed a
lease for 100,000 sf. Midtown South class A asking rents closed
the third quarter of 2014 at $78.07 psf, a 10% increase from
one year earlier.
The pendulum continued to swing in Downtown’s favor as
the market continued to emerge as the hottest in Manhattan.
The overall Downtown vacancy rate dipped 390 bps during
2014 to 10.9%. The class A vacancy rate, at 11.7% as of the
third quarter of 2014, was the lowest since the start of 2013.
The value-play attraction of Downtown class A space stood at
$53.50 psf, with the World Trade Center submarket asking $67
psf.
New York Vacancy Rates
24%
22%
20%
18%
16%
14%
12%
10%
8%
6%
4%
2%
0%
2013
2014
2015F
Office
Manhattan’s West Side. Also, Saks Fifth Avenue announced it
will open another 85,000-sf store at Brookfield Place, while
a 55,000-sf Saks Off 5th outlet will open Downtown at One
Liberty Plaza. Asking rental rents continue to rise with Fifth
Avenue representing the highest in the market.
Investment
Throughout 2014, results on a submarket basis provided
insight into the shifting tides in the Manhattan market.
Across all asset classes, Midtown West remains the sales
volume leader over the past five years – a trend that has
been consistent through the real estate market recovery.
With a 28.6% share of sales volume as of third-quarter 2014,
Midtown West’s share fell below 30% for the first time since
2008. Conversely, the steadily upward-trending Downtown
submarket finished at a 27.1% share, up from a 5% share only a
handful of years ago.
Through the first three quarters of 2014, a total of 41 leases of
100,000 sf or more were completed, compared with only 30 a
year earlier. Eleven of these deals involved properties larger
than 200,000 sf.
Retail
The Manhattan retail market’s progress is illustrated by the
number of large commitments made by several department
stores. Luxury brand Neiman Marcus agreed to open a
250,000-sf store at the future Shops at the Hudson Yards on
Avison Young 2015 Forecast
43
Oakland
Cherry Logistics Center
Migration to East Bay expands job growth
T
he East Bay/Oakland market experienced considerable job
growth during the first nine months of 2014. According to
State of California statistics, Alameda County gained 14,000
jobs, ending the third quarter of 2014 with an unemployment
rate of 5.7%. By comparison, the rate was 11.7% in August 2010.
A big reason for the drop is the migration of companies either
relocating or expanding to the East Bay from San Francisco and
Silicon Valley due to considerably lower rents.
Oakland Vacancy Rates
24%
22%
20%
18%
16%
14%
12%
10%
8%
Office
6%
The East Bay/Oakland office market is well-positioned
geographically to take advantage of record-high rents in its
neighboring markets. A lot of the recent growth in this market
has come from San Francisco tenants looking for less expensive
ways of doing business. As of the third quarter of 2014, the
average East Bay/Oakland asking rent was $2.08 psf full service 57% lower than that of San Francisco.
2%
Oakland’s CBD has witnessed the most activity in this market
since the beginning of 2013 from tenants wanting to relocate
from San Francisco. More than 100,000 sf of tenants from San
Francisco have migrated to the Oakland CBD, and a handful of
expanding tech tenants from San Francisco have shown interest
in calling Oakland home in the near future. They would be joining
tech companies Pandora Media Inc., Ask.com and Visual Supply
Company, among others.
Retail
Retail vacancy stood at 4.8% in the East Bay/Oakland market in
the third quarter of 2014. Vacancy has decreased steadily since
2010, when it stood at 7.3%, while average asking rates have
increased steadily during the past 24 months. New development
projects are fetching anywhere between $45 and $60 psf. With
more than 250,000 sf of new retail development underway and
another 150,000 sf expected to break ground in 2015, rental rates
are expected to continue to increase.
Industrial
The industrial market has recorded more than 4 msf of occupancy
growth since the beginning of 2010. Overton Moore’s The
Crossings at I-880, a 700,000-sf speculative development in
Fremont that broke ground in 2014, preleased 85% of the
project to Apple Inc., Living Spaces and Pivot Interiors. By the
end of 2015, more than 1.6 msf of new industrial product will be
delivered to the market. Of that, 65% is already preleased.
44
Avison Young 2015 Forecast
4%
0%
2013
2014
Office
2015F
Industrial
Investment
Investment activity remained high in 2014 for industrial product
as investors sought to deploy large amounts of capital in the East
Bay/Oakland market. Due to the area’s lack of available inventory
and limited vacant land for development opportunities, cap rates
continued to compress.
The most significant investment transaction in 2014 was Met Life
Realty Group’s acquisition of the 575,000-sf distribution center at
Cherry Logistics Center in Newark, which is leased to Amazon.com. This transaction marked the lowest cap rate
(4.3%) achieved in the Northern California marketplace in more
than a decade. Moving into 2015, industrial investors will find
it challenging to place large sums of capital into a market with
limited available options.
Orange County
Impac Center
Steady growth continues amid consistent demand
O
range County’s robust economic recovery is supported by
ongoing demand for commercial real estate across all sectors.
This thriving hub for financial services, information technology,
logistics and healthcare has continued to attract a talented
workforce. The region’s ideal geography and bustling tourism trade
contribute to a high quality of life.
Orange County boasts one of the lowest unemployment rates in
the state, at 5.1% as of September 2014. The draw of employment
is translating to increased population and rapidly increasing
demand for space. Vacancy is falling steadily as rents continue to
climb, triggering much-anticipated development. Developers have
been cautious since the recession; however, construction activity is
expected to accelerate during 2015.
Office
Economic growth and improving employment rates, combined
with strong vacancy and subsequently elevating rents, are fueling
leasing activity. Increasingly specific office space requirements will
ensure healthy movement into 2015. Construction is seeing an
increase in demand for flexible and mixed-use designs that cater to
the needs of the evolving modern office worker. Increased demand
for medical office space is another dynamic component of the
county’s leasing activity.
Vacancy rates have been trending down year-over-year since
2010, settling at 11.2% in late 2014. This trajectory is expected
to continue through 2015 as rents keep rising. Total net positive
absorption for 2014 reached 650,000 sf in late 2014, and 2015
should see little variance from this level. Timing is ideal for
higher-end renovations in advance of expected increases in newconstruction activity.
Retail
The diverse demands of a growing population are keeping retail
investments attractive. Consumer demand is shifting from goods
to services, and this trend is creating vendor movement without
hindering demand for space. Vacancy has been declining since
mid-2010, dipping below 5% at year-end 2014. A further decline in
vacancy is anticipated in 2015, but will likely not reach pre-recession
levels of 3%.
Orange County Vacancy Rates
24%
22%
20%
18%
16%
14%
12%
10%
8%
6%
4%
2%
0%
2013
2014
Office
2015F
Industrial
Industrial
Orange County remains one of the tightest industrial markets in
the U.S., placing local quality space at even more of a premium.
Consistent demand for limited product is propelling rents upward
while vacancy tightens. Construction, aerospace and distribution
firms continue to drive demand, especially for buildings exceeding
100,000 sf.
These drivers are, in turn, heightening demand for new distribution
warehouses. In the meantime, many older industrial buildings are
being converted to residential, creative office and self-storage uses
to meet demand. Development picked up in 2014, and increased
construction activity is anticipated for 2015. However, demand
continues to outweigh development potential, and the valuation
of existing inventory is set to continue to rise.
Investment
Orange County’s economic strengths are translating to heightened
property values. Investors are rallying around every product type
with exceptional attention being paid to abundant high-value
assets in the region. The U.S. Federal Reserve is expected to raise
interest rates minimally by the second half of 2015, but cap rates
are expected to remain compressed. Trading volume is expected
to gain traction during 2015 due to commercial real estate’s
continuing appeal.
Orange County is the sixth-most populous county in the U.S. and the
largest of the 100 wealthiest counties. Retailers are highly motivated
to maintain a presence here and are driving the positive absorption
and escalating rents that are still emerging post-recession.
Avison Young 2015 Forecast
45
Philadelphia
Comcast Innovation and Technology Center
Market optimism, falling vacancy set stage for strong 2015
P
hiladelphia, the East Coast’s second-largest city, has
historically outperformed others in recessions and
underperformed in periods of growth. As the economic recovery
continues to strengthen, the region expects continued slow
growth in employment. Unemployment declined to 7.1% as
of September 2014, down from 9.9% one year prior. Current
development does not match the rapid pace of growth between
1997 and 2008; nevertheless, steady expansion and optimism
characterize the market’s ongoing recovery.
Office
Philadelphia’s office market consists of almost 220 msf. Class
A office space comprises 59.3% of the region’s inventory. CBD
and non-CBD markets posted vacancy rates of 9.4% and 9.5%,
respectively, as of the third quarter of 2014. The Main Line, West
Chester, Outer Chester County and Lancaster County all reported
vacancies in the 5% to 7.5% range.
The redevelopment of existing product in Philadelphia’s
established suburbs and CBD is expected in 2015. Philadelphia’s
vacancy rates, typically well below the U.S. average, are expected
to finish 2015 around 11.2%.
Nearly 340 acres in Philadelphia are designated for the
development of innovation centers separately belonging to the
University of Pennsylvania, Drexel University and the Philadelphia
Industrial Development Corporation. These campuses will
function as powerful research centers and business incubators.
In October 2014, Comcast broke ground on the Innovation and
Technology Center, a 1.3-msf tower, while Brandywine Realty
Trust commenced construction in May on the FMC Tower, an
861,000-sf multi-purpose building.
Retail
At the conclusion of the third quarter of 2014, Philadelphia’s
retail vacancy dipped marginally to 5.9% with only 673,000 sf
vacant in the market, and rental rates averaging $13.96 psf. The
biggest lease signings of 2014 included a 70,700-sf deal signed
by Burlington Coat Factory, a 50,000-sf lease by Hobby Lobby and
42,000 sf leased by Movie Tavern. One of the largest transactions
of 2014 was the sale of the South Mall, a 405,200-sf retail
center, for $23.6 million. With nearly 400,000 sf currently under
construction, the retail market is expected to deliver consistent
numbers in 2015.
46
Avison Young 2015 Forecast
Philadelphia Vacancy Rates
24%
22%
20%
18%
16%
14%
12%
10%
8%
6%
4%
2%
0%
2013
2014
Office
2015F
Industrial
Industrial
Philadelphia’s industrial market continues to surge as Eastern
Pennsylvania emerges as a major industrial hub within the
Northeast. The market, comprising 512 msf, reported a vacancy
rate of 7.1% in late 2014, similar to the national average.
The Philadelphia metropolitan area currently has 20 industrial
buildings under construction (comprising 10 msf ), which
marks the highest level of speculative development since 2006.
With downward-trending vacancy rates across the board,
Philadelphia’s new construction, leasing and sales are expected to
continue their upswings in 2015.
Investment
Single-property office investment sales grew along with the
average price per square foot. Office sales comprised the largest
transactions of 2014, with the three biggest purchases averaging
$147 million. The mean cap rate for office investments is 9.5%,
remaining higher than the U.S. average. It is anticipated that cap
rates in the Philadelphia region will fluctuate between 8% and 9%
through 2018. The purchase and redevelopment of class A and B
buildings in areas accessible to public transit is expected to play a
large role in the transactional activity of 2015.
Pittsburgh
Proposed U.S. Steel Office
Promising business climate places a focus on the future
B
ased on its history, Pittsburgh is widely recognized as a resilient
city - a reputation that is paying dividends. The ability to
withstand economic fluctuations is a reflection of the region’s
resolute financial services, healthcare and educational sectors. In
recent years, these industries have been the region’s core strength,
keeping vacancy and unemployment rates low, but emerging
business opportunities continue to gain momentum.
Pittsburgh’s focus on future expansion is a by-product of promising
growth in the region’s technology and energy industries. As large
corporations continue to set up regional operations, the local
market will work to accommodate increased demand in 2015.
Pittsburgh Vacancy Rates
24%
22%
20%
18%
16%
14%
12%
10%
8%
6%
4%
2%
0%
2013
Office
The Pittsburgh region’s tight office market provides limited
opportunities for tenants searching for quality space, with class A
vacancy sitting at 7.9% at the end of 2014. As availability remained
restricted for the seventh consecutive year, the onus was placed
on developers to get new product out of the ground. More than 3
msf of office space is proposed or under construction as a result of
increasing demand in the CBD and Greater Downtown area.
Market conditions continue to favor landlords; however, as more
product becomes available, a shift could occur, giving leverage
back to tenants. The recent growth in rental rates (in excess of $3
psf since 2008) appears to be stabilizing with new development on
the horizon.
Retail
The retail market continues to enjoy occupancy rates in the mid90% range in spite of highly inflated triple-net costs. Absorption
is strong as major tenants such as Whole Foods, Target, Dick’s
Sporting Goods, GetGo, Speedway and multiple restaurant
concepts seek new market expansion opportunities. Car
dealerships are also expanding – a sign of the increasing consumer
demand and confidence of Pittsburgh residents.
Retail construction is the strongest in the Cranberry (North) and
South Strabane (South) submarkets, but new product is also
available in the South Hills Village Area, McCandless Crossing
and Southpointe. Moving into 2015, the retail market will likely
continue to flourish along with the economy.
2014
Office
2015F
Industrial
Industrial
The region’s industrial vacancy rate continues to decline as user
activity remains stable. However, new construction is limited. The
region’s largest lease transaction of 2014 occurred in Crafton, PA,
where Amazon.com committed to 320,300 sf. Notable demand
produced by oilfield companies involved in the Marcellus and Utica
Shale plays occurred, but suitable product is very limited for users
seeking long-term arrangements for large spaces.
Factors affecting the industrial market moving forward are Shell’s
proposed multi-billion-dollar ethane cracker plant and GE’s plans to
construct a 125,000-sf facility related to advanced manufacturing
and process improvement.
Investment
The Pittsburgh market is gaining recognition among national and
even international investors. Low vacancy rates and reduced cap
rates benefitted owners as properties were marketed and sold for
historically high prices. Medical and hospital-related developments,
as well as seniors housing, continue to hit the market. With the
second-oldest population in the country, Western Pennsylvania has
been recognized by investors and developers as fertile ground for
new senior-oriented product.
Out-of-town interest has been directed toward lodging and multiresidential conversions in the Greater Downtown area in response
to the millennial demand for urban housing. As the Pittsburgh
region’s energy and technology sectors continue to develop,
investment numbers are expected to increase further during 2015.
Avison Young 2015 Forecast
47
Raleigh-Durham
Citrix Headquarters
Investment volume expected to remain strong
T
he Triangle region witnessed significant improvement across
all sectors in 2014. Strong job growth fueled increased tenant
demand which drove vacancy to pre-recessionary levels for all
product types. Exceptional quality of life and low cost of doing
business are fueling robust population and economic growth.
With three research universities and a significant concentration
of technology and R&D companies, the Triangle is recognized as
having one of the nation’s most educated work forces.
Raleigh-Durham Vacancy Rates
24%
22%
20%
18%
16%
14%
12%
10%
8%
Office
6%
Office absorption surged in 2014, reaching its highest level since
2008 as class A properties witnessed the strongest demand. While
construction activity has increased, tenants will continue to face
limited near-term class A options. Class A asking rates increased
by nearly 4% in 2014. Increasingly constrained supply, combined
with higher-priced new construction, will bend the cost curve
sharply upward in 2015.
2%
The largest transaction of 2014 occurred in the Research Triangle
Park (RTP) submarket, where Lenovo leased 460,000 sf of former
Sony Ericsson space. The CBDs were also epicenters of activity.
Vacancy in Downtown Raleigh fell below 8.5%, while vacancy in
Downtown Durham dropped below 5%. Citrix became the most
recent tech company to plant a stake in Downtown Raleigh,
moving into its 170,000-sf, build-to-suit facility.
Retail
Retail vacancy fell below 7% for the first time since 2008 as
retailers continued to flock to the rapidly growing Triangle
market. The local grocery scene was a significant source of
activity. Publix entered the market with its first location in Cary,
while Harris Teeter opened additional stores and completed
its merger with Kroger. Lowe’s Foods announced one Triangle
closure, while specialty grocers Whole Foods and Fresh Market
announced new stores. Field & Stream opened its first Triangle
store in Cary, Gander Mountain backfilled a former Best Buy in
North Raleigh and Golf Galaxy opened its third regional location
in Cary. Moderate construction activity is not expected to
negatively impact vacancy in 2015.
Industrial
The industrial market witnessed its fourth consecutive year of
positive absorption in 2014 with activity coming from a broad
base of tenants. The sector is benefitting from a resurgent
housing market, a growing e-commerce sector and expanded
48
Avison Young 2015 Forecast
4%
0%
2013
2014
Office
2015F
Industrial
manufacturing activity. Industrial asking rates grew by more than
7% year-over-year.
At last, low vacancy and strengthening rental rates are spurring
speculative development. Projects totaling 161,000 sf were
delivered in 2014 with most of the space leased upon completion.
Liberty Property Trust announced plans for a new warehouse
development that will add up to 462,000 sf to the RTP submarket.
More projects, both speculative and build-to-suit, are likely to
break ground in 2015 as the market makes up for a decade of
limited development activity.
Investment
Capital continued to pour into the Triangle in 2014 as investors
maintained a voracious appetite for multi-residential properties.
Sales of office and industrial properties also increased notably.
Given the relatively low levels of construction, investors recognize
that there is a window of opportunity to acquire office and
industrial assets at prices below replacement cost while rental
rates are rising.
Investment volume should remain strong in 2015. Multiresidential sales are expected to become less dominant as
demand increases for office and industrial properties.
Reno
The Riverfront Building
The future is jobs for Northern Nevada
N
orthern Nevada is positioned for a boom. After fierce
competition with three states, Tesla Motors chose the region
for its new manufacturing plant. The Gigafactory will encompass
more than 5 msf and generate more than 6,500 jobs. The
entrance of Tesla and other employers will generate billions of
dollars during the next 10 years.
Lease rates are expected to escalate in 2015. During the past five
years, a lack of new construction has intensified demand in the
market for all commercial property types. Industrial product is
most in demand with companies seeking to relocate and take
advantage of the region’s favorable tax structure.
Office
The office market struggled in 2014. Occupancy rates should
rise substantially in 2015 due to the lack of new construction.
Several new tenants entered the market, but many larger tenants
vacated space. Occupancy and lease rates edged up in several
submarkets, including the CBD and the Meadowood area. In
addition, the end of 2014 saw a significant increase in office sale
and lease inquiries.
Retail
The retail market continues to show positive signs. New tenants
are entering the marketplace, and the area recorded positive
absorption in 2014. The retail vacancy rate ended 2013 at
17.3% and declined 40 bps by the end of 2014. Rental rates
remain unchanged at an average of $16.20 psf. Retailers are
relocating their businesses to locations with superior exposure at
comparable rental rates.
Notable market entrants include: Hobby Lobby, Floor & Décor,
Natural Grocers, Cheesecake Factory, Dunkin’ Donuts, Starbucks
and Nordstrom Rack. National retailers are returning, and other
openings are planned as the market outlook remains optimistic.
Industrial
Reno’s industrial market continued to gain momentum in 2014,
but it was Tesla’s announcement that fully energized the sector.
It also gained from the Federal Aviation Administration naming
Nevada as one of six sites for commercial development of
unmanned aerial vehicles (UAVs). The Economic Development
Authority of Western Nevada and the Nevada Governor’s Office
of Economic Development have been flooded with calls. Ashima
Devices committed to bring its headquarters - with 400
research, testing and manufacturing jobs - to the area. Cenntro
Reno Vacancy Rates
24%
22%
20%
18%
16%
14%
12%
10%
8%
6%
4%
2%
0%
2013
2014
Office
2015F
Industrial
Motor Company will manufacture electric delivery vehicles and
scooters.
Within two years, Cenntro will complete a 250,000-sf
manufacturing facility, employing 300 workers and housing its
North American headquarters. A large number of businesses
are starting, relocating and expanding in industries including
e-commerce, logistics, manufacturing, mining, technology, data
centers and R&D. In 2014, more than 2 msf was built for Amazon.com, Zulily and San Mar. Reno will add millions of square
feet with these industries committed to new construction.
Investment
Commercial real estate investment interest continues to grow as
product remains scarce after the supply of bank-owned property
dissipated. Prices rose amidst low availability and strong demand,
particularly in the case of acquisitions and dispositions eligible for
1031 Exchange tax deferrals.
Demand is expected to increase in 2015 (and rise dramatically in
following years) as vacancy rates diminish in the retail and office
sectors. Multi-residential occupancy remains high. This asset class
continues to hold the most interest to investors. Rental rates rose
to support new construction in anticipation of an apartment
development boom expected to continue through 2015.
Avison Young 2015 Forecast
49
Sacramento
Sacramento Kings Development (rendering)
New Kings arena sparks rebirth of Downtown demand
W
ith the NBA’s Sacramento Kings’ new arena opening in fall
2016, the downtown district is preparing for a rebirth. The
new arena has created a tremendous amount of buzz within the
community and resulted in new office and retail tenant activity in
the downtown area. Kings owner Vivek Ranadivé, a Silicon Valley
tech entrepreneur, plans to develop up to 475,000 sf of office
space adjacent to the arena along with 350,000 sf of retail, a 250room hotel and 550 residential units.
The challenge for the entire Sacramento Valley moving into
2015 is a lack of new sources of employment to feed the
local economy. With the exception of the state government
and healthcare companies, the valley lacks major corporate
headquarters.
Sacramento VacancyRates
Rates
SacramentoVacancy
24%
22%
20%
18%
16%
14%
12%
10%
8%
6%
4%
2%
0%
2013
2014
Office
2015F
Industrial
Office
Industrial
In the third quarter of 2014, the office market experienced
year-over-year negative absorption. Despite a slight setback, the
market has witnessed almost 2.2 msf of occupancy growth since
the beginning of 2012, bringing vacancy back to pre-recession
levels (13.9%) at third-quarter 2014.
The industrial market recorded positive absorption in each of
the first three quarters of 2014, experiencing almost 2.1 msf of
occupancy growth. Average asking rates have slipped during the
past 24 months despite strong leasing activity, and ended the
third quarter of 2014 at $4.08 psf triple net. The market has shown
no signs of a slowdown in 2015. Average asking rates will increase
minimally throughout the year as vacancy continues to decline.
The Roseville/Rocklin submarket has been the most desirable
location for businesses in this region during the past couple of
years. As a result, occupancy has grown during 13 of the last 14
quarters, and vacancy declined to 15.1% at the end of the third
quarter of 2014. Roseville/Rocklin has evolved as the region’s
most upscale submarket during the past 20 years, resulting in
higher-than-average absorption during boom years and lower
vacancies in recessionary ones. Businesses have chosen this
area for its great lifestyle and affordable housing. In 2015, the
excitement of the new Kings arena is expected to bring renewed
interest from tenants in Downtown Sacramento as well.
Retail
Retail vacancy has declined steadily since 2012 while average
asking rates have stayed relatively flat during the same period.
Deal activity slowed in 2014 compared with the previous two
years despite a healthy amount of demand. Roseville/Rocklin,
the strongest office market in the valley, was also the bestperforming retail market in 2014 due to its healthy income
demographics. The overall Sacramento Valley retail market is
expected to remain relatively flat throughout 2015.
50
Avison Young 2015 Forecast
Investment
The excitement of the new Kings arena has not only renewed
interest in Downtown Sacramento from users, but also investors.
A group led by local investment group Buzz Oates Properties
purchased 555 Capitol Mall, a 376,000-sf office building adjacent
to the new arena project, with ground-floor retail. The owners
plan to renovate 555 Capitol with a focus on first-floor retail in
anticipation of increased foot traffic and greater tenant activity in
the area. Investors are expected to continue this trend in 2015.
San Diego County
La Jolla Commons Tower II
Steady and sustainable demand continues
S
an Diego’s commercial real estate market pushed ahead
in 2014, exhibiting year-over-year growth in rents and
steadily declining vacancy. The county is known for its
desirable geography and remains a vital hub for biotechnology,
telecommunications, defense and tourism, which have all
contributed to the resilience of the market since the Great
Recession.
Population growth and improving employment rates help
drive the market, which continues to see an increase in leasing
activity. Unemployment stayed low through 2014 (reaching
5.9%) and is anticipated to remain stable through 2015.
Expected hiring in the county’s bustling technology sector will
sustain economic progress.
Office
Employment is driving the office market. There is demand for
creative and flexible space as businesses strive to use space
more efficiently while providing improved lifestyle amenities.
Technology companies, healthcare innovators and independent
research institutes are at the forefront of the growth. San Diego
is a leader in supplying employees for these companies.
Vacancy rates are declining after a two-year stall, and rents
have been rising quarter-over-quarter on a trajectory that
should hold through 2015. More than 1 msf of new inventory is
expected to come on line by the end of 2015. A slow increase in
construction activity is anticipated in 2015 as demand continues
to outpace existing supply.
Retail
Population growth has a strong influence on retail activity, and
leasing is recovering at a modest pace. Demand for retail space
is ongoing in San Diego County, the fifth-most-populous county
in the U.S. As general consumer demand remains reserved and
shifts toward service-oriented retail, expect to see an increase
in medical- and health-related vendors located in shopping
centers.
Approaching the end of 2014, vacancy sat just below 4% mirroring pre-recession levels. In 2015, vacancy is expected to
reach mid-3%, which is closer to historical rates for the area.
Delivery volume remains flat as developers remain cautious.
Renovations are more likely than a surge in new construction in
this well-established market.
San Diego County Vacancy Rates
24%
22%
20%
18%
16%
14%
12%
10%
8%
6%
4%
2%
0%
2013
2014
Office
2015F
Industrial
Industrial
San Diego’s established industrial base supports the military,
biotechnology and telecommunications sectors. Rents have
been trending upward quarter-over-quarter relative to a
decrease in vacancy. Total net absorption remained positive
throughout 2014, and the trend should continue in 2015.
Tightening vacancy and increasing rents are sparking interest in
development thanks to an uptick in property values. Persistent
demand, generated by e-commerce activity, has reduced
retail space needs while increasing demand for warehousing.
Further industrial demand should be fueled by continued GDP
growth. Industrial sale pricing is currently below peak levels and
expected to rise as construction picks up in 2015.
Investment
Secondary investment markets like San Diego are becoming
more popular as investors look beyond larger metropolitan
markets for more resilient, high-value assets. Investors are
making the pricing for these assets more competitive – and
more expensive – as low returns on alternative investments free
up capital to seek better yields in commercial real estate. With
interest rates low, cap rates will remain compressed. Even with
new inventory, demand will outpace supply in this historically
tight market. Commercial real estate in the county is expected
to experience improved values in 2015 as current trends
continue.
Avison Young 2015 Forecast
51
San Francisco
Salesforce Tower
Investors to benefit from strong user demand
S
an Francisco continues to be a hub for technology and
innovation by drawing companies from all over the world
to its vibrant business climate and talented workforce. As of
the third quarter of 2014, the city’s unemployment rate was
4.4%, down a full percentage point from 2013. With almost 20
office tenants in the market for more than 100,000 sf, and with
retail and industrial vacancy extremely low, San Francisco is
expected to remain lively throughout 2015.
San Francisco Vacancy Rates
24%
22%
20%
18%
16%
14%
12%
10%
8%
Office
6%
The San Francisco office market remains extremely vibrant
with increasing demand and diminishing available space.
Vacancy has dropped 130 bps since the end of 2013 and 220
bps year-over-year to 6% at third-quarter 2014. Class A rents
have increased by 12% since year-end 2013, ending the third
quarter of 2014 at $60 psf.
2%
Preleasing became a common practice in 2014 with nearly
62% of the total 3.6 msf currently under construction already
leased. Salesforce recorded the largest lease transaction of
the year, preleasing 714,000 sf at Salesforce Tower. Given the
consistently high demand, developers have been driven to
pursue and obtain more than 3.9 msf of entitlements during
the past 24 months from the City of San Francisco. This has
brought Prop M, a municipal cap on office development,
into effect. Pending projects totaling 3.3 msf are on file with
the city, which has only 3 msf left to approve under Prop M
through October 2015.
Retail
The retail market is still hot – vacancy looks to remain below
3% as no new retail developments are expected in 2015.
Union Square remains the retail hotspot in San Francisco and
is benefitting from being the hub of international tourism. In
Mission Bay, the NBA’s Golden State Warriors’ new arena and
the hundreds of residential units under development will
invigorate the area’s retail market.
Industrial
San Francisco is synonymous with innovation and high-quality
products, so companies want “Made in San Francisco” on their
products to attract consumers. Though companies are willing
to pay a premium, many simply cannot produce on a large
enough scale to stay in the city. Anchor Steam Brewery, a San
Francisco staple since 1896, is one of the exceptions. In the
52
Avison Young 2015 Forecast
4%
0%
2013
2014
Office
2015F
Industrial
last quarter of 2014, the well-known brewer broke ground
on its new 212,000-sf Pier 48 facility as part of the Mission
Rock mixed-use development next to AT&T Park. Smaller
manufacturers will continue to flood the market – despite
increasing rental rates – in order to take advantage of local
branding.
Investment
During the first three quarters of 2014, investment activity was
nearly double the full-year 2013 total. By third-quarter 2014,
investment volume reached nearly $4 billion compared with
$2.4 billion for all of 2013.
With full-year stats still being compiled, 2014 was on pace
to be the second-highest investment year in San Francisco
since 2007. The South Financial District remained a hot spot
for investment activity as three of the top five investment
transactions of 2014 were located in the area. Investors will
remain active throughout 2015 and take advantage of rising
rental rates and extremely high demand from local and
regional users.
San Mateo
Pacific Shores Center
Developers become active again in San Mateo County
F
or the first time in more than a decade in San Mateo County,
a major speculative office development has been preleased.
Crossing/900, a 334,000-sf, two-building office project located
in Downtown Redwood City, preleased the entire project in the
third quarter of 2014 to cloud-storage company Box Inc., which
will relocate from Silicon Valley.
Since the first quarter of 2011, the county office market has
recorded more than 2.3 msf of occupancy growth, bringing
the overall vacancy rate down to 8.9% at the close of the third
quarter of 2014. The office market also recorded 14 consecutive
quarters of increasing average asking rates, ending the third
quarter at $43.32 psf full-service.
San Mateo Vacancy Rates
24%
22%
20%
18%
16%
14%
12%
10%
8%
6%
4%
2%
0%
2013
Office
The San Mateo County office market experienced more than
560,000 sf of occupancy growth during the first three quarters
of 2014. This market also witnessed a 4% increase in average
asking rates during the same time period. The office sector
is experiencing the most demand since 2007. As of the third
quarter of 2014, Avison Young was tracking 17 companies in
and around San Mateo County seeking space in excess of 25,000
sf within the next 24 months.
Almost 500,000 sf of proposed new Downtown office projects
were submitted by developers to the Redwood City planning
department for approval in the third quarter of 2014. With the
recent success of the aforementioned Crossing/900 project and
Redwood City’s vibrant downtown atmosphere and proximity
to public transportation, developers accelerated efforts to get
schematics in front of city planners, including the 180,000-sf
office development by Lane Partners at 2075 Broadway that was
pending approval as of the third quarter of 2014.
In the city of San Mateo, two major speculative office projects
broke ground in late 2014: Concar Office Park, a 300,000-sf,
three-building office project, and the first phase (210,000 sf ) of
the 763,000-sf Bay Meadows office development.
2014
Office
2015F
Industrial
Industrial
The San Mateo County industrial market experienced a slight
setback in 2014. This market recorded slightly more than
100,000 sf of occupancy losses through the third quarter of the
year. Despite the slight loss in occupancy, average asking rates
continued to increase due to the limited amount of available
options.
Investment
During the first nine months of 2014, San Mateo County
witnessed more than $5 billion worth of investment activity –
compared with less than $4 billion in all of 2013. Office trades
accounted for 82% of all investment activity, highlighted by
the $206-million sale of Parkside Towers in Foster City. Google
purchased 934,000 sf from Starwood Capital and Blackstone
Group at Pacific Shores Center in Redwood City during the last
quarter of 2014. Investors are expected to remain active in 2015
as vacancy continues to decrease and average asking rates
continue to rise steadily.
Retail
Retail vacancy remained extremely low in 2014. Due to strict
development policies in San Mateo County, developers have
not been active in this market, resulting in a lack of available
options for retailers. Demand is expected to remain strong in
2015 with rental rates climbing throughout the year due to
limited availability in the market.
Avison Young 2015 Forecast
53
South Florida
(Miami, Fort Lauderdale, Palm Beach)
CityPlace Tower
Industrial market gathers momentum
C
ommercial real estate market fundamentals in South
Florida, comprising Miami, Fort Lauderdale and Palm Beach,
continue to strengthen as the economy improves and there is
a tapered supply flowing into the market. As unemployment
decreases, the overall market will see modest gains as vacancy
declines, absorption improves and planned development
continues to increase. Together, these factors helped market
fundamentals progress in 2014 beyond those recorded in 2013.
The market is anticipated to post even better results in 2015.
Office
A limited amount of new supply, coupled with improving
employment figures, led the office market’s enhanced
performance. The overall office vacancy rate ended the third
quarter of 2014 at 14.4%, down 110 bps from year-end 2013. As
the economy steadily improves, the urban cores of Miami and
Fort Lauderdale are experiencing tighter market conditions with
the overflow of demand stretching into suburban areas where
class A buildings are registering higher occupancy levels.
Forecasts for year-end 2015 are optimistic in the office market
as vacancy rates are slated to continue improving. Vacancy is
expected to fall to 12.7% by the end of 2015 and demonstrate
the improving fundamentals of the asset class.
Retail
The retail sector experienced positive net absorption in 2014 as
demand remained high and new supply was limited. Appetite
for retail space in 2014 grew slightly as, at the end of the third
quarter, the vacancy rate remained at 5.3%. Third-quarter 2014
was stellar in the retail investment sector as dollar volume more
than doubled in comparison with one year earlier, increasing
to $1.3 billion from $541 million. Even with improving sales,
however, the year-end 2014 average price per square foot was
expected to fall below the year-end 2013 level.
Forecasts for year-end 2015 remain optimistic as vacancy rates
are expected to continue improving and a limited supply of new
product is slated to hit the retail market.
Industrial
The surge in demand for industrial space in the tri-county area
has led to even tighter market conditions. Even with more
than 2 msf of industrial product delivered during the first
three quarters of 2014, the sector still experienced positive net
absorption, as demonstrated by an improving vacancy rate.
54
Avison Young 2015 Forecast
South Florida Vacancy Rates
24%
22%
20%
18%
16%
14%
12%
10%
8%
6%
4%
2%
0%
2013
2014
Office
2015F
Industrial
From year-end 2013 to third-quarter 2014, vacancy decreased
by 50 bps to 7.1%.
The industrial market is expected to see ongoing advances in
2015, as there should be continued demand for industrial space.
Delivery of another 2 msf in 2015 is expected, with vacancy
dipping to 5.9% at year-end 2015 from 7.1% at the end of the
third quarter of 2014 - a 120-bps decline.
Investment
Investment activity across all sectors remained steady in
2014 and was heavily influenced by the multi-residential and
hospitality sectors. The constrained delivery of new supply in
the office and industrial sectors is expected to continue to push
down vacancy rates in those asset classes during 2015. Among
all sectors, cap rates have been compressed and, in some
instances, have dipped below previous lows. Cap rates in 2015
will be further compressed as fundamentals continue to see
improvement.
The projections for 2015 are optimistic; however, a slowing of
the economy could potentially lead to diminished consumer
confidence which exerts downward pressure on investment
activity.
Tampa
Tampa City Center
Occupancy improves across all sectors
C
ommercial real estate market fundamentals in Tampa
have been fluctuating even as the economy shows slight
improvement. Unemployment has been declining steadily, but
the tightening of the market seems to be aligned with a lack
of new supply coming online and upticks in the demand for
additional space. The outlook for 2015 remains positive as the
forecast anticipates enhanced market conditions.
Tampa Vacancy Rates
24%
22%
20%
18%
16%
14%
12%
10%
Office
8%
Constrained supply levels have allowed the office market
to experience positive net absorption. The overall office
vacancy rate at the end of the third quarter of 2014 was 13.9%,
dropping 70 bps from year-end 2013. In the meantime, office
sales improved between third-quarter 2013 and third-quarter
2014, climbing to $476 million – a 7% increase from the
previous year.
4%
Forecasts for 2015 remain positive for the office sector as
vacancy is anticipated to continue on its downward trend.
Vacancy is slated to fall 260 bps, landing at 11.3% by year-end
2015.
Retail
Tampa’s retail market continues to see occupancy improve as
vacancy rates maintain a slow and steady descent. Demand for
retail space in 2014 maintained an upward trajectory. During
the third quarter of 2014, the vacancy rate decreased by 20
bps and settled at 6.4%. However, retail property sales volume
took a hit during the third quarter of 2014 as pricing on a persquare-foot basis remained on a downward trend. After hitting
a recent peak of more than $150 psf in the fourth quarter of
2013, prices fell below $130 psf.
The outlook for 2015 continues to be optimistic as a further
tightening of the market, coupled with a limited supply of new
deliveries, should push occupancy and pricing higher than
what was achieved in 2014.
Industrial
6%
2%
0%
2013
2014
Office
2015F
Industrial
compared with third-quarter 2013 as dollar volume reached
$25 million. Sales pricing on a per-square-foot basis increased
dramatically after falling to levels not seen in more than three
years. Prices in 2014 averaged $54 psf, after dropping to $35
psf at year-end 2013.
Forecasts for 2015 remain bullish on the industrial sector and
anticipate improved conditions. Estimates for Tampa’s overall
industrial sector in 2015 anticipate vacancy falling to 8%, a
decrease of 90 bps from the third quarter of 2014.
Investment
During 2014, Tampa experienced varying types of investment
activity. Some sectors (most notably office and industrial)
saw improvements, while others witnessed flat or declining
activity. All sectors had limited new product delivered, which
assisted in the improvement of overall market fundamentals.
The outlook for 2015 remains optimistic as new construction is
anticipated to remain at low levels – a situation which, in turn,
should continue to push down vacancy and capitalization
rates and has the potential to increase rental rates during
2015.
Even with 3 msf of industrial space being delivered during the
first three quarters of 2014, the market is still experiencing
enough demand that Tampa recorded positive net absorption
during the same period. Vacancy fell more than a full
percentage point from the end of 2013 to third-quarter 2014 landing at 8.9%, which was 120 bps below year-end 2013. The
third quarter of 2014 saw heightened levels of industrial sales
Avison Young 2015 Forecast
55
Washington, DC
3100 Clarendon Boulevard
Record sales pricing buoys optimism going forward
T
he Capital Region has demonstrated job creation, strong retail
sales and a robust multi-residential market. Washington’s 5.4%
unemployment rate compares favorably with the U.S. national
average (5.8%). The threats of sequestration have subsided and,
with a budget in place, there is some optimism that the federal
government will resume leasing in 2015. The region saw growth
in data center demand and development as well as warehouse
occupancy, a strong multi-residential market, record sales pricing
and an appreciable increase in foreign capital flows in 2014.
Office
Washington’s nearly 400-msf office market felt the effects of
oversupply in 2014 with most markets experiencing vacancy
increases. DC’s vacancy rose to double digits (10%) and Northern
Virginia’s reached its highest level in 10 years (18%). The efficiency
game continued and reduced space utilization for all tenant
types more than offset any gains in office-using employment.
Buildings that are new, environmentally friendly and have access
to Metrorail and housing are outperforming the market. Leases
were dominated by renewals, often in advance of expiries, and
by tenants upgrading while taking less space. Lease concessions
remain elevated and transactions are taking longer to finalize.
Overall, leasing volume was below historical levels in 2014.
Oversupply is likely to carry through 2015 with another 2 msf to
be delivered. Anticipated move-outs, such as ExxonMobil leaving
more than 1 msf in Northern Virginia, will keep vacancy elevated.
Retail
Live/work/play environments, town centers, and restaurant and
specialty foods define retail growth in the region. Transit-oriented
development is prominent and projects, such as Pike & Rose in
Montgomery County, MD, are successfully attracting retailers.
In Virginia, the completion of Metrorail’s Silver Line into Tysons
Corner has generated an influx of new consumers.
Elsewhere in Virginia, the 1.4-msf Springfield Town Center reopened in October 2014 after a two-year renovation, and the
once-tired 1970s-era mall is now thriving. The second phase
of the Silver Line’s extension to Dulles International Airport is
underway and will bring further retail growth when completed in
2018.
Industrial
The industrial market fared well in 2014 thanks to positive annual
absorption and rental rates achieving a slow but steady upward
56
Avison Young 2015 Forecast
Washington,
DC
Vacancy
Rates
Washington,
DC
Vacancy
Rates
24%
22%
20%
18%
16%
14%
12%
10%
8%
6%
4%
2%
0%
2013
2014
Office
2015F
Industrial
trajectory. Construction volume has doubled year-over-year
and will likely push vacancy higher by year-end 2015. Growing
e-commerce, data centers and a New Panamax-enabled Port
of Baltimore have, thus far, kept occupancy rates high. Threats
of overbuilding are limited due to land constraints in the most
desirable locations. Submarkets that are expected to attract new
investment include Springfield, Newington and technology hubs
in Loudoun County. The largest transaction in 2014 (prior to
publication) was Amazon.com’s 200,000-sf new data center lease
in the Dulles Corridor.
Investment
With the passing of a federal budget and job creation on the rise,
regional investment activity has been revitalized. Acquisitions
by international investors have risen significantly since 2011;
however, market watchers have reported Washington’s fall in
investor survey rankings, and this situation is evidenced by
overall lower transaction volume in 2014.
Nonetheless, well-located, stabilized assets in and around the
nation’s capital continue to attract strong investor interest.
In 2014, PNC Place was sold to TIAA-CREF and Norges Bank
Investment Management for $1,075 psf, marking the first time
any DC office building has broken the $1,000-psf threshold. This
record psf price is an indication of investor interest in the DC
market for select trophy-class properties. Outside the Beltway,
counter-cyclical investors are pursuing suburban offices as cap
rates have risen.
London, U.K.
Walkie Talkie, 20 Fenchurch Street
Strong growth expected until 2019
L
ondon’s position as a “world city” has insulated it from the
poor economic environment in continental Europe. London’s
economy was expected to grow by 4.2% in 2014, slowing down
to 3.4% in 2015. It is expected to expand by a further 15% over
the next five years to 2019. The challenge for London, therefore,
is how to manage this growth both now and in the future.
Office
In 2014, London recorded its highest level of office leasing
activity since 2007. The main submarkets all saw take-up levels
in excess of long-term averages. Across the main user groups,
demand is being driven by growth rather than consolidation,
with technology, media and telecommunications the most
active sectors.
With the absence of completed space, occupiers are signing
preleasing agreements. It is estimated that half the space
currently under construction has been preleased. Looking
further out to 2016 and using long-term average take-up as a
benchmark, only half the required supply of new space is likely
to be constructed. Rents rose by 7% in 2014. Continued, and
even stronger, rental growth is expected throughout 2015. As
a result, many occupiers will have to review what jobs must be
London-based or could be moved to cheaper locations.
Retail
London’s prominence as a major tourist destination and the
expected increase in visitors from China and the Persian
Gulf, due to the relaxation of visa requirements, will support
consumer spending and maintain retailer demand for space.
Central London continues to experience a chronic shortage of
flagship stock on the prime pitches of Bond Street and Oxford
Street. Although prime retail rents are now around £1,250 psf
per annum, this level is still lower than those in New York, Hong
Kong and Paris.
Retailers are also increasingly expanding into office space above
their existing stores to add space without drastically increasing
their rent. Salvatore Ferragamo (Bond Street) and Nicole Farhi
(Conduit Street), among others, have taken this approach.
London Vacancy Rates
24%
22%
20%
18%
16%
14%
12%
10%
8%
6%
4%
2%
0%
2013
2014
Office
2015F
Industrial
to the new market conditions. DP World Gateway is reworking
its master plan for a 9.3-msf logistics park east of London. The
plan is being revised to create a cluster of “small” (80,000-sf to
200,000-sf ) buildings that can be delivered quickly on a designbuild basis.
Into 2015, the trend of preleasing distribution facilities will
likely continue. In the smaller size ranges, tenant inducements
will likely continue to shrink as rents increase and, significantly,
lease terms move back in favour of landlords.
Investment
Domestic and overseas investor demand remained high in 2014.
Both groups have been attracted by the rental growth seen
across all of London’s office submarkets. At the end of 2014,
the preferred bidder for the Gherkin building (516,000 sf ) was a
Brazilian investor group. The £710-million bid reflected an initial
yield of 3.8% - a low yield for such a large lot size.
Looking forward into 2015, investor demand is expected to
remain strong, and continued headline-grabbing acquisitions
of trophy assets are also expected. Away from the headlines,
there will likely be steady growth in investor interest in the U.K.’s
regional markets.
Industrial
Overall, industrial demand has been steady, and the level
of take-up for 2014 was similar to that of 2013. There will be
falling supply but, with relatively low levels of speculative
development, rents are likely to rise. Developers are adapting
Avison Young 2015 Forecast
57
Our Contacts
Canadian Research
Bill Argeropoulos, Principal
Practice Leader, Research (Canada)
416.673.4029
[email protected]
Canadian Offices
U.S. Research
Margaret Donkerbrook
Vice-President, U.S. Research
202.644.8677
[email protected]
Regina
2550 - 12th Avenue
Suite 300
Regina, SK S4P 3X1
T 306.359.9799
Chicago (Suburban)
9700 West Higgins Road
Suite 500
Rosemont, IL 60018
T 847.881.2045
Calgary
585 - 8th Avenue SW
Suite 1200
Calgary, AB T2P 1G1
T 403.262.3082
Toronto
(Property Management)
60 Adelaide Street East
Suite 900, Mailbox #15
Toronto, ON M5C 3E4
T 416.343.0078
Cleveland
600 Superior Avenue East
Suite 910
Cleveland, Ohio 44114
T 216.609.0303
Edmonton
Suite 2800, Bell Tower
10104 - 103 Avenue NW
Edmonton, AB T5J 0H8
T 780.428.7850
Toronto North
600 Cochrane Drive
Suite 220
Markham, ON L3R 5K3
T 905.474.1155
Guelph (SW Ontario)
299 Brock Road South
Building A
Guelph, ON N1H 6H9
T 226.366.9090
Vancouver
2100-1055 West Georgia Street
Box 11109, Royal Centre
Vancouver, BC V6E 3P3
T 604.687.7331
Halifax
1657 Bedford Row
Suite 1
Halifax, NS B3J 1T1
T 902.454.6185
Winnipeg
330 Portage Avenue
Suite 1000
Winnipeg, MB R3C 0C4
T 204.947.2242
Toronto (HQ)
18 York Street
Suite 400, Mailbox #4
Toronto, ON M5J 2T8
T 416.955.0000
Lethbridge
515 7th Street South
Suite 300
Lethbridge, AB T1J 2G8
T 403.330.3338
Mississauga
77 City Centre Drive
Suite 301
Mississauga, ON L5B 1M5
T 905.712.2100
Montreal
2000 McGill College Avenue
Suite 1950
Montreal, QC H3A 3H3
T 514.940.5330
Ottawa
155 Queen Street
Suite 1301
Ottawa, ON K1P 6L1
T 613.567.2680
Quebec City
C.P. 69 succ.
Haute-ville, QC G1R 4M8
T 418.694.3330
58
U.S. Offices
Atlanta
30 Ivan Allen Jr. Boulevard, NW
Suite 900
Atlanta, GA 30308-3035
T 404.865.3663
Austin
515 Congress Street
Suite 1500
Austin, TX 78701
T 512.474.2411
Boston
200 State Street
7th Floor
Boston, MA 02109
T 617.250.7600
Charlotte
440 South Church Street
Suite 530
Charlotte, NC 28202
T 704.531.5550
Chicago (Downtown)
One South Wacker Drive
Suite 3000
Chicago, IL 60606
T 312.957.7600
Avison Young 2015 Forecast
Los Angeles
(Santa Monica)
301 Arizona Avenue
Suite 303
Santa Monica, CA 90401
T 310.899.1800
Los Angeles (North)
6711 Forest Lawn Drive
Los Angeles, CA 90068
T 323.851.6666
Columbus, OH
88 East Broad Street
Suite 1740
Columbus, Ohio 43215
T 614.840.0700
Los Angeles (West)
10940 Wilshire Boulevard
Suite 2100
Los Angeles, CA 90024
T 424.265.9200
Dallas
5910 North Central Expressway
Suite 800
Dallas, TX 75206
T 214.559.3900
New Jersey
1120 Headquarters Plaza
West Tower, 4th Floor
Morristown, NJ 07960
T 973.898.6360
Denver
1900 16th Street
Suite 1300
Denver, CO 80202
T 720.508.8100
New York
623 Fifth Avenue
22nd Floor
New York, NY 10022
T 212.729.7140
Detroit
T 313.510.2825
Oakland
300 Lakeside Drive
Kaiser Center, Suite 1975
Oakland, CA 94612
T 510.254.4255
Fairfield/Westchester
MerrittView
383 Main Avenue
6th Floor
Norwalk, CT 06851
T 203.614.1260
Houston
2800 Post Oak Boulevard
Suite 1950
Houston, TX 77056
T 713.993.7700
Las Vegas
3993 Howard Hughes Parkway
Suite 350
Las Vegas, NV 89169
T 702.472.7979
Long Island
68 South Service Road
Suite 100
Melville, NY 11747
T 516.962.5400
Los Angeles
(Downtown)
555 S. Flower Street
Suite 3200
Los Angeles, CA 90071
T 213.935.7430
Orange County (Irvine)
2030 Main Street
Suite 150
Irvine, CA 92614
T 949.757.1190
Orlando
255 S. Orange Avenue Suite
1545
Orlando, FL 32801
T 407.219.3500
Philadelphia
One Tower Bridge
100 Front Street
Suite 1275
West Conshohocken, PA
19428
T 610.276.1080
Pittsburgh
20 Stanwix Street
Suite 401
Pittsburgh, PA 15222
T 412.944.2130
Corporate Communications & Media
Sherry Quan, Principal
National Director of Communications & Media Relations
604.647.5098
[email protected]
Raleigh-Durham
1511 Sunday Drive
Suite 200
Raleigh, NC 27607
T 919.785.3434
Raleigh-Durham
(Chapel Hill)
100 Europa Drive
Suite 190
Chapel Hill, NC 27517
T 919.968.4017
Reno
6151 Lakeside Drive
Suite 1000
Reno, NV 89511
T 775.332.2800
Sacramento
980 9th Street
Suite 350
Sacramento, CA 95814
T 916.426.3773
San Diego County
4225 Executive Square
Suite 600
San Diego, CA 92037
T 858.201.7070
San Francisco
601 California Street
Fifth Floor
San Francisco, CA 94108
T 415.322.5050
San Mateo
950 Tower Lane
Suite 120
Foster City, CA 94404
T 650.425.6420
South Carolina
(Charleston)
550 Long Point Road
Mt. Pleasant, SC 29464
T 843.725.7200
South Carolina
(Columbia)
1233 Washington Street
Suite 625
Columbia, SC 29201
T 803.298.3010
South Carolina
(Greenville)
300 East Coffee Street
Grenville, SC 29601
T 864.334.4145
South Florida (Boca
Raton)
1875 NW Corporate Boulevard
Suite 280
Boca Raton, FL 33431
T 954.903.1800
South Florida (Fort Lauderdale)
500 West Cypress Creek Road
Suite 350
Fort Lauderdale, FL 33309
T 954.903.1800
South Florida (Miami)
95 Merrick Way
Suite 380
Coral Gables, FL 33134
T 305.446.0011
South Florida (West Palm Beach)
250 South Australian Avenue
Suite 1100
West Palm Beach, FL 33401
T 561.721.7000
Suburban Maryland
100 Lakeforest Boulevard
Suite 500
Gaithersburg, MD 20877
T 301.948.9870
Tampa
1715 N.Westshore Boulevard
Suite 130
Tampa, FL 33607
T 813.288.1800
Tysons Corner
8484 Westpark Drive
Suite 150
McLean, VA 22102
T 703.288.2700
Washington, DC
1999 K Street NW
Suite 650
Washington, DC 20006
T 202.644.8700
Europe Offices
Frankfurt
An der Welle 4
60322 Frankfurt am Main
Frankfurt
T +49 (0)69 7593 7233
London, U.K.
19 Margaret Street
London W1W 8RR
T +44 (0)20 7101 0200
Thames Valley, U.K.
Hampden Chase
Little Hampden
Great Missenden HP16 9PT
T +44 (0)1494 540 000
Follow Us
Follow Avison Young on Twitter:
For industry news, press releases and market reports:
www.twitter.com/avisonyoung
For Avison Young listings and deals:
www.twitter.com/AYListingsDeals
Follow Avison Young Bloggers:
http://blog.avisonyoung.com
Follow Avison Young on LinkedIn:
www.linkedin.com/company/avison-youngcommercial-real-estate
Follow Avison Young on YouTube:
www.youtube.com/user/AvisonYoungRE
avisonyoung.com
Avison Young 2015 Forecast
59
avisonyoung.com
© 2015, Avison Young (Canada) Inc.
The information contained herein was obtained from sources which
we deem reliable and, while thought to be correct, is not guaranteed
by Avison Young (Canada) Inc.

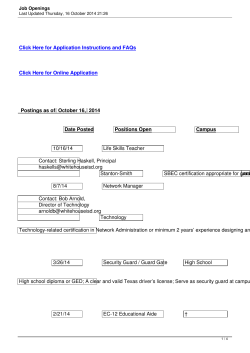

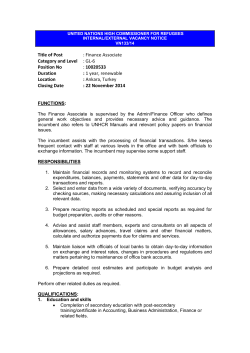
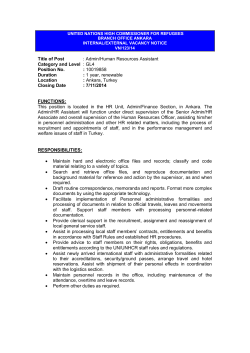


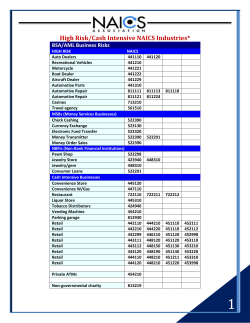
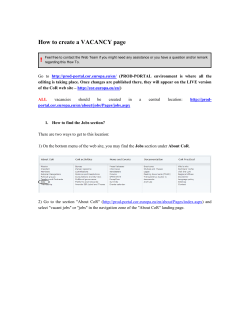

© Copyright 2026