
Nature Index Costa Rica
1112 Nature Index Costa Rica An IPBES pilot project David N. Barton, Grégoire Certain, Sylvia Chaves, José Cuadra Álvaro Herrera, Pål Kvaløy, María Auxiliadora Mora, Signe Nybø Vilma Obando, Bård Pedersen, Jesús Ugalde and Manuel Vargas NINA Publications NINA Report (NINA Rapport) This is a electronic series beginning in 2005, which replaces the earlier series NINA commissioned reports and NINA project reports. This will be NINA’s usual form of reporting completed research, monitoring or review work to clients. In addition, the series will include much of the institute’s other reporting, for example from seminars and conferences, results of internal research and review work and literature studies, etc. NINA report may also be issued in a second language where appropriate. NINA Special Report (NINA Temahefte) As the name suggests, special reports deal with special subjects. Special reports are produced as required and the series ranges widely: from systematic identification keys to information on important problem areas in society. NINA special reports are usually given a popular scientific form with more weight on illustrations than a NINA report. NINA Factsheet (NINA Fakta) Factsheets have as their goal to make NINA’s research results quickly and easily accessible to the general public. The are sent to the press, civil society organisations, nature management at all levels, politicians, and other special interests. Fact sheets give a short presentation of some of our most important research themes. Other publishing In addition to reporting in NINA’s own series, the institute’s employees publish a large proportion of their scientific results in international journals, popular science books and magazines. Nature Index Costa Rica An IPBES pilot project Authors (alphabetical) David N. Barton Grégoire Certain Sylvia Chaves José Cuadra Álvaro Herrera Pål Kvaløy María Auxiliadora Mora Signe Nybø Vilma Obando Bård Pedersen Jesús Ugalde Manuel Vargas Participating organizations: National Biodiversity Institute of Costa Rica (INBio) & Norwegian Institute for Nature Research (NINA) NINA Report 1112 Barton, D.N., G. Certain, S. Chaves, J. Cuadra, A. Herrera, P.Kvaløy, M. A. Mora, S. Nybø, V. Obando, B. Pedersen, J. Ugalde, M. Vargas (2014) Nature Index Costa Rica. An IPBES pilot project- NINA Report 1112. 67 pp. Heredia and Oslo, December, 2014 ISSN: 1504-3312 ISBN: 978-82-426-2733-9 COPYRIGHT © Norwegian Institute for Nature Research The publication may be freely cited where the source is acknowledged AVAILABILITY Open PUBLICATION TYPE Digital document (pdf) EDITION QUALITY CONTROLLED BY Signe Nybø SIGNATURE OF RESPONSIBLE PERSON Research director Erik Framstad (sign.) CLIENT(S) Norwegian Environment Agency, contract no. 13010471 CLIENTS’ CONTACT PERSON(S) Nina Vik COVER PICTURE KEY WORDS Costa Rica Nature Index Biodiversity indicators IPBES NØKKELORD Costa Rica Naturindeks Biodiversitetsindikatorer IPBES CONTACT DETAILS NINA head office Postboks 5685 Sluppen NO-7485 Trondheim Norway Phone: +47 73 80 14 00 NINA Oslo Gaustadalléen 21 NO-0349 Oslo Norway Phone: +47 73 80 14 00 NINA Tromsø Framsenteret NO-9296 Tromsø Norway Phone: +47 77 75 04 00 www.nina.no 2 NINA Lillehammer Fakkelgården NO-2624 Lillehammer Norway Phone: +47 73 80 14 00 NINA Report 1112 NI-CR IN BRIEF The “Nature Index Costa Rica” (NI-CR) has been a one-year pilot project to demonstrate and promote the capacity-building objectives of the Intergovernmental Platform on Biodiversity and Ecosystem Services (IPBES). The National Biodiversity Institute of Costa Rica (INBio) in collaboration with the Norwegian Institute for Nature Research (NINA) have tested the Norwegian Nature Index methodology and IT platform on Costa Rican forest ecosystems, in a collaboration with a number experts from Costa Rican institutions specialized in biodiversity assessments. The NI-CR pilot project has demonstrated the relevance of the Nature Index for IPBES as a platform for international collaboration and mutual capacity-building in biodiversity assessment. shown that the Nature Index methodology and IT-platform are a tool for “gap analysis “in biodiversity monitoring information in support of conservation area management. shown the potential of Nature Index methodology to strengthen sustainability indicators reporting and natural capital accounting in Costa Rica. illustrated the Nature Index platform’s relevance for CBD national data clearinghouse. demonstrated the potential of the Nature Index to coordinate national data and institutions across conservation sectors, in particular the potential to fill gaps in national level biodiversity safeguards reporting of REDD+. Identified a number of limitations, solutions, and opportunities in the current NI methodology which would facilitate scaling up of the pilot project findings to full implementation at national level and improve future transfer of NI to other countries. Example map of Costa Rica showing the values of the index of natural plant cover in hexagonal units of analysis in the period 2005 - 2013 3 NINA Report 1112 NI-CR EN BREVE El “Índice de Naturaleza de Costa Rica” (NI-CR) fue un proyecto piloto de un año para promover y demostrar los objetivos de capacitación del Plataforma Intergubernamental de Biodiversidad y Servicios Ecosistémicos (IPBES). El Instituto Nacional de Biodiversidad (INBio) en colaboración con el Instituto Noruego de Investigación para la Naturaleza (NINA) evaluaron la metodología y plataforma informática del Índice de Naturaleza de Noruega aplicada a ecosistemas forestales de Costa Rica, con participación de un grupo de expertos de instituciones nacionales en Costa Rica especializados en la evaluación de la biodiversidad. . El proyecto piloto NI-CR permitió demostrar: la relevancia del Índice de Naturaleza para IPBES como un marco metodológico para la colaboración y capacitación mutua entre países en evaluación de la biodiversidad. que la metodología y la plataforma informática del NI son herramientas para la identificación de vacíos en el sistema de monitoreo de la biodiversidad para el manejo de áreas de conservación. el potencial del NI para fortalecer los índices de sostenibilidad para el estado de la Nación y la contabilidad del capital natural de Costa Rica. la relevancia de la plataforma informática del NI para el nodo nacional en Costa Rica del Convenio sobre la Diversidad Biológica (CBD). el potencial del NI para coordinar datos e instituciones nacionales trabajando en conservación, en particular para llenar vacíos actuales en informes sobre los salvaguardas de la biodiversidad en REDD+. varias limitaciones, soluciones y oportunidades en la metodología actual de NI que podrían facilitar la ‘implementación a escala’ nacional de los logros del proyecto piloto, así como facilitar la transferencia de la metodología NI a otros países tropicales. Mapa ejemplo de los valores del índice sobre vegetación natural en unidades de análisis hexágonales en Costa Rica durante el período 2005 - 2013 4 NINA Report 1112 KORT OM NI-CR Pilotprosjektet “Nature Index Costa Rica” (NI-CR) har tatt mål av seg å demonstrere kapasitetsutvikling i tråd med målsettingene til Naturpanelet (IPBES). Gjennom det ett-årige pilotprosjektet samarbeidet det Nasjonale biodiversitetsinstituttet i Costa Rica (INBio) og Norsk institutt for naturforskning (NINA) med uttesting av den norske Naturindeks-metoden og ITplatformen i kartlegging av biodiversitetstilstanden i Costa Rica’s skogøkosystem. Pilotprosjektet involverte en rekke eksperter fra ulike nasjonale institusjoner i Costa Rica koordinert av INBio, i en lignende rolle som NINA tidligere har hatt i implementering av Naturindeksen for Norge.. NI-CR prosjektet har vist relevansen av Natuindeksen for IPBES som et metode-rammeverk for internasjonalt samarbeid og gjensidig kapasistetsoppbygging demonstrert at Naturindeksmetodologien og IT-platformen fungerer som verktøy for gapanalyse i biodiversitetsovervåkning og som del av forvaltning av verneområder. vist at Naturindeksen styrker rapportering av bærekraftsindikatorer og naturkapitalregnskap i Costa Rica illustrert hvordan Naturindeksens IT-platform kan kompletere nasjonale data ‘clearinghouse’ som del av CBDs rapportering avdekket svakheter i nasjonal rapportering demonstrert hvordan Naturindeks-metodologien kan koordinere nasjonale data og institusjoner på tvers av miljø-sektorer, og potensialet for å fylle gap i rapportering om sikring av biodiversitet i REDD+ identifisert en rekke begrensninger, løsninger og muligheter ved Naturindeksmetodologien som kan bidra til oppskalering av pilotprosjektet på nasjonalt nivå og til overføring av metoden til andre tropiske land. Eksempelkart med indeks for naturlig vegetasjonsdekke i heksagonale analyseenheter for hele Costa Rica i perioden 2005 - 2013 5 NINA Report 1112 Contents NI-CR IN BRIEF ........................................................................................................................... 3 NI-CR EN BREVE ........................................................................................................................ 4 KORT OM NI-CR.......................................................................................................................... 5 Contents ......................................................................................................................................6 Acknowledgement ...................................................................................................................... 7 1 Introduction ............................................................................................................................ 8 2 Background ............................................................................................................................ 9 3 Capacity-building at INBio and in Costa Rica ..................................................................10 4 Strengthening science-policy interface in Costa Rica .................................................... 15 5 Transferability lessons .......................................................................................................17 6 Proposal for future work - NI-CR follow-up ......................................................................21 7 Conclusions ......................................................................................................................... 24 8 Recommendations .............................................................................................................. 33 9 Acronyms ............................................................................................................................. 36 10 Appendix 1: Activity Report ............................................................................................. 38 11 Appendix 2: NI-CR Results and indicator examples ....................................................... 43 12 Appendix 3 – Overview of Norwegian Nature Index Methodology ................................ 64 6 NINA Report 1112 Acknowledgement We thankfully acknowledge the funding from the Norwegian Environment Agency contract no. 13010471 which made the pilot project possible. The findings in the report are the responsibility of the authors and do not necessarily represent those of the Norwegian Environment Agency. INBio and NINA would like to thank the researchers and their institutions who contributed to construction of the indicators that were tested in the pilot study: - Costa Rican Bird Observatory (CRBO). - National System of Conservation Areas (SINAC) - Organization for Tropical Studies (OTS) - La Selva Biological Station - Panthera - Tropical Science Center (TSC) - University of Costa Rica (UCR) - School of Biology Without the time offered by these experts the demonstration of the Nature Index in Costa Rica would not have been possible. One woman and three men participated from NINA while 9 women and 14 men participated from Costa Rica side from the aforementioned institutions. Corresponding authors’ contact details: M.A. Mora [email protected] D.N. Barton [email protected] 7 NINA Report 1112 1 Introduction In 2012 The Norwegian Institute for Nature Research (NINA) and the National Biodiversity Institute of Costa Rica (INBio) proposed a pilot testing of the Norwegian Nature Index methodology in Costa Rica. The “Nature Index Costa Rica” (NI-CR) was born as a demonstration activity to test and promote IPBES capacity-building objectives using a consistent methodological framework for biodiversity assessment. NINA and INBio were awarded a contract for a pilot implementation in 2014. The pilot project shows that the know-how and the technology for a state-of-the-art indicator system developed in Norway can be implemented in a mega-diverse tropical country such as Costa Rica. The NI-CR pilot project demonstrates how a consistent methodology provides support to the national effort toward the Costa Rican Biodiversity Information System (CRBio), aiming at providing integrated free and open access to Costa Rican biodiversity information and its conservation, in order to support science, education, and management of natural resources. Part of the pilot objective was also to evaluate the institutional capacities needed to implement the expert-networking model based on voluntary contributions by national experts that had been developed in Norway. How would it work in the different economic reality of biodiversity researchers in Costa Rica? How could it complement efforts already under way in CRBio? In the pilot project NINA and INBio have tested the reliability and policy relevance of a Nature Index for Costa Rican conservation. This report discusses how environmental authorities can use an indicator system for national evaluation of the state of biodiversity information for policy-support. The pilot project has focused on forest ecosystems. The project has been implemented in parallel with the Norwegian Embassy financed “REDD+” project, demonstrating a methodology for evaluating the co-benefits of REDD+ to biodiversity at a national scale. The REDD+ project is a collaboration between INBio, CATIE and the Trondheim biodiversity group. We propose that in a second phase, the Trondheim biodiversity group could work with INBio to extend the collaboration network of experts to (1) further demonstrate the implementation of the NI-CR to reporting on co-benefits of REDD+ in forests, as well as (2) extend the indicator set to other priority ecosystems that present different spatial challenges compared to forests. 8 NINA Report 1112 2 Background The efforts of Costa Rica, which are recognized internationally, are related to the establishment and operation of protected areas, as well as the capacity that has been built to recover a significant proportion of the original forest cover. However, Costa Rican authorities lack national level indicators system of the status of biodiversity. This is also the situation for other countries in the region. Some national efforts leaded by the National System of Conservation Areas (SINAC), aiming to establish an indicator system have been part of initiatives, such as the Socio-ecological Management Units (USEG) and the Terrestrial Ecological Monitoring of Costa Rica’s Protected Areas and Biological Corridors (PROMEC-CR) program. USEG relates to spaces that have similar social, economic and environmental characteristics. The aim of the initiative is to define a multiscale management system with an eco-regional approach, thus allowing the implementation of a conservation mechanism that recognizes the capacity development of all geographic areas. The system currently defines 17 territories as part of its National System of Conservation Areas (SINAC)1. Moreover, PROMEC-CR aims to create one of the tools to support the achievement of national conservation goals, as defined in GRUAS II project2, to make a decisive contribution to the conservation of biodiversity in the country, by generating and applying decision making about management of the national territory, reliable scientific information on the conservation status of biodiversity and its trends. Both initiatives are under implementation, but do not have an information system to support them. Costa Rica is a leading country in forest conservation policy in the context of REDD+, with a complementary system of public protected areas and voluntary forest conservation incentives through payments for ecosystem services for forest conservation and regeneration. PES constitutes the backbone of Costa Rica REDD Readiness strategy3. While it is probably the best documented PES scheme in the world4, its effectiveness has only been evaluated in relation to changes in forest cover, rather than achievement of specific national biodiversity conservation targets established by the GRUAS II conservation strategy. A further national policy aim of the NI-CR methodology could be to allow authorities to evaluate the biodiversity effectiveness of voluntary forest conservation at the level of regional offices of the National Forest Fund (FONAFIFO) administering the PES program. 1 http://www.sinac.go.cr/Paginas/Inicio.aspx http://www.sinac.go.cr/gruas/ 3 http://forestcarbonpartnership.org/costa-rica 2 Porras, I., Barton, D.N., A. Chacón-Cascante, M. Miranda(2013) Learning from 20 years of Payments for Ecosystem Services in Costa Rica. 2013, London: International Institute for Environment and Development. 4 http://pubs.iied.org/16514IIED.html 9 NINA Report 1112 3 Capacity-building at INBio and in Costa Rica The operational objective of the NI-CR pilot was to “implement the IT-platform software and methodology developed for Nature Index Norway for the selected ecosystem and region in Costa Rica, using available biodiversity data, as well as expert based evaluation,” which it achieved during the planned execution period (January December 2014). In addition, other strategic objectives were met: Capacity was developed in Costa Rican institutions to implement the NI methodology in the forest ecosystem. Representatives of the Ministry of Environment, Energy and Seas of Costa Rica (MINAE) were involved in the project implementation through the National System of Conservation Areas (SINAC), identifying with them the benefits of applying this methodology in all the ecosystems of the country to monitor progress in meeting national and international commitments associated with biodiversity conservation (i.e. Aichi Targets). It was shown that the software tools developed by NINA could be adapted to the needs of mega-diverse countries. Possible new uses for existing biodiversity data and expert knowledge at the national level were demonstrated. To further examine the process developed, see Appendix 2, which describes in detail the implementation of the NI methodology in Costa Rica and the results obtained as of the date of this report. The main objective of this section is to gather the project successes, shortcomings and lessons learned for better planning of later project stages, thereby minimizing risks that may face future implementations of the NI approach in other IPBES capacity-building initiatives in other countries. The information presented in this section was compiled during meetings of the NICR implementation team at INBio following three workshops that were held with national experts and the participation of staff from the following institutions: 10 NINA Report 1112 Institution Representative Costa Rican Bird Observatory (CRBO) Isabel Martin Costa Rican Bird Observatory (CRBO) Pablo Elizondo National System of Conservation Areas (SINAC) Gustavo Induni National System of Conservation Areas (SINAC) José Joaquín Calvo National System of Conservation Areas (SINAC) Sonia Lobo National University of Costa Rica (UNA) - Wildlife Management and Conservation Institute (ICOMVIS) Christian Herrera Martínez National University of Costa Rica (UNA) - Wildlife Management and Conservation Institute (ICOMVIS) Yuly Lorena Caicedo National University of Costa Rica (UNA) - School of Biology Iván Sandoval Hernández Norwegian Institute for Nature Research (NINA) Grégoire R. Certain-Hubert Norwegian Institute for Nature Research (NINA) Pal Kvaloy Organization for Tropical Studies (OTS) - La Selva Biological Station Carlos de la Rosa Organization for Tropical Studies (OTS) - La Selva Biological Station Socorro Ávila Panthera Esther Pomareda Panthera Javier Carazo Salazar Tropical Science Center (TSC) Guisselle Monge Arias Tropical Science Center (TSC) Olivier Chassot University of Costa Rica (UCR) Gerardo Ávalos University of Costa Rica (UCR) - School of Biology Gerardo Chaves National Biodiversity Institute (INBio) Álvaro Herrera National Biodiversity Institute (INBio) Ángel Solís National Biodiversity Institute (INBio) Jesús Ugalde National Biodiversity Institute (INBio) Manuel Vargas National Biodiversity Institute (INBio) María Auxiliadora Mora National Biodiversity Institute (INBio) Nelson Zamora National Biodiversity Institute (INBio) Sylvia Chaves National Biodiversity Institute (INBio) Vilma Obando 11 NINA Report 1112 The details of the meetings and workshops held during the project execution are given in Appendix 1. 3.1 Success factors The NINA personnel who accompanied the implementation of the pilot had knowledge and expertise for the implementation of the NI in Norway, which enabled more efficient progress in Costa Rica. The historical relationship that INBio has with a broad group of national specialists with whom it has implemented other projects, facilitated the involvement of these experts in the experience. The interdisciplinary team that executed the project at INBio enabled the effective and efficient implementation of activities. The methodology and technology to implement NI had been developed and tested during the implementation of the NI in Norway and there was documentation about the process that helped expedite the initiation stage in Costa Rica. National experts were willing to contribute their knowledge and expertise to the definition of indicators and evaluation of the pilot project results. 3.2 Lessons learned 3.2.1 Project design process A pilot experience to implement the Norwegian NI technology and methodology requires two factors in particular, in addition to the time for its implementation: 1.) Time to adapt the methodology to the country. Although there was previous experience with the NI in Norway and in Costa Rica with the management of indicators, an adequate understanding of the process should still be provided. 2.) Involvement and oversight of the work with experts. This component requires a coordinated effort and greater supervision, of personnel and institutions, to create a solid network of partners. It is estimated that at least 12 NINA Report 1112 two years are needed to implement a comprehensive pilot project that applies the methodology at the national level in a selected ecosystem. 3.2.2 Project implementation Work with experts For experts involved in the development of indicators, the project was a catalyst that motivated them to use their data and experience in a new way, applying these in a standardized process to assess the status of biodiversity in an ecosystem. It also allowed them to organize their data to be used for other purposes (i.e. other publications). However, to maintain this motivation and involve other experts in the process, incentives must be defined, such as: i) Financial support (i.e. funding for the generation of new data or the processing of existing data); and ii) professional development (i.e. participation in scientific publications associated with NI), among others. The provision of proper credit (to individuals as well as institutions) must be assured on all products generated from the pilot experience (i.e. indicators, data portal, communication portal, publications, among other products). Although the documentation process for indicators is guided by the software and there is a user's manual for the system, documentation should be generated for the creation of indicators aimed at addressing doubts of the experts and the pilot project implementation team, including sections such as: i) frequently asked questions regarding the definition of indicators; ii) the minimum number of indicators per site; iii) assigning weights to the indicators; iv) how to define reference values; v) representative examples of indicators; vi) how to define polygons (requirements); vii) ways in which the index supports national decision-making processes (examples of products generated by user type); and viii) ways to motivate experts to participate, among other aspects. The extrapolation of data or the application of expert criteria by researchers to areas for which there is no primary information is not easily accepted. In this regard the same NI tool provides researchers with opportunities to base temporary decisions on defined indicator values, and to define or prioritize areas of interest or research gaps that should be covered. 13 NINA Report 1112 Software tools The data capture software for the indicators developed by NINA worked well for the implementation of the prototype in Costa Rica. However, a restructuring of the source code is required in order to internationalize it, translate it into Spanish and generate technical documentation so that other programmers can extend the functionality of the system to address national needs without relying on the original programmers. The ability to enter data using digital spreadsheets aided the specialists with the information editing process. Other facilities that would make the process more efficient (i.e. other user roles within the system, duplicating the content of an indicator, etc.) should be evaluated with the users. The scripts for analysis used to calculate the index should be more robust and the data capture mechanism should implement more control during data entry to avoid errors during the analysis (i.e. negative values can cause errors in the scripts for analysis, therefore the data capture interface must control the entry of values to disallow negative values). Project communication An internet site for displaying the NI-CR results must be implemented to generate products aimed at different types of users (i.e. NI-CR display functionality by municipality, functionality for support to protected area management, etc.). This display portal would enable: (i) the presentation of the project at national and regional levels; (ii) motivating the participation of other experts; (iii) different types of users to access products that would support decision-making in their activities; and (iv) improving feedback from the experts during the indicator documentation process. 14 NINA Report 1112 4 Strengthening science-policy interface in Costa Rica The implementation of NI-CR nationwide will facilitate decision-making and policy formulation that is better informed from a scientific point of view, through: The standardized integration of biodiversity monitoring efforts and expert knowledge in order to have better information on trends in the status of national ecosystems. The coordination and prioritization of biodiversity monitoring efforts and sites with the participation of a network of experts, which will help avoid duplication of efforts and allow the development of community capacity for priority matters. The generation of products to suit different types of users that will facilitate the application of the results in decision-making and policy formulation in various sectors (i.e. ministries and local governments). NI-CR in particular will enable the tracking of resolutions of the Comptroller General of the Republic and the mandates and national reports to the various international conventions signed by the country (i.e. the Convention on Biological Diversity). The display and dissemination of the impact of decisions and policies on trends in biodiversity status in different national ecosystems. The fine-tuning of index indicators and results through a feedback process with different types of users of the products. This national initiative would also integrate the efforts of different institutions involved with monitoring and assessing the status of the country’s ecosystems; the institutions mentioned by the experts are listed below: The Terrestrial Ecological Monitoring Program for the Protected Areas and Biological Corridors of Costa Rica (PROMEC-CR). PROMEC-CR is implemented by the National System of Conservation Areas (SINAC) of the Ministry of Environment, Energy and Seas of Costa Rica (MINAE), with the aim of providing information about the human impact on biodiversity conservation and the degree of success for management measures. The Continuous Quality Improvement Evaluation System (SEMEC - SINAC). SEMEC provides Costa Rican citizens and state and private institutions with general statistics about SINAC’s work and a snapshot of the status of state protected areas and wildlife biodiversity. 15 NINA Report 1112 The National Fund for Forestry Financing (FONAFIFO) is part of MINAE and its mission is to identify and mobilize financial resources to contribute to achieving national objectives and policies relating to the management, conservation and sustainable development of ecosystems. FONAFIFO has had a positive impact on promoting the development of the forestry sector, especially through the Payment for Environmental Services Program (PESP) and forest credits granted under conditions suited to the sector. The National Center for Geo- environmental Information (CENIGA) is part of MINAE and its objective is to integrate and disseminate essential information by topic, to support the institution’s decision-making. The Socio-ecological Management Units (USEG). This SINAC project approaches land management in an integrated way in which all areas of the territory (those assigned to productive work, dedicated to biodiversity conservation and those available for infrastructure) are important and have their role. In this case, conservation is seen as an important part of the production process, and therefore, key to human welfare. 16 NINA Report 1112 5 Transferability lessons 5.1 Technical lessons learned for Norway’s Nature Index information system What improvements can be made in the database and interface solutions based on experiences with NI-CR pilot? For this pilot system, we chose to install it in the cloud hosted by Microsoft Azure. The url for this system is http://nicr.azurewebsites.net/. Microsoft Azure is a cloud computing platform and infrastructure, created by Microsoft, for building, deploying and managing applications and services through a global network of Microsoftmanaged datacenters. Among the reasons for choosing this platform are: The legal owner of the system and data is INBio – Costa Rica Access to the system is possible both from Norway and Costa Rica High availability INBio does not have any infrastructure supporting or running Windows servers at the time The Microsoft Azure platform have worked very well for this purpose, and for similar collaborate projects we would recommend doing the same thing. The database was originally developed for Norway, and at the time, no one expected it to be an export article. As a result the table and column names in the database are in Norwegian – e.g. “kommune” instead of “municipality”, “omraade” instead of “area” and so forth. This makes it hard for non-Norwegians to get semantic meaning out of the data because they do not understand intuitively what the tables, columns, and their data represents. The whole database schema should be translated into English to make more sense for computer professionals outside Norway. The user interface (UI) of the current version of the Nature Index is in English. For INBio and Costa Rica there is a desire to have the UI in Spanish as well. There is no support for multiple languages in the current version of the software, and a Spanish version will more or less have to be written from a copy of the current version. At some point, these versions would start to drift apart and would be impossible to maintain from the same source-code. A future version of the Nature Index should implement support for multiple languages, where the language of the UI is fetched from the database. The output website currently under completion - Naturindeks.no - will also have to be made with support for multiple languages if it is to be used outside of Norway. 17 NINA Report 1112 What improvements can be made in routines for calculating the Nature Index? (e.g. in data scarce pilot study settings with less than national coverage) In this pilot study, we calculated trial Nature Index values for Costa Rica based on 11 indicators. For this purpose, we applied R-scripts originally developed for calculating the index from data in the Norwegian NI database. These trial calculations revealed that the original scripts were not robust when applied on a scarce dataset such as the Costa Rican pilot data. The scripts failed when run on data consisting of only one single indicator or when only one indicator was documented in the dataset for some spatial units. A series of modifications were made to the scripts so they could be run without error also under these pilot settings. The process thereby made the scripts more robust with respect to scarce datasets, which is of value for future projects similar to the Costa Rican pilot. The trial runs also revealed that a thorough understanding of both the data base structure and the R-code is necessary to adapt and maintain the NI information system. Thus, transfer of competence and training of personnel in the NI-framework should be emphasized in similar projects and when developing the Costa Rican system further. 5.2 Comparisons with other NI pilot sites What has been notable about Costa Rica NI-CR relative to other NI implementations? Are there generic lessons for NINA coordination of future pilot projects elsewhere? In 2014 there has been a pilot study in Costa Rica and in the Arctic (http://www.caff.is/arctic-nature-index). In 2015 there are applications in Bulgaria, Romania and Lithuania to test the NI and its database. Applications have been sent for EEA grants. Project organisation In the Arctic, the CAFF-secretariat has coordinated the NI-project with support from NINA, while in Costa Rica NINA has had the overall project coordination. INBio has coordinated the work within Costa Rica with respect to organizing meetings, experts and data entry. Both project organizations has worked well. Definition of spatial units of analysis As the geography of the whole northern hemisphere is more complex, there has been quite a lot of time used on the decision and formation of polygons of in the database. Also the implementation of the polygons has been more difficult since we have had to have the pole as the center of the map, not the equator. In the NI- Arctic it is decided to focus on administrative units, except in the ocean where there are 18 NINA Report 1112 areas outside national borders. In the ocean equal sized polygons are preferred. In Costa Rica each polygon is hexagonal. Here this issue was solved quite fast. Timeline In Costa Rica the organization of experts and understanding the framework, discussing details and entering data has been time consuming. Also, in Norway the process of organizing experts, discussing and data entry in the pilot project of 2008 was also completed in one year and a half. The timeline of the Costa Rica pilot projects can be compared to the Norwegian pilot study in 2008. In the NI-CAFF the polygons has only been finalized by December 2014, and the data entry will start in 2015. CAFF plans to start with only a few indicators next year. Expert involvement In CAFF the NI-project has been discussed in the marine group, while Costa Rica has focused on forests. The pilot project in CAFF has gone somewhat slower than in Costa Rica due to lack of finalizing the implementation of polygons in the database. Also the experts are distributed around the Arctic, and experts are therefore difficult to coordinate. CAFF has presented the project at regular meetings, but has not starting the implementation of indicators and datasets. Data availability In Costa Rica most biodiversity data are ad hoc project funded data and not timeseries collected from systematic monitoring. To reveal changes in biodiversity over time, one needs time series/ monitoring. In Costa Rica the work on NI might push the biodiversity society to look into new ways of gathering time-series. In CAFF there are quite a lot of data series as presented in the Arctic Species Index. Often data are gathered with different methods in different areas, but as data are scaled between 0-1 in the NI, this can be solved through this framework. Here the challenge will be to organize the experts to enter data. The experts are responsible for updating and quality assurance of their own data. Thus experts do not lose control of their own data and this should make them more confident of contributing to the NI-database. NI-maps and outputs For Costa Rica and CAFF calculated maps and graphs will be available in reports. In Norway the data behind NI and the overall maps of each ecosystem will be available to the public through the Internet in late 2015. Summary In both pilot areas the hosting institutions (CAFF and INBio) find it interesting to store and handle biodiversity data in the database. It is a way to systematically organize data and stored for the future. One must expect that data entry is quite time- 19 NINA Report 1112 consuming, since these data often only are available in reports and notes of the expert that has gathered them. The NI is considered to be a tool to synthesize and communicate the state and development of biodiversity and the impact of anthropogenic pressures on biodiversity. Currently there are as far as we know, no other databases internationally that store and synthesize time-series of biodiversity data. Marine, freshwater and terrestrial ecosystems may be included. In 2015 the pilot study will continue in CAFF. In Costa Rica the pilot test ends in 2014, but efforts will be made during 2015 to publish experiences in a scientific paper. The role of NI in reporting to CBD and national and/ or regional government will evolve over time. 5.3 Summary of technical recommendations: The Microsoft Azure platform is recommended for other international applications of NI. The whole database schema should be translated into English to make more sense for computer professionals outside Norway. the Nature Index platform must be enabled to support multiple languages, where the language of the UI is fetched from the database. The output website Naturindeks.no will also have to be made with support for multiple languages if it is to be used outside of Norway. Training of personnel in the NI database structure and R-code should be emphasized earlier on other international applications. In a phase II further development of R-code in collaboration with INBio would help in developing the Costa Rican system further. 20 NINA Report 1112 6 Proposal for future work - NI-CR follow-up In a second phase, the work should be able to: i.) Fine-tune the methodology, specifically as related to standardizing ways of defining the reference state of indicators. ii.) Evaluate the results by assigning weights to individual indicators. iii.) Given the limited diversity of data sources in the pilot project, implement more biodiversity data and indicators for forests, including analyzing data from reports, scientific papers and other relevant information for more time series. iv.) Include other major ecosystems. v.) Strengthen the network of experts involved in NI-CR generation and evaluation. vi.) Develop products meant to address the specific needs of different types of users (i.e. decision-makers in ministries, local governments, initiatives that fund research projects, etc.). For example, monitoring of REDD+ co-benefits. Final products must be developed in collaboration with the users who can pinpoint their needs. Included here is the development of capabilities in users for the use of the products generated. vii.) Disseminate project results nationally and regionally. Challenges and proposed solutions: In further evaluation and scaling up of the NI-CR a number technical, organizational, policy and financial challenges would need to be met. In the following we discuss these challenges and outline ways forward. Technical challenges Involving more experts in the process of defining indicators and maintaining their commitment over time to participate regularly in campaigns to update the indicators. -Proposed solutions: Establish a sustainable incentive mechanism with the experts, such as financial incentives (i.e. funding for the generation of new data or the processing of existing data); professional development (i.e. participation in scientific publications associated with the NI, organizing symposia to present the work and the results of the index), among other ideas. Generate baseline documentation that would support standardizing the process to define reference values for indicators (i.e. historical information from reference sites). 21 NINA Report 1112 -Proposed solutions: With the experts, define the type of information required, assess whether it exists, process the information and make it available to the experts. The extrapolation of data or the application of expert criteria by researchers for areas where there is no primary information is not easily accepted. -Proposed solutions: With the experts, develop a standardized methodology for the extrapolation of values for indicators and include a statistician on the project implementation team. Difficulty for local programmer in modifying NI source code in ‘Norwegian’ to adapt it to local conditions. - Proposed solutions: With NINA analysts/programmers, evaluate and execute the restructuring and documentation for the software. Translate source code into English and generate technical documentation so that other programmers can extend the functionality of the system to address national needs without relying on the original programmers. Implement a visualization site for NI-CR results that will generate products meant for different types of users (i.e. NI-CR visualization functionality by municipality, functionality to support protected area management, etc.). - Proposed solutions: Analyze the needs of priority visualization portal users, evaluate and adapt the NI-CR implementation methodology to ensure that it meets user requirements and implement the portal. Explore collaborative agreements to take advantage of technologies of other portals for biodiversity information such as the Norwegian Biodiversity Information Centre (NBIC)(citizens science portals) and Global Forest Watch (forest monitoring portal). Generation of end-user products should be carried out only when NICR partners are confident that there are sufficient indicators in to represent the ecosystem in question. Generating new data through periodic campaigns that provide access to information for the period to be evaluated. -Proposed solutions: In cooperation with national institutions (UCR, OTS, MNCR, INBio), define and implement a monitoring methodology that makes use of society’s efforts to generate new data with scientist-backed quality controls (i.e. citizen science projects, park ranger training, private reserve initiatives, etc.). Prioritize specific monitoring projects for priority groups to fill information gaps. 22 NINA Report 1112 Organizational NI-CR should be a collaborative effort involving public and private institutions that generates the data necessary for its implementation and in turn requires results to support its decisions and policymaking. - Proposed solutions: In the second phase of NI-CR implementation, involve institutions that participated in the implementation of the pilot experience, and include a wider network of indicator experts within each institution. Policy Convert NI-CR into a national initiative that integrates the monitoring efforts done by government institutions and uses the results in making national decisions (a legal structure is needed or the NI would become integrated into some national monitoring effort such as the Information System for Biodiversity Management (SIGBI) proposed by the Comptroller General of the Republic). - Proposed solutions: Exert a stronger influence on SINAC to become involved in the planning and implementation of the second phase of the project to assess the best implementation strategy. Financial Financial support is needed to ensure the sustainability of the initiative. - Proposed solution: Secure the commitment of government institutions and non-governmental organization to fund the initiative (i.e. funding monitoring processes to fill information gaps, support digital data entry and data debugging processes, support the development of the necessary technology, support capacity-building processes). In addition, access international funding sources. 23 NINA Report 1112 7 Conclusions 7.1 National policy relevance 7.1.1 NI-CR is a tool for “gap analysis “of biodiversity monitoring information NI provides a consistent framework for evaluating biodiversity information availability and gaps for: i.) the presentation of national and international reports; ii.) decision making, and iii.) the definition of policies for biodiversity conservation. During the implementation of the pilot project, it was clearly established that for a second project implementation phase, there is no current monitoring data that represents all the hexagons and ecosystems of the country. A standardized methodology must therefore be defined for the extrapolation of data or the application of expert criteria by researchers for areas where there is no primary information (this must be one of the first activities for the implementation of a second phase of the project). NI-CR will allow the visualization of existing information gaps and planning investment in national monitoring processes. Costa Rica does not have many researchers working continuously on monitoring, therefore existing data have been generated opportunistically, funded by individual projects. NI-CR is seen as an opportunity to address information gaps and define priority areas and biological groups on which to focus research. The work on NI-CR has therefore highlighted the need for long time series of biodiversity data to be able to assess trends of biodiversity. The NI-methodology identifies where and what monitoring data are needed. 7.1.2 NI-CR will strengthen sustainability indicators reporting and ecosystem accounting - State of the Nation annual reports (CONARE) The State of the Nation Program is an initiative of four public universities that is executed by the National Council of Rectors (CONARE). For over 20 years it has produced an annual report on the national situation, biological-environmental as well as socioeconomic. Its seriousness is recognized and it is a source of information for the media, NGOs, and public and private sectors. Its results are cited as a reliable source in varied fields and especially during presidential and mayoral election periods. It is the only recognized integrated information source that exists on the state of the nation. 24 NINA Report 1112 The “harmony with nature” chapter is dedicated to analyzing the country’s environmental challenges, progress and challenges for each year, based on indicators established over two decades. In this chapter, specifically on the subject of conservation and biodiversity, the status of biodiversity is described (including the status of species and ecosystems), thus it is appreciated that NI-CR would contribute significantly to this section. The 2013 report released in October 2014, reports on the NI-CR initiative (http: //www.estadonacion.or). - National Development Plan of the Ministry of National Planning and Economic Policy (MIDEPLAN) and Ministry of the Environment, Energy and Seas of Costa Rica (MINAE) The Ministry of National Planning and Economic Policy (MIDEPLAN) is responsible for preparing the National Development Plan that every president elect defines as his/her work plan for their four years of government. It is prepared with contributions from each ministry. In this regard, if the NI-CR could be implemented in the framework of a national biodiversity monitoring system led by MINAE, the Planning Ministry would have standardized inputs agreed by the national scientific community to prepare the National Development Plan. 7.1.3 Conservation area gap analysis and management - the NI-CR pilot uncovers a lack of biodiversity information systems The country has different information platforms, some of which are already in operation; others are in the design process while others are in the planning stage. One of these platforms is the National Center for Geo- environmental Information (CENIGA), which in turn manages several nodes, such as SIA and BDG. CENIGA is in the initial implementation stage and it has a biodiversity node that would eventually be connected to the Information System for Biodiversity Management (SIGBI). See Figure 1. 25 NINA Report 1112 Figure 1. Regional initiatives in the context of the CCAD and others existing in the country. Prepared by Gustavo Induni, SINAC. August 2013. In: SINAC, 20145. Abbreviations in the Figure: SIAM Mesoamerican Environmental Information System (CCAD) SINIA National Environmental Information System (country node) SIA Environmental Indicators System (Costa Rica – CENIGA) BDG Geographic Database (Costa Rica – CENIGA) CHM Clearing-House Mechanism of the Convention on Biological Diversity SIGBI Information System for Biodiversity Management SIB Biodiversity Indicators System of Costa Rica In 2013, the Comptroller General of the Republic, in its report on SINAC’s management of biodiversity, recommended the creation of SIGBI, which should be implemented in the medium term (approximately two years from 2014). Therefore, it is envisioned that NI-CR could provide integrated information on the status of ecosys- SINAC (National System of Conservation Areas). 2014. Estrategia Nacional de Investigación del SINAC 2014 – 2024, ENI 2014-2024. Costa Rica. 131 p. 5 26 NINA Report 1112 tems to SIGBI as well as the SINAC Digital system, data that in turn would be linked with the observatories of the national universities. It is important to note that SIGBI would be closely related to the Biodiversity Indicators System (SIB) of SINAC’s Ecological Monitoring Program and to the Terrestrial Ecological Monitoring Program for Protected Areas and Biological Corridors of Costa Rica (PROMEC-CR), already formalized and in development. On the other hand, the national initiative called Costa Rican Biodiversity Information System (CRBio), formed by several national institutions, growing and active since 2006, is expected to be a kind of “National Biodiversity Atlas”, where the results of research promoted by SINAC and PROMEC will contribute information and similarly, NI-CR could strengthen this platform. Another potential use of NI-CR would provide information on the status of ecosystems for processes such as GRUAS, a territorial land management system for biodiversity that is headed by SINAC (in 2014, its third update was initiated). In parallel, in the domestic realm, SINAC has an accountability system for management and effectiveness, called SEMEC. NI-CR could provide local information that could be used as an indicator by conservation areas. In summary, a number of partially overlapping biodiversity monitoring and clearinghouse initiatives are in progress initiated by the public and private sector (SIGBI, CRBio, SEMEC) – the NI-CR has potential as a common methodological framework for integrating information across these initiatives particularly aimed at informing conservation planning (GRUAS and REDD+). 7.1.4 REDD+ implementation - NI-CR pilot uncovers lacking focus on biodiversity co-benefits INBio and CATIE are co-implementing a project on REDD+6 that aims to help maximize positive impacts and minimize negative ones for the implementation of REDD+ strategies related to issues such as maintenance of carbon sinks, biodiversity conservation, resilience and ecosystem services, through the use of computer tools, analytical methods, scenarios and modeling. Two of the specific matters to be addressed by the REDD+ project are: i.) evaluating the impact and maximizing the co-benefits from REDD+ actions in Costa Rica; and ii.) analysis of how to guide REDD+ measures to ensure greater resilience of carbon sinks using the information available. 6 http://www.redd-mas.cr/ 27 NINA Report 1112 This project is developing a geospatial model that includes, among other aspects, the following elements: i.) a map of the degree of threat of deforestation, based on predictive variables of the location of deforestation in Costa Rica; ii.) a map of the multiple ecosystem services of forests - co-benefits - which also seeks to identify, characterize, and spatially locate the main pressures and drivers of change that influence deforestation; and iii.) a map based on Holdridge life zones that would help focus REDD+ actions on the most resilient carbon reservoirs. The above, through a characterization of the functional composition of forests on a large scale, as a way of proposing priority ecosystems or regions for the maintenance of carbon deposits for the long term, while conserving more biodiversity. With this geospatial work, to be done in parallel with the economic analysis of the social co-benefits, data and detailed information will be obtained on which areas will be obtained on which zones (and where) there could be REDD+ interventions. Since both the CATIE-INBio REDD+ project and NI-CR pilot project express their results in spatially explicit models, complementarities could be identified that would allow, through specific adjustments, joint information analyses. While the CATIE-INBIo REDD+ project aims to fill a gap in reporting co-benefits, the focus is on ecosystem services of forests, rather than on forest biodiversity status. From a review of Costa Rica’s REDD+ reporting7 it is our impression that the Forest Carbon Partnership Facility does not require systematic reporting of biodiversity status in areas proposed for REDD+ actions. Biodiversity status information of NI-CR would fulfill the aims of biodiversity co-benefits reporting which current REDD+ reporting on carbon and ecosystem service social co-benefits does not cover. 7.1.5 PES monitoring - NI-CR pilot uncovers potential for data sharing between forest management and conservation authorities PES constitutes the ‘backbone’ of Costa Rica’s REDD+ policy. How could NI-CR contribute to Payments for Ecosystem Services (PES) impact evaluation criteria (SINAC-FONAFIFO, Procuradoría) in future? Parallel projects conducted by INBioCATIE (“REDD+”) and NINA (PESILA-REDD) have uncovered a lack of coordination of monitoring data between Costa Rica’s National Forest Fund (FONAFIFO) and the National System for Conservation Areas (SINAC). FONAFIFO has the responsibility to target PES contracts to private forest holders and monitor contract compliance, while SINAC is charged with monitoring impacts on forest biodiversity on all land both public protected areas and private land. In practice FONAFIFO is the only pub- 7 http://forestcarbonpartnership.org/costa-rica 28 NINA Report 1112 lic body carrying out systematic monitoring of forest management on private land. It has a georeferenced system of contracts and their property boundaries where basic information on forest conservation practices is recorded. This information is not integrated with SINACs information systems. In practice, SINACs resources mainly allow it to enforce public protected area regulations, with control of illegal hunting and logging outside protected areas taking place only sporadically. SINACs monitoring data on environmental infractions nevertheless constitutes an important proxy database on biodiversity pressures. SEMEC data is currently not georeferenced, nor is it available to FONAFIFO officers. At present lacking coordination of these sources of proxy indicators for biodiversity condition make it difficult to implement the Nature Index methodology at property level. We see the NI methodology as a tested and consistent framework that could guide the development of a shared biodiversity management information system for SINAC-FONAFIFO in future. 7.2 International policy relevance and strengthening networks 7.2.1 Natural Capital Accounting – NI-CR relevance for WAVES and TEEB The Economics of Ecosystems and Biodiversity (TEEB) emphasized the importance of natural capital accounting in support of policy8. In late 2013 a law was introduced in the Costa Rican legislature entitled "Valuation of natural capital and integration of green accounting in planning for development". It proposes to amend Costa Rica's Organic Law of the Environment of 1995, introducing the need for constructing natural capital accounts to inform environmental impact assessments (EIAs)9. Through the country’s work with the WAVES10 Partnership, accounts are being constructed for forest and water assets. If the so-called ‘Natural Capital Law’ is passed the parliament of Costa Rica would require the Government to gradually build and maintain a wider range of environmental accounts, both economic and biophysical. The UN Experimental Ecosystem Accounting (EEA) (UN 2013)11 discusses a number of proposed approaches to integrating biophysical accounts of ecosystems and biodiversity into the UN System of Environmental-Economic Accounting12 . The 8 TEEB for National and International Policy Makers. http://www.teebweb.org/wpcontent/uploads/Study%20and%20Reports/Reports/National%20and%20International%20Policy%20Making/TEE B%20for%20National%20Policy%20Makers%20report/TEEB%20for%20National.pdf 9 http://www.wavespartnership.org/en/costa-rica-introduces-law-mandate-valuation-natural-capital 10 Wealth Accounting and the valuation of Ecosystem Services (WAVES) http://www.wavespartnership.org/en/costa-rica 11 UN(2013)Experimental Ecosystem Accounting http://unstats.un.org/unsd/envaccounting/eea_white_cover.pdf 12 UN(2014) System of Environmental-Economic Accounting 2012. Central Framework. United Nations. http://unstats.un.org/unsd/envaccounting/seeaRev/SEEA_CF_Final_en.pdf 29 NINA Report 1112 Norwegian Nature Index is proposed as one of a handful of promising composite measures of the state of biodiversity. The guidance document emphasizes that for structuring information on biodiversity and in order to create accounts for particular areas (e.g. Ecosystem Accounting Units), it is imperative that the data are spatially and temporally referenced. Through the NI-CR pilot we have demonstrated a methodology for carrying out spatial and temporal referencing, as well as calculation of composite indicators which could be used directly in biophysical accounts. NI-CR provides the framework for biodiversity to become part of an information system supporting implementation of the proposed Natural Capital Law. 7.2.2 Convention on Biological Diversity (CBD) What is the potential relevance of NI-CR for the national CBD clearing house focal point ? The CBD established new international targets for 2020 and 2050 (Convention on Biological Diversity 2011), and indicators linked to these are being developed. The (Norwegian) Nature Index methodology, with associated thematic indices, can be used for national reporting for these new CBD targets. This particularly applies to indicators linked to Strategic Goal C “To improve the stats of biodiversity by safeguarding ecosystems, species and genetic diversity” (CBD 2011). Thematic indices based on the Nature index framework can be used to show de development in these “Aichi Targets”. See Box 1. Box 1. Indicators where the NI methodology could be useful (thematic indices or the index itself) Population trends of utilized species, including species in trade Degradation of natural habitats; population trends of habitat dependent major habitat type Population trends of target species and by-catch aquatic species Population trends of forest and agriculture dependent species in production systems (Impacts of invasive alien species on extinction risk trends) Trends in abundance of selected species Status and trends in species that provide ecosystem services INBio has prepared a proposal to the CBD entitled, "Biodiversity Capacity Building initiatives at INBio, Costa Rica to support the accomplishment of CBD and Aichi Targets". What is the potential relevance of NI-CR for the national CBD clearinghouse focal point? Costa Rica still does not have a Clearinghouse Mechanism (CHM) as stipulated by the Convention on Biological Diversity (CBD). As mentioned, there are different initiatives in the country but none of them are under the framework of a na- 30 NINA Report 1112 tional CHM. Its development is still a part of SINAC-Digital and in this regard NI-CR could be one of the elements to be considered for that platform. 7.2.3 Intergovernmental Platform on Biodiversity and Ecosystem Services (IPBES) How does NI-CR complement other capacity-building initiatives? The full implementation of the NI in Costa Rica and its application to other Central American countries has key opportunities and enablers, for instance: Recently INBio prepared concepts notes for the IPBES Technical Unit in Norway and the IPBES secretariat entitled “Establishment of a regional tropical IPBES Capacity-Building node at INBio, Costa Rica” and for the CBD entitled "Biodiversity Capacity Building initiatives at INBio, Costa Rica to support the accomplishment of CBD and Aichi Targets“. INBio has implemented several projects in Central America on capacity-building and technology transfer, for instance: o Building Capacity and Sharing Technology for Biodiversity Management in Central America to conserve and sustainably use Central American biodiversity through leadership and organizational capacity, to encourage collaboration among governments and civil society. o Establishment of the Biodiversity Network of the Mesoamerican Environmental Information System (SIAM) led by the Central American Commission on Environment and Development (CCAD) to provide the Central American region with free-use information technologies for the generation, editing, integration, and publication of taxonomic, geographical, ecological data and those of potential uses of biodiversity. o Establishment of Species and Specimen Thematic Network (SSTN) of the Inter-American Biodiversity Information Network to foster technical collaboration and coordination among countries of the Americas in collection, sharing, and use of biodiversity information relevant to policy and decision-making on natural resources conservation and development. IPBES plenary in Bonn January 2015 is expected to propose the task force on Capacity Building with the aim of meeting deliverables 1a and 1b. Various workshops at regional level will develop the capacity needed for the regional and sub-regional assessments. The Nature Index – with its focus on utilizing available information combined with expert judgment – could be one of the methodologies for carrying out sub-regional assessments. In September 2014 a technical group met in Paris to define methodologies for the assessments. Unfortunately, INBio was not present and further steps need to be taken if the Nature Index is to become (one of several) sub-regional or regional assessment tools. 31 NINA Report 1112 Thanks to its ability to integrate various sources of information the Nature Index framework could be considered as one of several framework methodologies to carry out subregional assessments as part of IPBES. NI-CR could be tested at a ‘coarse grain’ level, although it would be hampered by the lack of systematic mapping of Biodiversity at national and sub-national level as has been carried out in the NI-CR Pilot. While the pilot project in Costa Rica has successfully tested the technical feasibility of the Nature Index methodology, and a number of potential applications for NI at national and international level have been identified, the pilot project did not address in detail how these multiple initiatives would be coordinated, funded and implemented. Institutional feasibility should receive priority in a second phase implementation of NI-CR. 32 NINA Report 1112 8 Recommendations 8.1 NI as a methodological framework for biodiversity safeguards reporting in REDD+ Significant synergies will often be possible between reporting on carbon-related aspects of REDD+ and monitoring of biodiversity impacts of any land use regulations or incentive schemes that countries may choose to apply as part of their portfolio of REDD+ actions13. Nevertheless, from our review of Costa Rica’s REDD+ reporting14 to the Forest Carbon Partnership Facility we find reporting on biodiversity status in areas proposed for REDD+ actions to be lacking. We recommend that Norwegian funding to REDD+ initiatives15 require a greater emphasis on reporting of biodiversity status of forests. In particular, we recommend that Norwegian authorities encourage multi-lateral organizations to develop reporting protocols for biodiversity indicators as part of biodiversity safeguards reporting for REDD+ actions. There seems to be a clear mission for IPBES capacity-building initiatives to bridge these gaps. The NI-CR pilot project has shown that the main cost of implementing NI methodology is in organizing the process of data retrieval through a network of biodiversity assessment experts. Given the costs of such a process, the aim of a ‘REDD+ biodiversity safeguards reporting protocol’ should be to define an indicator set, with a spatial resolution, that meets the needs of both the carbon and conservation policy agendas in participating REDD+ countries. The NI methodology is flexible in terms of indicators and spatial resolution so it can meet particular national reporting needs. There is unexplored potential for integrating national Nature Index maps for forests with REDD+ mapping tools, in particular the Global Forest Watch16 funded by the Norwegian government. More generally, the Nature Index methodology could provide an initial framework for a ‘REDD+ biodiversity safeguard reporting protocol’. 8.2 IPBES capacity-building node on REDD+ biodiversity safeguards As highlighted in this report, Costa Rica has a number of partially overlapping carbon and biodiversity monitoring and clearing-house initiatives (REDD Readiness, SIGBI, CRBio, SEMEC). Legislation is also being put forward on natural capital accounting. Based on the ongoing learning process sparked by these policy initiatives, Costa Rica seems well suited as an IPBES capacity-building node for demonSee Epple et al. (2011) http://www.cbd.int/doc/meetings/for/wscb-redfd-lac-01/other/wscb-redfd-lac01-wcmc-en.pdf 14 http://forestcarbonpartnership.org/costa-rica 15 http://www.climatefundsupdate.org/listing/norway-s-international-climate-and-forest-initiative 16 http://www.globalforestwatch.org/ 13 33 NINA Report 1112 strating how to integrate the international REDD+ and IPBES agendas to meet national level policy needs for reporting biodiversity safeguards in the region. A recent agreement between INBio, CONABIO(Mexico) and Humboldt Institute (Colombia) may form the basis for a regional node. . 8.3 Second phase of NI-CR in Costa Rica The pilot NI-CR has enabled the full functionality of NI-CR to be tested and to get a database, calculation of indices and user interface up and running. The pilot NI-CR in 2014 has revealed the major challenge is the mobilization of a network of experts and their continued motivation to participate in a collaborative. A second phase would allow NI-CR to demonstrate its usefulness for the specific needs of different types of users of biodiversity information (i.e. decision-makers in ministries, local governments, initiatives that fund research projects, etc.) National sustainability indicator reporting National level Natural Capital Accounting and EIA support REDD Readiness CBD clearinghouse IPBES regional capacity-building A second phase of the pilot project would include Strengthen the network of experts involved in NI-CR generation and evaluation. Further focus on obtaining more data on a wider set of biodiversity indicators of forests. Conduct a pre-feasibility assessment of NI for other major ecosystems in Costa Rica. (However, before proceeding with other ecosystems, a full scale implementation of NI for forests is recommended). Develop the NI-CR institution including coordination procedures and incentives for the participation of national experts. Disseminating the project results nationally and regionally through a multilanguage enabled web-portal. Fine-tune the methodology, specifically as related to standardizing ways of defining the reference state of indicators. Evaluate the results by assigning weights to individual indicators. Capacity-building for different national institutional users for the use of the products generated. 34 NINA Report 1112 8.4 Applying the NI platform to other pilot studies around the world Experiences from the Costa Rican pilot provide some lessons for implementation of NI methodology in other case studies: Use the Microsoft Azure platform for other international applications of NI. Train personnel in the NI database structure and R-code early in the pilot. Translate the database code into English to allow computer professionals outside Norway to continue development of the NI platform. Enable the Nature Index for multiple languages, where the language of the UI is fetched from the database. Once completed translate the Nature Index database to local languages. Enable the output website Naturindeks.no for multiple languages. 35 NINA Report 1112 9 Acronyms BDG Geographic Database CAFF Conservation of Arctic Flora and Fauna CATIE Tropical Agricultural Research and Higher Education Center CBD Convention on Biological Diversity CCAD Central American Commission on Environment and Development CENIGA National Center for Geo- environmental Information CHM Clearing-House Mechanism of the Convention on Biological Diversity CONARE National Council of Rectors CRBio Costa Rican Biodiversity Information System CRBO Costa Rican Bird Observatory EEA Experimental Ecosystem Accounting ESI Exponential Shannon Index FONAFIFO National Forestry Financing Fund INBio National Biodiversity Institute of Costa Rica IPBES Intergovernmental Platform on Biodiversity and Ecosystem Services MIDEPLAN Ministry of National Planning and Economic Policy MINAE Ministry of Environment, Energy and Seas of Costa Rica NI-CR Nature Index of Costa Rica NINA Norwegian Institute for Nature Research OTS – La Selva Organization for Tropical Studies - La Selva Biological Station PES Payments for Ecosystem Services PROMEC Terrestrial Ecological Monitoring Program for Protected Areas and Biological Corridors of Costa Rica REDD + Reducing Emissions from Deforestation and Forest Degradation SEMEC Continuous Quality Improvement Evaluation System SIA Environmental Indicators System SIAM Mesoamerican Environmental Information System SIB Biodiversity Indicators System of Costa Rica SIGBI Information System for Biodiversity Management SINAC National System of Conservation Areas SINIA National Environmental Information System 36 NINA Report 1112 SSTN Species and Specimen Thematic Network TEEB The Economics of Ecosystems and Biodiversity TSC Tropical Science Center UCR University of Costa Rica UNA National University of Costa Rica USEG Socio-ecological Management Units 37 NINA Report 1112 10 Appendix 1: Activity Report Operational Objective: Implement the IT-platform software and methodology developed for Nature Index Norway for the selected ecosystem and region in Costa Rica, using available biodiversity data, as well as expert based evaluation. General Activities Planned: 1. Build capacity in INBio Team to apply the methodology and software tools in Costa Rica. 2. Implement the Communication and Data Portals. 3. Define the methodology to implement the demo project in close collaboration with experts /researchers: 4. Analyse data and evaluate results. 5. Communicate the results and submit a proposal for full-scale implementation. Progress: The operational objective of the pilot project was fulfilled during the planned execution period (January-December 2014). The following table presents the main activities developed between January and December 18th, 2014. 38 1. Build capacity in INBio-Team to apply the methodology and software tools in Costa Rica. Date Planned Sub-Activities Responsible February – To review the available literature INBio - NINA June, 2014 about NI and organize capacitybuilding videoconferences. Progress to September 2014 Completed INBio team read and discused about the documentation received from NINA. Two videoconferences (NINA-INBio) and five internal meetings were organized to discus the project’s progress, exchange ideas, and answer questions about the NI and its possible applications in Costa Rica (before INBio started organizing meetings with experts). 2. Implement the Communication and Data Portals. Date February February June February April June Planned Sub-Activities To install and configure a test version of data portal for online training. – Translate NI Manual from Norwegian into English. Responsible Pål Kvåløy, NINA Progress to September 2014 Pål Kvåløy, NINA Completed – Establish a Communication Portal. INBio Team Completed Completed - The test version of the system was available at http://nicostarica.nina.no/. - NI manual is available in English. INBio translated it into Spanish (available at http://nicr.azurewebsites.net/) and adapted it to the NI-CR project. - The Communication Portal is available at http://indicenaturalezacr.org/ Implement the NI-CR Data Portal. INBio – NINA Completed The Data Portal is available at http://nicr.azurewebsites.net/. It contains: the analysis unit polygons and the list of indicators and experts. 3. Define the methodology to implement the demo project and work with experts /researchers. Date February June Planned Sub-Activities Responsible – Methodology: identify ‘significant’ INBio indicators, NINA Select demo sites, define the analysis scales, and compile a list of experts /researchers. February June – Define the framework to start the INBio Team demo implementation for the NICR. June Training with technical visit from NINA. INBio – NINA Progress to September 2014 Completed - Three internal meetings and two videoconferences (NINA INBio) were organized to present project’s progress, exchange ideas, and answer questions. - An exhaustive expert list was compiled (91 specialist in different ecosystems). The list was evaluated and completed with SINAC. 32 active forest researchers were selected from it to work in the pilot project. INBio started visiting them in April 2014. Completed - SINAC was involved in the project implementation to start linking the NI-CR to other national initiatives (two meetings were organized and SINAC representatives participated in the workshop organized last June). - 9 institutions and 32 experts were visited to present the project. Eleven of them accepted to participate in the project and attended the workshop last June. - An internal workshop with INBio specialists was organized to start defining indicators. Eleven people attended the session and two potential indicators were discussed. - (June 3-4th). A workshop to train experts and define the elements needed to apply the methodology was organized with participation of Pål Kvaløy, Grégoire Certain and 17 Costa Rican. - (September 5th, 2014). A meeting with David Barton, Signe Nybo, and INBio representatives was organized to follow up on the project activities and make recommendations to the coordination team at INBio. Completed Workshop organized (June 3-4th ) Date Planned Sub-Activities July – Sep- Input data for demo sites tember Responsible INBio Team Progress to September 2014 Completed - Meetings were organized with experts involved in the project to define and document indicators. - INBio organized a second workshop with experts (September 30th). The workshop’s objective was to present the preliminary results by indicator, discussion about the results, and propose the necessary tunings to the process. 14 people representing 5 institutions attended the workshop. During the session 17 indicators were presented and discussed: 10 of them had data inside the data portal, 6 of them were in documenting process, and 1 of them was being defined. - INBio organized a third workshop on December 5th, 2014. The workshop’s objective was to present the NI-CR results and get feedback (i.e. recommendations, lessons learned, and challenges for a second phase of the project) from the expert group. 10 people representing 5 institutions attended the workshop. Detailed about the methodology, NI-CR results, and examples of indicators are available at the Appendix 2. 4. Analyse data and evaluate results. Date November Planned Sub-Activities Analyze indicators data using R scripts Responsible Progress to September 2014 INBio - NINA Completed The index calculation was done using scripts in the “R” language provided by NINA and adapted to the project in Costa Rica under a feedback process between the two institutions. The main modification had to do with the division of the territory into hexagons in contrast with the division into municipalities that was used in Norway. 5. Communicate the results and submit a proposal for full-scale implementation. Date Planned Sub-Activities 3-5 Sep- Knowledge exchange workshop: tember 2014 ‘Policy day’ - NI Training (NI in policy process, etc.) -NI verification of demo site database with experts - REDD+ NI-CR coordination meeting - Proposal development (scaling up, other pilot experiences) November Analysis, reporting & proposal 2014 workshop. (NINA visit Costa Rica to write report) JanuarySubmit proposal for full scale imJune 2015 plementation (Phase II) June 2015 Scientific paper submission Responsible Signe Nybø, David N. Barton, Pål Kvåløy Bård Pedersen (tentative) Progress to September 2014 In progress - The workshop will be organized during the first quarter of 2015. David N. Barton In progress In progress INBio - NINA In progress NINA Report 1112 11 Appendix 2: NI-CR Results and indicator examples Methodology and results The pilot project to implement the Nature Index in Costa Rica (NI-CR) began with the study of twelve scientific papers provided by NINA, regarding the experience to develop the Nature Index in Norway (NI-NO). Moreover, an inventory was made of possible Costa Rican researchers, recognized for their expertise with taxonomic groups and field data management, who could contribute knowledge and information to the development of the indicators for NI-CR. The scientific papers were discussed in meetings of the pilot experience implementation team at INBio, where the main contributions were identified and inquiries related to specific issues were made. These questions were transferred to the persons in charge of NI-NO via video-conferencing and emails. These series of publications revealed the logic behind NI-NO in greater detail in order to then transform it into NI-CR, evaluating its adaptation to the conditions of Costa Rica. In addition, this stage was essential for explaining the basis of the nature of NI-NO to the researchers involved with NI-CR. In the analysis of the beneficiaries of NI-CR, the National System of Conservation Areas (SINAC) was identified as a key user of the information that would be generated and above all, as a strategic partner for the development and promotion of NICR. Thus it was decided to involve three SINAC officials (Sonia Lobo, José Joaquín Calvo and Gustavo Induni) in the pilot experience, starting with a presentation about NI-NO and what was expected from it in Costa Rica. For this purpose, an official letter of introduction was sent to the then director of SINAC, Rafael Gutiérrez. To produce the list of researchers the database of researchs registered in SINAC (2009-2013), the list of researchers who participated in the focus groups and workshops for the development of the SINAC Research Strategy (ENI 2012-2013) and the list of researchers who participated in meetings to develop the protocols for updating the national list of endangered species (2012-2013), a process that was led by SINAC with support from INBio, were used. The initial number of researchers on the list was 136. Subsequently, researchers were selected who: i.) are active in research; ii.) have shown a greater willingness to share data and participate in various initiatives; and iii.) would reside in the country. Under these criteria the list was reduced to 43 researchers. Next, giving additional consideration to the taxonomic study group, the 43 NINA Report 1112 decision was made to visit and present the project to 30 researchers from nine national organizations to invite them to participate, including INBio staff. Of these, eleven researchers from five organizations, including INBio, agreed to accompany the implementation team in this pilot experience. During this stage, the relevance of applying NI-CR to a single ecosystem at a particular site was analyzed. Because much of the research conducted in Costa Rica is in forests, it was suggested that this should be the priority ecosystem. Moreover, six sites in the country where most of the research is concentrated (Osa Peninsula, Santa Rosa National Park, Monteverde, the La Selva Station and vicinity, Talamanca-San Vito and Tortuguero National Park) were analyzed. Considering that at that time it wasn’t clear which researchers would participate in this pilot project, it was decided that NI-CR would be applied to the entire country so as not to exclude researchers eager to participate. A website was created to publicize the project, containing basic information about NI-CR. The site provides an introduction to the project, its objectives and its coordinating/umbrella organizations, as well as access to the interface for data entry and the values for each indicator. The site can be accessed at: http://indicenaturalezacr.org/es/. As part of the process, a workshop was held at INBio on June 3 and 4 with the participation of eleven researchers, a representative of SINAC, two NI-NO representatives and five INBio staff members. The aim was to understand the NI-NO methodological approach for the development of NI-CR. During this workshop, the researchers presented their initial ideas about how they could develop the indicators for NI-CR, considering among other things, what the reference state would be. The presentations made by the Norwegians about NI-NO and the analysis of the development of its indicators, helped participants to better understand what NI-CR and its national utility would be. At this workshop, the use of the forest ecosystem only for NI-CR was discussed and approved. Hexagons of 200 km2 were also defined as the geographical units of the system, whereby the country’s surface area would be covered by a grid of 253 hexagons total. Per the agreement of the group, 10-year periods between 1970 and 2010, and five year periods after 2010 were defined for the NI-CR analysis. The Norwegians’ visit was instrumental in alleviating doubts through direct discussion of some NI-NO aspects that were unclear, as well as the management of the information capture system for the indicators. 44 NINA Report 1112 Subsequent to the workshop, the INBio implementation team began the task of following up with the researchers to consolidate their concept of indicators and the reference state. Toward that end, several personal meetings and two workshops for discussion were conducted with the people involved and there were several internal meetings of the implementation team with the inclusion of SINAC colleagues at some of them. In that period, some indicators could not be developed because: i.) they would require more detailed data analyses, which limited their incorporation given the schedule for the pilot project; ii.) data did not meet the requirements for the NI-CR indicators. At the end of this process, prior to the calculation of NI-CR, the information capture system had thirteen indicators with minimum information for use. These indicators are shown in Table 1. In short, it can be said that for this pilot experience, NI-CR was calculated for the forest ecosystem for 2010 (the only year with at least one indicator for the 253 hexagon divisions of the Costa Rican territory where the greatest number of indicator matches were recorded). The indicators that were finally considered in calculating NI-CR were: 1. 2. 3. 4. 5. 6. 7. 8. 9. 10. 11. Key bird species of the Caribbean lowlands Natural vegetation coverage Hummingbird species diversity Floristic diversity in Maquenque Dung beetles Key bird species of mangroves Key bird species of paramo Key bird species of the highlands Green macaw nests Chironomids Severely declined anuran (frog) richness Indicators whose values were not consistent and created problems in running the scripts or those indicators whose values had not been completed at the time of the calculation were not included Preliminary results of the analysis As shown in Figure 2, for 2010 all the polygons have at least one indicator reported. The only indicator present in all the polygons is “natural vegetation coverage”. 45 NINA Report 1112 Only one indicator is reported for 34% (86) of the hexagons, 38% (96) have two indicators, 23% (58) have three indicators, 5% (12) have four indicators, and only one indicator (0.004%) has data for the five indicators. The nature index calculation was done using scripts in the “R” language provided by NINA and adapted to the project in Costa Rica under a feedback process between the two institutions. The main modification had to do with the division of the territory into hexagons, in contrast with the division into municipalities that was used in Norway. The scripts read information from the database that was entered by the experts on the site http://nicr.azurewebsites.net/ and they return a delimited text file with the calculation of the 2.5, 50 and 97.5 percentiles of the index for each one of the hexagons and for the whole country. Figure 3 shows the geospatial distribution of the values for NI-CR by hexagons for 2010 and the forest ecosystem. The detailed content of the text file is shown in Table 2. It can be seen that the highest values for NI-CR are located in areas with more natural vegetation coverage (e.g. La Amistad National Park, Corcovado National Park, Northern Caribbean) and the lowest values are in urban areas (e.g. Central Valley) or those where agricultural activities prevail (e.g. the northern plains). This situation is probably influenced by the “natural vegetation coverage” indicator that, as has been noted, is the most widely distributed and the only one that was reported for the whole country in 2010. Finally, a second workshop was held on December 5 with the participating researchers to present the results for the NI-CR calculation and receive their feedback on the lessons learned and challenges for the development of future indicators, with a view toward implementing a national project. The workshop was attended by six researchers and four members of the INBio team. Their participation enabled the gathering of many inputs for the evaluation of the pilot experience and reaffirmed interest for participating in a national project. 46 Table 1. Indicators with values in the information capture system available for the calculation of the Nature Index-Costa Rica on November 28, 2014 Indicator Calculation method Ara ambiguus Great Green Macaw Nest Percentage of active nests Covering number of hexagons 2000, 2010, 11 2015 Javier Carazo - Esther Panthera Pomareda Mammalia Big cats and their main prey Presence of species 2015 Gerardo Chávez AmphibiaReptilia Severely declined anuran richness Percentage of species present severely declined 1970, 1980, 152 1990, 2000, 2010 Nelson Zamora - Alva- National Biodiversity ro Herrera Institute (INBio) Plantae Floristic diversity Inverse Simpson index in Maquenque 2010, 2015 2 Angel Solís National Biodiversity Institute (INBio) Scarabaeinae Dung Beetles Exponential Shannon index 2010 (39), 2015 (5) 40 Carlos de la Rosa Organization for Chironomidae Tropical Studies (OTS) - La Selva Biological Station CRBO / INBio / Kla- Aves math Bird Observatory / US Forest Service Wings Across the Americas CRBO / INBio / Kla- Aves math Bird Observatory / US Forest Service Wings Across the Americas Chironomids Number of species 1990 (13), 1980 (2), 2010 (1), 2015 (3) 2010, 2015 41 2010, 2015 22 Researcher Institution Taxonomic group Olivier Chassot Independent Pablo Elizondo - Isabel Martín Pablo Elizondo - Isabel Martín University of Costa Rica (UCR) - School of Biology Key bird species Presence of key bird of Caribbean low species of Caribbean lands low lands. Key bird species Presence of key bird of high lands species of high lands Years 8 37 Pablo Elizondo - Isabel Martín CRBO / INBio / Kla- Aves math Bird Observatory / US Forest Service Wings Across the Americas Key bird species Presence of key bird of paramo species of paramo 2010, 2015 4 Pablo Elizondo - Isabel Martín CRBO / INBio / Kla- Aves math Bird Observatory / US Forest Service Wings Across the Americas Key bird species Presence of key bird of Mangrove species of Mangrove 2010, 2015 4 Alvaro Herrera Nelson Zamora y Oscar Chacón National Biodiversity Institute (INBio) Natural vegetation coverage Natural vegetation coverage Weighted coverage ratio 2010 253 Gerardo Ávalos University of Costa Rica (UCR) - School of Biology Euterpe precato- Density of Euria terpe precatoria individuals Individuals / ha 2010 (1), 2015 (3) 4 Gerardo Ávalos University of Costa Rica (UCR) - School of Biology Trochilidae Species diversity Shannon index (Natural 2010, 2015 of hummingbirds logarithm) 3 Figure 2. Number of indicators for NI-CR by hexagon for the forest ecosystem and the year 2010 Figure 3. Geospatial distribution of NI-CR values by hexagon for the forest ecosystem and the year 2010 NINA Report 1112 Table 2. Results of the calculation for NI-CR by hexagon for the forest ecosystem and the year 2010 Hexágono Costa Rica Matina 4 Paraiso 2 Talamanca 12 Talamanca 7 Talamanca 3 Limón 7 Limón 8 Turrialba 4 Perez Zeledón 7 Heredia 2 Talamanca 11 Limón 3 Limón 6 Turrialba 2 Dota 1 Limón 10 Pococí 8 Oreamuno 1 Turrialba 6 Turrialba 3 Upala 5 San Ramón 4 Pococí 2 Talamanca 6 Buenos Aires 2 Guácimo 3 Talamanca 10 Tilarán 2 Limón 9 Golfito 2 Turrialba 8 Talamanca 8 Limón 2 Limón 1 2.5% 0.457271721 0.9941095134 0.9921917485 0.9910294689 0.9891031471 0.9831664756 0.9782986847 0.9750772814 0.9712577954 0.9710694089 0.968251582 0.9551589103 0.905789218 0.9332721668 0.9260719956 0.9241353271 0.9160599572 0.904987588 0.8981057883 0.8901873571 0.8597587511 0.8532984911 0.874198683 0.8661284908 0.863075074 0.8550923703 0.8441575764 0.7874377707 0.7167863425 0.7869250335 0.7466629467 0.8061968239 0.754254742 0.7990936943 0.7320553946 51 50% 0.466117311 0.997071765 0.9949774301 0.9939822414 0.9920733869 0.9859340178 0.9810561481 0.9780733367 0.9740438504 0.9738717615 0.9709590808 0.9580650231 0.9557345748 0.9359697335 0.9289600922 0.9270705162 0.918905817 0.9079690742 0.9009995771 0.8929560837 0.8892798411 0.8778701944 0.8769653129 0.869062239 0.8660599762 0.857956202 0.8469270241 0.8380022931 0.8346863571 0.8240061258 0.8162141956 0.8090881214 0.8051974732 0.801895345 0.7990202592 97.5% 0.4785792821 0.9997737335 0.9978958785 0.9968596455 0.9948487113 0.9887755021 0.9838656209 0.9807204332 0.9768843926 0.9766825772 0.9740847264 0.9609480872 0.964095436 0.9389063475 0.9318022066 0.9301701272 0.9219514542 0.9108276148 0.90387379 0.8958037285 0.8908670335 0.879331952 0.8797693794 0.8720535827 0.8688075147 0.8609943092 0.8499666472 0.8897394519 0.8746690678 0.8452137098 0.8193482133 0.8121002875 0.8562940335 0.8049829627 0.848772646 NINA Report 1112 Hexágono Pococí 1 Limón 5 Coto Brus 1 Paraiso 3 Golfito 3 Talamanca 9 Osa 3 Coto Brus 3 San Ramón 5 Sarapiquí 1 Perez Zeledón 1 Golfito 11 San Ramón 2 Osa 5 Talamanca 4 Osa 1 Talamanca 1 Talamanca 5 Alajuela 2 Sarapiquí 6 Talamanca 13 Limón 4 Garabito 1 Osa 10 Upala 2 La Cruz 3 Coto Brus 5 Sarapiquí 2 Golfito 8 Guatuso 3 Sarapiquí 11 Golfito 4 Golfito 7 San Carlos 2 Aguirre 3 San Carlos 9 Puntarenas 2 San Carlos 11 Perez Zeledón 2 2.5% 0.5616982491 0.7553117452 0.7540448278 0.5874253326 0.7129721677 0.7391174035 0.7369825476 0.7371694284 0.6092102057 0.6202881098 0.7221165531 0.6791517708 0.7132370187 0.6740317309 0.6521168016 0.6331938414 0.6912218898 0.6893701306 0.679065769 0.6778912435 0.653392378 0.6670455263 0.654128666 0.6152712776 0.65015624 0.6491701591 0.6460322062 0.4936679051 0.6401464978 0.640353382 0.6310711472 0.629917678 0.6077642472 0.4336520038 0.5626376758 0.4163191863 0.5990963194 0.4521984301 0.5933411603 52 50% 0.79036522 0.7579897329 0.7569733637 0.7535625913 0.7429563642 0.7420690691 0.7400744747 0.7399692927 0.7359657663 0.7340053107 0.7250226875 0.717336514 0.7159056989 0.7066132301 0.7030716117 0.7006375524 0.6939474339 0.6919612505 0.6819730029 0.6809667774 0.6728864164 0.6700481835 0.6569708347 0.6541743384 0.6530252014 0.6519972396 0.649160985 0.6452937608 0.6430467133 0.6428812406 0.6339583792 0.633007028 0.6328656792 0.6309649218 0.6197628907 0.6169779752 0.6021532185 0.6011439562 0.5960466293 97.5% 0.8881610233 0.7607948322 0.7598624262 0.9137586765 0.7740082422 0.7448945071 0.7427350472 0.7430844274 0.8435866708 0.902840391 0.7278285446 0.7553876981 0.718908886 0.7417257186 0.7501415785 0.7400720522 0.6969702596 0.6946115862 0.6847971757 0.6838650315 0.6932592307 0.6728243874 0.6600986056 0.6929936894 0.6559829552 0.6549554422 0.6521193064 0.868694292 0.6460252012 0.6458243484 0.6368069132 0.6358860984 0.6608692285 0.8092856508 0.6735642801 0.9158810984 0.6051319301 0.82729673 0.5988516061 NINA Report 1112 Hexágono Pococí 5 Turrialba 7 Sarapiquí 10 Talamanca 2 Dota 3 Buenos Aires 7 Santa Cruz 7 Zarcero 1 Osa 7 Santa Cruz 1 Heredia 1 Buenos Aires 6 San Carlos 1 Liberia 5 Parrita 1 Golfito 5 Paraiso 1 Sarapiquí 8 Parrita 4 Upala 4 Liberia 6 Bagaces 1 Osa 6 Osa 9 Puriscal 2 La Cruz 2 Golfito 1 San Carlos 7 Bagaces 6 Garabito 2 Nicoya 1 La Cruz 6 Siquirres 4 Liberia 1 Puntarenas 4 Cañas 1 Valverde Vega 1 Sarapiquí 4 Matina 1 2.5% 0.5883354334 0.5870904904 0.5211025065 0.5771280755 0.5739637394 0.5263174569 0.5649397502 0.5370112394 0.4810428451 0.5530256127 0.5442162608 0.5223455456 0.3396612319 0.5360171194 0.5044268781 0.514389811 0.5321499796 0.3338413006 0.5260617467 0.5221054641 0.5220086042 0.5201462145 0.4774356548 0.4937190154 0.5091069876 0.5081821918 0.5080744098 0.5031922161 0.4961725996 0.4961193484 0.4951919326 0.492147244 0.0173395741 0.4881757213 0.4861983917 0.4752335053 0.4711309906 0.2702339152 0.4651411741 53 50% 0.5910696548 0.5899499875 0.5816051241 0.5800071646 0.5769494277 0.5723464519 0.5679595495 0.5624725688 0.5562501647 0.5558946878 0.5547805084 0.5545518744 0.5401902967 0.5389208045 0.5383413484 0.5374583511 0.5349601239 0.5343385384 0.5289358194 0.5251134123 0.5251005809 0.5230235176 0.516624394 0.5150406254 0.5119947451 0.5110860235 0.511003351 0.5060562084 0.499060624 0.4989658343 0.4980996646 0.4950713483 0.4913163047 0.4909982246 0.4890343625 0.4780153157 0.4739831858 0.4709738729 0.4679403207 97.5% 0.5939137336 0.5927432082 0.6467151246 0.5830231325 0.5799013598 0.6167091372 0.5706717613 0.5874419665 0.6323446021 0.5589810461 0.5650077921 0.5899672236 0.8396210885 0.5418277571 0.5684526226 0.5578475171 0.5379120564 0.8333536472 0.5318876289 0.5280294177 0.5280001554 0.5258484983 0.5583460308 0.5378324378 0.5149915424 0.5138582854 0.5138094581 0.5088405213 0.5018731203 0.5019279531 0.5009605218 0.497906825 1,0000000000 0.4938925849 0.4919947592 0.4808236952 0.4768323503 0.7698436714 0.4708403595 NINA Report 1112 Hexágono San Carlos 4 Puntarenas 5 San Ramón 1 Turrubares 1 Perez Zeledón 3 Nicoya 7 Buenos Aires 4 Golfito 9 San Ramón 3 Bagaces 5 Matina 3 Montes de Oro 1 Aguirre 1 Upala 1 Siquirres 3 Acosta 1 Pococí 4 Liberia 2 La Cruz 5 Bagaces 2 Upala 8 Osa 4 Hojancha 1 Siquirres 2 Santa Cruz 6 Tilarán 1 Santa Cruz 5 Buenos Aires 1 Corredores 1 Nicoya 4 Santa Cruz 4 Perez Zeledón 9 Santa Cruz 2 Puntarenas 8 Grecia 2 Perez Zeledón 6 Nicoya 3 Sarapiquí 3 Esparza 1 2.5% 0.3115665943 0.4600632195 0.4599468324 0.4512494672 0.4500817614 0.4490199876 0.4257321592 0.3597239667 0.4391927769 0.4300084756 0.4047917967 0.425157024 0.4222821671 0.4213620623 0.4161177005 0.4141340283 0.4091569697 0.4059979239 0.4060821095 0.4030341604 0.4030295743 0.3798306825 0.4012056895 0.4010093235 0.3940268035 0.3931813718 0.3911990654 0.3883116221 0.378066884 0.3760025777 0.3652789141 0.3649819637 0.3651256899 0.3631530627 0.1645757721 0.3613893414 0.360174385 0.3601570836 0.3510135456 54 50% 0.4632254815 0.4630379574 0.4628817057 0.4540973169 0.4529270207 0.4520236082 0.4500438344 0.4443446194 0.441941139 0.4329597431 0.4309690936 0.4280191655 0.4249002104 0.4239534029 0.4190357675 0.4169464518 0.4121417869 0.4090549343 0.4090142383 0.4060684942 0.4059925764 0.4042112013 0.4040738663 0.4039697531 0.3969709265 0.3960181657 0.3939612641 0.3910129578 0.3809918761 0.3789540897 0.3680482447 0.3680003067 0.3679850475 0.3660386242 0.3642464744 0.3640484743 0.3630007008 0.3629379885 0.3540562365 97.5% 0.6717377298 0.4659580713 0.4658325644 0.4569011978 0.455790348 0.4551232292 0.475101888 0.540057336 0.4447695293 0.4358325573 0.4608439055 0.4310009926 0.4278022604 0.4269272592 0.421963696 0.4196833173 0.4148808627 0.4118747334 0.4117765089 0.4088481466 0.4090031167 0.4302803424 0.4068282034 0.4069260658 0.3999360207 0.3989268667 0.3970062026 0.3937525671 0.3839914646 0.3816598106 0.3710050498 0.3707571636 0.3710143773 0.3688929086 0.6639375427 0.3670323692 0.3658988156 0.3658493745 0.3567918115 NINA Report 1112 Hexágono Nicoya 2 Buenos Aires 8 Golfito 6 Tarrazú 1 Guatuso 2 Nandayure 2 La Cruz 1 Osa 2 Puntarenas 6 Liberia 9 Turrialba 5 Dota 2 Puntarenas 1 Osa 8 Perez Zeledón 4 Los Chiles 2 Guatuso 4 Nicoya 5 Pococí 6 Nicoya 6 Puriscal 1 La Cruz 4 Puntarenas 9 Abangares 2 San Carlos 8 Sarapiquí 9 Matina 2 San Carlos 10 Tilarán 3 Liberia 8 Carrillo 2 Perez Zeledón 8 Liberia 3 Bagaces 3 Orotina 1 Alajuela 1 Mora 1 Buenos Aires 3 Puntarenas 3 2.5% 0.3469928258 0.3460606261 0.3431533191 0.323265621 0.3392087128 0.339217398 0.33812367 0.3373519847 0.335950116 0.3329563194 0.3321781533 0.3301308614 0.3301984618 0.3290995554 0.3293202352 0.3273460583 0.325168442 0.3191741987 0.3191715475 0.316124436 0.3140856765 0.3140244958 0.3121490482 0.3110981696 0.3080367329 0.1107629396 0.3049466863 0.2981791848 0.2981405374 0.2922527144 0.2849486848 0.2880316961 0.2860751241 0.2783524492 0.2752394393 0.2731307988 0.2700223662 0.2692657914 0.26865228 55 50% 0.3498835295 0.3489402288 0.3459999407 0.3452543868 0.3420426258 0.3419491746 0.3409360576 0.3400381401 0.338987396 0.3360645421 0.3350970941 0.3330872726 0.3330242216 0.3320049585 0.3319375943 0.3300762511 0.3279290525 0.3220566208 0.3219770961 0.3191013378 0.3170184122 0.3169457263 0.314966571 0.3140052889 0.310904853 0.3108156337 0.3080379274 0.3009911469 0.3009708817 0.2950726519 0.2916155864 0.290966016 0.2889629864 0.2810233649 0.2779639352 0.276037037 0.2728623686 0.2720492811 0.2719963068 97.5% 0.3526178298 0.3521999056 0.3490020594 0.368134307 0.3449472358 0.3450359574 0.3438298527 0.3428940007 0.3418991386 0.3389485336 0.3378358728 0.3360176221 0.3358763578 0.3347988703 0.3350708471 0.3330056055 0.3308475325 0.3250399854 0.3247426979 0.3217547492 0.3198373852 0.3200074082 0.3179038342 0.3169598287 0.3140661029 0.6105093105 0.3109068335 0.3038953797 0.3039415892 0.2978727235 0.2946254618 0.2938172436 0.292036595 0.2838248751 0.2809430053 0.2788888372 0.2757566672 0.2748166076 0.274909959 NINA Report 1112 Hexágono Buenos Aires 5 Cañas 2 Coto Brus 4 Bagaces 4 Nandayure 1 Buenos Aires 9 Pococí 3 Parrita 3 Upala 6 Liberia 7 Alajuela 3 Valle Central 1 San Carlos 12 Los Chiles 6 Puntarenas 7 Jimenez 1 Abangares 1 Cañas 5 Santa Cruz 3 Vázquez de Coronado 1 Guatuso 1 Grecia 3 Upala 9 Perez Zeledón 10 Atenas 1 Tilarán 4 Turrialba 1 Sarapiquí 5 Los Chiles 5 Los Chiles 4 Cartago 1 Los Chiles 7 Guácimo 2 San Carlos 14 Upala 7 Cañas 3 San Carlos 3 Los Chiles 3 Parrita 2 2.5% 0.2671951916 0.2671717319 0.2670438581 0.265136642 0.2641868392 0.2631822861 0.2618790572 0.2602584858 0.2591598131 0.2580811043 0.2542972326 0.2530895356 0.2522118273 0.2521538619 0.2491470689 0.2482424148 0.2389959612 0.2380886152 0.2370059776 0.2342900572 0.2330266961 0.2291115648 0.2270397582 0.2271071997 0.2250490976 0.2251675401 0.220175627 0.2169047792 0.2131693465 0.2131924779 0.1960663784 0.1942499366 0.187009287 0.1850447472 0.1803116948 0.1680395815 0.1641020412 0.1622886885 0.1571024473 56 50% 0.2700344909 0.2700073359 0.2699449998 0.2680531419 0.2670804082 0.265924741 0.264951082 0.2628984993 0.2619676138 0.2609668766 0.2570187619 0.2559434345 0.2550834727 0.2536952984 0.2520395689 0.2510544469 0.2420944051 0.2409391723 0.2399588059 0.2368504328 0.2360135605 0.2320515045 0.23002522 0.2300238945 0.2280114351 0.2279352327 0.2229858795 0.2200283034 0.2159940025 0.2159657139 0.1990062859 0.1971004595 0.1900077153 0.1880109609 0.1829049727 0.1710206462 0.1669416307 0.164981854 0.1599103337 97.5% 0.2730503112 0.2730559313 0.27292467 0.2709470703 0.26969989 0.2688413816 0.2679302828 0.26610597 0.2648143843 0.2639099201 0.2599962907 0.2586498893 0.2579278632 0.2551079442 0.2548855504 0.25380893 0.2448638088 0.2439589665 0.2430884154 0.2397979369 0.2387143134 0.2347202037 0.2329474346 0.2328536328 0.2309737765 0.2309027883 0.2258787322 0.2227625784 0.218844644 0.2188889006 0.2018154588 0.1997624178 0.1930379413 0.1906948189 0.1859865115 0.1739017505 0.1696680759 0.1677273679 0.1627942696 NINA Report 1112 Hexágono Siquirres 1 San Carlos 5 Upala 3 Los Chiles 1 Perez Zeledón 5 San Ramón 6 Pococí 9 Cañas 4 Aserrí 1 Coto Brus 2 San Carlos 13 Guácimo 1 Golfito 10 Aguirre 2 Sarapiquí 7 Valle Central 2 Oreamuno 2 Corredores 2 Alajuela 4 Liberia 4 San Carlos 6 Pococí 7 Grecia 1 Carrillo 1 2.5% 0.1550207579 0.1530100713 0.1502651444 0.1449843599 0.143085357 0.1382207604 0.1283152124 0.1189414977 0.1159278642 0.1110901061 0.1111339699 0.110010673 0.1089752405 0.1041127391 0.1040822061 0.1021858892 0.0919105499 0.0881339831 0.0880463768 0.0813590059 0.0810311229 0.0770464785 0.0371113215 0.0350188957 57 50% 0.1580745559 0.1559418615 0.1530530357 0.1480080387 0.1460043397 0.1410269283 0.1309008343 0.1219683864 0.1189297576 0.1139957856 0.1139734971 0.1130092073 0.1119133007 0.1070383964 0.1069956184 0.1049992044 0.0950425335 0.0909728577 0.0909053941 0.0841165393 0.0839328382 0.0800041137 0.0399573822 0.0353035583 97.5% 0.1609145637 0.1589235688 0.1559875486 0.1506676497 0.1488473362 0.1436879792 0.1337390275 0.1249070216 0.1220199445 0.1167773842 0.1169409685 0.1157765423 0.1149139958 0.1096920278 0.1100507866 0.1078843709 0.0979689913 0.0938736089 0.0939162766 0.0869378707 0.0869227284 0.0829241784 0.0429569844 0.0355921178 NINA Rapport 1112 Indicator records Some of the indicators established for NI-CR are described below, with examples of some of the ones that were used. 1. Indicator: natural plant cover The natural connectivity of forests was suggested in the first workshop with NI-CR specialists as an indicator that indirectly measures the quality of the forests. This indicator considers the most recent available information on forest cover. Natural plant cover provides the most favorable conditions for the movement of genes between populations, favoring the development of evolutionary and ecological processes for species. Thus, the higher the proportion of natural plant cover (mature forest, paramo, palm forest and mangroves), the higher the value of this indicator for a given hexagon. For the construction of this indicator, the types of plant cover used in the map of “Forest Types” produced by SINAC’s National Forest Inventory (2013) were considered in combination with a relative weight assigned to each type of plant cover in relation to their contribution to gene movement (animals, seeds and pollen) between forest patches. The relative weights of each type of cover were determined by INBio specialists, giving the following weights: i.) mature forest = 1; ii.) paramo = 1; iii.) palm forest = 1; iv.) mangrove = 1; v.) deciduous forest = 0.6; vi.) secondary forest = 0.5; vii.) forestry plantation = 0.2; viii.) grassland = 0.01; ix.) non-forest = 0.0. For the calculation, the area of each type of plant cover for each hexagon was determined using Geographic Information System (GIS) tools. The Excel program was then used to calculate the equation below: ((cover area 1 X relative weight 1) + (cover area 2 X relative weight 2) + (cover area 3 X relative weight 3) + ... n)) / hexagon area without clouds or cloud shadows As can be seen in Figure 4, the resulting value is a ratio whose value is between 0 and 1, which also happens to be the value of the scaled indicator. The reference state for this indicator is given in relation to an undisturbed area, when the entire hexagon has natural plant cover (mature forest, paramo, palm forest or mangroves). 59 NINA Rapport 1112 Figure 4. Map of Costa Rica showing the values of the index of natural plant cover in each hexagon in the period 2005 - 2013 2. Indicator: coprophagous beetles The coprophagous beetle guild consists of dung beetles belonging to the Scarabaeinae subfamily. The group is well-defined taxonomically and there is a large amount of information on its biology. These are decomposer insects, both adults and larvae feed primarily on mammal feces, although there are some species that depart from this pattern and feed opportunistically on carrion or rotting fruits, fungi or seeds. One very special feature of this group is its breeding behavior, which involves moving or rolling a portion of food (dung) in which an egg has been deposited to complete its development into a new adult. Nests are made on the ground with a high degree of perfectionism and they can be categorized according to the nesting be- 60 NINA Rapport 1112 havior. Another characteristic of this group of insects is the temporal distribution of food daily. These beetles are considered very important functional components of ecosystems, since they provide environmental services in the form of decomposing feces and reincorporating the nutrients into the soil (by feeding on and burying the dung they use as a brood nest). They also contribute to soil aeration and the penetration of water into the soil by building tunnels and by relocating seeds they assist dispersal, which helps prevent seed predation. Finally, they can be important agents in the spreading or the destruction of the larvae and eggs of flies and other organisms that are parasites of vertebrates. For this pilot experience, the indicator value is given by the Exponential Shannon Index (ESI), which is a diversity index that uses a standardized method to sample dung beetles at the site. The method is based on the use of baited traps placed along transects in a way to obtain 20 replicas per site. The number of individuals per species is quantified for each replica. Thanks to the 20 repetitions obtained for each forest, diversity values (ESI) can also be calculated as can the value of the 25th percentile and the 75th percentile for each site sampled. Given that in Costa Rica, under undisturbed primary forest conditions, a nonmonotonic relationship has been detected between elevation and the diversity measured using the ESI, which responds to a second order polynomial equation that produces a bell-shaped curve; the estimate of the reference value for calculating NI-CR must take this relationship into account. Based on empirical data collected since 2005 and using a standardized methodology for sampling, there are ISE values for more than 100 sampling sites in forests of Costa Rica with different levels of disturbance (from intact forests to forests with different degrees of logging). Looking at the scatterplot, around the regression curve it can be seen that there was some scattering of the data, so we chose to get the 95th percentile for each undisturbed forest sampled and use it to create a new regression curve that would better approximate pristine conditions. This curve was the one that was used to determine the reference values in Costa Rica, given the elevation of a particular site. Because this reference value is derived from a mathematical model, the reference values and their up-and-down variation are reported as equal to their actual reference value. The results for the indicator can be seen in Figure 5. 61 NINA Rapport 1112 Figure 5. Map of Costa Rica showing the index values for dung beetles in the hexagons sampled during the period 2005 - 2010 3. Indicator: hummingbird species diversity Hummingbirds are the pollinators of many species of herbaceous plants, thereby enabling their reproduction; these plants in turn play a key role in the structure and composition of tropical forests. For its part, hummingbird species richness is influenced by the diversity of the plants from which the birds obtain their main food: nectar. Hummingbird communities vary with altitude, with higher diversity in the highlands. For this indicator, the Shannon Diversity Index was calculated for hummingbirds captured in mist nets in the Monteverde area: Monteverde Cloud Forest Reserve (87 individuals from 9 species) and Selvatura (250 individuals from 9 species), as well as Cerro de La Muerte (102 individuals from 4 species). Shannon is an abundance-based index that gives more weight to common species. The objectives of 62 NINA Rapport 1112 the study have been to monitor the use of artificial feeders, relate this use to competitive interactions, assess pollen loads and relate this to dominance and feeder use, and quantify patterns of aerodynamic variation (relating that to pollen loads, morphological variation and feeder usage). Data for Monteverde are from 20122014, and for Cerro de la Muerte from 2003-2014 (not all the data gathered were included in this indicator). Selvatura has artificial feeders on an almost permanent basis. Hummingbirds there carry little or no pollen. Species tend aggregate around feeders. In the Monteverde Cloud Forest Reserve, conditions are more natural and hummingbirds carry more pollen. Species abundance is more even. At Cerro de La Muerte pollen loads vary with position in the dominance hierarchy (more dominant species bear less pollen) and flower availability. Here, the reference state for this indicator is given by the highest value of the Shannon Diversity Index in each site during the time of the study. The results from the index can be seen in Figure 6. Figure 6. Map of Costa Rica showing the values for the diversity index of hummingbirds in the hexagons sampled in the period 2005 - 2013 63 NINA Rapport 1112 12 Appendix 3 – Overview of Norwegian Nature Index Methodology The Nature Index (NI) is a generic and flexible biodiversity indicator framework developed to synthesize and communicate the current knowledge of the state and development of biodiversity. Within Norway, the NI has been adopted as an indicator of sustainable development and also as an indicator for state and trends of major ecosystems as needed by the Ministry of Environment17. The methodology is flexible and thematic indices on the state of ecosystems as described by the Aichi targets may be developed. Currently, the relationship between the NI and ecosystem services is being investigated. The index may be presented as maps or graphs with confidence intervals. The NI is designed to make the most of the available knowledge in the ecological research community, including expert judgment, monitoring data and models (Figure 1). Data entered online A National Expert or an Expert group for each indicator Monitoring data Unpublished reports or notebooks Research Field observations Figure 1. Different sources of knowledge on biodiversity may be used. Information on the uncertainty of each indicator are entered and combined in the final index The NI combines a multitude of indicators, each representing a separate aspect of biodiversity in Norway. The indicators are subjectively chosen by an expert group so that they together (as far as possible) give an exhaustive account of ecosystems. Primarily species or surrogates of species are chosen as indicators (Figure 2) and a weighted average of these indicators reflects the state of a given ecosystem. Information needed is any measures on abundance or population levels (relative or absolute). These numbers are to be followed by a judgment of uncertainty, thus respecting that knowledge on different indicators are not absolute certain. The geographical resolution of the data is flexible, i.e. both high resolution and low resolution data may be used. 17 http://www.environment.no/Topics/Biological-diversity/The-Norwegian-Nature-Index-/ 64 NINA Rapport 1112 Figure 2. Principle scheme for aggregating NI for a major ecosystem or thematic indices. For simplicity we have shown terrestrial ecosystems as one ecosystem. However, we calculate NI separately for the forests, open lowlands and mountains within the terrestrial environment. Thematic indices (white boxes to the right) can be made for specific management issues. In addition to thematic indices focusing on a given taxa, also indices related to e.g. forestry, pollution or species on the red list can be constructed. The index ranges from 0 to 1, 1 representing optimal conditions and 0 representing a completely impoverished state. It is flexible in that it can be calculated for almost an unlimited amount of subsets, both thematic (such as different ecosystems) and geographical (such as counties and larger regions). The index also comes with confidence intervals around its estimates, both providing information about the level of knowledge and enabling statistical hypothesis testing. The index can thus answer questions such as “has the quality of the forests in a given region or area increased or decreased in the past five years?” Further information can be found here http://www.nina.no/en-gb/environmentalmonitoring/thenorwegiannatureindex.aspx A detailed methodology has been published in a scientific journal (Certain et al., 2011). Examples of results. The method has been applied to 9 major ecosystems in Norway. Dark blue indicates the reference state (NI=1.0), whereas dark red indicates degraded ecosystems (NI=0.0). Generally the NI is higher in marine ecosystems and freshwater, than in terrestrial ecosystems. 65 NINA Rapport 1112 Figure 3. State of biodiversity in different major ecosystems in 2010 as measured by the NI. Red color (0) shows a severely degraded ecosystem, while blue (1) shows an ecosystem at the reference state. Furthermore the NI has increased by 10% in freshwater and ocean pelagic and bottom. The increase is due to several management actions such as the work to combat of acidification and reduced pollution from sewage and agriculture. Natural variations in marine populations and improved fishing regulations of marine stocks are regarded as the main explanations of the increased NI of the ocean. Open lowlands, which mainly consist of traditional managed agricultural land, the NI has decreased by 12% these 20 years. The state of other ecosystems are generally stable (Nybø et al., 2011). Several thematic indices may be generated. One example is presented below (Figure 4). Here we display the index as a graph with confidence intervals and trends over time. 57 indicators sensitive to forestry has been selected to indicate the effect of forestry on the NI at the national level (Storaunet and Gjerde, 2010). It is however emphasized that these indicators also are sensitive to other pressures. 66 NINA Rapport 1112 Figure 4. Thematic index of forestry. Year are given on the x-axis, while the NI-value with 95% confidence interval is given on the y-axis. The thematic index is based on 57 indicators included both mammals, birds, insects, lichens, mosses and plants. 67 1112 ISSN: 1504-3312 ISBN: 978-82-426-2733-9

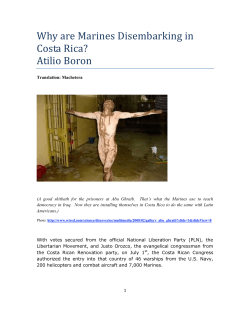


© Copyright 2026