
c o m m e n ta r y
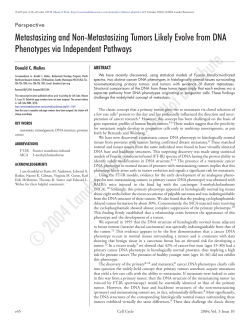
c o m m e n ta r y
OPEN
npg
© 2013 Nature America, Inc. All rights reserved.
Enabling transparent and collaborative
computational analysis of 12 tumor types
within The Cancer Genome Atlas
Larsson Omberg1,6, Kyle Ellrott2,6, Yuan Yuan3,4, Cyriac Kandoth5, Chris Wong2, Michael R Kellen1,
Stephen H Friend1, Josh Stuart2, Han Liang3,4 & Adam A Margolin1
The Cancer Genome Atlas Pan-Cancer Analysis Working Group collaborated on the Synapse software platform to
share and evolve data, results and methodologies while performing integrative analysis of molecular profiling data
from 12 tumor types. The group’s work serves as a pilot case study that provides (i) a template for future large
collaborative studies; (ii) a system to support collaborative projects; and (iii) a public resource of highly curated
data, results and automated systems for the evaluation of community-developed models.
The Cancer Genome Atlas (TCGA) PanCancer project, consisting of over 250 collaborators spread across almost 30 institutions,
required researchers to engage in over 60 different research projects oriented on the same
set of data. As with other team-science efforts,
the Pan-Cancer endeavor required researchers
around the world to work in distributed teams
to generate, share and interpret large amounts
of data. Many projects were interdependent,
requiring multi-stage analysis and sharing of
results, such that results from one group were
used as input for the analyses of other groups.
Thus, it was essential to standardize the input
data used by all researchers. The results in the
1Sage Bionetworks, Seattle, Washington, USA.
2Department of Biomolecular Engineering,
University of California, Santa Cruz, Santa
Cruz, California, USA. 3Department of
Bioinformatics and Computational Biology,
University of Texas MD Anderson Cancer
Center, Houston, Texas, USA. 4Graduate
Program in Structural and Computational
Biology and Molecular Biophysics, Baylor
College of Medicine, Houston, Texas,
USA. 5The Genome Institute, Washington
University, St. Louis, Missouri, USA. 6These
authors contributed equally to this work.
Correspondence should be addressed to L.O.
([email protected]) or A.A.M.
([email protected]).
current collection of papers are based on integrative analysis of 1,930 input data files encompassing 6 different biomolecular technologies,
including protein expression, copy number
variation, somatic mutation, mRNA expression, DNA methylation, microRNA (miRNA)
expression and clinical data for 12 cancer types.
The same patients were sampled across most
of the platforms, yielding a coherent data set
(Fig. 1).
Currently, collaborative science and data
sharing are supported by a number of tools,
including repositories for sharing published
data, such as the Gene Expression Omnibus1
and the database of Genotypes and Phenotypes
(dbGaP)2; more general solutions for ad hoc
sharing of data, code or wiki content, such as
Sharepoint, GitHub and Confluence; standards for file descriptors, such as ISA-Tab3;
and software tools for running prepackaged
methodologies in analysis pipelines, such as
Firehose, Galaxy3, Taverna4 and GenomeSpace.
However, enabling collaborative scientific projects requires tools that facilitate the evolution
of knowledge and resource outputs beyond the
sum of the group’s individual efforts. By incorporating such collaboration tools throughout
all phases of the research cycle, rather than as
post hoc descriptions added at the time of publication, emergent data and analysis resources
are created by the collaboration that may be
seamlessly released to the general research
nature genetics | volume 45 | NUMBER 10 | OCTOBER 2013
community, thereby increasing the resource
value of the work.
The Pan-Cancer group explored a collaborative model in which all consortium participants worked through the Synapse software
platform to share and evolve data, results
and methodologies throughout the full duration of the project5. Synapse is composed of a
set of shared Representational State Transfer
(REST)-based web services that support both
a website designed to facilitate collaboration
among scientific teams and integration with
analysis tools and programming languages
to allow computational interactions (Fig. 2).
Synapse provides an expanding number of
features to enhance collaborative analysis of
complex genomic data (Box 1). In the following sections, we highlight how key features of
Synapse were used by the Pan-Cancer group
through three different examples of collaborative analysis: (i) establishing a canonical data
set that required strict use of versions and data
freezes; (ii) applying multistep data-processing
procedures to infer functionally significant
mutations; and (iii) comparative analysis of
predictive models of patient survival with realtime evaluation of model performance.
Aggregation standardized data
To coordinate all of the investigators working on the same data, standardized collections of data sets were released in the form
1121
COMMENTARY
BCLA
n = 127
COAD
n = 423
BRCA
n = 898
GBM
n = 595
LAML
n = 201
HNSC
n = 313
KIRC
n = 460
LUAD
n = 438
npg
© 2013 Nature America, Inc. All rights reserved.
READ
n = 167
LUSC
n = 361
OV
n = 590
UCEC
n = 513
Copy number data
Methylation data
miRNA-seq data
Expression data
Mutation data
RPPA data
Number of data platforms for sample
Absent
Legacy platform
Current platform
Fewer
More
Figure 1 Molecular profiling data sets in the Pan-Cancer project. Each circular plot displays the total
number of samples analyzed across each of the 12 tumor types in the Pan-Cancer project. Samples are
arranged in the same order in each concentric circle for each tumor type. Different circles are colored
according to whether the sample was profiled using the most current platform, was profiled using a
legacy platform or was not profiled. Each data set, including older versions, is available in Synapse
(syn300013).
of ‘data freezes’, which served as the input
for all downstream analysis. Files in the data
freeze were intuitively presented to researchers as lists of tab-delimited matrices for each
tumor type and experimental platform. As
described below, each file in a data freeze was
associated with provenance tracking, data
versioning, queryable structured meta-data
and bindings to multiple analytical clients.
Each processed data set was associated with
a provenance record, depicted as a graph of
the input data sets and data-processing procedures used to generate the data (Fig. 3).
Such input data sets were aggregated from
several locations, including the TCGA DataCoordinating Center (DCC), Broad Firehose
and file-sharing platforms used by the individual TCGA analysis working groups. Synapse
uses a federated data model such that data
stored on any external platform are represented the same way in Synapse. In contrast
to commonly used data-sharing solutions
that expose lists of files structured in folder
hierarchies, Synapse provides graphical provenance records that accurately describe a
data resource in terms of dependencies and
structured workflows related to its inputs. For
example, although aggregated data matrices
are the standard input data for all downstream
analyses, researchers can also trace the derivation of a processed data set back to its upstream
constituents and processing procedures. In
addition, researchers can apply alternative dataprocessing procedures to generate different
versions of the aggregated data sets that can be
shared with other analysts and fed into downstream analysis.
The use of data versioning allowed the data
freezes to evolve as a living resource as new
TCGA data were generated during the PanCancer project. The tracking system in Synapse
associates a version with each data file that
automatically increments with each update,
and each data freeze defines a ‘snapshot’ of a
collection of specified versions of the constituent data files. Therefore, the data could evolve
with new versions while keeping a data freeze
constant.
Each data file was associated with structured meta-data annotations, consisting of strongly typed key-value pairs.
We employed standardized meta-data
schemas and controlled vocabularies for
different types of data within the project, allowing queries using SQL-like syntax from a variety of analytical clients
(R, Python, Java and command line). For
example, using the R interface, the command
synQuery(“select name, id
from entity where
freeze==’tcga_pancancer_v4’ and
tissueType==’breast’ and
dataSubType==’geneExp’”)
Table 1 Publications and Synapse DOIs containing output results
Project title
Synapse DOIs
Dissecting the clinical prognostic and predictive utility of cancer genomic data across tumor types (Y.Y., E.M. Van Allen, L.O., N. Wagle, doi:10.7303/syn1710282
A. Sokolov et al., unpublished data)
Pan-cancer patterns of somatic copy number alteration21
doi:10.7303/syn1703335
Analysis of somatic mutations across many tumor types22
doi:10.7303/syn1715784
Integrated genomics analysis of 12 tumor types reveals new cell-of-origin cancer subtypes (J.S. et al., unpublished data)
doi:10.7303/syn1868708a
1,000 tumor-normal pairs across 5 cancers by whole-genome sequencing
doi:10.7303/syn1709899a
Identification of pan-cancer oncogenic miRNA superfamily anchored by a central core seed motif
doi:10.7303/syn1703131
Estimating the presence of tumor-associated normal cells using gene expression signatures predicts tumor purity
doi:10.7303/syn1809223a,
doi:10.7303/syn1901044
The Cancer Proteome Atlas: a resource for cancer proteomic data23
doi:10.7303/syn1750330
Multi-cancer molecular signatures and their interrelationships
doi:10.7303/syn1686966
aThe
data for these projects will be made public when the projects publish. Requests for access should be made to the corresponding author.
1122
volume 45 | NUMBER 10 | OCTOBER 2013 | nature genetics
COMMENTARY
npg
© 2013 Nature America, Inc. All rights reserved.
returns the name and Synapse ID for all gene
expression data sets for breast cancer in the
fourth data freeze. This feature not only
allows the relevant data sets to be discoverable
for exploratory analysis but also allows downstream data analysis pipelines to be scripted,
adapted and reused. For example, with the
release of a new data freeze, all downstream
analyses can be regenerated by incrementing
the ‘freeze’ parameter in the example query
statement. Moreover, because all data sets are
stored in the same format, a cross-tissue comparative analysis can be performed by changing the ‘tissueType’ parameter and applying
the same analytical procedure.
Inferring significant mutations
Pan-Cancer researchers rapidly applied and
evolved novel analytical techniques and used
Synapse to share results. In addition to the
input data described above, collaborators
have generated over 1,600 data files representing various analysis procedures and results
(Table 1). This data resource (summarized in
syn1895888) includes results from the most
commonly used algorithms in TCGA publications6–12 and provides the broader community
with improved transparency of the results of
each methodology. As an illustrative example,
we describe how results and analysis procedures of the MuSiC13 algorithm were represented in Synapse through the use of features
such as wiki-based descriptions and runnable
source code contained in provenance records.
The ‘significantly mutated gene test’ in the
MuSiC suite of tools uses as input a list of
somatic variants detected in tumor samples
and identifies functionally significant mutations affecting genes, gene families or protein
domains. These variant lists, made available by TCGA, were mirrored in Synapse
(syn1695396) with appropriate provenance
to the original sources and then standardized,
checked for errors and corrected as necessary
(syn1710680). Because methods for somatic
variant calling are susceptible to errors, these
variant lists were further strictly filtered for
likely false positive variant calls (syn1729383).
All analysis steps are tracked and versioned
on Synapse, with appropriate documentation using markdown-formatted wiki pages
describing the details of each step and the
data formats of associated results files (Fig. 3).
Users may also view the provenance record of
the multistep data-processing procedure, as
well as the intermediate results and processing code used in each analysis step.
Download of input data and upload of
results were automated using the Synapse
Python application programming interface (API). Intermediate steps performed in
Box 1 Key features of Synapse
Data versioning. Data change over time. Experiments are rerun and new data are
generated. However, new data do not invalidate the previous data, which must be
maintained to reproduce previous analyses. Synapse allows for data entities to be updated
and keeps track of their previous versions while maintaining a single accession number
for each entity. Multiple files and specific versions can be combined into data freezes,
corresponding to a collection of specified versions of data entities.
Provenance tracking. Data analysis occurs in stages. One researcher will perform an
analysis and produce results that are used by another researcher. This may happen several
times. Synapse allows for a series of analysis steps to be recorded and visualized using
the provenance system. Every piece of data and analysis in Synapse can be tracked by
provenance, including the chronology of ownership and links to data and source code used
in the analysis. The graph representing the provenance of analysis is based on the W3C
provenance specification proposal (see URLs).
Data annotation. A file by itself is not descriptive. Projects with large amounts of data
often devolve into collections of unorganized files with obscure names. Synapse has
utilities to attach structured typed annotations to data, such as source species, file type,
algorithm used or any other characteristic attribute defined by the user. Optionally, each
annotation may be associated with a dictionary of possible values, allowing integration
with existing data ontologies.
Query language. Finding relevant data is important. In addition to browsing data using
the traditional ‘file/folder’ hierarchy, all annotations associated with Synapse entities may
be queried using the web client or using SQL-like syntax from a variety of programmatic
clients. Thus, users can quickly search through thousands of files to find the data that are
relevant to their experiments.
Governance. Synapse enables the management of controlled data-access mechanisms to
share data while maintaining compliance with human privacy protections and/or legal or
ethical restrictions. Data use terms are set by the data contributor and are managed by
the Synapse Access and Compliance Team according to institutional review board (IRB)approved protocols.
Group security. Although open research is the ultimate goal, many groups like to work with
a level of controlled access during certain stages of the research process. Access can be
limited to individual users or groups and seamlessly transitioned to public access at the
appropriate time.
Citation management. Everything stored in Synapse is accessible by unique accession
numbers (Synapse IDs) that can also easily be assigned a citable, permanent DOI (digital
object identifier). These DOIs can either reference specific versions of data or, by choice,
track the most recent version of data.
Clients for R, Python, Java and command line. Synapse provides open APIs and fully
functional clients in three popular programming languages as well as command line
access. Each client communicates with a common set of Synapse REST services,
allowing robust access to Synapse features, including loading data objects into analytical
environments, creating and editing Synapse entities and creating provenance records.
Rich descriptions. Wiki pages describing data or analyses may be optionally associated
with any Synapse entity. These wiki pages fully support markdown syntax and can be
decorated with rich content in the form of widgets, such as tables, graphs, videos or even
runnable R instances in the form of shiny apps.
Evaluation queues. Entities uploaded to Synapse may be loaded into an evaluation
queue, which kicks off an automated procedure to perform a specified analysis on the
newly uploaded entity. Results of these downstream analysis procedures may be stored in
Synapse, for example, to implement the real-time leader board systems used to evaluate
the accuracy of predictive models.
house (outside of Synapse) were reduced to
a sequence of commands that invoke tools
in the MuSiC suite and other minor pre- or
post-processing steps that were documented
in Synapse’s provenance records, thereby
nature genetics | volume 45 | NUMBER 10 | OCTOBER 2013
enabling any peer with appropriate computational resources to reproduce the results.
Predictive models of patient survival
In addition to creating capabilities for
1123
COMMENTARY
describing and sharing analysis workflows, the Pan-Cancer group also explored
a research model in which independent
groups of investigators collaboratively
evolved novel analytical methods through
the use of automated tools to assess the performance of each approach14. Specifically,
the Pan-Cancer group used tools to provide
real-time automated assessments, based
on common performance metrics, of both
‘unsupervised’ clustering methods (J.S. et al.,
unpublished data) and ‘supervised’ molecular
prognostic models of patient survival (Y.Y.,
E.M. Van Allen, L.O., N. Wagle, A. Sokolov et
al., unpublished data).
Broad
Firehose
DCC
© 2013 Nature America, Inc. All rights reserved.
To evaluate the performance of prognostic
models, participants submitted predictions
of survival times to Synapse along with the
executable code that generated the model.
Using an evaluation queue running in Synapse,
the performance of each model was assessed
on the basis of concordance index scores, and
performance results were provided to participants via an online real-time leader board
(syn1710282). Specifically, we assessed model
performance in the four cancer types with
adequate patient survival data and sufficient
sample size: kidney renal clear-cell carcinoma,
glioblastoma11, lung squamous cell carcinoma10 and ovarian serous cystadenocarciAnalysis
working
groups
Data standardization
npg
Data
Results,
models,
predictions
Collaborators and modelers
Predictions
Leader board
Metaanalysis
Figure 2 Schematic of the Pan-Cancer analysis workflow. Data were aggregated and standardized from
the TCGA DCC, Broad Firehose and individual analysis working groups and processed into easy-to-use
tab-delimited files. Collaborators used a variety of analytic tools, such as R, Python, Unix shell and
the web client, to interact with data in Synapse while also storing results, provenance records, analysis
descriptions and source code. For a subset of these results (for example, patient survival predictions),
Synapse carried out automated performance evaluations and displayed results on a real-time leader
board, which were available to collaborators to perform comparative meta-analysis or adapt model
source code to additional applications.
1124
noma6. For each tumor type, 100 randomly
sampled training and test data set partitions
were stored in Synapse, and researchers submitted prediction vectors for the 100 test data
sets using models built on the corresponding
training data set. Each model was also submitted with publicly available runnable source
code, allowing any researcher to reproduce the
results or adapt models to apply to additional
data sets (Fig. 2).
To facilitate downstream meta-analysis of
model results, each model was associated with
a structured set of meta-data, corresponding to (i) cancer type; (ii) molecular data type;
(iii) clinical features used; (iv) feature preselection method; (v) number of selected features;
and (vi) type of algorithm. Ability to query using
these annotation fields and retrieve model scores
based on specified criteria allowed a controlled
evaluation of modeling factors related to predictive accuracy, similar to in the analytical design
used by the MAQC-II consortium15.
The Pan-Cancer evaluation system for
the prediction of patient survival is now
publicly available as a community resource to
evaluate the accuracy of any user-submitted
predictive model of patient survival across
the four tumor types (syn1710282). Using a
crowd-sourced research model similar to the
Sage Bionetworks–DREAM Breast Cancer
Prognosis Challenge16, we believe that enabling
the entire research community to collaboratively evolve models and providing real-time
objective feedback based on predefined metrics will enable the community to more rapidly
converge on approaches that are most likely to
yield maximal benefit to patients.
A reproducible research commons
The current collection of Pan-Cancer publications documents the innovations and
discoveries derived from over 250 researchers analyzing a common set of data. This
Commentary describes the group’s attempt to
improve the transparency and reproducibility
of its research efforts by pioneering a collaborative methodology in which researchers leveraged a common resource to build off each
other’s work. The data freezes, analysis results
and evaluation framework for survival predictions each correspond to a new publicly available resource released in conjunction with
this work. First, the curated Pan-Cancer data
freezes are now available (syn300013), allowing researchers to easily access well-curated,
analysis-ready data sets from the TCGA
Research Network. Data freezes will continue
to be maintained and updated in future expansions of the Pan-Cancer project. Updates will
be immediately available to the community,
allowing any researcher to use data from and
volume 45 | NUMBER 10 | OCTOBER 2013 | nature genetics
COMMENTARY
Illumina RNA-seq: normal
(syn1695371 version 1)
Illumina RNA-seq: tumor
(syn1695373 version 2)
MAF files: combined
(syn1695396 version 4)
Liftover, deduplication and
reannotation
Researcher 1
Researcher 2
npg
© 2013 Nature America, Inc. All rights reserved.
Pancan12 log2 RSEM
(syn1695418 version 1)
MAF files: hg19 and deduplicated
(syn1710680 version 4)
Averaging across
tumor types
Flitering of false
positives
Researcher 2
Researcher 2
Sequencing coverage
(syn1695394)
Mean RSEM
MAF files: strictly filtered
(syn1734155 version 1)
(syn1729383 version 2)
MuSiC
Researcher 2
Researcher 3
MuSiC mutation rates and SMGs MutSig.pancan12.SMG
(syn171578 version 2)
(syn1713813 version 4)
Combination and
comparison
Researcher 2
Shortlisted SMGs from MuSiC and MutSig
(syn1750331 version 2)
Figure 3 Example provenance graph of a multistep workflow showing interaction between the analysis
of three researchers. The provenance record consists of two types of nodes—activities (shown as red
boxes above) performed by a researcher and input and output files of these actions (shown as file and
folder icons and identified by their name and Synapse ID). In addition, every activity has metadata
associated with it to further describe the details of the actions performed. This specific graph shows
the workflow used to perform comparative analysis of two mutation-calling algorithms—MuSiC and
MutSig. For MuSiC, the provenance of analysis is displayed from input data to derivation of mutation
calls. Provenance records may be further expanded (ellipses) to trace the origin of input files to their
original data source in Firehose, DCC or personal communications with AWG members. For brevity, the
MutSig graph is not expanded. This graph was produced from version 2 of the data in doi:10.7303/
syn1750331.
contribute to the Pan-Cancer project. Second,
we are releasing a resource of Pan-Cancer
analysis results (syn1895888), containing
the results of applying most commonly used
algorithms developed throughout the course
of the broader TCGA effort. Compared to
previous reports of TCGA analysis procedures via traditional publication mechanisms6–12, the Synapse resource of analysis
results provides improved transparency and
reuse of results reported in the current collection of Pan-Cancer papers. In addition,
any researcher may contribute content to
this central resource so that it may evolve as a
broad community effort in the next phase of
the Pan-Cancer project. Third, we are launching a ‘collaborative competition’ framework
(syn1710282) through which any researcher
may submit survival predictions, based on
available clinical and molecular data for the
four tumor types currently analyzed, and
assess each prediction’s accuracy in real time
compared to all other submitted models.
The Pan-Cancer project provides only a
starting point to guide aspects of future largescale collaborative studies, and many improvements must be made in future work. Synapse
is currently in beta release, and the feature set
nature genetics | volume 45 | NUMBER 10 | OCTOBER 2013
(Box 1) evolved dynamically according to the
needs of consortium researchers.
To maximize user participation, Synapse
was designed to favor simplicity of use at the
possible expense of the consistency that is
favored by more strict standardization. For
example, each data object was associated with
structured meta-data represented as key-value
pairs. However, the set of keys associated with
each object was standardized by convention rather than by enforcing a strict schema.
Moreover, the set of values associated with each
key was strongly typed but not restricted to
dictionaries of possible terms. In future implementations, we will allow project owners to
define stricter schemas, including associations
with ontologies and integration with tools such
as ISA-Tab3 for meta-data standardization.
Similarly, we provided tools for users to
document data dependencies in the form of
provenance records; however, to minimize barriers to participation, we did not enforce the
use of such tools. An alternative strategy could
be to define a minimal standard of provenance
associated with each Synapse entity, verifying
compliance of uploaded entities or providing
tools for the community to flag entities that
may require additional documentation. A
more technical solution that we have recently
implemented allows users to upload executable
code specifying a function such that Synapse
automatically executes the function, stores the
output in a Synapse entity and creates a provenance record corresponding to the input arguments. We adapted this strategy in a previous
project16 in which we enforced adherence to
predefined APIs and verified code execution;
however, in the Pan-Cancer project, we allowed
users to upload analysis code without enforcing
such constraints.
Consistent with the strategy of favoring flexibility over standardization, Synapse is intended
to provide the connection (the metaphorical
‘synapse’) between analyses performed in any
analytical environment using any computational infrastructure and data stored in any
distributed location. Although tools exist for
many (perhaps all) individual features supported by Synapse, we believe that the integrated system provides a unique framework for
enabling large-scale collaborative analysis projects, and integration with additional tools is a
priority for future development. Initial integration has focused on popular programming languages, such as R and Python. Recent work has
focused on integration with popular tools, such
as Galaxy for the design of analysis pipelines,
Cytoscape17 and WikiPathways18 for representing and visualizing networks and pathway
data, and GenomeSpace for facilitating data
conversions across multiple tools. We hope to
1125
npg
© 2013 Nature America, Inc. All rights reserved.
COMMENTARY
accentuate and enable the strengths of each tool
through integration with Synapse capabilities
to share and organize data and results, as well
as other features designed to facilitate largescale collaborative projects (Box 1).
The federated data model employed by
Synapse is a particular choice designed to
facilitate flexibility. This design allows for the
distributed analysis of large data sets in which
data and analysis servers must be colocalized to
minimize bottlenecks due to data transfer. This
design was not required for the Pan-Cancer
group, as data consisted mainly of gene-level
summarizations, and data transfer to collaborators’ local analysis environments did not cause
a bottleneck. To facilitate more data-intensive
projects, we are exploring the ability to provision computational environments hosted by
Synapse along with colocalized copies of data.
Our work represents a pilot project designed
to demonstrate the ability to facilitate a largescale, distributed collaboration, including
design choices intended to minimize barriers
to adoption and achieve engagement from all
collaborators. As we improve and expand the
capabilities of Synapse in the context of future
phases of the Pan-Cancer project and related
collaborative projects, it will be interesting to
explore the tradeoffs between enforcing constraints on how users may perform analyses
and represent results versus providing a flexible
set of tools and allowing standards and protocols to emerge organically from users.
We believe that the open research strategy
of the Pan-Cancer project both increased the
resource value of the group’s work and accelerated the group’s pace of scientific progress.
Moreover, by exposing the entire research
process through an open resource, any stage
of analysis may serve as a starting point for
additional scientific projects throughout the
community. Thus, we believe that Synapse
will enable an acceleration in the rate of discoveries building off our work. As recent
studies have suggested19,20, the benefits of
open projects are often most dramatically
observed over time. Biomedical research—
1126
characterized by worldwide efforts to harness
massive data sets and collaboratively evolve
understanding of complex systems over long
periods of time—may be the field of study
poised to reap maximal benefits through an
open-research paradigm.
URLs. Synapse, https://synapse.org/; Firehose,
http://gdac.broadinstitute.org/; GenomeSpace,
http://www.genomespace.org/; W3C provenance specification, http://www.w3.org/TR/
prov-primer/.
Accession codes. All input data files used
in the Pan-Cancer project are available via
Synapse DOI syn300013 (to find any Synapse
page referenced in this paper, type the Synapse
ID or DOI into the search box on any page at
http://www.synapse.org/). Synapse is freely
available to any registered user, and all source
code is released under an open-source license
and available through GitHub (https://github.
com/Sage-Bionetworks/Synapse-RepositoryServices). We invite members of the scientific
community to provide feedback (http://
support.sagebase.org/sagebase, access the
source code and directly contribute to the
software, and suggest additional projects
through which to explore a collaborative
research paradigm.
Note: Any Supplementary Information and Source Data
files are available in the online version of the paper.
ACKNOWLEDGMENTS
We gratefully acknowledge contributions from the
TCGA Research Network and its TCGA Pan-Cancer
Analysis Working Group (contributing consortium
members are listed in the Supplementary Note). We
thank J. Wilbanks for discussions on the benefits of
open systems. We thank the Synapse development
team for building Synapse and providing technical
support. We thank the anonymous reviewers for
helping us improve the quality of this work through
many insightful comments. This work was funded
by US National Institutes of Health/National Cancer
Institute grant 5U54CA149237.
AUTHOR CONTRIBUTIONS
L.O., K.E. and A.A.M. wrote the manuscript with
assistance from C.K., S.H.F., J.S. and H.L. L.O., K.E.
and C.W. created the visuals for the manuscript.
L.O. and K.E. coordinated data aggregation and
sharing in Synapse. Y.Y. developed data sampling
and primary models for survival predictions.
C.K. performed MuSiC analysis and created the
corresponding Synapse annotations. L.O. developed
infrastructure for scoring and evaluations in
Synapse. M.R.K. oversaw the development of
Synapse. J.S. and A.A.M. conceived of and oversaw
the use of Synapse to support the Pan-Cancer
project. The TCGA Research Network contributed
all of the results in Synapse.
COMPETING FINANCIAL INTERESTS
The authors declare no competing financial interests.
This work is licensed under a
Creative Commons AttributionNonCommercial-Share Alike 3.0
Unported License. To view a copy of this license, visit
http://creativecommons.org/licenses/by-nc-sa/3.0/.
1. Edgar, R., Domrachev, M. & Lash, A.E. Nucleic Acids
Res. 30, 207–210 (2002).
2. Mailman, M.D. et al. Nat. Genet. 39, 1181–1186
(2007).
3. Goecks, J., Nekrutenko, A. & Taylor, J. Genome Biol.
11, R86 (2010).
4. Wolstencroft, K. et al. Nucleic Acids Res. 41, W557–
W561 (2013).
5. Derry, J.M.J. et al. Nat. Genet. 44, 127–130 (2012).
6. Cancer Genome Atlas Research Network. Nature 474,
609–615 (2011).
7. Cancer Genome Atlas Research Network. N. Engl. J.
Med. 368, 2059–2074 (2013).
8. Cancer Genome Atlas Research Network. Nature 497,
67–73 (2013).
9. Cancer Genome Atlas Network. Nature 490, 61–70
(2012).
10.Cancer Genome Atlas Research Network. Nature 489,
519–525 (2012).
11.Cancer Genome Atlas Research Network. Nature 455,
1061–1068 (2008).
12.Cancer Genome Atlas Network. Nature 487, 330–337
(2012).
13.Dees, N.D. et al. Genome Res. 22, 1589–1598
(2012).
14.Bilal, E. et al. PLOS Comput. Biol. 9, e1003047
(2013).
15.Shi, L. et al. Nat. Biotechnol. 28, 827–838 (2010).
16.Margolin, A.A. et al. Sci. Transl. Med. 5, 181re1
(2013).
17.Saito, R. et al. Nat. Methods 9, 1069–1076 (2012).
18.Kelder, T. et al. PLoS ONE 4, e6447 (2009).
19.Benkler, Y. Yale Law J. 114, 273–358 (2005).
20.Kolata, G. New York Times (12 August 2010).
21.Zack, T.I. et al. Nat. Genet. doi:10.1038/ng.2760
(26 October 2013).
22.Lawrence, M.S. et al Nature 499, 214–218 (2013).
23.Li, J. et al. Nat. Meth. doi:10.1038/nmeth.2650
(15 October 2013).
volume 45 | NUMBER 10 | OCTOBER 2013 | nature genetics


© Copyright 2026