
Effects of Pressurization on Structure, Water
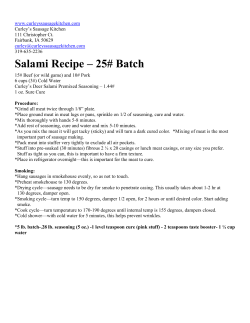
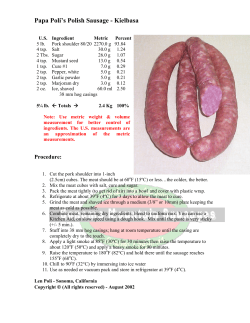
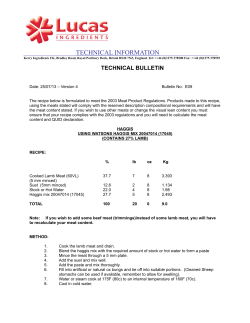
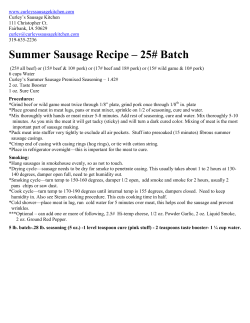
Effects of Pressurization on Structure, Water Distribution, and
Sensory Attributes of Cured Ham: Can Pressurization Reduce
the Crucial Sodium Content?
HANNE CHRISTINE BERTRAM,*,† ZHIYUN WU,† IDA K. STRAADT,†
MICHAEL AAGAARD,§ AND MARGIT DALL AASLYNG#
Department of Food Science, Danish Institute of Agricultural Sciences, Box 50, DK-8830 Tjele,
Denmark; Tulip Food Company, Tulipvej 10, DK-7100 Vejle, Denmark; and Department of Pork and
Beef Quality, Danish Meat Research Institute, Maglegaardsvej 2, DK-4000 Roskilde, Denmark
This study investigated the replacement of tumbling (intermittent vacuum tumbling for 6 h) with pressure
treatment (7 MPa for 4 s) in the production of a cured ham product with the aim of elucidating if the
pressure treatment could reduce the amount of salt added to obtain a satisfactory product. Confocal
laser scanning microscopy (CLSM) revealed a pressure-induced loosening of the meat structure,
and proton nuclear magnetic resonance (NMR) relaxometry revealed that this structural modification
of the meat had an impact on water properties and water distribution in both cooked and cooked/
fried products. Three salt levels (0.6, 1.1, and 1.7% w/w) were investigated, and sensory profiling
revealed that the pressured-cooked meat obtained a significantly higher juiciness score at low and
medium salt levels. In addition, sensory profiling assessments revealed that at the lowest salt
concentration the pressured product was perceived to be saltier compared with the tumbled product;
however, the difference was not significant and was absent upon frying. In contrast, in sensory time
intensity analysis the maximum intensity and the total salt taste were significantly higher in the
pressured samples at the low and medium salt levels in the cooked samples. In conclusion, the
present study showed strong evidence that the structure and biophysical characteristics of cured
ham is altered by pressurization and suggested that pressurization may reduce the critical amount of
salt required in a ham product.
KEYWORDS: NMR; T2 relaxation; CLSM; confocal microscopy; meat quality; pressure treatment; high
pressure; pork; salt; curing; tumbling
INTRODUCTION
In recent years the focus on sodium intake has increased
dramatically. Animal and human studies have indicated a
relationship between sodium intake and blood pressure (1, 2),
and high blood pressure is known to be a risk factor for the
development of cardiovascular diseases (3, 4). Accordingly,
guidelines for sodium intake have been put forward (5), and
the food industry is interested in developing new products with
low sodium content to fulfill the dietary recommendations. A
requirement for this is an understanding of the basic structure
of the food items and the interactions with the sodium ions.
Cured ham is a low-fat product; however, a drawback is that it
contains a relatively high amount of sodium.
Several investigations on high-pressure treatment of meat exist
(6), and major changes in meat texture as a result of pressuriza-
tion of meat are reported (7-9). Effects of pressurization on
the denaturation of myosin and actin (10, 11) and the characteristics of titin (12, 13) have been demonstrated. Using NMR
microimaging, alterations in water characteristics due to pressurization of meat have also been shown (14). Moreover, an
early study reported the sensory properties of pressured meat
to be quite different, especially with regard to juiciness (15).
During the curing of meat the salt binds additional water and
thereby affects the juiciness of the meat. However, as pressurization seems to affect the water characteristics and juiciness
of the meat, pressurization could also be expected to affect the
relationship between added sodium and how juicy cured meat
is being perceived. The aim of the present study was to
investigate the effects of a pressure treatment on meat structure,
water distribution, and sensory attributes of a cured, fried ham
product using confocal laser scanning microscopy (CLSM) and
proton nuclear magnetic resonance (NMR) relaxometry to
elucidate if the sodium content of a cured product can be reduced
if the tumbling procedure is replaced by a pressure treatment.
MATERIALS AND METHODS
Animals and Sampling Procedure. A total of 18 female slaughter
pigs were included in the study. The pigs were chosen at random at
the slaughter line with a hot carcass weight between 74 and 79 kg, an
average meat content between 57 and 61% [Commission Regulation
(EC) 3127/94], and pHu in both thighs between 5.50 and 5.60. The
day after slaughter left and right m. semimembranosus were excised.
The animals were randomly divided into three treatment groups with
six animals in each: low (0.6%), medium (1.1%). and high (1.7%)
salt concentration.
Processing. All muscles were cured using multineedle injection to
a weight gain of approximately 10%. The pressure of the injection was
1.1 bar, and the speed was 85-90 strokes/min. The composition of
the brines was optimized in preliminary investigations to give a final
yield of 85% and consisted of 7, 14, and 20% (w/w) curing salt (0.6%
nitrite in NaCl) resulting in a final salt concentration in the product of
0.6% (low), 1.1% (medium), and 1.7% (high), respectively. A salt level
of 1.7% corresponds to the level in a standard commercial ham product,
which was the rationale for the choice of salt levels. Subsequently,
one muscle semimembranosus from each animal was pressured.
Pressure treatment was carried out across the fiber direction using a
manual mechanical pressurizer (in-house made), and when a pressure
of 7 MPa was obtained, the pressure was kept for 4 s, resulting in a
total treatment time of approximately 10-12 s. The other muscle
semimembranosus from each animal was intermittently vacuum-tumbled
for 6 h using a speed of 6 revolutions/min. Next the muscles were
cooked at 78 °C to an internal temperature of 72 °C in a cooking cabinet
(Danfotech, Aalborg, Denmark), and after cooling to room temperature,
the muscles were shreded into strips with a length of
5-8 cm and a cross-sectional area of 1 × 1 cm. Half of the strips
from each muscle were fried (Phillips Comfort Plus, Phillips, The
Netherlands) in grapeseed oil (FoodLine, Denmark) at 175 °C for
1.5 min. Meat strips for sensory analysis were packed in 80% N2/20%
CO2 using oxygen impermeable bags, whereas strips for chemical
analyses, NMR, and CLSM measurements were vacuum-packed using
oxygen impermeable bags (oxygen permeability < 3 cm3/m2/24 h/atm).
All samples were stored at 4 °C until further analysis.
Chemical Analyses. The total water content of the cooked meat
samples was determined according to a gravimetric analysis by drying
the meat in an oven at 102-105 °C until a constant weight was reached.
Salt content (Cl-) was determined according to a potentiometric titration
using an ABU90 autoburette (Radiometer, Copenhagen, Denmark) and
a titration manager TI900 (Radiometer). The sample was extracted with
hot, basic buffer solution. Proteins were precipitated, and the solution
was filtrated. Nitric acid was added, and the content was determined
by a potentiometric end point titration with silver nitrate (ABU 901
autoburette and TIM 900 titration manager, Radiometer).
NMR Measurements. Water distribution in a total of 96 cooked
and fried meat samples was examined using 1H NMR relaxometry.
The NMR relaxation measurements were performed on a Maran
Benchtop Pulsed NMR Analyzer (Resonance Instruments, Witney,
U.K.) with a resonance frequency for protons of 23.2 MHz. The NMR
instrument was equipped with an 18 mm variable-temperature probe.
The meat strips were cut and placed in cylindrical glass tubes for the
NMR measurements and tempered in a 25 °C water bath for 1520 min prior to measurement. Transverse relaxation, T2, was measured
using the Carr-Purcell-Meiboom-Gill sequence (CPMG). The T2
measurements were performed with a τ value (time between 90° pulse
and 180° pulse) of 150 µs. The 90° and 180° pulses were 8.2 and 16.4,
respectively. The repetition time between two scans was 3 s. Data from
4096 echoes were acquired as 16 scan repetitions, with 1 dummy scan.
Only data from even-numbered echoes were used in further data analysis
to avoid the influence of imperfect pulse settings. The obtained T2
relaxation decays were analyzed using distributed exponential fitting
analysis (16) using in-house-made scripts in Matlab.
CLSM. Cooked and fried meat samples were examined with CLSM
at two different salt concentrations: 0.6 and 1.7%. Thick transverse
sections (slice thickness ∼ 1 mm) were sliced free-hand with a scalpel
from the cooked and the fried meat samples. The samples were placed
in a 24-well microtiter frame and were covered with Alexa Fluor 488
phalloidin (0.22 µM) in PBS buffer (pH 7.2) for a minimum of
20 min. Subsequently, the samples were mounted on microscope glass
slides and covered with coverslips. The samples were examined with
a laser scanning confocal fluorescence microscope (Bio-Rad Radiance
2100, AGR-3Q AOTF, Hertfordshire, U.K.), attached to a Nikon Eclipse
E800 upright microscope. The argon laser beam was set at 488 nm
excitation and 500 nm long-pass emission filter. The images were
acquired with 10× (0.45 NA, Nikon Plan Apo) and 60× (1.20 NA,
WI Plan Apo, water immersion) objectives, and only samples with a
proper transverse cut were examined further. Z-series of images of
representative areas were collected, restored, and projected using the
software LaserSharp2000 (Bio-Rad, Hermel Hempstead, U.K.), and the
images were further processed with the software LaserPix 2000 (BioRad, Hermel Hempstead, U.K.).
Sensory Analyses. A trained sensory panel consisting of nine
assessorssone male and eight femalesswas used. All assessors came
from the area around Roskilde and were familiar with pork assessments.
Two sensory sessions were carried out, one on cooked samples and
one on fried samples. The following attributes were assessed in a
profiling analysis: salt taste, juiciness, and tenderness. The scale was
a 15-point nonstructured line anchored at the extremes (0 ) slight and
15 ) intense). The profiling analysis was followed by a time intensity
analysis assessing salt taste in 60 s on a 15 cm nonstructured line scale.
The position was logged every 2 s. The assessors were instructed to
chew at their own speed and to end the assessment when they found
the sample to be ready for swallowing. The data were collected in FIZZ
Biosystems (ver 2.10H, Counternon, France) and the following
parameters calculated: maximal intensity (Imax), area under the increasing phase (area Inc), area under the plateau phase (area Pl), area under
the decreasing phase (area Dec), and total area (area Tot).
Statistics. Principal component analysis (PCA) was performed on
the obtained T2 relaxation decays using the Unscrambler software vers.
9.2 (CAMO, Trondheim, Norway). PCA is a descriptive method, which
allows the main variability aspects of a data set to be visualized without
the constraint of an initial hypothesis concerning the relationship
between samples and between samples and variables. The analysis aims
at finding relationships between the different parameters (samples and
variables) and displaying possible clusters within samples and/or
variables. The data are arranged in a matrix, X(n,m). To find the main
sources of data variability and the relationship between or within
samples and variables, the data are decomposed into a few orthogonal
principal components by a least-squares method. The decomposition
is formulated by eq 1
X(n,m) ) T(n,k)P(k,m)T + E(n,m)
(1)
where T is the sample-score matrix, P is the variable-loading matrix,
E is the error or residual matrix, n is the number of samples, m is the
number of variables, and k is the number of principal components.
Statistics were performed using the SAS system 9.1 (SAS Institute,
Cary, NC). To analyze the statistical differences between treatments,
an analysis of variance model was used (PROC Mixed) including the
fixed effect of treatment (tumbling versus pressurization) and salt level
(low, medium, high) and the interaction between these and for the
chemical data animal as random effect. Moreover, assessor and the
interactions between assessor and salt level, assessor, and treatment
and the three-way interaction between these were included as random
effects.
RESULTS
Cooking Loss and Salt and Water Contents. Cooking loss
for the different combinations of salt and treatment is given in
Table 1. Cooking loss decreased with increasing salt concentration and was significantly higher in pressured samples compared
with tumbled samples. Tables 2 and 3 show the NaCl and water
contents in the cooked samples. At the low and medium salt
levels an identical salt concentration was obtained in pressured
and tumbled samples, whereas at the high salt concentration
the salt level was significantly lower in pressured samples
Table 1. Cooking Loss (Percent) as a Function of Salt Levela
tumbling
pressurization
a
low
medium
high
SE
23.0a
24.3b
18.3c
22.2b
13.0d
19.7c
0.5
0.5
Different letters indicate significant differences (P < 0.05).
Table 2. NaCl Content (Percent w/w) in the Cooked Samples as a
Function of Salt Levela
tumbling
pressurization
a
low
medium
high
SE
0.60a
0.62a
1.14b
1.07b
1.89c
1.66d
0.04
0.04
Different letters indicate significant differences (P < 0.05).
Table 3. Water Content (Percent w/w) in the Cooked Samples as a
Function of Salt Levela
tumbling
pressurization
a
low
medium
high
SE
69.2b
67.8a
69.7b
68.0a
71.08c
69.3b
0.3
0.3
Different letters indicate significant differences (P < 0.05).
compared with tumbled samples. The water content was
generally lower in pressured samples compared with tumbled
samples, which can be ascribed to a higher cooking loss in
pressured samples.
1H NMR Measurements. Figure 1 displays PCA score plots
for low, medium, and high salt concentrations (panels A, B,
and C, respectively). Independent of salt concentration, the
samples are strongly discriminated into cooked and fried samples
in the score plot, whereas a grouping according to tumbling
and pressurization also is observed. Figure 2 shows distributed
T2 relaxation times for the tumbled and pressured samples after
only cooking and after cooking and frying in samples with low
and high salt concentrations (panels A and B, respectively). In
the cooked meat a pronounced difference is observed in the
water distribution between tumbled and pressured meat as
pressured meat is characterized by a much broader distribution
of relaxation times compared with tumbled meat. Frying causes
a shift toward lower relaxation times, and fried samples are
characterized by narrower populations; the difference in water
distribution between tumbled and pressured meat is less evident
upon frying.
CLSM Examinations. CLSM images of cooked tumbled and
pressured meat with low salt concentration are displayed in
Figure 3. The CLSM images reveal a much looser and more
open meat structure in pressured meat compared with tumbled
meat, causing the distance between adjacent fibers to be bigger
in pressured than in tumbled meat, and this effect was observed
for all salt levels (data not shown). The looser structure in
pressured meat was also evident by a better penetration of the
phalloidin dye, causing a greater staining intensity of this meat
compared with tumbled meat.
Sensory Analyses. Figure 4 shows the assessed salt taste in
the meat as a function of salt concentration. In cooked meat
and at the lowest salt concentration the pressured meat attained
a higher score in salt taste than the tumbled meat; however, the
difference was not statistically significant (Figure 4A). At the
medium salt concentration the two treatment groups attained
identical scores for salt taste, whereas for the highest salt
concentration the pressured meat was characterized by a lower
salt taste score, which probably can be ascribed to the lower
Figure 1. PCA score plot showing the two first principal components for
(A) low-salt samples, (B) medium-salt samples, and (C) high-salt samples.
salt concentration for this group compared with tumbled meat
at same high salt concentration (Table 2). In the fried meat a
pattern equivalent to that for cooked meat was observed (Figure
4B). In cooked meat the salt taste increased significantly with
increasing salt concentration, and an increase in salt taste with
increasing salt concentration was also observed in the fried meat;
however, the difference in salt taste between low and medium
salt concentrations was not statistically significant.
Figure 5 shows the assessed juiciness in the meat as a
function of salt concentration. For cooked meat at low and
medium salt concentrations the pressured samples attained a
significantly higher juiciness score compared with the tumbled
samples (Figure 5A). In the fried meat no significant difference
in juiciness was observed between the two treatments at the
Figure 4. Salt taste as a function of salt level as assessed by the sensory
panel: (A) cooked product; (B) cooked and fried product. Letters a−d
indicate significant differences.
Figure 2. Average distributions of T2 relaxation times for the four
combinations of tumbling, pressurization, cooking, and frying for (A) lowsalt samples and (B) high-salt samples.
5B). Figure 6 shows the assessed tenderness in the meat as a
function of salt concentration. Tumbled meat attained a significantly higher tenderness score compared with pressured
meat; however, in the fried meat an interaction between
treatment and salt concentration was observed.
Table 4 shows the time intensity parameters. As can be seen,
the Imax is assessed higher in the pressured meat compared with
the tumbled meat. The total area under the curve expresses the
total salt experience during chewing. There was a tendency to
a significant interaction between treatment and salt level in the
cooked samples (P ) 0.08) as the area was higher in the
pressured meat for the low and medium salt levels, but not at
the high salt level. As for the sensory attributes, the differences
were more pronounced in the cooked samples compared with
the fried samples.
DISCUSSION
Figure 3. CLSM images of transverse sections of cooked ham (A) tumbled
meat, 10× magnification; (B) pressured meat, 10× magnification; (C)
tumbled meat, 60× magnification; and (D) pressured meat, 60× magnification.
low and medium salt concentrations; however, at the highest
salt concentration the tumbled meat attained a significantly
higher juiciness score compared with pressured meat (Figure
Sodium intake is gathering increasing attention, and there is
an increasing demand for the food industry to develop lowsodium products. Pressure treatment has been put forward to
be the most important emerging technology with applications
relevant to meat processing (17), and several investigations on
the impact of various pressure applications on the structure and
biophysical properties of muscle foods have been reported (713). However, in the present study it was for the first time
investigated if pressurization of a ham product potentially can
reduce the need for sodium in the product. Three salt levels
were investigated; the highest concentration corresponds to the
level in a traditional commercial ham product. Low-field 1H
NMR relaxometry revealed pronounced effects of pressurization
on the T2 relaxation time in the cooked and fried product
Table 4. Time Intensity Parameters in the Cooked and Fried Samples
as a Function of Treatment and Salt Levela
tumbled
cooked
Imax
area Inc
area Pl
area Dec
area Tot
fried
Imax
area Inc
area Pl
area Dec
area Tot
a
Figure 5. Juiciness as a function of salt level as assessed by the sensory
panel: (A) cooked product; (B) cooked and fried product. Letters a−d
indicate significant differences.
Figure 6. Tenderness as a function of salt level as assessed by the
sensory panel: (A) cooked product; (B) cooked and fried product. Letters
a−d indicate significant differences.
(Figures 1 and 2), which implies altered water distribution upon
pressurization. Upon pressurization the T2 relaxation times were
characterized by much broader distributions, which probably
can be ascribed to a larger spatial variation in protein structures
pressure
low
medium
high
low
medium
high
3.8d
39.9c
11.0c
39.4b
89.9c
6.3c
66.8c
18.3bc
79.2b
167.3c
11.9a
126.7a
67.4a
259.9a
454.3a
5.3c
47.3c
16.2bc
55.4b
117.8c
8.3b
86.5b
41.9abc
109.5b
242.1b
11.5a
136.7a
51.9ab
235.3a
430.5a
3.0d
31.0b
6.2c
25.9b
62.6c
6.0c
58.0b
29.3bc
62.4b
159.5c
11.6a
122.1a
81.8a
202.1a
422.1a
4.2c
36.8b
11.7bc
37.6b
86.1c
5.7c
52.1b
22.0bc
56.8b
133.0c
9.9b
114.5a
59.4b
143.5a
317.9b
Different letters indicate significant differences (P < 0.05).
(18). A previous MRI study investigating the effect of high
pressurization (300 MPa) of beef likewise observed effects on
the T2 relaxation times and thereby water properties in the meat
(14). Accordingly, evidence exists that pressurization of meat
changes the interactions between the muscle proteins and water
molecules. In the present study high-resolution CLSM images
were also obtained on meat samples using minimal sample
preparation and no prior fixation, thereby minimizing the
introduction of artifacts. The CLSM examinations revealed that
this can be ascribed to the fact that pressurization causes a
loosening and opening of the meat structure (Figure 3), which
has also been observed in an earlier study using immunoelectron
microscopy (13). Hence, the CLSM results comply with the
observed broadening of the T2 distribution in this meat, which
in association with the Brownstein-Tarr theory (19) would
correspond to a wider range of distances between water
molecules and protein protons. Consequently, the NMR and
CLSM examinations revealed that pressurization causes a
loosening of the meat protein matrix with concomitant changes
of the interactions between muscle proteins and water molecules
and thereby alterations in the water distribution in the meat. To
investigate if this structural modification also affects the
properties of added salt and the general sensory attributes of
the meat product, sensory assessments were also included in
the present study. Three salt levels were investigated, and in
cooked meat at the lowest salt concentration the pressured meat
was actually perceived to be saltier than the corresponding
tumbled meat; nevertheless, the difference was not statistically
different in the sensory profile (Figure 4). In contrast, in the
time intensity analysis, which had a special focus on the salt
taste, the maximum intensity and the total area were significantly
higher in the pressured samples at the low and medium salt
levels in the cooked samples (Table 4). In addition, if the cooked
meat was subsequently fried, pressurization could not enhance
the salt taste. However, noteworthy for cooked samples the
pressurized meat was perceived to be significantly juicier
compared with the tumbled meat at low and medium salt
concentrations (Figure 5). This positive effect of pressurization
on juiciness is in agreement with an earlier investigation (13)
and reveals that the pressure-induced alteration in meat structure
and water distribution is affecting how juicy the meat is being
perceived during consumption. The tenderness of the meat
products was also affected, as pressured meat was perceived to
be significantly less tender than tumbled meat. Sensory studies
on sausages and fish fillets pressured at 500 MPa have reported
improved texture of the pressured products compared with the
control products (20, 21). In contrast, at lower pressure levels
studies have reported a lack of tenderizing effects of pressurization in beef (8, 22), which is consistent with the findings in the
present study.
In conclusion, the present study demonstrated that pressurization of meat alters meat structure and water distribution in
cooked ham. The pressure treatment improved the juiciness of
low- and medium-salted products when compared with tumbled
products. However, even though the pressured ham product at
a low salt level was perceived to be saltier than the corresponding tumbled product, no significant change in salt taste in a
sensory profiling was obtained using pressurization. In contrast,
in sensory time intensity analysis the maximum intensity and
the total salt taste were significantly higher in the pressured
samples at the low and medium salt levels in the cooked
samples. Therefore, it remains uncertain if the used pressurization technique enables a reduction in the critical amount of salt
required in a ham product, and supplementary studies are
needed. In addition, studies attempting to find other alternatives
for sodium reduction and/or replacement in ham products could
be of great interest.
ACKNOWLEDGMENT
We thank Maiken Baltzer, Ann-Britt Frøstrup, and Jonna
Andersen for technical assistance.
LITERATURE CITED
(1) Tobian, L. Salt and hypertension: lessons from animal models
that relate to human hypertension. Hypertension 1991, 17, 5258.
(2) Froment, A.; Milon, H.; Gravier, C. Relationship of sodium intake and arterial hypertension. Contribution of geographical epidemiology. ReV. Epidemiol. Sante Publique 1979, 27, 437-454.
(3) Kannel, W. B. Blood pressure as a cardiovascular risk factor.
JAMA-J. Am. Med. Assoc. 1996, 275, 1571-1576.
(4) Stamler, J.; Stamler, R.; Neaton, J. D. Blood pressure, systolic
and diastolic, and cardiovascular risks: U.S. population data.
Arch. Intern. Med. 1993, 152, 598-615.
(5) Loria, C. M.; Obarzanek, E.; Ernst, N. D. Choose and prepare
foods with less salt: dietary advice for all Americans. J. Nutr.
2001, 131, 536-551.
(6) Cheftel, J. C.; Culioli, J. Effects of high pressure on meat: a
review. Meat Sci. 1997, 46, 211-236.
(7) Bouton, P. E.; Harris, P. V.; Macfarlane, J. J.; O’Shea, J. M.
Effect of pressure treatment on the mechanical properties of preand post rigor meat. Meat Sci. 1977, 1, 307-318.
(8) Macfarlane, J. J.; McKenzie, I. J.; Turner, R. H.; Jones, P. N.
Pressure treatment of meat: effects on thermal transitions and
shear values. Meat Sci. 1981, 5, 307-317.
(9) Macfarlane, J. J.; McKenzie, I. J.; Turner, R. H. Pressure-heat
treatment of meat: changes in myofibrillar proteins and ultrastructure. Meat Sci. 1986, 17, 161-176.
(10) Lee, E. J.; Kim, Y. J.; Kim, Y. H.; Seo, E. J.; Yamamoto, K.
Effects of hydrostatic pressure on biochemical characteristics of
myofibrillar protein extracted from bovine semitendinosus
muscle. Food Sci. Biotechnol. 2004, 13, 632-635.
(11) Zamri, A. I.; Ledward, D. A.; Frazier, R. A. Effect of combined
heat and high-pressure treatments on the texture of chicken breast
muscle (Pectoralis fundus). J. Agric. Food Chem. 2006, 54,
2992-2996.
(12) Kim, K.; Homma, Y.; Ikeuchi, Y.; Suzuki, A. Effect of high
hydrostatic pressure on the conversion of R-connectin to β-connectin. J. Biochem. 1993, 114, 463-467.
(13) Suzuki, A.; Homma, Y.; Kim, K.; Ikeuchi, Y.; Sugiyama, T.;
Saito, M. Pressure-induced changes in the connection/titin
localization in the myofibrills revealed by immunoelectron
microscopy. Meat Sci. 2001, 59, 193-197.
(14) Bertram, H. C.; Whittaker, A. K.; Shorthose, R.; Andersen, H.
J.; Karlsson, A. H. Water characteristics in cooked beef as
influenced by ageing and high-pressure treatmentsan NMR
micro imaging study. Meat Sci. 2004, 66, 301-306.
(15) Ratcliff, D.; Bouton, P. E.; Ford, A. L.; Harris, P. V.; Macfarlane,
J. J.; O’Shea, J. M. Pressure-heat treatment of post-rigor
muscle: objective-subjective measurements. J. Food Sci. 1977,
42, 857-859.
(16) Menon, R. S.; Rusinko, M. S.; Allen, P. S. Multiexponential
proton relaxation in model cellular systems. Magn. Reson. Med.
1991, 20, 196-213.
(17) Jime´nez-Colmenero, F.; Borderias, A. J. High-pressure processing
of myosystems. Uncertainties in methodology and their consequences for evaluation of results. Eur. Food Res. Technol. 2003,
217, 461-465.
(18) Bertram, H. C.; Wu, Z.; van den Berg, F.; Andersen, H. J. NMR
relaxometry and differential scanning calorimetry during meat
cooking. Meat Sci. 2006, 74, 684-689.
(19) Brownstein, K. R.; Tarr, C. E. Importance of classical diffusion
in NMR studies of water in biological cells. Phys. ReV. A 1979,
19, 2446-2453.
(20) Mor-Mur, M.; Yuste, J. High pressure processing applied to
cooked sausage manufacture: physical properties and sensory
analysis. Meat Sci. 2003, 1187-1191.
(21) Cheret, R.; Chapleau, M.; Delbarre-Ladrat, C.; Verrez-Bagnis,
V.; De Lamballerie, M. Effects of high pressure on texture and
microstructure of sea bass (Dicentrarchus labrax L.) fillets. J.
Food Sci. 2005, 70, 477-483.
(22) Bouton, P. E.; Ford, A. L.; Harris, P. V.; Macfarlane, J. J.; Oshea,
J. M. Pressure-heat treatment of post-rigor muscleseffects on
tenderness. J. Food Sci. 1977, 42, 132-135.
Received for review July 14, 2006. Revised manuscript received
September 27, 2006. Accepted October 21, 2006. We thank the Danish
Ministry of Food, Agriculture and Fisheries for funding the project
“Characterization of technological and sensory quality in foods” and
the Danish Meat and Bacon Council for funding the project “Processinduced structural changes in muscle proteins of importance for
functional properties of meat” through which the presented data have
been obtained and analyzed.
JF061966I


© Copyright 2026