
Global Views 01-23
Global Views January 23, 2015 Weekly commentary on economic and financial market developments Economics Corporate Bond Research Emerging Markets Strategy Fixed Income Research Fixed Income Strategy Foreign Exchange Strategy Portfolio Strategy Contact Us Economics Greece Versus The Fed Forecasts & Data 2-5 Derek Holt What’s Next For The Bank Of Canada? 6-7 Derek Holt Greece Likely To Elect A Syriza Government; But Won’t Leave The 8-9 Euro Zone. Erika Cain, Frédéric Prêtet and Colin White Global Car Sales Rev Up In December Trinidad & Tobago Face Near-Term Headwinds From Lower Energy Key Indicators A3-A5 Global Auctions Calendar A6 Events Calendar A7 Global Central Bank Watch A8 Forecasts A9 Latest Financial Statistics A10-A11 A12 11 Prices This Week’s Featured Chart Rory Johnston and Neil Shankar Eurozone Quantitative Easing Fixed Income Strategy A1-A2 Latest Economic Statistics 10 Carlos Gomes Key Data Preview European Central Bank January Meeting Frédéric Prêtet 80 12 70 Central Bank Assets, % of GDP 60 50 Bank of Japan 40 European Central Bank 30 20 10 Federal Reserve 0 08 09 10 11 12 13 14 15 16 Source: Scotiabank Economics, Federal Reserve, Bank of Japan, European Central Bank. Global Views is available on scotiabank.com, Bloomberg at SCOT and Reuters at SM1C January 23, 2015 Economics Global Views THE WEEK AHEAD Derek Holt 416.863.7707 [email protected] Greece Versus The Fed Please see our full indicator, central bank, auction and event calendars on pp. A3-A8. United States — Fed To Stay The Course? The Federal Reserve’s policy statement will clearly be the show stealer next week, but some competition will come from Q4 GDP and earnings releases from almost one-third of the companies listed on the S&P500 index that will shape the market tone for the I-T sector among others. I think the FOMC will generally stay the course and continue to signal rate hikes by mid-year in next week’s statement-only affair at 2pmET on Wednesday. A clear risk concerns developments in Greek elections that may cloud this FOMC meeting more so than the next one on March 18th. Recall that timing was a matter left to Chair Yellen’s press conference in December when she said that rate hikes were unlikely “for at least the next couple of meetings.” There is no press conference this time and I’d doubt a statement-codified approach to changing this guidance next week. Instead, look for a repeat of language like the Fed “can be patient in beginning to normalize the stance of monetary policy” and simultaneous “considerable time” references. If so, that would probably lessen the odds of an April hike but keep June alive. Other key factors include how the Fed is looking at the USD and inflation expectations. Please go here for our focused thoughts on both of these issues. In short, I would look for the Fed to repeat guidance that “Market-based measures of inflation compensation have declined somewhat further; survey-based measures of longer-term inflation expectations have remained stable.” The above-noted paper we did on this includes a variety of the sort of measures of inflation expectations that we think the Fed is considering. Fed's Own Dollar Index Has Risen By Less 110 105 Jan. 07 = 100 Bloomberg Spot Dollar Index 100 95 I would also be rather surprised to see an explicit dollar comment 90 in the statement given the Fed’s tendency to avoid directly commenting on it and the sensitivities with the Treasury in this regard. When the Fed 85 Fed Broad has addressed the currency, it has emphasized its own broad-dollar Dollar Index index that is trade-weighted and expressed in inflation-adjusted terms 80 adjusted for relative rates of inflation at home and abroad. This measure 07 08 09 10 11 12 13 14 15 Source: Scotiabank Economics, Bloomberg. has appreciated by considerably less than other measures such as the euro-dominated DXY or Bloomberg’s spot dollar index (chart 1). The Fed’s measure is superior because it trade-weights a broad basket of currencies and adjusts for relative rates of inflation which combines to give a more accurate measure of trade competitiveness than a measure that only considers changes in nominal rates of exchange versus the greenback. The Fed’s measure has appreciated by less than 15% since 2011 and this measure is best correlated with changes in the current account balance of the US economy (as a % of GDP) with a four year lag. Modest appreciation, with the effects spread over multiple years in an economy that is half as reliant upon trade as Europe or China isn’t enough in our view to truly spook the Fed. In fact, it’s possible that the Fed views currency strength as occurring for the right reasons as a reflection of solid economic growth in anticipation of Fed rate hikes, as opposed to applying incrementally more serious tightening conditions on the US economy. As a final caution I’d add some unease over the very consensus view that the USD will keep on appreciating versus crosses like the euro and end much stronger by year end. There is a reasonable story to tell in this regard, but that reasonable consensus story has existed in the past and many forecast pundits have proven completely and utterly befuddled in efforts to forecast the euro. USD appreciation is a very crowded trade. Everyone believes it. I can’t recall the last time I met someone who thought otherwise! To those of us who forecast things for at least part of our living, that should be a bit of a warning sign. Didn’t we learn from crowded trades into early last year when net short 2 Economics January 23, 2015 Global Views THE WEEK AHEAD Derek Holt 416.863.7707 [email protected] … continued from previous page positions were expecting cheaper Treasuries? It may be that we’re all at the same side of the boat peering into the water again, waiting to be hit by a wave from the other side of the ship that flips it. The economic story for something very different could be that Eurozone inflation will recover into year-end and next year as the base effects of cheaper oil shake out. Eurozone growth will get a lift from lower oil, lower bond yields, and euro depreciation to date and perhaps lessened fiscal drag. If Eurozone growth and inflation improve then this may drive euro strength at the margin. That risks driving frenzied short-covering — like in last year’s Treasury market — and a significant reversal higher in the euro as a one-way bet by market participants causes them to reverse course in a hurry. As for further colour on how the Fed views international risks, we’re uncertain but err closer to the side of seeing optimism going forward. Some argue that if other central banks like the ECB and BoC are adding stimulus, the BoE is delaying hikes, and the BoJ is expected to do more, then that complicates the Fed’s exit strategy. What this view may be overly discounting is that more aggressive action by foreign central banks may be interpreted optimistically by the Fed as evidence that its counterparts are addressing risks in their own markets and in a way that lessens foreign sector risks in a one– to two-year outlook. Indeed you could argue that recent ECB actions in particular actually raise the odds of Fed hikes sooner rather than later because they lessen foreign risks and have added further stimulus to the US economy via highly correlated global bond market rallies. After all, if the Fed thought that a rate hike by mid-year was appropriate in December, when the 10-year was bouncing between a yield of 2.25% and 2.5%, how much more so is a rate hike appropriate now given the low level of term premia? To a data dependent Fed, clearly the tone to key releases will also matter next week. Indeed, no sooner than the ink is dry on the Fed’s latest pontifications will fresh data begin the reshape the risks on the path toward the next FOMC meeting on March 18th. That’s because the week’s key data release will be Q4 GDP on Friday. Consensus thinks the economy grew by 3.1% at an annualized rate in the final quarter of the year. If that comes true, then it would cement a very good string of growth figures for the US economy in — at a minimum — temporary defiance of ‘new normal’ talk. Recall that the economy grew by 4.6% in Q2 and 5% in Q3. The Q2 acceleration was partly explainable by deferred activity from Q1 when the economy shrank by 2.1% significantly due to weather disruptions. But the fact that strong momentum has been maintained over each of Q2, Q3 and hopefully Q4 is something that the bears should be finding increasingly difficult to simply talk though as if it hasn’t happened. The day before the FOMC statement, watch for four debates within the macro picture to be further informed. Will durable goods orders continue a weak trend since August or end it with some upside as consensus expects? More important will be core capital goods orders (ex-defence and ex-air) that are less volatile and more in line with trend growth in business investment. S&P Case Shiller house prices are expected to rise for the third straight month after falling for four. New home sales are expected to rise after two weak months. More important is that this lagging December data could well face a more encouraging outlook given the recent acceleration in mortgage purchase applications this month and in response to the sharp drop in the 30 year fixed mortgage rate. These are among the developments that are expected to drive the Conference Board’s consumer confidence index to its strongest reading since the Fall of 2007. It’s my firm belief that the markets are not letting much of the data do the talking here, and that could well work to their peril in timing the next steps for a data dependent Fed. Apart from Tuesday, limited data risk will be presented in Thursday’s pending home sales print. Be a little forgiving if you see your normally friendly equity analyst looking a tad sleep-deprived next week. Earnings season kicks it up a notch with no fewer than 143 companies listed on the S&P500 scheduled to report. Some of the big names include Apple, Microsoft, Facebook, Amazon, Google, Yahoo, Pfizer, P&G, Caterpillar (also useful for big ticket economy-wide cap-ex guidance), AT&T, 3M, Lockheed Martin, du Pont, Boeing, Colgate-Palmolive, Time Warner, Dow Chemical, Ford, Visa, Mastercard, Xerox and Whirlpool. The Treasury auctions two year floating rate notes (FRNs) on Tuesday, in addition to normally scheduled auctions for 2s, 5s and 7s. 3 Economics January 23, 2015 Global Views THE WEEK AHEAD Derek Holt 416.863.7707 [email protected] … continued from previous page Europe — Greek Election Results May Be Just The Beginning Sunday’s election in Greece may quickly make risk markets forget all about the ECB depending upon the outcome and then the aftermath. Markets will begin to know the results once polls shut and advance results start to trickle out beginning about noon eastern time on Sunday. The results will therefore fully factor into the Asian market open to kick off the week. The opposition Syriza party led by Alexis Tsipras continues to lead in the polls, but may well not win a majority on its own. The freshest poll shows Syriza in the lead with a projected 32.5% of the vote versus 26.5% for the governing New Democracy Party. If neither main party wins a majority on its own, then it must form a coalition with someone else. If Syriza leads the vote tally but fails to form a majority or a coalition, then the governing New Democracy Party would likely have the opportunity to form a coalition. Failing that, another round of Greek elections may be required sometime over the next month or two. That then seriously jeopardizes the timeline for funding agreements barring unexpected stop-gap funding measures. That’s because whoever wins will have to get to work very quickly to negotiate a new debt agreement before the existing funding arrangement with the Troika expires by the end of February. If they fail, then Greece’s funding disappears and along with it collateral eligibility in ECB programs. Clearly this would be very bad for Greek debt. Tsipras has promised to write down Greek debt in a violation of existing debt agreements with the Troika (ECB, EC and IMF). ECB buying of Greek bonds depends on whether the government stays the course of debt agreements, and upon when and by how much the ECB’s holdings of Greek debt fall below 33% of the Greek debt market which is the ceiling imposed on any one market’s share by the ECB’s recent announcements (or change the ceiling, I suppose). Tsipras is in a difficult position, having promised to tear up debt agreements but facing an electorate that wants to remain as a member of the Eurozone and retain the euro as its currency. Wildcard risks are high, but many political analysts expect that if Syriza wins, Tsipras’ rhetoric will be reined in lest he risk alienating his loose, highly fragmented coalition’s support and the voting public’s support. Should that happen, it’s not inconceivable that election risk will overhang Greece for an extended period. Another round of Eurozone inflation data will play second fiddle to Greek election risks and takes on less significance in light of the ECB’s €60 billion monthly purchase program that runs to September of next year. That said, German inflation is expected to dip into negative year-ago territory for the first time since October 2009. Tertiary developments will include Q4 GDP figures from the UK and Spain, IFO business sentiment readings, French consumer spending, and German retail sales. BoE Governor Carney speaks in Davos on a panel with BoJ Governor Kuroda and the ECB’s Coeure on “The Global Economic Outlook” and Carney’s remarks may pose risk to gilts and pound sterling. On the effects of lower oil on inflation, Carney recently remarked that “It is appropriate to look through those dynamics at a time when wages are growing and prices are having a one-off level shift.” Canada — If Only It Were November Canada should follow the global tone for much of the week with little on the domestic calendar. A lagging GDP print and a few earnings releases will garner attention. The economy probably posted relatively soft growth in November; however, the data will likely have little market impact. WTI oil entered the month at about US$80 and ended the month at US$66. Since then it has fallen by another $20. Western Canada Select entered November at US$65 and exited at US$48 and now sits at about $33. So first is the obvious point about how risks to the forecasts get reassessed as oil prices continue to fall. Second is that there are lagging influences on the economy stemming from such a large and swift move. These effects are unlikely to have shown up much in November GDP given the oil price correction that began after June and really only accelerated from October onward. 4 Economics January 23, 2015 Global Views THE WEEK AHEAD Derek Holt 416.863.7707 [email protected] … continued from previous page Nevertheless, we still have a duty to speak to what the data risk to the nanosecond’s trade may be, but the usual health warnings on walking forward while looking over your shoulder apply. Here’s our round-up of the influences that have us expecting a flat GDP print on the month. Let’s start with the positives. Retail sales volumes were up 0.8% m/m in November and that may portend a decent gain in the sector’s value-added output. Hours worked also climbed by 0.1% m/m and would suggest a small gain in GDP given that it equals total hours worked in the economy times worker productivity. The rest of the readings were not so good. Manufacturing shipment volumes slid by 1.4% m/m. The trade numbers were a mess with the volume of exports down 1.6%. The volume of imports fell 1.7% m/m which may signal weakness in the domestic economy that pulled in fewer imports. Housing starts climbed by about 6% m/m but home resales were flat in November before falling in December at the fastest pace since August 2012. January is not looking any better — in fact, month-to-date sales in Calgary are down by 35% over the same period in January last year and after falling by a much milder 7.6% y/y in December. The Bank of Canada probably wants a cooler housing market over time but the speed of adjustment may have been a contributing factor behind the central bank’s decision to cut rates. Earnings releases will trickle out over the course of the week with companies like CN Railway, Metro, Rogers, Potash Corp and Canadian Oil Sands on tap. Much of the focus is likely to be upon resource earnings and further potential guidance on earnings risks, cap-ex, production and capital structures. Note that BoC Senior Deputy Governor Carolyn Wilkins had been scheduled to speak in Calgary next Tuesday but her speech has now been delayed until February 10th and she will address the topic of ‘Oil, jobs and growth’. No formal reason for the delay was given. At the time of writing, there are no other public appearances by BoC officials before her speech. Asia — あなたは日本語を話します? Asian markets will be hopping with their own list of market-specific factors, but none of them probably have the ability to challenge the role of the Fed and Greek elections in setting the global market tone. Virtually every Japanese indicator that matters to assessing progress on Abenomics will be released next week. Here’s the list: national CPI; Tokyo CPI (fresher by a month); export growth; retail sales; total household spending; vehicle sales; housing starts; industrial production; and the jobless rate. On top of that there may be additional colour on BoJ sentiments in the release of minutes to the December 18-19 meeting. Firmer growth signaled through retail sales and industrial output will trade off against slightly weaker CPI inflation. Earnings risk will help shape the tone of Asian markets. Included in this category will be that China releases industrial profits at the start of the week. The prior month’s 4.2% y/y decline could accelerate to something that would be the weakest since the series was revamped back in 2011. Australia will release softer inflation figures when Q4 CPI arrives into the Wednesday trading session. CPI is expected to cool by about a half a percentage point while the trimmed mean and weighted median measures may soften by a little less. If consensus is right, then Australia’s inflation rate could drop to the weakest rate since 2012. None of next week’s regional central banks are expected to alter their rate stances — not that this provides much assurance these days. Among them include the RBNZ, Bank Negara Malaysia and the Bank of Thailand. The riskiest call among these is that a minority of forecasters expect the Bank of Thailand to cut by 25bps. Developments of more regional interest will include Q4 GDP releases in the Philippines and Taiwan, trade figures in countries like the Philippines and Thailand, and industrial output in South Korea. 5 January 23, 2015 Economics Global Views CANADIAN MONETARY POLICY Derek Holt 416.863.7707 [email protected] What’s Next For The Bank Of Canada? There is strong reason to believe that additional rate cuts lie ahead, and one cannot rule out the case for returning to the lower zero bound that was practically defined as 0.25% from April 2009 to May of 2010. What will the Bank of Canada do next? I was down at our successful global conference hosted by Scotiabank in Miami this week and what a week for central banks to say the least. The BoC rate cut arrived right in the middle of our research panel to kick off the conference. Clearly the BoC’s timing had us in mind as opposed to other more worldly concerns. Frankly I can't see much of a compelling argument against cutting at least once more. Even another cut after that — and thus returning the policy rate to the lower zero bound — is feasible, after which I can see the BoC parking it there for an extended period. There are several reasons: One reason is that the costs to operating at the lower zero bound (LZB) are less than they were in the past. Operating at the LZB at an earlier stage of the crisis was thought to be potentially destabilizing to money markets in part by raising instability risks across companies that run large money market funds. That’s part of why ex-Governor Carney was happy to get off the LZB as soon as he could, but also because his conditional inflation pledge was being violated just before the pledge expired in June 2010. Chart 1 shows that concern about money market instability has largely gone away. If you didn’t get out of money market funds by now, then please accept our condolences. Money market fund assets in Canada have plunged from about C$77.4 billion in March 2009 to about one-third of that now. Instability in this sector is just not the issue it was when the Fed was going to ZIRP and offsetting money market stability issues through other initiatives. Chart 1 Money Market Fund Assets Declining in Low Rate Setting 90 80 C$ Billions 70 60 50 40 Money Market Fund Assets 30 20 10 0 Jan-90 Jan-00 Jan-10 Source: Scotiabank Economics, Statistics Canada Another reason is that a quarter point rate cut does very little on its own. It helped to smoke the currency this week as it fell by about a nickel since the end of Monday, and I don’t buy that this isn’t almost entirely the point. It is also not universally effective, however, as the euro cross against CAD has been largely flat on the week. A quarter point cut does little to borrowing costs, and the global bond market had already long before cut fixed borrowing costs. A third reason is that – apart from the Fed, and I’ll come back to that in a minute – other global central banks are turning on the taps including the ECB, delayed rate hikes at the BoE, and the prospect for further stimulus from the BoJ. This changed the relative outlook for the BoC and gave the central bank the comfort it needed to cut on a relative conditions basis governing currency risks. Note the Prime Minister’s generally recognized remark that “…even after the Bank of Canada’s actions yesterday, Canadian monetary policy remains the most restrictive of almost any Western country, certainly more restrictive than every single other G-7 country.” A fourth reason is that the Federal Reserve’s likely tightening moves this year will carry negative knockon effects on Canada. They already are by reversing the commodity flows from USD-priced commodities back into the greenback during the period in which the QE3 bond purchase program was shut down and rate hike bets started to cheapen the US front end. Further negative adjustments are likely. A fifth reason is that the only way I can see why the BoC would still forecast a return to full capacity in the Canadian economy by the end of 2016 and re-achieving its inflation target by then (as it had forecast in the last MPR in October) is if a path of greater monetary easing is implied within their forecasts. Otherwise it would be natural to expect them to delay the output gap’s closure, and they may have 6 January 23, 2015 Economics Global Views CANADIAN MONETARY POLICY Derek Holt 416.863.7707 [email protected] … continued from previous page to yet by our own modelling even if they pursue additional easing. Our Chart 2 own modelling of the output gap does not envision closure by the end of 2 % 2016 perhaps even if further monetary policy accommodation is delivered (chart 2). 1 An additional factor concerns the Bank of Canada’s assessment of how its first rate cut is transmitted through financial intermediation channels. Disappointment in this regard may result in the central bank cutting further as a way of more aggressively influencing what it can — the currency and money market funding. Canadian Output Gap Forecast BNS Range 0 -1 -2 Finally, we have new leadership at the central bank. Consensus had -3 been conditioned by years of messaging from ex-Governor Carney that demonstrated stubbornness toward returning to the lower zero bound and -4 08Q1 10Q1 12Q1 14Q4 16Q4 that guided household borrowers to expect future rate hikes. Governor Source: Scotiabank Economics, Bank of Canada. Poloz is taking a very different approach that is one part rooted in changed circumstances, and one part reflecting a different bias to domestic risks. Instead of warning households about borrowing behaviour, the bias has rightly and finally shifted toward being concerned about household sector downsides and how monetary policy needs to accommodate such adjustments. The rapid softening of home sales figures across the whole country must have raised concerns in Ottawa. It is this shift in how the BoC approaches monetary policy from one Governor's reaction function to another's that is part of what has changed here and we’re learning a new style. In all, we’re left with a significant but not complete reassessment of our forecast risks. Previously I had argued the BoC would be on hold throughout 2015 and 2016 and possibly longer and that markets should be factoring in a decent probability of a rate cut before they moved to price this in by — for instance — pushing two year Government of Canada bond yields below the BoC’s overnight rate. The direction of our market bias worked well, but the timing of the policy rate cut came as an abrupt surprise that was not at all pre-conditioned by the central bank. This shift in communications strategy would make it highly prudent for markets to continue to factor in expectations for a further rate cut and that could once again lead the BoC to deliver one. 7 January 23, 2015 Economics / Fixed Income Strategy Global Views EUROPE Erika Cain 416.866.4205 [email protected] Frédéric Prêtet 00 33.17037.7705 [email protected] Colin White 416.866.4214 [email protected] Greece Likely To Elect A Syriza Government; But Won’t Leave The Euro Zone Greek exit more costly than staying the course. Greek voters will go to the polls on January 25th in a snap election that pits Prime Minister Antonis Samaras’s conservative ruling coalition against the left-wing Syriza party led by Alexis Tsipras. Mr. Tsipras has campaigned on an anti-austerity platform and pledged to renegotiate the terms of the bailout imposed by the “troika” (European Union, ECB and IMF). The party also wants deeper debt relief and is open to defaulting on the nation’s massive government debt. In our opinion, if elected, a Syriza government will likely be pulled towards the center of the political spectrum, given that the electorate favors the euro, and strike a compromise with the European Union (EU) that will allow Greece to stay in the currency union. Syriza’s popularity is a reflection of the severe economic retrenchment that followed the great recession and the subsequent round of tough austerity measures introduced. Without the option to rely on exchange rate devaluation to re-establish competitiveness, Greece has relied on years of “internal devaluation” to bring its high cost structure back in line with falling German production costs (chart 1). The result was a deep, six year recession (chart 2), with unemployment rising upward of 25%, nominal wages declining by roughly 20%, and persistent deflationary pressures taking hold. Along with massive cutbacks in government spending, falling consumption and slowing export demand, productive capital investment has sharply declined over the last six years (chart 3), explaining in part Greece’s lagging productivity performance (chart 4). This self-reinforcing downward cycle has driven many voters to consider the Syriza party’s position that Greece is unable to honour its debt/bailout terms. EU policymakers have made it clear that they will not be coerced into allowing Greece to renege on the terms of its bailout — which has rescued the country’s finances — and appear less concerned about a Greek exit. Statements by German Chancellor Angela Merkel and French President François Hollande have departed from the traditional stance that euro membership is irrevocable, while Greece has been suspended from the ECB’s €1.1 trillion asset-purchase program until at least July. In fact, with far-left parties rising in popularity in Spain, Italy, Portugal, and France, EU authorities may take a hard line to ensure all members play by EU rules of budget austerity and structural reforms. The euro zone is more resilient today than five years ago, allowing vulnerable members such as Ireland, Portugal and Spain to resist spillover from political risks in Greece. In fact, this time around, sovereign borrowing rates in peripheral countries will be anchored by the ECB’s quantitative easing, which now includes sovereign bonds. In addition, Europe has established an array of mechanisms Chart 1 Harmonized Competitiveness Indicators 140 Index: 1999 = 100 130 120 Ireland 110 Italy France 100 Spain Portugal 90 Greece Germany 80 99 01 03 05 Chart 2 07 09 11 13 Real GDP 15 Germany 105 France 100 Ireland 95 Spain Portugal Italy 90 85 80 Index: 2007 = 100 75 Greece 70 07 08 Chart 3 09 10 11 12 13 14 Business Investment 110 Germany 100 France 90 80 Italy 70 Portugal Ireland Spain 60 50 Index: 2007 = 100 40 Greece 30 07 08 Chart 4 09 10 11 12 13 14 Labour Productivity 115 Index: 2007 = 100 Spain 110 Ireland Portugal 105 Germany France 100 Italy 95 Greece 90 07 08 09 10 11 12 13 14 Source for all charts: Bloomberg, ECB, Scotiabank 8 January 23, 2015 Economics / Fixed Income Strategy Global Views EUROPE Erika Cain 416.866.4205 [email protected] Frédéric Prêtet 00 33.17037.7705 [email protected] Colin White 416.866.4214 [email protected] … continued from previous page since 2010 that should mitigate contagion fears, including the European Stability Mechanism (ESM) bailout fund and the banking union, with the ECB as the sole regulator of European banks. Moreover, the direct risk of contagion spreading across the region’s financial system has been reduced. Following Greece’s massive debt restructuring in 2012, Greek bonds in the hands of private sector creditors were down to just 13% of where they had stood in April 2010. The Greek economy emerged from recession last year and the government expects real GDP growth to accelerate markedly from 0.6% in 2014 to 2.9% in 2015. However, the country’s recovery hasn't been widespread, with unemployment still above 25%, and a quarter of households living in poverty. Specifically, Greece’s export recovery has remained elusive (chart 5). While all peripheral countries have reported a strong improvement in their current account balances, the composition has varied. Greece has diverged from its peers since most of its improvement has come from a sharp fall in imports (chart 6), while the recovery in exports has been limited. In the case of Spain, Ireland and Portugal, higher export growth has played a much bigger role in their recoveries. However, Greece’s export recovery has gained momentum in 2014, while the substantial softening of the euro’s trade-weighted exchange rate should provide further impetus to the export-led recoveries in the periphery (chart 7). In light of the severe adjustment costs already shouldered in Greece, an exit at this time would come at a significantly higher cost than staying the course. For Greece, an exit would shake confidence, undermine the incipient recovery and lead to another downward cycle of falling investment spending and growth. Devaluation of a newly introduced currency, however, would not contribute much to a Greek export revival, given the structure of the Greek economy and the lack of recent investment in export capacity that would allow the country to benefit from greater external competitiveness. At the same time, exchange rate devaluation could significantly increase Greece’s eurodenominated debt burden, making default inevitable and requiring creditors to write down their claims on Greece. In light of these costs, all stakeholders have an incentive to find an accommodation within the existing monetary union that avoids a Greek exit. Chart 5 Export Recovery 125 Ireland Index: 2007 = 100 Spain Portugal 115 Germany France 105 Greece 95 Italy 85 75 07 08 09 10 11 12 13 14 Chart 6 Import Recovery 120 Germany Index: 2007 = 100 France 110 Ireland 100 90 Portugal 80 Spain Italy 70 Greece 60 07 08 09 10 11 12 13 14 Chart 7 Source for all charts: Bloomberg, Scotiabank Economics. Syriza is aware that the electorate wants to keep the country in the euro zone: a fall 2014 Eurobarometer opinion poll showed that 63% of Greeks support the euro — higher than Portugal, Italy and Cyprus — as euro zone membership is seen as the only anchor against domestic political inefficiency and instability. If elected, a Syriza government will have the people’s support for a more centrist solution. 9 January 23, 2015 Economics Global Views AUTOS Carlos Gomes 416.866.4735 [email protected] Global Car Sales Rev Up In December Broad-based improvement across all regions. Global car sales ended the year on a high note, surging 10% above a year earlier — the fastest growth of the past year. The acceleration occurred at a time when most forecasters have been downgrading their global economic outlook and suggests that the sharp decline in oil prices in recent months may be providing consumers worldwide with a stronger-than-expected boost to purchasing power. Importantly, sales accelerated in every region, including climbing above a year earlier in Eastern Europe for the first time since March, when the crisis in the Ukraine intensified. Activity was also largely flat in South America last month — the best performance since February — with the improvement driven by a moderate gain in Brazil and a 56% yearover-year surge in Colombia. 24 20 Record Global Auto Sales millions of units, 3MMA China 16 United States 12 8 Western Europe Asia led the way last month, with purchases surging 14% above a 4 07 08 09 10 11 12 13 14 15 year ago, double the full-year 2014 gain. Sales accelerated last month in most countries across the region, led by 20% y/y increases in South Source: Scotiabank Economics. Korea, China and India. The improvement in South Korea reflects recent interest rate reductions by the Bank of Korea, as well as the introduction of new models by Hyundai, Kia and Renault-Samsung. Sales in China exceeded expectations last month, with purchases of both passenger cars and crossover utilities gaining significant momentum. However, the acceleration in China likely reflects an attempt to clear out rising inventories, as most indicators continue to point to slowing economic activity. In contrast, we find the latest developments in India more encouraging, as volumes have posted back-to-back months of double-digit increases alongside improving economic conditions. In fact, in its latest World Economic Outlook released this week, the IMF expects India to become the world’s fastest-growing major economy by 2016, with activity strengthening by 6.5% that year and outpacing the 6.3% growth rate projected for China. In North America, all three NAFTA partners posted double-digit gains last month — a development last seen in early 2012, and which supports our view that volumes in the region will scale new heights over the coming year, surpassing the 2000 peak. While Canada led the way last month with a 17% y/y surge, both the United States and Mexico posted 11% gains. In fact, while the United States is the key auto market in the region, accounting for 85% of overall sales on the continent, it is important to note that purchases in Mexico exceeded volumes in Canada last month, and that Mexico has been the strongest auto market in North America in recent months, posting double-digit gains consistently since August. Sales also picked up across Europe last month, helping to lift full-year sales in Western Europe to the first annual increase since 2009. Spain continued to lead the way, with volumes supported by the government’s vehicle replacement program which was extended in November. In fact, if the program remains in place for all of 2015, car sales in Spain are likely to exceed one million units this year for the first time since 2008. More importantly, the sales improvement is broadening out across the region, with sixteen of the nineteen markets reporting gains last month. In particular, Germany posted its strongest year-over-year sales increase since July, a development which combined with several other leading indicators suggest that activity in Europe’s largest economy began to build some positive momentum in the final months of 2014. Sales even improved across Eastern Europe in December. While an upward trajectory has been in place since mid-2013 among the new EU members, Russia provided a temporary positive surprise, with sales rising 2.4% y/y last month, as households bought new vehicles ahead of announced price increases in the New Year. We expect Poland and the other EU members of Central and Eastern Europe to post further sales gains over the coming year. However, deteriorating economic conditions in Russia point to a sharper double-digit fall-off in sales this year, following a 10% contraction in 2014. 10 January 23, 2015 Economics Global Views CARIBBEAN Rory Johnston 416.862.3908 [email protected] Neil Shankar 416.866.6781 [email protected] Trinidad & Tobago Face Near-Term Headwinds From Lower Energy Prices Despite energy sector weakness, the economy is expected to pick up speed in 2016. Trinidad and Tobago will face headwinds through 2016 as the country attempts to increase energy sector output and attract further hydrocarbon investment in an environment of low energy prices. The government has prioritized economic diversification and the non-energy economy has expanded faster than the energy economy for the past four years on the back of strong service sector growth. Despite this, the energy sector still accounts for more than 40% of GDP and 85% of merchandise exports, and continues to exert drag on the economy. Oil production has steadily fallen over the past decade and 2014 crude output stood at just over half of the volume realized in 2006. Natural gas production has stepped in as the growth industry (Figure 1), but 2014 production suffered due to maintenance and technological upgrade-related downtime. While production is expected to rise this year, weaker oil and liquefied natural gas (LNG) prices will put downward pressure on earnings and growth. Project completions — particularly the prolific 590 million cubic feet per day Juniper gas project — will serve to increase production from 2017 onward and the government is aiming to spur further exploration through accommodative shifts in its regulatory and tax structures. The proliferation of hydraulic fracturing and horizontal drilling in the United States (the country’s traditional LNG market) has depressed prices, forcing Trinidad and Tobago to search for new customers. The expansion of the Panama Canal will facilitate this transition by enabling much larger LNG tankers to secure higher LNG prices in gas-thirsty Asian markets. Following an estimated 1% y/y expansion in 2014, we expect real GDP growth to remain at around 1% in 2015 due to a weak energy price outlook before accelerating to 2% in 2016. Figure 1: Gas Overtakes Crude 180 5.0 Natural Gas, RHS 160 4.5 140 4.0 3.5 120 3.0 100 2.5 80 60 2.0 Crude Oil & Lease Condensate, LHS 1.0 20 0.5 Thousand Bpd Billion cfpd 0 0.0 2002 2004 2006 2008 2010 2012 2014 Source: MEEA 30 Figure 2: Food Prices Drive the Headline Retail Price Index 25 20 Food 15 10 The government has indicated that collapsing oil prices will result in a US$1.2 billion revenue shortfall; however, expansionary fiscal policy ahead of the May elections will likely take priority over deficit consolidation. Much of this shortfall will be offset by either delaying planned infrastructure projects or shifting the cost to debt instead of current revenue. A decreased fuel subsidy burden will soften the budgetary impact of lower oil prices; we expect a deficit of 3% of GDP for FY2014/15 (Oct-Sept). 1.5 40 5 Headline y/y % change Core 0 Nov-11 Nov-12 Source: Bloomberg Nov-13 Nov-14 Inflation remains stubbornly high with price levels increasing by 9% y/y in November (a two-year high) driven largely by rising food prices on the back of lower domestic agricultural output (Figure 2). Accordingly, monetary authorities have increased the benchmark repo rate by 50 basis points since September taking the key rate to 3.25%; we expect rate hikes to continue into early 2015. The hike also reflects the central bank’s attempt to increase the attractiveness of TTD-denominated assets ahead of expected monetary policy normalization in the US. We expect inflationary pressures to persist in the first half of 2015 due to flood-induced food price increases before decelerating on the back of base effects, likely closing the year at around 5.2%. The Trinidad and Tobago dollar (TTD) outlook remains stable due to a quasi-fixed exchange rate averaging roughly 6.35 per US dollar over the past 12 months. The country holds over US$11 billion in international reserves and we assess that expectations of US monetary policy normalization in 2015 coupled with recent energy market downturns prompted the monetary authorities to sell US$200 million on January 16th, signaling a continued commitment to the programme of foreign exchange interventions into 2015. 11 Fixed Income Strategy January 23, 2015 Global Views Frédéric Prêtet 00.33.17037.7705 [email protected] European Central Bank January Meeting European Central Bank (ECB) President, Mario Draghi, did not disappoint as the central bank was able to deliver a significant QE program and provided ample details on it, demonstrating its willingness to be reactive despite the fact that the decision (on January 22nd) was taken under a consensus view. So, the ECB president recognised some opposition and the release of the minutes in four weeks’ time will provide more insight on this. Main points of strength are: The size: €60 bn per month although this figure also includes existing programs like the covered bond and the ABS program (looking to the recent trend, the covered bond is running at a pace of around €8/10 bn per month while the ABS is around €2 bn since the beginning of the year). So it would mean at this stage at least an additional €40-50 bn coming from this new program. Timeframe: the program will start on March 1st, 2015 and is intended to be carried out until at least September 2016. However, its duration could be longer as it is tied to “until the Governing Council sees a sustained adjustment in the path of inflation that is consistent with its aim of achieving inflation rates below, but close to, 2% over the medium term”. So, while the initial target is for a €1.1 trillion program (more than 10% of GDP), the ECB opens the door for an infinite QE program which is very significant. Asset purchases: a very large definition as it will include all bonds issued by euro area central governments, agencies and European institutions. Actually, only Greece will have to deal with specific criteria that apply to countries under an EU/IMF program. However, Draghi said that the ECB could be buying Greek bonds starting this summer if conditions under the EU/IMF program are met. It is a way for the ECB to push for a compromise solution between the new Government and the EU institutions. Also, in terms of maturities, it is very large, from 2Y to 30Y, so the ECB is ready to buy negative yields. Finally, nominal but also indexed linked bonds are part of the program which is clearly, in our view, demonstrating the willingness to reflate the economy and raise inflation expectations. The ECB will accept the same (pari passu) treatment as private investors, so there is no question of coming back to the “seniority” regimen meaning that in case of default the ECB is ready to carry the same risk as investors. Purchase will be made under the capital key (calculated according to the population & GDP of a member state in relation to the European Union as a whole; for example, Germany will account for 25%, France 20%). Point of weakness: Risk sharing: It is a mixed bag as while the ECB is ready to share the loss on bonds from European institutions, there will not be risk sharing for the other additional purchases. So, in that sense, it sent the message of fragmentation in the management of the monetary policy in the Eurozone — though Draghi tried to dismiss this point. In addition to the expanded QE program, the ECB also decided to increase the efficiency of the TLTRO program by cutting the 10 bps spread over the Refinancing rate (at 0.05%) in the coming quarterly operations starting in March in order to increase the attractiveness of this program. To conclude, the lack of clear risk sharing could be a point of disappointment, especially for peripherals vs. core countries. However, at this stage, it is more than offset by the size, the potential “unlimited” timeframe of the program and the ECB’s ability to deliver significant actions. 12 January 23, 2015 Economics Global Views Frances Donald 416.862.3080 [email protected] Derek Holt 416.863.7707 [email protected] Dov Zigler 212.225.6631 [email protected] Key Data Preview CANADA Canadian GDP for November is looking soft on the basis of leading indicators. Manufacturing sales volumes fell by 1.4% m/m, wholesale trade fell in volume terms by 0.3% m/m, and the international trade numbers on the month pointed to extreme weakness (export volumes, -1.6% m/m; import volumes, -1.7% m/m — see chart). Retail trade is one of the two bright spots on the month at +0.4% m/m in volume terms, the other being hours worked, which climbed by 0.1% m/m, not exactly a major gain, but enough to leave us anticipating only a moderate decline on the order of -0.1% m/m. UNITED STATES GDP for Q4 should come in at a solid 3.2% q/q. Consumer spending was quite strong on the quarter, and even after factoring in a decline of 1% m/m in retail sales in December, we’re still expecting consumer spending to grow by 3% q/q annualized in real terms, with some upside potential (see chart). That alone should help to pull growth along and add on the order of 200bps to GDP. Trade should also be a plus, as exports are tracking for a 6% q/q annualized gain while imports are tracking at a softer 2% q/q. Residential construction spending as well as non-residential construction spending also look to score plusses. Weak spots on the quarter come from a moderate decline in equipment spending through November (December data will land next week, see below) and a probable drop in absolute levels of inventory stocking after a strong Q2/Q3 stretch. One downside risk comes from government spending as it would seem as though defense outlays have become fairly lumpy as the defense department procures arms for its sustained operations in the Middle East; still, even here, defense outlays are still lower than they were in late 2012 with room to rise. Durable goods orders could pick up moderately as a large drop in defense capital goods spending in November will probably be reversed in December. Civilian aircraft orders, on the other hand, fell at Boeing in December, implying potential downside. The big question is how these two counteracting forces play off against one another. Our calculations lead us to expect that the net will leave orders higher by 0.7% m/m. There isn’t much insight to be gained from the ISM manufacturing index’s sustained new orders category, which was flat in the 58-62 index level range for the four months through December. Soft capital goods orders point to the possibility of weak shipments in that category (see chart). New home sales could well tick higher as the NAHB index showed overall strength including an uptick in traffic of prospective buyers through homes. General metrics looking at housing activity, including existing home sales for December and mortgage purchase applications, were also strong. We’re looking for a 455k annualized sales number. Exports Softening to End 2014 48 46 C$, Billions 44 42 40 38 Canada, Exports 36 34 32 30 Jan-10 Jan-11 Jan-12 Jan-13 Jan-14 Source: Scotiabank Economics, Statistics Canada Real Consumer Spending Ends 2014 on a Strong Note 11.1 11 US$, Billions, Constant 2009 Dollars 10.9 10.8 Real Consumer Spending 10.7 10.6 10.5 Jan-13 Jul-13 Jan-14 Jul-14 Source: Scotiabank Economics, BEA 75 Capital Goods Orders & Shipments (Non-Defense, Ex-Air) Above Pre-Crisis Levels US$, Billions 70 65 Shipments 60 55 50 Orders 45 06 08 10 12 14 Source: Scotiabank Economics, Census Bureau. A1 13 January 23, 2015 Economics Global Views Rory Johnston 416.862.3908 [email protected] Tuuli McCully 416.863.2859 [email protected] Frédéric Prêtet 00.33.17037.7705 Neil Shankar 416.866.6781 [email protected] [email protected] … continued from previous page EUROPE Germany will release its IFO Business Climate Survey results for January on January 26th. The magnitude of any improvement in business sentiment will be worth watching over the coming months. Given the 50% decline in oil prices, the over 10% drop in the euro effective exchange rate and lower interest rates, we believe that euro zone growth dynamics could prove better-than-expected — with improvements in euro zone PMIs and details of the French INSEE survey in January already pointing in this direction. We expect the German IFO Business Climate Survey to move up one full point to 106.5, while the expectations component should mirror the sharp rise in the Zew index by increasing to 102.5 from 101.1 in December. January EU Commission surveys are likely also to reflect this dynamic with an upward payback in industrial sentiment to -4.5 after a surprising drop to -5.2 in December. Euro zone preliminary HCPI data for January will be released on January 30th and is expected to show inflation moving lower. We forecast a drop to -0.4% y/y, from -0.2% y/y in December. On January 29th, we expect German CPI and HICP to move into negative territory to -0.1% y/y and -0.2% y/y, respectively. The risks to our forecast are on the downside due to the impact of lower energy and food prices — though the latter could be supported by the adverse impact of colder temperatures. Euro zone core inflation is expected to remain stable at 0.7% y/y. However, seasonal swings are strong at this time of the year, creating the risk of surprises. LATIN AMERICA Chile will release industrial production and retail sales figures for December on January 29th. Driven by weak commodity prices, we expect to see Chilean economic weakness reflected in these indicators, with retail sales likely contracting slightly by 0.9% y/y, down from 0.4% growth in November, while industrial production will see no y/y growth, a marginal improvement over the 1.1% contraction experienced in November. ASIA 40 Chilean Industrial Production & Retail Sales 35 30 25 forecast 20 15 Retail 10 5 0 The Philippines and Taiwan will release fourth quarter GDP IP -5 y/y % data on January 28th and 29th(EST), respectively. The growth -10 Philippines’ economic outlook remains favourable, with solid Dec-10 Dec-11 Dec-12 Dec-13 growth momentum likely to be maintained through 2016. Real Source: Bloomberg, Scotiabank Economics. GDP growth averaged 5.8% y/y in the first three quarters of 2014. We estimate that output expansion picked up to 6.0% y/y in the final three months of 2014, being underpinned by solid household spending and continuing rebuilding efforts after the Typhoon Haiyan. Dec-14 We estimate that Taiwan’s real GDP growth slowed to 3.2% y/y from the 3.7% pace recorded in the JulySeptember period. The slowdown reflects a weaker position in the external sector during the final three months of 2014, largely affected by currency developments in both Japan and South Korea. Nevertheless, Taiwan’s exports grew 2.7% (in USD terms) in 2014 as a whole to a record high of US$313.84 billion; exports of goods and services in Taiwan account for roughly 75% of GDP. Although the slowdown in China remains a primary risk for Taiwan’s growth outlook in 2015/16, potential slack experienced in the export sector will likely be somewhat offset by the positive effects of lower oil prices (the country is a large net importer of oil) as well as steady demand originating from member countries in the Association of Southeast Asian Nations, which account for roughly 20% of Taiwan’s exports. We expect GDP growth to average roughly 3.5% in 2015-16. A2 14 January 23, 2015 Economics Global Views Key Indicators for the week of January 26 – 30 North America Country Date Time Indicator MX 01/26 09:00 Retail Sales (INEGI) (y/y) US 01/26 10:30 Dallas Fed. Manufacturing Activity 08:30 08:30 09:00 09:00 09:00 09:00 10:00 10:00 10:00 Durable Goods Orders (m/m) Durable Goods Orders ex. Trans. (m/m) Global Economic Indicator IGAE (y/y) Trade Balance (US$ mn) S&P/Case-Shiller Home Price Index (m/m) S&P/Case-Shiller Home Price Index (y/y) Consumer Confidence Index New Home Sales (000s a.r.) Richmond Fed Manufacturing Index Period Nov Jan BNS --- Consensus 4.0 3.1 Latest 5.6 4.1 Dec Dec Nov Dec Nov Nov Jan Dec Jan 0.7 0.5 --0.5 4.2 96.0 455.0 8.0 0.5 0.6 2.4 1011.5 0.6 4.3 95.5 450.0 5.0 -0.9 -0.7 2.5 -1076.4 0.8 4.5 92.6 438.0 7.0 US US MX MX US US US US US 01/27 01/27 01/27 01/27 01/27 01/27 01/27 01/27 01/27 US US 01/28 07:00 MBA Mortgage Applications (w/w) 01/28 14:00 FOMC Interest Rate Meeting (%) JAN 23 Jan 28 -0.25 -0.25 14.2 0.25 US US US MX 01/29 01/29 01/29 01/29 08:30 08:30 10:00 14:00 Initial Jobless Claims (000s) Continuing Claims (000s) Pending Home Sales (m/m) Overnight Rate (%) JAN 24 JAN 17 Dec Jan 29 300 2400 -3.00 300 2400 0.5 3.00 307 2443 0.8 3.00 CA US US US US US 01/30 01/30 01/30 01/30 01/30 01/30 08:30 08:30 08:30 08:30 09:45 10:00 Real GDP (m/m) Employment Cost Index (q/q) GDP (q/q a.r.) GDP Deflator (q/q a.r.) Chicago PMI U. of Michigan Consumer Sentiment Nov 4Q 4Q A 4Q A Jan Jan F -0.1 -3.2 --99.0 0.0 0.6 3.1 0.9 57.9 98.2 0.3 0.7 5.0 1.4 58.8 98.2 Period Jan Jan Jan BNS 106.5 110.3 102.5 Consensus 106.5 110.8 102.5 Latest 105.5 110.0 101.1 4Q A Nov Jan 27 Dec Dec Dec --2.10 3508.0 20.0 -- 0.6 0.3 2.10 3503.7 15.5 0.3 0.7 0.3 2.10 3488.3 27.4 0.5 Feb Jan --- 9.1 0.3 9.0 0.2 Dec Jan Jan Jan Jan Jan Jan P Jan P Jan P Jan P Jan --10.0 6.5 -102.0 -4.5 -0.9 -0.1 -1.0 -0.2 -- --10.0 6.5 0.1 101.6 -4.5 -0.8 -0.1 -1.0 -0.2 -2.0 0.5 -27.0 6.5 0.0 100.7 -5.2 0.0 0.2 0.1 0.1 -4.0 Europe Country Date Time Indicator GE 01/26 04:00 IFO Business Climate Survey GE 01/26 04:00 IFO Current Assessment Survey GE 01/26 04:00 IFO Expectations Survey UK UK HU FR FR GE 01/27 01/27 01/27 01/27 01/27 01/27 04:30 04:30 08:00 12:00 12:00 GE UK 01/28 02:00 GfK Consumer Confidence Survey 01/28 Nationwide House Prices (m/m) SP GE GE EC EC EC GE GE GE GE UK 01/29 01/29 01/29 01/29 01/29 01/29 01/29 01/29 01/29 01/29 01/29 03:00 03:55 03:55 05:00 05:00 05:00 08:00 08:00 08:00 08:00 19:05 GDP (q/q) Index of Services (m/m) Base Rate (%) Total Jobseekers (000s) Jobseekers Net Change (000s) Retail Sales (m/m) Real Retail Sales (y/y) Unemployment (000s) Unemployment Rate (%) Business Climate Indicator Economic Confidence Industrial Confidence CPI (m/m) CPI (y/y) CPI - EU Harmonized (m/m) CPI - EU Harmonized (y/y) GfK Consumer Confidence Survey Forecasts at time of publication. Source: Bloomberg, Scotiabank Economics. A3 1 January 23, 2015 Economics Global Views Key Indicators for the week of January 26 – 30 Europe (continued from previous page) Country FR FR SP SP SP SP UK EC EC EC RU Date 01/30 01/30 01/30 01/30 01/30 01/30 01/30 01/30 01/30 01/30 01/30 Time 02:45 02:45 03:00 03:00 03:00 03:00 04:30 05:00 05:00 05:00 05:30 Indicator Consumer Spending (m/m) Producer Prices (m/m) CPI (y/y) CPI - EU Harmonized (y/y) Current Account (€ bn) Real GDP (q/q) Net Consumer Credit (£ bn) Euro zone CPI Estimate (y/y) Euro zone Core CPI Estimate (y/y) Unemployment Rate (%) One-Week Auction Rate (%) Period Dec Dec Jan P Jan P Nov 4Q P Dec Jan Jan A Dec Jan 30 BNS 0.1 ---1.6 -0.4 --0.4 0.7 11.5 17.00 Consensus 0.4 --1.2 -1.5 -0.5 1.2 -0.5 0.7 11.5 17.00 Latest 0.4 -0.1 -1.0 -1.1 0.3 0.5 1.3 -0.2 0.7 11.5 17.00 Period Jan BNS -- Consensus 1.2 Latest 1.8 Asia Pacific Country Date Time Indicator VN 01/24 CPI (y/y) JN JN JN JN VN VN VN 01/25 01/25 01/25 01/25 01/25 01/25 01/25 18:50 18:50 18:50 18:50 Merchandise Trade Balance (¥ bn) Adjusted Merchandise Trade Balance (¥ bn) Merchandise Trade Exports (y/y) Merchandise Trade Imports (y/y) Exports (y/y) Imports (y/y) Industrial Production (y/y) Dec Dec Dec Dec Jan Jan Jan -------- -735.2 -743.1 11.2 2.0 13.5 16.4 -- -893.5 -925.0 4.9 -1.6 13.6 12.1 9.6 SI SK PH PH CH SK TH TH TH 01/26 01/26 01/26 01/26 01/26 01/26 01/26 01/26 01/26 00:00 16:00 20:00 20:00 20:30 Industrial Production (y/y) Consumer Confidence Index Imports (y/y) Trade Balance (US$ mn) Industrial Profits YTD (y/y) Department Store Sales (y/y) Customs Exports (y/y) Customs Imports (y/y) Customs Trade Balance (US$ mn) Dec Jan Nov Nov Dec Dec Dec Dec Dec ---------- -4.0 --4.2 -181.0 --0.6 -2.4 110.0 -2.8 102.0 7.5 -56.0 -4.2 -6.5 -1.0 -3.5 -78.0 HK HK HK AU 01/27 01/27 01/27 01/27 03:30 03:30 03:30 19:30 Exports (y/y) Imports (y/y) Trade Balance (HKD bn) Consumer Prices (y/y) Dec Dec Dec 4Q ---1.9 3.0 3.3 -55.5 1.8 0.4 2.4 -52.2 2.3 TH MA NZ NZ NZ NZ AU JN JN PH PH CH 01/28 01/28 01/28 01/28 01/28 01/28 01/28 01/28 01/28 01/28 01/28 01/28 02:30 05:00 15:00 16:45 16:45 16:45 18:00 18:50 18:50 21:00 21:00 BoT Repo Rate (%) Overnight Rate (%) RBNZ Official Cash Rate (%) Trade Balance (NZD mn) Exports (NZD bn) Imports (NZD bn) Conference Board Leading Index (%) Large Retailers' Sales (y/y) Retail Trade (y/y) Real GDP (y/y) Annual GDP (y/y) Leading Index Jan 28 Jan 28 Jan 29 Dec Dec Dec Nov Dec Dec 4Q 2014 Dec 2.00 3.25 3.50 ------6.0 5.8 -- 2.00 3.25 3.50 75.0 4.2 4.1 -0.3 1.0 6.0 5.9 -- 2.00 3.25 3.50 -213.0 4.0 4.2 -0.2 1.1 0.5 5.3 7.2 99.2 Forecasts at time of publication. Source: Bloomberg, Scotiabank Economics. A4 2 January 23, 2015 Economics Global Views Key Indicators for the week of January 26 – 30 Asia Pacific (continued from previous page) Country SK SK SK SK JN JN JN JN JN AU AU TA SI JN Date 01/29 01/29 01/29 01/29 01/29 01/29 01/29 01/29 01/29 01/29 01/29 01/29 01/29 01/29 Time 16:00 16:00 18:00 18:00 18:30 18:30 18:30 18:30 18:50 19:30 19:30 19:30 21:30 23:00 Indicator Business Survey- Manufacturing Business Survey- Non-Manufacturing Industrial Production (y/y) Cyclical Leading Index Change Household Spending (y/y) Jobless Rate (%) National CPI (y/y) Tokyo CPI (y/y) Industrial Production (y/y) Private Sector Credit (y/y) Producer Price Index (y/y) Real GDP (y/y) Unemployment Rate (%) Vehicle Production (y/y) JN JN TH TH TH TH TH IN IN 01/30 01/30 01/30 01/30 01/30 01/30 01/30 01/30 01/30 00:00 01:00 02:30 02:30 02:30 02:30 02:30 05:30 07:00 Housing Starts (y/y) Construction Orders (y/y) Exports (y/y) Imports (y/y) Trade Balance (US$ mn) Current Account Balance (US$ mn) Business Sentiment Index Fiscal Deficit (INR Crore) Annual GDP Govt. Estimate (y/y) Period Feb Feb Dec Dec Dec Dec Dec Jan Dec P Dec 4Q 4Q P 4Q P Dec BNS -----3.5 2.3 ----3.2 2.0 -- Consensus ---1.6 --2.3 3.5 2.3 2.2 0.3 5.9 -3.3 2.0 -- Latest 77.0 68.0 -3.4 -0.1 -2.5 3.5 2.4 2.1 -3.7 5.9 1.2 3.6 2.0 -12.2 Dec Dec Dec Dec Dec Dec Dec Dec 1Q R --------5.40 -14.8 ----2445.0 ---- -14.3 16.9 -1.8 -4.2 1914.0 1664.0 48.6 49383.0 4.70 Period Dec Dec Dec BNS -0.0 -0.9 Consensus 4.7 0.4 -- Latest 4.8 -1.1 0.38 Dec Dec Jan 30 Nov --4.50 -- 6.0 8.9 4.50 -1488.2 6.1 8.7 4.50 -1356.7 Latin America Country Date Time Indicator BZ 01/29 06:00 Unemployment Rate (%) CL 01/29 07:00 Industrial Production (y/y) CL 01/29 07:00 Retail Sales (y/y) CL CO CO CO 01/30 07:00 Unemployment Rate (%) 01/30 11:00 Urban Unemployment Rate (%) 01/30 Overnight Lending Rate (%) 01/30 Trade Balance (US$ mn) Forecasts at time of publication. Source: Bloomberg, Scotiabank Economics. A5 3 January 23, 2015 Economics Global Views Global Auctions for the week of January 26 – 30 North America Country US US Date Time Event 01/26 11:30 U.S. to Sell USD24 Bln 3-Month Bills 01/26 11:30 U.S. to Sell USD24 Bln 6-Month Bills US US MX MX MX MX MX US 01/27 01/27 01/27 01/27 01/27 01/27 01/27 01/27 11:30 11:30 12:30 12:30 12:30 12:30 12:30 13:00 U.S. to Sell USD15 Bln 2-Year Floating Rate Notes U.S. to Sell 4-Week Bills Mexico To Sell MXN 5.5 Bln 1-Month Mexico Sells MXN 9.5 Bln 3-Month Mexico Sells MXN 11 Bln 6-Month Mexico Sells MXN 9 Bln 5-Year Bond Mexico Sells UDI 750 Mln 10-Year Bond U.S. to Sell USD26 Bln 2-Year Notes US 01/28 13:00 U.S. to Sell USD35 Bln 5-Year Notes US 01/29 13:00 U.S. to Sell USD29 Bln 7-Year Notes Europe Country GE FR FR FR Date 01/26 01/26 01/26 01/26 Time 05:30 08:50 08:50 08:50 Event Germany to Sell EUR1.5 Bln 364-Day Bills France to Sell Up to EUR3.6 Bln 84-Day Bills France to Sell Up to EUR1.9 Bln 133-Day Bills France to Sell Up to EUR1.9 Bln 343-Day Bills SP NE SP NE MB IT IT IT EC SZ 01/27 01/27 01/27 01/27 01/27 01/27 01/27 01/27 01/27 01/27 04:30 04:30 04:30 05:00 05:00 05:00 05:00 05:00 05:10 05:15 Spain to Sell 3-Month Bills Netherlands to Sell Up to EUR2 Bln 2.75% 2047 Bonds Spain to Sell 9-Month Bills Netherlands Reopen 2.75% DSL Jan 15 2047 Bonds Malta to Sell Bills Italy to Sell Up to EUR2 Bln Zero 2016 Bonds Italy to Sell Up to EUR1 Bln 1.7% 2018 Bonds Italy to Sell Up to EUR1 Bln 2.55% 2041 Bonds ECB Main Refinancing Operation Result Switzerland to Sell 91-Day Bills IT SW SW EC GE 01/28 01/28 01/28 01/28 01/28 05:00 05:00 05:03 05:10 05:30 Italy to Sell Bills Sweden to Sell SEK1.75 Bln 2.5% 2025 Bonds Sweden to Sell SEK1.75 Bln 1.5% 2023 Bonds ECB Long-Term Refinancing Operation Result Germany to Sell EUR2 Bln 2.5% 2046 Bonds DE IT IR IR 01/29 01/29 01/29 01/29 04:30 05:00 05:30 05:30 Denmark to Sell Bills Italy to Sell Bonds Ireland to Sell Bills Ireland to Sell Treasury Bills UK UK UK 01/30 06:00 U.K. to Sell GBP500 Mln 28-Day Bills 01/30 06:00 U.K. to Sell GBP1.5 Bln 182-Day Bills 01/30 06:00 U.K. to Sell GBP1 Bln 92-Day Bills Asia Pacific Country CH CH Date Time Event 01/25 22:00 Export-Import BOC to Sell CNY7 Bln 5-Year Bonds 01/25 22:00 Export-Import BOC to Sell CNY5 Bln 7-Year Bonds JN CH 01/27 03:00 Japan Auction for Enhanced-Liquidity 01/27 22:00 China to Sell CNY20 Bln 10-Year Bonds AU JN JN 01/28 18:30 Australia Plans to Sell AUD500 Mln 84-Day Bills 01/28 22:35 Japan to Sell 3-Month Bill 01/28 22:45 Japan to Sell 2-Year Bonds AU 01/29 19:00 Australia Plans to Sell AUD700 Mln 2.75% 2024 Bonds Source: Bloomberg, Scotiabank Economics. A6 4 January 23, 2015 Economics Global Views Events for the week of January 26 – 30 North America Country Date Time Event US 01/26 15:00 Congressional Budget Office Annual Budget & Economic Outlook CA 01/26 Mark Wiseman Speaks at CPPIB Annual Dinner US 01/27 14:00 Full committee hearing on "U.S. Trade Policy Agenda." US 01/28 14:00 FOMC Rate Decision MX 01/29 14:00 Overnight Rate US 01/30 02:45 Fed's Rosengren Addresses Basel Committee Africa Meeting Europe Country Date Time Event SZ JAN 21-24 World Economic Forum Annual Meeting Held in Davos UK 01/24 08:00 BOE's Mark Carney Speaks in Davos GR 01/25 SW HU IT 01/27 03:30 Swedbank presents Swedish economic forecasts 01/27 08:00 Central Bank Rate Decision 01/27 08:30 Italy Debt Agency Head, Bank of Italy's Panetta in Rome GE SP 01/28 06:00 Gabriel Presents German Government's 2015 Economic Outlook 01/28 06:30 Bank of Spain Governor Linde Speaks in Madrid IT 01/29 09:00 Italian Parliament, Regional Delegates Vote on New President SZ RU GE 01/30 01:30 Swiss National Bank Releases 4Q 2014 Currency Allocation 01/30 05:30 Key Rate 01/30 German Finance Ministry Publishes December Monthly Report Greece Holds Parliamentary Elections Asia Pacific Country Date Time Event JN 01/25 18:50 Bank of Japan Dec. 18-19 meeting minutes TH MA NZ NZ 01/28 01/28 01/28 01/28 02:30 05:00 15:00 21:00 BoT Benchmark Interest Rate BNM Overnight Policy Rate RBNZ Official Cash Rate RBNZ Reports Net Currency Sales Latin America Country Date Time Event CO 01/30 Overnight Lending Rate Source: Bloomberg, Scotiabank Economics. A7 5 January 23, 2015 Economics Global Views Global Central Bank Watch North America NORTH AMERICA Rate Bank of Canada – Overnight Target Rate Current Rate 0.75 Next Meeting March 4, 2015 Scotia's Forecasts -- Consensus Forecasts -- Federal Reserve – Federal Funds Target Rate 0.25 January 28, 2015 0.25 0.25 Banco de México – Overnight Rate 3.00 January 29, 2015 3.00 3.00 Fed: We expect the Federal Reserve to maintain a stable course in its statement on Jan. 28, continuing to say that it can be ‘patient’ with respect to subsequent interest rate moves, meaning, as Fed Chair Yellen said, that rates will not begin to rise until April at the earliest. We still maintain our view that rate hikes are likely in Q2 2015 as the economy improves. A key day to see if that view holds will be Jan. 30, when Q4 GDP and wage data land. If these numbers are strong, then the Fed can continue on course. If not, we might be back in the world of heightened ‘data dependence'. BoC: The Bank of Canada cut rates unexpectedly at its January meeting. The question is whether or not there are more cuts to come. The strong implication from the BoC was that to the extent that oil prices remain subdued, then, as BoC Governor Poloz put it, the BoC can take out ‘more insurance.’ Stay tuned. The Banco de México is expected to maintain its benchmark overnight rate at 3.00% after its meeting on January 29th. Inflation eased in December to 4.1%, but remains above monetary authorities' 3% (+/- 1%) target. It is unlikely that the central bank will raise rates in the current environment of low oil prices, but we do expect rates to rise later in the year. Europe EUROPE Rate European Central Bank – Refinancing Rate Current Rate 0.05 Next Meeting March 5, 2015 Scotia's Forecasts 0.05 Consensus Forecasts -- Bank of England – Bank Rate 0.50 Swiss National Bank – Libor Target Rate -0.75 February 5, 2015 0.50 0.50 March 19, 2015 -0.75 Central Bank of Russia – One-Week Auction Rate 17.00 -- January 30, 2015 17.00 17.00 Hungarian National Bank – Base Rate 2.10 January 27, 2015 2.10 2.10 Central Bank of the Republic of Turkey – 1 Wk Repo Rate 7.75 7.75 Sweden Riksbank – Repo Rate Norges Bank – Deposit Rate 0.00 1.25 February 24, 2015 February 12, 2015 --- March 19, 2015 0.00 1.25 -- The National Bank of Hungary (MNB) will meet on January 27th. Although inflationary pressures remain stubbornly depressed with price levels contracting by 0.9% y/y in December, central bank governor Gyorgy Matolcsy expressed his belief that current inflation levels are favourable and that the consumer price index will reverse direction and move towards the central bank’s target of 3.0% in a moderate and predictable inflation path. Accordingly, we expect the MNB to keep its benchmark base rate at 2.1% following next week’s meeting. The Russian Central Bank will meet on January 30th. We do not expect any changes to benchmark interest rates. Asia Pacific ASIA PACIFIC Rate Reserve Bank of Australia – Cash Target Rate Current Rate 2.50 Next Meeting February 2, 2015 Scotia's Forecasts 2.50 Consensus Forecasts 2.50 Reserve Bank of New Zealand – Cash Rate 3.50 January 28, 2015 3.50 3.50 People's Bank of China – Lending Rate 5.60 TBA -- -- Reserve Bank of India – Repo Rate 7.75 February 3, 2015 7.50 -- Bank of Korea – Bank Rate 2.00 February 17, 2015 2.00 -- Bank of Thailand – Repo Rate 2.00 January 28, 2015 2.00 2.00 Bank Indonesia – Reference Interest Rate 7.75 February 17, 2015 7.75 -- We maintain our view that the Reserve Bank of New Zealand (RBNZ) will keep the benchmark overnight cash rate at 3.50% following next week’s monetary policy meeting. Price levels continue to grow at a slower pace on the back of lower oil prices coupled with a relatively tight monetary policy framework. The consumer price index grew by 0.8% y/y in the fourth quarter of 2014. Accordingly, the RBNZ will likely hold off from further policy tightening until inflation nears the 2% target midpoint. Similarly, in Thailand inflationary pressures remain depressed with the consumer price index up by 0.6% y/y in December (a five-year low) on the back of lower oil prices. Weak domestic demand that has been hurt by months of political unrest as well as price controls implemented by the military administration are further contributing to an easing inflationary environment. Nevertheless, we expect the central bank to keep the benchmark repo rate on hold at 2.0% as it considers the current monetary policy stance accommodative enough; should the economy fail to gain traction in the near term, further monetary easing may take place. Latin America LATIN AMERICA Rate Banco Central do Brasil – Selic Rate Current Rate 12.25 Next Meeting March 4, 2015 Scotia's Forecasts 12.25 Consensus Forecasts -- Banco Central de Chile – Overnight Rate 3.00 February 12, 2015 3.00 -- Banco de la República de Colombia – Lending Rate 4.50 January 30, 2015 4.50 4.50 Banco Central de Reserva del Perú – Reference Rate 3.25 February 12, 2015 3.25 3.50 We expect no change in the benchmark overnight lending rate from the Banco de la República de Colombia after its meeting on January 30th. Colombian inflation stood at 3.7% y/y in December, near the upper end of the central bank’s 2-4% target range. However, the oil price collapse will impact the country negatively and it is unlikely that monetary authorities will hike rates before the full effects of the decline are realized. Africa AFRICA Rate South African Reserve Bank – Repo Rate Current Rate 5.75 Next Meeting January 29, 2015 Scotia's Forecasts 5.75 Consensus Forecasts 5.75 Inflationary pressures have eased in South Africa, with the consumer price index growing by 5.3% y/y in December down from an increase of 5.8% in November on the back of lower oil prices; South Africa is a large net energy importer, meeting roughly 70% of its petroleum needs by imports. Although the South African Reserve Bank’s (SARB) governor has made hawkish comments in prior monetary policy statements as inflation is near the top end of the SARB’s 3% to 6% target, monetary authorities will likely take time to assess the effects of the lower oil price shock on inflation and hold the benchmark interest rate at its current level of 5.75% following next week’s monetary policy meeting. Forecasts at time of publication. Source: Bloomberg, Scotiabank Economics. A8 6 January 23, 2015 Economics Global Views Forecasts as at January 8, 2015* Forecasts as at January 8, 2015* 2000-13 Output and Inflation (annual % change) 2014f 2015f 2016f 2000-13 2014f 2015f 2016f 2 Real GDP Consumer Prices World1 3.9 3.2 3.3 3.6 Canada Canada UnitedUnited StatesStates MexicoMexico 2.2 1.9 2.4 2.4 2.4 2.1 2.2 3.3 3.3 2.1 3.1 3.7 2.0 2.4 4.7 2.0 1.7 4.2 1.3 1.3 4.2 2.0 2.2 4.0 Kingdom UnitedUnited Kingdom Euro Zone Euro zone 1.8 1.2 2.6 0.8 2.8 1.0 2.3 1.3 2.3 2.0 0.5 -0.2 1.4 0.3 2.3 1.1 Japan Japan Australia Australia China China India India Korea South Korea Thailand Thailand 0.9 3.0 9.1 7.0 4.1 4.1 0.4 2.7 7.4 5.4 3.5 1.0 1.1 2.8 7.0 5.8 3.6 4.0 1.0 2.8 6.5 6.2 3.8 4.0 -0.1 3.0 2.4 10.2 2.9 2.6 2.3 2.0 1.3 5.0 0.8 0.6 1.5 2.5 2.2 6.0 2.0 2.1 1.6 2.7 2.7 6.5 2.6 2.5 3.4 4.4 5.6 0.2 1.7 2.6 0.5 2.7 5.0 1.5 3.9 5.7 6.5 3.2 2.6 6.5 4.6 3.2 7.0 2.6 3.0 6.0 3.0 2.8 Central Bank Rates (%, end of period) 14Q4 15Q1f 15Q2f 15Q3f 15Q4f 16Q1f 16Q2f 16Q3f Bank of Canada Federal Reserve European Central Bank Bank of England Swiss National Bank Reserve Bank of Australia 1.00 0.25 0.05 0.50 -0.25 2.50 1.00 0.25 0.05 0.50 -0.25 2.50 1.00 0.50 0.05 0.50 -0.25 2.50 1.00 0.75 0.05 0.50 -0.25 2.75 1.00 1.25 0.05 0.75 -0.25 3.00 1.00 1.50 0.05 0.75 -0.25 3.25 1.25 1.75 0.05 1.00 -0.25 3.50 1.50 2.25 0.05 1.00 -0.25 3.75 1.16 0.86 1.21 1.56 120 0.82 6.2 14.8 2.66 1.20 0.83 1.17 1.50 122 0.79 6.1 15.0 2.75 1.22 0.82 1.15 1.50 124 0.79 6.1 14.5 2.80 1.21 0.83 1.14 1.51 125 0.78 6.0 13.9 2.82 1.20 0.83 1.13 1.51 126 0.78 6.0 14.1 2.85 1.20 0.83 1.13 1.51 128 0.77 6.0 14.2 2.85 1.19 0.84 1.13 1.51 129 0.78 5.9 14.1 2.90 1.19 0.84 1.12 1.51 130 0.78 5.9 14.2 2.95 Commodities (annual average) 2000-13 2014 2015f 2016f WTI Oil (US$/bbl) Brent Oil (US$/bbl) Nymex Natural Gas (US$/mmbtu) 63 65 5.32 93 99 4.26 60 63 3.75 70 73 3.75 Copper (US$/lb) Zinc (US$/lb) Nickel (US$/lb) Gold, London PM Fix (US$/oz) 2.30 0.79 7.58 792 3.11 0.98 7.65 1,266 2.90 1.20 9.00 1,150 2.85 1.60 11.50 1,150 Pulp (US$/tonne) Newsprint (US$/tonne) Lumber (US$/mfbm) 745 587 280 1,025 604 349 1,005 610 370 1,020 615 400 Brazil Brazil Chile Chile Peru Peru Exchange Rates (end of period) Canadian Dollar (USDCAD) Canadian Dollar (CADUSD) Euro (EURUSD) Sterling (GBPUSD) Yen (USDJPY) Australian Dollar (AUDUSD) Chinese Yuan (USDCNY) Mexican Peso (USDMXN) Brazilian Real (USDBRL) 1 World GDP for 2000-13 are IMF PPP estimates; 2014-16f are Scotiabank Economics' estimates based on a 2013 PPP-weighted sample of 38 countries. 2 CPI for Canada and the United States are annual averages. For other countries, CPI are year-end rates. * See Scotiabank Economics 'Global Forecast Update' report for additional forecasts & commentary. A9 7 January 23, 2015 Economics Global Views Economic Statistics North America Canada Real GDP (annual rates) Current Acc. Bal. (C$B, ar) Merch. Trade Bal. (C$B, ar) Industrial Production Housing Starts (000s) Employment Unemployment Rate (%) Retail Sales Auto Sales (000s) CPI IPPI Pre-tax Corp. Profits 2013 14Q2 14Q3 Latest 2.0 3.6 2.8 -56.3 -39.6 -33.6 -7.2 8.7 11.8 -7.7 (Nov) 0.4 3.4 2.7 1.9 (Nov) 188 196 199 180 (Dec) 1.3 0.6 0.7 1.1 (Dec) 7.1 7.0 6.9 6.6 (Dec) 3.2 5.2 4.8 4.8 (Nov) 1744 1817 1949 1865 (Nov) 0.9 2.2 2.1 1.5 (Dec) 0.4 3.4 2.7 -1.9 (Nov) -0.6 12.0 10.3 Mexico Real GDP Current Acc. Bal. (US$B, ar) Merch. Trade Bal. (US$B, ar) Industrial Production CPI 1.4 1.6 2.2 -26.5 -30.6 -10.8 -1.2 4.3 -6.1 -12.9 (Nov) -0.5 1.1 2.0 1.8 (Nov) 3.8 3.6 4.1 4.1 (Dec) United States Real GDP (annual rates) Current Acc. Bal. (US$B, ar) Merch. Trade Bal. (US$B, ar) Industrial Production Housing Starts (millions) Employment Unemployment Rate (%) Retail Sales Auto Sales (millions) CPI PPI Pre-tax Corp. Profits 2013 2.2 -400 -702 2.9 0.93 1.7 7.4 4.3 15.5 1.5 1.2 4.6 14Q2 14Q3 Latest 4.6 5.0 -394 -401 -757 -728 -699 (Nov) 4.1 4.3 4.8 (Dec) 0.99 1.03 1.09 (Dec) 1.8 1.9 2.2 (Dec) 6.2 6.1 5.6 (Dec) 4.5 4.3 2.6 (Dec) 16.5 16.7 16.8 (Dec) 2.1 1.8 0.8 (Dec) 2.8 2.4 -0.5 (Dec) 10.4 10.0 Europe Euro Zone Real GDP Current Acc. Bal. (US$B, ar) Merch. Trade Bal. (US$B, ar) Industrial Production Unemployment Rate (%) CPI 2013 14Q2 14Q3 Latest 1.3 0.8 0.8 284 234 383 369 (Nov) 285.2 334.7 329.8 321.4 (Nov) -0.7 0.9 0.5 11.2 (Nov) 11.9 11.6 11.5 11.5 (Nov) 1.4 0.6 0.4 -0.2 (Dec) Germany Real GDP Current Acc. Bal. (US$B, ar) Merch. Trade Bal. (US$B, ar) Industrial Production Unemployment Rate (%) CPI 2013 14Q2 14Q3 Latest 0.2 1.4 1.2 189.2 280.9 311.9 278.2 (Nov) 253.2 293.9 308.4 266.4 (Nov) 0.1 1.3 0.3 3.2 (Nov) 6.9 6.7 6.7 6.5 (Dec) 1.5 1.1 0.8 0.2 (Dec) France Real GDP Current Acc. Bal. (US$B, ar) Merch. Trade Bal. (US$B, ar) Industrial Production Unemployment Rate (%) CPI 0.4 0.0 0.4 -40.3 -53.1 9.5 -16.6 (Nov) -46.4 -40.9 -44.1 -31.1 (Nov) -0.5 -2.1 -0.1 -1.2 (Nov) 10.3 10.1 10.3 10.3 (Nov) 0.9 0.6 0.4 0.1 (Dec) United Kingdom Real GDP Current Acc. Bal. (US$B, ar) Merch. Trade Bal. (US$B, ar) Industrial Production Unemployment Rate (%) CPI 1.7 2.6 2.6 -76.7 -97.2 -108.0 -176.1 -202.7 -213.1 -167.5 (Nov) -0.6 1.8 1.2 2.0 (Nov) 7.6 6.3 6.0 5.8 (Oct) 2.6 1.7 1.5 0.5 (Dec) Italy Real GDP Current Acc. Bal. (US$B, ar) Merch. Trade Bal. (US$B, ar) Industrial Production CPI -1.9 16.6 38.8 -3.0 1.2 Russia Real GDP Current Acc. Bal. (US$B, ar) Merch. Trade Bal. (US$B, ar) Industrial Production CPI -0.4 24.6 57.4 -0.2 0.3 -0.5 41.8 58.9 -1.2 0.0 41.8 53.0 -2.2 -0.1 (Nov) (Nov) (Nov) (Dec) 1.3 59.1 15.2 0.4 6.8 0.8 12.9 17.3 1.9 7.6 0.7 6.4 15.1 1.4 7.7 13.4 (Nov) -0.4 (Nov) 11.4 (Dec) All data expressed as year-over-year % change unless otherwise noted. Source: Bloomberg, Global Insight, Scotiabank Economics. A10 8 January 23, 2015 Economics Global Views Economic Statistics Asia Pacific Australia Real GDP Current Acc. Bal. (US$B, ar) Merch. Trade Bal. (US$B, ar) Industrial Production Unemployment Rate (%) CPI 2013 14Q2 14Q3 Latest 2.1 2.7 2.7 -49.7 -39.1 -55.9 20.7 17.1 2.9 18.6 (Nov) 2.0 4.4 3.8 5.7 6.0 6.1 6.1 (Dec) 2.4 3.0 2.3 Japan Real GDP Current Acc. Bal. (US$B, ar) Merch. Trade Bal. (US$B, ar) Industrial Production Unemployment Rate (%) CPI 2013 14Q2 14Q3 Latest 1.6 -0.3 -1.2 33.6 14.0 63.5 44.7 (Nov) -117.6 -108.8 -115.5 -95.5 (Nov) -0.6 2.6 -1.1 3.4 (Nov) 4.0 3.6 3.6 3.5 (Nov) 0.4 3.6 3.3 3.9 (Nov) South Korea Real GDP Current Acc. Bal. (US$B, ar) Merch. Trade Bal. (US$B, ar) Industrial Production CPI 3.0 81.1 44.1 0.2 1.3 3.5 96.5 59.0 1.2 1.6 3.2 89.8 136.9 (Nov) 35.8 69.0 (Dec) 1.1 -1.8 (Nov) 1.4 0.8 (Dec) China Real GDP Current Acc. Bal. (US$B, ar) Merch. Trade Bal. (US$B, ar) Industrial Production CPI 7.7 7.5 7.3 182.8 259.2 347.4 512.9 595.4 (Dec) 9.7 9.2 8.0 7.9 (Dec) 2.5 2.3 1.6 1.5 (Dec) Thailand Real GDP Current Acc. Bal. (US$B, ar) Merch. Trade Bal. (US$B, ar) Industrial Production CPI 2.9 -2.5 0.6 -3.1 2.2 0.4 -0.4 2.0 -5.2 2.5 0.6 -0.5 1.6 -3.8 2.0 1.9 (Nov) -2.2 (Nov) 0.6 (Dec) India Real GDP Current Acc. Bal. (US$B, ar) Merch. Trade Bal. (US$B, ar) Industrial Production WPI 4.7 5.7 5.3 -49.3 -7.8 -10.1 -12.7 -11.1 -12.4 0.6 4.5 1.4 6.3 5.8 3.9 Indonesia Real GDP Current Acc. Bal. (US$B, ar) Merch. Trade Bal. (US$B, ar) Industrial Production CPI 5.8 -29.1 -0.3 6.0 6.4 5.1 -8.7 -0.7 4.2 7.1 5.0 -6.8 -0.2 6.1 4.4 -0.4 (Nov) 8.3 (Oct) 8.4 (Dec) Chile Real GDP Current Acc. Bal. (US$B, ar) Merch. Trade Bal. (US$B, ar) Industrial Production CPI 2013 14Q2 14Q3 Latest 4.1 1.9 0.8 -4.8 -0.6 -6.7 8.0 11.6 4.8 14.9 (Dec) 3.1 2.1 -1.4 -3.0 (Nov) 1.9 4.5 4.7 4.6 (Dec) Colombia Real GDP Current Acc. Bal. (US$B, ar) Merch. Trade Bal. (US$B, ar) Industrial Production CPI 4.7 -12.5 0.2 -1.8 2.0 -9.4 (Dec) 3.8 (Nov) 0.1 (Dec) Latin America Brazil Real GDP Current Acc. Bal. (US$B, ar) Merch. Trade Bal. (US$B, ar) Industrial Production CPI Peru Real GDP Current Acc. Bal. (US$B, ar) Merch. Trade Bal. (US$B, ar) Unemployment Rate (%) CPI 2013 14Q2 14Q3 Latest 2.3 -0.7 -0.1 -81.1 -73.5 -77.9 2.4 14.3 7.2 3.5 (Dec) 2.2 -4.3 -3.7 -3.0 (Nov) 6.2 6.4 6.6 6.4 (Dec) 5.9 -9.1 0.1 5.9 2.8 1.7 -3.4 -0.3 5.9 3.5 1.8 -2.3 -0.1 5.7 2.9 -0.3 (Nov) 5.6 (Dec) 3.2 (Dec) 4.3 -4.1 -0.2 -0.3 2.8 4.2 -5.0 -0.4 1.2 2.9 -1.4 (Oct) -0.9 (Nov) 3.7 (Dec) All data expressed as year-over-year % change unless otherwise noted. Source: Bloomberg, Global Insight, Scotiabank Economics. A11 9 January 23, 2015 Economics Global Views Financial Statistics Interest Rates (%, end of period) Canada BoC Overnight Rate 3-mo. T-bill 10-yr Gov’t Bond 30-yr Gov’t Bond Prime FX Reserves (US$B) 14Q3 1.00 0.92 2.15 2.67 3.00 73.6 14Q4 1.00 0.92 1.79 2.34 3.00 Jan/16 1.00 0.92 1.54 2.11 3.00 74.0 Jan/23* 0.75 0.61 1.48 2.03 3.00 (Nov) United States Fed Funds Target Rate 3-mo. T-bill 10-yr Gov’t Bond 30-yr Gov’t Bond Prime FX Reserves (US$B) 14Q3 0.25 0.02 2.49 3.20 3.25 126.0 14Q4 0.25 0.04 2.17 2.75 3.25 Jan/16 0.25 0.02 1.84 2.45 3.25 122.6 Jan/23* 0.25 0.02 1.82 2.39 3.25 (Nov) Germany 3-mo. Interbank 10-yr Gov’t Bond FX Reserves (US$B) 0.04 0.95 65.1 0.02 0.54 0.00 0.45 65.1 -0.01 0.36 (Nov) France 3-mo. T-bill 10-yr Gov’t Bond FX Reserves (US$B) -0.03 1.29 50.6 -0.05 0.83 -0.15 0.63 49.2 -0.15 0.54 (Nov) Euro Zone Refinancing Rate Overnight Rate FX Reserves (US$B) 0.05 0.20 329.4 0.05 0.14 0.05 -0.08 329.3 0.05 -0.07 (Nov) United Kingdom Repo Rate 3-mo. T-bill 10-yr Gov’t Bond FX Reserves (US$B) 0.50 0.51 2.43 94.4 0.50 0.44 1.76 0.50 0.43 1.53 97.9 0.50 0.42 1.48 (Nov) Japan Discount Rate 3-mo. Libor 10-yr Gov’t Bond FX Reserves (US$B) 0.30 0.05 0.53 1234.4 0.30 0.05 0.33 0.30 0.04 0.24 1239.9 0.30 0.03 0.23 (Nov) Australia Cash Rate 10-yr Gov’t Bond FX Reserves (US$B) 2.50 3.48 50.1 2.50 2.74 2.50 2.56 49.4 2.50 2.63 (Nov) 1.12 0.89 1.621 1.263 0.72 0.96 1.16 0.86 1.558 1.210 0.69 0.99 1.20 0.83 1.515 1.157 0.73 0.86 1.24 0.81 1.502 1.128 0.75 0.88 ¥/US$ US¢/Australian$ Chinese Yuan/US$ South Korean Won/US$ Mexican Peso/US$ Brazilian Real/US$ 109.65 0.87 6.14 1055 13.429 2.447 119.78 0.82 6.21 1091 14.752 2.658 117.51 0.82 6.21 1077 14.558 2.622 117.79 0.79 6.23 1084 14.643 2.582 17043 1972 14961 44986 54116 1119 17823 2059 14632 43146 50007 1038 17512 2019 14309 41402 49017 1042 17753 2060 14819 42821 48988 1117 U.K. (FT100) Germany (Dax) France (CAC40) Japan (Nikkei) Hong Kong (Hang Seng) South Korea (Composite) 6623 9474 4416 16174 22933 2020 6566 9806 4273 17451 23605 1916 6550 10168 4380 16864 24104 1888 6833 10650 4641 17512 24850 1936 1030 605 340 91.16 4.12 1020 595 340 53.27 2.89 1020 595 321 48.69 3.13 1020 595 312 46.24 2.96 Copper (US$/lb) Zinc (US$/lb) Gold (US$/oz) Silver (US$/oz) CRB (index) 3.06 2.88 1.04 0.98 1216.50 1206.00 17.11 15.97 278.55 229.96 2.57 0.93 1277.50 16.92 224.24 2.53 0.96 1294.75 18.23 217.56 Exchange Rates (end of period) USDCAD CADUSD GBPUSD EURUSD JPYEUR USDCHF Equity Markets (index, end of period) United States (DJIA) United States (S&P500) Canada (S&P/TSX) Mexico (IPC) Brazil (Bovespa) Italy (BCI) Commodity Prices (end of period) Pulp (US$/tonne) Newsprint (US$/tonne) Lumber (US$/mfbm) WTI Oil (US$/bbl) Natural Gas (US$/mmbtu) * Latest observation taken at time of writing. Source: Bloomberg, Scotiabank Economics. A12 10 A12 Disclaimer January 23, 2015 Global Views Fixed Income Strategy (London) www.gbm.scotiabank.com © 2012, The Bank of Nova Scotia This material, its content, or any copy of it, may not be altered in any way, transmitted to, copied or distributed to any other party without the prior express written consent of ScotiabankTM. This material has not been prepared by a member of the research department of Scotiabank, it is solely for the use of sophisticated institutional investors, and this material does not constitute investment advice or any personal recommendation to invest in a financial instrument or “investment research” as defined by the Financial Services Authority. This material is provided for information and discussion purposes only. An investment decision should not be made solely on the basis of the contents of this publication. It is not to be construed as a solicitation or an offer to buy or sell any financial instruments and has no regard to the specific investment objectives, financial situation or particular needs of any recipient. It is not intended to provide legal, tax, accounting or other advice and recipients should obtain specific professional advice from their own legal, tax, accounting or other appropriate professional advisers before embarking on any course of action. The information in this material is based on publicly available information and although it has been compiled or obtained from sources believed to be reliable, such information has not been independently verified and no guarantee, representation or warranty, express or implied, is made as to its accuracy, completeness or correctness. Information included in this material related to comparison performance (whether past or future) or simulated performance (whether past or future) is not a reliable indicator of future returns. This presentation is not directed to or intended for use by any person resident or located in any country where the distribution of such information is contrary to the laws of such country. Scotiabank its directors, officers, employees or clients may currently or from time to time own or hold interests in long or short positions in any securities referred to herein, and may at any time make purchases or sales of these securities as principal or agent. Scotiabank may also have provided or may provide investment banking, capital markets or other services to the companies referred to in this communication. TM Trademark of The Bank of Nova Scotia. Used under license, where applicable. Scotiabank, together with "Global Banking and Markets", is a marketing name for the global corporate and investment banking and capital markets businesses of The Bank of Nova Scotia and certain of its affiliates in the countries where they operate, including Scotia Capital Inc., Scotia Capital (USA) Inc., Scotiabanc Inc.; Citadel Hill Advisors L.L.C.; The Bank of Nova Scotia Trust Company of New York; Scotiabank Europe plc; Scotia Capital (Europe) Limited; Scotiabank (Ireland) Limited; Scotiabank Inverlat S.A., Institución de Banca Múltiple, Scotia Inverlat Casa de Bolsa S.A. de C.V., Scotia Inverlat Derivados S.A. de C.V. – all members of the Scotiabank Group and authorized users of the mark. The Bank of Nova Scotia is incorporated in Canada with limited liability. Scotia Capital Inc. is a member of CIPF. Scotia Capital (USA) Inc. is a registered broker-dealer with the SEC and is a member of the NASD and SIPC. The Bank of Nova Scotia, Scotiabank Europe plc, Scotia Capital (Europe) Limited and Scotia Capital Inc. are each authorised and regulated by the Financial Services Authority (FSA) in the U.K. Scotiabank Inverlat, S.A., Scotia Inverlat Casa de Bolsa, S.A. de C.V., and Scotia Derivados, S.A. de C.V., are each authorized and regulated by the Mexican financial authorities. Fixed Income Strategy (Paris) Disclaimer © 2011, The Bank of Nova Scotia This material, its content, or any copy of it, may not be altered in any way, transmitted to, copied or distributed to any other party without the prior express written consent of Scotiabank™. This material has not been prepared by a member of the research department of Scotiabank, it is solely for the use of sophisticated institutional investors, and this material does not constitute investment advice or any personal recommendation to invest in a financial instrument or “investment research” as defined by the Financial Services Authority. This material is provided for information and discussion purposes only. An investment decision should not be made solely on the basis of the contents of this publication. It is not to be construed as a solicitation or an offer to buy or sell any financial instruments and has no regard to the specific investment objectives, financial situation or particular needs of any recipient. It is not intended to provide legal, tax, accounting or other advice and recipients should obtain specific professional advice from their own legal, tax, accounting or other appropriate professional advisers before embarking on any course of action. The information in this material is based on publicly available information and although it has been compiled or obtained from sources believed to be reliable, such information has not been independently verified and no guarantee, representation or warranty, express or implied, is made as to its accuracy, completeness or correctness. Information included in this material related to comparison performance (whether past or future) or simulated performance (whether past or future) is not a reliable indicator of future returns. This presentation is not directed to or intended for use by any person resident or located in any country where the distribution of such information is contrary to the laws of such country. Scotiabank its directors, officers, employees or clients may currently or from time to time own or hold interests in long or short positions in any securities referred to herein, and may at any time make purchases or sales of these securities as principal or agent. Scotiabank may also have provided or may provide investment banking, capital markets or other services to the companies referred to in this communication. January 23, 2015 Disclaimer Global Views Scotiabank Economics This report has been prepared by Scotiabank Economics as a resource for the clients of Scotiabank. Opinions, estimates and projections contained herein are our own as of the date hereof and are subject to change without notice. The information and opinions contained herein have been compiled or arrived at from sources believed reliable but no representation or warranty, express or implied, is made as to their accuracy or completeness. Neither Scotiabank nor its affiliates accepts any liability whatsoever for any loss arising from any use of this report or its contents. TM Trademark of The Bank of Nova Scotia. Used under license, where applicable. Scotiabank Economics Scotia Plaza 40 King Street West, 63rd Floor Toronto, Ontario Canada M5H 1H1 Tel: 416.866.6253 Fax: 416.866.2829 Email: [email protected] For general and publication-related inquiries, contact us by telephone, email and/or fax.


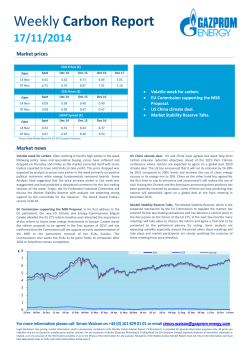


© Copyright 2026