
chapter 9: health for all - Indus Valley School of Art and Architecture
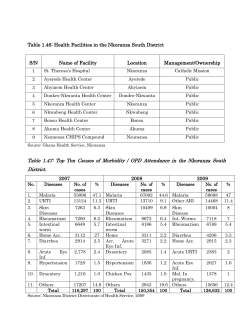
CHAPTER 9: HEALTH FOR ALL
I. Universal Health Coverage
Good health stands at the center of sustainable development. Good health is at the center of wellbeing,
and is vital for everything else we hold dear. Good health aids children to not only survive disease, but
also to flourish, learn, and make their way through school and on to adulthood and the labor force. It
also enables a workforce to be productive. Thus, good health enhances the ability of a community to
develop human capital, undertake economic activities, and attract investment.
Health has also long been regarded as a basic human need and basic human right. Technically the goal
is the “highest attainable standard of physical and mental health.” Why do we refer to the “highest
attainable” standard? Perfect health cannot be a human goal. Every human being will face disease and
death. The highest attainable health refers to what is possible given current knowledge and technology.
The world is far from this practical standard. Around 6 million children die each year before their 5th
birthday, almost all of them in developing countries, and almost all as the result of disease conditions
that are preventable or treatable; in other words, better health is attainable.
Since the beginning of the United Nations itself, the priority of health has been clear. In 1948, the
Universal Declaration of Human Rights made it clear that health is a human right and basic need; and
that even when these kinds of rights cannot be achieved immediately, they should be progressively
realized. Yet time is progressing and we could still move faster. When the World Health Organization
(WHO) was created, also in 1948, it declared in its central constitution that the highest attainable
standard of health is a fundamental human right “without distinction of race, religion, political belief,
economic or social condition.” But we have yet to achieve this goal.
One notable global effort after 1948 to achieve universal health was launched in 1978 in Alma-Ata, now
Almaty, Kazakhstan. World health officials gathered and adopted the important Alma-Ata Declaration,
which called for universal health by the year 2000. Unfortunately when 2000 came around, there was
not health for all. Instead, there were pandemics and poor health outcomes in many parts of the world.
The HIV/AIDS pandemic was running rampant. An estimated 36.1 million people were infected with the
HIV virus. Malaria, a tropical killer disease, rose tremendously in number of infections and in number of
deaths, because the first line medicine used in Africa to treat malaria lost its efficacy – the parasite had
become resistant to the chloroquine drug. 2000 was a very bleak year for malaria, with a surging death
toll – around 985,000 people. The year 2000 was also bleak for tuberculosis, another horrific scourge of
humanity that claims millions of lives each year. The tuberculosis surge was partly riding on the
HIV/AIDS pandemic, because immunocompromised individuals suffering from AIDS died in very large
numbers from tuberculosis. Like malaria, there was a crisis of drug resistance. New and lethal strains
were spreading multidrug-resistant tuberculosis (MDR TB) bacteria that were resistant to a wide
spectrum of traditional medicines. This became extensively drug-resistant tuberculosis (XDR TB), where
1
even the most heavy-duty rescue medicines lost their effectiveness as the bacteria continued to evolve
resistance.
In other words, the year 2000 did not meet the hopes and aspirations of the health ministers who had
assembled in 1978, nor did it fulfill the promise of the Universal Declaration of Human Rights, nor the
Constitution of the World Health Organization. So it was notable that in 2000, the Millennium
Development Goals (MDGs) centrally took up the challenge of fighting these spreading scourges of killer
diseases. We have made a lot of progress since then. The time from 2000 until now is a period of
tremendous progress. It rekindles the hopes of 1978. Indeed, we see within reach the possibility of truly
honoring the commitment to health as a basic human right.
It is notable that three of the eight MDGs, which seek to end extreme poverty, are centrally about
health. MDG 4 is about reducing child mortality. MDG 5 is about reducing maternal mortality. MDG 6 is
about controlling mass killer epidemic diseases including AIDS and malaria. All of the other goals, such
as ending poverty and hunger, having children in school, and gender equality, are also goals in which
health plays an important role, both as a determinant of outcomes and also as one of the main
objectives.
There has been significant progress in health since 2000, and especially since around 2005. The science
of public health, breakthroughs in modern medicine, and breakthroughs in areas such as food
production and urban infrastructure have led to important gains. However, there are still major
challenges. I’ve already noted that millions of children, especially in the poorest countries, die each year
of preventable or treatable causes could have been ended with a well-directed, well-implemented
effort. These lives could be saved. Children who are dying today or are left with life disabilities could,
with proper organized responses, have happy, safe lives that could give them the many opportunities
they desire.
Around the world, most people consider health to be a merit good – a good that should be accessible
very broadly or indeed universally in the population. Health is generally considered to be such a good,
not only because it is vital for each individual from a moral and ethical point of view; but also from a
practical point of view. Untreated disease is a serious societal threat that spills over to the rest of the
population. Think of the devastation that comes when a highly communicable disease races through a
country or continent, the way AIDS has. The time and money spent fighting such infections, and the
death tolls that result, are a huge cost to communities both in lives and in finances. Governments have a
necessary leadership role to ensure widespread coverage as well as the efficiency and orientation of the
healthcare system.
The great progress of pubic health, like economic development itself, is one of great achievement of the
modern era. At the time of the Industrial Revolution, worldwide life expectancy at birth (LEB) was
perhaps 35 years (there are not records to precisely establish a worldwide number, but this is a
reasonable estimate). This does not mean that people were dying at the age of 35. It means that a
newborn on average would reach an average age of 35, taking into account that a very large number of
2
deaths were within the first five years of life. Therefore, if individuals reached the age of 20, there was a
good chance that they would reach the age of 50 or higher. Life expectancy at birth is therefore a
measure made just at the time of birth. The life expectancy of an individual who has already survived
childhood (say at age 20) can therefore be far higher than the life expectancy at birth.
By 1950, just after World War II, there were some gains in the world’s average LEB compared with the
pre-industrial era, but it is worthwhile to recall how much of the world was still mired in poverty in the
middle of the last century. The United Nations estimated that during the five-year period from 1950 to
1955, the worldwide life expectancy at birth was around 46 years. Figure 9.1 considers the trend in LEB
since then for various groupings of countries.
As we see in the graph, the LEB for the entire world in 1950-55 is estimated at around 47 years. In the
developed regions, LEB was already around 65 years, while in the least developed countries LEB was still
only around 40 years, not much different from the estimated LEB for the pre-industrial world. Note that
in the landlocked developing countries, the LEB was even lower, at around 36 years. This very low LEB
reflects the poverty and isolation typical of landlocked developing countries. It may also reflect the
highland geography of many of those countries. As of 2010-15, world life expectancy has increased to
70 years, roughly twice the life expectancy from the start of the Industrial Revolution. This is one of the
great achievements of modern humanity, of modern science and of economic development.
3
Figure 9.1. Life Expectancy by World Region
Nonetheless, there are still enormous health gaps between the developed and developing countries. In
the developed countries, life expectancy is almost 80 years, whereas in the least developed countries
LEB is only 60 years, and less in many LDCs. In other words, there is roughly a two-decade gap in
average life expectancy between the richest and poorest countries. These two decades of survival offer
an indication of how much can be done to improve the health of the poorest countries.
In public health, it is now typical to speak of a full lifetime of 80 years, and to define excess mortality as
a death under the age of 80. When an individual dies at age X (say 30 years), we can speak of the
number of years of life that are lost, measured by 80-X (= 50 years lost for a death at age 30). Most of
the excess mortality in LDCs is caused by poverty in some way, directly or indirectly. From a medical and
public health point of view, most “excess deaths” (that is, deaths under the age of 80) are the result of
preventable or treatable conditions. There is therefore a strong chance that improved public health can
spread throughout the whole world in the same way as economic development, thereby raising the life
expectancy in the poor countries towards the LEB of the rich countries. We can speak of the
convergence of public health in the same way we speak of the convergence of GDP per capita.
Figure 9.2 shows the worldwide relationship between the per capita income of a country and its life
expectancy at birth. The GDP per capita of each country is placed on the horizontal axis and the life
expectancy at birth is placed on the vertical axis. Notice the rising curve in this graph, showing the
overall “best fit” relationship between these two variables. Richer countries have a higher life
expectancy than poorer countries. Notice also that the curve flattens out at high income, however,
meaning that once a country has reached a certain level of development, there are not huge gains to
LEB for further increases in GDP per capita. That top threshold seems to be around $20,000 (measured
at international prices).
4
Figure 9.2. GDP and Life Expectancy
The solid line and the scatter plot are for the year 2005. A dotted line is also drawn showing the
relationship that applied in 1975. Notice that the entire curve shifted upward, meaning that during the
30-year interval, at any given level of income, an individual could expect to live longer in 2005 than in
1975. The main reasons are the technological and social improvements in public health, such as
improved diagnostics, medicines, and surgical procedures; and also more healthy lifestyles (such as
reduced cigarette smoking) in some populations. Of course many of the advances are outside of the
health sector itself. As one simple example, people can now use their mobile phones to call for
emergency help if necessary. The spread of literacy and public awareness about health and disease also
enable people to promote their own health and survival.
There is another extremely important, yet subtle, lesson in Figure 9.2. Note that the very steepest part
of the curve is at very low incomes (that is, on the left-hand side of the graph). When countries are very
poor, even small incremental changes in income (say, from $1,000 per year to $2,000 per year) lead to
very steep gains in life expectancy, while the gains in health as the result of higher incomes tend to level
off at higher incomes. For instance, according to the relationship depicted by the solid line, a rise in
income from $1,000 to around $3,000 is associated with roughly 10 years of added life expectancy, from
45 years to 55 years. Yet going from $31,000 to $33,000, the same absolute gain in income, is
associated with less than one added year of LEB.
Now, some people might claim that Figure 9.2 shows that the best, or perhaps the only, way to higher
life expectancy is through overall economic development. Get rich and get healthy as well. But that
would be a mistaken interpretation. The fact that very small changes in the income of the poor can lead
5
to huge changes in health outcomes suggests an alternative interpretation: that modest but targeted
investments in public health for poor people can make a profound difference for their health outcomes.
Consider the following example, which is quite realistic. Suppose that health care depends on income in
the following way. Typically a poor country will raise around 20% of its GDP in domestic revenues and
will spend roughly 15% of those revenues on public health. The other 85% of the budget will be spent
on other needs like education, roads, power, water, public administration, interest on the public debt,
and so forth.
Now consider what happens when income rises from $1,000 to $3,000. Total taxes rise from $200 per
capita to $600 per capita (20% of GDP). Spending on public health therefore rises from $30 per capita to
$90 per capita (15% of the total revenues). The extra $60 per person of public spending on health can
make a huge difference, by ensuring proper coverage of all core health interventions, such as
vaccinations of children, safe childbirth, malaria control, and AIDS treatment for those individuals
infected with the HIV virus.
Now here is the exciting point. Figure 9.2 implicitly suggests that even a small incremental sum, as small
as $60 per person per year, could enormously boost public health. This is correct. Yet the poor country
may simply lack the budgetary means to provide that increment, since it would exceed its budgetary
revenues. What if a foreign funding source, such as the Global Fund to Fight AIDS, TB, and Malaria,
picked up the modest extra costs? The results could be enormous, even historic. Lives could be saved
by the millions; and with better health, the economy could actually enjoy a surge of economic growth.
Soon enough, it would be able to cover the health bills on its own, out of its own revenues, once it
reached a somewhat higher level of GDP per capita! This is the basic idea behind the successful concept
of Development Assistance for Health, which I discuss in greater detail later in the chapter.
Figure 9.3 maps out the under-five mortality rate (U5MR), which signifies how many children under the
age of five die for every 1,000 live births. The world average for the five-year period 2010-15 is 52 per
1,000, according to the UN Population Division estimates. For the developed countries it is 7/1,000, and
for the developing countries it is 57/1,000. For the Least Developed Countries, it is 99/1,000. Among
the world’s regions, the under-five mortality rate is the highest in sub-Saharan Africa (110/1,000), and
then South Asia (55/1,000). These two locations are the epicenters of the challenges of extreme poverty
and health.
6
Figure 9.3. Under-5 Mortality per 1,000 Births
Figure 9.4 shows another very crucial aspect of public health: maternal mortality. This is measured as
the number of pregnancy-related deaths (typically at childbirth but also earlier during pregnancy) for
every 100,000 live births. Pregnancy-related deaths have huge variation between countries since very
few women die of pregnancy-related causes in rich countries (16/100,000), compared to poor regions
like sub-Saharan Africa where around 500 women die for every 100,000 births. However, the maternal
mortality rate (MMR) in the developing regions is falling sharply. It was around 440 deaths per 100,000
live births back in 1990, but as of 2010 is below 250 deaths per 100,000 live births, an enormous
achievement in saving women’s lives.
7
Figure 9.4. Maternal Mortality for Developed and Developing Regions
In general, the reasons for death in rich and poor countries differ. The poor die from many of the same
causes that the rich do: cancer, cardiovascular diseases, and metabolic disorders such as diabetes. But
the poor also die of conditions that rich people no longer die of, especially communicable diseases such
as measles, malaria, or other kinds of infections. One basic principle of health is that under-nutrition
leads to the weakness of the immune system to resist infections (known as immunosuppression). For
that reason, children in very poor countries, who are more likely to be undernourished, die of diarrheal
diseases or respiratory infections that would not kill a better-nourished child in a richer country.
The disparities between rich and poor, and across ethnic groups, also apply within countries as well. The
United States, already noted as having the highest income inequality among the high-income countries,
also has significant disparities in life expectancy. Figure 9.5 shows the measured life expectancy for
women across counties of the United States. The northeast seaboard of the United States, including
Boston and New York City, has high life expectancies. However, counties of the deep south of the United
States, in states such as Alabama or Georgia, have several years fewer in life expectancy. AfricanAmericans have significantly fewer years of life expectancy compared with white non-Hispanic
Americans. The gaps cross both class and racial lines, and perhaps also reflect direct effects of
geography as well.
8
Figure 9.5. Life expectancy in US, Female (2010)
Various statistics are used to measure health outcomes. Life expectancy at birth, the under-five
mortality rate, and the maternal mortality rate are three important statistics we have already noted.
Another important and very widely used concept is Disability-Adjusted Life Years (DALYs). As I noted
earlier in referring to life-years lost, a normal lifespan is 80 years. If an adult dies at age 60, then 20
years of life are lost. DALYs count not only premature mortality but also disabilities. A year of life with a
disability is counted as a part of a year of life lost, with the portion dependent on the severity of the
disability. Thus, living a year with a very serious disability such as paraplegia, schizophrenia, or
blindness, is counted as a substantial fraction of a life-year lost, perhaps up to 0.9 years lost for each
year lived with the condition (depending on the specifics).
The DALYs of a population is the sum of life years lost plus the years lost to disability. It is standard to
divide the total DALYs by the population to calculate the DALYs per capita, just as we divide GDP by the
population to calculate GDP per capita. DALYs per capita are used to understand the varying disease
burdens across the world, as demonstrated in Figure 9.6. Every colored segment on the bar refers to the
DALYs per capita of a specific category of disease. The bar at the top of the chart is the DALYs per capita
of the high-income countries by disease category. The other bars refer to various regions of developing
countries. A large bar means that that the total DALYs per capita is high; that is, that the disease burden
is very high, with considerable premature death and disability. Clearly, sub-Saharan Africa has by far the
highest disease burden, while not surprisingly the high-income countries have the lowest disease
burden of any grouping.
9
Figure 9.6. DALYs by Region
The bars are divided by colors in an interesting way; they refer to different disease categories. SubSaharan Africa, for example, has the highest disease burden of HIV/AIDS (the dark blue portion at the
left-hand of the bar). This is not surprising, as Sub-Saharan Africa is the epicenter of the global AIDS
pandemic. The light blue portion of the bar to the right of the HIV category shows the DALYs caused by
other (non-HIV) infectious and parasitic diseases, such as malaria or typhoid. Here too the DALYs per
capita in sub-Saharan Africa is “off the charts” compared with the other regions.
Compare the bar for sub-Saharan Africa with the top bar for high-income countries. In the top bar we
see that HIV/AIDS is a tiny sliver. This does not mean that there are no deaths and disease from
HIV/AIDS in the high-income world, only that the burden of HIV per person is low compared with the
massive burden in sub-Saharan Africa. In the high-income countries, the category of communicable and
parasitic diseases is virtually imperceptible because it is so low on a per capita basis. Many of the
communicable diseases are either completely absent (e.g. malaria) or are prevented by standard public
health measures such as immunizations (e.g. measles). Other communicable diseases, such as diarrheal
and respiratory infections, are generally treated by antibiotics and are rarely fatal in the high-income
countries. The good news is that the field of public health already offers the tools to shrink the dark blue
and light blue bars in sub-Saharan Africa.
The very light blue bar to the right of the communicable disease category is “maternal, perinatal, and
nutritional conditions.” This category combines deaths due to pregnancy and childbirth, and deaths due
to severe under-nutrition. Once again, we see that Africa has an extraordinarily high disease burden in
10
these categories, far higher than in almost all of the rest of the regions. Only South Asia, like Africa, has
a very high disease burden for pregnancy and nutrition-related diseases.
Notice by comparing the DALYs per capita across the disease categories and regions that sub-Saharan
Africa’s extraordinary disease burden (in comparison with all of the rest of the regions) is heavily
concentrated in the first three conditions: HIV/AIDS, other communicable diseases, and pregnancy and
nutrition-related conditions. For all of the rest of the conditions, such as cardiovascular diseases or
cancers, the DALYs per capita in Africa and the rest are not very different. The key point is that Africa’s
high disease burden is not a general phenomenon but a specific one: it refers to infectious diseases
(including HIV), pregnancy-childbirth, and nutrition. By focusing on these main conditions, it would be
possible to have Africa’s public health conditions converge substantially with the disease conditions in
the rest of the world.
(There is only one other area that stands out: cardiovascular disease in Eastern Europe and Central Asia,
shown as the red category in the graph. We know that middle-aged men in Russia and some other parts
of the former Soviet Union are suffering massive disease burdens from heart attacks and other
disorders. There is no single accepted explanation for this, but it probably relates heavily to lifestyles:
heavy tobacco and alcohol use, binge drinking, little exercise, and a highly fatty diet.)
II. Poverty and Disease
Health is a challenge for all societies. In the rich world, where health conditions are far better than in
poor countries, the problems of high and rising healthcare costs are front and center of the political and
economic agenda. In the poorest countries, the challenges are also about finances, but much more
importantly are about the still very high burdens of disease and the tragic loss of lives.
Poverty and ill health go together. This linkage must be understood to address the challenges of heavy
disease burdens in poor countries, and the explanations need to be used to identify tools to break the
poverty trap itself. There is a two-way causation whereby poverty contributes to disease, while disease
also contributes to poverty. An individual suffering from disease cannot work at full capacity and so
loses income. A community or country with a heavy disease burden similarly loses income from the
resulting lack of productivity and the other high costs of health care.
Disease contributes through many channels. First, diseases of young children adversely impact the
entire lifecycle development of a young child. Repeated illnesses at a young age are likely to set a child
back in terms of readiness for school, capacity to learn, and even vulnerability to diseases as an adult.
For example, adult cardiovascular diseases can be exacerbated by poor nutrition of children at a young
age. Human development across the entire lifecycle is strongly affected by health and disease at early
stages of the life cycle.
Over the long term, a high death rate of children can contribute to adverse demographic problems.
Consider what happens when 200 of every 1,000 children born do not reach adulthood. Parents know
11
the high risks of children’s deaths and respond by having very large numbers of children. For example, if
the low-income parents want to be as sure that they raise a surviving son, either for cultural reasons
(such as to perform funeral rites) or pragmatic economic reasons (such as to support the parents in old
age), they may choose to have very many sons to ensure that at least one survives. (Note that the
preference for boys still applies in many cultures, and notably in many low-income settings in Africa and
Asia.) Yet aiming to have three or more sons might mean six or more children in total, sons and
daughters, leading to extremely rapid population growth and very low levels of investment per child in
health, nutrition, and education.
A high disease burden can have a strong direct adverse effect on a local or national economy as well. It
is not uncommon for a whole farm community to be knocked out by malaria and thus physically unable
to harvest the crops necessary for their survival. This kind of epidemic can have very serious harmful
consequences for poverty, destitution, and hunger. Another obvious negative economic consequence
of ill health is the direct cost of healthcare itself. Treating diseases can seriously deplete an already
squeezed household budget. What would seem to be modest outlays of a few dollars per disease, an
amount that would hardly be noticed in the rich world, can actually eliminate the margin of survival for
a very poor family.
Finally, it is obvious that investors are not very keen on investing into areas with high malaria or AIDS
prevalence. If a potential investors is aware that the labor force is likely to be sick, and that there will be
a need to replace absentee or dying workers and to cover their healthcare costs, the potential returns
on an investment are lower, perhaps decisively so. Nor is it helpful for tropical tourism if the risks of
infection of malaria, dengue, or other tropical disease are high.
The arrow of causation also goes in the reverse direction, from poverty to disease. That is the direction
of causation that people most naturally consider: poverty leading to poor health. There are many ways
that poverty causes disease and premature mortality. Most obviously, the poor often cannot afford a
doctor even when an illness is serious. They may be unable to afford the needed medicines, or the
transport to get to a hospital. Yet there are many other, less obvious ways in which poverty contributes
to a heavy disease burden.
One that I’ve already mentioned is the immunosuppression caused by under-nutrition. Children who are
not fed well, who lack basic micronutrients, and thereby have degraded immune systems are
consequently unable to resist disease and often succumb to infections that would be mild irritants of
well-fed and affluent children.
Poverty also tends to create a more dangerous home environment. Poor families in rural areas typically
do not have reliable sources of safe drinking water and sanitation. This means that many diseases are
spread by open defecation and then drinking unsafe water. Diseases like cholera are notoriously spread
in this manner. Poor communities have poor infrastructure (piped water, sewerage, electricity to
refrigerate or heat foods safely). Even the physical structure of housing can make a very big difference.
Many poor people live in adobe huts with thatched roofs, where there is often a gap between the thatch
12
and the walls through which various disease-carrying insects and other animals can easily enter the
household.
Poverty is also related to the ecological conditions of disease. Worm infections like hookworm, trichuris,
and ascaris are found in warm, moist tropical climates, so poor people living in those areas are especially
vulnerable to debilitating worm infections. Malaria is also a disease of the tropics, since malaria only
transmits in warm temperatures (generally above 18-degrees C or 64 degrees F). As a result, the poor
people living in tropical regions have that extra burden of disease. One can say that malaria is a
condition of poverty, but it is really a condition of the geography where many poor people live. I should
add that Africa’s malaria burden is especially deadly, and it is estimated that sub-Saharan Africa
accounts for up to 90% of the global malaria deaths. This seems to be caused by three main factors:
very warm temperatures, specific species of mosquitos that are particular to Africa, and enough rainfall
to support breeding sites of the mosquitos.
Poverty is also associated with illiteracy, innumeracy, and therefore poor health knowledge and weak
health-seeking behaviors. Illiterate people may have a great difficulty understanding how to fill a
prescription or adhere to a drug regimen. Health-seeking behavior is extremely important for all of us.
Poor people with less formal education have a harder time and lesser ability to ferret out the right kinds
of advice and help. This is why trained local health workers, such as Community Health Workers (CHWs),
can be vital to help poor people to understand how to keep themselves safe (e.g. by using an antimalaria bed net) and how to make the connections with the health system itself in the event of an
emergency or special need (e.g. safe childbirth or immunizations for children).
People living in poverty are also very vulnerable to being pushed into dangerous work, such as young
women who, because of their poverty, are cajoled or forced into sex work, and thereby become highly
vulnerable to AIDS and other sexually transmitted diseases, as well as to job-related violence and other
life-threatening conditions.
There are therefore the two directions of causation: poor health leads to poverty and poverty leads to
poor health. Whenever the arrows work in both directions such as this, there is the possibility of a
vicious spiral. A household can get trapped in poverty, and thereby succumb to disease, which in turn
lowers the earning power, and further traps the household in debt and poverty, and so forth.
Yet whenever there is a vicious spiral, there is also generally the possibility of a virtuous spiral as well.
Disease control can raise household and community income, and this higher income can lead to further
improvements in health. The result is an upward spiral of health and wealth, with each leading to the
other. It is part of the job of public health policy to help break the vicious circle that traps people in a
poverty-and-disease trap, and to create a positive spiral of health and development.
Breaking the Vicious Circle of Extreme Poverty and Disease
13
How best can we intervene to stop the vicious circle of disease and poverty, and turn it into the virtual
circle of health and wealth? The first thing to do is to implement what the health ministers called for
back in 1978 in Alma-Ata: a primary health system for all. The second step is to help poor communities
to achieve better nutrition. Part of that may occur through dietary fortification and supplementation, or
through better community knowledge about healthful diets. Part will also come through improvements
in the agriculture sector. More productive farmers growing more food will support healthier diets, and
the community may generate a surplus that can be used, for example, for school feeding programs.
Agricultural interventions can thereby play a role not only in improving agriculture and raising
household income, but also in reducing the overall disease burden, once again illustrating the integrated
nature of sustainable development.
Local infrastructure is another kind of investment in public health, in areas such as safe drinking water,
sanitation, power, roads, and communications. Investments in electricity are needed to run the
refrigerators in clinics that keep the vaccines cooled, or to power the instrumentation needed for
emergency obstetrical care. (There are of course dozens or hundreds of high-priority uses of reliable
electricity.) Investments in water infrastructure help pump the irrigation water that improves
agriculture. Roads are vital to be able to reach health facilities. Phones and internet have multiple
purposes, ranging from simple text messaging to telemedicine. These are not health interventions per
se, but communities that have access to phones and the internet are also very likely to have access to
better health.
There is some important progress in expanding access to a rudimentary health system in low-income
countries. Figure 9.7 shows the data on the mortality rates of children under the age of five. Back in
1990, 12 million children under the age of five died. By 2010, the number was 7.6 million. As of 2012, it
was down to 6.6 million. This decline is a huge victory for public health, but it is still 6.6 million too
many, since almost all of these deaths are caused by preventable or treatable diseases.
Figure 9.7. Deaths of Children Under Five (thousands)
14
In Figure 9.8, those same mortality rates are put in terms of numbers per thousand live births (the
under-five mortality rate, or U5MR) rather than aggregate numbers. In 1990, on average 88 per 1,000
children in the world did not live to their fifth birthday. By the year 2010, that rate had declined to
around 57 per 1,000 children. It is still a high number that can and should be cut significantly, but the
under-five mortality rate is indeed falling sharply.
Figure 9.8. Under-Five Mortality Rate
More than 6 million of the 7.6 million total deaths in 2010 were in just two regions, sub-Saharan Africa
and Southern Asia. These are the continuing epicenters not only of overall poverty but also of the
disease burden and of preventable and treatable diseases. Where are poor children succumbing, and to
what kinds of conditions?
This question is addressed by Figure 9.9, which estimates the worldwide causes of deaths of children
under five. The overwhelming message of this chart is that there is still a very high burden of
communicable diseases, including diarrheal disease, pneumonia, measles, malaria, and other infectious
diseases. Another major category, death at childbirth, includes birth asphyxia, trauma, prematurity, and
severe neonatal infections. Many of these causes can be attributed to a lack of sanitary birth conditions
or simple equipment to help newborns breathe, and thus could be reduced substantially at low cost.
15
Figure 9.9. Major Causes in Death for Children Under Five
This kind of epidemiology is a good start in terms of understanding what to do. There is a povertydisease trap, where poverty feeds disease and disease feeds on poverty. This disease burden is heavily
concentrated in sub-Saharan Africa and South Asia, and is significantly composed of diseases that are
either communicable, birth-related, or nutrition related. Now that we better understand the specific
problems, an effective starting point for addressing the continuing health crisis in low-income settings is
to build a primary health system that is responsive to these specific challenges.
III. Designing & Financing Primary Health Systems in Low Income Countries
The starting point for designing an appropriate health system is in the science of public health. What is
the field of public health? When we think of medicine, we think of doctors and nurses who treat
individual patients. Public health can be called population health. It tackles the treatment and health of
a population rather than an individual, partly through the work of doctors and nurses but through other
tools as well. Attention to safe drinking water, community access to anti-malaria bed nets, and
widespread coverage of effective vaccines are examples of critical tools in public health beyond what
doctors and nurses provide. The public health solutions differ by location and income level because
they depend on the specific disease burden in any location.
Public health is a highly effective specialty and can be very systematic in practice. The public health
approach starts with the epidemiology of disease, as we have just done with deaths of children under
age of five. The public health specialist must understand the disease burden in a particular population.
What is the DALY count for each disease? What is the prevalence of the disease in a population? What is
16
the incidence (number of new cases) of the disease in a given time period? Epidemiology measures the
disease burden in a systematic way and also focuses on the transmission mechanisms. Is the disease
transmitted person-to-person? Does an intermediate insect vector pass the infection from one person
to another (such as in the case of the mosquito with malaria)? Epidemiologists need to understand the
various categories of disease; who the diseases burden; and how the diseases are transmitted.
The second stage of good public health thinking is to examine the feasible and desirable interventions,
both within the health sector and in the closely related sectors of nutrition, agriculture, and
infrastructure. What exactly can and should be done? We can think of these as the “apps” of public
health, though in the field of public health, they are generally called interventions. The interventions are
systematic packages of diagnosis, treatment and follow-up that address particular problems such as
malaria or neonatal resuscitation.
The third step of good public health is “systems design.” Suppose that you have created a list of needed
interventions, for example that every child should get immunizations, every household should have bed
nets, and every mother should have a specific number of antenatal visits. Then, systems design creates a
way for the public health system to delivers these interventions properly and effectively. Who should do
the work for each intervention? Who should give immunizations: doctors, nurses, clinical officers, or the
Community Health Workers? How should anti-malaria bed nets get distributed to best ensure that
households know how to use them? Which organizations or agencies should guarantee the supply chain
of medicines? Who should perform and interpret a diagnostic test? Who manages the health workforce
for its competence, honesty, and hard work?
These are the kinds of challenge that a business faces in running an organization. Running a public
health system is also a quite complicated challenge. Building that system from scratch in a very poor
setting is extremely difficult and important work that brings up issues of training, recruitment, job
designations, and so forth. This system has to be translated into actual management and
implementation. There are many things to do. If you are in charge, you may have to invest in a new
operating theater for emergency obstetrical care; build an examination room; design a new clinic; and
drill a new borewell for safe drinking water. You may have to train a local public health labor force,
usually from a starting point of woefully few health professionals.
The public health system centrally involves the individuals in the community who seek healthcare and
have to be connected with the health facilities. There should be trust and confidence in the Community
Health Workers. Households should understand health risks and health-seeking behavior when disease
strikes. Oversight of key personnel is crucial, as it is in any organization. How do you as the public health
official make sure the work is actually getting done, and that budget funds are used properly? How do
you make sure the disease burden is as expected and thus your interventions are properly targeted?
Additionally, a good system not only monitors outcomes for management purposes, but also evaluates
and assesses the performance of the health system. The health system should use timely information to
interrogate its own performance. For example, if the data show that a mother died in childbirth, the key
17
health personnel should investigate the death, determine if it was in fact preventable, and if so,
understand what kinds of adjustments will be needed to prevent a recurrence in the future. This kind of
feedback system is absolutely crucial for practical success.
Next comes financing. It is not surprising that money looms large in this issue of healthcare in lowincome settings. These are places where the absence of money plays a pervasive role in the continued
high prevalence of preventable and treatable diseases. Even if a health system is designed with high
efficiency, smart epidemiology, and cost-effective interventions, a poor community will need help to
afford the health system to address the disease burden. A finance strategy will be vital.
Some feasible interventions that are based on the local epidemiology include interventions for malaria.
A mosquito transmits the single-celled plasmodium pathogen from individual to individual. How does
the health system best protect the population? This could be done through medicines that kill the
pathogen in an infected individual. It could be done through preventions such as the use of larvicides,
which kill the larvae of the anopheles mosquitoes before they mature to become malaria-transmitting
mosquitoes. It could also be done through the mass distribution of anti-malaria bed nets that block
mosquitos from biting, or spraying the inside walls of houses to kill mosquitos that come inside for blood
meals. In fact, an effective control system will deploy several of these strategies together, not just one
alone.
There are many examples of how good epidemiology can be connected with a strong set of highly
effective and low-cost interventions. The results can be very striking and remarkably positive. In 2013
dollars, the total cost of a basic primary health system that addresses the previously described diseases
might be no more than $60-$90 per person in the community per year. This is a remarkably low cost to
address all of those disease conditions, but the irony is that even $60 may be too much for a
government in a very poor country. This is the part that is hard for those in the rich world to appreciate,
because most people in high-income countries assume intuitively that if diseases with low costs of
control nonetheless continue in very poor communities, it is perhaps because the host government is
not trying very hard to deal with the issue. That inference is simply not correct. (I am not denying that
some governments in low-income countries don’t try very hard; I am saying that even exemplary
governments in such countries also need external financial assistance.)
It is often hard to remember the financial plight of the very poor. A country such as Malawi is at around
$400 per capita at current market exchange rates. As I noted earlier, a country like Malawi will typically
collect around 20% of its national income in taxes. Twenty percent of $400 leaves the government’s
domestic revenue collection at $80 per person per year – that will be used to finance the government,
the national defense, the police, the roads, the power sector, the roads and ports, the water and
sanitation, the schools, environmental conservation and yes, the public health system. Budget experts
have recommended that governments in low-income settings devote around 15% of the total budget to
the health sector, but at $80 per capita, 15% comes to just $12 per capita per year devoted to public
health! In Europe and the United States, the public health budget is $3,000 per person, per year and
18
$4,000 per person per year. Figure 9.10 illustrates the various levels of GNP per capita, health spending,
and health outcomes (through the U5MR) for low-income, middle-income, and high-income countries.
Figure 9.10. Poverty, Budgets and Health Sector
The point is that even trying hard with its own revenues, a poor country cannot reach the necessary
$60-$90 per person per year on its own. As I emphasized earlier, this is why Official Development
Assistance (ODA) is so important for public health. Such ODA should be carefully, scientifically, and
professionally targeted towards improving the health and health systems of poor people. I advocated
for this kind of development aid when I chaired the Commission on Macroeconomics and Health for the
World Health Organization in 2000-2001, and I have championed such aid for more than a dozen years
as Special Advisor to UN Secretary General Kofi Annan (2001-2006) and UN Secretary General Ban Kimoon (2007-present).
A case in point of effective aid implementation is the Global Fund to Fight Aids, Tuberculosis, and
Malaria, which I was very honored to help design and launch in 2002. Based on the extra ODA supplied
by the Global Fund, the poor countries have achieved huge improvements in the control of all three
diseases since the Global Fund’s establishment. The Global Alliance for Vaccines and Immunization
(GAVI) is another great program that provides international financing for immunization coverage. The
United States’ President's Emergency Plan for AIDS Relief (PEPFAR) and the President’s Malaria Initiative
(PMI) have also been quite successful in improving health outcomes in poor, disease-stricken countries.
These kinds of targeted, focused programs backed by ODA have been hugely effective and very
successful because the funds have been carefully monitored, assessed, and evaluated at each step of
the way. Figure 9.11 is heartening. It charts the takeoff of Official Development Assistance for health,
19
especially bilateral assistance, from governments to low-income country governments after the year
2000. With this added funding, malaria is coming down, the AIDS burden is coming down, treatment for
tuberculosis is expanding, and under-five mortality and maternal mortality rates have come down
considerably. These successes demonstrate that ODA for public health works very well. Yet the poorest
countries still do not have the full financing they need. The national budget gaps remain significant,
perhaps $20-30 dollars per capita (depending on the country), even though the financing gaps have
been partly covered in recent years by the step up in ODA.
Figure 9.11. Global Official Development Aid for Health and Population
I have recommended over the years that the rich countries should be giving around $40 per person in
the recipient countries for these purposes. We are perhaps at the halfway mark or even a little above
half way, and this has made a big difference, but there still is an important financing gap that needs to
be closed to achieve our longstanding and crucial objective of health for all.
IV. Ten Recommended Steps to Health for All in the Poorest Countries
The period of the Millennium Development Goals since 2000 has been an exciting one for public health.
Malaria is a prime example. Malaria is a not only a lethal disease, but it spreads very widely and in many
parts of Africa. In many regions it is holoendemic, which means that the whole community is typically
infected much of the year unless active control measures are put in place. Controlling malaria is
therefore a great feat; and malaria is being controlled right now in sub-Saharan Africa thanks to the
focused efforts of organizations like the Global Fund and the US PMI. It is also thanks to great advances
in public health and in new technologies, such as insecticide-treated bed nets; CHWs who go into the
20
communities rather than waiting for sick people to carry their dying ones over many kilometers; and
new diagnostic tests, where instead of a microscope that reads the blood to detect the plasmodium
pathogen, a prick of the finger allows a CHW on the spot to know within a few minutes whether a child
is infected with malaria. New medicines such as artemisinin are replacing medicines like chloroquine
that have lost their efficacy to the parasite’s drug resistance. All in all, malaria deaths of children under
five have declined by around 50% since the year 2000.
By now the poor countries have gotten more than half way to building their primary health systems, and
we should take inspiration from the recent health successes and move forward to fulfill the commitment
to Health for All that was made back in 1948.
I have 10 basic recommendations of how we could achieve the full breakthrough in the next decade.
The first is financial. This total need for ODA for health is around $40 billion a year, which is roughly $40
per person for the 1 billion people who need the help. Since there are also about 1 billion people in the
rich world, we need around $40 from each person per year in the rich world in order to save millions
and millions of people each year in the poor countries. $40 per person in the rich world is the bargain of
the planet. It comes out to just 10 cents for every $100 dollars in the rich world. Current aid flows for
health are roughly about half of what is needed.
Recommendation 1. Rich countries should devote 0.1 percent of GNP ($40 billion per year as of 2009)
to health assistance for poor countries in order to close the financing gap of the primary health
system.
The second recommendation is to put that money into highly effective organizations. My own
recommendation would be to transform the Global Fund to Fight AIDS, TB and Malaria, which has done
such an outstanding job, into a more general Global Health Fund; and to channel about $20 billion per of
the $40 billion per year (that is, half) through the Global Health Fund. This expanded fund would help
poor countries to establish their basic health care systems with all of the components discussed earlier.
Recommendation 2. Half of that money should be channeled through the Global Fund to Fight AIDS,
TB, and Malaria, which would become the Global Health Fund.
The third recommendation is that the low-income countries contribute around 15% of the total national
budget for funding health. (The 15% target is known as the “Abuja Target.”)
Recommendation 3. Low-income countries should fulfill the Abuja Commitment of allocating at least
15% of domestic revenues to the health sector. Total spending (domestic and external funding) should
be at least $60 per person per year in order to ensure basic health services.
The fourth recommendation is to finish up the job of comprehensive malaria control. Malaria is a
pernicious disease, a killer, and a burden on development; but we are so close to having it under control
21
that attention must be paid towards it. The world should adopt a plan for comprehensive malaria
control. That would cost roughly $3-$4 billion a year, which would enable the poor countries to finish up
the building of supply chains, and the funding of Community Health Workers, rapid diagnostic tests,
medicines, and so forth, to really get the job done.
Recommendation 4. The world should adopt a plan for comprehensive malaria control, with an (near)
end of malaria mortality by 2015 (estimated cost $3-$4 billion per year).
The fifth recommendation is that the leading donor countries should fulfill their long-standing
commitment to providing universal access to antiretroviral medicines (ARVs) for individuals infected
with HIV. These medicines work, and the treatment of poor people will save their lives. More treatment
would also mean much lower transmission of the disease, because when an HIV-infected individual is
treated with antiretroviral medicines, the viral load (the concentration of the virus in the body)
diminishes sharply. This makes it much less likely for the virus to be transmitted from the infected
individual to another.
Recommendation 5. The G8 should fulfill the commitment to universal access to ARVs.
The sixth recommendation is that the leading donor countries should also fulfill their commitment and
partnership with the poor countries in fully funding the Global Plan to Stop Tuberculosis (TB). This too
has a financing gap on the order of $3-$ billion a year, roughly $3-$4 per person per year in the highincome world. Roughly a cup of coffee once per year at a favorite coffee shop in NYC or London would
be what is needed incrementally to build the requisite funding!
Recommendation 6. The world should fulfill the Global Plan to Stop TB, including closing the financing
gap of $3-$4 billion per year.
The seventh recommendation is that the world, especially the donor countries in their financing and the
poor countries in their implementation, should guarantee access to sexual and reproductive health
services. This would include emergency obstetrical care for safe childbirth, antenatal care for safe
pregnancy, and modern contraceptives, as households would like. Many women around the world do
want to use modern contraceptives and have fewer children, but they lack the access or the funds to be
able to afford this on a market basis. These women need full funding of family planning services,
contraception, emergency obstetrical care, and pregnancy care at a very low budget so that these
services can be made universal.
Recommendation 7. The world should fulfill the funding for access to sexual and reproductive health
services, including emergency obstetrical care and contraception, by the year 2015, partly through the
Global Health Fund and partly through the United Nations Population Fund (UNFPA).
The eighth recommendation is for the Global Health Fund to take up the “neglected tropical diseases.”
These neglected tropical diseases are less in the headlines than malaria or AIDS. They include
22
hookworm; the worm infections ascariasis, trichuriasis, onchocerciasis, and schistosomiasis; and
lymphatic filariasis, which is another vector borne tropical disease with terrible consequences, but that
can be controllable through bed nets and with ample effort and organization. Another neglected disease
is blindness from cataracts, which can now be treated with surgery at remarkably low cost.
Recommendation 8. The Global Health Fund should establish a financing window for seven
controllable neglected tropical diseases: hookworm, ascariasis, trichuriasis, onchocerciasis,
schistosomiasis, lymphatic filariasis, and trachoma.
Recommendation nine calls on the Global Fund to establish special financing to complete the health
systems, for example the training and deployment of Community Health Workers. This would be a
crucial part of the transformation from a disease-targeted fund to a general Global Health Fund that
provides a broad base of services. My colleagues and I have also called for the United Nations to help
African nations to deploy one million CHWs to Africa by 2015, as a major boost for achieving the
Millennium Development Goals.
Recommendation 9. The Global Health Fund should establish a window for health systems, including
the mass training and deployment of One Million Community Health Workers in Africa by 2015
Finally, the tenth recommendation is to address the number of non-communicable diseases that have
been typically overlooked in many of these urgent MDG-related efforts. Dental care, for example, is very
basic and important but often not present in poor countries. Eye care, mental health counseling, and
mental health interventions are also crucial for the massive burden of depression, which is pervasive
around the world. There are many cardiovascular diseases where people have undiagnosed high blood
pressure and hypertension that can cause loss of life for adults if untreated, but where the adverse
consequences can be controlled. A number of cancers can be addressed at a very low cost. Campaigns
against tobacco use are a crucial part for any good public health system, because tobacco remains a
massive killer. This is a behavioral challenge, but one that needs to be met because it is one of the most
effective ways to save lives.
Recommendation 10. The world should introduce primary healthcare (mass prevention and
treatment) of non-communicable diseases, including: oral health, eye care, mental health,
cardiovascular disease, and metabolic disorders; including measures on lifestyle (smoking, trans-fats,
urban design for a healthy environment), surveillance, and clinical care.
The moral of the story is that the world is close to achieving primary health for all. The Millennium
Development Goals have hugely spurred the effort. We can now see a pathway to health for all – the
next phase of the global development objectives and the Sustainable Development Goals. Universal
health coverage will feature prominently in the next phase of goals, and we will have the opportunity to
complete what we have started – to finally achieve health as a basic human right.
V. The Continuing Challenges of Health Coverage in the High-Income Countries
23
We have analyzed the challenge of health in the very poorest parts of the world. One might assume
there is no longer a challenge at the opposite end of the income spectrum in the upper income
countries. Life expectancy is high and the healthcare systems are technically very sophisticated. In the
high-income countries, annual public spending for healthcare is typically around $3,000 to $4,000 per
person per year in the public budget. In the United States, the sum of public and private spending for
health is $8,000 per person per year.
What then is the problem? The problem, especially in the United States, is that $8,000 per person per
year is incredibly expensive. It is so expensive that it is a major burden on the economy (around 18% of
the total GDP, the largest single sector of the economy!), a major burden on the budget, and a major
burden on poor people who are often priced out of the healthcare market entirely, as well as on those
in the middle class who may be burdened with crushing healthcare costs. In the United States there is
high inequality of income alongside expensive healthcare, and a rather limited social safety net provided
by government programs.
The puzzle I want to explore is one that is specific to the United States, in one sense. Why is the US
healthcare system so expensive compared with others? Even though the problem is mainly in the US,
the lessons of the US case are globally applicable, and therefore important to understand.
One of the main reasons why the US system is so expensive is that it is a privately oriented health
delivery system. Yet there is the common insistence in the US debate that the private sector is more
efficient, and the public sector is inefficiently bureaucratized and very costly. Nonetheless, in the United
States, where the private sector role in healthcare is the largest of any high-income country, the costs
per person are also the highest. It is important to understand why this is the case, because it gives
further understandings of the proper boundaries between public and private sectors, especially in the
health systems. In general, it helps overcome a presumption that the free market is always the best
solution. The results of this free-market orientation in US healthcare are peculiar, to say the least.
From the start, it should be understood that health is not a typical market commodity. For one reason, it
is a merit good: most of us agree that access to healthcare should be universal. Health is a basic human
right. Health therefore starts out in a very specific situation, similar to education. Public provision of
these services is important if for no other reason than to help ensure that the poor are able to gain
access to these merit goods just like the rich.
But the problem goes even deeper than that. The economist Kenneth Arrow, the great Nobel laureate,
in a seminal 1963 article observed that the health sector cannot really operate like a competitive market
sector because there is a fundamental problem. Patients generally do not know what is best for them
medically. They must rely on their doctors, who presumably do know (or should know!). Arrow noted
that such an asymmetry of information violates one of the basic assumptions of the proper functioning
of a free-market economy, which is that consumers and suppliers in a transaction have similar
information.
24
What happens when only the suppliers have the information? Your doctor says you need a test and
generally you listen to what the doctor says. When there is asymmetric information, and the supplier is
the one who has the knowledge, then it is possible that the consumer can end up being overcharged and
overbilled if the incentives facing the suppliers are not properly designed. Unfortunately the US system
has this problem. Too many healthcare providers have the incentive to overcharge patients, either by
fraud, over excessive use of procedures, or use of monopoly power (such as when there is only one
hospital in the community).
There are other problems with treating healthcare as if it were a free-market commodity. Healthcare
requires insurance because of the possibility of expensive healthcare costs in the event of a serious
disease. Yet if individuals know their conditions while the health insurer does not, the insurer will find
that the health premium is too low. The health insurer will raise the premium, so that healthy people
will not buy insurance and only very sick people (who expect to use the insurance coverage) will do so.
The pool of insured individuals will increasingly include only those who are already sick or who have
good reason to believe they are likely to become sick. The insurance market will shrink, and even
collapse, in what is commonly called an “insurance death spiral. ”
The US system is characterized by substantial fraud, excessive care, waste, and monopoly power of local
health providers. Insurance markets do not work well, and leave many people outside of the private
system. The Affordable Care Act, also known as Obamacare, addresses some of the problems, but does
not really get to the crux of the excessive health care costs in the US. The US system therefore remains
far more expensive than other systems that rely much more on regulated prices and much less on
private, unregulated health providers.
In Figure 9.12, the dotted black line at the top is the cost of spending in the United States per person. It
is soaring. Back in 1980, the average spending on health in the United States was about $1,000 per
person. By the year 2009, it was $8,000 per person. Norway, another rich country, is next, but at a
much lower level of around $5,500 per capita. In general, the rest of the rich countries are clustered
around this lower level. Typical spending is around $4,000 per person per year outside of the US – half
of the US level.
25
Figure 9.12. Average Spending on Health
Figure 9.13 shows spending divided by national income to get the share of health outlays as a
percentage of income. Back in 1980, the United States was spending about 9% of its national income on
health. By 2009, that had doubled to 18% of national income. In 1980, all of the countries including the
US were rather tightly clustered between 6% and 9% of national income. As of 2009, for most countries
the spending is about 10% of gross national product, but the US has separated from the pack and
become the most expensive healthcare system in the world. In general, health costs and health outlays
as a share of national income have been increasing, yet not at the same pace as the US.
26
Figure 9.13. Health Outlays as a Percent of GDP
One of the leading scientific organizations in understanding the US health system, the Institute of
Medicine of the US National Academies of Science, found something extraordinary in a recent study.
The waste, fraud and abuse in the healthcare system amounted to as much as 5% of US national income,
about $750 billion a year. This is from overbilling, waste of resources, repeated tests, outright fraud, and
the high management costs. To put it into context, the US is spending 18% of its gross national product
in health while only getting 13% of national income in real value.
The distinctiveness of the US system in the size of the private sector is illustrated in Figure 9.14. The
figure shows the share of total health spending that comes from private sources (e.g. private payments
to an insurance company) as opposed to public (budget) sources. We see that the US is the only country
where private payments are more than half of the total outlays. The US is both the most expensive and
the most private system. This is not a coincidence. It is the mistaken reliance on the private market
system, one that does not satisfy the assumptions of an efficient, competitive marketplace, which
explains America’s over-priced system.
27
60
50
40
30
20
10
United States
Korea
Israel
Switzerland
Greece
Portugal
Australia
Canada
OECD average
Slovenia
Spain
Finland
Ireland
Belgium
Germany
Austria
Italy
France
New Zealand
Japan
Sweden
Iceland
Luxembourg
Norway
United Kingdom
Denmark
Netherlands
0
Figure 9.14. Private Health Outlays as Percent of Total Health Outlays
One can see this in Figure 9.15, a systematic comparison of US costs with the costs in other high-income
countries for some specific commodities and services. For example, the US cost of the 30 most
commonly prescribed medicines is set at an index of one. Then the cost in New Zealand is calculated at
.34, which means one-third of the US cost. The cost in Australia is .49, roughly one-half of the US costs of
those medicines. The cost in the US of a visit to a physician paid by a public sector program ($60) is
comparable to what is paid in other countries. However, the cost that is paid by a private payer or
private insurance company is over twice the amount ($133) that is paid by the public payer. The US
system costs are still simply out of sight.
28
Figure 9.15. Drug and Physician Prices (2011)
Figure 9.16 shows the spending for each patient discharged from a hospital. How much was spent on a
patient in the United States in 2009? Remarkably, the cost per hospital discharge was $18,000! In
France and Germany, it was less than a third of this amount. The average of the OECD, a high-income
country group, was one-third of the average discharge cost in the United States.
29
Figure 9.16. Hospital Spending Per Discharge
Another disparity is in salaries. US doctors make far more than doctors in other countries. In 2008
orthopedic physicians in the United States made $440,000, while those in Germany made less than half
of that, $202,000. America’s high salaries are shown in Figure 9.17, which charts physician incomes
across selected countries.
Figure 9.17. Physician Incomes (2008)
The US system is remarkably expensive, not because it is delivering a huge range of services that other
countries are not, and not because the outcomes are better, but because the unit costs of the
interventions and medicines are much higher than in the other countries.
There is one final dimension to this issue: political economy. The health sector in the United States is
politically powerful, so it is able to resist effective regulation or replacement by a public system. Indeed,
the private healthcare industry should be considered one of the four most powerful lobbies in the
United States, alongside Wall Street, the military-industrial complex, and the oil industry. Indeed, during
1998-2012, the lobbying outlays of the health industry exceeded those of every other industry except
“miscellaneous” (which means a grab-bag of several industries), as we see in Figure 9.18. This powerful
healthcare lobby has so far prevented any remedial action on the excessive costs.
30
Figure 9.18. Lobbying Outlays (1998-2012)
The health sector is also a major contributor to campaign financing. The health sector was number five
on the list of industries in terms of the size of campaign contributions during the most recent campaign
cycle (Figure 9.19). In the complete campaign cycle of 2011 to 2012, management and employees of the
health sector contributed approximately $260 million of campaign contributions. This means politicians
are attentive to the interests of this concentrated group, and not necessarily to the interests of the
taxpayers or the citizens more generally.
Figure 9.19. Campaign Financing by Industry (2011-2012)
31
What are some of the reform options?
The first would be to move to a single-payer system as in Canada. Canada’s health system is far lower
cost than the United States, and with very high quality. The governments of Canada’s provinces cover
most costs of health care, so that private outlays are below 30% of the total.
A second possibility is what is called an all-payer system. Health payments would still come from private
employers, but regulations would prevent the exercise of monopoly power in pricing. In particular there
would be a single, publicly known price for every health service. Hospitals and doctors would not be
allowed to “price discriminate,” that is, to charge a monopoly price when they can get away with it (as
they can do now).
A third possibility is called capitation. Rather than paying service by service, the hospital or doctor
would receive a fixed amount of money per patient per year, irrespective of the specific services that
need to be provided during the year. The fixed amount would be according to the “expected costs” of
providing quality healthcare. If the actual costs are higher, then the hospital would bear the excess.
There would be no way to overcharge per patient, and no incentive to call for excessive services. Of
course, there might be trouble in the other direction, that the doctor or hospital refuses to carry out a
procedure or surgery since there is no added financial incentive to do so. To make such a system work,
the healthcare provider would be responsible for quality care and would be subject to review of
performance.
Finally, technology can be the friend of lower costs, with information technology, smarter systems, and
even patients monitoring their key vital signs at home, that can all be used to bring costs down sharply.
In some places, healthcare providers are already using extensive distance monitoring of a patient, in
which clinical information is automatically transmitted and read at a distance. With these new
technologies it is also possible that low-cost Community Health Workers can provide some of the
services currently provided by high-cost doctors and nurses.
There are plenty of paths to reform. Incentives must be partly changed, and new technologies must be
deployed. Of course, that kind of reform also depends on politics. If the lobbies get their way, there will
continue to be greatly inflated costs. If the US system is run for the public’s benefit, then tremendous
good can be done to reach more people, and improve health outcomes at considerably lower cost.
32


© Copyright 2026