
New Look Annual Report 2014
N E W
L O O K R E TA I L G R O U P L I M I T E D
A N N U A L R E P O R T 2 0 1 4
2
NEW LOOK ANNUAL REPORT & ACCOUNTS 2014
3
Contents
Overview
04
Chairman’s statement
15
CEO’s statement 17
Strategic report
Business model
30
Year in review
36
Financial review
44
Risks & uncertainties
54
Corporate social responsibility
58
The Directors’ report
The Directors’ report
64
Directors’ responsibilities statement
67
The Board
68
Financial statements
Independent auditors’ report – group accounts
72
Consolidated income statement
73
Consolidated statement of comprehensive income
74
Consolidated balance sheet
75
Consolidated statement of changes in equity
77
Consolidated statement of cash flows
78
Notes to the group financial statements
79
Independent auditors’ report – company accounts
128
Company balance sheet
129
Notes to the company financial statements
130
Contacts136
4
NEW LOOK ANNUAL REPORT & ACCOUNTS 2014
OVERVIEW
We deliver fashionable product and great value, helping
people express themselves, look good and feel great
3
5
5
4
NEW LOOK ANNUAL REPORT & ACCOUNTS 2014
6
A Global Retailer
KEY
Owned stores
Franchise
Ecommerce
(Own website & 3rd Party partners)
Store numbers
New Look International Franchise
Armenia2
Azerbaijan1
Bahrain3
Georgia2
Indonesia12
Kazakhstan1
Kuwait2
New Look Owned
Libya2
Malta3
Belgium10
Romania7
China5
Russia20
France28
Belgium4
Saudi Arabia
Germany8
France272
39
Singapore7
Mim Owned
Netherlands13
Mim Affiliate
Thailand1
Poland10
29
France74
UAE17
Republic of Ireland
Ukraine6
UK576
Total125
Total679
Total356
Morocco4
Romania2
OVERVIEW
Store numbers
FY10 FY11 FY12 FY13FY14
New Look UK Stores
602
607
600
589
576
New Look International
109
144
183
213
228
New Look Brand
711
751
783
802
804
Mim inc Affiliates 307 300 316 336356
Group
1,018 1,0511,099 1,1381,160
*
* For an explanation of the affiliate model see Strategic Business Model page 34
7
NEW LOOK ANNUAL REPORT & ACCOUNTS 2014
8
UK’s #1
Favourite
Fashion
Retailer
†
Who we are and
what we do
Our business
model
Founded in 1969, New Look has grown from a single store to
become a dynamic, international, multichannel retail brand
with a unique value-fashion offer in apparel, footwear and
accessories for women, men and teenage girls. Our affordable
take on celebrity style and fashion trends aims to help people
express themselves, look good and feel great.
New Look operates a flexible, fast-fashion business model
that allows us to react quickly to emerging trends and deliver
exciting, fashionable product ranges with a constant sense
of newness.
We’re proud to be Britain’s second-biggest womenswear
retailer*. We have the largest share of the UK’s combined
apparel, footwear and accessories market for women under 35*,
and, in December 2013, we were thrilled to be named Britain’s
favourite fashion brand in the authoritative annual Fashion
Brands Index**.
Our estate of 576 UK stores places New Look in immediate
reach of the majority of the British population. The Group
has as many stores beyond the UK, trading either as New
Look or as Mim. Our fast-growing E-commerce business
at newlook.com currently serves over 120 countries
worldwide, and our E-commerce channels including 3rd
Party partnerships now account for £1 in every £10 spent
with us.
†
*
**
Results based on survey of 10,000 respondents by brand recommendation site, dressipi.com.
Year to March 2014 (by value), as measured by Kantar Worldpanel
Measures from CACI Retail Footprint
Although our attractive price architecture positions New
Look in the value sector, we strive for ‘best in class’ service
standards as well as a consistent ‘one voice’ customer
experience across all channels and markets.
Whilst the UK remains New Look’s single biggest market,
we have an increasingly important international foothold.
We’ve also embraced new opportunities of the digital era,
becoming a truly multichannel business. Now, as well as at
New Look stores throughout the UK and overseas, customers
shop with us online at newlook.com, via our mobile app, or
through 3rd Party E-commerce partners. Additionally, they
engage with us on Facebook, Twitter, YouTube and our other
social media platforms.
OVERVIEW
Total sales were £1,528.8
million with gross profit of
£805.9 million
Significant advances
towards our strategic goal of
international expansion
Significant growth of £58.4
million in E-commerce
Transformational
bond refinancing
3rd Party E-commerce has
extended our global reach
Key operational achievements
of Financial Year ended
29 March 2014 (FY14)
We’re pleased that FY14 proved another progressive
year for New Look, despite the continuing challenges
of economic uncertainty, low consumer confidence and
competition. Total sales were £1,528.8 million (FY13*:
1,484.0 million) with gross profit of £805.9 million (FY13*:
£785.1 million), and Adjusted EBITDA** of £200.2 million
(FY13*: £189.2 million).
We also achieved significant growth of £58.4 million,
or 63.9%, in E-commerce, partly driven by important
enhancements to the functionality, design and content of our
transactional website at newlook.com. Within the UK, more
customers than ever before used our Click and Collect and
Order In Store services. Our new in-house fulfilment facility
at Lymedale fully supports our increasing online sales and
extended range of delivery options.
FY14 also saw important developments in 3rd Party
E-commerce. Building on the success of our partnership
with ASOS, we signed agreements with a further 6 partners,
spanning 3 continents. This has extended our global reach,
giving us exposure in markets where we previously had little or
no presence. We’re very encouraged by the initial performance
of these new channels.
* FY14 on 52 week basis, FY13 comparative on 53 week basis. For full discussion see Financial Review
** For a full definition of Adjusted EBITDA see page 51 in the Financial Review
In May 2013, we completed our transformational bond
refinancing, providing an improved capital structure
and extending maturities for five years. Before the
year-end, we made 2 significant advances towards
our strategic goal of international expansion. In
February we were able to buy back our Polish franchise
business, giving us an exciting opportunity to develop
our foothold in a market where the New Look brand
is already known. Then, most significantly of all, we
successfully launched New Look in China - unleashing
a major brand-awareness marketing campaign and
initiating a vibrant social media presence on key
Chinese platforms ahead of our store openings in
Beijing, Shanghai and Hangzhou during late February
and early March.
9
10
NEW LOOK ANNUAL REPORT & ACCOUNTS 2014
OVERVIEW
Financial Highlights
Group revenue increased by
£44.8 million to
£1,528.8 million*
New Look brand revenue
increased by £36.3 million
to £1,396.6 million*
†
††
Group LFL** sales were +2.2%
New Look brand LFL sales
were +2.7%
Group Adjusted EBITDA**
increased by 5.8%*
New Look Brand Adjusted
EBITDA increased by
£20.1 million*
Group underlying operating profit
increased by 11.3%*
New Look Brand underlying
operating profit increased
by £21.8 million*
Group loss after tax declined by
£57.0 million to £53.6 million
following the non-recurring
impairment of Mim’s net assets
of £64.2 million
*
FY14 on a 52 week basis, FY13 comparative on a 53 week basis. For a fuller discussion of
the financial results see the Financial Review.
**
For a full definition of terms see the Financial Review.
†
New Look Brand refers to New Look owned and franchise stores, and Total E-commerce.
††
Revenue is based on Gross Transactional Value excluding adjustment for concession
income on a net basis for statutory reporting purposes.
11
12
NEW LOOK ANNUAL REPORT & ACCOUNTS 2014
We’re the UK’s
largest clothing &
accessories retailer
for the under 35s*
We’re the UK’s
No.1 for dresses*
We’re No.2 for
women’s footwear in
the UK*
We’re No.2 retailer
for womenswear in
the UK*
*Year to March 2014 (by value), according to measures of Kantar Worldpanel.
OVERVIEW
We’ve successfully
opened 5 new
stores in China
We now have 7
3rd Party
E-commerce
partners reaching
195 countries
We’ve achieved
63.9% growth in
our E-commerce
channels in FY14*
We’ve bought back our
Polish franchise of
10 stores
* Total E-commerce revenue growth of 63.9% (42.3% own website).
13
14
NEW LOOK ANNUAL REPORT & ACCOUNTS 2014
Positive growth in Adjusted EBITDA
E-commerce channels
performed strongly
Successful launch into China
I am completely confident that New
Look will continue to flourish under
Anders and his team
Alistair McGeorge
C H A I R M A N ’ S S TAT E M E N T
CHAIRMAN’S
STATEMENT
New Look delivered another credible performance for FY14.
We achieved positive growth in Adjusted EBITDA, and we
maintained our market share despite the challenges of
competition and uneven trading patterns.
In the first half, our spring/summer ranges performed exceptionally
well, however, despite improvements to transitioning between
seasons, prolonged hot weather diminished initial demand for
our autumn/winter ranges. As Christmas approached, high street
shoppers held out for discounts and delayed purchases. Much of the
high street reacted with aggressive price-cutting, but we managed
our promotional activity carefully. While this allowed us to trade
longer at full price, we had higher stock levels to clear during the
main winter sale period from Boxing Day and on through January.
Pleasingly, our E-commerce channels performed strongly
throughout the entire year. In fact, our online shopping proposition
at newlook.com goes from strength to strength. We have also
sustained our strong presence in social media, developing further
platforms and achieving enviable levels of engagement. On
Facebook alone, we now have close to 3 million people ‘liking’ us.
Our leadership team has seen a few changes this year, and I want
to commend the Board for ensuring consistency of approach
and a steady hand throughout. At this time, I’d especially like to
acknowledge the contribution of our former CFO, Alastair Miller,
who stepped down from the Board after 14 years. His commitment
to the business has been exemplary, and, following the success of
last May’s transformational bond refinancing, he leaves New Look in
excellent shape for the future.
The business is already in an exciting new era, with Anders
Kristiansen completing his first full year as CEO. As well as
providing a greatly improved capital structure, our refinancing
gives him and his team a further 4 year runway to fulfil their strategic
goals, particularly in multichannel development and international
expansion. One of this progressive year’s most exciting and
significant achievements was our successful launch into China. Of
course, marketing costs were incurred in the final quarter, as we did
all we could to support entry to this important new market. Our first
5 stores successfully opened before the year-end, and more are
planned for FY15.
None of our successes would be possible without our great
people. To deliver the exceptional experience and great service
our customers expect and deserve, we have dedicated teams
in Support Centres in London, Weymouth, Lymedale, Paris and
Shanghai, supporting employees in stores around the world. I’d
like to thank each of them for their hard work and commitment.
I am proud of what New Look has achieved during my time here.
The success of our turnaround plan has enabled us to re-invest in
the business, and as a result, our brand identity has never been
better defined. Already, over 40% of New Look’s UK estate has
been refitted in our new ‘concept’ format, generating performance
improvements. Our developments in infrastructure and technology
will be key to realising the best in class customer experience and
service options crucial to our future growth.
Now, as I prepare to depart, I know I am leaving the business in
good hands. In the short term, Tom Singh is taking over as Interim
Non-Executive Chairman, and I am completely confident that New
Look will continue to flourish under Anders and his team.
Alistair McGeorge
NON-EXECUTIVE CHAIRMAN
23 May 2014
15
16
NEW LOOK ANNUAL REPORT & ACCOUNTS 2014
I am pleased with our achievements...
we’ve delivered a good result
A year of important advances towards
fulfilling our international ambitions
We developed new channels in
3rd Party E-commerce
We remain committed to
delivering our strategic goals
Anders Kristiansen
C E O ’ S S TAT E M E N T
CEO’S
STATEMENT
Looking back over my first financial year here at New Look,
I am pleased with our achievements. Despite continuing
economic uncertainties and competition, we’ve delivered a
good result and maintained our market share of circa 5.8%
(by value)*. The strength of our performance has allowed us
to implement our strategic review and invest further in the
future of our business.
Amongst the year’s highlights and notable successes, we
continued our strong growth in our E-commerce activities.
E-commerce sales were + 63.9% (own website 42.3%) and
we developed new channels in 3rd Party E-commerce. It
was also a year of important advances towards fulfilling our
international ambitions. As well as buying back our franchise
business in Poland, we successfully opened our first New
Look stores in China.
We continued to roll out our distinctive new brand identity
across our estate, our product ranges and all our marketing
activities. During FY14, a further 119 stores were shopfitted
in our new ‘concept’ format, generating an uplift in gross
profit performance compared to unconverted stores.
Our investment programme continues as we remain
committed to delivering our strategic goals of international
expansion plus continued growth and development across
all channels of our business.
* Year to March 2014, according to measures of Kantar Worldpanel.
17
18
NEW LOOK ANNUAL REPORT & ACCOUNTS 2014
C E O ’ S S TAT E M E N T
Multichannel
Our online sales continued their strong growth,
advancing by 63.9% (own website 42.3%). This not
only reflects our customers’ changing shopping
behaviour, but also enhancements made to our web
platform. We’ve been investing in IT developments
and improving delivery options to realise our goal of
a best in class customer experience.
As well as significant enhancements to the design
and functionality of our transactional website, we’ve
responded to customers’ increasing use of mobile
devices such as smartphones and tablets to inform
their choices or make purchases. Our upgraded
mobile experience ensures customers can browse
and buy all products while they’re on the move.
Our retail stores remain a core channel to market for
us, particularly in the UK, where our 576 locations give
us extensive geographical reach. Our stores have also
become an integral part of the multichannel shopping
experience as more than 1 in 4 of our online shoppers
are now using our Click and Collect service, and our
Order In Store option (which counters availability
issues and gives easy access to our complete product
range) is increasingly popular.
In the light of our successes with our initial
partners, we’ve identified the potential of 3rd
Party E-commerce. Most of the sales of New Look
product made by our 3rd Party partners come from
outside the UK, providing an extremely encouraging
validation that the New Look brand resonates with an
international audience.
19
20
NEW LOOK ANNUAL REPORT & ACCOUNTS 2014
C E O ’ S S TAT E M E N T
International
One of our key strategies
is international expansion.
We’ve identified 4
strategic international
markets that we will focus
on: China, Poland, Russia
and Germany.
In the first quarter, we appointed a local Managing
Director for China, and the strong team we have
built allowed us to launch our first 5 stores in Beijing,
Shanghai and Hangzhou on plan in the final quarter
of the year. We have further Chinese stores due to
open in the new financial year. We’re encouraged by
the strong demand for our affordable take on fashion
trends validated by customer reaction, high levels of
local press coverage and social media interest.
Also in the final quarter of FY14, we bought back
our franchise business in Poland and appointed a
local Managing Director. As well as launching a local
E-commerce proposition during FY15, we will invest
to grow our Polish presence from our existing base of
10 stores.
Following our strategic review, Mim is not a strategic
focus for the Group. As a result of the disappointing
performance in FY14, an impairment has been
recognised on Mim’s net assets.
We aim to find a strategic partner to acquire our Russian
business from the current franchisee during FY15,
allowing us to strengthen our presence in this market.
We’re currently considering how best to build on the
success of our existing 8 concessions in Germany,
and our first step is to launch a German language
transactional website during FY15.
21
22
NEW LOOK ANNUAL REPORT & ACCOUNTS 2014
C E O ’ S S TAT E M E N T
Brand
New Look already occupies
a unique position in the
value-fashion market.
We’ve concentrated this
year on understanding and
consolidating what the New
Look brand stands for and
what it means to our customers
and other stakeholders.
Crucial to future success is our ability to deliver a consistent brand
experience across all channels and in every New Look store
globally. Our refurbishment programme allows us to offer a more
engaging shopping environment; it’s also driving a significant
improvement in performance. The 119 stores shopfitted during
FY14 (taking our total number of ‘concept’ stores to 264)
continue to generate a positive uplift in gross profit compared to
unconverted stores.
FY14 was also the year in which we rolled out our distinctive new
logo. As well as now appearing on everything from our carrier
bags and swing-tickets to garment labels and hangers, this
clean, elegant rendering of our brand name will front every New
Look store by the end of FY15.
23
24
NEW LOOK ANNUAL REPORT & ACCOUNTS 2014
Product
An affordable and well-timed take
on key trends is crucial to New
Look’s success as a leading fastfashion brand.
We’ve continued fine-tuning our product offering to make sure
everything we do is customer-focussed and relevant in terms of style,
price and quality.
We continue to command the largest share of the UK’s combined
apparel, footwear and accessories markets for women under 35*,
and our product offer appeals to an international audience too. As
we’re operating in a highly competitive environment, we’ve remained
meticulous in our consideration of our price architecture to make
sure we deliver great value. We’ve also developed new product lines
to complement our main range. For example, we have successfully
added a Premium Denim selection to complement our core range and
increase customer choice.
Building on our reputation as a reliable fashion authority, we’ve been
updating the way we present products in-store. Instead of relying on
block-merchandising by product category, we’re increasingly pulling
together all the elements of a key trend and presenting them as headto-toe fashion stories. This allows customers to understand and be
inspired by the whole ‘look’.
*Year to March 2014 (by value), according to measures of Kantar Worldpanel
C E O ’ S S TAT E M E N T
25
26
NEW LOOK ANNUAL REPORT & ACCOUNTS 2014
People
From the outset, I’ve been
impressed by the passion and
enthusiasm of the people at
New Look, and none of this
past year’s achievements
would have been possible
without their commitment and
hard work. I want to thank
them all for their support.
Everyone at New Look recognises that we’re on a journey, and
we’ve continued to broadcast our leadership message across
every area of the business. Our teams right across our global
retail network and in each of our support centres are inspired
by and share the same brand values: think customer; be brave;
take responsibility; keep it simple; act with pace.
C E O ’ S S TAT E M E N T
There has been great progress
against our strategic objectives during
FY14, and we have delivered on what
we set out to achieve this year.
While remaining vigilant on costs, we will continue to invest in identified growth areas such as
E-commerce and international expansion. While we expect the retail environment to become
ever more competitive, and we will certainly monitor consumer confidence and spending
patterns very closely, New Look is going into the new financial year in a good position to meet
the challenges that lie ahead.
Anders Kristiansen
CHIEF EXECUTIVE OFFICER
23 May 2014
27
STRATEGIC
REPORT
4
30
NEW LOOK ANNUAL REPORT & ACCOUNTS 2014
BUSINESS
MODEL
S T R AT E G I C R E P O R T B U S I N E S S M O D E L
Our place in the market
The UK clothing market in 2014
is forecast by Verdict to have a
total value of £41.0 billion*.
New Look operates in the value clothing segment, which,
with an estimated value of £12.5bn, currently represents
30.4% of the overall UK clothing market*.
Widely popular for our affordable take on key fashion trends,
we’re Britain’s second largest womenswear retailer and 45%
of all UK female adults and teens shopped with us at least
once during calendar year 2013**.
As well as our UK store network, we have a significant
international store presence and a fast-growing E-commerce
proposition. Now, following our strategic review, we’ve
identified the strategic focus and objectives for the five pillars
of the New Look business: multichannel, international, brand,
product and people.
*
Copyright © 2014, Verdict, Value Clothing UK: Market Forecast 25 April 2014,
reproduced with permission of Verdict.
** Year to March 2014 (by value), as measured by Kantar Worldpanel.
31
32
NEW LOOK ANNUAL REPORT & ACCOUNTS 2014
Multichannel
Our objective is for our
E-commerce and retail
propositions to be best in
class, and to share our
unique brand personality
through a seamless
customer experience across
all channels.
*Measures from CACI Retail Footprint
UK stores
We currently have 576 stores in the UK, which remains our primary
market. Our geographical reach, from Wick in the north-east of
Scotland to Penzance in south-west England places a New Look
store within easy reach of the majority of the UK population.
We’re well represented in prime high-street and shopping mall
locations, with New Look stores in 46 of the UK’s 50 highestranking centres*. Thanks to our ongoing investment, 245 UK stores
are now trading in our new ‘concept’ format – outperforming
unconverted stores by an average uplift in profitability of 7%.
We plan to improve the in-store shopping experience further by
continuing investment in our major refurbishment programme
and converting further stores to our highly successful new
‘concept’ format.
S T R AT E G I C R E P O R T B U S I N E S S M O D E L
Newlook.com
3rd Party E-commerce
Our transactional website at newlook.com is currently
achieving an average of 2.7 million visits each week –
making it the UK’s third most visited fashion website*. We
also have an app for mobile devices, enabling customers
to browse and buy products on the move. Fulfilment of
all E-commerce orders in the UK and beyond** is now
handled by our highly automated distribution centre at
Lymedale, Staffordshire.
Capitalising on brand awareness in existing markets and
providing an opportunity for low risk trial entry to new
markets, we’ve formed strategic partnerships with selected
website providers who buy New Look product and market it
to their audiences. Our current 7 partners (ASOS, Koovs,
La Moda, Smart Guy, The Iconic, Zalora and Zalando) host
websites which ship to over 195 countries.
We plan to continue our investment in our own website with
further development of our mobile app and improvements in
our delivery service options. We’re committed to making sure
our support infrastructure can meet all future capacity needs.
We also intend to launch new local language websites
serving our key European markets.
* Experain Hitwise data
** newlook.com currently serves over 120 countries
Based on our initial success with this model, we intend to
develop further 3rd Party E-commerce channels.
Social
We have an impressive social media presence, with close to
3 million people ‘liking’ us on Facebook and over 170,000
following us on Twitter. Awareness generated on Weibo and
WeChat played a significant role in our successful launch
into China.
33
34
NEW LOOK ANNUAL REPORT & ACCOUNTS 2014
S T R AT E G I C R E P O R T B U S I N E S S M O D E L
35
International
Product
We already have a significant and growing international foothold, and our
goal is sustained international expansion. At present, our 584 international
stores consist of 103 wholly-owned New Look stores, 125 New Look stores
operated by franchise partners, and 356 Mim stores (including 80 affiliates).
We aim to develop our presence in the western European markets in which
we already operate, consolidate our eastern European business, and open
wholly-owned stores in target markets beyond Europe.
New Look’s unique proposition – combining value with fashion and
newness – differentiates us from other retailers in the value segment.
Operating at the crest of the fashion wave, we build new trends in-store
every 6 to 8 weeks, with fresh lines being dropped in daily. In fact, we
introduce an average of 419 new products every week of the year, serving
our customers’ appetite for newness and fashion excitement – especially
important as over half our customers tell us they visit one of our stores at
least once a fortnight*.
Owned stores
Within Europe, we directly operate New Look stores in the Republic of
Ireland (29), France (28), Belgium (10), Poland (10, recently acquired from
a franchisee) and Holland (1), plus concessions within leading department
stores in Germany (8) and Holland (12). In each of these markets, we’re
unique: a British value-fashion retailer, with a product offer distinctly
differentiated from local competition.
Following our successful launch in China in FY14, by end of March 2014
we already had 5 New Look womenswear stores of varied size and format
enabling us to assess the ideal structure ahead of our second wave of
openings planned for FY15 and thereafter.
Franchise stores
There are currently 125 New Look franchise stores in 16 countries spread
across the Middle East, North Africa, Europe and South-East Asia. This
low investment, low risk model delivers high exposure for our brand in
international markets to which entry may be challenging or where local
laws don’t permit us to develop a wholly-owned business entity. We form
partnerships with franchisees to whom we sell New Look products at cost
price. We augment our partners’ local knowledge and expertise with
support and guidance on shopfit, branding, marketing and staff training. In
return, New Look receives a royalty on sales.
Mim
The Group’s Mim brand has a different customer profile to New Look. Its
handwriting is younger, and distinctly value-focussed rather than trend-led.
At present, there are 276 wholly-owned Mim stores in France, Belgium,
Morocco and Romania plus 80 Mim affliliate* stores. However, following
the strategic review undertaken during FY14, Mim is not a strategic focus
for the Group. Given the disappointing result in FY14, an impairment of
Mim’s net assets has been recognised**.
Brand
We strive to be the chosen brand for an inspiring and accessible fashion
experience – helping people express themselves, look good and feel
great. From Birmingham to Beijing, from in-store to online, from print
advertising to social media, the New Look experience must be clearly
defined, instantly recognisable and consistently delivered. So, in addition
to completing the roll-out of our new brand identity, we will continue our
store refurbishment programme in the UK and beyond. We also remain
committed to driving enhancements in customer service to create a
seamless brand experience across all channels.
At present, over 250 suppliers are manufacturing for us at 865 factories
in 29 countries. Our long standing and close relationships across a wide
supplier base are geared to maximising flexibility, minimising lead-times,
and achieving rigorous standards in quality, fit and ethical compliance. Our
average lead-time is a market-leading 13 to 14 weeks and, thanks to our
network of close-proximity sourcing partners within the UK and Europe,
key high fashion items can be delivered in 3 weeks.
Going forward, our objective is to drive better engagement with existing
customers and attract new customers through a better product offer including head-to-toe interpretations of key looks, to encourage add on and
multiple sales. Without compromising our fundamental reputation for value,
we intend to stretch our price architecture by introducing some premium
products at higher price-points. We also plan a major development of our
menswear offer geared to enhancing its online appeal, increasing its in-store
prominence, and raising its share of our total business.
*Data from New Look store exit surveys, year to March 2014
People
New Look stores around the world buzz with talented, fashion-focussed
people committed to delivering an outstanding customer experience.
Our London Support Centre houses our Buying, Merchandising, Design,
Multichannel, International Partnerships and Marketing teams, while our
Weymouth site has our IT, Finance, Audit, Procurement, Property and
Human Resources teams. At our three state-of-the-art distribution centres
at Lymedale, Staffordshire, staff handle around 2.9 million units of stock
per week plus global fulfilment of all E-commerce orders.
Fully committed to attracting and nurturing great talent, we will continue
to recruit apprentices who can proceed into management, and host
development programmes for potential senior leaders through The New
Look Academy and our Stores of Learning framework for building skillsets.
We also intend to develop a new global careers website, and provide
language learning opportunities in support of our international expansion.
We remain fully committed to recognising success and rewarding the
efforts of our people.
* An affiliate is a concession agreement in which the partner bears store and staffing
costs while Mim retains ownership of the stock.
** See Financial Review, page 52 for a full discussion.
YEAR IN REVIEW
FY14 saw significant progress against objectives across
our 5 strategic pillars: multichannel, international,
brand, product and people.
3
38
NEW LOOK ANNUAL REPORT & ACCOUNTS 2014
We’re proud that we have
delivered on what we set
out to accomplish this year.
Key achievements included
our successful launch in
China and further growth in
E-commerce activity.
We developed greater brand consistency across all
aspects of the customer experience, and established
a Group Analytics function to provide heightened
insight across all channels and functions.
We maintained our UK market share*, and we
were thrilled that New Look was named Britain’s
favourite fashion brand in the authoritative annual
Fashion Brands Index (FBI)**. Among the many other
accolades that came our way, we were voted Best
for Footwear in the annual Prima High Street Fashion
Awards. We also won the Most Stylish Women’s
High Heels category at PETA’s UK Vegan Fashion
Awards, we were named Best for Denim and Best
for Shoes in the Mirror’s Notebook High Street
Fashion Awards, and we were voted top brand for
footwear at Lorraine’s High Street Awards 2013. At
the International Financing Review (IFR) Awards, our
transformational refinancing transaction was named
EMEA High-Yield Bond of the Year.
Personal style advice at dressipi.com
*
Women’s clothing and accessories market by value and volume,
year to March 2014, as measured by Kantar Worldpanel.
** Results based on survey of 10,000 respondents by brand
recommendation site, dressipi.com.
S T R AT E G I C R E P O R T Y E A R I N R E V I E W
Multichannel
Our further surge in online sales reflects not
only changing shopping behaviour, but also the
compelling strength of our online proposition and
continuing investment in our transactional website
at newlook.com to improve its design, content
and functionality.
Key developments in FY14 included
personalisation of the homepage according
to gender, an augmented search capacity to
deliver more relevant results and improved page
performance. Customers can also now see their
recently viewed items, and create wishlists which
can then be shared on social media. In response
to the increasing potential of M-commerce, we’ve
developed a greatly enhanced user-interface for
mobile devices.
Following our initial success with ASOS, FY14
also saw significant developments in 3rd Party
E-commerce, with 6 further partners (Koovs,
La Moda, Smart Guy, The Iconic, Zalando and
Zalora) and taking our brand into territories where
we previously had little or no presence. Early
results validate our belief that these additional
channels will become an important addition to
our established activities. At £22.0 million, 3rd
Party E-commerce represents 14.7% of our total
E-commerce revenue mix for FY14 (FY13: 1.8%).
As well as generating cost-savings, the migration
of UK and global E-commerce fulfilment to our
purpose-built distribution centre at Lymedale in
Staffordshire delivered important improvements
in delivery times and customer service. During
FY14, more than 1 in 4 of our online shoppers used
our Click and Collect service, and 9% of all our
E-commerce orders were generated through the
Order In Store option. Our continuing investment in
infrastructure and systems is geared to supporting
future capacity requirements including those
projected for our launch of international websites
during FY15.
We continue to achieve impressive engagement
levels across our various social media platforms,
with close to 3 million people now ‘liking’ us on
Facebook alone. One example of FY14’s host of
social successes was our Winter Wishes preChristmas competition, devised to re-engage our
fanbase and reward them for continued loyalty.
Although we continue to review and appraise our
property portfolio to maintain value and flexibility,
exploring attractive opportunities to right-size
or relocate existing stores, we’re paying close
attention to the importance the geographical reach
of our store network plays in our E-commerce
success. As well as the fast-increasing numbers
of online orders being generated at or uplifted
from a store, two-thirds of E-commerce returns are
now made through a store – a visit that potentially
results in additional purchasing.
39
40
NEW LOOK ANNUAL REPORT & ACCOUNTS 2014
International
During FY14, we made significant progress towards our
strategic goals in international expansion.
Without doubt, the year’s most exciting achievement was our
successful launch in China. Our first 5 New Look womenswear
stores opened at key mall locations in Beijing, Shanghai and
Hangzhou in late February and early March – supported by
a storm of editorial coverage, experiential marketing activity,
and social media engagement on key Chinese platforms such
as Weibo and WeChat.
We’re still learning about this market, but media interest and
initial performance are confirming an appetite for the New
Look brand in China. Our beautiful new store at Glory Mall
(Beijing) already ranks within New Look’s top 10 performers
by density. Further openings in key cities across China are
planned for FY15.
Shortly before the year-end we successfully purchased our
Polish franchise business from our existing partner. These 10
New Look stores located in Warsaw and other major Polish
cities give us an important foothold from which to develop our
presence in this market.
Our New Look brand stores in Western Europe saw positive
revenue growth in the year.
Performance of our Mim stores has once again proved
disappointing, reflecting tough trading conditions in those
markets and heavier than anticipated markdown activity. We
have also seen changes in senior management. Following the
year’s strategic review, Mim is not a strategic focus for the Group.
S T R AT E G I C R E P O R T Y E A R I N R E V I E W
Brand
Building on the proven success of our store refurbishment
programme, we transformed a further 119 New Look stores
during FY14. Over 40% of our UK stores now trade in our
performance-enhancing ‘concept’ format. We also extended
its distinctive look and feel into our international markets, with
refit projects in France and Belgium as well as further countries
through our franchise partners.
Further innovation and updates to our shopping environments
were developed for our debut in China, and these will feature in
future store openings and refurbishments in the UK and beyond.
We’re close to completing the roll-out of our distinctive new logo
(launched in FY13). Its clean, contemporary rendering of the New
Look name now graces our product labelling, garment hangers,
advertising, E-commerce and social media platforms – as well as
facias at most of our stores. The final store-front conversions are
planned for completion during FY15.
As we drive greater consistency across all aspects of the brand
experience, the synergy between our online and offline worlds
has never been closer. During FY14, in our continuing drive
for a best in class service standard wherever and however
a customer engages with us, we rolled out an innovative
customer service initiative across all stores and support centres.
This is supported by New Look Listens, our new pro-active
research vehicle which measures shoppers’ satisfaction levels
and perceptions about our brand and provides feedback to our
operating channels.
41
42
NEW LOOK ANNUAL REPORT & ACCOUNTS 2014
Product
Our focus on placing the customer at the heart of everything we
do continues to have a significant impact on shaping our product
ranges. Our response to celebrity fashion looks and emerging
trends was always tempered by a relevance to the people who
shop with us. So, while we continued to deliver excitement and
newness, and in some key areas extend our price architecture, we
never lost sight of our credentials for great value.
We increasingly develop head-to-toe versions of key trends,
presenting them in-store and online as a whole ‘look’ to inspire
add-on purchasing.
Our seasonal footwear performed well, with strong sales of high
summer sandals during July and August and an excellent reaction
to our ankle boots throughout autumn and winter.
*Apparel (excluding underwear) bought for ages 9 to 15; measure for year to March 2014,
according to Kantar Worldpanel
The big hits of the festive season were novelty knits. We achieved
excellent business in eye-catching, smile-raising sweaters
emblazoned with Christmas puddings, reindeers, snowflakes, and
a host of other fun motifs.
Building on our women’s jeans range, we aimed to extend our
reach still further, by relaunching our denim offer during FY14,
adding a Premium Denim range to complement our core product,
thereby enhancing choice and stretching our price architecture.
Younger shoppers clearly liked what we were doing. Our
teenwear ranges, delivered their best-ever performance and
secured number 1 position in the UK market.*
S T R AT E G I C R E P O R T Y E A R I N R E V I E W
People
We remain committed to helping our great people build their
skillsets and develop careers with us. During FY14, our new
customer service initiative HEART was cemented into store
and support centre standards. It is a personalised approach,
setting important new performance targets and inspiring greater
consistency across all aspects of the customer experience by
putting the customer at the heart of all we do.
Also during FY14, we launched Stores of Learning in each
region – an initiative designed to facilitate rapid on-the-job
experiential training and enable newly recruited or promoted
managers to ramp up quickly and effectively. As well as enhancing
managerial competence, this initiative has helped generate a 15%
improvement on the 12-month retention of our new recruits.
Over 55% of our employees took part in our annual employee
engagement survey. Of these, 80% said they enjoyed their job,
93% felt they understood our customer, and the majority said
they understood how their work contributes to New Look’s
success. Additional points have inspired us to introduce an
extensive programme of listening groups as well as a structured
framework for 1-2-1 engagement with managers that encourages
two-way feedback. We’ve also re-launched our staff forum and
recognition programme.
Through initiatives such as developing stronger links with
universities and colleges, we have improved our ability to
recruit talent. Our ability to retain exceptional people has also
increased – especially important because of the impact this has
on our support centre structures as well as regional and store
management functions. In FY14, we saw a 10% year-on-year
increase in internal hiring, which is now responsible for filling
36% of our vacancies - providing a demonstrable return on our
investment in developing our people.
43
44
NEW LOOK ANNUAL REPORT & ACCOUNTS 2014
45
FINANCIAL
REVIEW
46
NEW LOOK ANNUAL REPORT & ACCOUNTS 2014
Growth in our key strategic pillars of
multichannel and international underpinned
our improved performance through FY14, which
has seen Group Adjusted EBITDA rise by
£11.0 million to £200.2 million.
Following our successful refinancing in May
2013, we have continued to focus on further
improvements to our capital structure. This has
included utilising our substantial cash balances
to prepay £40 million (including premium) of
Payment-In-Kind (PIK) debt.
All metrics in the Financial Review represent the Group’s Key Performance Indicators.
1,528.8
2013
2014
2012
*In 2013, on a 52 week basis,
Revenue was £1,458.2m
£1,528.8 (+3.0%)
1,484.0
2011
20
1,461.2
2010
1,447.5
641,463.6
TOTAL REVENUE (£m)
Revenue*
Group revenue increased by £44.8 million to
£1,528.8 million (2013: £1,484.0 million). When
the benefit of the 53rd week is excluded from
the prior year comparative, the increase in Group
revenue was £70.6 million. A significant factor
was the continued growth of our E-commerce
business, in which revenues advanced by 63.9%
(own website 42.3%) as we continued to enhance
the functionality of our website and develop new
channels with 3rd Party E-commerce partners.
New Look’s strong product ranges, strengthened
brand identity and the continued roll-out of our
store refurbishment programme also helped to
drive revenue growth.
S T R AT E G I C R E P O R T F I N A N C I A L R E V I E W 4 7
+2.2%
+1.2%
LFL Sales*
-0.7%
-5.9%
-5.5%
+2.2%
20
2014
2013
2012
2011
2010
GROUP LFL SALES* (%)
*In 2013, on a 52 week basis, Sales
were -0.5%.
Following improved performance in the UK and
internationally, Group LFL sales improved to +2.2%
(2013: -0.7%) , gathering pace in the final quarter
of FY14.
UK LFL sales (stores and E-commerce) – which
account for 76.0% of Group sales – were +3.0%
(2013: -0.5%), driven by continued growth in
E-commerce and the benefits of our continuing
store refurbishment programme.
The improvement in New Look International LFL
sales is in part due to our continued focus on
tailoring stock assortments to meet the specific
needs of each international market. It also reflects
the enhanced store performance from the
International ‘concept’ format roll out.
However, Mim continued to experience negative
LFL sales particularly in the first half of the year.
Further actions have been taken to address the
on-going under-performance of Mim.
These include changes to the senior management
team, a review of the Buying and Merchandising
strategy, seeking ways to improve the fast
fashion credentials and develop E-commerce
opportunities. Heavy discounting to clear through
old lines of stock saw an improvement in LFL sales
for the second half of the year but this impacted
upon gross margin.
Like-for-like (LFL) sales is the gross transactional value from LFL operations in
any given period compared with the same period in the previous financial
period and is normally shown as a percentage change between two periods.
LFL operations consist of our New Look directly operated stores, Mim and
its affiliates, concession stores and our E-commerce segment (if applicable).
A store is included in LFL operations if it has traded for more than 52 weeks,
excluding existing stores where a new store of ours has opened within one
mile (for the first 52 weeks of the new store’s commencement of trading)
or where the store has undergone a significant increase or decrease in
trading space during the period. A store is included in the calculation of
LFL sales from the date at any point during the financial year when it has the
comparable weeks’ data for the prior financial year. If a store is closed for a
full week or more for any reason during a financial year, for example, due to
refurbishment or permanent closure, it is excluded from the LFL calculation
for the period of closure.
48
NEW LOOK ANNUAL REPORT & ACCOUNTS 2014
6,250
2013
2014
6,250 (+0.8%)
6,198
2011
20
5,787
2010
6,051
5,473
2012
Space ‘000 sq ft
*In 2013, on a 52 week basis, Space
was 6,197 sq ft.
1,160
1,138
1,099
1,051
1,018
1,160 (+1.9%)
20
2014
2013
2012
2011
2010
Total stores
* In 2013, on a 52 week basis,
Total stores were 1,136.
Space*
In line with our principal focus over the last 3
years we have continued to optimise our store
estate by closing unprofitable stores and finding
opportunities to relocate existing stores to sites of
more appropriate location or size. During FY14 our
total number of UK stores decreased by 13 to 576
(2013: 589).
The roll-out of our ‘concept’ refurbishment
programme has continued this year. We have now
converted 248 stores to the new store format in
total (109 in 2014), and opened 16 new stores in
this format (10 in 2014), including 5 in China which
have an updated version incorporating further
developments and refinements.
During FY14, we increased the total trading space
of our international estate, with New Look owned
stores increasing by 12.2% to 718k sqft (2013: 640k
sqft). This includes 5 new stores in China, and 10
stores in Poland which were previously part of our
Franchise business.
Taking the Polish re-acquisition into account,
the total number of New Look franchise stores
decreased by 1 to 125 stores (2013: 126 stores)
during the year.
In line with our action plan for Mim, 9 unprofitable
Mim stores were closed during FY14. However, the
overall number of Mim stores (wholly owned stores
and affiliate stores) increased by 20 to 356 (2013:
336 stores) due to the launch of 29 new Mim
affiliate stores.
S T R AT E G I C R E P O R T F I N A N C I A L R E V I E W 4 9
149.8
E-commerce sales*
£149.8 (+63.9%)
91.4*
20
62.7
52.3
37.0
2014
2013
2012
2011
2010
Sales (£m)
* In 2013, on a 52 week basis,
Sales were £89.1m.
2013 has been restated to correct for the
reclassification of £2.7 million for sale returns
between UK Retail and E-commerce.
FY14 saw further growth in our E-commerce sales,
increasing by £58.4 million, or 63.9%, to £149.8
million (2013: £91.4 million). We continued
to invest in improving the design, content
and functionality of our own website, a focus
which helped to drive better engagement and
conversion rates as well as achieve an increase in
the average transaction value per order, with sales
increasing 42.3%.
A further factor in our E-commerce growth has
been the development of convenient delivery
options, fully supported by our purpose-built
distribution facility at Lymedale. More than 1 in 4
of our E-commerce customers use our Click and
Collect service, and the Order In Store facility was
used by 9% of our E-commerce customers.
Building on the success of our initial launch with
ASOS in 2013, 3rd Party E-commerce sales, at
£22.0 million (2013: £1.6 million) have further
driven the overall growth in E-commerce sales.
These new partnerships have given us a route into
new territories, providing strong indications that
the New Look brand can be successful in these
new markets.
The transfer of fulfilment and distribution of
E-commerce orders to our own in-house facility
has resulted in efficiencies, further improvement
in our stock control levels, and a better service for
our customers.
NEW LOOK ANNUAL REPORT & ACCOUNTS 2014
50
52.7
52.9
50.9
53.9
56.7
Gross margin*
52.7% (-0.2%)
20
2014
2013
2012
2011
2010
Gross margin %
* In 2013, on a 52 week basis, Gross
margin was 52.9%.
Our gross profit margin decreased by 0.2
percentage points to 52.7% (2013: 52.9%). This
reflects the increasing mix of E-commerce sales,
as although some fixed costs (such as staffing)
are lower for E-commerce than for our stores, our
packaging and distribution costs are higher. Sales
to 3rd Party E-commerce partners are made at a
lower margin, and sales at newlook.com include
some lower margin third party products.
Our changing revenue mix between Retail and
E-commerce offsets an underlying increase in
gross margin. This was driven by the success of
our continued efforts to right-time our response to
key trends, support our best sellers, and improve
our stock management. We also increased to
80.1% (2013: 78.5%) the amount of stock sold at
full price.
Costs
Our cost efficiency drive, continued from last year,
has enabled further investment in the strategic
priorities of the business. As well as continuing to
assess store payroll costs, property negotiations
and re-tendering of contracts, we have focussed
on achieving tighter controls around administrative
expenses through the introduction of a new
Purchase Order system to ensure all costs are
adequately reviewed and approved prior to
committing spend.
S T R AT E G I C R E P O R T F I N A N C I A L R E V I E W
51
200.2
2013
2014
£200.2 (+5.8%)
189.2
146.6
190.2
249.4
2012
2011
2010
Group Adjusted EBITDA (£m)
* In 2013, on a 52 week basis,
Adjusted EBITDA was £185.2m.
128.5
115.5
62.7
98
162.7
£128.5 (+11.3%)
2014
2013
2012
2011
2010
Underlying operating profit (£m)
**In 2013, on a 52 week basis,
Underlying operating profit was
£111.5m.
Group Adjusted
EBITDA*
Underlying
operating profit**
Adjusted EBITDA increased by £11.0 million, or
5.8%, to £200.2 million (2013: £189.2 million).
When the benefit of the 53rd week is removed
from the prior year comparative, the increase in
EBITDA is £15.0 million, or 8.1%. This was driven
by the improved sales performance and cost
reduction programme.
Underlying operating profit increased by £13.0
million to £128.5 million, reflecting the improved
performance of the New Look brand. This was
offset by the performance of Mim, which saw a
decrease in underlying operating profit of £8.8
million to -£10.9 million (FY13: -£2.1 million).
The underlying increase in the New Look brand
performance has been offset by the poor
performance of Mim. Adjusted EBITDA for the
New Look brand increased by £20.1 million, or
10.9% to £204.2 million (2013: £184.1 million)
whereas Adjusted EBITDA for Mim decreased by
£9.1 million, to -£4.0 million (2013: £5.1 million).
Mim’s poor performance reflects the tough
trading conditions in France and heavy levels of
discounting in FY14.
Adjusted EBITDA, a non IFRS measure, is calculated as the Group’s
underlying operating profit before depreciation of tangible fixed assets,
amortisation of intangible fixed assets and the income statement charge
in relation to the Group’s onerous lease provision. Note that the Group
onerous lease charge is split between New Look and Mim £1.6 million and
£0.8 million respectively (2013: £0.1million and £0.1million respectively).
Underlying operating profit is a non-IFRS measure, and is calculated as
operating profit before exceptional items, share based payment expense
and the movements in the fair value of financial instruments under IFRS.
See page 76 for reconciliation back to Operating Profit.
52
NEW LOOK ANNUAL REPORT & ACCOUNTS 2014
Pre-tax loss
Taxation
Following the decline in the performance of Mim,
management performed an impairment review,
which resulted in an impairment charge of £64.2
million to write down the value of Mim’s net assets.
This impairment charge has been recognised
within the total operating exceptional charge of
£57.8 million (2013: £4.7 million). The remainder
of the operating exceptional charge reflects the
one-off incentive scheme, the impairment of a
franchise receivable, and costs in relation to the
refinancing. These were offset by a £9.1 million
gain on disposal of land, at our Weymouth site,
and the net gain of £2.5 million on the acquisition
of the New Look business in Poland from our
franchise partner.
The income statement taxation movement during
FY14 is driven by a reduction in the UK current tax
charge following the utilisation of historic accrued
interest expenses which are tax deductible during
the year coupled with a prior year adjustment in
current tax, relating to the Employee Share Option
Plan Trusts (ESOP), and movements in deferred tax
impacting on the current year credit. This included
a reversal of timing differences of £4.2 million
credit (FY13: £1.7 million credit) which relates
primarily to the reversal of a deferred tax liability
previously recognised on the Mim brand following
the impairment in the year and a £5.5 million credit
(FY13: £3.5 million credit) relating to the change
in the UK Corporation Tax rate, offset by a prior
period adjustment to deferred tax of £2.8 million
(FY13: £0.8 million credit).
Share based payment charges increased by
£6.5 million to £6.3 million (2013: -£0.2 million)
as a result of an increase in the share price and
significant good leaver payments in the period.
Net finance costs increased by £9.4 million to
£115.8 million (2013: £106.4 million) This included
an increase in interest costs on bonds and bank
loans of £32.9 million offset by a decrease of
£23.7 million in interest on PIK debt following the
refinancing in May 2013.
The results for the Group for FY14 financial year
show a pre-tax loss of £55.0 million (2013: profit
£3.1 million).
S T R AT E G I C R E P O R T F I N A N C I A L R E V I E W 5 3
143.2
100.6
81.1
83.9
142.3
£143.2 (+42.3%)
20
2014
2013
2012
2011
2010
Free cash flow (£m)
Free cash flow *
Free cash flow increased by £42.6 million to
£143.2 million. We saw an increase in our Free
Cash Flow versus last year as a result of increasing
underlying operating profit and cash generation,
supported by lower net capital expenditure.
In addition, since the refinancing in May 2013 we
have drawn upon our substantial cash balances
to prepay £40.0 million of PIK debt (including a
prepayment premium of £1.2 million).
Free cash flow, a non-IFRS measure, is cash flow from operating activities
(pre-tax) less net capital expenditure. We believe that free cash flow assists
in understanding our trading performance as it represents the amount of
cash generated before tax, but after investment on net capital expenditure,
by our trading activities.
* Comparative information has been restated from previously deducting
capital expenditure to deducting net capital expenditure and therefore
now includes proceeds from sale of Property, Plant and Equipment and
Acquisition of Subsidiaries, in line with internal management reporting to
the Board.
Net debt
On 3 May 2013, the Group entered into a series
of transactions to issue senior secured bonds;
these transactions were settled on 14 May 2013.
The finance raised was used to settle the existing
debt under the Senior and Mezzanine Facility
Agreements and 50% of the outstanding PIK in
cash, with the remaining PIK being exchanged for a
new PIK instrument at par value.
This has given us a much improved capital
structure and provides a further 4 year ‘runway’ to
continue driving our strategic goals of performance
improvements, international expansion, and
developments online and in-store.
Group net debt reduced by £50.2 million to
£1,045.8 million as at 29 March 2014 (2013:
£1,096.0 million) of which £377.3 million (2013:
£741.5 million) was PIK notes including £47.4
million (2013: £71.5 million) of deferred interest
rolled into the outstanding value of the loan
during the year. In addition to the £40.0 million
of PIK prepaid during the financial year the Group
announced subsequent to the year-end the
commitment to prepay a further £40.0 million of
PIK (including prepayment premium of £1.2 million)
effective on 27 May 2014.
Current year trading
Looking ahead, we expect the economic outlook
to improve, but we remain cautious as to how
swiftly or substantially our customers will find these
indicators of economic recovery translating into
increased spending capacity.
Believing we offer compelling value-fashion
product ranges to UK and international audiences
through attractive store and E-commerce channels,
we are confident in our strategy for future growth
of the New Look brand.
54
NEW LOOK ANNUAL REPORT & ACCOUNTS 2014
RISKS &
UNCERTAINTIES
3
S T R AT E G I C R E P O R T R I S K S A N D U N C E R TA I N T I E S
Risks & Uncertainties
New Look considers effective risk management
fundamental to achieving its business
objectives, protecting its reputation, and
delivering added value.
Risk management
To support operational management, the
Board has created a practical framework set out
in its Risk Management Policy. This provides
a clear structure for managing risk across
the Group and ensures significant risks are
understood and visible to senior management,
as well as to the Board.
Responsibility
The Board has ultimate responsibility for the
Group’s risk management process and reviews
its effectiveness at least annually. However,
on a day-to-day basis, senior management is
responsible for providing visible leadership
in the management of risk, integrating it into
everything we do and all important decisions
we take. It’s not the Board’s intention to create
additional functions or separate committees to
administer the risk management process.
The assessment and management of risk
is already part of our planning and review
procedures, and senior management is required
to ensure this review of risk is carried out in an
effective and timely manner.
Principal risks & uncertainties
It is recognised that the Group at any point
in time is exposed to a number of risks. The
following table details the most significant risks
as identified by the Board together with the
relevant mitigation. It should be noted that any
system of risk management and internal control
is designed to manage rather than eliminate the
risk of failure to achieve business objectives and
can only provide reasonable and not absolute
assurance against material misstatement or loss.
55
56
NEW LOOK ANNUAL REPORT & ACCOUNTS 2014
Risk Type
Description of Risk
•
Unfavourable
economic
conditions
Competition
•
Product design
and proposition
Stock
Management
Leadership
Uncertainty over international
economic climate.
•
Investment in Brand to differentiate New Look from other value
fashion retailers.
•
Maintenance of our value fashion proposition through appropriate
price architecture as well as desirable, on-trend product ranges.
Ease of entry to market via E-commerce
•
and attractive opportunities arising from
depressed property market.
•
•
Distractions of high profile projects
from day to day business needs.
•
Failure to maintain our reputation for
compelling fashion at attractive prices.
•
Inability to respond swiftly to changing
customer preferences and key trends.
Lack or loss of speed and flexibility in
the supply chain, leading to greater risk
in buying decisions and potential loss
of margin through higher markdowns.
•
Disruption to supply chain arising from
strikes, civil unrest, political turmoil or
natural disasters.
•
Ethical or quality standards failure
within the supply chain, leading to
reputational damage to our brand.
•
Ineffective controls over the
management of stock, impacting on
gross margin or product availability.
Adapting to the changes in core customers’ disposable incomes
through the delivery of a compelling product range (fashion, value
and newness) at competitive prices.
Effective forecasting process and regular reviews to enable actions
reflecting current market climate.
•
Failure to adopt the right business
strategy in a very difficult consumer
market (both UK and International)
would prove critical to the success of
the business.
The latest independent market information fully reflected in our
internal plans and forecasts.
•
Loss of market share to rival value
operators.
•
Sourcing
strategy
•
Consistent fall in customer spending and
erosion in consumer confidence as a
result of prolonged economic downturn •
and other macro-economic factors.
•
•
Business strategy
development and
implementation
Risk Mitigation
Cohesive multichannel strategy to secure our brand’s significance
in the digital as well as physical marketplace.
Development of additional product ranges to reach new
customers and extend our target audience.
•
Top down integration of leadership message into all aspects
of strategy.
•
Macro-economic and industry-specific trends affecting the Group
are constantly reviewed.
•
The annual budget and 3 year planning process identifies key
drivers to increasing revenue and Adjusted EBITDA.
•
Aligning resources to ensure project management delivers
on objectives.
•
Monthly measurement of performance against key attributes of the
business strategy.
•
Effective adoption of target customer profiling to better inform
buying decisions.
•
Stronger integration of buyers and designers working closely
with suppliers.
•
Recognisable and consistently delivered product handwriting.
•
Robust and transparent process for trialling and evaluating
emerging trends and reviewing feedback mechanisms.
•
Development of open costing approach to ensure our value
offering is maintained.
•
Strong and robustly supported sourcing team responsible for
maintaining an efficient and effective supply chain.
•
Suppliers treated as key business partners, working to shared
objectives such as reduced lead times, enhanced quality control
and better employment practices.
•
Structured audit processes at factories throughout our supply
chain, conducted by internal and external teams, and support for
suppliers working towards full compliance with our ethical aims.
•
Regular review of supply chain and routes to maximise flexibility
and sustain fulfilment of product demand across all channels.
•
Pro-active membership of the Ethical Trading Initiative.
•
Policy of maintaining ‘open to buy’ ensuring effective response to
emerging trends and improved ability to have enough of the right
product available (in-store and online) at the right time.
•
Regular reviews and forecasting updates to ensure forward orders
can be adjusted where appropriate.
•
Effective use of data analytics tools to optimise stock allocation
and replenishment.
•
Maintenance of clear leadership message identifying our primary
objectives plus the five pillars of the business: brand, people,
product, international and multichannel.
•
Failure to attract or retain talent;
departure of key personnel.
•
•
Lack of leadership at all levels to deliver
our key business strategies.
Regular reviews of management structure to ensure capability
and succession.
•
Regular, effective performance reviews, leadership assessments,
and training and development in place.
•
The Remuneration Committee ensures appropriate incentive plans
are in place.
S T R AT E G I C R E P O R T R I S K S A N D U N C E R TA I N T I E S
Risk Type
Multichannel
Description of Risk
•
Failure to meet customer expectations
across all channels undermining our
multichannel proposition.
•
Lack of cohesion between channels
confusing or compromising the
customer experience.
•
International
expansion
IT systems
and business
continuity
Warehousing
and distribution
Credit risk and
liquidity
Risk Mitigation
•
Detailed review of all channels and a ‘one voice’ policy to ensure
customer expectations are consistently met.
•
In-house fulfilment operation maximising control, flexibility, efficiency
and cost-containment.
•
Effective use of data analytics and other research tools, plus close
monitoring of customer feedback on social media platforms and
other channels.
•
Stringent agreements in place with all 3rd Party E-commerce partners.
•
Continuance of a tough international
economic climate.
•
Failure to secure entry into markets of
choice or problems in partner selection.
•
•
Failure to grow the international business
successfully through franchise operations,
wholly-owned businesses
and E-commerce.
Increased International experience on main Board and
among senior management.
•
Clear focus on best territories for future growth, plus best trading
model for each country in which we already operate.
•
Careful analysis of cultural fit with the New Look brand and thorough
due diligence of partners.
•
New Look product inappropriate for or
poorly received by new markets.
•
•
Cultural, language and time differences
creating communication difficulties across
our international workforce.
Product ranges selected and developed to ensure relevance in
different markets.
•
Recruitment of local workforce, plus effective and consistent training
and support for all new employees.
•
UK-centric mindset.
•
•
Geo-political instability arising in key
growth markets.
Consistent effort to instill international focus in all aspects of planning
and strategy.
•
Continuing investment in technology and infrastructure.
•
Difficulties in integrating E-commerce
platforms with international store network.
•
Inability of systems to process core
transactional data or to provide key
decision-making reporting.
•
Investment in new and existing IT systems is a key part of our
business strategy.
•
Systems failure compromising security or
fulfilment of online transactions.
•
•
Data protection failure leading to potential
prosecution and reputational damage to
our brand.
Back-up procedures in place to deal with any short-term or specific
loss of data; business continuity plan in place and tested to deal with
any serious incident or loss of systems capability.
•
Provision of secure externally hosted data storage facilities.
•
On-going PCI compliance for transactional website.
•
Failure to maintain the infrastructure
required to support a growing international
multichannel fast-fashion business.
•
Business continuity plans developed and tested for all locations and
operations throughout the Group.
•
•
Inability to recover from a major incident.
•
Inability to cope with increasing demand
of online fulfilment in-house.
Enhancement of capacity at our purpose-built distribution centre in
Lymedale to cope with projected growth of our
E-commerce business.
•
•
Inability to offer convenient and competitive
delivery options for online orders, leading
to loss of market share to competitors.
Continuing review of international supply chain and support
infrastructure as business develops globally.
•
Continuing investment in technology and infrastructure to maintain
best in class service options.
•
Regular review of the Group’s current debt position and potential
interest and currency rate exposure.
•
Treasury policy in place, aiming to hedge interest and currency rates
over the medium term.
•
Weekly cash flow forecasting and quarterly covenant reporting
commencing on the quarter ending nearest to 30 June 2014.
•
Wage increases offset by improvements in productivity.
•
Geographical diversity of supply chain portfolio.
•
Review of order pricing to determine scope for changing
price architecture.
•
Cost efficiency process in place, together with drive to control and
contain energy usage throughout the Group.
•
•
Cost inflation
Compromise of brand identity or loss
of pricing control arising from 3rd Party
E-commerce platforms.
57
•
The Group’s level of indebtedness, tough
financial markets and exposure to interest
and currency rate volatility constraining the
business and its ability to grow.
Escalation of supply chain costs arising
from factors such as wage inflation or
increases in raw material prices.
Increased fuel and energy costs, impacting
on distribution or store and head office
operational costs.
58
NEW LOOK ANNUAL REPORT & ACCOUNTS 2014
59
N e w L o o k R E TA I L E R S LT D
CORPORATE
SOCIAL
RESPONSIBILITY
We work hard to ensure our business relationships are
ethical and to manage our impact on the environment
3
60
NEW LOOK ANNUAL REPORT & ACCOUNTS 2014
Corporate Social Responsibility
Sustainability is a cornerstone of
how we do business. It’s important
to our customers, our staff, our
suppliers and our stakeholders, and
it makes good business sense for
us too. So we work hard to make
sure our business relationships are
ethical and to manage our impact
on the environment.
Our Ethical Strategy
Achieving a continual improvement in workers’ lives and livelihoods
remains a primary objective. We also want to help improve factory
management skills, systems and safety standards, while empowering
factory workers to raise and resolve issues. We’re doing all we can to
build trust, transparency and shared responsibility throughout our
supply chain.
We’re also working hard to respond effectively to particular events in
our key sourcing countries. Following the tragic building collapse at
Rana Plaza and the series of factory fires in Bangladesh, much of our
focus there has been on improving fire and building safety.
Improving workplace conditions
New Look supported the Accord in Fire and Building Safety in
Bangladesh, and we’ve delivered fire safety training at factories
manufacturing for us.
In China, we’ve provided Health and Safety training at 135 sites, and
the entire workforces at 77 of the factories manufacturing for us are now
covered by an accident and injury insurance initiative. We’ve worked with
13 factories to change thinking about wages and hours as well as build
better systems to track and analyse them, and we’ve trialled peer-to-peer
learning to encourage ongoing improvements at a further four sites.
In India we’ve continued partnering with Geosansar to provide bank
accounts for a further 387 workers at 3 factories and in Bangladesh we
have initiated partnership with BRAC bank to provide bank accounts for
300 workers. This enables workers to start saving, or send money to their
families in rural areas without risk.
In Turkey, we’ve delivered training on freedom of association and workermanagement communication at 8 factories.
Improving factory management systems
At factories where management capacity is poor, workers are more likely
to work long hours, and health and safety issues may go unchecked.
So, during FY14, we provided management training at 44 sites across
Bangladesh, Cambodia, China and India. On completing the UK
Aid funded project Benefits for Business and Workers in India and
Bangladesh, we followed up with participating factories to support
ongoing progress. This has already achieved significant improvements in
worker turnover and wage rates. We have now piloted this project in our
UK supply chain as well.
Building shared responsibility along the supply chain
We can’t expect suppliers to meet our ethical aims without the full
support of New Look’s buyers, merchandisers and designers. So, we’ve
launched an Ethical Champions programme to spread awareness among
our staff, and provided information and training on the principles and
benefits of ethical trade on a monthly basis for our buying teams. We’re
also providing training for all new recruits, and circulating quarterly
newsletters with ethical trade tips and updates.
Animal welfare
At New Look, we’re committed to ensuring no animals are harmed in
the manufacture or testing of our products. Although investigations
uncovered no evidence within our supply chain of the shocking animal
welfare lapses discovered by PETA (People for the Ethical Treatment of
Animals) at Chinese angora farms, we decided to cease production of all
products containing angora and ban its future use.
Our ethical awards
Our commitment to trading in an ethical and sustainable manner has
been acknowledged by a number of major awards.
At the 2013 Ethical Fashion Forum Source Awards, spotlighting bestpractice in the fashion industry, New Look was named Best High Street
Retailer. We also won the Most Stylish Women’s High Heels category in
PETA’s annual Vegan Fashion Awards.
New Look and the environment
Empowering workers to raise and resolve issues
We’re fully committed to minimising the environmental impact of
our activities.
We have supported the establishment of worker committees at 66
factories in India and Bangladesh, helping workforces secure enhanced
leave benefits, more religious holidays, and changed pay dates to help
with budgeting.
During FY14, we signed up to the Sustainable Clothing Action Plan
(SCAP) 2020 Commitment, pledging to measure and reduce our
environmental footprint.
S T R AT E G I C R E P O R T C O R P O R AT E S O C I A L R E S P O N S I B I L I T Y
To inspire environmental awareness among our Bangladeshi
manufacturers, we held an energy efficiency workshop in Dhaka during
November 2013 with representatives from 52 factories covering topics
such as the business case for energy efficiency. Also in Bangladesh,
we’re part-funding suppliers to participate in the International Finance
Corporation’s (IFC) PaCT programme which focuses on efficient water
management practices.
During FY14 we launched the Textile Industry Sustainability Platform
(TISP) to our Chinese suppliers. It provides an online guide to
improving environmental practices, and several factories have already
implemented energy efficiency programs.
Energy & Climate Change
We continue to recognise our corporate responsibility to manage
the risks posed to society, our customers, and our long term business
sustainability from human induced climate change.
Community Giving
Our people give their time, money and energy to support national and
local charities plus special appeals.
The New Look Foundation (established in 2009) is a focus for fundraising
activities throughout the Group. Monies are raised through a variety
of channels including Payroll Giving, Pay Day lottery, direct donations
– and such fun initiatives (in our stores and support centres) as cake
trolleys, prize quizzes, sample sales and raffles. Also a team from New
Look participated in Prince’s Trust Million-Makers initiative, and we held
our first-ever charity Winter Wishes Ball. The total raised during FY14
increased to in excess of £700,000 (from £189,279 in FY13).
During the year we pledged £350,000 to the Retail Trust as well as
£138,000 to the Prince’s Trust from the total fundraising.
During FY14, for those stores which have not been re-lamped as part
of our concept stores programme or re-lamped as part of our drive to
upgrade the product display at other stores, we’ve worked hard in order
to make year-on-year electricity consumption reductions at our stores.
Across 278 stores in the UK and Republic of Ireland where we can monitor
detailed store electricity consumption and which have not been significantly
re-lamped during FY14, we have made like-for-like average annual
electricity consumption savings of 3.4% or circa 5,500 kWh per store, when
compared to same store electricity consumption data for FY13*.
As a participant in the UK’s Carbon Reduction Commitment (CRC) Energy
Efficiency Scheme we calculate and report annually our carbon emissions
under the scheme’s rules. Our carbon emissions in FY13, the last year for
which final data is available, were 69,121 tonnes** (FY12: 65,887 tonnes***).
Our London Support Centre received an award from Paper Round for our
commitment to recycling, saving the equivalent of 22 trees and 2,550kg
of C02 in FY14.
Our Colleagues
We would be nothing without our great people. We believe New Look
is an attractive employer, offering competitive remuneration packages.
In recruitment, we look for customer champions who have passion, who
are curious, go-getting self-starters. We are committed to supporting
everyone at New Look to deliver their part in our success and growth,
and to build skillsets and careers with us.
Equal Opportunities
We make sure no job applicant or colleague is discriminated against, either
directly or indirectly, on the grounds of disability, gender, nationality, ethnic
or racial origins, marital status, religious belief, political opinion, age or
sexual orientation. It is the policy of the Group to give equal opportunity
of employment to disabled and able persons according to their suitability
to perform the work required. The services of existing colleagues who
become disabled are retained whenever practicable.
The Strategic Report presented above is authorised by the Board.
On behalf of the Board,
Anders Kristiansen
*
Including ‘concept’ refurbishments and re-lamped stores, annual electricity
consumption was 2.3% higher than FY13
** On current CRC measurement, which, in line with CRC guidelines has changed for FY14.
*** The comparable current year figure is 63,023 tonnes
CHIEF EXECUTIVE OFFICER
23 May 2014
61
62
NEW LOOK ANNUAL REPORT & ACCOUNTS 2014
N e w L o o k R E TA I L E R S LT D
63
THE
DIRECTORS’
REPORT
64
NEW LOOK ANNUAL REPORT & ACCOUNTS 2014
The Directors’ Report
The Directors present their
report and the audited,
consolidated financial
statements for the year
ended 29 March 2014.
Directors
The Directors whose details are set out on pages 68 and
69 are the current Directors of the Company.
Alistair McGeorge, who was appointed to the Board as
Executive Chairman on 3 May 2011 and became NonExecutive Chairman on 16 January 2013, resigns from the
Board on 31 May 2014.
Tom Singh ceases to be Commercial Director and has
been appointed Interim Non Executive Chairman,
following the departure of Alistair McGeorge, effective
31 May 2014.
The Directors report that, having reviewed current
performance and forecasts, they have a reasonable
expectation that the Group has adequate resources to
continue its operations for the foreseeable future. For this
reason, they have continued to adopt the going concern
basis in preparing the financial statements.
During the financial year, the following persons were also
Directors of the Company:
Land and buildings
Fabio Andreottola, who was appointed to the Board as
a Non-Executive Director on 13 December 2012 and
resigned on 18 December 2013.
The Directors believe there is no material difference
between the market value and net book value of
freehold land held by the Group.
Oriol Pinya, who was appointed to the Board as a NonExecutive Director on 2 November 2010 and resigned
on 18 February 2014.
Principal activities
Following the year-end:
Alastair Miller, who was appointed to the Board as
the Chief Financial Officer of the Group in April 2008,
resigned on 11 April 2014.
Richard Collyer has been appointed to Interim Chief
Financial Officer, following the departure of Alastair
Miller, effective 11 April 2014.
The principal activity of the Group is international,
multichannel retailing. A review of the Group’s business
is set out in the previous sections of the Strategic
Report. The Company acts as a holding company for
the Group.
THE DIRECTORS’ REPORT
Payment of suppliers
The Group’s creditor days as at 29 March 2014 were 51
days (2013: 55 days). Payment is made in accordance
with contractual or other legal obligations. The parent
Company has no trade creditors.
Political donations
The Group made no political donations in the period
(FY13: £nil).
Indemnity insurance
The Company maintains liability insurance for its Directors
and officers; this was in place for the financial period and
up to the date of approval of the Directors’ Report.
Walker report
Directors’ statement as to the disclosure of
information to auditors
In respect of each Director who was a Director at the time
when the report was approved:
•
so far as the Director is aware, there is no relevant
audit information of which the Company’s auditors
are unaware;
•
each Director has taken all steps that he/she ought
to have taken as a Director in order to make himself/
herself aware of any relevant audit information, and to
establish that the auditors are aware of that information.
Independent auditors
PricewaterhouseCoopers LLP have expressed their
willingness to continue in office as auditors.
On behalf of the Board,
On 20 November 2007, David Walker published his
‘Guidelines for Disclosure and Transparency in Private
Equity’ (the Walker Report). Since then the Private Equity
Monitoring Group on Transparency and Disclosure has
produced six reports, the sixth of which was issued in
December 2013. This report has been prepared in the
context of those recommendations.
Anders Kristiansen
CHIEF EXECUTIVE OFFICER
23 May 2014
65
66
NEW LOOK ANNUAL REPORT & ACCOUNTS 2014
T H E D I R E C T O R S ’ R E P O R T D I R E C T O R S ’ R E S P O N S I B I L I T I E S S TAT E M E N T
DIRECTORS’
RESPONSIBILITIES
STATEMENT
The Directors are responsible for preparing
the annual report and the financial
statements in accordance with applicable
law and regulations.
Company law requires the Directors to prepare financial
statements for each financial year. Under that law the
Directors have prepared the Group financial statements
in accordance with International Financial Reporting
Standards (IFRSs) as adopted by the European Union, and
the parent company financial statements in accordance
with United Kingdom Generally Accepted Accounting
Practice (United Kingdom Accounting Standards and
applicable law). Under company law, the Directors must
not approve the financial statements unless they are
satisfied that they give a true and fair view of the state of
affairs of the Group and the parent company and of the
profit or loss of the Group for that period.
the Company and the Group and enable them to ensure
that the financial statements comply with the Companies
Act 2006. They are also responsible for safeguarding
the assets of the Company and the Group and hence for
taking reasonable steps for the prevention and detection
of fraud and other irregularities.
The Directors are responsible for the maintenance
and integrity of the Company’s website. Legislation in
the United Kingdom governing the preparation and
dissemination of financial statements may differ from
legislation in other jurisdictions.
By order of the Board,
In preparing these financial statements, the Directors are
required to:
•
select suitable accounting policies and then apply
them consistently;
•
make judgements and accounting estimates that are
reasonable and prudent;
•
state whether IFRSs as adopted by the European
Union and applicable UK Accounting Standards
have been followed, subject to any material
departures disclosed and explained in the
Group and parent company financial statements
respectively;
•
prepare the financial statements on the going
concern basis unless it is inappropriate to presume
that the Company will continue in business.
The Directors are responsible for keeping adequate
accounting records that are sufficient to show and
explain the Company’s transactions and disclose with
reasonable accuracy at any time the financial position of
Keith Gosling
COMPANY SECRETARY
23th May 2014
67
68
NEW LOOK ANNUAL REPORT & ACCOUNTS 2014
Board of Directors
Alistair McGeorge
Anders Kristiansen
Tom Singh
Non-Executive Chairman
Chief Executive Officer
Director
Alistair McGeorge joined New
Look in November 2010, becoming
Executive Chairman in May 2011
and subsequently Non-Executive
Chairman in January 2013. Prior to
New Look, he was Chief Executive
of Matalan, the value retail chain
where he was responsible for
transforming the look and feel
of the stores and improving
operational efficiency. This resulted
in a significant improvement in
financial performance and returned
the business to growth. Before
Matalan, Alistair worked in a variety
of roles for Littlewoods/Shop Direct
(formerly Littlewoods plc), latterly
as Chief Executive Officer. He is a
qualified Chartered Accountant.
Anders Kristiansen joined New
Look in January 2013 from Bestseller
Fashion Group, where as Vice
Chief Executive in China he helped
establish more than 5,500 stores
in that exciting new market. Prior
to Bestseller, he was Senior Vice
President of Staples Inc. Before
this, he was Managing Director
Europe then Managing Director Asia
Pacific at Lyreco, the office supplies
business. Prior to Lyreco, Anders
held senior positions at Herlitz and
GBC Corp.
Tom Singh founded New Look
in 1969 and retained overall
responsibility for Buying and
Merchandising until he became
a Non-Executive Director and
consultant in May 2001. Following
the public to private re-organisation
in April 2004, he was appointed
Managing Director, Commercial,
until June 2006 when he again
became a Non-Executive Director.
In March 2011, he became
Director, overseeing the Buying,
Merchandising, Design and
Sourcing functions. Following the
year-end and Alistair McGeorge’s
resignation from the Board, Tom
has been appointed Interim NonExecutive Chairman.
THE DIRECTORS’ REPORT BOARD OF DIRECTORS
Tripp Lane
Mike Garland
Christian Bamberger Bro
Martin Halusa
Non-Executive Director
Non-Executive Director
Non-Executive Director
Non-Executive Director
Joining New Look in March 2010 as
Non-Executive Director, Tripp Lane
holds an MBA from The Wharton
School and an MA from Johns
Hopkins University. He is a Principal
at Apax Partners Worldwide LLP in
London. During his 8 years at Apax,
he has worked on deals including
Cengage Learning, New Look,
EMAP, and Trader Corporation.
A partner of Permira, based in
London, Mike Garland leads the
Permira Portfolio Group and has
served on many of its boards. He
has also worked on numerous
transactions including New Look,
Hogg Robinson, Homebase, Hugo
Boss and Valentino, Provimi and
Travelodge. Prior to joining Permira
in 1990, Mike worked at Williams
Holdings and Price Waterhouse
in London. He has a degree in
Mechanical Engineering from the
University of Southampton, England,
and is a Chartered Accountant.
He joined New Look as a NonExecutive Director in 2012.
Christian Bamberger Bro is an
investment executive at Permira
Advisers LLP. He joined Permira’s
consumer sector team in the London
office in 2012. Previously, between
2006 and 2012 he was based in
Permira’s Stockholm office primarily
covering the Nordic region. He has
worked on a number of transactions
including TDC, All3Media and
New Look. Prior to joining Permira,
Christian was an Engagement
Manager at McKinsey & Company
in Copenhagen. Before this, he
worked in Investment Banking at
Nordea. Christian has a Masters in
Economics and Management from
the University of Aarhus, Denmark.
He joined New Look as NonExecutive Director in 2013.
Martin Halusa co-founded Apax
Partners in Germany in 1990 as
Managing Director. His investment
experience has been primarily in
telecommunications and service
industries. In 2003 Martin was
elected Chief Executive Officer of
Apax Partners, and Chairman of
Apax Partners in 2014. Prior to the
launch of Apax, Martin worked at
The Boston Consulting Group,
Swarovski Inc (USA) and Zurich.
Martin has a MBA from Harvard
Business School and PhD in
Economics from Leopold-Franzens
University in Innsbruck. He joined
New Look as a Non-Executive
Director in 2014.
Board is defined here as the ultimate holding company at the date mentioned. Due to various Group reorganisations, New Look Retail Group Limited has only been the ultimate holding company since 7 June 2006.
New Look Retail Group Limited is the ultimate holding company of the New Look Group. Apax Funds own 27.7%
and Permira Funds own 27.6% of the total issued share capital.
69
3
FINANCIAL
STATEMENTS
72
NEW LOOK ANNUAL REPORT & ACCOUNTS 2014
Independent auditors’ report
to the members of
New Look Retail Group Limited
Report on the Group financial statements
Our opinion
In our opinion the financial statements, defined below:
• give a true and fair view of the state of the Group’s affairs as at 29
March 2014 and of its loss and cash flows for the period then ended;
• have been properly prepared in accordance with International
Financial Reporting Standards (IFRSs) as adopted by the European
Union; and
• have been prepared in accordance with the requirements of the
Companies Act 2006.
This opinion is to be read in the context of what we say in the remainder
of this report.
What we have audited
The Group financial statements (the “financial statements”), which are
prepared by New Look Retail Group Limited, comprise:
• Consolidated balance sheet as at 29 March 2014;
• Consolidated income statement and consolidated statement of
comprehensive income for the period then ended;
• Consolidated statement of cash flows for the period then ended;
• Consolidated statement of changes in equity for the period then
ended; and
• the notes to the financial statements, which include a summary of
significant accounting policies and other explanatory information.
The financial reporting framework that has been applied in their preparation
is applicable law and IFRSs as adopted by the European Union.
In applying the financial reporting framework, the Directors have made
a number of subjective judgements, for example in respect of significant
accounting estimates. In making such estimates, they have made
assumptions and considered future events.
What an audit of financial statements involves
We conducted our audit in accordance with International Standards
on Auditing (UK and Ireland) (“ISAs (UK & Ireland)”). An audit involves
obtaining evidence about the amounts and disclosures in the financial
statements sufficient to give reasonable assurance that the financial
statements are free from material misstatement, whether caused by fraud
or error. This includes an assessment of:
the Directors’ Report for the financial period for which the financial
statements are prepared is consistent with the financial statements.
Other matters on which we are required to report
by exception
Adequacy of information and explanations received
Under the Companies Act 2006 we are required to report to you if, in
our opinion, we have not received all the information and explanations
we require for our audit. We have no exceptions to report arising from
this responsibility.
Directors’ remuneration
Under the Companies Act 2006 we are required to report to you if, in our
opinion, certain disclosures of Directors’ remuneration specified by law are
not made. We have no exceptions to report arising from this responsibility.
Responsibilities for the financial statements
and the audit
Our responsibilities and those of the Directors
As explained more fully in the Directors’ Responsibilities Statement set out
on page 67, the Directors are responsible for the preparation of the financial
statements and for being satisfied that they give a true and fair view.
Our responsibility is to audit and express an opinion on the financial
statements in accordance with applicable law and ISAs (UK & Ireland).
Those standards require us to comply with the Auditing Practices
Board’s Ethical Standards for Auditors.
This report, including the opinions, has been prepared for and only for
the Company’s members as a body in accordance with Chapter 3 of
Part 16 of the Companies Act 2006 and for no other purpose. We do
not, in giving these opinions, accept or assume responsibility for any
other purpose or to any other person to whom this report is shown or
into whose hands it may come save where expressly agreed by our prior
consent in writing.
Other matter
We have reported separately on the parent company financial
statements of New Look Retail Group Limited for the 52 week period
ended 29 March 2014.
• whether the accounting policies are appropriate to the Group’s
circumstances and have been consistently applied and adequately
disclosed;
• the reasonableness of significant accounting estimates made by the
Directors; and
• the overall presentation of the financial statements.
In addition, we read all the financial and non-financial information in
the Annual Report & Accounts (the “Annual Report”) to identify material
inconsistencies with the audited financial statements and to identify any
information that is apparently materially incorrect based on, or materially
inconsistent with, the knowledge acquired by us in the course of performing
the audit. If we become aware of any apparent material misstatements or
inconsistencies we consider the implications for our report.
Opinion on other matter prescribed by the Companies Act 2006
In our opinion the information given in the Strategic Report and
Alan Kinnear (Senior Statutory Auditor)
for and on behalf of PricewaterhouseCoopers LLP
Chartered Accountants and Statutory Auditors
Southampton
23 May 2014
(a) The maintenance and integrity of the New Look Retail Group Limited website is the
responsibility of the Directors; the work carried out by the auditors does not involve
consideration of these matters and, accordingly, the auditors accept no responsibility for any
changes that may have occurred to the financial statements since they were initially presented
on the website.
(b) Legislation in the United Kingdom governing the preparation and dissemination of financial
statements may differ from legislation in other jurisdictions.
73
New Look Retail Group Limited
Consolidated income statement
For the financial periods
Revenue
52 weeks ended
29 March 2014
53 weeks ended
30 March 2013
Notes
£m
£m
5, 6
1,528.8
1,484.0
Cost of sales
(722.9)
(698.9)
Gross profit
805.9
785.1
(744.7)
(675.3)
109.8
Administrative expenses
Operating profit
7
61.2
Finance income
9
7.7
10.2
Finance expense
9
(123.5)
(116.6)
(0.4)
(0.3)
Share of post tax loss from joint venture
15
(Loss) / profit before taxation
(55.0)
3.1
Taxation
11
1.4
0.3
(Loss) / profit attributable to the owners of New Look Retail Group Limited
33
(53.6)
3.4
The notes on pages 79 to 127 are an integral part of these consolidated financial statements.
74
NEW LOOK ANNUAL REPORT & ACCOUNTS 2014
New Look Retail Group Limited
Consolidated statement
of comprehensive income
For the financial periods
52 weeks ended
29 March 2014
Notes
(Loss) / profit for the period
53 weeks ended
30 March 2013
£m
£m
(53.6)
3.4
15.8
Other comprehensive income
Items that may be subsequently reclassified to profit or loss:
Cash flow hedges
26, 33
(28.2)
Exchange differences on translation of foreign operations
33
(2.4)
0.9
Tax credit on items recognised directly in equity
11
6.9
(4.0)
Actuarial loss on post employment benefit obligations
35
—
(0.5)
Other comprehensive (expense) / income for the period, net of tax
(23.7)
12.2
Total comprehensive (expense) / income for the period
(77.3)
15.6
The income tax relating to each component of other comprehensive income is disclosed in note 11.
The notes on pages 79 to 127 are an integral part of these consolidated financial statements.
Underlying operating profit is calculated as follows:
For the financial periods
Notes
Operating profit
52 weeks ended
29 March 2014
53 weeks ended
30 March 2013
£m
£m
61.2
109.8
57.8
4.7
Add back/(deduct):
Exceptional items
10
Share based payment expense/(credit)
31
6.3
(0.2)
Fair value movement of financial instruments
26
3.2
1.2
5
128.5
115.5
Underlying operating profit
75
New Look Retail Group Limited
Consolidated balance sheet
As at
Notes
29 March 2014
30 March 2013
£m
£m
Non-current assets
Property, plant and equipment
13
149.6
182.2
Intangible assets
14
703.0
744.7
0.3
Investment in joint venture
15
—
Available for sale financial assets
17
0.3
0.3
Other receivables
19
27.4
39.2
Deferred income tax assets
11
27.0
29.8
907.3
996.5
Current assets
Inventories
18
138.1
144.1
Trade and other receivables
19
64.6
67.8
Derivative financial instruments
20
0.3
17.6
Cash and cash equivalents
21
111.1
113.6
Total assets
314.1
343.1
1,221.4
1,339.6
Current liabilities
Trade and other payables
22
(255.4)
(246.2)
Financial liabilities
23
—
(59.5)
Derivative financial instruments
24
(17.2)
(3.4)
Provisions
29
(4.4)
(5.7)
(9.0)
(8.9)
(286.0)
(323.7)
Income tax liabilities
Non-current liabilities
Deferred income and other payables
22
(86.5)
(91.4)
Financial liabilities
23
(1,156.9)
(1,150.1)
Derivative financial instruments
24
(11.8)
(0.8)
Provisions
29
(10.4)
(9.8)
Deferred income tax liabilities
11
(61.1)
(77.7)
Total liabilities
Net liabilities
(1,326.7)
(1,329.8)
(1,612.7)
(1,653.5)
(391.3)
(313.9)
76
NEW LOOK ANNUAL REPORT & ACCOUNTS 2014
New Look Retail Group Limited
Consolidated balance sheet
(continued)
As at
29 March 2014
30 March 2013
Notes
£m
£m
Share capital
32
10.4
10.4
Share premium
32
0.6
0.6
Treasury shares
32
(23.3)
(21.9)
Other reserves
33
(4.8)
18.9
Reverse acquisition reserve
33
(285.3)
(285.3)
Accumulated losses
33
(88.9)
(36.6)
(391.3)
(313.9)
Deficit attributable to the owners of New Look Retail Group Limited
Total deficit
The notes on pages 79 to 127 are an integral part of these consolidated financial statements.
The financial statements on pages 73 to 127 were authorised for issue by the Board of Directors on 23 May 2014 and were signed on its behalf by:
Anders Kristiansen
CHIEF EXECUTIVE OFFICER
New Look Retail Group Limited
Registration number: 05810406
77
New Look Retail Group Limited
Consolidated statement
of changes in equity
Attributable to the shareholders of New Look Retail Group Limited
Share
capital
Balance at 24 March 2012
Share
premium
Treasury
shares
Other
reserves
Accumulated
losses
Total
equity
Notes
£m
£m
£m
£m
£m
£m
32, 33
10.4
0.6
(22.1)
(279.1)
(39.6)
(329.8)
33
—
—
—
—
3.4
3.4
Comprehensive income
Profit for the financial period
Other comprehensive income
Exchange differences on translation of foreign companies
33
—
—
—
0.9
—
0.9
Movements in hedged financial instruments
33
—
—
—
15.8
—
15.8
Tax on items recognised directly in equity
11
—
—
—
(4.0)
—
(4.0)
Actuarial loss on post employment benefit obligations
35
—
—
—
—
(0.5)
(0.5)
Total other comprehensive income
—
—
—
12.7
(0.5)
12.2
Total comprehensive income
—
—
—
12.7
2.9
15.6
Transactions with owners:
Employee share option scheme:
– value of employee services
33
—
—
—
—
0.1
0.1
Disposal of treasury shares
32
—
—
0.2
—
—
0.2
—
—
0.2
—
0.1
0.3
32, 33
10.4
0.6
(21.9)
(266.4)
(36.6)
(313.9)
33
—
—
—
—
(53.6)
(53.6)
Total transactions with owners
Balance at 30 March 2013
Comprehensive income and expense
Loss for the financial period
Other comprehensive income
Exchange differences on translation of foreign companies
33
—
—
—
(2.4)
—
(2.4)
Movements in hedged financial instruments
33
—
—
—
(28.2)
—
(28.2)
Tax on items recognised directly in equity
11
—
—
—
6.9
—
6.9
Total other comprehensive income and expense
—
—
—
(23.7)
—
(23.7)
Total comprehensive expense
—
—
—
(23.7)
(53.6)
(77.3)
(0.1)
Transactions with owners:
Employee share option scheme:
– value of employee services
33
—
—
—
—
(0.1)
Purchase of treasury shares
32
—
—
(1.4)
—
1.4
—
—
—
(1.4)
—
1.3
(0.1)
10.4
0.6
(23.3)
(290.1)
(88.9)
(391.3)
Total transactions with owners
Balance at 29 March 2014
32, 33
The notes on pages 79 to 127 are an integral part of these consolidated financial statements.
78
NEW LOOK ANNUAL REPORT & ACCOUNTS 2014
New Look Retail Group Limited
Consolidated statement
of cash flows
For the financial periods
52 weeks ended
29 March 2014
53 weeks ended
30 March 2013
£m
£m
Operating profit
61.2
109.8
Depreciation of property, plant and equipment
59.0
65.5
Impairment of property, plant and equipment
14.4
2.7
Amortisation and impairment of intangible assets
51.0
6.7
Write back of investment in joint venture
(0.1)
—
Gain on disposal of property, plant and equipment and intangible assets
(9.5)
(7.4)
Net gain on acquisition of subsidiary
(2.9)
—
(0.2)
Notes
Cash flows from operating activities
Share based payment expense / (credit)
6.3
Fair value losses in financial instruments
3.2
1.2
Foreign exchange losses / (gains) on operating activities
1.2
(0.1)
Amortisation of lease inducements
(11.8)
(11.9)
Decrease / (increase) in inventories
7.3
(11.0)
Decrease in trade and other receivables
13.5
4.5
(10.9)
(5.8)
Decrease in provisions
(0.7)
(3.7)
Income taxes (paid) / received
(5.4)
1.3
Purchase of treasury shares
(1.4)
—
174.4
151.6
Purchase of property, plant and equipment
(42.7)
(45.9)
Purchase of intangibles
(10.5)
(15.8)
16.7
12.0
Decrease in trade and other payables
Net cash flow generated from operating activities
Cash flows used in investing activities
Proceeds from sale of property, plant and equipment
Net acquisition of foreign subsidiary
Net cash flow from investing activities
(0.1)
—
(36.6)
(49.7)
(48.6)
(41.2)
0.4
0.6
(880.7)
(161.0)
Cash flows used in financing activities
Interest paid
Interest received
Repayment of borrowings
Proceeds from issuance of bonds
Net cash flow from financing activities
789.9
—
(139.0)
(201.6)
Net decrease in cash, cash equivalents and bank overdrafts
27
(1.2)
(99.7)
Opening cash, cash equivalents and bank overdrafts
27
113.6
212.3
Exchange (losses) / gains on cash, cash equivalents and bank overdrafts
27
(1.3)
1.0
Closing cash, cash equivalents and bank overdrafts
27
111.1
113.6
The notes on pages 79 to 127 are an integral part of these consolidated financial statements.
79
New Look Retail Group Limited
Notes to the Group
financial statements
1.
Authorisation of financial statements and statement of compliance with IFRSs
The consolidated financial statements of the Group for the 52 weeks
ended 29 March 2014 were authorised for issue by the Board of
Directors (“the Board”) on 23 May 2014 and the balance sheet was
signed on the Board’s behalf by Anders Kristiansen. New Look Retail
Group Limited is a private limited company incorporated and domiciled
in England & Wales whose registered office is New Look House,
Mercery Road, Weymouth, Dorset, England, DT3 5HJ. The registered
number of the company is 05810406.
2.
Summary of significant accounting policies
The principal accounting policies applied in the preparation of
these Group financial statements are set out below. These policies
have been applied consistently to all the periods presented, unless
otherwise stated.
2.1 Basis of preparation
The Group financial statements have been prepared on a going concern
basis in accordance with International Financing Reporting Standards
as adopted for use in the European Union (IFRSs as adopted by the EU),
International Financial Reporting Standards Interpretations Committee
(IFRSIC) interpretations and those parts of the Companies Act 2006
applicable to companies reporting under IFRS. The consolidated
financial statements are presented in Pound Sterling and all values are
rounded to the nearest million (£m) except where otherwise indicated.
There are no material differences between the results shown in the
consolidated income statement and the results prepared under the
historical cost convention, as modified by the revaluation of financial
assets and financial liabilities (including derivatives) at fair value through
the income statement.
2.1.1Going concern
The Directors report that, having reviewed current performance and
forecasts, they have a reasonable expectation that the Group has
adequate resources to continue its operations for the foreseeable future.
For this reason, they have continued to adopt the going concern basis in
preparing the financial statements.
a) Standards, amendments and interpretations that were effective in
the period and were adopted by the Group in preparing the
financial statements.
Amendment to IAS 1 ‘Financial statement presentation’ on other
comprehensive income (OCI) – effective for accounting periods
beginning on or after 1 July 2012. This amendment requires items
disclosed in an entity’s statement of other comprehensive income to be
separated into two groups dependent on whether they may be recycled
to profit and loss in the future or not. This amendment does not have a
material impact on the Group’s financial statements.
IAS 19 (revised 2011) ‘Employee benefits’ – effective for accounting
periods beginning on or after 1 January 2013 and is to be applied
retrospectively. This amendment makes significant changes to the
recognition and measurement of defined benefit pension expense
and termination benefits and to the disclosures for all employee
benefits. This revision does not have a material impact on the
Group’s financial statements.
IFRS 13 ‘Fair value measurement’ – effective for accounting periods
beginning on or after 1 January 2013. This standard provides
the definition of fair value measurement and the disclosure
requirements for use across IFRSs. Material differences between
the fair value and carrying amount of items will be disclosed in the
Group’s financial statements.
The following standards were effective during the period but not
relevant to the Group’s operations:
•
IAS 12 (amendment) ‘Income taxes’ on deferred tax relating to investment properties;
•
IFRS 1 (amendments) ‘First time adoption’ on hyperinflation and fixed dates; and
•
Annual improvements 2011.
b) Standards, amendments and interpretations to existing standards
that are not yet effective and have not been adopted early by the
Group. The Group is still considering the impact of these changes,
but any impact is not expected to be material to the Group’s financial
statements, unless stated otherwise below. No other existing
standards that are not effective are relevant to the Group’s operations.
IAS 32 (amendment) ‘Financial instruments on asset and liability
offsetting’ - IAS 32 amendments effective for accounting periods
beginning on or after 1 January 2014. The amendment is to the
application guidance in IAS 32 that clarifies some of the requirements for
offsetting financial assets and financial liabilities on the balance sheet.
IFRS 10 ‘Consolidated financial statements’ – effective for accounting
periods beginning on or after 1 January 2014. This standard builds on
the existing concept of control in determining whether an entity should
be included within consolidated financial statements.
IFRS 11 ‘Joint arrangements’ – effective for accounting periods beginning
on or after 1 January 2014. This standard provides for revised principles
on the treatement of joint arrangements by focusing on the rights and
obligations rather than their legal form.
IFRS 12 ‘Disclosure of interest in other entities’ – effective for accounting
periods beginning on or after 1 January 2014. This standard includes the
disclosure requirements for all forms of interests in other entities.
IAS 27 (revised) ‘Separate financial statements’ – effective for accounting
periods beginning on or after 1 January 2014. This standard includes the
provisions on separate financial statements of IAS 27 that have not been
included in IFRS 10 ‘Consolidated financial statements’.
IAS 28 (revised) ‘Investments in associates and joint ventures’ – effective
for accounting periods beginning on or after 1 January 2014. This
standard requires joint ventures and associates to be equity accounted
in accordance with the issue of IFRS 11 ‘Joint arrangements’.
IFRS 9 ‘Financial instruments’ on deferral of mandatory effective date -
80
NEW LOOK ANNUAL REPORT & ACCOUNTS 2014
New Look Retail Group Limited
Notes to the Group financial statements (continued)
effective for accounting periods beginning on or after 1 January 2015.
This amendment delays the effective date to annual periods beginning
on or after 1 January 2015. The original effective date was for annual
periods beginning on or after 1 January 2013.
IFRS 10, 11 and 12 (amendments) on transition guidance – effective
for accounting periods beginning on or after 1 January 2014. These
amendments also provide additional transition relief in IFRSs 10, 11, 12,
limiting the requirement to provide adjusted comparative information
to only the preceding comparative period. For disclosures related to
unconsolidated structured entities, the amendments will remove the
requirement to present comparative information for periods before IFRS
12 is first applied.
2.3 Interest in joint ventures
The Group has an investment in a joint venture which is jointly controlled
through a separate legal entity. The Group recognises its interest using
the equity method of accounting. The investment was initially recorded
at cost and adjusted thereafter for the post acquisition changes in
the Group’s share of net assets less distributions received less any
impairment in value. The Group’s share of the entity’s profit or loss
after taxation is included in the consolidated income statement with
the Group’s share of any income and expense outside profit and loss
recognised in the consolidated statement of comprehensive income.
2.4Revenue
IFRS 10, 12 and IAS 27 (amendments) ‘Investment entities’ – effective
for accounting periods beginning on or after 1 January 2014. These
amendments permit many investment entities (funds or similar entities)
to be exempt from consolidating controlled investees.
Revenue is measured at the fair value of the consideration received or
receivable and represents amounts receivable for goods and services
provided to customers outside the Group, stated net of returns, staff
discounts, and value added and other sales taxes.
2.2 Basis of consolidation
The Group recognises revenue when the amount of revenue can be
measured reliably, it is probable that future economic benefits will flow
to the entity and when specific criteria have been met for each of the
Group’s activities as described below. The Group bases its estimates on
historical results, taking into consideration the type of customer, the type
of transaction and the specifics of each arrangement. For example, it is
the Group’s policy to sell its products to the end customer with a right
of return. Accumulated experience is used to estimate and provide for
such returns.
The Group financial statements incorporate the financial statements
of the Company, its subsidiary undertakings and joint venture. Joint
ventures are accounted for using the equity method, see 2.3.
Subsidiaries are all entities over which the Group has the power to
govern the financial and operating policies generally accompanying a
shareholding of more than one half of the voting rights. The existence
and effect of potential voting rights that are currently exercisable or
convertible are considered when assessing whether the Group controls
another entity. Subsidiaries are consolidated from the date on which
control is transferred to the Group. They are de-consolidated from the
date that control ceases.
Acquisitions of subsidiaries by the Group prior to 1 July 2009 have been
included in the Group financial statements using the purchase method
of accounting that measures the assets and liabilities given, incurred
or assumed at their fair value at the acquisition date, plus costs directly
attributable to the acquisition. For all acquisitions occurring on or after 1
July 2009, costs relating to the acquisition shall be expensed.
Goodwill is initially measured as the excess of the aggregate of the
consideration transferred and the fair value of non controlling interest
over the net identifiable assets acquired and liabilities assumed. If
this consideration is lower than the fair value of the net assets of the
subsidiary acquired, the difference is recognised in profit or loss.
Acquisitions which result from a newly created company issuing shares
to achieve a business combination are treated as a group reorganisation.
When the acquiree has not been combined with any other business and
continues to meet the definition of a business then reverse acquisition
accounting has been applied.
All intra-group transactions, balances, income and expenses are
eliminated on consolidation. Accounting policies of subsidiaries have
been changed where necessary to ensure consistency with the policies
adopted by the Group.
Sales of goods and concession income are recognised when goods
are delivered and title passed. Income from rendering of services is
recognised when the services have been performed. Internet sales are
recognised when the goods are despatched to the customer. Store card
arrangement fees are recognised over the life of the agreement with the
store card provider.
Revenue from concessions is shown on a net basis, being the
commission received rather than the gross value achieved by the
concessionaire on the sale.
Rental income in respect of sub-leased stores is recognised on a straightline basis over the period of the sub-lease.
Franchise income is received in connection with the franchise of the
Group’s brand name overseas. Franchise royalty income represents
the release of the upfront exclusivity fee that has been spread over the
term of the agreement. Monthly franchise fee income is recognised
in accordance with the related underlying trading performance of
the franchisee. Monthly income covering the supply of goods to the
franchisee is included in the sale of goods.
2.5 Cost of sales
Cost of sales consists of expenses incurred in getting products to
a saleable position and condition. Such costs principally include
purchasing of products from suppliers, packaging, freight and
distribution costs.
81
2.6 Interest income
Interest income is accounted for on the accruals basis, by reference
to the principal outstanding and the applicable effective interest
rate, which is the rate that exactly discounts the estimated future
cash payments or receipts through the expected life of the financial
instrument or a shorter period, where appropriate, to the net carrying
amount of the financial asset or liability.
2.7 Exceptional items
Significant non-recurring items of income and expense are disclosed in
the underlying profit reconciliation as exceptional items. The separate
reporting of exceptional items helps provide an indication of the
Group’s underlying business performance.
Costs which may be classified as exceptional include costs of
restructuring and reorganisation of the business (such as redundancies,
directly related legal and professional costs, relocation costs and
duplicate facility costs), writing down inventories by material amounts
to net realisable value, writing down trade and other receivables by
material amounts to their recoverable amount, impairments or reversal
of impairments of intangible assets, property, plant and equipment,
litigation settlements, costs incurred as part of the review of business
financing, including abortive costs and refinancing costs not eligible
to be treated as debt issue costs, one off bonus incentives, gains on
acquisition of subsidiaries and directly related legal costs and the
subsequent unwinding of acquisition fair value adjustments and gains or
losses resulting from the disposal of the Mercery Road, Weymouth site.
2.8 Foreign currencies
Items included in the financial statements of each of the Group’s
entities are measured using the currency of the primary economic
environment in which the entity operates (“the functional currency”).
The consolidated financial statements are presented in Sterling, which is
the Group’s presentational currency.
Transactions in foreign currencies, which are those other than the
functional currency of an entity, are recorded at the rate of exchange
ruling at the date of the transaction. Monetary assets and liabilities
denominated in foreign currency are translated at the rates ruling at the
balance sheet date. Resulting exchange gains or losses are recognised
in the income statement for the period.
Upon consolidation, assets and liabilities of the Group’s overseas
subsidiary undertakings are translated into Sterling at the rate of
exchange ruling at the balance sheet date and income statements are
translated at the average exchange rate during the period. Differences
on translation are recognised in a separate reserve. On disposal of
an overseas subsidiary, the cumulative exchange differences for that
subsidiary are recognised in the income statement as part of the profit or
loss on disposal.
2.9 Property, plant and equipment
Property, plant and equipment is stated at cost less accumulated
depreciation and any provision for impairment in value. Cost includes
the original purchase price of the asset and the costs attributable to
bringing the asset to its working condition for its intended use.
Asset Category
Useful life
Freehold buildings
50 years
Fixtures and equipment
3 to 15 years
Depreciation is provided to write down the cost of fixed assets to their
estimated residual values, based on current prices at the balance sheet
date, over their remaining useful lives on a straight-line basis.
Refurbishments are included in the asset’s carrying amount only when
it is probable that future economic benefits associated with the items
will flow to the Group and the cost of the item can be measured reliably
and are depreciated over the asset’s remaining useful economic life. The
carrying amount of the replaced part is derecognised. All other repairs
and maintenance are charged to the income statement during the
financial period in which they are incurred.
The assets’ residual values and useful lives are reviewed, and adjusted if
appropriate, at each balance sheet date.
An asset’s net carrying amount is written down immediately to its
recoverable amount if the asset’s net carrying amount is greater than its
estimated recoverable amount.
Gains and losses on disposals are determined by comparing the
proceeds with the net carrying amount.
2.10Intangible assets
(a)Goodwill
Goodwill represents the excess of the cost of an acquisition over
the fair value of the Group’s share of the net identifiable assets of the
acquired subsidiary at the date of acquisition. Goodwill on acquisition of
subsidiaries is included in ‘intangible assets’. Goodwill is tested annually
for impairment and carried at cost less accumulated impairment losses.
Impairment losses on goodwill are not reversed. Gains and losses on the
disposal of an entity include the carrying amount of goodwill relating to
the entity sold.
Goodwill is allocated to cash-generating units (CGUs) for the purpose
of impairment testing. The allocation is made to those CGUs or groups
of CGUs that are expected to benefit from the business combination in
which the goodwill arose.
(b) Other intangible assets
Intangible assets acquired separately are capitalised at cost and those
acquired as part of a business acquisition are capitalised at fair value
as at the date of acquisition. Following initial recognition, intangible
assets are carried at cost less any accumulated amortisation and any
accumulated impairment losses.
Internally generated intangible assets are capitalised when certain
criteria are met in accordance with IAS 38, otherwise this expenditure is
charged against income in the year in which it is incurred.
The useful lives of these intangible assets are assessed to be either finite
or indefinite. Intangible assets with an indefinite life are not amortised
82
NEW LOOK ANNUAL REPORT & ACCOUNTS 2014
New Look Retail Group Limited
Notes to the Group financial statements (continued)
but are subject to an impairment test as described in note 2.11. Where
amortisation is charged on assets with finite lives, this expense is taken
to the consolidated income statement, on a straight-line basis, through
administrative expenses, based on the useful life shown below:
The fair value of derivative contracts is their market value at the balance
sheet date. Market values are calculated using mathematical models
and are based on the duration of the derivative instrument together
with quoted market data including interest rates, foreign exchange rates
and market volatility at the balance sheet date. The fair value of interest
rate contracts is the estimated amount that the Group would receive or
pay to terminate them at the balance sheet date, taking into account
prevailing interest rates.
Category
Useful life
Brand
Indefinite
Software licences
1 to 5 years
(b) Hedge accounting
Domain names
5 to 10 years
Recoverable leasehold property premiums
Indefinite
For the purpose of hedge accounting, hedges are classified as either fair
value hedges where they hedge the exposure to changes in the fair value
of a recognised asset or liability; or cash flow hedges where they hedge
exposure to variability in cash flows that is either attributable to a particular
risk associated with a recognised asset or liability or a forecast transaction.
Intangible assets with finite lives are assessed for impairment in
accordance with note 2.11.
2.11 Impairment of non-financial assets
Assets that have an indefinite useful life, for example goodwill, are not
subject to amortisation and are tested annually for impairment. Assets
that are subject to amortisation are reviewed for impairment whenever
events or changes in circumstances indicate that the net carrying
amount may not be recoverable. An impairment loss is recognised
for the amount by which the asset’s carrying amount exceeds its
recoverable amount. The recoverable amount is the higher of an asset’s
fair value less costs to sell and value in use. For the purposes of assessing
impairment, assets are grouped at the lowest level for which there
are separately identifiable cash flows (CGUs) and impairment is tested
for groups of CGUs not larger than operating segments which are
country sub-groups of each of the Group’s brands, in line with internal
management reporting.
For non-financial assets other than goodwill, impairment losses are
reviewed for possible reversal at each reporting date. A previously
recognised impairment loss is reversed only if there has been a
change in the assumptions used to determine the asset’s recoverable
amount since the last impairment was recognised. The reversal is
limited so that the carrying amount of the asset does not exceed its
recoverable amount, nor exceed the carrying amount that would have
been determined, net of depreciation, had no impairment loss been
recognised for the asset in prior years. Such reversal is recognised in the
income statement unless the asset is carried at a revalued amount.
2.12Financial instruments
(a) Derivative financial instruments
Derivative financial instruments (‘derivatives’) are used to manage risks
arising from changes in foreign currency exchange rates relating to the
purchase of overseas sourced products and changes in interest rates
relating to the Group’s debt. In accordance with its treasury policy, the
Group does not enter into derivatives for speculative purposes.
Derivatives falling under the classifications laid out in IAS 39 are stated at
fair value in the balance sheet.
For derivatives that are designated and qualify as cash flow hedges,
the effective portion of changes in fair value is recognised in other
comprehensive income through the hedging reserve. The gain or loss
relating to the ineffective portion is recognised immediately in the income
statement. Amounts accumulated in equity are reclassified to the income
statement in the periods when the hedged item affects profit or loss.
When a cash flow hedging instrument expires or is sold, or when
a hedge no longer meets the criteria for hedge accounting, any
cumulative gain or loss existing in the hedging reserve in equity at that
time remains in equity and is recognised when the forecast transaction is
ultimately recognised in the income statement. If a hedged transaction is
no longer expected to occur, the net cumulative gain or loss recognised
in the hedging reserve in equity is immediately transferred to the income
statement for the period.
Changes in the fair value of derivatives that are designated and qualify
as fair value hedges are recorded in the income statement, together
with any changes in the fair value of the hedged asset or liability that
are attributable to the hedged risk. If the hedge no longer meets the
criteria for hedge accounting, the hedged item ceases to be adjusted
for changes in its fair value attributable to the risk being hedged and
continues to be accounted for in the manner that was applicable prior to
it being hedged.
Changes in the fair value of derivatives which do not qualify for hedge
accounting are recognised in the income statement as they arise.
Derivatives embedded in other financial instruments or other host
contracts are treated as separate derivatives when their risks and
characteristics are not closely related to those of the host contracts. The
unrealised gains and losses on embedded derivatives are taken directly
to the income statement.
(c) Non-derivative financial instruments
All loans and borrowings are initially recognised at the fair value of the
consideration received net of issue costs associated with the borrowing.
All deposits are initially recognised at cost.
83
After initial recognition, interest-bearing loans and borrowings are
subsequently measured at amortised cost using the effective interest
method. Amortised cost is calculated by taking into account any issue
costs, and any discount or premium on settlement.
•
Where the temporary difference arises from the initial recognition
of goodwill or a non business combination asset or liability;
•
In respect of taxable temporary differences associated with
investments in subsidiaries and the joint venture, where the timing
of the reversal of the temporary differences can be controlled and
it is probable that the temporary differences will not reverse in the
foreseeable future; and
•
Deferred tax assets are recognised only to the extent that it is
probable that taxable profits will be available against which the
deductible temporary differences, carried forward tax credits or
tax losses can be utilised.
Interest costs are expensed in the income statement so as to achieve a
constant finance cost as a proportion of the related outstanding borrowings.
Trade receivables are initially recognised at fair value and subsequently
measured at amortised cost less any provision for impairment.
A provision for impairment of trade receivables is established when
there is objective evidence that the Group will not be able to collect
all amounts due according to the original terms of the receivables.
Significant financial difficulties of the debtor, probability that the
debtor will enter bankruptcy or financial reorganisation, and default or
delinquency in payments (more than 60 days overdue) are considered
indicators that the trade receivable is impaired. The amount of the
provision is the difference between the asset’s net carrying amount and
the present value of the estimated future cash flows, discounted at the
original effective interest rate.
Trade payables are initially recognised at fair value and subsequently
measured at amortised cost.
The Group’s unlisted investments are classified as available for sale and
are stated at their historic cost less any impairment. They are included in
non-current assets since management does not intend to dispose of the
investments within 12 months of the balance sheet date.
2.13Inventories
Inventories are valued at the lower of cost and net realisable value, using
the weighted average cost basis.
Costs include the direct costs, measured at actual cost, and an
attributable proportion of distribution overheads incurred in bringing
inventories to their current location and condition.
Net realisable value is based on estimated selling price, less further costs
to be incurred to disposal.
2.14Cash and cash equivalents
In the consolidated statement of cash flows, cash and cash equivalents
includes cash in hand, deposits held at call with banks, short term
deposits with an original maturity of three months or less, and bank
overdrafts. In the consolidated balance sheet, bank overdrafts are shown
within current financial liabilities.
2.15Taxation
Current tax assets and liabilities are measured at the amount expected
to be recovered from or paid to the taxation authorities. The tax rates
and tax laws used to compute the amount are those that are enacted or
substantively enacted at the balance sheet date.
Deferred tax is recognised on all temporary differences arising between
the tax bases of assets and liabilities and their carrying amounts in the
Group financial statements, with the following exceptions:
Deferred tax assets and liabilities are measured on an undiscounted
basis at the tax rates that are expected to apply when the related asset
is realised or liability settled, based on tax rates and laws enacted or
substantively enacted at the balance sheet date. Deferred tax assets and
liabilities are offset against each other when there is a legally enforceable
right to offset current tax assets against current tax liabilities, when the
deferred income taxes relate to income taxes levied by the same tax
jurisdiction and when the Group intends to settle its current tax assets
and liabilities on a net basis.
Tax is recognised in the income statement, except to the extent that it
relates to items recognised in other comprehensive income or directly
in equity. In this case, the tax is also recognised in other comprehensive
income or directly in equity, respectively.
2.16Employee benefit costs
(a) Pension obligations
The Group accounts for pensions and other post-retirement benefits
under IAS 19.
The Group only operates defined contribution pension schemes in the
UK and RoI. The Group has no further payment obligations once the
contributions have been paid. Payments to defined contribution plans
are recognised as an expense when the contributions fall due. Prepaid
contributions are recognised as an asset to the extent that a cash refund
or a reduction in the future payments is available.
The French subsidiaries are subject to a statutory scheme which consists
of a single payment at the date of retirement which is classified as a
defined benefit plan under IFRS. In respect of this plan, obligations are
measured at the discounted present value by a qualified actuary.
(b) Termination benefits
Termination benefits are payable when employment is terminated
by the Group before the normal retirement date, or whenever an
employee accepts voluntary redundancy in exchange for these benefits.
The Group recognises termination benefits when it is demonstrably
committed to either: terminating the employment of current employees
according to a detailed formal plan without possibility of withdrawal; or
providing termination benefits as a result of an offer made to encourage
voluntary redundancy. Benefits falling due more than 12 months after the
balance sheet date are discounted to their present value.
84
NEW LOOK ANNUAL REPORT & ACCOUNTS 2014
New Look Retail Group Limited
Notes to the Group financial statements (continued)
2.17Share based payments
The Group operates a number of share based payment schemes: the
Senior Management Scheme, the 2004 Share Scheme, the 2006
Option Plan and the 2008 Share Plan. Each scheme features both equity
and cash settled components.
risks specific to the obligation. The increase in the provision due to the
passage of time is recognised as interest expense.
Provisions for restructuring costs are recognised when the Group has a
detailed formal plan for the restructuring that has been communicated
to affected parties.
The cost of the equity settled transactions with employees is measured
by reference to the fair value at the date at which they are granted and is
recognised as an expense over the vesting period, which ends on the
date on which the relevant employees become fully entitled to the award.
Fair value is determined using an IFRS 2 compliant pricing model.
2.20Leases
At each balance sheet date, the Group revises its estimates of the
number of options or shares that are expected to vest. The impact
of the revision, if any, is recognised in the income statement with a
corresponding adjustment to reserves.
Where an arrangement is dependent on the use of a specified asset or
assets, or conveys the right to use an asset, it is determined to contain a
lease although this may not be its legal form. The lease element of the
arrangement is accounted for as either a finance or operating lease.
The Group provides for the expected cost of ‘Good Leavers’ which
are settled in cash by estimating at each balance sheet date the likely
amount of ‘Good Leavers’ until the date when vesting conditions are
met. A provision is created on the balance sheet and a corresponding
charge is made to the income statement. ‘Good Leavers’ could arise
from redundancy, disability, injury or death. The actual cost of ‘Good
Leavers’ in the period is charged against the provision brought forward.
Rentals payable under operating leases are charged to income on a
straight line basis over the period of the lease. Premiums payable on
entering an operating lease are charged to the income statement on
a straight line basis over the lease term. Rent free periods and lease
inducements receivable on entering an operating lease are recognised
as deferred income and released to income on a straight-line basis over
the lease term. Capital contributions from landlords are reflected as
lease incentives.
Under the 2006 Option Plan and the 2008 Share Plan the number of
shares that would vest under the ‘Good Leaver’ provision would be
pro-rated to take into account the length of the holding period since
the date of the grant and this pro-rated amount of shares would then
be cash settled. Under the Senior Management Scheme and the 2004
Share Scheme the change in equity value from the date of the grant or
issue of the shares using an appropriate valuation model is payable to
the ‘Good Leavers’ in cash.
Other Leavers under the 2004 Share Scheme and the 2008 Share Plan
are entitled to a cash payment. Provision is made for the cash to which
Other Leavers are entitled.
2.18 Shares held by the ESOPs
The Employee Share Option Plan Trusts (ESOPs) were set up to allow the
issue of shares to Group employees and are consolidated. The shares
acquired by the ESOPs are included as treasury shares within capital and
reserves at cost. Gains made by the ESOPs on purchasing and selling
New Look Retail Group Limited shares are recorded within a separate
ESOP reserve.
2.19Provisions
A provision is recognised when: the Group has a present legal or
constructive obligation as a result of a past event; it is probable that an
outflow of resources will be required to settle the obligation; and the
amount has been reliably estimated. Provisions are not recognised for
future operating losses.
Provisions are measured at the present value of the expenditures
expected to be required to settle the obligation using a pre tax rate that
reflects current market assessments of the time value of money and the
Leases are classified as finance leases where the terms of the lease
transfer substantially all the risks and rewards of ownership to the Group.
All other leases are classified as operating leases.
2.21 Share capital
Ordinary share capital is classified as equity. Financial liabilities and
equity instruments are classified according to the substance of the
contractual arrangements entered into. An equity instrument is any
contract that evidences a residual interest in the assets of the Group after
deducting all of its liabilities.
2.22 Segment reporting
Operating segments by brand and geography are determined in a
manner consistent with the internal reporting provided to the chief
operating decision-maker. The chief operating decision-maker, who is
responsible for allocating resources and assessing performance of the
operating segments, has been identified as the Board.
2.23Underlying operating profit
In addition to the information required by IFRS and to assist with the
understanding of earnings trends, the Group has included within its
financial statements a non-GAAP measure referred to as underlying
operating profit. Management consider that underlying operating
profit reflects the trading performance of the Group which excludes the
impacts of exceptional items, share based payments and the marking to
market of financial instruments not realised in the period.
3.
Treasury and financial risk management
The Group’s activities expose it to a variety of financial risks: liquidity
risk, market risk (including foreign exchange rate risk and interest rate
risk) and credit risk. The Group’s overall risk management programme
focuses on the unpredictability of financial markets and seeks to
minimise potential adverse effects on the Group’s financial performance.
85
The Group operates a centralised treasury function which is responsible
for managing the liquidity, interest and currency risks associated with the
Group’s activities. As part of its strategy for the management of those
risks, the Group uses derivative financial instruments. In accordance with
the Group’s treasury policy, derivative instruments are not entered into
for speculative purposes.
The Group’s principal financial instruments, other than derivatives, are
cash and short-term deposits, bank overdrafts and loans. The main
purpose of these financial instruments is to raise finance for the Group’s
operations. In addition, the Group has various other financial assets and
liabilities such as trade receivables and trade payables arising directly
from its operations.
Liquidity risk
Prudent liquidity risk management implies maintaining sufficient
cash and marketable securities, the availability of funding through an
adequate amount of committed credit facilities and the ability to close
out market positions. Due to the dynamic nature of the underlying
businesses, Group treasury maintains certainty of funding by maintaining
availability under committed credit lines.
Management monitors rolling forecasts of the Group’s liquidity position
which comprise an undrawn revolving credit facility of £75.0 million
(2013: £10.8 million) and an overdraft limit of £5.0 million (2013: £5.0
million) and cash and short-term deposits (note 21) on the basis of
expected cash flow.
The Group monitors compliance against all its financial obligations and
it is Group policy to manage the performance and position of the Group
so as to operate within covenanted restrictions at all times.
Currency risk
The Group operates internationally and is exposed to foreign exchange
risk arising from various currency exposures, primarily with respect to the
Euro and US dollar. Foreign exchange risk arises from future commercial
transactions, recognised assets and liabilities and net investments in
foreign operations.
Foreign currency risk is the risk that the fair value of a financial
commitment, recognised financial assets or financial liabilities will
fluctuate due to changes in foreign currency rates.
The Group’s principal foreign currency exposures arise from the
purchase of overseas sourced products. Group policy is to hedge a
proportion of these exposures for up to 15 months ahead in order to
limit the volatility in the ultimate Sterling cost. This hedging activity
involves the use of spot, forward and option contracts. To the extent that
the translation of overseas assets is not offset by the effect of translating
overseas liabilities, the effects are not currently hedged and are
recognised within consolidated reserves.
To manage the foreign exchange risk arising from future commercial
transactions and recognised financial assets and financial liabilities,
forward contracts, managed by Group treasury, are used.
The periodic effects are determined by relating the hypothetical
changes in the risk variables to the balance of financial instruments at
the reporting date. It is assumed that the balance at the reporting date is
representative for the period as a whole.
During the period to 14 May 2013, debt Tranches B2, B5, C2 and C5
were denominated in Euros before being settled in full as part of the
Group refinancing transaction. During the period 14 May 2013 to 29
March 2014, the Group had bond tranches denominated in Euros and
US dollars. All other group borrowings were in Sterling.
The Group uses a currency swap to manage the foreign exchange
exposure on the US dollar bond to convert the US dollar interest
payments and the end of term repayment into Sterling.
During the period ended 29 March 2014, if Sterling had weakened
by 5.0% against the Euro with all other variables held constant, posttax loss (2013: gain) for the period would have been £6.2 million
higher (2013: £0.5 million lower), mainly as a result of the translation
of Euro denominated bonds; post-tax decrease (2013: decrease) in
shareholder’s deficit would have been £3.2 million higher (2013: £6.6
million lower) due to the consolidation of net assets and liabilities of
foreign subsidiaries with their functional currency as Euro.
During the period ended 29 March 2014, if Sterling had weakened by
5.0% against the US dollar with all other variables held constant, posttax loss (2013: gain) for the period would have been £1.3 million higher
(2013: £2.5 million lower), mainly as a result of revaluation of overseas
trade creditors; post-tax decrease (2013: decrease) in shareholders’
deficit would have been £14.6 million higher (2013: £14.3 million
higher) as a result of the movement in forward currency contracts.
The Group decided to hold cash in a Euro denominated bank account
as a natural hedge for the effect of the revaluation of the Group’s Euro
denominated bank borrowing up until the Euro debt was settled on 14
May 2013 as part of the Group refinancing transaction. As at 30 March
2013, the amount of Euros held as a natural hedge was €65.8 million
against the total Euro denominated bank borrowings of €65.8 million.
Interest rate risk
The Group uses interest rate derivatives to manage the cost of its floating
rate debt by entering into fixed rate derivatives, so as to reduce exposure to
changes in interest rates.
The Group analyses its interest rate exposure on a dynamic basis. Various
forecasting is simulated taking into consideration refinancing, alternative
financing and hedging. Based on these forecasts, the Group calculates the
impact on profit and loss of a defined interest rate shift. For each forecast,
the same interest rate shift is used across all currencies. The scenarios are
only run for liabilities that represent the major interest-bearing positions.
The forecasting is done on a regular basis to verify that the maximum loss
potential is within the limit given by management.
Borrowings issued at variable rates expose the Group to cash flow interest
rate risk. Since the Group refinancing transaction on 14 May 2013, the
Group has hedged 100% of the floating rate exposure. Prior to the
refinancing, Group policy was to hedge 50-75% of floating rate exposure.
86
NEW LOOK ANNUAL REPORT & ACCOUNTS 2014
New Look Retail Group Limited
Notes to the Group financial statements (continued)
The Group manages its cash flow interest rate risk by using floating-to-fixed
interest rate swaps and interest rate caps. This has the economic effect of
converting borrowings from floating rates to fixed rates.
Interest rate risks are presented by way of sensitivity analyses in
accordance with IFRS 7. These show the effects of changes in market
interest rates on interest payments, interest income and expense and
other income components.
The interest rate sensitivity analyses are based on the following assumptions:
• In the case of fair value hedges designed for hedging interest
rate risk, the changes in the fair value of the hedged item and the
hedging instrument attributable to interest rate movements balance
out almost completely in the income statement in the same period.
As a consequence, these financial instruments are not exposed to
interest rate risk;
• Certain financial instruments are designated as hedging instruments
in a cash flow hedge to hedge payment fluctuations resulting from
interest rate movements. Changes in the market interest rate affect
the hedging reserve in shareholders’ equity and are therefore taken
into consideration in the equity-related sensitivity calculations;
• Changes in the market interest rate of interest rate derivatives affect
other financial income or expense and are therefore taken into
consideration in the income-related sensitivity calculations; and
• Currency derivatives are not exposed to interest rate risks and are
therefore not included in the interest rate sensitivity calculations.
During the period ended 29 March 2014, if interest rates had been 100
basis points higher (2013: 100 bp) with all other variables held constant,
post-tax loss (2013: profit) for the period would have been £0.4 million
lower (2013: £8.4 million lower), mainly as a result of a higher interest
income on floating rate deposits; post-tax movement in equity would be
£0.6 million higher (2013: £2.3 million lower) as a result of movement in
cash flow hedges.
During the period ended 29 March 2014, if interest rates on Euro
denominated borrowings had been 100 basis points higher (2013: 100
bp) with all other variables held constant, post-tax loss (2013: profit)
for the period would have been unaffected (2013: £0.6 million lower)
due to the equal and opposite offset of the interest rate swaps held to
convert the floating rate interest to fixed rate interest.
Credit risk
Credit risk is managed on a Group basis. Credit risk arises from cash
and cash equivalents, derivative financial instruments and deposits with
banks and financial institutions, as well as credit exposures to wholesale
and retail customers, including outstanding receivables and committed
transactions. If wholesale customers are independently rated, these
ratings are used. Otherwise, if there is no independent rating, risk
control assesses the credit quality of the customer, taking into account its
financial position, past experience and other factors. Individual risk limits
are set based on internal or external ratings in accordance with limits set
by the Board. The utilisation of credit limits is regularly monitored. Sales
to retail customers are settled in cash or using major credit cards.
The credit ratings of banks with which the Group has investments
of cash surpluses, borrowings or derivative financial instruments are
reviewed regularly by management. Each bank is assessed individually
with reference to the credit it holds and deposit limits are set, which are
approved by the Board and reconsidered if the Fitch, Moody or S&P
credit rating falls below an “A” rating.
Receivable balances are monitored on an on-going basis and provision
is made for estimated irrecoverable amounts.
Capital risk management
The Group’s principal objective when managing capital is to safeguard
the Group’s ability to continue as a going concern in order to provide
returns to shareholders and benefits for stakeholders.
The Group had debt covenants imposed by its lenders to be achieved
in order to maintain the level of borrowings. Covenant tests were
carried out quarterly and at the end of each financial period. There
were no breaches of the covenants up to the date on which the Group
refinanced (2013: none).
As a result of the refinancing on 14 May 2013, the quarterly debt
covenant reporting requirements ceased. The Revolving Credit Facility
Agreement requires the Group to comply with a leverage ratio, defined
as the ratio of consolidated net indebtedness at such date to adjusted
EBITDA for the period of the most recent 4 consecutive financial
quarters. New covenant measures will be tested quarterly with the
first date commencing on 28 June 2014. For further details on the
refinancing transaction see note 28.
The Group must ensure sufficient capital resources are available for
working capital requirements and meeting principal and interest
payment obligations as they fall due.
As at 29 March 2014, net debt was £1,045.8 million (2013: £1,096.0
million), see note 27.
4.
Critical accounting estimates, judgements and assumptions
Estimates and judgements are continually evaluated and are based on
historical experience and other factors, including expectations of future
events that are believed to be reasonable under the circumstances.
The Group makes estimates and assumptions concerning the future. The
resulting accounting estimates will, by definition, seldom equal the related
actual results. The estimates and assumptions that have a significant risk
of causing a material adjustment to the carrying amounts of assets and
liabilities within the next financial period are discussed below:
(a) Estimated impairment of intangible assets with indefinite lives
The Group tests whether intangible assets with indefinite lives have
suffered any impairment in accordance with the accounting policy stated.
The recoverable amounts of cash-generating units have been determined
based on the higher of value in use or fair value less cost to sell. These
calculations require the use of estimates as detailed in note 14.
(b) Income taxes
The Group is subject to income taxes in numerous jurisdictions. At
each financial period end, judgement is required in determining the
87
Group provision for income taxes. There are some transactions and
calculations for which the ultimate tax determination is uncertain.
The Group recognises anticipated tax liabilities based on the best
estimates of whether additional taxes will be due at the balance sheet
date. Where the final tax outcome of these matters is different from the
amounts that were initially recorded, such differences will impact the
current and deferred tax assets and liabilities in the period in which such
determination is made.
(c) Share based payments
The share based payment expense is recognised in each period as it is
incurred, based on a fair value model, and estimates of the likely future
cash payments to leavers. The key assumptions include the estimated
timing of a change in control of the Group or a listing. The remaining key
assumptions of this model are presented in note 31.
(d) Estimated useful life of intangibles, property, plant and equipment
The Group estimates the useful life and residual values of intangible
assets, property, plant and equipment and reviews these estimates at
each financial period end. The Group also tests for impairment when a
trigger event occurs, or annually as appropriate.
(e) Onerous lease provisions
When a property ceases to be used for the purposes of the business,
a provision is made to the extent that the recoverable amount of the
interest in the property is expected to be insufficient to cover the
future obligations relating to the lease. Where possible, the property is
subleased at the prevailing rent.
A provision is also booked on loss making stores where the discounted
future cash flows are not expected to cover future payments under
the lease contract. The key assumptions to these provisions are the
estimated future cash flows and applied discount rates.
(f)
Impairment of financial assets
The Group follows the guidance of IAS 39 to determine when a financial
asset is impaired. This determination requires significant judgement. In
making this judgement, the Group evaluates, among other factors, the
duration and extent to which the fair value of an investment is less than
its cost, and the financial health of and near-term business outlook for
the investee, including factors such as industry and sector performance,
changes in technology and operational and financing cash flow.
(g) Inventory provisions
The Group estimates a slow moving inventory provision based on prior
movements and current market conditions.
(h) Exceptional items
The Group applies judgement in identifying the significant non-recurring
items of income and expense that are recognised as exceptional to help
provide an indication of the Group’s underlying business performance.
5.
Segment information
Management has determined the operating segments based on the
reports reviewed by the Board that are used to make strategic decisions.
The Board considers the business from both a New Look brand and
geographic perspective. Geographically, management considers the
performance of the UK (UK Retail and E-commerce) and International (all
other streams).
The reportable segments derive their revenue primarily from the sale
of retail goods and gross concession sales. New Look brand & UK
segments include rental income and store card income.
The Board assesses the performance of the operating segments based
on revenue grossed up to include the sales of store concessions
(‘segmental gross transactional value’) and on a measure of underlying
operating profit (see definition in note 2.23). This measurement basis
excludes the effects of exceptional items, share-based payments and
unrealised gains/losses on financial instruments. Interest income and
expenditure are not allocated to segments, as this type of activity is
driven by the central treasury function, which manages the cash position
of the Group. Transfer prices between operating segments are on an
arm’s length basis in a manner similar to transactions with third parties.
88
NEW LOOK ANNUAL REPORT & ACCOUNTS 2014
New Look Retail Group Limited
Notes to the Group financial statements (continued)
5.
Segment information (continued)
The segment information provided to the Board for the reportable segments by brand and by geographic segment, are as follows:
For the financial periods
52 weeks ended
29 March 2014
53 weeks ended
30 March 2013
£m
£m
1,034.3
1,061.2
External revenue
New Look brand
– UK Retail*
– E-commerce*
149.8
91.4
– International
152.6
149.2
– Franchise
Total New Look brand
59.9
58.5
1,396.6
1,360.3
Mim brand
– Owned stores
160.8
154.0
Total Mim brand
160.8
154.0
1,557.4
1,514.3
(28.6)
(30.3)
1,528.8
1,484.0
Segmental gross transactional value
Adjustment to state concession income on a net basis for statutory reporting purposes
Total Group external revenue
* A reclassification of £2.7 million for sale returns between UK Retail and E-commerce has been included in the comparative.
For the financial periods
52 weeks ended
29 March 2014
53 weeks ended
30 March 2013
£m
£m
1,184.1
1,152.6
373.3
361.7
1,557.4
1,514.3
(28.6)
(30.3)
1,528.8
1,484.0
External revenue
UK
International
Segmental gross transactional value
Adjustment to state concession income on a net basis for statutory reporting purposes
Total Group external revenue
The revenue from external parties reported to the Board is measured in a manner consistent with that in the income statement except for the
gross up of store concessions sales.
89
For the financial periods
52 weeks ended
29 March 2014
53 weeks ended
30 March 2013
£m
£m
– UK Retail*
94.3
92.8
– E-commerce*
35.2
14.5
2.4
0.9
Underlying operating profit
New Look brand
– International
– Franchise
Total New Look brand
7.5
9.4
139.4
117.6
Mim brand
– Owned stores
(10.9)
(2.1)
Total Mim brand
(10.9)
(2.1)
Total Group underlying operating profit
128.5
115.5
For the financial periods
52 weeks ended
29 March 2014
53 weeks ended
30 March 2013
£m
£m
129.5
107.3
(1.0)
8.2
128.5
115.5
Underlying operating profit
UK
International
Total Group underlying operating profit
* A reclassification of £1.3 million for sale returns between UK Retail and E-commerce has been included in the comparative.
Underlying operating profit is defined in note 2.23 and is reconciled to operating profit on page 74.
For the financial periods
52 weeks ended
29 March 2014
53 weeks ended
30 March 2013
£m
£m
Capital expenditure
New Look brand
44.2
58.8
– E-commerce
– UK Retail
2.5
3.5
– International
7.5
2.0
– Franchise
Total New Look brand
—
—
54.2
64.3
4.3
2.1
Mim brand
– Owned stores
Total Mim brand
Total Group capital expenditure
4.3
2.1
58.5
66.4
90
NEW LOOK ANNUAL REPORT & ACCOUNTS 2014
New Look Retail Group Limited
Notes to the Group financial statements (continued)
5.
Segment information (continued)
For the financial periods
52 weeks ended
29 March 2014
53 weeks ended
30 March 2013
£m
£m
UK
46.7
62.3
International
11.8
4.1
58.5
66.4
Capital expenditure
Total Group capital expenditure
For the financial periods
52 weeks ended
29 March 2014
53 weeks ended
30 March 2013
£m
£m
Depreciation and amortisation
New Look brand
52.2
54.9
– E-commerce
– UK Retail
4.7
3.4
– International
6.3
8.1
– Franchise
Total New Look brand
—
—
63.2
66.4
6.1
7.1
Mim brand
– Owned stores
Total Mim brand
Total Group depreciation and amortisation
6.1
7.1
69.3
73.5
For the financial periods
52 weeks ended
29 March 2014
53 weeks ended
30 March 2013
£m
£m
56.9
58.3
Depreciation and amortisation
UK
International
12.4
15.2
Total Group depreciation and amortisation
69.3
73.5
Analyses of the Group’s external revenues (by customer location) and non-current assets (excluding investments, deferred tax assets and other financial
assets) by geographical location are detailed below:
External revenue
United Kingdom
Non-current assets
52 weeks ended
29 March 2014
53 weeks ended
30 March 2013
52 weeks ended
29 March 2014
53 weeks ended
30 March 2013
£m
£m
£m
£m
1,142.5
1,113.5
772.0
845.5
France
226.5
219.4
74.1
105.5
Rest of Europe
115.2
111.6
33.1
15.1
Middle East
35.3
31.0
—
—
9.3
8.5
0.8
—
1,528.8
1,484.0
880.0
966.1
Rest of World
91
6.Revenue
For the financial periods
52 weeks ended
29 March 2014
Sale of goods
53 weeks ended
30 March 2013
£m
£m
1,505.0
1,463.1
Rental income
1.8
2.0
Store card arrangement fee
2.8
2.9
Franchise royalty income
0.4
0.4
Concession income (net)
Revenue
18.8
15.6
1,528.8
1,484.0
Included within rental income is contingent rent of £0.5 million (2013: £0.6 million).
7.
Operating profit
For the financial periods
52 weeks ended
29 March 2014
53 weeks ended
30 March 2013
£m
£m
234.9
226.6
65.5
Group operating profit is stated after charging/(crediting):
Staff costs (note 8a)
Depreciation of property, plant and equipment
59.0
Impairment loss of property, plant and equipment
14.4
2.7
Amortisation of intangible assets
10.3
8.0
Impairment loss / (reversal) of intangible assets
40.7
(1.3)
Impairment reversal of investment in joint venture
(0.1)
—
Amortisation of lease incentives
Gain on disposal of property, plant and equipment
Loss / (gain) on disposal of intangible assets
(6.6)
(7.0)
(10.0)
(6.0)
0.5
(1.4)
178.5
180.3
Operating lease charges:
– Minimum lease payments
– Contingent rent payments
Net foreign exchange differences
Cost of inventories recognised as an expense through cost of sales
Write down of inventories to net realisable value through cost of sales
0.2
0.1
(1.9)
1.7
636.8
614.2
15.3
15.9
0.2
0.2
0.3
0.2
Auditors’ remuneration:
Fees payable to the company’s auditor for the audit of the Group and parent company
Fees payable to the company’s auditor and its associates for other services:
– The audit of the company’s subsidiaries pursuant to legislation
– Tax compliance services
0.1
0.1
– Tax advisory services
0.6
0.5
– Other assurance services
0.3
0.5
– All other services
0.8
0.4
Included in auditors’ remuneration are out of pocket expenses paid to Group auditors.
92
NEW LOOK ANNUAL REPORT & ACCOUNTS 2014
New Look Retail Group Limited
Notes to the Group financial statements (continued)
8a. Staff costs
For the financial periods
52 weeks ended
29 March 2014
53 weeks ended
30 March 2013
£m
£m
Wages and salaries
202.4
202.2
Social security costs
23.4
22.4
Other pension costs (note 35)
Share based payment expense/(credit) (note 31)
2.8
2.2
228.6
226.8
6.3
(0.2)
234.9
226.6
In addition to the above, costs relating to temporary and contract staff total £6.3 million (2013: £4.2 million).
The average monthly number of employees of the Group (including Directors) during the period was:
For the financial periods
Administration and distribution
Retailing
52 weeks ended
29 March 2014
53 weeks ended
30 March 2013
Number
Number
2,332
2,383
17,741
18,765
20,073
21,148
If the number of part-time hours were converted on the basis of a full working week, the equivalent average number of full-time employees
would be 10,693 (2013: 11,476).
Compensation for key management personnel
The compensation for key management personnel, including the Directors, was as follows:
For the financial periods
52 weeks ended
29 March 2014
53 weeks ended
30 March 2013
£m
£m
Short term employee benefits
5.1
2.5
Termination benefits
0.2
—
Post employment benefits
0.1
—
Share based payments
1.0
—
6.4
2.5
Retirement benefits are accruing to two members of key management (2013: two) at the end of the period. Directors’ remuneration is detailed
in note 8b on the following page.
93
8b. Directors’ remuneration
(a) Historical aggregate emoluments
The Directors’ emoluments table below includes aggregate emoluments of all Executive and Non-Executive Directors of New Look Retail Group
Limited who provided qualifying services during the financial periods ended 29 March 2014 and 30 March 2013.
For the financial periods
Aggregate emoluments in respect of qualifying services
Company contributions paid in respect of pension schemes
52 weeks ended
29 March 2014
53 weeks ended
30 March 2013
£m
£m
4.4
2.1
—
—
There have been no waivers of emoluments by any of the Directors in the reporting period. No (2013: none) Directors exercised share options, one
(2013: none) Director sold an interest in shares and no (2013: three) Directors were granted shares in the period. Retirement benefits are accruing to
no (2013: none) Directors at the end of the period.
(b) Directors’ details
Directors
A McGeorge, T Lane, A Miller, M Garland, A Kristiansen,T Singh, C Bamberger Bro and M Halusa were Directors as at 29 March 2014. F Andreottola
resigned on 18 December 2013 and O Pinya resigned on 18 February 2014. C Bamberger Bro was appointed on 18 December 2013 and M Halusa
was appointed on 18 February 2014.
In the financial period ended 29 March 2014, each of the following were Executive Directors: A McGeorge, T Singh, A Kristiansen and A Miller
(2013: A McGeorge, T Singh, A Kristiansen and A Miller).
During the financial period, A McGeorge and A Miller announced their intention to resign as Directors on 31 May 2014 and 11 April 2014 respectively.
As a representative of Permira, M Garland and C Bamberger Bro have an indirect economic interest in the shares of the Company held by the Permira
Funds. As representatives of Apax, T Lane and M Halusa have an indirect economic interest in the shares of the Company held by the Apax Funds.
During the financial period, a monitoring fee of £201,000 (2013: £197,000) was payable to Apax and a monitoring fee of £150,000 (2013: £150,000)
to Permira.
For details of transactions with the Directors, including payment-in-kind (PIK) interest, see note 36.
Highest paid Director
For the financial periods
Aggregate emoluments in respect of qualifying services
Company contributions paid in respect of pension schemes
52 weeks ended
29 March 2014
53 weeks ended
30 March 2013
£m
£m
1.6
0.7
—
—
94
NEW LOOK ANNUAL REPORT & ACCOUNTS 2014
New Look Retail Group Limited
Notes to the Group financial statements (continued)
9.
Finance income and expense
For the financial periods
52 weeks ended
29 March 2013
53 weeks ended
30 March 2013
£m
£m
Finance income
Interest on bank deposits
0.4
0.6
Exchange rate gain on revaluation of Euro bond
4.0
—
Exchange rate gain on revaluation of US dollar bond*
2.9
—
Exchange rate gain on revaluation of Euro cash
0.4
0.5
Gain on cancellation of PIK debt
—
9.1
7.7
10.2
Interest on bonds, bank loans and overdrafts
68.3
35.4
Interest on other loans
47.8
71.5
Total finance income
Finance expense
Premium on PIK prepayment
1.2
—
Exchange rate loss on revaluation of Euro loans
0.4
0.5
Amortisation of issue costs on loans
2.6
6.8
120.3
114.2
Finance expense before exceptional expenses
Exceptional items – finance expense
Refinancing costs
Total finance expense
3.2
2.4
123.5
116.6
* During the financial period, £10.9 million of losses resulting from the US dollar cross currency derivatives, accounted for as a cash flow hedge, were recycled from reserves into finance income in the
consolidated income statement and net against the £13.8 million gain on revaluation of the US dollar bond.
Gain on cancellation of PIK debt
In July 2012, as part of the renegotiation of Senior and Mezzanine debt maturities, the Group was provided with the ability to repay part of the PIK
debt. During the previous financial period, the Group achieved the required level of leverage to satisfy the covenant and bought back £47.1 million of
PIK debt for consideration of £38.0 million.
Premium on PIK prepayment
As permitted under the PIK facility agreement dated 14 May 2013, New Look Finance II Plc gave notice to debt investors on 20 February 2014 that
the Group intended to prepay an amount of the new PIK debt equal to a principal amount of £38.4 million plus accrued interest of £0.4 million and a
redemption premium of £1.2 million. The prepayment was settled on 24 March 2014.
Refinancing costs
In 2012, the Group incurred £6.8 million of costs in relation to renegotiating its Senior and Mezzanine loans which were capitalised against the debt
and released during the period. In February 2013, the Group began a number of investigative and preparatory steps in connection with a potential
debt refinancing. £2.4 million of costs were incurred in relation to these steps.
As a result of the Group refinancing during the current financial period, £18.0 million of costs incurred were capitalised into the value of the borrowings
and subsequently £2.6 million of these capitalised debt costs have been amortised and £3.2 million of costs were incurred.
95
10. Exceptional items
For the financial periods
52 weeks ended
29 March 2014
53 weeks ended
30 March 2013
£m
£m
Impairment loss
64.6
1.4
Gain on acquisition of subsidiary
(2.5)
—
Operating exceptional items
Exceptional bonus incentive
2.3
—
Restructuring operating base
0.2
4.3
0.9
0.7
Redevelopment of Mercery Road
Review of business financing
(9.1)
(6.0)
Franchise receivable impairment
1.4
4.3
Total operating exceptional items
Refinancing costs (note 9)
Total exceptional items
57.8
4.7
3.2
2.4
61.0
7.1
Impairment loss
An impairment charge has been recognised to write down tangible and intangible assets in stores to their recoverable amount as a result of a decline
in trading conditions for certain stores. The recoverable amount was calculated based on the value in use of the individual stores. The calculation of
value in use was most sensitive to the following assumptions:
• Forecast operating cash flows for the remaining period of the lease which were based on approved budgets and plans;
• The rate of growth used to extrapolate cash flows and the pre-tax discount rate are disclosed in note 14.
During the financial period, management also reviewed the value in use of the Mim business based on the latest 3 year forecast of future operating
cash flows. As a result, the carrying value of the Mim net assets held by the Group has been written down to their value in use. Details of the
assumptions used in these calculations are included in note 14.
During the financial period ended 24 March 2012, management reviewed its ability to recover the investment in its 50% interest in NLT Tekstil Sanayi
Ve Ticaret Limited Şirketi. The recoverable amount of the joint venture was calculated based on the present value of the discounted future cash flows
and a resulting impairment loss recorded in the income statement of £0.7 million. During the financial period ended 29 March 2014, £0.1 million of
previously impaired investment was written back.
Gain on acquisition of subsidiary
On 14 February 2014, the Group acquired two subsidiary companies from its Franchise Partner in Poland. The difference between the consideration
paid and the assets acquired and liabilities assumed on acquisition resulted in a gain on acquisition of £3.2 million. Legal costs incurred directly
relating to the acquisition of £0.4 million and an unwinding of the fair value adjustment on inventories of £0.3 million have also been included above in
the net gain on acquisition. Further details of the acquisition are included in note 16.
Exceptional bonus incentive
In a previous period, the Board of Directors approved a one-off incentive scheme related to the turnaround of the Group’s business performance for a
small number of Executive Directors. Under this scheme, two bonus payments become payable in the event that the Group’s EBITDA reaches a certain
threshold, as agreed by the Board. The Group incurred a charge of £2.3 million with respect to the first bonus payment under this scheme in the
financial period. Depending on the Group’s future EBITDA performance, the Group may incur additional charges in a future period.
Restructuring operating base
During the financial period ended 30 March 2013, the Group incurred £4.3 million in reviewing and restructuring its operating cost base to align
the Group’s strategies, structures and costs to the challenging macro-economic environment. This included £2.6 million which was incurred in
preparation for the termination and relocation of the Group’s E-commerce logistics operations which were previously outsourced before being
brought in house to the main distribution site at Lymedale. An additional £0.2 million was incurred during the financial period.
96
NEW LOOK ANNUAL REPORT & ACCOUNTS 2014
New Look Retail Group Limited
Notes to the Group financial statements (continued)
10. Exceptional items (continued)
Review of business financing/refinancing costs
During the financial period ended 29 March 2014, the Group undertook a debt refinancing. Total costs incurred were £22.1 million, of which
£18.0 million have been capitalised as debt issue costs, £3.2 million recognised as an exceptional finance expense (note 9) and £0.9 million as an
operational expense.
During the financial period ended 30 March 2013, the Group incurred total costs of £3.1 million as part of the preparatory work for the refinancing of
which £2.4 million were recognised as a finance expense (note 9).
Redevelopment of Mercery Road
During the financial periods ended 29 March 2014 and 30 March 2013, as part of the redevelopment of the Group’s land on its Mercery Road,
Weymouth site, a gain on disposal was recognised in relation to the sale of the land to Sainsburys. See note 13 for further information.
Franchise receivable impairment
During the financial period ended 30 March 2013, the outstanding receivable balance with the Russian franchise partner of £4.3 million was fully
impaired as it was no longer expected to be recoverable due to the on-going financial difficulties experienced by the partner. An additional receivable
balance of £1.4 million arising in the financial period ended 29 March 2014 was fully impaired due to the continuation of the partner’s financial difficulties.
11.Taxation
For the financial periods
52 weeks ended
29 March 2014
53 weeks ended
30 March 2013
£m
£m
1.5
8.1
Current tax:
UK corporation tax on losses/profits of the period
(0.2)
(0.2)
UK adjustment in respect of prior periods
Double tax relief
3.5
(2.8)
Overseas tax
0.8
0.5
Overseas adjustment in respect of prior periods
Total current tax
(0.1)
0.1
5.5
5.7
Deferred tax:
Origination and reversal of temporary differences
(4.2)
(1.7)
Impact of change in UK corporation tax rate
(5.5)
(3.5)
2.8
(0.8)
Total deferred tax
Adjustment in respect of prior period
(6.9)
(6.0)
Income tax credit
(1.4)
(0.3)
97
The tax on the Group’s loss before tax differs from the theoretical amount that would arise using the weighted average tax rate applicable to profits and
losses of the consolidated entities as follows:
For the financial periods
52 weeks ended
29 March 2014
53 weeks ended
30 March 2013
£m
£m
(Loss) / profit before taxation
(55.0)
3.1
Tax (credit) / charge on (loss)/profit at standard rate of 23% (2013: 24%)
(12.7)
0.7
4.2
2.0
14.3
1.5
Reasons affecting credit charge for the period:
Depreciation on non-qualifying assets
Expenses not deductible for tax purposes
Deferred tax liablity reversed following impairment
Foreign tax charged at a different rate than UK standard rate
Tax losses for which no deferred income tax asset was recognised
(10.6)
_
(0.3)
(0.9)
3.0
3.5
(5.5)
(3.5)
Adjustment to current tax charge in respect of prior periods
3.4
(2.8)
Adjustment to deferred tax charge in respect of prior periods
2.8
(0.8)
(1.4)
(0.3)
Re-measurement of deferred tax – change in the UK corporation tax rate
Income tax credit
The Finance Act 2013 was substantively enacted on 17 July 2013 and reduced the main rate of corporation tax to 21% with effect from 1 April 2014 and
20% from 1 April 2015. Closing deferred tax balances have therefore been valued at 20% (2013: 23%).
In addition to the amount credited/charged to the consolidated income statement, tax movements recognised directly in equity as shown in the
consolidated statements of comprehensive income and of changes in equity were as follows:
For the financial periods
52 weeks ended
29 March 2014
53 weeks ended
30 March 2013
£m
£m
Deferred tax:
Foreign exchange movements taken to translation reserve
0.3
(0.1)
Other temporary differences
6.6
(3.9)
Tax credit/(expense) on items recognised directly in equity
6.9
(4.0)
98
NEW LOOK ANNUAL REPORT & ACCOUNTS 2014
New Look Retail Group Limited
Notes to the Group financial statements (continued)
11. Taxation (continued)
Deferred income tax
Deferred income tax assets and liabilities are offset when there is a legally enforceable right to offset current tax assets against current tax liabilities and
when the deferred income taxes relate to the same tax authority.
As at
29 March 2014
30 March 2013
£m
£m
Deferred tax asset to be recovered within 12 months
13.9
17.3
Deferred tax asset to be recovered after more than 12 months
13.1
12.5
27.0
29.8
Deferred tax liability falling due within 12 months
—
—
(61.1)
(77.7)
(61.1)
(77.7)
(34.1)
(47.9)
Deferred tax liability falling due after more than 12 months
The movement in the period is as follows:
Accelerated
capital
allowances
At 24 March 2012
(Credited) / charged to income statement
Recognised directly in equity
Brand
Other
temporary
differences
Total
£m
£m
£m
£m
2.3
83.0
(35.4)
49.9
(4.1)
(5.6)
3.7
(6.0)
—
0.1
3.9
4.0
At 30 March 2013
(1.8)
77.5
(27.8)
47.9
(Credited) / charged to income statement
(2.4)
(18.8)
14.3
(6.9)
—
(0.3)
(6.6)
(6.9)
(4.2)
58.4
(20.1)
34.1
Recognised directly in equity
At 29 March 2014
There is a deferred tax asset in respect of capital losses of £1.9 million (2013: £2.1 million) that has not been recognised due to uncertainty as to
whether there will be sufficient taxable profits in the future against which the asset could be utilised.
PIK interest and onerous lease cost are the main items included in other temporary differences.
Deferred tax assets of £14.3 million (2013: £15.2 million) relating to losses in Mim, New Look France, New Look Belgium and New Look Holland have
not been recognised at a Group level as there is no certainty when these losses will be relieved.
No liability has been recognised in respect of temporary differences associated with investments in subsidiaries, branches and interests in the joint
venture, where the Group is in a position to control the timing of the reversal of the temporary differences and it is probable that such differences will
not reverse in the foreseeable future. The aggregate amount of temporary differences associated with these investments, for which a deferred tax
liability has not been recognised, is £8.9 million (2013: £6.7 million).
12.Dividends
No dividends have been proposed, declared or paid during the periods ended 29 March 2014 or 30 March 2013.
99
13. Property, plant and equipment
Freehold land and
buildings
Fixtures and
equipment
Total
£m
£m
£m
15.8
532.5
548.3
Cost
At 24 March 2012
—
1.2
1.2
Additions
Exchange movement
9.1
41.5
50.6
Disposals
(6.2)
(23.2)
(29.4)
At 30 March 2013
18.7
552.0
570.7
—
(3.2)
(3.2)
(1.3)
44.7
43.4
—
3.2
3.2
Exchange movement
Additions*
Acquisitions (note 16)
Disposals
(6.4)
(19.0)
(25.4)
At 29 March 2014
11.0
577.7
588.7
Accumulated depreciation
At 24 March 2012
(3.4)
(341.5)
(344.9)
Exchange movement
—
(1.5)
(1.5)
Depreciation charge
(0.2)
(65.3)
(65.5)
Impairment reversal / (loss)
0.4
(3.1)
(2.7)
Disposals
3.0
23.1
26.1
At 30 March 2013
(0.2)
(388.3)
(388.5)
Exchange movement
—
2.8
2.8
Depreciation charge
(0.2)
(58.8)
(59.0)
Impairment loss
—
(14.4)
(14.4)
Reclassification**
—
1.7
1.7
Disposals
—
18.3
18.3
(0.4)
(438.7)
(439.1)
29 March 2014
10.6
139.0
149.6
30 March 2013
18.5
163.7
182.2
At 29 March 2014
Net Book Value
* Freehold land and buildings includes a release of £2.1 million capital accrual
** Reclassification of depreciation/amortisation to software within intangible assets
Freehold land of £1.2 million (2013: £6.3 million) is not depreciated.
Included within fixtures and equipment are assets in the course of construction of £7.0 million (2013: £9.3 million), which are not depreciated.
At 29 March 2014, the Group has entered into contractual commitments for the acquisition of property, plant and equipment amounting to £10.3
million (2013: £3.3 million).
An impairment charge has been recognised to write down property, plant and equipment in stores and management also have reviewed the net
assets of the Mim business which resulted in a further impairment loss. See note 14 for further details.
On 27 April 2011, the Weymouth and Portland Borough Council made the decision to support New Look’s outline planning application for its
Weymouth Gateway regeneration plans to redevelop the Group’s land on its Mercery Road, Weymouth site. The plans included a new office building
for New Look, a Sainsbury’s supermarket, a hotel, family restaurant, and additional commercial units.
During the financial period ended 30 March 2013, the Group recognised a gain on the disposal of land following completion of clearance works.
During the financial period ended 29 March 2014, the Group recognised a further gain on disposal of land in relation to the site sold to Sainsbury’s
(see note 10).
100
NEW LOOK ANNUAL REPORT & ACCOUNTS 2014
New Look Retail Group Limited
Notes to the Group financial statements (continued)
14. Intangible assets
Goodwill
Brands
Recoverable
leasehold property
premiums
£m
£m
£m
£m
£m
365.3
317.9
29.7
52.8
765.7
Exchange movement
—
0.3
0.3
0.1
0.7
Additions
—
0.2
0.3
15.3
15.8
Software
licences
Total
Cost
At 24 March 2012
Disposals
—
—
(2.3)
(2.6)
(4.9)
365.3
318.4
28.0
65.6
777.3
Exchange movement
—
(0.8)
(0.6)
—
(1.4)
Additions
—
1.3
0.7
9.8
11.8
Acquisitions (note 16)
—
—
—
0.1
0.1
—
—
(0.7)
(2.0)
(2.7)
365.3
318.9
27.4
73.5
785.1
At 30 March 2013
Disposals
At 29 March 2014
Accumulated amortisation and impairment
At 24 March 2012
—
—
(4.9)
(24.6)
(29.5)
Amortisation charge
—
—
—
(8.0)
(8.0)
Impairment reversal/(loss)
—
—
1.4
(0.1)
1.3
Disposals
—
—
1.0
2.6
3.6
At 30 March 2013
—
—
(2.5)
(30.1)
(32.6)
Exchange movement
—
0.7
0.3
—
1.0
Amortisation charge
—
—
(0.3)
(10.0)
(10.3)
Impairment loss
—
(38.2)
(2.0)
(0.5)
(40.7)
Reclassification*
—
—
—
(1.7)
(1.7)
Disposals
—
—
0.3
1.9
2.2
At 29 March 2014
—
(37.5)
(4.2)
(40.4)
(82.1)
At 29 March 2014
365.3
281.4
23.2
33.1
703.0
At 30 March 2013
365.3
318.4
25.5
35.5
744.7
Net book value
* Reclassification of depreciation/amortisation from fixtures and equipment within property, plant and equipment
As at 29 March 2014, the Group had entered into contractual commitments for the acquisition of software amounting to £0.6 million (2013: £2.4 million).
The lowest CGUs within the Group are individual stores, however for the purpose of the Goodwill and Brand intangible impairment review; the lowest
group of CGUs are the country sub-groups of the Group’s brands, which is in line with internal management reporting. Brands have been allocated
between these groups. Goodwill arising from business combinations is all allocated to the UK.
Brands include the New Look and Mim brands acquired through business combinations. Fair value was established by independent valuers and was
based on the relief from royalty method. The Group is committed to the continuing development of the New Look brand but conclude that brands have
indefinite useful lives.
Certain premiums paid on acquisition of short leasehold property in mainland Europe are expected to be recoverable from subsequent tenants.
Recoverable leasehold property premiums are pledged as security for the related lease rental liabilities. To support the recoverable amount, value in use
calculations were performed at a store level and in some cases independent third party valuations were obtained on the premiums paid resulting in an
impairment loss of £1.0 million (2013: impairment reversal of £1.4 million).
The value in use of relevant groups of CGUs for impairment testing purposes have been determined based on calculations using cash flow projections
from the financial plans approved by the Board covering a three year period from the balance sheet date.
101
The calculation of value in use is most sensitive to the following assumptions:
•
The forecast operating cash flows for the next three years are based on approved budgets and plans. These budgets and plans are based on past
performance and expectations for the market development of the relevant groups of CGUs;
•
An estimate of the long-term effective tax rate for the CGU; and
•
The rate of growth used to extrapolate cash flows beyond the three year plan period is 2.0% per annum (2013: 2.0%). This growth rate is based
on published estimates of the long-term growth in Gross Domestic Product in the respective CGUs and inflation.
For the New Look brand, the resulting cash flows were discounted using a pre-tax discount rate of 10.1% (2013: 11.1%). For the Mim brand, the resulting cash
flows were discounted using a pre-tax discount rate of 7.7% (2013: 9.5%). These rates reflect management’s estimate of the cost of capital for the business.
Management does not believe that any reasonable change in any of the above key assumptions would cause the carrying value of goodwill or the New Look
brand to exceed their recoverable amounts.
During the period, management reviewed the carrying value of Mim’s net assets which are recognised by the Group based on the value in use as described
above. The resulting value in use did not support the carrying value of the net assets and therefore an impairment loss of £14.9 million on property, plant and
equipment; £39.7 million on intangible assets and £9.5 million on trade and other receivables has been recognised.
Sensitivity to changes in assumptions
In analysing the impairment of Mim’s net assets, if the pre-tax discount rate had been 1% higher or 1% lower, the Group’s operating profit would have
been £0.5 million lower or £0.7 million higher. If the terminal growth rate had been 1% higher or 1% lower, the Group’s operating profit would have been
£0.7 million higher or £0.5 million lower.
As at 30 March 2013, the recoverable amount exceeded the carrying amount by £73.8 million.
15. Investment in joint venture
The Group has a 50% interest in NLT Tekstil Sanayi Ve Ticaret Limited Şirketi, a jointly controlled entity incorporated in Turkey, which sources product on behalf of
the Group.
The Group’s share of the assets, liabilities, revenue and expenses of the jointly controlled entity are as follows:
As at
Share of the joint venture’s balance sheet
Non-current assets
Current assets
Current liabilities
Non-current liabilities
Share of net (liabilities) / assets
Loan to joint venture
Impairment loss
Total investment in joint venture
Details of the reversal of the impairment loss of £0.1 million (2013: £nil) are included in note 10.
29 March 2014
30 March 2013
£m
£m
—
—
1.2
1.2
(1.4)
(1.0)
—
—
(0.2)
0.2
0.8
0.8
(0.6)
(0.7)
—
0.3
102
NEW LOOK ANNUAL REPORT & ACCOUNTS 2014
New Look Retail Group Limited
Notes to the Group financial statements (continued)
15. Investment in joint venture (continued)
For the financial periods
Share of the joint venture’s result
Revenue
52 weeks ended
29 March 2014
53 weeks ended
30 March 2013
£m
£m
4.5
5.2
Cost of sales
(4.1)
(4.6)
Administrative expenses
(0.8)
(0.9)
Loss before taxation
(0.4)
(0.3)
—
—
(0.4)
(0.3)
Taxation
Loss for the financial period
The share capital of the joint venture is 3,040,000 YTLs (being equivalent of £1,272,020 at a conversion rate of 2.39 YTLs to each Pound Sterling)
divided into 121,600 shares of 25 YTLs each. New Look Retailers Limited and Global Tekstil Danismanlik Sanayi Ve Ticaret Limited Şirketi each own
60,800 shares in the company.
There is no recourse to Group companies in respect of the borrowings of the joint venture and there are no commitments or contingent liabilities at the
year end.
16. Business combinations
On 14 February 2014, New Look Overseas Limited, a subsidiary of the Group, acquired 100% of the share capital of Cenzora Enterprises Limited,
the Cypriot holding company of Polish company Fashion Look Sp. z o.o. from its former Franchise partner Empik Media & Fashion S.A. of Poland for
provisional consideration of £0.3 million subject to final agreement of the purchase price in accordance with the agreed terms of the executed share
purchase agreement.
As a result of the acquisition, the Group will continue to trade under the New Look brand and expand its presence in Poland.
The net exceptional gain arising from the acquisition of £2.5 million (note 10) is attributable to the indebtedness owing to the Group prior to acquisition.
The following table summarises the consideration paid for the companies, the provisional fair value of the assets acquired and liabilities assumed at the
acquisition date:
Provisional fair value as at
14 February 2014
£m
Consideration:
Cash
0.3
Total consideration transferred
0.3
Recognised amounts of identifiable assets acquired and liabilities assumed:
Cash and cash equivalents
0.2
Property, plant & equipment (note 13)
3.2
Intangible assets (note 14)
0.1
Inventories
1.9
Trade and other receivables
Trade and other payables
—
(2.4)
Net deferred tax asset
0.5
Total identifiable net assets
3.5
Gain on acquisition
Total
(3.2)
0.3
103
Legal costs incurred relating directly to the acquisition of £0.4 million have been included in the calculation of the exceptional gain on acquisition of
foreign subsidiary in note 10.
Inventories have been fair valued at the recommended retail price to the final customer in Poland and the difference between cost and the fair value will
unwind through exceptional items as the inventories are sold. During the financial period, £0.3 million of the fair value adjustment had been released.
The revenue included in the Group’s income statement since 14 February 2014 contributed by Fashion Look Sp z o.o. was £0.7 million and an
operating loss of £0.1 million.
Had Cenzora Enterprises Limited and Fashion Look Sp. z o.o. been consolidated from the beginning of the financial period, the Group’s income
statement would include revenue of £7.4 million and operating losses of £1.3 million.
17. Available for sale financial assets
As at
Unlisted investments available for sale
29 March 2014
30 March 2013
£m
£m
0.3
0.3
The investments included above are investments in unlisted equity securities which are carried at cost being fair value at inception. The investments
continue to be carried at cost since they do not have a quoted price in an active market nor a fair value which can be reliably measured. The
investments have no maturity or coupon rate and are denominated in Euros.
There were no disposals or impairment provisions on available for sale financial assets in any of the periods.
18.Inventories
As at
Raw materials and work in progress
Finished goods
29 March 2014
30 March 2013
£m
£m
1.8
1.6
136.3
142.5
138.1
144.1
Inventories with a value of £2.3 million (2013: £3.2 million) are carried at fair value less costs to sell, this being lower than cost. Cost of inventories
recognised as an expense and any write downs of inventory are disclosed in note 7.
104
NEW LOOK ANNUAL REPORT & ACCOUNTS 2014
New Look Retail Group Limited
Notes to the Group financial statements (continued)
19. Trade and other receivables
As at
29 March 2014
30 March 2013
£m
£m
16.9
14.6
Current
Trade receivables
Other receivables
Prepayments
Accrued income
8.1
11.0
36 .4
40.4
3.2
1.8
64.6
67.8
Non-current
Other receivables
Prepayments
5.0
9.7
22.4
29.5
27.4
39.2
The carrying amounts of the Group’s trade and other receivables are denominated in the following currencies:
As at
29 March 2014
30 March 2013
£m
£m
Sterling
73.0
78.0
Euro
14.6
26.8
1.2
0.7
Roubles
1.2
1.5
Renminbi
2.0
—
92.0
107.0
US dollar
Included within the trade and other receivables balance is a bad debt provision for £6.5 million (2013: £5.9 million). There was a bad debt charge in
the income statement of £1.4 million (2013: £4.5 million).
An impairment loss of £9.5 million has been recognised to write down prepayments and other receivables of Mim resulting from the impairment
review of Mim’s net assets. See note 14 for more details.
As at 29 March 2014, trade and other receivables of £26.9 million (2013: £33.0 million) were fully performing.
As at 29 March 2014, trade and other receivables of £3.1 million (2013: £2.2 million) were past due but not classed as impaired.
The ageing analysis of these is as follows:
As at
29 March 2014
30 March 2013
£m
£m
Up to 2 months
0.9
0.1
2 to 6 months
2.2
2.1
3.1
2.2
As at 29 March 2014, trade and other receivables of £6.5 million (2013: £6.0 million) were impaired and £6.5 million (2013: £5.9 million) were
provided for. The ageing of these receivables is as follows:
As at
29 March 2014
30 March 2013
£m
£m
Up to 2 months
2.0
1.7
2 to 6 months
4.5
4.3
6.5
6.0
105
Movements on the Group provision for impairment of trade receivables are as follows:
As at
29 March 2014
30 March 2013
£m
£m
At start of period
5.9
3.6
Provisions for receivables impairment
1.4
4.5
(0.8)
(2.2)
6.5
5.9
Receivables written off during the period
The creation and release of the provision for impaired receivables has been included in administrative expenses. Amounts charged to the bad debt
provisions are generally written off when there is no expectation of recovering additional cash. Subsequent recoveries of amounts previously written
off are credited against administrative expenses. The other classes within trade and other receivables do not contain impaired assets.
The Group maximum exposure to credit risk at the reporting date is the carrying value of each class of receivables mentioned above.
20. Derivative financial instrument assets
As at
29 March 2014
30 March 2013
£m
£m
Foreign currency contracts
0.1
17.5
Embedded foreign exchange derivatives
0.2
0.1
0.3
17.6
Current assets
Foreign currency contracts comprise forward contracts and options which are used to hedge exchange risk arising from the Group’s overseas
purchases. The instruments purchased are denominated in US dollars.
Foreign currency contracts are referred to within note 26.
Embedded foreign exchange derivatives arise within outstanding purchase orders, which are in currencies other than the functional currencies of the
contracting parties.
21. Cash and cash equivalents
As at
29 March 2014
30 March 2013
£m
£m
Cash at bank and in hand
45.8
43.5
Short-term deposits
63.7
67.9
Blocked cash
1.6
2.2
111.1
113.6
Cash at bank earns interest at floating rates based on daily bank deposit rates. Short-term deposits are made for varying periods between one day and
three months depending on the cash requirements of the Group, and earn interest at market short-term deposit rates. Blocked cash relates to amounts
held as guarantees over leases in mainland Europe.
106
NEW LOOK ANNUAL REPORT & ACCOUNTS 2014
New Look Retail Group Limited
Notes to the Group financial statements (continued)
22. Trade and other payables
As at
29 March 2014
30 March 2013
£m
£m
100.6
105.3
13.4
11.5
1.3
2.5
89.8
Current
Trade payables
Other taxation and social security
Other payables
Accruals
90.0
Interest accrual
21.9
0.4
Deferred income
26.7
36.7
Liability for cash settled share based payments
1.5
—
255.4
246.2
Non-current
Liability for cash settled share based payments
3.7
0.7
Other taxation and social security
0.1
0.3
Other payables
Deferred income
2.6
2.4
80.1
88.0
86.5
91.4
Trade payables, other payables and accruals are non-interest bearing. Trade payables are normally settled on either 60 or 75 day terms. Included in
accruals is £50.4 million (2013: £41.5 million) relating to inventory.
23. Financial liabilities
As at
29 March 2014
30 March 2013
£m
£m
—
59.5
—
59.5
—
408.6
Current
Bank loans
Non-current
Bank loans
Bonds
779.6
—
PIK debt
377.3
741.5
1,156.9
1,150.1
Further disclosure in respect of loans is provided in note 28.
24. Derivative financial instrument liabilities
As at
29 March 2014
30 March 2013
£m
£m
16.3
0.2
—
2.4
0.9
—
Current liabilities
Foreign currency contracts
Interest rate swaps
Currency swaps
Embedded foreign exchange derivatives
—
0.8
17.2
3.4
Non-current liabilities
Currency swaps
Interest rate swaps
11.8
—
—
0.8
11.8
0.8
107
Foreign currency contracts comprise forward contracts and options which are used to hedge exchange risk arising from the Group’s overseas
purchases. The instruments purchased are denominated in US dollars.
The interest rate swap agreements, currency swap agreements and foreign currency contracts are referred to within note 26.
Embedded foreign exchange derivatives arise within outstanding purchase orders, which are in currencies other than the functional currencies of the
contracting parties.
25. Financial instruments
Fair values
The carrying values of each category of the Group’s financial assets/liabilities in the Group’s balance sheet, excluding short-term receivables and
payables, are as follows:
As at
29 March 2014
30 March 2013
Carrying amount
Carrying amount
£m
£m
111.1
113.6
Financial assets
Cash and short term deposits
Available for sale financial assets
0.3
0.3
Foreign currency contracts
0.1
17.5
Embedded foreign exchange derivatives
0.2
0.1
—
468.1
Financial liabilities
Bank loans
Bonds
779.6
—
PIK debt
377.3
741.5
Foreign currency contracts
16.3
0.2
Currency swaps
12.7
—
Interest rate swaps
—
3.2
Embedded foreign exchange derivatives
—
0.8
Using market prices, as at the balance sheet date, the fair value of the PIK debt was approximately £18.5 million higher (2013: £74.2 million lower)
than the carrying value.
The Directors consider that the carrying amounts of all other financial instruments recorded in these financial statements is equal to or approximate to
their fair value.
The fair values of derivatives have been calculated by discounting the expected future cash flows at prevailing interest rates and are based on market
prices at the balance sheet date.
The total notional amount of outstanding foreign currency and interest rate contracts to which the Group was committed at the balance sheet date is as follows:
As at
29 March 2014
Notional amount of outstanding foreign currency contracts
Notional amount of outstanding currency swaps
Notional amount of outstanding interest rate swaps
30 March 2013
£m
£m
357.0
350.9
161.1
—
144.6
275.0
The foreign currency contracts have expiry terms of between 1 and 14 months (2013: 1 and 12 months). The interest rate swap contracts have expiry
terms of between 3 and 15 months (2013: 1 and 20 months) and the interest rate swap contracts have been converted from the Euro notional amounts
using the closing Euro rate of 1.210. The currency swap contracts have expiry terms of between 2 and 50 months and have Sterling notional amounts
based on a swap contract US dollar rate of 1.552.
108
NEW LOOK ANNUAL REPORT & ACCOUNTS 2014
New Look Retail Group Limited
Notes to the Group financial statements (continued)
25. Financial instruments (continued)
Category
The accounting policies for financial instruments have been applied to the line items below:
Assets per balance sheet
Loans and
receivables
Assets at fair value
through income
statement
Derivatives
used for
hedging
Available
for sale
Total
£m
£m
£m
£m
£m
At 29 March 2014
Available for sale financial assets
—
—
—
0.3
0.3
Derivative financial instruments
—
0.2
0.1
—
0.3
Trade and other receivables (excluding prepayments)
33.2
—
—
—
33.2
Cash and short term deposits
111.1
—
—
—
111.1
144.3
0.2
0.1
0.3
144.9
Liabilities at fair
value through
income statement
Derivatives
used for
hedging
Other financial
liabilities at
amortised cost
Total
£m
£m
£m
£m
—
—
1,156.9
1,156.9
1.2
27.8
—
29.0
Liabilities per balance sheet
At 29 March 2014
Borrowings
Derivative financial instruments
Trade and other payables (excluding deferred income)
Assets per balance sheet
—
—
235.1
235.1
1.2
27.8
1,392.0
1,421.0
Loans and
receivables
Assets at fair value
through income
statement
Derivatives used
for hedging
Available
for sale
Total
£m
£m
£m
£m
£m
—
—
—
0.3
0.3
17.6
At 30 March 2013
Available for sale financial assets
Derivative financial instruments
Trade and other receivables (excluding prepayments)
Cash and short term deposits
—
0.1
17.5
—
37.1
—
—
—
37.1
113.6
—
—
—
113.6
150.7
0.1
17.5
0.3
168.6
109
Liabilities per balance sheet
Liabilities at fair
value through
income statement
Derivatives
used for
hedging
Other financial
liabilities at
amortised cost
Total
£m
£m
£m
£m
—
—
1,209.6
1,209.6
0.8
3.4
—
4.2
—
—
212.9
212.9
0.8
3.4
1,422.5
1,426.7
At 30 March 2013
Borrowings
Derivative financial instruments
Trade and other payables (excluding deferred income)
The following table presents the Group’s assets and liabilities that are measured at fair value at 29 March 2014:
Assets
Level 1
Level 2
Level 3
Total
£m
£m
£m
£m
Foreign currency contracts
—
0.1
—
0.1
Embedded foreign exchange derivatives
—
0.2
—
0.2
Total assets
—
0.3
—
0.3
Foreign currency contracts
—
16.3
—
16.3
Currency swaps
—
12.7
—
12.7
Total liabilities
—
29.0
—
29.0
Level 2
Level 3
Total
Liabilities
The following table presents the Group’s assets and liabilities that are measured at fair value at 30 March 2013:
Level 1
£m
£m
£m
£m
Foreign currency contracts
—
17.5
—
17.5
Interest rate swaps
—
—
—
—
Assets
Embedded foreign exchange derivatives
—
0.1
—
0.1
Total assets
—
17.6
—
17.6
Liabilities
Foreign currency contracts
—
0.2
—
0.2
Interest rate swaps
—
3.2
—
3.2
Embedded foreign exchange derivatives
—
0.8
—
0.8
Total liabilities
—
4.2
—
4.2
The fair value of financial instruments traded in active markets is based on quoted market prices at the balance sheet date. A market is regarded as
active if quoted prices are readily available from an exchange, dealer, broker, industry group, pricing service, or regulatory agency, and those prices
represent actual and regularly occurring market transactions on an arm’s length basis. The quoted market price used for financial assets held by the
Group is the current bid price. These instruments are included in level 1.
The fair value of financial instruments that are not traded in an active market (for example, over-the-counter derivatives) is determined by using valuation
techniques. These valuation techniques maximise the use of observable market data where it is available and rely as little as possible on entity specific
estimates. If all significant inputs required to fair value an instrument are observable, the instrument is included in level 2.
If one or more of the significant inputs is not based on observable market data, the instrument is included in level 3.
The fair value of interest rate swaps is calculated as the present value of the estimated future cash flows based on observable yield curves. The fair value
of forward foreign exchange contracts is determined using forward exchange rates at the balance sheet date, with the resulting value discounted
back to present value. The fair value of currency swaps is calculated as the present value of the future cash flows based on observable yield curves and
forward exchange rates at the balance sheet date.
110
NEW LOOK ANNUAL REPORT & ACCOUNTS 2014
New Look Retail Group Limited
Notes to the Group financial statements (continued)
25. Financial instruments (continued)
Credit quality
The credit quality of financial assets can be assessed by reference to external credit ratings (if available) or to historical information about
counterparty default rates.
As at
29 March 2014
30 March 2013
£m
£m
1.0
2.3
Trade Receivables
Counterparties without external credit rating:
Group 1
Group 2
0.6
0.3
Group 3
15.3
12.0
Total trade receivables
16.9
14.6
Group 1 – new customers (less than 6 months)
Group 2 – existing customers (more than 6 months) with no defaults in the past
Group 3 – existing customers (more than 6 months) with some defaults in the past
The Group limits its exposure to financial institutions by setting credit limits based on their credit ratings and generally only with counterparties with
a Fitch’s credit rating of at least ‘A’. Group treasury monitors counterparty credit ratings closely, adjusting limits and balances immediately following
counterparty downgrades. At 29 March 2014, the Group had £106.1 million of cash and cash equivalents (2013: £108.5 million) held with institutions
rated ‘A’ or above, £3.9 million (2013: £3.4 million) held with institutions rated ‘A-’ and £1.1 million (2013: £1.7 million) held with institutions rated
‘BBB’, with a combined credit limit of £620.0 million (2013: £540.0 million).
The Group limits its exposure with its counterparties to derivative financial instruments by engaging with counterparties with a Fitch credit rating of ‘A’
or above. At 29 March 2014, the Group had derivative financial assets of £0.1 million (2013: £17.5 million) with counterparties rated ‘A’ or above.
Maturity
The table below analyses the Group’s financial liabilities and net-settled derivative financial liabilities into relevant maturity groupings based on the
remaining period at the balance sheet date to the contractual maturity date. The amounts disclosed in the table are the contractual undiscounted cash
flows. Balances due within 12 months equal their carrying balances as the impact of discounting is not significant.
At 29 March 2014
Borrowings
Trade and other payables (excluding deferred income)
At 30 March 2013
Borrowings
Derivative financial instruments
Trade and other payables (excluding deferred income)
<1 year
1-2 years
2-5 years
5+ years
£m
£m
£m
£m
—
—
1,156.9
—
228.7
2.7
3.7
—
<1 year
1-2 years
2-5 years
5+ years
£m
£m
£m
£m
59.5
31.9
1,118.2
—
2.4
0.8
—
—
209.5
3.4
—
—
111
The table below analyses the Group’s derivative financial instruments which will be settled on a gross basis into relevant maturity groupings based on
the remaining period at the balance sheet date to the contractual maturity date. The amounts disclosed in the table are the contractual undiscounted
cash flows. Balances due within 12 months equal their carrying balances as the impact of discounting is not significant.
<1 year
1-2 years
2-5 years
5+ years
£m
£m
£m
£m
Outflow
361.7
15.1
—
—
Inflow
346.7
15.1
—
—
At 29 March 2014
Forward foreign exchange contracts – cash flow hedges
Currency swaps – cash flow hedges
Outflow
14.0
14.0
196.2
—
Inflow
12.6
12.6
183.7
—
<1 year
1-2 years
2-5 years
5+ years
£m
£m
£m
£m
Outflow
333.6
0.6
—
—
Inflow
350.4
0.7
—
—
At 30 March 2013
Forward foreign exchange contracts – cash flow hedges
Embedded foreign exchange derivatives
At 29 March 2014, the Group had embedded foreign exchange derivatives comprising outstanding purchase orders which are in currencies other
than the functional currencies of the contracting parties. Exceptions to this are where a non-functional currency is commonly used in the country of a
contracting party. The fair values of the embedded foreign exchange derivatives under IAS 39 are as follows:
As at
Fair value of embedded foreign exchange derivatives
29 March 2014
30 March 2013
£m
£m
0.2
(0.7)
26. Hedging activities
Foreign currency contracts
The Group uses derivatives in order to manage foreign currency exchange risk arising on expected future purchases of overseas sourced products.
These derivatives comprise forward currency contracts and currency options, the terms of which have been negotiated to match the terms of the
expected purchases.
The fair values of derivatives are as follows:
As at
Fair value of hedging instruments, qualifying for hedge accounting
Fair value of hedging instruments, not qualifying for hedge accounting
29 March 2014
30 March 2013
£m
£m
(15.0)
17.3
(1.2)
—
(16.2)
17.3
112
NEW LOOK ANNUAL REPORT & ACCOUNTS 2014
New Look Retail Group Limited
Notes to the Group financial statements (continued)
26. Hedging activities (continued)
Interest rate swaps
At 29 March 2014, the Group had entered into interest rate swap agreements of £144.6 million (2013: £275.0 million) as partial cash flow hedges of
the interest rate risk associated with the drawn down loans of the Group of £144.6 million (2013: £1,209.6 million). The Group pays fixed rates on the
swap agreements of between 0.236% to 0.305% (2013: 0.615% to 2.2475%). The interest rate swap expiry dates are between June 2014 and June
2015 (2013: June 2014 and December 2014).
The fair values of the interest rate swaps are as follows:
As at
29 March 2014
30 March 2013
£m
£m
Fair value of interest rate swaps, qualifying for hedge accounting
—
(3.2)
Fair value of interest swaps, not qualifying for hedge accounting
—
—
—
(3.2)
Currency swaps
At 29 March 2014, the Group had entered into currency swap agreements of £161.1 million (2013: £nil) as cash flow hedges of the currency exchange
risk associated with the Group’s US dollar fixed rate notes of £161.1 million (2013: £nil). The Group pays fixed rates on the swap agreements of
between 8.668% to 8.768% and the US dollar swap rate of 1.552. The currency swap expiry dates are May 2018. The fair values of the currency swaps
are as follows:
As at
29 March 2014
30 March 2013
Fair value of currency swaps, qualifying for hedge accounting
Fair value of currency swaps, not qualifying for hedge accounting
£m
£m
(12.7)
—
—
—
(12.7)
—
Movement in fair values
Currency
swaps
Foreign exchange
contracts
Interest rate
swaps
Embedded
derivatives
Total
£m
£m
£m
£m
£m
Fair value at 24 March 2012
—
4.4
(6.1)
0.5
(1.2)
Fair value loss through income statement
—
—
—
(1.2)
(1.2)
Fair value gain to reserves
—
12.9
2.9
—
15.8
—
17.3
(3.2)
(0.7)
13.4
(11.1)
(3.9)
—
0.9
(14.1)
Fair value at 30 March 2013
Fair value (loss) / gain through income statement - operating
Fair value (loss) / gain through income statement - finance
Fair value (loss) / gain to reserves
Fair value at 29 March 2014
0.2
—
—
—
0.2
(1.8)
(29.6)
3.2
—
(28.2)
(12.7)
(16.2)
—
0.2
(28.7)
The net fair value loss (2013: gain) to reserves comprises a net £12.6 million loss (2013: net £18.8 million gain) recognised in equity during the period
offset by the recycling out of equity of a £15.6 million prior period gain on final settlement of contracts taken out in prior periods (2013: £3.0 million
gain) included in operating loss during the financial period. The income statement includes an operating charge of £3.0 million relating to the
marking to market of financial instruments not realised in the period and £0.2 million of amortisation of the difference between the spot and forward
rate relating to the final exchange on cross currency swaps. The income statement includes £10.9 million of losses recognised within finance income
resulting from the US dollar cross currency derivatives, accounted for as a cash flow hedge, recycled from reserves. The £3.9 million loss through the
income statement relating to foreign exchange contracts includes £1.2 million relating to options not qualifying for hedge accounting and £2.7 million
relating to maturing forward contracts during the period.
The ineffective portion recognised in the income statement that arises from cash flow hedges amounts to £nil (2013: £nil).
The embedded derivatives are referred to within note 25.
113
27. Analysis of net debt
Cash and cash equivalents
Bank loans
Bonds
PIK debt
Total net debt
30 March
2013
Cashflow
Non-cash
changes
29 March
2014
£m
£m
£m
£m
113.6
(1.2)
(1.3)
111.1
(468.1)
469.1
(1.0)
—
(779.6)
—
(789.9)
10.3
(741.5)
411.6
(47.4)
(377.3)
(1,096.0)
89.6
(39.4)
(1,045.8)
Included in bank loans non-cash changes are £0.6 million deferred interest rolled over to the carrying value of the Mezzanine debt and £0.4 million
loss on revaluation of Euro loan. Included in PIK debt non-cash changes is £47.4 million deferred interest rolled over to the carrying value of the PIK
loan and cash changes includes £0.4 million of PIK interest paid as part of prepayment (note 9). Included in bonds non-cash changes are; £2.6 million
amortisation of capitalised fees, £4.9 million of foreign exchange losses on forward contracts that were taken out to fix the Sterling cash receipts on the
Euro and US dollar bonds, reduced by £17.8 million gain on revaluation of bonds.
24 March
2012
Cash and cash equivalents
Bank loans
PIK debt
Total net debt
Cashflow
Non-cash
changes
30 March
2013
£m
£m
£m
£m
212.3
(99.7)
1.0
113.6
(585.8)
123.0
(5.3)
(468.1)
(717.1)
38.0
(62.4)
(741.5)
(1,090.6)
61.3
(66.7)
(1,096.0)
Included in non-cash changes are £4.8 million deferred interest rolled over to the carrying value of the Mezzanine debt, £71.5 million deferred interest
rolled over to the carrying value of the PIK loan, £9.1 million gain on buyback of PIK debt below par and £0.5 million loss on Euro loan revaluations.
28. Interest rate risk and liquidity risk
On 4 July 2012, Trinitybrook Limited, a fully owned subsidiary in the Group executed an agreement with the Facility Agents HSBC and Unicredit Bank
AG, London Branch which was supplemental to and amended the Senior Facility Agreement and the Mezzanine Facilities Agreement originally dated
24 May 2005 and subsequent amendments.
The executed agreement amended the Senior debt profile, with 5 new tranches (B4, B5, C4, C5 and D2) added to the existing 6 tranches and a
reallocation of existing borrowings after a mandatory prepayment on the transaction date of £62.0 million.
The costs incurred by the Group to negotiate and execute the amend and extend agreements were £6.8 million (note 9).
Interest continued to be payable on the outstanding Sterling denominated tranche balances at the GBP Libor rate + cash margin + minimum liquid
assets (MLA) rate. On Euro denominated tranches, interest was payable at Euribor + cash margin + MLA.
The PIK margin on the Mezzanine debt determined the amount of interest capitalised into the outstanding balance at each rollover date.
114
NEW LOOK ANNUAL REPORT & ACCOUNTS 2014
New Look Retail Group Limited
Notes to the Group financial statements (continued)
28. Interest rate risk and liquidity risk (continued)
The table below provides detail of the amended debt profile, the new tranches and the cash and PIK margins:
Cash
margin
PIK
margin
%
%
Borrowings
at
24 March
2012
Repayments
25 March
2012 to
3 July 2012
Capitalised
interest
25 March
2012 to
3 July 2012
Translation
of Euro
borrowings
Reallocation
of borrowings
Amended
borrowings at
4 July 2012
£m
£m
£m
£m
£m
£m
Tranche A†
1.75
8.3
(8.3)
—
—
—
—
Tranche A2†
1.75
3.5
(3.5)
—
—
—
—
Tranche B1
2.75
164.3
(20.3)
—
—
(91.2)
52.8
Tranche B2 (Euro) **
2.75
31.5
(1.3)
—
(1.4)
(21.6)
7.2
Tranche B3
2.75
22.8
(3.5)
—
—
(9.3)
10.0
Tranche B4
4.75
—
—
—
—
100.5
100.5
Tranche B5 (Euro) **
4.75
—
—
—
—
21.6
21.6
Tranche C1
3.25
164.3
(19.9)
—
—
(99.4)
45.0
Tranche C2 (Euro) **
3.25
31.5
(0.4)
—
(1.3)
(21.3)
8.5
Tranche C4
4.75
—
—
—
—
99.4
99.4
Tranche C5 (Euro) **
4.75
—
—
—
—
21.3
21.3
Tranche D1
5.00
80.0
(8.3)
—
—
(65.6)
6.1
Tranche D2
6.00
Mezzanine
4.50
6.50
—
—
—
—
65.6
65.6
79.6
(8.3)
1.2
—
—
72.5
585.8
(73.8)
1.2
(2.7)
—
510.5
* The PIK margin on the Mezzanine debt increased from 5.50% to 6.50% as a result of the amend and extend transaction.
** The exchange rate for EUR/GBP as at 24 March 2012 was 1.196 and as at the transaction date was 1.248.
† The balance of Tranche A & A2 borrowings were prepaid voluntarily on 26 April 2012 and therefore not included in the amendments.
On 3 May 2013, New Look Retail Group Limited and its subsidiaries underwent a Group reorganisation and issued senior secured bonds. These
bonds were issued on 14 May 2013. The finance raised was used to repay the existing debt under the Senior and Mezzanine Facility Agreements and
to acquire 50% of the outstanding PIK debt in cash, with the remaining PIK debt being acquired for a new PIK instrument at par value.
The refinance included a restructure of the Group whereby Trinitybrook Limited sold its investment in Hamperwood Limited to New Look Finance
Limited (a new intermediate holding company). New Look Finance Limited now holds the direct investment in Hamperwood. New Look Finance
Limited also has a direct investment in New Look Finance II Plc and New Look Bondco I Plc.
New Look Bondco I Plc issued the senior secured bonds which are made up of three tranches of Sterling, US dollar and Euro. The Sterling and US
dollar bonds are at fixed coupon rates and the Euro bond is at the prevailing floating rate of interest based upon short-term inter-bank rates (EURIBOR)
plus a fixed margin.
New Look Finance Limited purchased 50% of the existing PIK debt in cash and New Look Finance II Plc then issued a new PIK instrument in settlement
of the remaining PIK debt.
Total transaction costs incurred as part of the refinance were £25.2 million. £3.1 million of these costs were incurred during the financial period ended
30 March 2013 and were expensed in full. Those costs that are directly attributable to the issue of the bonds were capitalised against the value of the
new borrowings and amortised as a finance expense over the maturity period of the debt. Those costs that relate to the extinguishment of the Senior,
Mezzanine and PIK debts will be expensed in full (note 9).
115
The table below provides details of the new debt tranches and the cash and PIK margins:
Senior - Tranche B1
Cash
margin
PIK
margin
%
%
2.75
Borrowings
as at
30 March
2013
Capitalised
interest
31 March
2013 to
14 May 2013
Translation
of Euro
borrowings
£m
£m
25.3
—
Repayments
& bond issue
Amended
borrowings as
at 14 May 2013
£m
£m
£m
—
(25.3)
—
Senior - Tranche B2 (Euro)*
2.75
3.6
—
0.1
(3.7)
—
Senior - Tranche B3
2.75
4.8
—
—
(4.8)
—
Senior - Tranche B4
4.75
96.4
—
—
(96.4)
—
Senior - Tranche B5 (Euro)*
4.75
21.8
—
0.2
(22.0)
—
Senior - Tranche C1
3.25
43.0
—
—
(43.0)
—
Senior - Tranche C2 (Euro)*
3.25
8.6
—
—
(8.6)
—
Senior - Tranche C4
4.75
95.3
—
—
(95.3)
—
Senior - Tranche C5 (Euro)*
4.75
21.5
—
0.1
(21.6)
—
Second Lien - Tranche D1
5.00
6.1
—
—
(6.1)
—
Second Lien - Tranche D2
6.00
65.6
—
—
(65.6)
—
Mezzanine Debt
4.50
PIK debt
New PIK debt
Senior bonds – Sterling
Senior bonds – US dollar**
Senior bonds - Euro*
6.50
76.1
0.6
—
(76.7)
—
9.00
741.5
4.9
—
(746.4)
—
12.00
—
—
—
373.2
373.2
8.75
—
—
—
500.0
500.0
8.375
—
—
—
164.1
164.1
6.25
—
—
—
148.7
148.7
1,209.6
5.5
0.4
(29.5)
1,186.0
*The exchange rate for EUR/GBP as at 30 March 2013 was 1.8156 and 1.1771 as at the date of transaction.
**The exchange rate for USD/GBP was 1.5240 as at the date of transaction.
The Group entered into foreign currency contracts on 3 May 2013 to hedge the exchange risk arising between pricing the bonds on 3 May 2013 and
settlement on 14 May 2013. The hedged rates were 1.1878 for the Euro bond and 1.5581 for the US dollar bond. The foreign currency contracts fixed
the total cash proceeds received in Sterling at £807.9 million.
The senior bonds are repayable in full on 14 May 2018. An early repayment option exists after two years and is repayable at par plus 50% coupon up to
14 May 2016 and at par plus 25% coupon up to 14 May 2017. After four years the bonds are repayable at par.
Interest on the PIK is rolled into the carrying value of the debt although an option does exist to pay the PIK interest in cash. The PIK debt matures in full
on 14 November 2018.
116
NEW LOOK ANNUAL REPORT & ACCOUNTS 2014
New Look Retail Group Limited
Notes to the Group financial statements (continued)
28. Interest rate risk and liquidity risk (continued)
On 3 May 2013 the Group also entered into a re-negotiated revolving credit facility for £75.0 million which has a final termination date of 3 February 2018.
The revolving credit facility is subject to quarterly covenant leverage reporting on an annualised basis beginning on the quarter ending 28 June 2014.
The following table sets out the carrying amount, by maturity, of the Group’s financial instruments that are exposed to interest rate risk:
Period ended 29 March 2014
Floating rate
Within
1 year
1-2 years
2-3 years
3-4 years
4-5 years
More than
5 years
Total
£m
£m
£m
£m
£m
£m
£m
Cash Assets
111.1
—
—
—
—
—
111.1
Bond - Euro
—
—
—
—
(144.6)
—
(144.6)
111.1
—
—
—
(144.6)
—
(33.5)
The following table sets out the carrying amount, by maturity, of the Group’s financial instruments that are at fixed rates and therefore not exposed to
interest rate risk:
Fixed rate
Within
1 year
1-2 years
2-3 years
3-4 years
4-5 years
More than
5 years
Total
£m
£m
£m
£m
£m
£m
£m
Bond – Sterling
—
—
—
—
(500.0)
—
(500.0)
Bond – US dollar
—
—
—
—
(150.3)
—
(150.3)
PIK debt
—
—
—
—
(377.3)
—
(377.3)
—
—
—
—
(1,027.6)
—
(1,027.6)
Within
1 year
1-2 years
2-3 years
3-4 years
4-5 years
More than
5 years
Total
Period ended 30 March 2013
Floating rate
£m
£m
£m
£m
£m
£m
£m
Cash Assets
113.6
—
—
—
—
—
113.6
Senior term debt – Tranche B1
(25.3)
—
—
—
—
—
(25.3)
Senior term debt – Tranche B2
(3.6)
—
—
—
—
—
(3.6)
Senior term debt – Tranche B3
(4.8)
—
—
—
—
—
(4.8)
(96.4)
Senior term debt – Tranche B4
—
—
(96.4)
—
—
—
Senior term debt – Tranche B5
—
—
(21.8)
—
—
—
(21.8)
Senior term debt – Tranche C1
(21.5)
(21.5)
—
—
—
—
(43.0)
Senior term debt – Tranche C2
(4.3)
(4.3)
—
—
—
—
(8.6)
Senior term debt – Tranche C4
—
—
(95.3)
—
—
—
(95.3)
(21.5)
Senior term debt – Tranche C5
—
—
(21.5)
—
—
—
Senior term debt – Tranche D1
—
(6.1)
—
—
—
—
(6.1)
Senior term debt – Tranche D2
—
—
(65.6)
—
—
—
(65.6)
Mezzanine debt
—
—
(76.1)
—
—
—
(76.1)
PIK debt
—
—
(741.5)
—
—
—
(741.5)
54.1
(31.9)
(1,118.2)
—
—
—
(1,096.0)
Interest on financial instruments classified as floating rate is re-priced at intervals of less than one year. Interest on financial instruments classified as fixed
rate is fixed until the maturity of the instrument.
117
Senior term debt tranches B2, B5, C2 & C5 were denominated in Euros and converted at the date of settlement at 1.177 (2013: balance sheet date at 1.186).
The closing balances of the Euro and US dollar bonds were converted at rates of 1.210 and 1.664 respectively.
Interest bearing loans and borrowings
Borrowings under the mezzanine debt, senior term debt and the available ancillary facilities were at the prevailing floating rates of interest based upon
short-term inter-bank rates (GBP LIBOR and EURIBOR for the interest period selected at the Group’s discretion). Commitment fees were payable in respect
of the undrawn amount of committed facilities.
The senior term debt, mezzanine debt and PIK loan were subject to quarterly covenant reporting.
Margins over Sterling LIBOR and Euro EURIBOR, applying to the senior term debt on all B tranches and C tranches were fixed and ranged from 2.75% to
4.75%. The margin applying to Second Lien tranche D debt ranged from 5.0% to 6.0%. The margin that applied to senior term debt tranche A was subject
to a ratchet mechanism whereby it varied from 1.5% to 2.25% subject to the financial performance of the Group. The margin applying to the mezzanine
debt was fixed at 11.0% of which 4.5% was settled in cash and 6.5% was capitalised at the end of each interest period. The margin applying to the old PIK
debt was 9.0% subject to a margin adjustment linked to the consolidated EBITDA of Trinitybrook Limited and its subsidiaries.
During the financial period ended 30 March 2013, the Group had the ability to repay part of the PIK debt held by Pedalgreen Limited based on a covenant
leverage test. Where, as at a reporting period end, the consolidated total net borrowings of the Group divided by the covenant LTM EBITDA of the Group
was less than two and continued to remain less than two for 12 months from that reporting period end. Pedalgreen Limited could then pay down an
amount of the PIK debt up to a limit of £25.0 million in the first year and then within the available excess cash PIK basket thereafter.
The PIK basket mechanism of buying back the PIK started at £25.0 million at the date of the transaction and continued to build using 50% of retained
excess cash flow, calculated on a quarterly basis in line with filing of covenant compliance certificates.
In November 2012, December 2012 and February 2013, the Group achieved the leverage test to enable three PIK debt buy back and cancellations. NL
Bowline Limited, a wholly owned subsidiary of Pedalgreen Limited, was incorporated as a special purpose vehicle to facilitate the buy back. £47.1 million
of PIK debt was repurchased for consideration of £38.0 million resulting in a gain on cancellation of £9.1 million (note 9).
Borrowing facilities
At 29 March 2014, the Group had the following undrawn committed facilities available:
As at
29 March 2014
Expiring within one year
Expiring in more than one year
30 March 2013
£m
£m
5.0
5.0
75.0
10.8
The facilities expiring within one year are annual facilities subject to an annual review. All facilities incur commitment fees at market rates and would
provide funding at floating rates. £5.0 million (2013: £5.0 million) expires within one year and is an undrawn annual facility subject to an annual review.
£75.0 million is an undrawn committed multi-currency revolving credit facility and matures in more than one year (2013: £10.8 million). The Group’s
subsidiaries are party to a cross guarantee on the revolving credit facility.
In addition, the Group has arrangements in place with certain banks to provide standby letters of credit to the Group’s suppliers. Letters of credit of
£45.6 million (2013: £48.1 million) were outstanding under these arrangements.
The Group’s management of interest rate risk, credit and market risk is explained in note 3.
118
NEW LOOK ANNUAL REPORT & ACCOUNTS 2014
New Look Retail Group Limited
Notes to the Group financial statements (continued)
29.Provisions
At 24 March 2012
Arising during the period
Onerous Lease
provisions
Dilapidations
provisions
£m
£m
£m
18.4
0.8
19.2
Total
6.3
0.1
6.4
Utilised
(3.7)
(0.4)
(4.1)
Reversal of unused amounts
(6.1)
—
(6.1)
0.1
—
0.1
15.0
0.5
15.5
Exchange difference
At 30 March 2013
Arising during the period
Utilised
7.7
—
7.7
(3.0)
(0.1)
(3.1)
Reversal of unused amounts
(5.3)
—
(5.3)
At 29 March 2014
14.4
0.4
14.8
As at
29 March 2014
Current
Non-current
30 March 2013
£m
£m
4.4
5.7
10.4
9.8
14.8
15.5
Onerous lease provisions
The provision relates to future lease costs of vacant properties for the remaining period of the lease, net of expected sub-letting income, which is
estimated to be used over one to 24 months, and a provision for onerous lease contracts on loss making stores. A provision is booked on loss making
stores where the discounted future cash flows are not expected to cover future rental payments under the lease contract. A provision is made for the
lower of: discounted store cash outflows (including rental payments) and discounted rental payments. Future operating losses are not provided for.
Dilapidations provisions
The dilapidations provision of £0.4 million (2013: £0.5 million) is expected to be utilised over one to 12 months.
30. Operating lease commitments
Future minimum rentals payable under non-cancellable operating leases where the Group is the lessee:
As at
29 March 2014
Not later than one year
30 March 2013
£m
£m
176.5
175.6
Later than one year and not later than five years
611.0
577.1
Later than five years
542.7
607.2
1,330.2
1,359.9
The Group has entered into operating leases in respect of warehouses, offices and retail stores. Contingent rentals are payable on certain retail store
leases based on store revenues.
At the balance sheet date, total future payments expected to be received under non-cancellable sub-leases were £3.9 million (2013: £3.6 million).
119
31. Share based payments
Senior Management Scheme
In April 2004, the senior management of the Group were invited to invest in the shares of the three Guernsey companies which comprised the holding
companies of Trinitybrook Limited (the ultimate holding company of the Group at that time), being NL Company No. 1 Limited, NL Company No. 2
Limited and NL Company No. 3 Limited. These shares were purchased at fair value.
As part of the Group reorganisation and share for share exchange in June 2006, the shares held by employees in the three Guernsey companies, NL
Company No. 1 Limited, NL Company No. 2 Limited, and NL Company No. 3 Limited and the ESOP1 holding in Trinitybrook Limited were exchanged
for shares in New Look Retail Group Limited.
All of the shares held were originally issued at fair value determined by reference to the market value of a basket of comparator companies. Under the
reorganisation a cash payment of £48.0 million was paid by Pedalgreen Limited (an immediate subsidiary company of New Look Retail Group Limited)
to investors within the scope of IFRS 2, in consideration for the sale of a proportion of the shares in Guernsey 4 Limited (the holding company of the
Group prior to the reorganisation in 2006) and the remaining shares were exchanged for shares in Pedalgreen Limited. Guernsey 4 Limited acquired
its holding in the Group on 1 June 2006 by acquiring all the shares in NL Company No. 1 Limited, NL Company No. 2 Limited and NL Company No. 3
Limited. There was then a share for share exchange as part of which shares in Pedalgreen Limited were exchanged for shares in New Look Retail Group
Limited. Accordingly the reorganisation was accounted for as a modification of an equity-settled arrangement under IFRS 2. The £48.0 million was
charged directly to the retained earnings reserve.
As at
29 March 2014
Number
Shares in issue at the beginning of the period
Shares purchased by ESOP from senior management in the period
Shares in issue at the end of the period
30 March 2013
Number
000s
000s
34,432
40,432
(12,895)
(6,000)
21,537
34,432
The 2004 Share Scheme and the 2008 Share Plan
In May 2004, under a new arrangement, Trinitybrook Limited loaned funds to ESOP1. ESOP1 then subscribed to Trinitybrook Limited to acquire a fixed
allocation of shares. Between May 2004 and February 2006, certain employees were invited to acquire beneficial ownership of these shares at fair
value determined by reference to the market value of a basket of comparator companies. As a result of the Group reorganisation in 2006, employees
now hold the beneficial interest in shares in New Look Retail Group Limited.
In April 2009, August 2009, August 2011, September 2012, February 2013, September 2013 and December 2013 certain employees were invited
to acquire the beneficial interest in shares owned by ESOP1 at fair value determined by reference to the market value of a basket of comparator
companies (the 2008 Share Plan).
These shares vest over a 4-year period. Under the first tranche, 20.0% vested on 30 April 2009, then 20.0% on 18 September 2009 and 20.0%
on each anniversary of 18 September until the third anniversary. Under the second tranche, 20.0% vested on 21 August 2009 and 20.0% on each
anniversary from the grant date until the fourth anniversary. Under the third tranche, 20.0% vested on 25 August 2011, 20.0% vested on 1 May 2012
and 20.0% on each anniversary of 1 May until the third anniversary. Under the fourth tranche, 20.0% vested on 18 September 2012 and 20.0% on each
anniversary from the grant date until the fourth anniversary. Under the fifth tranche, 20.0% vested on 18 February 2013 and 20.0% on each anniversary
from the grant date until the fourth anniversary. Under the sixth tranche, 20% vested on 1 September 2013 and 20% on each anniversary from the
grant date until the fourth anniversary. Under the seventh tranche, 20.0% vested on 20 December 2013 and 20.0% on each anniversary from the grant
date until the fourth anniversary.
120
NEW LOOK ANNUAL REPORT & ACCOUNTS 2014
New Look Retail Group Limited
Notes to the Group financial statements (continued)
31. Share based payments (continued)
Vesting affects the price at which the employee may be required to sell any shares which have not vested upon ceasing to be employed within the
Group. The employee is generally not free to sell the shares until either a change in control of the Group or (subject to the vesting conditions) a listing.
The Group has issued shares to ESOP2 for the purposes of meeting the liabilities in respect of phantom options under the Phantom Plan granted to
certain employees in France.
Under the 2008 Share Plan, shares have vested at various times throughout the year. The weighted average share price at vesting for all grants
throughout the period was 8.0p (2013: 1.0p).
Until June 2007, the 2004 Share Scheme operated as an equity settled arrangement under which employees could be required to sell their shares
in the event of a sale or listing of the Group. In June 2007, an amendment was introduced such that, in the event of a sale, the employees would be
required to sell their shares but, in the event of a listing of the Group, they would remain entitled to their shares. The 2008 Share Plan contains similar
features. The 2008 Share Plan also protects the employee from a fall in the value of New Look Retail Group Limited’s shares. The 2008 Share Plan is
therefore accounted for, in substance, as a share option arrangement.
Details of the 2008 Share Plan share options outstanding during the period are as follows:
Outstanding at the beginning of the period
Granted in the period
Exercised in the period
Lapsed in the period
Forfeited in the period
Outstanding at the end of the period
Exercisable at the end of the period
Weighted average remaining contractual life (months)
Weighted average share price at the date of exercise (pence)
Weighted average exercise price (pence)
March 2013 – March 2014
Number of share options
March 2012 – March 2013
Number of share options
000s
000s
92,099
32,719
8,900
64,321
—
—
—
—
(36,434)
(4,941)
64,565
92,099
—
—
26 months
36 months
—
—
4.0p
4.0p
Market value at period end (pence)
12.0p
1.0p
Highest market value (pence)
12.0p
1.0p
Lowest market value (pence)
1.0p
1.0p
2006 Option Plan
In June 2006 and other times subsequently, key personnel in the Group were offered the opportunity to participate in the 2006 Option Plan. Share
options are awarded to employees at the discretion of the Board. Options will normally vest after two years if an employee remains in service. Options
will only vest before the two years continuous service when there has been a flotation or change of control in New Look Retail Group Limited (or its
holding company), or when the employee leaves the Group as a result of redundancy, injury/illness/disability or death.
Options may normally only be exercised during a period of eight years commencing on the second anniversary of the date of grant of the option, as
long as the employee remains in service. At 29 March 2014, 1,545,000 (2013: 1,882,105) options were outstanding, with the earliest exercise date
being 30 June 2008, assuming that the full vesting period is satisfied.
121
Details of the 2006 Option Plan share options outstanding during the period are as follows:
Outstanding at the beginning of the period
March 2013 – March 2014
Number of share options
March 2012 – March 2013
Number of share options
000s
000s
1,882
2,612
Granted in the period
—
—
Exercised in the period
—
—
Lapsed in the period
Forfeited in the period
—
—
(337)
(730)
Outstanding at the end of the period
1,545
1,882
Exercisable at the end of the period
1,545
1,882
30 months
43 months
Weighted average remaining contractual life (months)
Weighted average share price at the date of exercise (pence)
Weighted average exercise price (pence)
0.0p
1.0p
13.0p
14.0p
Market value at period end (pence)
12.0p
1.0p
Highest market value (pence)
12.0p
1.0p
Lowest market value (pence)
1.0p
1.0p
Fair value of equity settled share based payment schemes
The cost of the equity settled transactions with employees is measured by reference to the fair value at the date at which they are granted and the
expense is spread to the estimated date of a change of control of the Group.
As the employees acquired the beneficial interest in their shares at fair value under the Senior Management Scheme and the 2004 Share Scheme,
there is no charge to the income statement for these equity settled transactions.
The weighted average fair value of the share options granted under the 2006 Option Plan and the 2008 Share Plan was calculated at the date of grant
using the Black-Scholes option pricing model. The following table lists the inputs to the model used for the two plans for the periods ended 29 March
2014 and 30 March 2013:
29 March 2014
29 March 2014
30 March 2013
30 March 2013
2008 Share Plan
2006 Option Plan
2008 Share Plan
2006 Option Plan
Weighted average fair value (pence)
—
1.93
16.22
1.70
Weighted average share price (pence)
—
4.42
38.00
3.72
Exercise price (pence)
—
1.00 to 25.00
38.00
1.00 to 25.00
Expected volatility (%)
—
31.50 to 44.10
36.20
35.50 to 45.70
Expected life of option (years)
—
2.30 to 6.92
6.10
3.00 to 6.92
Dividend yield (%)
—
0.00 to 2.00
0.00
0.00 to 2.00
Risk-free interest rate (%)
—
1.00 to 4.00
4.00
1.75 to 4.00
Expected share price volatility was determined through the assessment of the historical volatility of a comparable group of companies over a period
consistent with the expected life of the award. It is indicative of future trends, which may not necessarily be the actual outcome. The expected life of the
options is based on management’s estimated date of a change of control of the Group and is not necessarily indicative of exercise patterns that may occur.
122
NEW LOOK ANNUAL REPORT & ACCOUNTS 2014
New Look Retail Group Limited
Notes to the Group financial statements (continued)
31. Share based payments (continued)
The table below reconciles the total number of unallocated shares controlled by the ESOPs for all share schemes operated by the Group for each period end.
As at
Shares controlled by the ESOPs at the beginning of the period
Shares allocated under 2006 Option Plan
Shares allocated under 2008 Share Plan
Share options exercised in 2006 Option Plan
Shares repurchased from 2006 Option Plan
29 March 2014
30 March 2013
Number
Number
000s
000s
23,682
74,672
—
—
(8,900)
(64,321)
—
—
337
730
6,000
Shares purchased from Senior Management Scheme
12,895
Shares purchased by the ESOPs in the period
37,378
6,601
Shares controlled by the ESOPs at the end of the period
65,392
23,682
Effect on financial statements
Share based payments also include a cash settled element for ‘Good Leavers’. The income statement is charged with the change in fair value relating to the
estimate at the balance sheet date of the number of ‘Good Leavers’ likely to arise before any change in control of the Group.
The effect of accounting for share based payments, in accordance with IFRS 2, on the Group’s loss before taxation (2013: profit) for the periods is as follows:
For the financial periods
52 weeks ended
29 March 2014
53 weeks ended
30 March 2013
£m
£m
Equity settled share based payment schemes
(0.1)
0.1
Cash settled share based payment schemes
6.4
(0.3)
Total share based payment expense / (credit)
6.3
(0.2)
32. Share capital
At 24 March 2012
Shares disposed of in the period
At 30 March 2013
Shares purchased in the period
At 29 March 2014
Share capital
Share premium
Treasury shares
Total
£m
£m
£m
£m
10.4
0.6
(22.1)
(11.1)
—
—
0.2
0.2
10.4
0.6
(21.9)
(10.9)
—
—
(1.4)
(1.4)
10.4
0.6
(23.3)
(12.3)
The total number of authorised Ordinary A shares is 200.0 million each period end and the total number of Ordinary B shares is 1,000.0 million each
period end. All shares have a par value of 1.0p.
The total number of allotted, called up and fully paid Ordinary A shares is 157.6 million and the total number of allotted, called up and fully paid
Ordinary B shares is 879.1 million at each period end. All shares have a par value of 1.0p.
The consideration paid for the ordinary shares of 1.0p each in the Company held by the ESOPs has been shown as a deduction in capital and reserves
as treasury shares.
The A shares in the Company entitle holders to receive notice, attend and speak at general meetings but only confer a right to vote if no B shares are in
issue. The shares also have a right to receive a dividend.
The B shares in the Company entitle holders to receive notice, attend, speak and vote at general meetings. The shares also have a right to receive a dividend.
123
33. Reconciliation of movements in equity
At 24 March 2012
Reverse
acquisition
reserve
ESOPs
reserve
Hedging
reserve
Translation
reserve
Accumulated
losses
Total
£m
£m
£m
£m
£m
£m
(318.7)
(285.3)
0.7
(4.1)
9.6
(39.6)
Total comprehensive income and expense for the period
—
—
15.8
0.9
3.4
20.1
Tax on total comprehensive income and expense for the period
—
—
(3.9)
(0.1)
—
(4.0)
Share based payment charge
—
—
—
—
0.1
0.1
Actuarial loss on post-employment benefit obligations
—
—
—
—
(0.5)
(0.5)
(285.3)
0.7
7.8
10.4
(36.6)
(303.0)
Total comprehensive income and expense for the period
At 30 March 2013
—
—
(28.2)
(2.4)
(53.6)
(84.2)
Tax on total comprehensive income and expense for the period
—
—
6.6
0.3
—
6.9
Purchase of treasury shares (note 32)
—
—
—
—
1.4
1.4
Share based payment charge
—
—
—
—
(0.1)
(0.1)
(285.3)
0.7
(13.8)
8.3
(88.9)
(379.0)
At 29 March 2014
Reverse acquisition reserve
The reverse acquisition reserve arose on the acquisition by New Look Retail Group Limited in 2006 of the former Trinitybrook Limited Group, as
permitted by IFRS 3 Business Combinations and represents the amount paid by New Look Retail Group Limited to acquire the existing shareholdings
in Trinitybrook Limited.
ESOPs reserve
The ESOPs reserve represents the gain made by the trusts on the transfer of shares to employees at a higher price than purchased.
Hedging reserve
The hedging reserve reflects the changes in fair value of effective hedging instruments on forward exchange contracts which are carried forward to
match the maturity of the future cash flows.
Translation reserve
The translation reserve is used to record exchange differences arising from the translation of the financial statements of foreign subsidiaries.
34. Shares held by ESOPs
The ESOPs have an independent professional trustee resident in Guernsey and provide for the allocation of shares to Group employees, at the
discretion of the trustee.
At 29 March 2014, the ESOPs held 115,809,649 (2013: 102,914,649) Ordinary A shares of 1.0p each in New Look Retail Group Limited and 323,408
(2013: 323,408) Ordinary B shares of 1.0p each in New Look Retail Group Limited.
The initial consideration paid for ordinary shares in New Look Retail Group Limited held by the ESOPs has been shown as a deduction in capital and
reserves as treasury shares. All other assets, liabilities, income and costs of the ESOPs have been incorporated into the financial statements of the Group.
124
NEW LOOK ANNUAL REPORT & ACCOUNTS 2014
New Look Retail Group Limited
Notes to the Group financial statements (continued)
35. Retirement benefit schemes
The Group operates a defined contribution scheme in the UK. At 29 March 2014 £nil (2013: £0.2 million) was outstanding in respect of contributions
payable to personal pension schemes. The pension cost recognised in the income statement was £1.7 million (2013: £1.2 million).
In France, the Group operates an unfunded defined benefit arrangement in accordance with French legal requirements which consists of a single
payment at the date of retirement. The scheme is uninsured and has no assets. An actuarial assessment was carried out as at 31 March 2013 by an
independent actuary, using the projected unit method. The major assumptions were:
As at
29 March 2014
30 March 2013
%
%
2.5 – 3.0
2.5 – 3.0
Discount rate
2.75
2.75
Price inflation
2.0
2.0
Rate of increase in salaries
The liability at 29 March 2014 was £2.0 million (2013: £1.7 million), which is included in accruals. The pension cost recognised in the income
statement was £1.1 million (2013: £1.0 million). During the financial period ended 29 March 2014, a charge of £nil (2013: £0.5 million) was recognised
in other comprehensive income in relation to actuarial losses on post employment benefit obligations.
36. Related party transactions
ESOPs
At the end of the financial period, the ESOPs owed New Look Retail Group Limited £24.6 million (2013: £25.1 million).
Franchise Agreement
On 1 February 2012, the Group agreed a five year franchise agreement with RNA Resources Group Limited (“RNA”), a subsidiary of the Landmark
Group International (“Landmark”), in which Mukesh Wadhumal Jagtiani and his wife, Renuka Mukesh Jagtiani own shares. Mukesh Jagtiani also owns
29,737,833 Ordinary B shares (2013: 29,737,833) in the Company in the name of Quillian Investments Corporation.
The agreement relates to the continued opening of new stores under the New Look brand in the Middle East.
In February 2012, the Group received a fee of £1.8 million in return for granting exclusivity to the New Look brand in the Middle East. In addition, the
Group receives a royalty for the supply of goods based on a percentage of sales made by the franchisee.
Amortisation of the territory fee over the term of the agreement of £0.4 million (2013: £0.4 million) has been recognised through the income
statement in the current financial period.
125
Transactions with franchisee
For the financial periods
Sale of goods and handling charges
Franchise royalty income
52 weeks ended
29 March 2014
53 weeks ended
30 March 2013
£m
£m
28.0
30.1
0.4
0.4
As at
29 March 2014
Balance due from franchisee at the end of the financial period
30 March 2013
£m
£m
4.2
3.0
Included within the balance due from franchisee is a provision of £nil (2013: £nil).
As at
29 March 2014
Investment in PIK loan
30 March 2013
£m
£m
44.2
87.4
On 14 May 2013, as part of the Group’s reorganisation and refinancing, 50% of the PIK loan was settled in cash and the remaining 50% rolled into a
new PIK loan. Up to the date of the refinancing, £1.2 million of interest was rolled up into the PIK and £44.3 million was disposed of by the franchisee.
Following the refinancing, £4.5 million of interest was rolled up into the balance of the new PIK loan and £4.6 million was disposed of on 24 March
2014. In the financial period ended 30 March 2013, £8.0 million of interest was rolled up into the balance of the PIK. £nil (2013: £nil) of additional new
PIK loan was purchased by the franchisee.
For further details of the refinancing transaction see note 28.
Transactions with Director and key management
As at 29 March 2014, there were loans outstanding with one key manager (2013: one), totalling £0.5 million (2013: £0.5 million) in connection with
their purchase of the beneficial interest in shares under the 2008 Share Plan (note 31). Interest on the 2008 Share Plan loan is charged at the applicable
HMRC rate and is repayable in full on exercise of shares and change in control of the business. In addition, under the 2008 Share Plan, one key
manager acquired beneficial ownership of shares on 20 December 2013 by way of a loan from New Look Retail Group Limited.
In the prior financial period under the 2008 Share Plan, T Singh acquired beneficial ownership of shares on both 18 September 2012 and 18 February
2013 by way of a cash payment to New Look Retail Group Limited, A McGeorge acquired beneficial ownership of shares on both 25 August 2011 and
18 September 2012 by way of a loan from New Look Retail Group Limited and A Kristiansen acquired beneficial ownership of shares on 18 February
2013 by way of a loan from New Look Retail Group Limited.
As at 29 March 2014, the total of loans outstanding with Directors was £0.4 million (2013: £0.4 million), which are repayable in full on sale of the
shares and change of control of the business. Interest is charged on these loans at the applicable HMRC rate.
The following transactions have occurred between the Group and Directors and key management:
As at
Investment in PIK loan
29 March 2014
30 March 2013
£m
£m
—
7.1
126
NEW LOOK ANNUAL REPORT & ACCOUNTS 2014
New Look Retail Group Limited
Notes to the Group financial statements (continued)
36. Related party transactions (continued)
In June 2006 certain Directors and key management used funds received from the sale of part of their existing shareholdings to reinvest £12.7 million
in the PIK loan.
On 14 May 2013, as part of the Group’s reorganisation and refinancing, 50% of the PIK loan was settled in cash and the remaining 50% rolled into a
new PIK loan. Up to the date of the refinancing, £0.1 million (2013: £0.6 million) of interest was rolled up into the PIK and £3.6 million was disposed of
by Directors.
On 23 August 2013, £3.6 million of the new PIK loan was disposed of by Directors and key management. £nil (2013: £nil) of additional PIK loan was
purchased by Directors and key management.
For further details of the refinancing transaction see note 28.
During the period a monitoring fee of £0.2 million (2013: £0.1 million) was payable to Rianta Capital Limited, an advisory company owned by T Singh’s
Family Trust.
Transactions with private equity investors
A monitoring fee was paid to each private equity investor during the period, details of which can be found in note 8b.
As at
29 March 2014
30 March 2013
£m
£m
—
108.4
Investment in PIK loan
On 14 May 2013, as part of the Group’s reorganisation and refinancing, 50% of the PIK loan was settled in cash and the remaining 50% rolled into a
new PIK loan. Up to the date of the refinancing, £0.8 million (2013: £12.6 million) of interest was rolled up into the PIK and £54.6 million (2013: £29.0
million) was disposed of by entities advised by a private equity investor. On 1 October 2013, £55.0 million of the new PIK loan was disposed of which
included £0.4 million of additional rolled up interest. £nil (2013: £nil) of additional new PIK loan was purchased during the financial period.
For further details of the refinancing transaction see note 28.
Transactions with joint venture
For the financial periods
52 weeks ended
29 March 2014
Purchases from joint venture
Included within the trade receivables is a balance of £nil (2013: £nil) owed by the joint venture.
Included within trade payables is a balance of £1.5 million (2013: £nil) owed to the joint venture.
No other transactions that require disclosure under IAS 24 have occurred during the current financial period.
53 weeks ended
30 March 2013
£m
£m
9.0
10.4
127
37. Investment in subsidiaries
The principal subsidiary companies in which New Look Retail Group Limited or its subsidiaries hold 100% of the ordinary shares and voting rights are
listed below. These companies are consolidated into the financial results of the Group.
Country of incorporation and operation
Country of incorporation and operation
Pedalgreen Limited(1)
Subsidiary
England and Wales
Intermediate holding company
New Look Finance Limited
England and Wales
Intermediate holding company
New Look Finance II Plc
England and Wales
Intermediate holding company
New Look Bondco I Plc
England and Wales
Intermediate holding company
Trinitybrook Limited
England and Wales
Intermediate holding company
Hamperwood Limited
England and Wales
Intermediate holding company
New Look Group Limited
England and Wales
Intermediate holding company
New Look Limited
England and Wales
Intermediate holding company
New Look Retailers Limited
England and Wales
Fashion retail
Geometry Properties Limited
England and Wales
Property holding and rental
New Look Overseas Limited
England and Wales
Intermediate holding company
Guernsey
Fashion retail
New Look Holdings (France) SAS
France
Intermediate holding company
Mim SAS
France
Fashion retail
SCI Geometry Properties France
France
Property holding and rental
New Look France SAS
France
Fashion retail
New Look Belgium SA
Belgium
Fashion retail
MIM Belgique
Belgium
Fashion retail
New Look Holland BV
Holland
Fashion retail
New Look Retailers (CI) Limited
New Look (Singapore) PTE Limited
New Look Retailers (Ireland) Limited
New Look (Germany) GmbH
Singapore
Logistics and freight management
Republic of Ireland
Fashion retail
Germany
Fashion retail
Fashion Look Sp. z o.o.
Poland
Fashion retail
Cenzora Enterprises Limited
Cyprus
Intermediate holding company
People’s Republic of China
Fashion retail
New Look Commerce (Shanghai) Co. Limited
Note:
1. Pedalgreen Limited shareholding held directly whilst all others held indirectly through wholly owned subsidiaries.
During the financial period ended 29 March 2014, NL Bowline Limited, NL Company No. 1 Limited, NL Company No. 2 Limited, NL Company No.3
Limited and Guernsey 4 Limited were placed in liquidation and were struck off.
A full list of subsidiary undertakings as at 29 March 2014 will be annexed to New Look Retail Group Limited’s next annual return.
In addition, the Group has a 50% stake in the ordinary share capital of NLT Tekstil Sanayi Ve Ticaret Limited Şirketi, a joint venture incorporated in Turkey,
whose principal trading activity is retail manufacturing.
38. Events after the reporting period
As permitted under the PIK facility agreement dated 14 May 2013, New Look Finance II Plc gave notice to debt investors on 23 April 2014 that the
Group intends to prepay an amount of the new PIK debt equal to a principal amount of £37.6 million plus accrued interest of £1.2 million and a
redemption premium of £1.2 million. The prepayment is due to be settled on 27 May 2014.
39. Ultimate controlling party
New Look Retail Group Limited is the ultimate parent of the Group. Apax Funds own 27.7% and Permira Funds own 27.6% of the total issued share
capital. Copies of the financial statements can be obtained from New Look House, Mercery Road, Weymouth, Dorset.
128
NEW LOOK ANNUAL REPORT & ACCOUNTS 2014
Independent auditors’ report
to the members of New Look
Retail Group Limited
Report on the parent company financial statements
Our opinion
In our opinion the financial statements, defined below:
• give a true and fair view of the state of the parent company’s affairs as
at 29 March 2014;
• have been properly prepared in accordance with United Kingdom
Generally Accepted Accounting Practice; and
• have been prepared in accordance with the requirements of the
Companies Act 2006.
Other matters on which we are required to report
by exception
Adequacy of accounting records and information and
explanations received
Under the Companies Act 2006 we are required to report to you if, in
our opinion:
• we have not received all the information and explanations we require
for our audit; or
This opinion is to be read in the context of what we say in the remainder
of this report.
• adequate accounting records have not been kept by the parent
company, or returns adequate for our audit have not been received
from branches not visited by us; or
What we have audited
• the financial statements are not in agreement with the accounting
records and returns.
The parent company financial statements (the “financial statements”),
which are prepared by New Look Retail Group Limited, comprise:
• Company balance sheet as at 29 March 2014; and
• the notes to the financial statements, which include a summary of
significant accounting policies and other explanatory information.
The financial reporting framework that has been applied in their
preparation is applicable law and United Kingdom Accounting
Standards (United Kingdom Generally Accepted Accounting Practice).
In applying the financial reporting framework, the Directors have made
a number of subjective judgements, for example in respect of significant
accounting estimates. In making such estimates, they have made
assumptions and considered future events.
What an audit of financial statements involves
We conducted our audit in accordance with International Standards
on Auditing (UK and Ireland) (“ISAs (UK & Ireland)”). An audit involves
obtaining evidence about the amounts and disclosures in the financial
statements sufficient to give reasonable assurance that the financial
statements are free from material misstatement, whether caused by fraud
or error. This includes an assessment of:
• whether the accounting policies are appropriate to the parent
company’s circumstances and have been consistently applied and
adequately disclosed;
• the reasonableness of significant accounting estimates made by the
Directors; and
• the overall presentation of the financial statements.
In addition, we read all the financial and non-financial information in
the Annual Report & Accounts (the “Annual Report”) to identify material
inconsistencies with the audited financial statements and to identify any
information that is apparently materially incorrect based on, or materially
inconsistent with, the knowledge acquired by us in the course of performing
the audit. If we become aware of any apparent material misstatements or
inconsistencies we consider the implications for our report.
Opinion on other matter prescribed by the
Companies Act 2006
In our opinion the information given in the Strategic Report and
the Directors’ Report for the financial period for which the financial
statements are prepared is consistent with the financial statements.
We have no exceptions to report arising from this responsibility.
Directors’ remuneration
Under the Companies Act 2006 we are required to report to you if, in our
opinion, certain disclosures of Directors’ remuneration specified by law are
not made. We have no exceptions to report arising from this responsibility.
Responsibilities for the financial statements and
the audit
Our responsibilities and those of the Directors
As explained more fully in the Directors’ Responsibilities Statement set out
on page 67, the Directors are responsible for the preparation of the financial
statements and for being satisfied that they give a true and fair view.
Our responsibility is to audit and express an opinion on the financial
statements in accordance with applicable law and ISAs (UK & Ireland).
Those standards require us to comply with the Auditing Practices
Board’s Ethical Standards for Auditors.
This report, including the opinions, has been prepared for and only for
the company’s members as a body in accordance with Chapter 3 of Part
16 of the Companies Act 2006 and for no other purpose. We do not,
in giving these opinions, accept or assume responsibility for any other
purpose or to any other person to whom this report is shown or into
whose hands it may come save where expressly agreed by our prior
consent in writing.
Other matter
We have reported separately on the Group financial statements of New
Look Retail Group Limited for the 52 week period ended 29 March 2014.
Alan Kinnear (Senior Statutory Auditor)
for and on behalf of PricewaterhouseCoopers LLP
Chartered Accountants and Statutory Auditors
Southampton
23 May 2014
(a) The maintenance and integrity of the New Look Retail Group Limited website is the
responsibility of the Directors; the work carried out by the auditors does not involve
consideration of these matters and, accordingly, the auditors accept no responsibility for any
changes that may have occurred to the financial statements since they were initially presented
on the website.
(b) Legislation in the United Kingdom governing the preparation and dissemination of financial
statements may differ from legislation in other jurisdictions.
129
New Look Retail Group Limited
Company balance sheet
As at
29 March 2014
30 March 2013
Notes
£m
£m
5
40.5
34.3
Other debtors (including £2.9 million (2013: £3.4 million) due after one year
2.9
3.4
Cash at bank and in hand
0.4
0.3
(29.7)
(28.9)
(26.4)
(25.2)
14.1
9.1
(6.3)
(3.4)
7.8
5.7
Fixed assets
Investments
Current assets
Current liabilities
Creditors: Amounts falling due within one year
6
Net current liabilities
Total assets less current liabilities
Creditors: Amounts falling due after more than one year
7
Net assets
Capital and reserves
Called up share capital
9
10.4
10.4
Share premium account
10
0.6
0.6
Treasury shares
11
(23.3)
(21.9)
ESOP reserve
12
0.7
0.7
Profit and loss account
13
19.4
15.9
Total shareholders’ funds
14
7.8
5.7
The financial statements on page 129 to 135 were approved by the Board of Directors on 23 May 2014 and were signed on its behalf by:
Anders Kristiansen
CHIEF EXECUTIVE OFFICER
New Look Retail Group Limited
Registration number: 05810406
130
NEW LOOK ANNUAL REPORT & ACCOUNTS 2014
New Look Retail Group Limited
Notes to the Company
financial statements
1.
Authorisation of financial statements
The financial statements of New Look Retail Group Limited for the 52
weeks ended 29 March 2014 were authorised for issue by the Board
of Directors on 23 May 2014 and the balance sheet was signed on the
Board’s behalf by Anders Kristiansen.
New Look Retail Group Limited, a private limited company, is
incorporated in England and Wales and is the ultimate parent company
of the New Look Group of companies.
2.
Accounting policies
The financial statements of the Company, for the financial period ended
29 March 2014 have been prepared on the going concern basis, under
the historical cost convention and in accordance with the Companies
Act 2006 and applicable UK Generally Accepted Accounting Principles
(UK GAAP). The principal accounting policies which have been applied
consistently are set out below.
Basis of preparation
The Company has taken advantage of the exemption under the terms
of FRS 1 (revised 1996) from the requirement to produce a cash flow
statement. A consolidated cash flow statement is included in the
Group’s financial statements. The Company has also taken advantage
of the exemption contained in FRS 8 from the requirement to disclose
related party transactions with wholly owned group companies. The
Company has taken advantage of the legal dispensation contained in
section 408 of the Companies Act 2006 allowing it not to publish a
separate profit and loss account and related notes.
Investments
Investments are stated at cost less provisions for impairment. The need
for any impairment write down is assessed by comparison of the carrying
value of the asset against the higher of its net realisable value or its value
in use.
Taxation
Corporation tax payable is provided on taxable profits at the current rate.
Deferred taxation
Deferred tax is recognised in respect of all timing differences that
have originated but not reversed at the balance sheet date, where
transactions or events that result in an obligation to pay more tax in the
future or a right to pay less tax in the future have occurred at the balance
sheet date.
A net deferred tax asset is recognised as recoverable when, on the
basis of all available evidence, it can be regarded as more likely than not
there will be suitable taxable profits from which the future reversal of
underlying timing differences can be deducted.
Deferred tax is measured at the tax rates that are expected to apply in
the periods in which the timing differences are expected to reverse,
based on tax rates and laws that have been enacted or substantively
enacted by the balance sheet date. Deferred tax has not been
discounted.
Non-derivative financial assets and liabilities
Non-derivative financial assets and liabilities are recognised initially at fair
value and subsequently at amortised cost using the effective interest rate
method.
Share based payments
The grant by the Company of options over its equity instruments to the
employees of a subsidiary undertaking in the Group is treated as a capital
contribution. The fair value of employee services received, measured
by reference to the grant date fair value of the equity instrument, is
recognised over the vesting period as an increase to investment in
subsidiary undertakings, with a corresponding credit to equity. At each
balance sheet date, the Company revises its estimates of the number of
options or shares that are expected to vest. The impact of any revision,
if any, is recognised as a capital contribution with a corresponding
adjustment to reserves. A provision is booked for the liability arising on
‘cash settled’ share based payments on behalf of a subsidiary undertaking
at each balance sheet date. Full disclosure of share based payments is
given in note 31 of the Group financial statements.
Shares held by ESOPs
The ESOPs provide for the issue of shares to Group employees and is
consolidated. The shares acquired by the ESOPs are included as treasury
shares within capital and reserves at cost. Gains made by the ESOPs on
purchasing and selling Company shares are recorded within a separate
ESOP reserve.
3.
Profit of the Company
The profit (2013: loss) for the financial period dealt with in the financial
statements of the Company was £2,202,000 (2013: loss £767,000).
The Company has no recognised gains or losses (2013: none) apart from
the profit for the period and therefore no separate statement of gains
and losses has been presented.
The fees payable for the audit are borne by another Group company.
The aggregate remuneration paid to the auditors in relation to services
received by the Group is disclosed in the consolidated financial
statements in note 7.
4.
Staff costs
New Look Retail Group Limited had no employees during the period
(2013: none).
Directors’ remuneration is borne by another group company. Details
of Directors’ remuneration are disclosed in note 8b to the Group
consolidated financial statements.
131
5.Investments
As at
Cost and net book value at the start of the period
Capital contribution in respect of share based payments
29 March 2014
30 March 2013
£m
£m
34.3
34.5
6.3
(0.3)
(Disposed of) / acquired in the period
(0.1)
0.1
Cost and NBV at the end of the period
40.5
34.3
Investments represent holdings in subsidiary undertakings.
The Directors believe that the carrying value of the investments is supported by their net assets or the trading results and net assets of the
investments’ subsidiaries.
132
NEW LOOK ANNUAL REPORT & ACCOUNTS 2014
New Look Retail Group Limited
Notes to the Company financial statements (continued)
5.
Investments (continued)
The principal subsidiary companies in which New Look Retail Group Limited or its subsidiaries hold 100% of the ordinary shares and voting rights are
listed below. These companies are consolidated into the financial results of the Group.
Subsidiary
Country of incorporation and operation
Main activity
England and Wales
Intermediate holding company
New Look Finance Limited
England and Wales
Intermediate holding company
New Look Finance II Plc
England and Wales
Intermediate holding company
New Look Bondco I Plc
England and Wales
Intermediate holding company
Trinitybrook Limited
England and Wales
Intermediate holding company
Hamperwood Limited
England and Wales
Intermediate holding company
New Look Group Limited
England and Wales
Intermediate holding company
New Look Limited
England and Wales
Intermediate holding company
Pedalgreen Limited
(1)
New Look Retailers Limited
England and Wales
Fashion retail
Geometry Properties Limited
England and Wales
Property holding and rental
New Look Overseas Limited
England and Wales
Intermediate holding company
New Look Retailers (CI) Limited
Guernsey
Fashion retail
New Look Holdings (France) SAS
France
Intermediate holding company
Mim SAS
France
Fashion retail
SCI Geometry Properties France
France
Property holding and rental
New Look France SAS
France
Fashion retail
New Look Belgium SA
Belgium
Fashion retail
MIM Belgique
Belgium
Fashion retail
New Look Holland BV
Holland
Fashion retail
Singapore
Logistics and freight management
Republic of Ireland
Fashion retail
Germany
Fashion retail
Poland
Fashion retail
Cyprus
Intermediate holding company
People’s Republic of China
Fashion retail
New Look (Singapore) PTE Limited
New Look Retailers (Ireland) Limited
New Look (Germany) GmbH
Fashion Look Sp. z o.o.
Cenzora Enterprises Limited
New Look Commerce (Shanghai) Co. Limited
Note:
1. Pedalgreen Limited shareholding held directly whilst all others held indirectly through wholly owned subsidiaries.
A full list of subsidiary undertakings as at 29 March 2014 will be annexed to the Company’s next annual return.
During the financial period, NL Bowline Limited, NL Company No.1 Limited, NL Company No.2 Limited, NL Company No.3 Limited and Guernsey 4
Limited were placed in to liquidation and were struck off.
In addition, the Company has a 50% stake in the ordinary share capital of NLT Tekstil Sanayi Ve Ticaret Limited Şirketi, a joint venture incorporated in
Turkey, whose principal trading activity is retail manufacturing
133
6.
Creditors: amounts falling due within one year
As at
Amounts owed to Group undertakings
29 March 2014
30 March 2013
£m
£m
28.1
28.7
Other taxation and social security
0.1
0.1
Corporation tax
0.1
0.1
Liability for cash settled share based payments
1.4
—
29.7
28.9
Amounts owed to Group undertakings are interest free, are unsecured and repayable on demand.
7.
Creditors: amounts falling due after more than one year
As at
29 March 2014
30 March 2013
£m
£m
2.6
2.4
Other taxation and social security
0.1
0.3
Liability for cash settled share based payments
3.6
0.7
6.3
3.4
Other creditors
8.
Financial commitments
The Company had no capital commitments at 29 March 2014 (2013: none).
9.
Called up share capital
As at
29 March 2014
30 March 2013
£m
£m
2.0
2.0
Authorised:
200,000,000 Ordinary A shares of 1p each
1,000,000,000 Ordinary B shares of 1p each
10.0
10.0
12.0
12.0
Allotted, called up and fully paid:
157,617,228 Ordinary A shares of 1p each
1.6
1.6
879,126,079 Ordinary B shares of 1p each
8.8
8.8
10.4
10.4
134
NEW LOOK ANNUAL REPORT & ACCOUNTS 2014
New Look Retail Group Limited
Notes to the Company financial statements (continued)
9.
Called up share capital (continued)
On 9 May 2006, New Look Retail Group Limited was incorporated with 1 Ordinary share of £1 issued to Instant Companies Limited. On 19 May 2006,
New Look Retail Group Limited transferred the share to Permira Funds and issued 1 Ordinary share of £1 to Apax Funds so that it was jointly and equally
held. On 1 June 2006 each £1 Ordinary share was converted into 100 Ordinary B shares of 1p.
On 7 June 2006, to acquire shares of Pedalgreen Limited, a further 287,183,785 Ordinary B shares of 1p each were issued to Apax Funds and
a further 287,183,786 Ordinary B shares of 1p each were issued to Permira Funds and a coinvestor. 155,000,000 Ordinary A shares of 1p each
and the remaining 304,758,308 Ordinary B shares of 1p each, were issued to the remaining shareholders of Pedalgreen Limited. At that date the
Company became the ultimate holding company of Trinitybrook Limited as part of the Group reorganisation pursuant to the share for share exchange
arrangement, in which 100% of the voting shares of Pedalgreen Limited were acquired by New Look Retail Group Limited.
In the 2007 financial statements New Look Retail Group Limited took advantage of section 131 Merger Relief under the Companies Act 1985 in
preparing its financial statements. No share premium has been recognised on the issue of these shares.
On 30 April 2009 2,148,568 Ordinary A shares of 1p and on 21 August 2009 468,660 Ordinary A shares of 1p were issued at 25.0p for the purposes
of the 2008 Share Plan. The share premium arising from these issues is shown in note 10. The 2008 Share Plan is one of the Group’s share based
payment arrangements shown in note 31 of the Group financial statements and is operated through an ESOP discussed in note 11.
10. Share premium account
As at
Share premium as at 29 March 2014 and 30 March 2013
29 March 2014
30 March 2013
£m
£m
0.6
0.6
11. Treasury shares
The initial consideration paid for ordinary shares in the Company held by the ESOPs has been shown as a deduction in capital and reserves as treasury
shares. All other assets, liabilities, income and costs of the ESOPs have been incorporated into the financial statements of the Company.
The ESOPs have an independent professional trustee resident in Guernsey and provides for the issue of shares to Group employees, at the discretion
of the Trustee.
At 29 March 2014 the ESOPs held 115,809,649 (2013:102,914,649) Ordinary A shares of 1.0p each in the Company and 323,408 (2013: 323,408)
Ordinary B shares of 1.0p each in the Company.
As at
29 March 2014
Opening treasury shares
Share (purchased) / disposed of in the period
Closing treasury shares
30 March 2013
£m
£m
(21.9)
(22.1)
(1.4)
0.2
(23.3)
(21.9)
12. ESOP reserve
As at
ESOP reserve as at 29 March 2014 and 30 March 2013
29 March 2014
30 March 2013
£m
£m
0.7
0.7
135
13. Profit and loss account
As at
29 March 2014
Opening profit and loss account
Profit / (loss) for the financial period (note 3)
Share based payment (credit) / charge
Purchase of treasury shares and beneficial rights
Closing profit and loss reserve
30 March 2013
£m
£m
15.9
16.6
2.2
(0.8)
(0.1)
0.1
1.4
—
19.4
15.9
14. Reconciliation of movement in shareholders’ funds
As at
Profit / (loss) for the financial period (note 3)
Shares issued from/(to) ESOPs from treasury shares (note 11)
Purchase of treasury shares and beneficial rights (note 13)
Share based payment (credit)/charge (note 13)
29 March 2014
30 March 2013
£m
£m
2.2
(0.8)
(1.4)
0.2
1.4
—
(0.1)
0.1
Net movement in shareholders’ funds
2.1
(0.5)
Opening shareholders’ funds
5.7
6.2
Closing shareholders’ funds
7.8
5.7
15. Contingent liability
The Company is party to a cross guarantee on the UK borrowing facilities of the New Look Retail Group Limited Group, which amounts to £75.0
million (2013: £10.8 million) undrawn committed revolving multi-currency facility as at 29 March 2014. This facility expires in more than one year.
16. Related party transactions
The Directors of the Company had no material transactions with the Company during the period, other than the loans that were outstanding in connection
with their purchase of the beneficial interest in shares under the 2008 Share Plan as disclosed in note 36 of the consolidated financial statements.
17. Events after the reporting period
As permitted under the PIK facility agreement dated 14 May 2013, New Look Finance II Plc gave notice to debt investors on 23 April 2014 that the
Group intends to prepay an amount of the new PIK debt equal to a principal amount of £37.6 million plus accrued interest of £1.2 million and a
redemption premium of £1.2 million. The prepayment is due to be settled on 27 May 2014.
18. Ultimate controlling party
New Look Retail Group Limited is the ultimate parent of the Group, and is the largest and smallest group of undertakings to include these financial
statements in their consolidation. Apax Funds own 27.7% and Permira Funds own 27.6% of the total issued share capital. Copies of the financial
statements can be obtained from New Look House, Mercery Road, Weymouth, Dorset.
136
NEW LOOK ANNUAL REPORT & ACCOUNTS 2014
Contacts
Registered office
New Look House
Mercery Road
Weymouth
Dorset
England
DT3 5HJ
Tel: +44(0) 1305 765000
Fax: +44(0) 1305 765001
Website: www.newlook.com
Registered Number in England: 05810406
Investor relations
45 Mortimer Street
London
England
W1W 8HJ
Tel: +44(0) 20 3219 7000
Press office
45 Mortimer Street
London
England
W1W 8HJ
Tel: +44 (0) 20 3219 7000
Customer services
New Look House
Mercery Road
Weymouth
Dorset
England
DT3 5HJ
Tel: +44 (0) 500 454094
Independent auditors
PricewaterhouseCoopers LLP
Chartered Accountants and Statutory Auditors
Savannah House
3 Ocean Way
Ocean Village
Southampton
England
SO14 3TJ
Financial public relations
Tulchan Communications Group
85 Fleet Street
London
England
EC4Y 1AE
Tel: +44 (0) 20 7353 4200
137
Forward-looking statements
This annual report contains “forward-looking statements” within the meaning of the securities laws of certain jurisdictions, including statements under the captions “Overview”, “Strategic report”, “Business
model”, “Year in review”, “Financial review”, “Risks & uncertainties” and in other sections of this annual report. In some cases, these forward-looking statements can be identified by the use of forward-looking terminology, including the words “believes”, “could”, “estimates”, “anticipates”, “expects”, “intends”, “may”, “will”, “plans”, “continue”, “ongoing”, “potential”, “predict”, “project”, “target”, “seek”, “should”
or “would” or, in each case, their negative or other variations or comparable terminology or by discussions of strategies, plans, objectives, targets, goals, future events or intentions. These forward-looking statements include all matters that are not historical facts. They appear in a number of places throughout this annual report and include statements regarding our intentions, beliefs or current expectations concerning,
among other things, our results of operations, financial condition, liquidity, prospects, growth, strategies and dividend policy and the industry in which we operate.
By their nature, forward-looking statements involve known and unknown risks and uncertainties because they relate to events and depend on circumstances that may or may not occur in the future. Forward-looking statements are not guarantees of future performance. You should not place undue reliance on these forward-looking statements.
Many factors may cause our results of operations, financial condition, liquidity and the development of the industry in which we compete to differ materially from those expressed or implied by the forward-looking statements contained in this annual report.
These risks and others described under “Risks & Uncertainties” are not exhaustive. Other sections of this annual report describe additional factors that could adversely affect our results of operations, financial
condition, liquidity and the development of the industry in which we operate. New risks can emerge from time to time, and it is not possible for us to predict all such risks, nor can we assess the impact of all such
risks on our business or the extent to which any risks, or combination of risks and other factors, may cause actual results to differ materially from those contained in any forward-looking statements. Given these
risks and uncertainties, you should not rely on forward-looking statements as a prediction of actual results.
Any forward-looking statements are only made as of the date of this annual report and we do not intend, and do not assume any obligation, to update forward-looking statements set forth in this annual report.
You should interpret all subsequent written or oral forward-looking statements attributable to us or to persons acting on our behalf as being qualified by the cautionary statements in this annual report. As a result,
you should not place undue reliance on these forward-looking statements.
New Look Retail Group Limited, New Look House, Mercery Road, Weymouth, Dorset, DT3 5HJ, UK. Registered in England and Wales under company number 0581 04 06


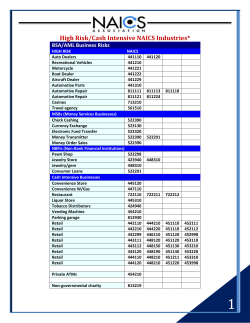


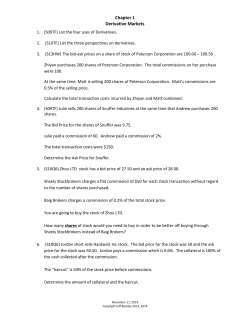


© Copyright 2026