
Going on a metal diet - Low Carbon Materials Processing
Going on a
metal diet
Using less liquid metal to deliver the same services
in order to save energy and carbon
Going on a Metal Diet in one page
Going on a metal diet
Using less liquid metal to deliver the same services in order to save energy and carbon
Julian M Allwood, Jonathan M Cullen, Mark A Carruth
Rachel L Milford, Alexandra C H Patel, Muiris Moynihan, Daniel R Cooper and Martin McBrien
Copyright © 2011 University of Cambridge
First published February 2011
ISBN 978-0-903428-32-3
The authors have asserted their right under the Copyright, Designs
and Patents Act 1988 to be identified as authors of this work
WellMet2050 is a £1.4m 5–year 8–person research programme at the
University of Cambridge, funded by the Engineering and Physical
Science Research Council (EPSRC) of the UK government to look at
all options to reduce global carbon dioxide emissions associated with
steel and aluminium. The project is supported by a consortium of over
20 global companies, with whom we are developing case studies,
demonstrators and analyses to reveal the emissions benefit, business
opportunities and technical challenges of a raft of emissions reduction
strategies.
Low Carbon and Materials Processing
Department of Engineering, University of Cambridge
Trumpington Street, Cambridge CB2 1PZ, United Kingdom
Phone: +44 (0) 1223 338181 Fax: +44 (0) 1223 332643
2
www.wellmet2050.com
Going on a metal diet
WellMet2050 is focused mainly on long-term strategies related to
material efficiency, and is currently exploring four themes:
▪▪ reusing metal without melting
▪▪ less metal, same service
▪▪ longer life and more intense use of metal assets
▪▪ compression of the metals manufacturing process chain
This report presents the research findings from the second theme.
Producing steel and aluminium is energy intensive, and releases
10% of the world’s CO2 emissions related to energy and processes.
Most of this energy is required at the early stages of the process—
to create liquid metal from ore or recycled scrap, and 100 years of
intense efforts by the industry have made this extremely efficient.
However, having invested so much effort to make the liquid, it
seems that we are rather extravagant in our use of it: around one
quarter of all liquid metal never makes it through the supply chain
into a product, but becomes scrap and is internally recycled with
further high-energy melting; for most products we could use
around a third less metal without seeing any loss of performance
during product use. Making products lighter can also give cobenefits for instance through saving energy in use or by allowing
lower weight design of other components in a system. We know
that global demand for the services provided by these top two
metals will continue to grow strongly, but it seems clear that our
consumption of liquid metal is already unhealthy. If we want to
make significant reductions in global carbon emissions we need to
consider Going on a Metal Diet.
We’ve found two key strategies for reducing our intake of liquid
metal: designing products that use less metal and improving the
‘yield ratio’ of metals manufacturing. We examined product design
with five detailed case studies—universal beams in construction,
food cans, car bodies, reinforcing bars and deep sea oil and gas
pipeline. In each case, we found we could deliver the same final
service with less metal, by pursuing one of four strategies: avoiding
over-specification; selecting the best materials; optimising whole
products; optimising individual components. We found plenty of
examples to demonstrate this happening in practice, including
the Velodrome for the London 2012 Olympic Games, planned
innovation in car doors, and the great success story of weight
reduction in drinks cans in the past 20 years. However, even though
our study suggests that we could potentially reduce product
weights by around a third, this hasn’t occurred because of a range
of constraints: the risk of under-design is often much greater than
the cost of over-design so clients, designers and producers all
tend to favour over-specification; even if metal requirements to
deliver a final service can be reduced, there may be other drivers
for increased use—such as robustness in handling, or stiffness
required during assembly; manufacturing/installation costs tend
to be reduced if parts are standardised and so over-specified; endusers see other benefits in over-design. Most of these constraints
can be overcome, but today’s practices reflect individual costoptimisation by existing businesses operating along long supplychains. The key to unlocking opportunities for saving weight in
design is to foster collaborative examination of component and
product designs along the whole supply chain.
of liquid metal required is more than double the final weight of
the product. This arises particularly from losses in blanking and
trimming. In exploring how we could reduce this waste, we’ve
found that there are plenty of technical options available—although
also some clear requirements for developments in manufacturing
processes—but we’ve also seen that most companies operating
within component supply chains are unaware of the total mass
being lost.
Our evidence suggests that for current uses of steel and aluminium,
we could reduce metal production by up to a third, through better
product design, and then by a further quarter through reducing
losses in manufacturing—and if both steps were achieved this
could halve our global requirement for liquid metal. The carbon
emissions consequence of this would be equivalent to halving
the number of cars used in the world. Yet this strategy hasn’t
yet had the profile of other, less significant abatement options.
To understand the business case for making this change, we’ve
examined the costs of material saving and predicted how much
manufacturers would be willing to pay for materials savings:
they would save on purchasing costs, could deliver user benefits
particularly in transport, but might incur additional manufacturing
costs. We found that, apart from aerospace, manufacturers
are more responsive to material cost savings than to use phase
savings. Further, it is generally the percentage of total costs rather
than their absolute value that determines manufacturers’ interest
in lightweight design and yield improvement. We also examined
the influence of existing UK government policies on material use,
and as a result have made policy recommendations that focus on
supply chain initiatives and raising awareness to create an appetite
for change.
Going on a Metal Diet has much greater potential for CO2
emissions abatement than the pursuit of further efficiency
measures in an already efficient liquid metals production process.
This report aims to raise awareness of that potential, to report
case studies of success, to identify specific opportunities, and to
propose means to overcome existing barriers.
We explored the opportunity for yield improvement by looking
at four related case studies, and we’ve walked backwards up the
supply chain—from the point at which the final user takes over
each product, back to where liquid metal was produced—and
added up the yield losses (scrap) and process energy involved. The
results are astonishing. For bulk metal products—universal beams
and castings, for instance—we lose only 10–20% of metal on this
journey. But for some products made from sheet metal, the mass
Going on a metal diet
3
Global flows of steel and aluminium
Reduction
Before we can begin to count the metal or carbon emission savings
from lighter products and more efficient manufacturing processes,
we need to first visualise the flow of steel and aluminium through
the production system.
Imagine the flow of steel and aluminium through society, starting
with the metal ores and scrap as sources and ending with the enduse products purchased by consumers. But instead of grouping
the metal flows by country, or company, or even economic sector,
think of the technical process steps that transform the metals
sources into final goods. Drawing global maps of this flow of
metal allows us to understand where large amounts of steel and
aluminium are being handled and therefore focus our efforts in
the areas which will make a big difference.
In our two maps—steel flow (right) and aluminium flow (following
page)—the flow of metal is traced from its source as ore or scrap
(left), through the production system, to the end-use products
purchased by consumers (right). Table 1 summarises the two maps
showing that in 2008, globally we produced 1400 million tonnes
(Mt) of liquid steel (including cast iron), and delivered 1040 Mt of
end-use products to consumers. One quarter of the liquid steel
is lost in the steel production system as scrap, most of which is
returned to electric furnaces, for recycling. For aluminium, the
tonnages are much lower, with 45 Mt of end-use products being
produced from 76 Mt of liquid metal, resulting in overall scrap loss
along the supply chain of 40%.
Blast furnace
Steelmaking
Oxygen
blown furnace
Global flow of steel
Casting
Rolling / Forming
Continuous
casting (slab)
Steel
Output (Mt)
Slab 640
Iron ore 994
Pig iron 928
Output (Mt)
540
Vehicles
CRC galv.
Tin mill
Mechanical 136
Industrial
equipment
Electrical 27
HRC galv.
Ingot
Direct
reduction
DRI 66
Scrap
preparation
End-of-life
scrap 240
Scrap
steel 568
Primary
mill
Plate mill
125
Electric
furnace
Hot rolled coil
HR narrow strip
Open
hearth
furnace
Plate
Continuous
casting (billet)
Rod and
bar mill
Billet 484
462
Liquid steel 407
Continuous
casting (bloom)
Section mill
94
Yield
Forming
Cladding 134
Welded pipe
Extrusion
Seamless tube
Reinforcing steel
in buildings 190
Construction
Reinforcing bar
Infrastructure150
Wire rod
Structural steel
in buildings 109
Hot rolled bar
Rail section
Light section
Packaging 9
Heavy section
76
Forming
1280
91%
54
72%
Steel product casting
Fabrication
1040
82%
45
82%
Iron foundry casting
59%
Observations from the metal maps
Appliances 29
Metal
products
Other 134
Cast steel
Cast iron
Cast iron
scrap
Table 1—Material yields for steel and aluminium production
Trucks 17
Other 11
Tin plated
Electrical strip
1400
74%
Cars 93
Galv. plant
CRC coated
Liquid steel 892
Liquid metal
Overall
Cold
rolling mill
Aluminium
Yield
End-use products
Global demand for steel products
= 1040 million tonnes
Cold rolled coil
Bloom 99
Process
Hot
strip mill
Fabrication
Global flow of steel in 2008
Values in million tonnes (Mt)
Forming scrap 98
© 2010 Cullen, Allwood et al.
Fabrication scrap 236
There is a vast difference in scale between the two maps of metal
flow, with the steel production system producing 23 times more
final goods than the aluminium system. In addition, a quick look
at the maps shows that the flow of steel is more complex than the
aluminium flow, especially in the forming steps.
For the map of steel flow (working from left to right):
▪▪ two-thirds of the liquid steel comes from iron ore and one-third
comes from recovered scrap
▪▪ Rod and bar mills have the highest throughput of steel,
producing reinforcing bar, wire rod and hot rolled bar; hot and
cold rolled coil are also significant
▪▪ the production of slab and billets dominate cast steel (>80%).
Most of the metal for slabs comes from iron ore, where as most
of the billet metal comes from recycled scrap
▪▪ Demand for products is dominated by the construction of
buildings and infrastructure (56%), with reinforcing steel in
buildings making up the largest fraction; further work is required
to understand the specific applications of steel in infrastructure,
including a breakdown of structure types and reinforcement use
▪▪ the original production route from ingot casting through a
primary mill has mainly been displaced by continuous casting
▪▪ Industrial equipment (16%), metal products (16%) and vehicles
(12%) are the other three major end use groups
▪▪ the forming of slab products (i.e. rolled coil) is complex and
involves many process steps—each subsequent handling of the
4
metal results in additional energy input and yield losses
Going on a metal diet
And from the map of aluminium flow:
▪▪ half of the liquid aluminium comes from bauxite ore and the
other half from recycled scrap
▪▪ liquid aluminium from alumina is almost entirely used in the
production of wrought products, which make up two-thirds
of all cast aluminium; the remaining third is used to make cast
aluminium products (in contrast to only 8% of liquid iron and
steel used for cast products)
▪▪ Some larger products at end of life (e.g. curtain walls and
window framing) are remelted for wrought products, however
most scrap cannot be cleanly separated by alloy and is suitable
only for refining, where silicon is added (up to 13% by mass)
preventing any future recycling to wrought products—a form
of down-cycling
▪▪ the yield in forming processes is lower for aluminium (72%) than
steel (91%), due to the additional scrap made when scalping
and trimming aluminium ingots and because of the higher
quality surface finish required for aluminium products
▪▪ cold rolled sheet/strip, extrusions and die castings are the
highest volume semi-finished products
▪▪ demand for end-use products is divided into 4 approximately
equal groups: vehicles (27%), industrial equipment (21%),
construction (24%) and metal products (28%)
▪▪ aluminium in buildings is divided into structural applications (e.g
curtain walls, sidings, entrances) and non-structural applications
(e.g. window frames, guttering)
Using less liquid metal to deliver the same services in order to save energy and carbon
5
Global flow of aluminium
Recovery of scrap metal
Table 2 shows the breakdown of metal sources used to make
liquid steel and aluminium, allowing the differences in the
liquid metal production routes to be analysed. The most
striking observation is that more scrap is collected from the
manufacture of products (forming and fabrication scrap) than
from the discard of post-consumer products (end-of-life scrap),
yet the potential for reducing industrial scrap is often overlooked
in discussion of efficiency options in the metals industry.
Liquid metal
sources
Steel
Mt
38
50%
Scrap
500
36%
38
50%
90
15%
20
26%
Fabrication scrap
236
6%
11
14%
End-of-life scrap
240
15%
8
10%
Less melting losses
–66
–1
100%
76
Scrap from the casting processes is returned immediately to
the caster for remelting. Scrap from forming processes is also
rarely traded but instead remelted in the casting furnace.
Records of such internal scrap flows are kept by each company
but are typically not reported in national or international data
sets on steel and aluminium production. Internal recycling
loops are typically clean and well segregated and make little
difference to the overall material yield of the process, provided
the scrap metal is efficiently collected and handled. However,
remelting of scrap metal, often several times over in the
same casting process, increases the overall energy input. Our
observation is that companies are often unaware of the energy
savings possible from reducing internal recycling loops.
Fabrication scrap is normally traded on the open market, but in
contrast to forming scarp, is often contaminated with cutting oils
and not segregated by alloy. This suggests there is an opportunity
for metal producers to deliver semi-finished products that are
closer to the shape required for the end-use product, thus moving
some of the scrap creation from fabrication to forming, where it
can be controlled more carefully. Table 2 shows the fractions of
scrap derived from forming and fabrication processes are lower for
steel than for aluminium.
For end-of-life scrap this trend is reversed and now steel scrap
makes up a larger fraction of the liquid metal input. This may result
from the higher recovery rates for discarded steel products—
steel products are typically larger than aluminium products and
can be separated from other waste magnetically—however the
amount of material recovered is also influenced by how quickly
metal demand has grown in the past. Technologies to improve the
recovery of aluminium from discarded goods, and in particular to
separate out different metal alloys, need to be developed further.
Going on a metal diet
Ingot 48
(for wrought)
Hot
rolling mill
26
Cold
rolling mill
Fabrication
Foil
mill
15
End-use products
Global demand for aluminium
products = 45 million tonnes
Foil
Vehicles
Plate
Mechanical 3
Industrial
equipment
End-of-life
scrap 8
Fabrication
scrap 11
Forming
scrap 20
Liquid aluminium 12
Wire drawing
4
Refiner
Casting
Secondary
casting
Liquid aluminium 26
Ingot 26
(for cast)
18
Electrical
cable 4
Electrical 2
Extrusions
9
Remelter
Cars 8
Other 4
Cold rolled sheet / strip
Hot rolled strip
100%
Table 2—Sources of liquid steel and liquid aluminium
6
Liquid aluminium 38
Rolling / Forming / Casting
Extrusion
64%
1400
Alumina 39
Casting
Mt
900
Liquid Metal
Electrolysis
Casting
Aluminium
Ore
Forming scrap
Electrolysis
/ Melting
Cable / wire
Structural
in buildings 5
Construction
Infrastructure 1
Die castings
Drinks cans 3
Permanent mould castings
Sand castings
Other
Non-structural
in buildings 5
Metal
products
Packaging foil 3
Consumer
durables 3
Other 4
Global flow of aluminium in 2007
Values in million tonnes (Mt)
© 2010 Cullen, Allwood et al.
The maps show annual flows of metal, and do not show stocks
of metal in use. Scrap from forming and fabricating processes
appears as loops in both diagrams, as these flows occur within
a single year. However end-of-life scrap is introduced as an input
to the left side of the diagrams, disconnected from the delivery
of metal into use on the right side—because most metal goods
last for more than one year. At present, global demand for both
metals is growing rapidly, so end-of-life sources of metal are small
compared to total demand. In future if global demand stabilises,
the need for new primary metal will be greatly reduced.
Reducing demand for liquid metal
This report identifies two key strategies for reducing demand
for liquid metal: designing products that contain less metal and
reducing the scrap created in metals manufacture. If all products
were re-designed to use less metal the whole map would contract,
apart from the flow of end-of-life scrap entering on the left side.
However, if manufacturing scrap were reduced, the total demand
for liquid metal would be reduced, but this would have little
impact on total primary metal production: reducing scrap leads to
a reduced flow into recycling. Predicting the emissions abatement
effect of these two strategies therefore depends on carefully
predicting their influence on total metal flows.
Creating the maps of metal flow
The maps of global metal flow are presented as Sankey diagrams, a form first
used by the Irish engineer Riall Sankey in 1898 to show the thermal efficiency
of a steam engine. In our maps, the width of each line is proportional to
the mass flow of metal. Values for the major flows are given in Mt (million
tonnes). Steel flows less than 1 Mt and aluminium flows less than 0.05 Mt are
not shown. Each major process step is shown by a vertical black line, with
three possible outputs: useful metal (coloured), process scrap (grey) and
metal losses (black). Useful metal continues to flow to the next process step,
while scrap loops back to the appropriate melting stage where it is recycled.
Internal recycling loops, for example from the continuous casting processes
for steel, are shown as small oval loops. Most of the metal losses are due to
formation of dross and scale in hot metal processes.
Several different data sources were used to create the diagrams. For the
steel map, the World Steel Association publish production figures1 and
process yields2 for reduction, steelmaking, casting, and rolling/forming.
This was supplemented with data from: IPIA for the electric furnace inputs;
Modern Casting for iron and steel casting; Steel Business Briefing for steel
flow interactions; and EUROFER and the WellMet2050 consortium for enduse products. For the aluminium map, data is sourced primarily from the
International Aluminium Institute material flow model3 which provides an
overview of the main process flows and estimates of forming and fabrication
yields by end-use product. Scrap allocation to remelting and refining is
scaled from European data from the EAA. The Aluminum Association provide
a breakdown of end-use products which is supported by data from the
WellMet2050 consortium.
The mapping of ‘semi-finished products’ (strip, plate, pipe, bar and sections)
onto end-use products is particularly complex, with most end-use products
requiring several different types of stock for fabrication. International
survey data is collected for processes up until the end of the forming step,
however data for the fabrication step is scarce, and is solved using regional
breakdowns, mass balancing and expert opinion. The boundary between
forming and fabrication is not always clear (i.e. tube welding could be classed
in either category) and forming sometimes occurs in smaller facilities which
fall outside the coverage of statistical surveys (i.e. hot rolled aluminium strip
may be rolled further into cold rolled strip).
The working papers Global flow of steelW1 and Global flow of aluminiumW2 give
more detail about creating the Sankey diagrams.
Using less liquid metal to deliver the same services in order to save energy and carbon
7
Designing products with less material
Lightweight design aims to use less material to deliver the same
services. Potentially this offers a significant opportunity to reduce
demand for steel and aluminium, so could be an important
abatement strategy for CO2 emissions. To what extent are attempts
being made to reduce the weight of existing products, and what
is the potential for further application of lightweight design to
reduce demand for liquid metal?
Our interest in lightweight design is motivated by the need to
reduce requirements for liquid metal. However, lightweight
design has other benefits: the fuel efficiency of road vehicles is
dependent on their mass, so future efficient cars and trucks must
be lighter than contemporary designs; in large static structures,
such as buildings, a significant fraction of total load is self-weight,
so a reduction in structural weight in some parts of a structure
may allow a reduction in loading specifications elsewhere; for
moving products, weight reduction may give benefits beyond
energy efficiency, such as car agility and handling or aircraft
range. As a result of these co-benefits, aeroplane and racing
car designers are the experts on weight saving, and future gains
in these applications will have limited effect. However, in other
applications, weight saving has had less attention to date, and our
interest is to identify opportunities for significant future savings.
The box below lays out an overview of the technical approach
to designing materially efficient components: consolidate loads;
don’t over-specify; align components with loads to minimise
bending; choose the best materials; optimise the cross-section
of components subject to bending. These strategies apply at
different stages of the design process, and could potentially lead
to considerable reductions in metal use, without loss of service.
To what extent have these approaches been deployed to date,
and how much of the liquid metal entering use per year could be
saved by wide-spread pursuit of these principles for lightweight
design? In order to explore the reality of material saving through
efficiency design, we’ve examined five case studies—universal
beams, food cans, car bodies/crash structures, deep-sea oil and
gas pipeline, and reinforcing bar. Globally, annual production
of these components accounts for around 400 Mt of steel and
aluminium, nearly 40% of total production.
The picture (below left) shows the simplest example of this—a point load
supported some specified distance from a wall. A typical requirement in design
is to support the load either with only a given deflection, or to ensure that the
support won’t fail even if the load reaches some peak value. The cheapest way
to provide the support is usually to have a beam with constant cross-section,
because it’s easier to manufacture standard parts than custom ones. But if the
beam is constant thickness, much of it is used inefficiently—it would be better to
have more depth nearer to the wall, and less nearer the load. In fact, we can show
that if we are allowed to vary the depth of the beam along its length, we could
provide the same stiffness with 11% less weight, but at the cost of increased
depth.
Remember that bending is the problem—it’s always better to load a member
along its length than to allow it to bend. So, for our simple example, what if we
change the design, and use a simple pin-jointed pair of members to support the
same load (below right). In this design, the loads are aligned with the members,
and our material requirement depends only on the angle between them. For
a given distance from the wall, it turns out that the best value of this angle is
110° and compared to the original beam we can use 98% less material and still
have the same stiffness (this includes a bracing strut to prevent buckling of the
compression member).
Our simple example is for a point load supported in one-dimension, but similar
observations apply for more complex structures. We can also show that if two
nearby loads must be supported, we always need less material if we support
them in one structure, rather than supporting them separately.
Our simple example allows us to propose the following technical principles for
materially efficient lightweight design with steel and aluminium:
Universal
beams
In this case study, several alternative designs of beam have been considered for a set of standard load cases, to estimate
the mass saving possible through optimised design. The beam designs analysed are shown in the figure and comprise:
standard I-beams; composite floor beams where the concrete floor slab is part of the bending system allowing a smaller
steel section; open-web joists which are truss structures suitable for lighter loads such as roofs; cellular beams where
shaped cells are cut from the web of the beam to save weight; variable cross-section beams where the beam depth or
width varies and is optimised for a given loading.
Using composite floor beams as a benchmark for the floor load cases, and a standard universal beam for the roof load
cases, weight savings of at least 30% could be achieved, with higher weight savings possible in cases where composite
floor beams are not currently in use.
Composite
floor beam
Open-web
joist
Cellular
beam
Variable cross-section
beam
Deep-sea oil and gas pipeline consists of large diameter pipe, manufactured from high grade steel plate. Operating at
depths of over 2 km, the pipe is subjected to a large hydrostatic crushing pressure, but in service the oil or gas in the pipe
is pumped at a pressure similar to the external pressure, so the pipe experiences only a small differential pressure. The
stresses on the pipe during installation are actually much higher than those in service, and it is these installation stresses
that limit the options for reducing the weight of the pipe.
Deep-sea
pipelines
Deep-sea pipelines are frequently installed using the ‘J-lay’ method. The pipe ‘string’ is hung vertically from a laying barge
and allowed to fall to the sea floor. As the barge moves forward, new pipe sections are welded to the string end. This
method is chosen as it allows accurate location of the pipeline on the sea floor and reduces the barge requirements
compared to other installation methods. However, installation by the ‘J-lay’ method generates two sources of stress: large
compressive stress due to water pressure (the pipe itself is empty) and large stresses due to bending of the pipe.
In this case study, methods of pressurising the pipeline internally during installation were assessed by static analysis and
the results indicate that pressurising the pipe with gas at a pressure equal to the external pressure at the sea floor could
reduce the weight of the pipe by 30%. However, requirements for corrosive protection may reduce these savings to 10%
and generating internal pressure in the pipe may lead to unacceptable health and safety risks.
▪▪ support multiple loads with one structure
▪▪ don’t over-specify the loads
▪▪ align components with the loads as much as possible
▪▪ choose the best materials
▪▪ optimise the cross-section of any component subject to bending.
L
F
Standard universal beams are the key components of steel-framed buildings. They are designed for bending stiffness,
and used as horizontal beams to support floors or roofs. They are manufactured in a standardized set of geometries,
listed in catalogues provided by steel producers. However, their constant cross-section geometry is chosen for ease of
manufacture, so not be perfectly efficient. Furthermore, part of the building design process is a ‘rationalisation’ phase to
reduce the number of beam sections required on site—to simplify logistics, fabrication and construction management—
and this leads to further inefficient material use.
Standard
I-beam
Principles of lightweight design
The engineering basis for lightweight design is surprisingly easy to explain: it’s
all about bending. A metal strut, cable or bar loaded along its length is perfectly
efficient—all the material is used to the limit of its capability. So, whether the
design is limited by stiffness (flexibility) or strength (maximum load), loading
along the length of the member is always best. However, we are often constrained
in our choice about how to support a load—and whether it’s the floor of an office
block, the wing of an aeroplane, or the arm of a crane, we may not be able to
support a load in-line, and this gives rise to bending.
Case studies
F
Car body structures include elements to improve crash safety, which deform during a collision to dissipate energy
through plastic work. Body shells of modern cars are typically made of steel or aluminium and for a lightweight crash
structure, both the selection of a suitable material and the design of the crash element are important. The key performance
requirement for crash structures is the specific energy absorption—the amount of energy absorbed per kilogram of
material. Materials such as aluminium foams, carbon fibre composites and magnesium all demonstrate high specific
energy absorption when compared to high strength steels and aluminium alloys. However, replacing steel and aluminium
with lighter materials does not necessarily provide an emissions saving, as production of other materials may have led to
greater carbon emissions.
Car body /
crash structures
It is difficult to analyse the whole car body structure to find possible weight savings, however reports in the published
literature suggest that savings of between 20% and 40% will be possible over the next 5–10 years, principally through the
substitution of superior alloys and new materials, in particular aluminium and magnesium. This agrees with the aims of car
makers such as Jaguar Land Rover, who aim to reduce the weight of car doors by 30% within 5 years.
8
Going on a metal diet
Using less liquid metal to deliver the same services in order to save energy and carbon
9
Case studies
Rebar
Food cans
Understand component service
needs and avoid over-specification
Around 100 billion food cans are produced each year. In contrast to beverage cans, which have seen a weight reduction
of around 20% over the past 30 years, the food can has seen only modest decreases in weight, and remains around
30% heavier than a beverage can of equivalent volume. Lighter cans could be produced using existing manufacturing
equipment, simply by substituting thinner gauge material in the can bodies and ends, but this has not been done. Why
is this?
Most component designs must provide
more than one service, but if material use
is increased by requirements prior to final
use, look for alternative solutions. Ensure
that use-phase design loads accurately
reflect those experienced in-service with
one appropriate safety factor.
The performance specifications of the food can are dictated the downstream processing requirements, where the food
manufacturer fills the can, caps it, then sterilizes the contents in a cooking process known as “retorting”, before stacking
the cans to great heights for storage. During the retorting process, the can experiences an implosive pressure of around 1
bar, followed by an explosive pressure of nearly 3 bar, and when stacked the can must withstand large compressive forces
axially. This differs from the treatment of other food packaging—aluminium pouches, plastic pots and Tetra PakTM—which
are sterilized in a balanced retorting process at pressures of around ±0.5 bar, are boxed instead of stacked, and generally
handled more carefully. If the same were true for food cans, the can body could be made 30% lighter, and in some cases
can ends could be replaced by foil closures reducing the weight of the ends by more than half.
Further details for each of these five case studies can be found in the working papers.W3–W7
In all the case-studies considered here, weight savings of 15–30%
were found to be possible. In the case of the I-beam and the car
crash structure, this was through reconsidering the design, and in
the case of the car body, through selection of higher performance
materials. For the food can and deep-sea pipeline case-studies,
the installation and supply chain after manufacture must also
be considered, and it is redesign of these elements that enables
lighter weight designs to be adopted. With reinforcing bar, the
saving is provided by a combination of material upgrade and
design optimisation.
Table 3 summarises our estimates of potential weight savings,
and on page 14, we’ll use these figures to estimate the savings
in CO2 emissions that would be achieved by reducing liquid metal
requirements by this amount.
On page 6 we set out a technical basis for lightweight design,
and looking at the case studies has allowed us to expand our
Universal
beams
Potential savings Mt
Deep-sea
pipeline
Car body
crash str.
Rebar
Food
cans
49 25
48
170
8
8–21
3–8
10–20
51
2
20–50%
10–30%
20–40%
30%
30%
Table 3—Summary of lightweight design case studies
10
Starting from the technical principles on
page 6, and having learnt from the
case studies and examples of successful
light-weighting, we can propose a set of
technical strategies for light-weight design:
Material selection
Advanced alloying has led to steady strength
increases for both metals. However, many components are stiffness constrained and within the
steel or aluminium family there is little possible
variation in stiffness. There are few material
alternatives to steel and aluminium available in
similar volume, and most of those have higher
embodied carbon emissions.
Product integration
Lessons learnt
Global demand Mt
Technical strategies
Steel bar is used extensively to provide structural reinforcement for concrete in buildings and infrastructure. In China,
which accounts for around 60% of global demand for reinforcing steel bars (rebar), the use of low strength rebar (~335 MPa)
is still common, whereas in Europe the use of higher strength rebar (400–500 MPa) is normal. Specification of rebar is
constrained by strength (rather than stiffness as in the Universal Beam example above.) There are two opportunities for
steel savings in reinforcing bar. The first is to upgrade all Chinese rebar, from the current mix of strengths to 500 MPa, which
we calculate would save 23 Mt or 13% of global rebar production. The second is to optimise the sizing and placement of
reinforcing systems, saving a further 15% of global production, assuming optimised rebar solutions could be used in 65%
of building projects and 50% of infrastructure projects. Companies such as Qube offer optimised reinforcing solutions but
are yet to gain significant market penetration (see box story on page 10).
Going on a metal diet
understanding of the decisions that influence design weight, and
the constraints that currently inhibit more aggressive adoption of
lightweight designs. We’ve summarised what we’ve learnt from
the cases on the opposite page.
Two issues have arisen in each case, which must be addressed if
we are to realise the savings in liquid metal production that we
believe are possible. Firstly, we’ve seen that the service provided
by metal components is often multi-faceted—so even when
components appear to be over-specified for their final use-phase,
this was chosen to meet other performance criteria: the food
can must withstand higher pressures during retorting than on
the shelf, and the deep-sea pipe must stand higher stress during
laying than when pumping gas or oil. Secondly, there is a strongly
asymmetric risk associated with lightweight design—it is generally
much cheaper to incur extra material costs for an over-performing
component than to carry the risk of component failure. As a result,
designers are inherently conservative, and in the long supplychains of metal products, this conservatism tends to be applied
additionally at several stages.
If we want to achieve the material savings that appear possible
from these case studies, we need to address both these issues. It
appears that the key to this is collaboration along metals supply
chains – so that final product designers, components suppliers,
and all decision takers between liquid material and final use,
collaborate in the definition of material service and the assessment
of risk.
Designs should be optimised at the product
level, before the component level, to seek
and exploit opportunities for integrating
multiple functions into the same components
where possible. Aim to layout components to
minimise bending loads.
Component optimisation
Once design specifications are known
for individual components, they can be
optimised. For axially loaded components
this is simple. For components loaded in
bending, any material saving benefit depends
on a materially efficient manufacturing route.
Co-benefits
Use-phase emissions
In applications where the product moves, for
example cars and aeroplanes, the use phase
emissions can be significantly reduced by
light-weight design
Constraints
Despite opportunities to save weight, the
technical strategies may not be adopted,
due to constraints at every stage of a product
life-cycle from specification to disposal:
Design specification and risk
Asymmetric risk tends to promote
over-specification at every stage of product design
and production. Uncertainty over future use
requirements may lead to over-specification, and
in some cases loads may not be well understood,
so must be over-specified or may be specified
from over-conservative codes of practice.
Component service required before use
Service requirements prior to the use-phase,
for instance to withstand loading during production, distribution or installation, may drive
a requirement for increased mass compared to
that required purely for service loading.
Manufacturing route
Economies of scale have driven development
of extremely efficient production processes for
standardised components. Production of more
optimised parts may be costly, or may depend
on extensive material removal (as happens
for example in aeroplane manufacture) so
that a light-weight design does not equate to
reduced material requirements.
Consumer perceptions
In some markets, final customers may have
negative perceptions of light-weight designs, for
example if a heavier car conveys a sense of luxury.
End-of-life trade-off
Optimised components may be more difficult
to re-use than standardised components
Use-phase performance
Weight reduction in certain products leads to
better use-phase performance, for example,
improved braking and road-handling for
light-weight cars
Compounding weight saving
The use of light-weight components
in part of a product may allow a
reduction in the loads and hence sizes
of components elsewhere.
Using less liquid metal to deliver the same services in order to save energy and carbon
11
Reinforcing steel optimisation
robotically manufactured with the reinforcement read from
Reinforced concrete designs generally include a degree of
to accurately match the moment envelope significantly
‘rationalisation’ in the selection and layout of reinforcing
steel, i.e. bars of same diameter and same spacing are
used across large areas to facilitate detailing, identification,
laying and checking of the installed reinforcement. This can
typically add between 15% and 30% more reinforcing steel
than is strictly required to meet performance and code
requirements. Qube Design minimise this over-specification
by using an advanced finite element approach for designing
and detailing reinforcement using the Bamtec prefabricated
rolled reinforcement carpet system. Bamtec carpets typically
comprise smaller diameter bars (including in addition to
normal stock ranges: 14, 18 and 22 mm dia) which are placed
at a reduced spacing to achieve the same reinforcement
area required by the design. Bamtec ‘rolled carpets’ are
reducing the degree of rationalisation in the slab, without any
loss of stiffness, and with increased crack control. Each bar is
spot welded to thin gauge steel straps during manufacture
and rolled, pre slung for lifting and placement allowing
for quick roll out on site. Using the rolled carpets, together
with prefabricated edge curtailment and cages results in
up to 95% of the installation being manufactured offsite.
The combination of Qube’s approach to design, and the
Bamtec carpet system is an attractive example of intelligent
innovation leading to real material savings. Significant
material and fixing savings can be achieved, and the system
may also give health and safety benefits and improved quality
control, due to offsite manufacture.
the detailed drawings. Complex sequences of bars are used
Reducing manufacturing scrap
The architects for the Velodrome had a vision for a minimum
structure building ‘shrink-wrapped’ around the sport and
spectators. As a result the geometry was governed by the
track layout and sightlines to it; this ‘saddle’ shape was also
suitable for a lightweight cable-net roof system where the
steel is used in tension to efficiently span the 130 metres
between supports. Despite some initial concerns about costs
The Aquatics Centre was awarded to a signature architect to
be an iconic building for the London 2012 Games. The roof
is a key element—‘an undulating roof sweeps up from the
ground as a wave’. Its geometry constrained the structure
to a conventional truss system. Despite being highly
optimised during design—up to 95% utilisation in places—
the roof is still over five times as heavy as the Velodrome’s,
which is of a similar span and area. This demonstrates the
importance of having a lightweighting ethos from the very
initial stages: finding a favourable form at the start yields
greater savings than highly refining a heavier option later on.
(Images: London 2012)
▪▪ a car door panel—made from either steel or aluminium
▪▪ an aluminium beverage can (excluding its lid)
▪▪ an aluminium wing skin panel for an aeroplane
In each case, we’ve visited production sites all along the supply
chain, starting from the final component, and proceeding
upstream until we reached the source of liquid metal. At every
stage, we gathered data on process yield losses, energy and CO2
emissions to try to build up a complete picture of the metal flows
and energy inputs to each component. Inevitably, some of this
data is commercially sensitive, some was unknown – for instance
where energy metering is applied at site rather than process level,
and some had to be deduced from aggregated numbers.
Collecting figures for yield losses was particularly challenging as
they can be defined using several different combinations of input
and output flows, as shown in the graphic above. This matters
most for melting processes—where it is easy to return scrap
straight back into the same process. At one site, where liquid metal
is cast into discrete ingots, we watched as up to 20% of each
batch was poured into a pit, once the ingot was of the required
size. This metal wasn’t lost—once cooled, it was fed back into the
next batch for re-melting—but of course the energy required is
determined by the total mass melted, not the total useful mass
poured. We’ve therefore defined yield losses as any metal entering
a process that isn’t immediately passed downstream to the next
process.
All the case studies are described in greater detail in our working
paper: The effect of yield losses on embodied CO2 emissions in
four case study metal products.W8
Understanding the link between
yield losses and embodied energy
We’ve presented the results of our case studies on graphs showing
how the ‘embodied energy’ in a component (the total energy
required to make it) builds up while the mass of metal decreases
due to yield losses. The figure below shows how these graphs
work. The x-axis shows that if the production process started with
Case study
product
15
10
5
0
0
0.2
20
30
Cumulative energy
(GJ/ t output)
40
20
50
▪▪ a steel I-beam
Loss = 1 - Yield
C
uc t
rp od
ed
ish
Fin
Process
B
C
ene
rgy
As use-phase CO2 emissions from buildings are reduced,
through energy efficiency measures, more attention is
being focused on the embodied carbon emissions from
construction. For the London 2012 Olympic Park more
than 90% of the embodied carbon comes from just three
construction materials—concrete, reinforcing steel and
structural steel—each accounting for approximately 30% of
the total.4 An effective means to reduce embodied carbon
in construction projects is for clients to set targets early on
in the design, preferably in the brief. Here the approaches to
lightweighting in the Olympic Velodrome and the London
Aquatics Centre are contrasted.
and risks, the contractor saw great cost and programming
savings in this system and together with the design team,
convinced the client to accept it. Using the cable-net roof
resulted in a 27% steel tonnage saving over an alternative
steel arch option. Additional steel savings were made by
combining the roof, stand and façade support systems and
by undertaking advanced dynamic analysis on the seating
structure to show it performed within accepted limits despite
being lighter than code recommendations.
Due to the huge variety of final steel or aluminium component
shapes in use, we can’t provide a general analysis of all yield
losses. So to gain some insight into the potential for future yield
loss reduction, we’ve conducted a series of case studies—hoping
to identify useful opportunities to modify process chains and
component designs. Our case study components are:
Metal to down stream processes
Sum of all process inputs
em
bo d
ied
London 2012 Olympic Park
When we manufacture plastic toys by injection moulding, or
concrete buildings by pouring into formwork, yield losses are very
low. For plastic and concrete, the final properties of the material are
achieved during solidification, so no other processing is required.
For steel and aluminium, this isn’t the case. The properties of metal
that is poured and cooled with no other processing are generally
very poor compared to those that can be created through a
controlled sequence of heating, deformation, and cooling. As
a result, the supply chain for these metals is long and is usually
configured in two major stages: intermediate products of general
shapes, for example bars, plates and coils, are made by a complex
processing chain, to achieve high quality uniform properties; final
components are manufactured from this intermediate stock, by
shaping, material removal or joining, to give required geometries.
This two-stage approach has evolved over a hundred years, and
has allowed a steady and remarkable increase in properties, but
risks considerable yield loss if intermediate products are far from
the geometries of final components.
Yield =
To upsteam
processes for
recycling /
reprocessing
Internal reprocessing
tan
t
Based on early bogie development work by British Rail
Research in the early 90’s, Bombardier’s FLEXX Eco-Bogie
(previously known as the B5000 bogie) is an example of
successful component lightweighting in the rail industry.
The integrated design reduces bogie weight by 30% (see
blue verus grey in plan view), saving approximately two
tonnes per bogie. More importantly for track damage, the
unsprung mass—that is the mass that is in direct contact
with the rail with no suspension—is reduced by 25%,
approximately 1 tonne per bogie. The FLEXX Eco-Bogie was
developed as part of Bombardier’s ECO4 Energy, Efficiency,
Economy, Ecology initiative and aims to deliver savings in
energy costs, network access charges and maintenance
costs. Bombardier estimate that the new bogie results in a
25% lifecycle cost saving. In the UK, where expected track
damage influences network track access charges, access
charges for the lightweighted bogie are expected to be
reduced by 17% in the 200 km / hr 16 tonne axel load class
compared to a conventional bogie. The lightweighted
bogie design is suitable for commuter, regional and highspeed rail applications. Over 1000 units are in operation
worldwide including in the UK under Voyager and Meridian
trains. Further units are being manufactured for the
Norwegian Railways (NSB) and for the new generation of
Bombardier Turbostar.
From downstream
processes for
recycling /
reprocessing
of c
ons
FLEXX Eco-Bogie
Loss
Process
I
rod
te p
a
i
ed
rm
nte
Pro
ces
sA
Adding
energy
Con
tou
rs
How much can we really reduce yield losses?
To downstream process
From upstream process
Cumulative process energy (GJ / t liquid metal)
Liquid metal production is the most energy intensive stage in
making metal components, so has had most attention, and is by
now highly energy efficient. However, total demand for liquid
metal is driven by a combination of final product mass—the
previous section explored ways to reduce this—and yield losses
in production. Any scrap, whether from scalping ingots, trimming
rolled coils, machining blocks, blanking sheets prior to pressing, or
from errors and defects, is a form of yield loss. The global metal
flow Sankey diagrams at the beginning of this report suggest
that if we could reduce all yield losses, we could reduce total
requirements for liquid metal production by 26% and 41% for
steel and aluminium respectively.
Reducing yield
0.4
0.6
Liq
0.8
uc t
B
10
B
ta
me
uid
lA
1.0
Cumulative yield (t output / t liquid metal)
Graph of cumulative energy against cumulative yield (example)
12
Going on a metal diet
Using less liquid metal to deliver the same services in order to save energy and carbon
13
Car door
panel
25
ed
mp
pa
Sta
nke
B la
oil
dc
led
rol
d
l
Co
l
coi
0
0.2
0.4
0.6
0.8
1.0
Cumulative yield (t output / t liquid steel)
n ent
chi pon
a
M com
185
dg
We
d
ape
-e sh
lar
gu
n
a
t te
Rec pla
te
pla
te
pla
ep d plate
rop lled
ec
dE g Hot ro
o
db
me
m
Tri
Car door
panel
s
Cup
d
nke
ls
coi
Bla
175
The steel energy / yield graph
We started by assuming that one tonne of liquid steel has an
embodied energy of 18 GJ / t. This is typical for UK steel, equivalent
to liquid steel produced via the blast furnace followed by oxygen
blown conversion with a 20% scrap content. The graph clearly
shows the impact of yield losses on the embodied energy of the
products—around 23 GJ / t for the beam, but nearly 55 GJ per
tonne for the car door panels. Remembering the two stages of
metal supply chains, the I-beam has a much shorter chain—with
standard sections rolled by the steel-maker, so the second stage
(fabricating) requires only a few operations such as trimming to
length and welding on end-plates. This gives yield losses of only
10%, and is in marked contrast to the 50% losses for the door
panel made from cold-rolled strip, which has a longer supply chain
with high yield losses in blanking (door panels do not tessellate
well) and stamping (window voids are cut from the part, and
edges are trimmed after deep-drawing.)
In order to draw attention to the impact of yield losses on embodied
14
Going on a metal diet
energy, we have assumed that the liquid steel is made with 20%
scrap for both products. Clearly, if this fraction is changed, the
energy required to manufacture liquid metal changes, and the
whole graph will shift up or down. However, because this first
step on the graph dominates the cumulative energy input, the
interpretation of the graph remains the same – yield losses in the
supply chain significantly increase the embodied energy in final
components.
165
ot
ing
l
coi t
lo aled ingo
i
c e
d
Slit Ann calpe
S
oil il
lS it c led co l
rol
coi
oC ld olled
tr
Ho
t
o
ing
d
e
is
gen
mo
o
H ot
ing
aC st
o
ing
aC st
ot
ing
d
e
t ot
t
hea ng
go
Pre lped i n in
Saw
Sca
170
one tonne of liquid metal, the mass remaining reduces after each
process due to yield loss. The y-axis shows how the cumulative
energy embedded in the product builds up with each additional
process step. We’ve normalised both axes by the mass of metal
originally cast to give meaning to contours with a constant
ratio of x to y: these contours show the energy intensity of the
product—cumulative energy up to each production stage divided
by the mass remaining at that stage. Typically, these graphs will
show that the (already energy efficient) process of liquid metal
production dominates the cumulative energy build-up, but yield
losses in the downstream supply chain can increase the embodied
energy in the final component by a factor of up to 10.
Cumulative energy versus cumulative
yield for aluminium case study products
ed
eat
rP eh
ls
ane
p
ed
mp
Sta
u
Liq
0
0.2
0.4
Aluminium
energy /
yield graph
te
e
pla plat
d
d
e
t
e
Tes treat
at
He
Beverage
can dy
180
Cumulative energy
(GJ/ t output)
200
300
400
5 00
1000
Wing skin
panel ed
l
coi
l
coi d
d
e
ckl olle
I-beam s Pi Hot rcoil
ion s
20
ect ction
s
ted se
ica olled
r
b
Fa ot r
el l
H
ste stee
t
s
Ca iquid
L
20
15
l
coi ani
Slit Galv
sed
2000
s
nel
190
30
40
50
Cumulative energy
(GJ/ t output)
Cumulative energy (GJ / t liquid aluminium)
Cumulative energy versus cumulative
yield for steel case study products
30
Cumulative process energy (GJ / t liquid steel)
Steel energy /
yield graph
0.6
0.8
id a
t
m
iniu
m
lu
1.0
Cumulative yield (t output / t liquid aluminium)
The aluminium energy / yield graph
The aluminium graph shows all three case-study components
starting with one tonne of 100% primary liquid aluminium, with
an embodied energy of 168 GJ / t. The y-axis does not start at zero,
in order to show variations in downstream process energy, but for
all three parts, the energy to make liquid metal accounts for more
than 90% of the total
Yield losses for the aluminium parts are higher than those in steel,
due to the requirement for ingot scalping (removing the outer
surface after casting) and more trimming during rolling stages.
Blanking for the cans (cutting circular blanks from a flat sheet)
causes a yield loss of around 15% but trimming losses are small
compared to those for the car door panel. However, the most
dramatic yield loss is for the wing skin panel which is machined
from plate, with loss of around 90% of the plate. Mass reduction
is so important in determining the fuel efficiency of aeroplanes
that the cost of this loss is not important to final customers, even
though it leads to an embodied energy of over 2,200 GJ per tonne.
As with steel, a change in recycled content of the original liquid
metal will shift the graphs up or down, but will not change the
relative impact of yield losses.
The causes of yield loss
We found two different sources of yield losses in our case studies.
Planned yield losses occur in normal operation, for example:
▪▪ Leaving behind a “skeleton” when cutting circles from
rectangular plate as perfect tessellation is not possible
▪▪ Trimming the side of metal coil between rolling processes to
leave a straight edge and to prevent crack propagation
▪▪ Removing a layer of metal oxide either mechanically (e.g.
scalping), or chemically (e.g. pickling)
▪▪ Machining complex geometries from regular shaped stock.
Measuring these planned losses is straightforward as they are
determined by design. In contrast, unplanned losses related to
quality cannot be anticipated and may change significantly over
time. They include:
▪▪ Producing poor quality parts due to equipment faults or material
defects
▪▪ Damaging material or products during handling
▪▪ Creating waste when starting and stopping equipment
As unplanned losses are an indicator of efficiency, they are
commercially sensitive and we found few companies willing
to reveal them. Also, for all our case study parts, yield loss was
dominated by planned losses.
How can we reduce planned yield losses?
Our case studies revealed three processes as the main generators
of planned yield loss: blanking and trimming (after stamping) of
sheet metal and machining of plates and bars. These processes
are required because the intermediate stock products created in
the first stage of the supply chain are the wrong geometry for
the second stage. To reduce these losses, we could develop new
processes, operate existing processes more effectively or change
component designs. This gives rise to many opportunities for
innovation:
▪▪ The ongoing development of ‘net-shape casting’ processes aims
to produce intermediate stock closer to required shapes. This
appears to be a major opportunity for reducing yield losses, but
is currently inhibited by a lack of economies of scale, and the
difficulty of controlling material properties as effectively as in
existing processes.
Using less liquid metal to deliver the same services in order to save energy and carbon
15
Material Substitution
We choose materials to meet design requirements, typically minimum stiffness or
strength. To meet any given set of design requirements we may opt for a lower
mass of a stiffer/stronger material, for example using carbon fibre or magnesium to
replace steel or aluminium. However, we should step back and consider the bigger
picture; would these substitutions give an overall energy saving?
▪▪ In current blanking processes, a clean cut round the perimeter
of the blank can only be achieved if a sacrificial ‘skeleton’ of
material outside the perimeter is discarded. Innovation might
eliminate this requirement.
▪▪ Except in can-making, stamping and drawing processes require
an over-size blank which is gripped during forming, and then
trimmed and discarded. Novel processes could aim to obviate
this trim.
▪▪ Current machining processes convert all unwanted material
into small chips, but innovative cutting processes might allow
separation of larger pieces of material for other uses.
▪▪ The efficiency of tessellation in cutting out parts from stock
improves as the number of parts increases. New business
models, with stage one metals companies providing blanks
to many customers from a restricted stock range, might allow
significant increases in tessellation efficiency.
▪▪ Component designs could be modified to increase tessellation,
and hence reduced planned yield losses.
Examples of recent or current process innovations to reduce
planned yield losses include:
▪▪ Continuous casting of steel to reduce planned yield losses
compared to discrete ingot casting
▪▪ Re-melting aluminium in an inert atmosphere to reduce
oxidation losses
Case Study Product
Steel I-beam
8
Aluminium beverage can
33
Aluminium car door panel
51
Steel car door panel
51
Aluminium wing skin panel
92
Table 4—Theoretical embodied energy savings for processes with 100% yield
Avoiding yield losses in all steel manufacturing therefore saves 11%
of energy associated with global steel production, and about 10%
of CO2 emissions. For aluminium, even though the saving in mass
is higher than for steel, the energy saving is just 4%. This small
number is due to the greater difference in energy requirements for
making aluminium from ore as opposed to scrap.
It is difficult to predict a realistic target figure for future yield losses,
but clearly there are many options to make significant changes. We
have drawn attention to several specific opportunities to develop
improved manufacturing processes. In addition, as with our earlier
discussion on lightweight design, we recognise the potential for
yield improvement through collaboration along the supply chain,
particularly in ensuring that component designers are aware of the
impact of their choices on total yield.
▪▪ Intelligent casting to producer customer-specific widths of
coiled strip
▪▪ Adjusting blank geometry to allow better tessellation
▪▪ Controlling the rolling process to reduce the requirement for
trimming due to earring after aluminium can manufacture
▪▪ Developing new alloys to allow use of thinner gauge material
in can-making, so reducing the mass (but not the fraction) of
planned yield losses
Steel
Aluminium
Current liquid metal demand
1400 Mt
76 Mt
Current metal content in products
1040 Mt
45 Mt
360 Mt
26%
31 Mt
41%
Liquid metal reduction potential
Table 5—Potential reduction in demand for liquid metal through yield improvements
The effect of yield on embodied
energy and carbon
Table 4 predicts the savings in liquid metal, and therefore in
embodied energy, that could be achieved for each case study
component, if all yield losses were eliminated. Using the global
Sankey diagrams from earlier, we can scale up this estimate:
assuming all of the yield losses downstream of liquid metal
production can be eliminated, the total demand for liquid steel
will reduce by 26% and the total demand for liquid aluminium will
reduce by 41%.
Reduction in cumulative
embodied energy (%)
Steel
Aluminium
Current energy used (liquid
metal production)
17 EJ
6.5 EJ
Energy reduction potential
2 EJ
11%
0.24 EJ
4%
1400 Mt CO2
340 Mt CO2
150 Mt CO2
10%
13 Mt CO2
4%
Current CO2 emissions (liquid
metal production)
CO2 reduction potential
Table 6—Potential reduction in energy and CO2 emissions through yield improvements
However, the metal that we have described as ‘yield loss’ is, of
course, not really lost – but, as shown in the Sankey diagrams, is
recycled by melting. Therefore reducing yield losses does not affect
demand for primary metal made from ore, but reduces demand
for metal made by recycling at the same rate that it reduces the
supply of metal for recycling. The benefit of yield improvements is
thus to reduce demand for energy in recycling processes.
16
Going on a metal diet
To answer this question, the balance of strength/stiffness properties to the embodied
energy used in processing the material may be compared graphically on Ashby
diagrams5. Using performance indices that are based on the design requirements,
guidelines of constant energy are plotted. Materials with a better performance index,
lying above or to the left of the guideline through the current material, will provide
the same service (strength or stiffness) with a lower embodied energy.
In static, structural applications, steel provides the required service of strength or
stiffness at a relatively low embodied energy but there are natural materials that
may be possible substitutes, for example stone in compression and wood in tension.
These may be viable in some situations such as small buildings, but generally the
ease of manufacture, recyclability, consistent properties, and the compact nature of
a steel design make it a more attractive option. Apart from wood and stone, there are
no other substitutes for steel with equivalent performance and reduced embodied
energy. Although often discussed in this context, composites have higher embodied
energy than steel.
MFA, 09
If use-phase energy is dependent on mass, or when other properties such as
corrosion resistance are important, the situation is not as clear. Aluminium is often
preferred to steel, as it has good strength to weight properties, is recyclable, has
well established fabrication processes, and has good corrosion performance. In this
case, composite materials may provide solutions with lower total emissions than
aluminium, and may be preferred if higher manufacturing costs can be offset by
energy savings in operation.
When all the details are considered, it seems we have already chosen our key
materials wisely, and only limited energy savings in specific applications may be
made through materials substitution.
MFA, 09
Materials selection options through comparing performance and embodied energy: stiffness
against embodied energy (top); strength against embodied energy (bottom)
Estimating emissions savings for cars made with less liquid metal
We’ve predicted the possible scale of emissions savings from lightweight
design and avoiding yield losses, so can now estimate a total benefit.
However, for cars, where fuel consumption is strongly dependent
on mass, we can also anticipate the emissions saving in-service from
having lighter cars. We’ll assume that the car remains the same, except
for application of our two strategies, and that as is currently typical, 70%
of the car is made from steel and aluminium6. We can therefore hope to
save 15–30% of 70% of its mass by efficient design. To translate this into
a saving in fuel use, we can use a standard simple estimate that a 10%
saving in vehicle mass gives a 5% saving in fuel consumption7. So our
predicted saving in fuel consumption is 5–10%.
The figure illustrates how the emissions savings from using less liquid
metal add up for the car, both in production and in use. In production,
most of the benefit comes from lightweight design rather than from yield
improvement, and the total emissions saving in material production is
roughly equal to the saving due to reduced fuel consumption. These
figures are illustrative only—and it is likely that pursuit of lighter weight
vehicles will drive wider changes to car design than component
optimisation. However, for liquid metal producers, these figures clearly
show that a drive for more fuel-efficient vehicles will also translate into a
reduced demand for liquid metal.
Calculation details can be found in the working paper: The global
emissions case for lightweight design and process yield improvements.W9
Overall savings
Process yield savings
Lightweighting savings
Material production
0
0.1
0.2
0.3
0.4
Lightweighting savings
Use phase
0
2
4
Global carbon emissions (Gt CO2)
6
8
Graph of carbon emissions savings for the car, as a result of pursuing lightweighting and
process yields improvements. (Note the two strategies when applied together are multiplicative and therefore the savings overlap for material production).
Using less liquid metal to deliver the same services in order to save energy and carbon
17
The economic case for using less metal
Product lightweighting and yield improvement have the potential
to deliver financial savings through reduced material costs,
reduced use phase costs and decreased exposure to carbon taxes.
This section looks at how big these incentives are, how sensitive
they are to a carbon price and why and why not opportunities
for product lightweighting and yield improvement have been
exploited in the manufacture of three products: a beverage can,
a car and a train.
The aluminium beverage can
The beverage can industry has seen aggressive lightweighting
resulting in a 35% reduction in material requirement over the last
30 years. Historic and ongoing efforts to lightweight products and
improve yield have been motivated by the need to reduce material
costs which account for approximately two thirds of production
costs (exchange rate dependent). The standardised nature of
the product and its automated production process means that
any material saving solutions can be widely applied allowing the
burden of R&D expenditure to be spread across a high volume
of sales—the European market is estimated at over 50 billion
beverage cans8.
Contracts typically link can price to input material price and,
even where this link is not explicit, any reduction in can weight is
transparent to the buyer and so can be negotiated over. Although
these contracting practices insulate the can-maker from volatility
in the primary metals market (reducing hedging costs) they mean
that material cost savings from lightweighting must be shared
with customers. By contrast the benefits of yield improvements
are invisible to the buyer and so are accrued entirely to the canmaker. Whilst can lightweighting enhances competitiveness (itself
important for utilisation and so margins), yield improvement adds
to margins directly.
In the analysis, the incentives for lightweighting and yield
improvement of the beverage can are driven entirely by the price
of aluminium can body stock. Additional potential benefits include
reduced producer responsibility costs (see policy review) and
logistical saving. Although these logistical savings are expected
to be minor for can transportation, a study into down-gauging of
food can-ends found significant logistics cost savings in can-end
transportation as 18% more can-ends could be transported per
pallet load following a 0.03 mm reduction in gauge9.
The can-making industry has actively exploited opportunities to
reduce material costs, exploring strategies that can be financed
through existing funds to renew tooling e.g. reducing skeleton
waste through novel stamping methods, as well as investing in
significant capital assets e.g. necking technology to reduce can
base and end size. Can lightweighting is limited by network
externalities along the supply chain; capital-intensive filling and
vending operations are reluctant to run lighter cans that require
operational change and/or capital expenditure.
18
Going on a metal diet
The car
There has been an upward trend in kerbweight of UK vehicles
over the last 40 years as typified by the average small family
car, which has increased in weight by 5–10% with each model
change, resulting in a 35–75% cumulative increase in weight since
the 1970s. Despite this overall weight increase, the industry has
put great emphasis on weight reduction of the car body. The
use of high strength steels, for example, is estimated to have
reduced vehicle weight by 5% over the period10. Rather than
passing the resultant weight saving on to consumers as fuel
savings, the industry has opted to add features, increase vehicle
size and improve performance in order to win customers. These
improvements are estimated to account for three quarters of the
weight increase observed (15% due to improved comfort, 13%
due to adding features, 17% due to improved performance e.g.
better acceleration and handling, and 30% due to increased
size11). The remaining increases in weight are attributed to safety,
with most cars now achieving five stars in the European safetyrating scheme—Euro-NCAP.
These priorities chime with research into customer preferences
for vehicle characteristics, that ranks fuel efficiency as ninth after
characteristics such as performance, comfort, style and safety12.
This research concludes that weight influences many vehicle
attributes, but is not coveted by consumers in its own right. The
premium paid for diesel over petrol vehicles shows that consumers
do factor fuel efficiency into purchases, however, they may not be
prepared to compromise other attributes in order to get similar
fuel efficiency improvements through lightweighting. As a result,
lightweighting is limited by its effect on other vehicle attributes
that are favoured by consumers.
The analysis shows that the majority of the benefit of lightweighting
of vehicles comes from use phase savings as a result of an
assumed fuel efficiency saving of 0.13 l / 100 km / 100 kg weight
saving13. Without strong customer preferences for fuel efficiency
these savings will not be pursued in the absence of intervention.
Legislation to limit tailpipe emissions from vehicles (discussed in
the policy section) force car manufacturers to realise these usephase savings irrespective of customer preference. The legislation
aims to reduce emissions from the new car fleet to 130 g CO2 / km
by 2015 and to 95 g CO2 / km by 2020.
Car manufacturers are willing to bear some additional costs
in order to meet these standards and deliver enhanced fuel
efficiency to customers. Analysis conducted for the European
Commission to assess the cost of different options for enhanced
carbon efficiency of vehicles, found that the three lightweighting
options considered (5%, 15% and 30% reduction in weight of the
body-in-white) presented above average costs per unit CO2 with
cheaper options offered by hybrid technologies and improvements
in transmission14. This is in direct contrast to evidence presented
by Tata Steel Automotive, which suggests that its VA / VE (Value
Analysis/Value Engineering) technique—which aims to optimise
material choice and design—can deliver concomitant cost and
weight savings15. Information on the cost of abatement is highly
commercially sensitive and it is likely that the true answer lies
somewhere between the two. Whilst strategies that involve
material substitution (e.g. substituting aluminium for steel in the
body in white) are likely to be costly, other strategies must exist
that save both costs and weight if only by reversing or kerbing the
trend in additional features on vehicles.
The train
The UK rail industry managed to stem train weight increases in
the 1980s and 1990s by using lighter weight materials (switching
from steel to aluminium body shells), pursuing lightweight
design for select components (see, for example, the box story on
Bombardier’s FLEXX Eco-Bogie, page 10), and applying integrated
design principles by replacing body shells built on underframes
with monocoque designs. From the 1990s onwards, however,
upward pressure on train weight prevailed and vehicle masses
rose in the range of 10–25% between late 1980 and early 2000
models16. This weight increase is attributed to: an emphasis on
reliability which has seen increased built in redundancy e.g. a
larger proportion of powered vehicles; improved access and
onboard services e.g. air conditioning and information systems;
demands for enhanced speed and control e.g. the addition of tilt
systems and intelligent train systems; and, developments in safety
such as the use of improved crash protection structures.
The railways offer an efficient means of transporting weight by
land—in the analysis of the benefits of lightweighting, trains are
found to emit five times less carbon in transporting 1 kg than is
emitted by transporting the same kg by car. Nevertheless the
more intense use of trains and the added benefit of reduced track
maintenance costs, mean that the benefits of lightweighting trains
are an order of magnitude greater than the benefits calculated
for the other case studies (this, even when the 7 year franchise
life, rather than the 30 train life is taken as the unit of analysis).
On this basis we would expect great emphasis to be put on
lightweighting of trains but instead we find that, in the recent
past, lightweighting has carried low priority for the rail industry
when procuring new trains. This seemingly incongruous finding is
explained by the structure of the industry.
Following the privatisation of the industry, there are three means
by which a train can be procured: (1) a Rolling Stock Company
(ROSCO) can buy a train and lease it to a train operating company
(TOC) that has won a franchise, the train then being available to
lease to other TOCs at the end of the franchise period; (2) the
TOC can buy the train outright but at the risk of being left with a
redundant asset at the end of the franchise and, (3) the franchising
authority (e.g. DfT) can procure the train and issue a franchise that
demands its use.
Option (1) is the most commonplace and can reduce the priority
given to lightweighting due to: a preference for versatile trains
that maximize residual value; use phase benefits accruing to the
operators over the franchise life only; and, rail access charges (the
charges that transfer maintenance costs and electricity costs from
Network Rail to TOCs) that do not fully pass on the benefits of
weight saving. Finally, although the discounted benefit of saving
one tonne in mass from a vehicle is measured in tens of thousands
of pounds over the lifetime of a vehicle, this compares to whole
life costs measured in millions of pounds. The potential savings
are therefore so relatively small that the case for lightweighting
is difficult to demonstrate in isolation. Lightweighting may well,
however, be viable as an intrinsic part of other initiatives.
Recent work conducted by the Rail Safety and Standards Board on
the benefits of lightweighting (used to inform this report) provides
a benchmark for showing the use phase cost implications of
weight17. In addition the McNulty Review on Value for Money on
Railways may recommend addressing some of the distortions in the
industry structure and may improve incentives for lightweighting
by emphasizing whole-system, whole-life cost savings18.
All data sources are listed in the WellMet2050 working paper:
Incentives for product lightweighting and yield improvementW10.
Key Insights
The willingness-to-pay analysis on the next page does not tell the full story—it is not just the
magnitude of potential benefits that dictates the incentives for material efficiency, but the size
of these benefits relative to other costs faced by the industry.
Although use phase benefits dominate in the transport industries considered, these appear to
provide less motivation for lightweighting as they are only seen by the manufacturer indirectly
and are clouded by other consumer preferences (in the case of the car) and distorted by the
industry structure (in the case of the train).
Yield improvement and lightweighting can deliver cost savings aside from material cost
savings e.g. inventory, handling and logistics savings. These savings are likely to be important
in upstream forming industries where the material cost of process yield losses is effectively
invisible due to internal material flows.
Using less liquid metal to deliver the same services in order to save energy and carbon
19
Financial benefit of using less metal for
the same service (£ / kg metal saved)
20
Material cost and use phase savings
Material cost savings
15
10
Beverage can
Car
0
0
25
50
75
We have seen that both yield improvement and product
lightweighting save embodied emissions in manufactured
products, and that product lightweighting may have additional use
phase emissions benefits. This section considers whether current
UK government environmental policy offers adequate incentives
for these emissions saving strategies.
Product lightweighting can be achieved through material substitution;
incumbent materials can be replaced with stronger, higher performance
materials. The benefits of lightweighting and yield improvement have
been calculated for each product taking into account material cost
savings (assuming constant unit costs), use-phase energy cost savings
and track maintenance costs savings (for trains only). In each case
the intercept is determined by the unit material price and the weight
sensitivity of discounted use-phase costs. The slope of the line shows
sensitivity to the carbon price, with differences in slope caused by
differences in the embodied energy in input materials and differences
in the carbon intensity of use phase activities.
Train
5
Policy and liquid metal consumption
How big are the benefits of yield
improvement and lightweighting?
100
Carbon price ( £ / t CO2)
Graph of the material cost and use phase benefits of lightweighting and
the effects of increasing the carbon price.
Policy review
Product lightweighting is a crosscutting issue that links energy
intensive industries with use-phase emissions and waste generation.
Encouraging product lightweighting and yield improvement does
not, therefore, sit conveniently within the objectives of a single
government department. A review of existing government policy
that may encourage these strategies (see policy boxes for details)
has reached the following conclusions:
We can see that higher carbon prices cause higher material prices and
increased use-phase weight-attributable costs, enhancing incentives
for lightweighting and yield improvement. If consumers are assumed
to perfectly factor use phase savings into their purchasing decisions,
and if material cost reduction is assumed to be given equal weight
across sectors, we would expect the greatest emphasis to be put on the
lightweighting and yield improvement of trains and equal weight to be
put on the lightweighting of cars and cans. The text above explores,
sector by sector, the additional considerations that explain why these
expectations are not met. The next section explains why the reality of
the EUETS offers weaker incentives than those assumed here.
Existing policies that price emissions
are ineffective at promoting yield
improvement and lightweighting
In order to make decisions about lightweighting and yield
improvement effectively, manufacturers must face consistent
carbon prices so that they can factor in the cost of the externalities
they cause both up and downstream. In reality there is no
single price of emissions: the average Phase II EUA price has
been €approximately £15 / t CO2; the CCL is levied at 0.47 p / kWh
equating to an implied carbon price of £0.09 / t CO219; the fuel
duty is levied at £0.5819/L equating to an implied carbon price
of £220 / t CO2 for the use of diesel in cars and £252 / t CO219 for
the use of petrol. Furthermore there are multiple reasons why
policies that price emissions from energy intensive industries
(e.g. the steel and aluminium industry) do not result in prices
of their outputs increasing in line with the emissions associated
with the production of those outputs: tax revenues from the
Climate Change Levy (CCL) are returned to businesses through
cuts in National Insurance contributions; the majority of the CCL
can be avoided by industries that negotiate Climate Change
Agreements; fears over carbon leakage result in free allocation of
EU ETS emissions permits. As a result of these measures, product
manufacturers do not face input prices that duly reflect embodied
emissions in their energy intensive inputs. Given the severity of the
challenge to tackle climate change, material efficiency strategies
such as yield improvement and lightweighting must be pursued
independently of these policies.
Implications for unit material costs
Product lightweighting can be achieved through material substitution;
incumbent materials can be replaced with stronger, higher performance
materials that reduce material requirement at the expense of higher unit
material costs. The diagram distinguishes between the effect of reduced
material requirement and the effect of increased unit material cost on
total material expenditure for two case study strategies. The first explores
the hypothetical scenario that the strength composition of Chinese annual
rebar consumption (currently 60% 335 MPa, 40% 400 MPa) is increased to EU
standard practice (100% 500 MPa). The second scenario explores how the
material cost of producing 1000 cans is affected by a reduction in gauge
from 0.34 mm to 0.27 mm. The graph shows that, despite higher unit costs
caused by the addition of Ferrovanadium to enhance rebar strength and
higher rolling charges to reduce gauge, the application of each of the
strategies considered offers material cost savings as reductions in material
requirement outweigh marginal increases in unit costs.
Whether or not these strategies can be cost effectively implemented will
depend on the effect on other cost components e.g. it is thought that higher
strength rebar is not currently being used in China due to a reluctance of
local producers to invest in capital equipment for pre-straining, heat
treatment and improved control.
Downgauging can body stock
Higher unit costs
Lower material requirements
Original expenditure
Bringing Chinese rebar to
European strength standards
Higher unit costs
Lower material requirements
Original expenditure
60
70
80
% of original expenditure
90
Graph of the material cost and use phase benefits of lightweighting and
the effects of increasing the carbon price.
100
The greater flexibility offered by modern
building codes should be exploited
through better communication between
clients, designers and contractors
Building codes specify minimum quantities of steel and concrete
in order to guard against building collapse and reduce accidents
20
Going on a metal diet
in construction. Modern, advanced codes allow the designer
increased flexibility in material use by providing clauses that allow
conservatism to be removed if better workmanship can be achieved
or better information is known. One example is in Eurocode 2 (BS
EN 1992–1–1:2004)**Annex A, which details reductions in partial
safety factors that can be applied if reinforcing bars are placed
more accurately. Using these reduced factors would decrease the
amount of steel required. However such clauses are not widely
exploited, instead default options are used. For non-safetycritical issues, such as deflection, recommended (not required)
limits are specified by the codes. Performance in these categories
can be negotiated with the client and less stringent criteria (that
save metal) adopted if suitable. Again, this is not commonly
done, leading to some buildings being over-specified. Increased
communication between different designers, contractors and
clients, with better awareness of other disciplines’ and professions’
requirements, would help to overcome this and put material only
where necessary.
Due reward must be given to emissions
savings from lightweighting of vehicles
The EC regulation 443/2009 sets fleet average emissions standards
for vehicles at 130 g CO2/km by 2015 and 95 CO2/km by 2020. These
standards are set for the average fleet mass with 4.57 g CO2 added/
subtracted for every 100 kg increase/decrease in kerbweight.
As the target CO2 varies by weight along this “limit line”, car
manufacturers are not duly reward for emissions savings achieved
through weight reduction; where lightweighting occurs, the car
manufacturer will simply face a more stringent emissions target.
Performance relative to these targets is measured according to the
testing standards set out in ECE Regulation 84. This static test,
which is conducted on rollers, does not fully take into account the
benefits of weight reduction. Certified CO2 figures are calculated
using categories that cover a 100 kg range of vehicle weights. This
means that up to 100 kg in weight can be taken off cars at the
top of a weight class, before any change in certified CO2 is seen.
These distortions must be addressed if vehicle manufacturers are
to see lightweighting as a viable strategy for achieved emissions
standards.
Measurement and reporting of
embodied carbon should be encouraged
to increase awareness of the
opportunities for material efficiency
There have been some promising developments in the
measurement and reporting of embodied carbon and material
efficiency. The European environmental management system,
EMAS requires participating companies to report mass flow
of different materials used, and the European Committee for
Standardisation is working on a standard (CEN–TC350) due for
release in the next year which will provide the basis for measuring
the integrated performance of buildings over the life cycle. Both
Using less liquid metal to deliver the same services in order to save energy and carbon
21
examples include measures of the embodied energy in materials
and can be used to identify opportunities to save material (and so
reduce carbon emissions) through yield improvement and product
lightweighting. This move, towards environmental reporting that
reveals opportunities to save carbon across the whole life cycle,
and results in actionable targets, should be encouraged and
applied consistently across supply chains.
Emission reduction targets must take
into account embodied energy
This report has highlighted the potential to reduce emissions
from energy intensive industries (such as aluminium and steel),
by improving material efficiency through yield improvement and
lightweighting along the supply chain. Nevertheless environmental
initiatives such as BREEAM and policies such as the emissions
standards for vehicles fail to take into account embodied energy
in their emissions assessments. As a result, these policies do little
to discourage the realization of use-phase emissions savings
at the expense of greater embodied emissions. By contrast the
Australian buildings rating Green Star was revised last year to
encourage dematerialisation of steel in structural applications. The
Green Star rating awards points for example for the use of high
strength steels and for the specification of rebar that is assembled
off site using optimal (material saving) fabrication techniques. As
opportunities to reduce use-phase emissions are exploited, the
emission reduction opportunities offered by reducing embodied
emissions become more prominent. Once consistent means of
measuring embodied emissions have been established (see point
(4)) targets must take these into account in order to provide
consistent incentives for emissions reduction across the whole life
cycle.
Policies that affect energy
intensive input sectors:
Policies that directly tackle
manufacturer’s input choice:
Policies that encourage a
reduction in use phase emissions:
The European Emissions Trading Scheme (EU ETS) is a capand-trade scheme. The current, second phase operates until
2012. The scheme applies to energy intensive sectors including
the steel and aluminium sector. Facilities that exceed threshold
output levels in these sectors are allocated allowances in the UK
Allocation Plan. Permits must be bought in the carbon markets
for emissions in excess of this initial allocation and operations
can choose to abate to emissions levels below their allocation
in order to sell permits. The European Commission is currently
harmonising the allocation of free emissions allowances
across countries, stipulating allowances be granted up to a
benchmark set by the top 10% most efficient installations in
each sector within the EU. Additional permits can be granted
to industries at risk of carbon leakage.
Packaging Essential Requirements Regulations apply to
companies that make, fill, sell or handle packaging or packaging
materials. They include a requirement to minimise packaging
weight and volume subject to safety, hygiene and consumer
acceptance. Companies must keep evidence of their compliance
with this regulation and be prepared to supply this evidence to
Trading Standards upon request. The European Standard BS EN
13428:2004 specifies the assessment procedure to ensure that
packaging weight and/or volume is at its feasible minimum.
The EU directive specifying emissions standards for new
passenger vehicles went into effect in April 2009. The directive
demands fleet average vehicle emissions of 130 g CO2 / km. The
target is being gradually phased in: it must be met by 65% of all
new vehicles by 2012, 75% by 2013, 80% by 2014, and 100% by
2015. A target of 95 g CO2 / km is expected in 2020. Manufacturers
pay a penalty for emissions in excess of the stated target. The
directive specifies emissions limits for three weight classes (less
than 1250 kg, 1250 kg to 1700 kg and more than 1700 kg) this has
been extrapolated into a limit line with more stringent emissions
targets for lighter vehicles in order to ensure that the fleet average
target is achieved.
The Producer Responsibility Obligations apply to companies
that handle more than 50 tonnes of packaging per year and
have an annual turnover in excess of £2 million. Compliance is
demonstrated through the purchase of Packaging Recovery Notes
(PRNs) the price of which fluctuates throughout the year. Producer
responsibility costs are in direct proportion to the weight of material
placed on the market.
The Climate Change Levy (CCL) is a tax on industrial and
commercial non-renewable energy supplies. The current
rates for 2010–2011 are 0.47 p / kWh for electricity. The levy
is designed to be revenue neutral with the money raised
returning to business through cuts in the rate of employers’
National Insurance.
The Eco-Management and Audit Scheme (EMAS) and the
European Standard EN 16001 are voluntary tools that help
companies evaluate, manage and improve their environmental
performance. Material efficiency is included within EMAS as one
of six core indicators, requiring organisations to report annual
mass-flow of different materials used (excluding energy carriers
and water). Organisations must provide justification that material
efficiency is not relevant to their direct environmental impact in
order to avoid reporting this indicator. EMAS accreditation can be
set as a requirement for CCAs. Where this is the case, companies will
receive a CCL rebate as a result of participating in EMAS.
Climate Change Agreements (CCA) are negotiated between
DECC and eligible energy intensive industries. A discount
of up to 80% on the CCL is offered in return for agreed
energy efficiency and carbon saving targets being met. The
qualification criteria are that energy costs must account for at
least 3% of production value and that the import penetration
ratio, calculated at the sector level, must be at least 50%.
The BRE Responsible Sourcing Standard BES 6001 provides a
common benchmark for all construction products to demonstrate
their responsible sourcing credentials
The WRAP Courtauld Commitment is a responsibility deal aimed
at improving resource efficiency and reducing the carbon and
wider environmental impact of the grocery retail sector. Signatories
span the entire retail supply chain. One of its commitments is to
reduce the carbon emissions associated with grocery packaging by
10% by reducing weight, increasing recycling rate and the recycled
content of grocery packaging.
A full supply chain approach is
required to systematically improve
yield and to lightweight products
There are examples of successful supply chain initiatives that
collect data on key performance indicators across the supply chain
and set performance targets. The Eco-Reinforcement Responsible
Sourcing Standard is part of the BRE standard for responsible
sourcing of construction products (BES 6001) and puts emphasis
on CO2 reduction and waste minimization across the supply chain.
In the grocery retail sector the WRAP Courtauld Commitment aims
to improve resource efficiency and reduce emissions and wider
environmental impacts by engaging the full supply chain. It is only
by addressing the entire supply chain that the objective of “using
less metal to deliver the same service” can be met. Such supply
chain initiatives should be promoted in all metal using sectors
with key performance indicators that report yield as a measure of
material efficiency.
DEF-PB13426-EMAS.qxp
20/7/10
11:13
The Fuel Duty is a tax levied on motoring fuel and is currently
charged at 58.19 p per litre for both diesel and unleaded petrol.
Although the 2010 budget staggered the 3 p rise in the duty that
was due for 2010 (due to the election), the former Chancellor
remained committed to the fuel duty escalator that will see pump
prices rise by inflation plus 1 p a litre, each year, between 2011 and
2014. The fuel duty is a lucrative source of revenue to the treasury
and is not purely an environmental tax.
The London Congestion Charge is currently charged at £8 per
weekday per vehicle to drive within the central London congestion
charge zone. Hybrid, electric and alternative fuel cars are exempt
from the charge. From January 2011 the charge will increase to £10
per day and the Greener Vehicle Discount (GDV) will be introduced.
The GDV makes all Euro 5 standard petrol or diesel cars that emit
less than 100 g CO2 /km exempt.
Voluntary eco-standards such as BREEAM give accreditation for the
sustainability features of buildings. Building’s are scored across a
number of sustainability criteria. The materials category includes an
assessment of the embodied life cycle impact of buildings but no
specific targets are stated and the embodied energy in steel frames
is typically ignored. Instead the emphasis is on use-phase savings.
By contrast, the Australian Green Star rating system was revised
in February 2010 in order to drive best practice steel production
and fabrication and to encourage demanterialisation of steel in
structural applications.
Page 1
An Introductory Guide to EMAS
C
M
Y
K
PMS ???
PMS ???
PMS ???
Scaling the heights
of environmental
management
PMS ???
Non-printing
Colours
Non-print 1
Non-print 2
BRE Environmental &
Sustainability Standard
JOB LOCATION:
PRINERGY 3
BES 6001: ISSUE 2.0
Framework Standard for the Responsible Sourcing of
Construction Products
This BRE Environmental & Sustainability Standard describes the
organisational governance, supply chain management and environmental and
social aspects to be addressed in the certification and approval of the
responsible sourcing of construction products
This BRE Environmental & Sustainability Standard is the property of BRE Global Ltd. and is made
publicly available for information purposes only. Its use for testing, assessment, certification or approval
must be in accordance with BRE Global Ltd internal procedures and requires interpretation by BRE
Global and BRE experts. Any party wishing to use or reproduce this BRE Environmental & Sustainability
Standard to offer testing, assessment, certification or approval must apply to BRE Global for training,
assessment and a licence; a fee will normally be charged. BRE Global will not unreasonably refuse such
applications. BRE Global accepts no responsibility for any un-authorised use or distribution by others of
this BRE Environmental & Sustainability Standard and may take legal action to prevent such unauthorised
use or distribution.
© BRE Global Ltd 2009
22
Going on a metal diet
Using less liquid metal to deliver the same services in order to save energy and carbon
23
Actions and opportunities
We’ve seen in this report that we can significantly reduce the
volume of liquid metal being cast to meet our current needs for
metal service. We could reduce product weights by up to a third,
and we could save a further quarter by avoiding manufacturing
yield losses. This saving offers such a serious carbon abatement
opportunity that it should be taken very seriously. Who could
initiate change in this area?
Senior management throughout the supply chain of metals
manufacturing companies could drive major change in liquid
metal consumption:
▪▪ Many of the companies we visited had a poor understanding
of their true yield performance, and even where data was
known, we found managers could be reluctant to reveal it,
even internally. Awareness and intelligent management of yield
losses could be improved
▪▪ The liquid metals industry currently thinks of its products as the
standard stock parts—sheets, plates, bars and rods—but these
are intermediate products, not in the shape that their customers
really require. There is significant opportunity for supply-chain
collaboration to reduce total yield losses
▪▪ Although the objective of the Metal Diet is to reduce production
of liquid metal, there is a major opportunity for liquid metals
manufacturers to add value to their business by integrating
downstream operations into their own activity, so converting
all manufacturing ‘new scrap’ into ‘home scrap’ and thus
internalising the motivation for yield improvement
Our examination of policy has shown that, under present
policies, lightweighting and yield improvement will not be given
due consideration across all steel and aluminium using sectors,
despite the fact that these strategies represent substantial
opportunity for emissions reductions. In order to address this
imbalance government should:
▪▪ Recognise that material efficiency strategies (such as
lightweighting and yield improvement) offer sizeable emissions
savings but will not be encouraged by existing policies based
on emissions pricing and so should be pursued independently
▪▪ Understand that due reward is not given to lightweighting in EU
tailpipe emissions standards and that this legislation should be
revised or that lightweighting of vehicles should be encouraged
through other means
▪▪ Acknowledge that more must be done to encourage design
teams in the construction sector to take advantage of the
greater flexibility offered by modern building codes with respect
to the lightweighting of buildings
▪▪ Foster better measurement and reporting of embodied carbon
and create reporting standards where these do not exist
▪▪ Incorporate embodied carbon into emissions targets industries—
such as the construction industry and the automotive industry—
that are heavy users of emissions intensive metals
▪▪ Act as a coordinator to facilitate a supply chain approach to
material efficiency, building on the success of the Courtauld
commitment and supply chain initiatives in construction
24
Going on a metal diet
In the definition of a design specification, arising from
interaction between client/customer, designer, marketing,
standards and other stakeholders, a significant impact on total
metal requirements could be achieved by:
▪▪ Specification of lightweight design as a component of the
earliest design/procurement brief
▪▪ Ensuring that design codes and load specifications accurately
reflect the required in-service performance requirements
▪▪ Looking for alternative means to overcome design loads that
arise before the final user service—for instance, where excess
material is currently required to cope with construction,
installation, production or distribution loads
▪▪ Applying life-cycle costing to capture full benefit of use-phase
reductions and other co-benefits
Several of the studies in this report have shown opportunities for
development of novel or improved manufacturing technologies:
References
Global flows of steel and aluminium
1.
World Steel Association (2009) Steel statistical yearbook 2009
2.
World Steel Association (2009) Yield Improvement in the Steel Industry: Working
group report 2003-2006
3.
International Aluminium Institute (2008) Material flow spreadsheet
4.
Cullen et al. (2011) Reducing embodied carbon through efficient design: Olympic
Park venues and infrastructure. London 2012 Learning Legacy paper
Reducing manufacturing scrap
5.
Ashby MF (2009) Materials and the environment: eco-informed material choice.
Burlington, MA, USA: Butterworth-Heinemann.
6.
University of California Santa Barbara (2010) Vehicle Lifecycle Assessment Model
7.
WorldAutoSteel (2007) Executive summary of life cycle greenhouse gas
assessments of automotive materials: the example of mild steel, advanced high
strength steel and aluminium in body in white applications
The economic case for using less metal
▪▪ The process of blanking—cutting blanks from coils of strip
metal—is among the most inefficient in the supply chain. Two
opportunities to overcome this are to develop novel blanking
processes to avoid the need for ‘skeletons’ between products,
and to tessellate blanks more efficiently through intelligent and
integrated optimisation over a wider product range
10. Tata Steel Automotive (2009) Pocket book of steel
▪▪ Many sheet forming processes, particularly deep drawing,
form final components but require significant excess material
for blank-holding, which must be trimmed and scrapped. New
processes could be developed to obviate this need
14. TNO Science and Industry (2006) Review and analysis of the reduction potential
and cost of technological and other measures to reduce CO2 emissions from
passenger vehicles
▪▪ The mismatch in geometry between intermediate products and
final components might be reduced through a re-examination
of the opportunities created by near-net-shape casting
▪▪ Unplanned losses of 1–2% are normal in many manufacturing
operations, but these become significant for metal goods
because the supply chain is long, with many sequential
operations. Shorter supply chains, or better control could
reduce them
To continue promoting and developing a low metal diet, the
WellMet2050 team will:
▪▪ Work to raise awareness of the fact that in the energy intensive
steel and aluminium sectors there is potentially a greater
emission abatement opportunity from reducing liquid metal
consumption than from energy efficiency in primary production
▪▪ Develop and demonstrate novel technologies for manufacturing
nearer net shape, lightweight components
8.
Beverage Can Makers Europe (2009) Country reports - Europe
9.
Wrap (2007) Retailer innovation: Heinz lightweighting can ends
11. ibid
12. Benteler (2008) Aluminium in cars- light and easy? Presentation to the Pyrotek
Metal Quality Workshop
13. University of California Santa Barbara (2010) Vehicle Lifecycle Assessment Model
15. Tata Steel Automotive (2009) Pocket book of steel
16. Fox, Pritchard and Hall (1994, 2007) British Railways Locomotives & Coaching
Stock, Platform 5
17. RSSB (2010) Quantification of benefit of train mass reduction
18. McNulty (2010) Rail value for money study
19. DECC (2009) Based on an emissions factor of 0.55kgCO2/kWh for UK grid
electricity, and 2.639kgCO2/L for Diesel and 2.639kgCO2/L for petrol
WellMet2050 working papers
The working papers contain more detailed analysis to support the findings of this
report, and are available for download from www.wellmet2050.com
W1 Cullen J (2011) Global flow of steel. WellMet2050
W2 Cullen J (2011) Global flow of aluminium. WellMet2050
W3 Carruth M (2011) Design optimization case study: food cans
▪▪ Continue and expand our engagement with government to
ensure that wider supply chain material efficiency becomes a
core part of energy intensive industry policy making
W4 Carruth M (2011) Design optimization case study: deep sea linepipe
▪▪ Develop specific case studies with consortium partners to
demonstrate the metal saving opportunities possible through
integration along the component supply chain
W7 Moynihan M (2011) Design optimization case study: reinforcing bar
▪▪ Aim to provide a sound basis and guidance for setting future
targets relating to embodied emissions in key product groups
W5 Carruth M (2011) Design optimization case study: structural beams
W6 Carruth M (2011) Design optimization case study: car structures
W8 Milford R (2011) The effects of yield losses on embodied CO2 emissions in four
case study metal products
W9 Milford R (2011) The global emissions case for lightweight design and process
yield improvements
W10Patel S (2011) The incentives for product lightweighting and yield improvement
Using less liquid metal to deliver the same services in order to save energy and carbon
25
Department of Engineering
University of Cambridge
Trumpington Street
Cambridge CB2 1PZ
United Kingdom
ISBN 978-0-903428-32-3


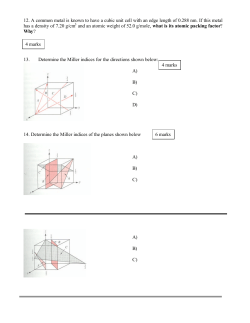


© Copyright 2026