
BioMag Laboratory, Hospital District of Helsinki and Uusimaa, HUSLAB,
BioMag Laboratory, Hospital District of Helsinki and Uusimaa, HUSLAB,
Helsinki University Central Hospital
Department of Clinical Neurophysiology, Department of Neurological Sciences, University of Helsinki
Pediatric Graduate School, Hospital for Children and Adolescents, University of Helsinki
NEUROMAGNETIC STUDIES ON CORTICAL SOMATOSENSORY
FUNCTIONS IN INFANTS AND CHILDREN – NORMAL DEVELOPMENT
AND EFFECT OF EARLY BRAIN LESIONS
Päivi Nevalainen
ACADEMIC DISSERTATION
To be presented, with the permission of the Faculty of Medicine of the University of Helsinki,
for public examination in lecture hall 1 of the Helsinki University Central Hospital, Haartmaninkatu 4,
on August 13, 2010, at 12 noon.
Helsinki 2010
Supervisors: Docent Leena Lauronen, MD
Department of Clinical Neurophysiology,
Hospital for Children and Adolescents,
Helsinki University Central Hospital, Finland
BioMag Laboratory, Hospital District of Helsinki and Uusimaa, HUSLAB,
Helsinki University Central Hospital, Finland
Docent Elina Pihko
Brain Research Unit, Low Temperature Laboratory,
Aalto University School of Science and Technology, Espoo, Finland
BioMag Laboratory, Hospital District of Helsinki and Uusimaa, HUSLAB,
Helsinki University Central Hospital, Finland
Reviewers:
Professor Vineta Fellman, MD
Lund University, Sweden/University of Helsinki, Finland
Department of Pediatrics, Lund, Sweden
Docent Minna Huotilainen
Cognitive Brain Research Unit and
Finnish Centre of Excellence in Interdisciplinary Music Research
University of Helsinki, Finland
Opponent:
Professor Jari Karhu, MD
Department of Physiology
University of Kuopio, Finland
ISBN 978-952-92-7560-1 (pbk)
ISBN 978-952-10-6379-4 (PDF, http://ethesis.helsinki.fi/)
Yliopistopaino
Helsinki 2010
CONTENTS
ABBREVIATIONS................................................................................................... 6
LIST OF ORIGINAL PUBLICATIONS................................................................... 7
1. ABSTRACT........................................................................................................... 8
2. INTRODUCTION................................................................................................. 10
3. REVIEW OF LITERATURE................................................................................ 11
3.1. Magnetoencephalography (MEG).......................................................... 11
3.1.1. Neural basis.............................................................................. 11
3.1.2. Theoretical background of modeling MEG signals................. 12
3.1.3. Instrumentation........................................................................ 13
3.1.4. The role of MEG within the field of current brain research.... 14
3.2. The somatosensory system..................................................................... 14
3.2.1. Functional anatomy in adults................................................... 14
3.2.2. Development............................................................................ 17
3.2.2.1. The neocortex............................................................17
3.2.2.2. Thalamocortical connections.................................... 18
3.2.2.3. Synaptogenesis.......................................................... 18
3.2.2.4. The brain and somatosensory system of a newborn. 19
3.3. Preterm infants........................................................................................ 19
3.4. Cerebral palsy (CP)................................................................................. 21
3.4.1. Overview.................................................................................. 21
3.4.2. Organization of the sensorimotor system in hemiplegic CP.... 21
3.5. Somatosensory evoked responses........................................................... 22
3.5.1. Somatosensory evoked magnetic fields (SEFs) to stimulation
of the hand area in adults................................................................... 22
3.5.2. SEFs and SEPs in newborns and infants................................. 26
4. AIMS..................................................................................................................... 28
5. METHODS............................................................................................................ 29
5.1. Study design............................................................................................ 29
5.2. Subjects................................................................................................... 29
5.2.1. Newborns................................................................................. 29
5.2.2. Infants and children..................................................................30
5.2.3. Very preterm infants................................................................ 30
5.2.4. Adolescents with CP................................................................ 30
5.2.5. Healthy adolescents................................................................. 30
5.2.6. Adults....................................................................................... 31
5.3. MEG studies........................................................................................... 31
5.3.1. Stimulation............................................................................... 31
5.3.2. Recordings............................................................................... 31
5.3.3. Procedure................................................................................. 32
5.3.4. Sleep stage analyses................................................................. 33
5.3.5. Data analyses........................................................................... 34
5.4. Magnetic resonance imaging (MRI)....................................................... 35
5.5. Behavioral tests....................................................................................... 35
5.6. Statistical analyses.................................................................................. 36
5.7. Ethical considerations............................................................................. 36
6. RESULTS.............................................................................................................. 37
6.1. SEFs in newborns................................................................................... 37
6.1.1. Differences between newborn and adult responses (Study I).. 37
6.1.2. Origins of the contralateral SEFs: effect of sleep stage and
interstimulus interval (ISI) (Study II)................................................ 37
6.1.3. Ipsilateral responses (Study II)................................................ 40
6.2. Developmental changes in SEFs (Studies I, IV).....................................41
6.3. SEFs in very preterm infants (Study III).................................................43
6.4. SEFs in adolescents with CP (Study V).................................................. 45
6.4.1. Tactile stimulation................................................................... 45
6.4.2. Median nerve stimulation........................................................ 45
6.4.3. Comparison of results from MEG, MRI, and behavioral tests 48
6.4.4. Effect of gestational age...........................................................49
7. DISCUSSION........................................................................................................ 50
7.1. Methodological considerations............................................................... 50
7.2. SEFs to median nerve stimulation.......................................................... 51
7.2.1. Healthy newborns.................................................................... 51
7.2.2. CP patients............................................................................... 53
7.3. SEFs to tactile stimulation...................................................................... 53
7.3.1. Healthy newborns.................................................................... 53
7.3.2. Development............................................................................ 54
7.3.3. Very preterm infants................................................................ 55
7.3.4. CP patients............................................................................... 55
7.4. SEFs from the ipsilateral primary somatosensory cortex (SIi)............... 56
7.5. Correlation of SEFs with behavioral and MRI data in the very preterm
infants and CP patients...................................................................................57
8. CONCLUSIONS................................................................................................... 58
ACKNOWLEDGEMENTS....................................................................................... 59
REFERENCES.......................................................................................................... 61
ABBREVIATIONS
AH
ANOVA
AS
CNS
CP
ECD
EEG
ELBW
EMG
EOG
FLAIR
fMRI
GABA
GW
ISI
IVH
MEG
MN
MRI
PPC
PVL
QS
REM
SD
SEF
SEP
SI
SIc
SIi
SII
SIIc
SIIi
SQUID
SWS
TMS
UH
US
WMD
Affected hemisphere
Analysis of variance
Active sleep
Central nervous system
Cerebral palsy
Equivalent current dipole
Electroencephalography
Extremely low birth weight
Electromyography
Electro-oculography
Fluid-attenuated inversion recovery
Functional magnetic resonance imaging
Gamma-aminobutyric acid
Gestational week
Interstimulus interval
Intraventricular hemorrhage
Magnetoencephalography
Median nerve
Magnetic resonance imaging
Posterior parietal cortex
Periventricular leukomalacia
Quiet sleep
Rapid eye movement
Standard deviation
Somatosensory evoked magnetic field
Somatosensory evoked potential
Primary somatosensory cortex
Contralateral primary somatosensory cortex
Ipsilateral primary somatosensory cortex
Secondary somatosensory cortex
Contralateral secondary somatosensory cortex
Ipsilateral secondary somatosensory cortex
Superconducting quantum interference device
Slow wave sleep
Transcranial magnetic stimulation
Unaffected hemisphere
Ultrasound
White matter damage
6
LIST OF ORIGINAL PUBLICATIONS
This thesis is based on the following publications:
I
Lauronen L, Nevalainen P, Wikström H, Parkkonen L, Okada Y, Pihko E.
Immaturity of somatosensory cortical processing in human newborns. NeuroImage 2006;
33: 195–203.
II
Nevalainen P, Lauronen L, Sambeth A, Wikström H, Okada Y, Pihko E.
Somatosensory evoked magnetic fields from the primary and secondary somatosensory
cortices in healthy newborns. NeuroImage 2008; 40: 738–745.
III
Nevalainen P, Pihko E, Metsäranta M, Andersson S, Autti T, Lauronen L. Does
very premature birth affect the functioning of the somatosensory cortex? –
A magnetoencephalography study. Int J Psychophysiol 2008; 68: 85–93.
IV
Pihko E, Nevalainen P, Stephen J, Okada Y, Lauronen L. Maturation of
somatosensory cortical processing from birth to adulthood revealed by
magnetoencephalography. Clin neurophysiol 2009; 120: 1552–1561.
V
Nevalainen P, Pihko E, Mäenpää H, Valanne L, Lauronen L. Bilateral
abnormalities of somatosensory cortical processing in hemiplegic cerebral palsy.
Submitted.
7
1. ABSTRACT
Background: Until recently, objective investigation of the functional development of the
human brain in vivo was challenged by the lack of noninvasive research methods.
Consequently, fairly little is known about cortical processing of sensory information even
in healthy infants and children. Furthermore, mechanisms by which early brain insults
affect brain development and later brain function are poorly understood. Deeper
understanding of these phenomena is critical in order to provide the best possible care for
infants and children with early brain lesions and those at risk for such insults and future
neurological deficits.
Purpose and methods: In this thesis we used magnetoencephalography (MEG) to
investigate the function of the somatosensory system of infants and children. The first
studies on healthy individuals of different ages (newborns, infants, children, and adults)
aimed at characterizing the normal developmental pattern of somatosensory evoked
magnetic fields (SEFs) to stimulation of the hand area. We then applied this knowledge
about normal neonatal SEFs and their development with age in two patient populations:
very preterm infants at risk for neurological disorders and adolescents with hemiplegic
cerebral palsy (CP).
Results: In newborns, stimulation of the hand activated both the contralateral primary
(SIc) and secondary somatosensory cortices (SIIc). At both areas, the SEF characteristics
differed from those of adults. While in adults the current orientation of the earliest SIc
SEFs to median nerve (MN) stimulation quickly switches from anterior during the initial
deflection to posterior during the second deflection, in newborns only an anteriorly
pointing current source with a prolonged duration was detected at SIc. The same was
present after tactile stimulation. Moreover, in newborns SIIc activity was enhanced during
quiet sleep in contrast to the absence of SIIc responses during slow-wave-sleep in adults.
After the newborn period, the early SIc SEF pattern systematically transformed with age,
so that by age 2, the main early adult-like components were present.
In the very preterm infants, at term age the SIc and SIIc were activated at similar latencies
as in the healthy fullterm newborns, but the SIc activity was weaker in the preterm group.
In addition, the SIIc response was absent in four out of the six infants with brain lesions of
the underlying hemisphere. In the CP adolescents, the types of underlying brain lesions
included both subcortical as well as cortico-subcortical defects. In the patients with pure
subcortical lesions, contrasting their unilateral clinical symptoms, the SIc SEFs of both
hemispheres differed from those of controls. The distance between SIc representation
areas for digits II and V was shorter and MN SEF morphology was altered, both
bilaterally. In four of the five patients with cortico-subcortical brain lesions no normal
early SEF components were evoked by stimulation of the palsied hand. The degree of
alterations in MN SIc SEF, of all CP patients, correlated not only with lesion size and
location on magnetic resonance images, but also with motor and tactile performance.
8
Conclusions: We showed in a relatively large number of newborn infants that
somatosensory stimuli evoke activity at both the SIc and SIIc already a few days after
fullterm birth. This demonstrates that the connections to and the neurons at these areas are
developed enough to produce synchronous activation detectable extracranially. However,
at this early age, the fundamental discrepancies between the cortical activation patterns in
newborns and adults reflect the still developmental stage of the newborns‟ somatosensory
system. Further maturation of the somatosensory system is manifested in the systematic
change in the early SEFs during the first years of life. In the very preterm infants, the lack
of the SIIc response, in particular, was associated with brain lesions. Determining the
prognostic value of this finding remains a subject for future studies, however. In the
patients with hemiplegic CP, the various uni- and bilateral SEF alterations reflect the
complex nature of functional reorganization after an early brain insult. The wide spectrum
of organization of sensorimotor functions underlying the common clinical symptoms, calls
for investigation of more precisely designed rehabilitation strategies resting on knowledge
about individual functional alterations in the sensorimotor networks.
9
2. INTRODUCTION
At the time of fullterm birth, development of the central nervous system (CNS) of a
newborn infant is far from being complete. Transient fetal brain structures still exist
(Kostovic and Rakic, 1990) and neurotransmitter systems are undergoing marked changes
(Ben-Ari et al., 2004; Herlenius and Lagercrantz, 2004; Dzhala et al., 2005). Dendritic
growth and synaptogenesis continue actively for months or even years after birth
(Huttenlocher and Dabholkar, 1997; Gilbert, 2006), whereas myelination, axonal
withdrawal, and synapse elimination can continue up to the second decade of life
(Huttenlocher and Dabholkar, 1997; Gilbert, 2006). Due to the ongoing development of
the CNS, early brain insults may result in different clinical outcomes than those in
adulthood. The mechanisms underlying many developmental neurological deficits are,
however, poorly understood because objective investigation of the functional development
of the human brain in vivo has been difficult due to a lack of noninvasive investigation
methods.
Most knowledge on the function of the somatosensory system in human infants and
children comes from behavioral studies and recordings of somatosensory evoked
potentials (SEPs) on the scalp with electroencephalography (EEG). Even in neonates,
tactile object recognition has been explored with habituation paradigms (Streri et al.,
2000; Sann and Streri, 2008), whereas more precise techniques assessing different
somatosensory modalities (e.g. pressure, proprioception, and thermal discrimination)
separately are applicable in older children (Thibault et al., 1994). The functional integrity
of the somatosensory pathways has been studied with SEPs recorded from the scalp
(Hrbek et al., 1973; Desmedt et al., 1976; Zhu et al., 1987; Willis et al., 1984; Laureau et
al., 1988; George and Taylor, 1991) and SEP abnormality has predicted future cerebral
palsy (CP) (e.g. White and Cooke, 1994; Pike and Marlow, 2000). In recent decades,
several new noninvasive brain research tools have revolutionized the field of
neuroscience, but few studies have investigated infants or children.
Magnetoencephalography (MEG) reflects, similar to EEG, cortical neuronal activation at a
temporal resolution of millisecond scale. MEG, however, surpasses EEG in spatial domain
as MEG is less sensitive to inhomogenities of the tissue between the active brain source
and the extracranial measuring device, making source localization easier (Hämäläinen et
al., 1993). This is particularly advantageous in infants with open fontanels interfering with
EEG source localization and age related skull thickness discrepancy complicating
comparisons between age groups (Flemming et al., 2005).
In this thesis we used MEG to explore somatosensory cortical function in newborns and
infants. The aim was to characterize the typical features of newborn somatosensory
evoked magnetic fields (SEFs) and their developmental course during the first years of
life. This information was then utilized in further studies involving very preterm infants
who are at risk for future neurological deficits and adolescents with hemiplegic cerebral
palsy.
10
3. REVIEW OF LITERATURE
3.1. Magnetoencephalography (MEG)
3.1.1. Neural basis
Magnetoencephalography (MEG) signals are thought to mainly reflect synaptically
induced intracellular currents flowing in the apical dendrites of cortical pyramidal neurons
(Figure 1A). At chemical synapses, neurotransmitters mediate opening or closing of ion
channels on the postsynaptic cell membrane resulting in current flux across the membrane
(Kandel, 2000). At the site of an excitatory synapse, the net transmembrane current flow is
directed into the cytoplasm locally depolarizing the originally negatively charged interior
of the neuron. This site, where the positive current is directed inward, is called a current
sink. From the current sink, the current flows along the dendrite to exit across the
membrane at other sites, current sources (Figure 1B). At inhibitory synapses,
neurotransmitter binding induces a current source at the site of the synapse resulting in
local hyperpolarization of the postsynaptic neuron (Kandel, 2000). Cortical pyramidal
cells receive excitatory input from, e.g., subcortical structures and other pyramidal cells,
whereas inhibitory input mostly comes from local interneurons. Excitatory synapses are
usually axodendritic, while inhibitory synapses often lie on the cell body or at the base of
an axon (DeFelipe et al., 2002; Spruston, 2008).
From a distance the net intracellular currents seem like current dipoles oriented along the
dendrites (Hämäläinen et al., 1993). MEG signals are proportional to the magnitude of this
net intracellular current, whereas the influence of the transmembrane current is negligible
and that of the return passive-current very small. Traditionally, the dendrites were
considered passive cable-like structures and consequently, the intracellular currents as
passive products of the postsynaptic potentials. A recent series of studies, however,
indicates that various active conductances (i.e. voltage- and calcium-dependent ion
channels) on the dendrites and soma of cortical neurons also play a role in shaping
neuronal activity and, hence, the temporal waveform of MEG signals (Okada et al., 1997;
Wu and Okada, 1998; 1999; 2000; Murakami et al., 2002; 2003, Murakami and Okada,
2006).
In vivo MEG measurements reflect brain activity at the level of neuron populations.
Activity of cortical pyramidal cells is effectively summated, because their apical dendrites
are arranged in parallel with each other towards the pial surface (Figure 1B). On the
contrary, non-pyramidal cells possessing more randomly oriented dendritic trees form
electrically closed fields and contribute little to MEG signal. As the dipole moment for a
single pyramidal cell is on the order of 0.2 pAm (Murakami and Okada, 2006),
synchronous activity of tens of thousands of pyramidal neurons produces current dipoles
with extracranially recordable moments on the order of 10 nAm (Hämäläinen et al., 1993).
The summation of postsynaptic potentials lasting tens of milliseconds is also temporally
effective. On the contrary, although the voltage changes during action potentials are
significantly greater than those associated with postsynaptic potentials, action potentials
11
contribute little to MEG signal, because of poor temporal summation due to their short
duration of 1 ms. In addition, the magnetic field of a quadrupolar action potential more
rapidly falls off with distance than that of a current dipole.
It should be noted that the net direction of the intracellular current flow (towards pia vs.
towards the white matter) depends on the site of the initial current sink/source on the
pyramidal cells. Even in the oversimplified “cable model”, the orientation of an
intracellular dipole formed by an active sink (excitation) at the distal end of an apical
dendrite would equal that formed by an active source (inhibition) at the somatic end of the
dendrite (Figure 1B). Furthermore, considering the active conductances on dendrites, it is
evident, that the nature of the synaptic activity, excitatory vs. inhibitory, can not be
determined solely based on extracranial signals.
Figure 1. A) A schematic illustration of a pyramidal neuron. B) Direction of the intracellular current flow
induced by excitatory synapses located at different portions of the apical dendrite and an inhibitory synapse
located on the soma of pyramidal cells with “passive dendrites”. The transmembrane currents and
return-passive currents are not shown.
3.1.2. Theoretical background of modeling MEG signals
An electric current flowing inside a conductor produces a magnetic field detectable
outside the conductor. In MEG, the activity dynamics of populations of cortical neurons
are investigated by recording the magnetic fields outside the head. The distribution of the
primary neuronal currents inside the head, however, cannot be uniquely determined from
these extracranial magnetic fields. Therefore, some preconditions are necessary for
12
successful analysis of neuromagnetic data. All MEG source modeling approaches are
based on a comparison of the measured data and that predicted by a model. In many
situations, accurate estimates are obtainable by considering the brain as a spherical
conductor, which simplifies further calculations. In a spherical conductor, currents
oriented radially with respect to the sphere surface or located in the center of the sphere do
not produce an external magnetic field. For MEG this means that neuronal currents
oriented tangentially with respect to the skull, i.e., fissural sources, have the greatest
influence on the recorded signal (For a review, see Hämäläinen et al., 1993).
The classical source model for MEG is the equivalent current dipole (ECD), which is
useful in situations where the neuronal activation is restricted to a small area of the cortex.
Such activity can be represented as a current dipole at the center of gravity of the active
source. The magnitude, direction, and location of the ECD are estimated with the least
squares search, which finds the set of parameter values that minimizes the difference
between the measured magnetic fields and the fields predicted by the model. The ECD
model performs well even when multiple sources are active simultaneously, as long as
they are relatively far away from each other (Hämäläinen et al., 1993).
3.1.3. Instrumentation
The weak extracranial magnetic signals are detected with sensors composed of a
superconducting flux transformer connected to a SQUID (Superconducting QUantum
Interference Device), which is a superconducting ring interrupted by two Josephson
junctions. To maintain the superconductivity, the sensors are kept in liquid helium. In
addition to the brain signal, the sensors pick up environmental noise, which can be several
orders of magnitude higher than the brain signal. Therefore, the measurements are
generally conducted in a magnetically shielded room. Additional noise cancellation can be
obtained with certain flux transformer configurations. (Hämäläinen et al., 1993)
The simplest flux transformer configuration is the magnetometer, which has a single
pick-up coil (Hämäläinen et al., 1993). Magnetometers measure the magnetic field
component perpendicular to the plane of the pick-up coil and, thus, give two response
maxima with opposite field directions on opposite sides of a small dipolar source. In
addition to nearby sources, magnetometers are also sensitive to sources further away. The
sensitivity to such distant, often interfering, sources can be decreased with gradiometric
configuration having an additional compensation coil used to cancel far-away interference
sources manifesting themselves as homogeneous magnetic fields. The pick-up and
compensation coils of a gradiometer can be arranged, e.g., along the same radial axis with
the former closer to head surface (axial gradiometer) or side by side in the same plane
(planar gradiometer). Planar gradiometers measure the change of the field component
along the plane and, consequently, show maximal responses just above source areas,
whereas the axial gradiometers measure the change of the radial field component resulting
in two opposite maxima in a similar manner to magnetometers (Hämäläinen et al., 1993).
The MEG recordings of this study were performed with a whole-head helmet-shaped
sensor array consisting of 306 independent sensors: 204 planar gradiometers and
13
102 magnetometers (Elekta Neuromag®, Elekta Oy, Helsinki, Finland). Additionally, four
of the infants of Study IV were measured with a pediatric MEG prototype „babySQUID‟
(Okada et al., 2006), which has 76 first-order axial gradiometers.
3.1.4. The role of MEG within the field of current brain research
At present, a number of noninvasive brain research tools are available, but none is superior
to the others both in time and space. Functional magnetic resonance imaging (fMRI) has
an excellent spatial resolution, but does not allow accurate investigation of the fast
temporal dynamics of the brain networks due to the slowness of the hemodynamic
changes it reflects. MEG and EEG, which both reflect electrical currents in the brain,
provide the best temporal accuracy. They have, however, important differences making
them too complementary to each other. While MEG is insensitive to strictly radial
currents, EEG reflects currents of all orientations. MEG is, however, well-suited for
investigation of areas within walls of sulci, which are difficult to reach with other
electrophysiological means, including invasive intracranial recordings (Hari et al., 2010).
Furthermore, inhomogenities between the active brain source and the measuring device
smear the EEG distributions, while MEG is practically transparent to them (Hämäläinen et
al., 1993). This is particularly advantageous in infants with open fontanels (Okada et al.,
1999; Flemming et al., 2005). Nevertheless, to date MEG studies in infants are scarce, and
development of devices particularly designed for infant studies has only advanced in
recent years (e.g., Okada et al., 2006; Adachi et al., 2010).
3.2. The somatosensory system
3.2.1. Functional anatomy in adults
The sense of touch is mediated from the skin mechanoreceptors via presynaptic dorsal root
ganglion neurons, to target structures of the central nervous system (CNS). Some branches
of these first order afferents terminate within the spinal grey matter to form local reflex
circuits. Others carry the information cranially in the ipsilateral dorsal columns of the
spinal cord to the gracile and cuneate nuclei of the medulla (Figure 2). Projections from
these medullary nuclei cross to the contralateral side in the brain stem and continue via the
contralateral medial lemniscal pathway to the ventroposterior complex of the thalamus.
The thalamocortical axons then project through the internal capsule to the contralateral
primary somatosensory cortex located in the postcentral gyrus of the anterior parietal lobe
(Figure 2) (Kandel, 2000).
The primary somatosensory cortex (SI) consists of four distinct areas known as the
Brodmann‟s areas 3a, 3b, 1, and 2 (Figure 2). Cutaneous information is mainly processed
in areas 3b and 1, and proprioceptive information in area 3a. Area 2 is thought to integrate
the two types of information (Hsiao, 2008). Each area of SI contains a complete
representation of the body, a somatotopical map (Figure 2). The areas of the body with the
highest density of mechanoreceptors (e.g. digits and lips) proportionally capture the
14
largest areas at SI (Kandel, 2000). Neurons at areas 3b and 1 have exclusively
contralateral receptive fields, except for those representing areas in the body midline, such
as the face and oral cavity. Part of the area 2 neurons may, however, have bilateral
receptive fields even in the hand area. The most likely pathway for the ipsilateral cortical
input is through the corpus callosum, whereas no evidence supports straight ipsilateral
connections from the periphery to the primary somatosensory area. Again an exception is
the trigeminal area, which may also be bilaterally represented at the level of the thalamus
(Iwamura, 2000). In the vertical dimension, the neocortex, including the somatosensory
area, is arranged into 6 layers (Kandel, 2000). Layer I, the most superficial layer, contains
mostly dendrites of cells in the deeper layers as well as axons of cells located in other
areas of the cortex. Layers II and IV are comprised of non-pyramidal granule cells,
whereas layers III and V contain pyramidal cells. Layer VI is more heterogeneous
(Kandel, 2000).
In addition to the four densely interconnected areas of SI, many higher order association
areas participate in processing of somatosensory information. The secondary
somatosensory cortex (SII) is located at the lateral end of the postcentral gyrus on the
upper bank of the Sylvian fissure. SII neurons have large, bilateral receptive fields
(Whitsel et al., 1969) and it has been suggested to integrate information from the two body
halves (Simoes and Hari, 1999; Simoes et al., 2001). In addition, the SII has been linked
with integration of somatosensory and motor information (Huttunen et al., 1996; Forss
and Jousimäki 1998), haptic size and shape perception (Hsiao, 2008), and tactile learning
and memory (Ridley and Ettlinger, 1978). Moreover, SII is consistently activated by
painful stimuli such as laser (for a review see Garcia-Larrea et al., 2003).
Somatosensory information is also processed at the posterior parietal cortex (PPC), located
posterior to the SI and including Brodmann‟s areas 5 and 7. PPC has connections to
dozens of cortical regions and subcortical structures, and serves a variety of complex
functions (Hyvärinen, 1982). In monkeys, area 5 neurons are activated by somatosensory
stimuli as well as movements (Mountcastle et al., 1975; Arezzo et al., 1981) and area 7
neurons respond to somatosensory and visual stimuli (Hyvärinen, 1982). Thus, PPC is
involved with gross-modal integration of somatosensory and visual information (Sack,
2009) and construction of a reference system of personal and extrapersonal space, to be
used in guiding goal-directed movements (Hyvärinen, 1982). Accordingly, in humans
lesions of these areas may cause, e.g., misreaching for targets and a deficit called sensory
neglect, in which information from the contralateral body half and visual space is
disregarded despite intact somatic and visual senses.
15
Figure 2: Below: the dorsal column-medial lemniscal pathway mediating the sense of touch. Information
from the hand is mediated by the cuneate tract and nucleus. The somatotopical organization of the SI and the
location of the SII on the upper lip of the Sylvian fissure are shown on the right. Up left: The primary
somatosensory cortex (SI), primary motor cortex (MI), and secondary somatosensory cortex (SII) shown on
a 3D reconstruction of the brain. In the insert: the four cytoarchitectonic areas of the SI. (SI = primary
somatosensory cortex, SII = secondary somatosensory cortex, MI = primary motor cortex, VPL = ventral
posterior lateral)
16
3.2.2. Development
3.2.2.1. The neocortex
The development of the central nervous system (CNS) begins in the process of neurulation
when the neural plate transforms into the neural tube. Thereafter, the cranial part of the
neural tube bulges to form the primary and secondary vesicles of the brain (Gilbert, 2006).
The neural tube is originally composed of a one-cell-layer-thick germinal
neuroepithelium, i.e., the ventricular zone, the proliferative cell layer of the embryo
(Bystron et al., 2008). The cortical plate, which will eventually develop into the neocortex,
is visible by the 12th gestational week (GW)1 (Radoš et al., 2006). During the next two to
three weeks, two new layers become distinguishable below the cortical plate: a transient
fetal structure called the subplate and the intermediate zone, which will form the cortical
white matter (Bystron et al., 2008). The subplate is suggested to serve as a “waiting
compartment” for the thalamic and other nerve afferents and as a fetal circuitry
compartment for potential interactions between these afferents and subplate neurons.
Below the future SI, the subplate forms at around the 14th and 15th GW. Thereafter, it
grows in thickness due to accumulation of afferent axons. It is the most prominent fetal
layer during late second and early third trimester and at its thickest four times thicker than
the cortical plate. Thereafter, it starts dissolving towards the end of the third trimester,
being mostly resolved around the end of the first postnatal month below the SI (Kostović
and Rakić, 1990).
Lamination of the cortical plate into the six distinct layers begins around the end of the
second trimester in an inside out manner. The earliest born neurons form the deepest
cortical layer (layer VI) and the last born ones the superficial layer II. The outermost
layer I originates from the marginal zone (Bystron et al., 2008). By fullterm age, most
cortical neurons have attained their destinations at the different cortical layers (Kostović et
al., 1995). Laterally the cortex is organized into over 40 histologically and functionally
distinct regions. The mechanisms regulating this area patterning include intrinsic genetic
factors as well as extrinsic influences relayed to the cortex via thalamocortical afferents
(O‟Leary et al., 2007). Folding of the cerebral sulci and gyri begins during the
3rd trimester. By the end of the 24th GW the basic sulcal pattern has been delineated and
the central sulcus is visible (Holmes, 1986). Further folding of sulci and gyri, however,
continues throughout the third trimester.
1
GW, used in clinical practice, is traditionally calculated from the first day of the last menstruation, but
presently determined by ultrasound scans during pregnancy. Gestational age is, thus, 2 weeks higher than the age
calculated from conception.
17
3.2.2.2. Thalamocortical connections
By the 12th to 15th GW, three CNS fiber systems are recognizable in both histological and
MRI sections: the corpus callosum, the fornix, and the cerebral stalk, a massive connection
between the diencephalon and telencephalon containing all projection fibers of the internal
capsule, including the thalamocortical afferents (Radoš et al., 2006). In the primary
somatosensory areas, the thalamic axons grow through the subplate between the 17th and
26th GW accumulating into its superficial parts at around the 23rd to 25th GW (Kostović
and Rakić, 1990; Kostović et al., 1995). During the early preterm period (26th–34th GW),
these axons grow into the cortical plate forming the first thalamocortical connections, and
thus constituting the anatomical pathway for sensory impulses from the periphery to the
cortex before term. After the 35th GW, also the long corticocorticals (e.g. callosal fibers)
grow into the cortical plate (Kostović and Jovanov-Milošević, 2006). Fairly little is known
about further development of cortical connections in the neonatal period. Presumably,
growth of the long afferents and long corticocortical connections ceases, but that of short
corticocortical connections continues even several months postnatally (Kostović and
Jovanov-Milošević, 2006). Initially, there is marked overproduction of axonal connections
which will then be withdrawn during later development (Innocenti and Price, 2005).
3.2.2.3. Synaptogenesis
Dendritic growth begins during the 2nd trimester. It proceeds earlier for the cortical
pyramidal neurons of layer V, followed by cells in the more superficial layers
(Marin-Padilla, 1970; Mrzljak et al., 1992). The first synaptic contacts appear above and
below the developing cortical plate already by the 11th GW and thereafter the number of
synapses increases progressively. Beginning at around the 25th GW synapses, including
contacts from the thalamocortical afferents, are gradually transferred to different layers of
the cortex (Molliver et al., 1973). Several animal studies suggest that the first functional
synapses on cortical pyramidal cells use gamma-aminobutyric acid (GABA) as their
neurotransmitter (Ben-Ari et al., 2004) and GABAA type receptors (Herlenius and
Lagercrantz, 2004). In the adult CNS, GABA is a common inhibitory neurotransmitter. At
early stages of development, however, GABAA receptor activation leads to depolarization
of the postsynaptic neuron, due to a high intracellular Cl– concentration. Thus, these
earliest synapses are initially excitatory (Ben-Ari et al., 2004). The early excitatory actions
of GABA have been suggested to be a requirement for later excitatory glutamatergic
synapse development (Wang and Kriegstein, 2008).
The period of active synaptogenesis exhibits different time courses at different cortical
regions, continuing for several years postnatally in some areas (Huttenlocher and
Dabholkar, 1997). It starts during the 2nd trimester from the primary sensory areas and
proceeds towards higher order areas, following the course of myelination. Synaptogenesis
seems to be originally intrinsically regulated and relatively random, whereas stabilization
and elimination of synapses is activity dependent. Thus, marked overproduction of
synapses occurs during development and, after a postnatal plateau period, the number of
synapses decreases to only 60% of the maximum during the first two decades of life. The
18
synapses that are not included in neuronal circuits are gradually eliminated (Huttenlocher
and Dabholkar, 1997).
3.2.2.4. The brain and somatosensory system of a newborn
In conclusion, at the time of fullterm birth, the anatomical substrate for somatosensory
information to reach the cerebral cortex exists. In many ways, the development of the
CNS, however, is incomplete at fullterm age. The subplate zone is dissolving but still
exists, the neurotransmitter systems are undergoing marked changes, and the organization
of cortical circuits is in progress. During the first postnatal months, synaptogenesis and
establishment of short corticocortical connections are at their busiest. Developmental
strengthening of appropriate cortical circuits, activity dependent elimination of synapses,
and axonal withdrawal continue along with myelination for several years after birth.
3.3. Preterm infants
According to the World Health Organization (WHO) International Classification of
Diseases, the term “preterm infant” refers to being born before completing the
37th gestational week (GW) and “extremely immature” before completing the 28th GW.
Low birth weight refers to a birth weight between 1000 and 2499 g and “extremely low
birth weight” (ELBW) to a birth weight of 999 g or less (WHO, 2007). According to the
National Birth Register in Finland, 59 808 infants were born in 2008. Of these, 5.7% were
born <37 GW, 1% <32 GW, and 0.4% <28 GW (Vuori and Gissler, 2009).
The increased survival of the extremely preterm infants is one of the greatest
achievements of contemporary neonatal medicine (Vohr et al., 2005). Many of these
infants develop with neurological impairments, however. Preterm birth associates with
increased morbidity in several areas. Pulmonary problems account for most deaths with
respiratory distress syndrome being the leading cause (Wilson-Costello et al., 2005). Later
disabilities involve deficits in sensorimotor development, cognition, vision, and hearing
(Marlow et al., 2005; Mikkola et al., 2005). Risk factors for adverse neurological outcome
include periventricular leukomalacia (PVL), severe intraventricular hemorrhage (IVH),
sepsis, bronchopulmonary dysplasia, and use of postnatal steroids (Vohr et al., 2005;
Mikkola et al., 2005). In current clinical practice, cranial ultrasound scans are performed
in the neonatal period to identify neonates at risk for neurodevelopmental deficits (Neil
and Inder, 2004). An unfavorable prognosis is associated with IVH of grades III and IV
and cystic PVL. On the other hand, many preterm infants with normal cranial ultrasound
scans also have adverse outcomes (Laptook et al., 2005). At term, moderate to severe
white matter abnormalities in MRI predict cognitive and motor dysfunction (Woodward et
al., 2006).
The adverse neurological outcome in preterm infants is caused by a complex combination
of primary destructive events and secondary maturational and trophic disturbances (Volpe,
2009a; 2009b). Approximately 90% of the neurological deficits in the preterm survivors
19
are now caused by white matter damage (WMD) (Khwaja and Volpe, 2008). It may
include focal necrosis of the deep white matter (loss of all cellular elements) and a more
diffuse injury in the central cerebral white matter (Figure 3). The focal necroses may be
macroscopic forming cysts (cystic PVL) or microscopic (non-cystic PVL), the latter being
significantly more common. A third form of WMD only encloses the diffuse component.
The sites of focal necrosis are located at arterial border and end zones in the
periventricular white matter. Low physiological blood flow to the white matter and its
impaired autoregulation in preterm infants increase the risk of hypoxia and ischemia in
these areas (Khwaja and Volpe, 2008). Moreover, WMD is accompanied by previously
unrecognized neuronal and axonal loss in the cerebral white matter, thalamus, basal
ganglia, cerebral cortex, brainstem, and cerebellum (Volpe, 2009a).
IVH originates from the ventricular zone (i.e. germinal matrix), which is still functionally
active extrauterinally in preterm infants. Because of the impaired regulation of the cerebral
blood flow and mechanical fragility, this highly vascularized area, located
subependymally and beside the lateral ventricles, is prone to hemorrhage. The hemorrhage
and associated periventricular hemorrhagic infarctions may then lead to destruction of the
white matter and significant tissue loss, interruption of thalamocortical fibers, and
impaired development of the overlying cortex (Volpe, 2009a).
Figure 3. Schematic images displaying the typical brain areas injured in preterm infants. A) White matter
damage (WMD): macroscopic (cystic PVL) and microscopic (non-cystic PVL) focal components as well as
areas of diffuse injury. B) Intraventricular hemorrhage (IVH) originating from the germinal matrix with and
without periventricular hemorrhagic infarction.
20
3.4. Cerebral palsy (CP)
3.4.1. Overview
Cerebral palsy (CP) is a persistent disorder of movement and posture caused by a
non-progressive lesion of the developing brain. It is a symptom complex with a
multifactorial etiology rather than a specific disease. In Europe, the incidence of CP was
2 to 3 per 1000 live-born infants in the year 2000 (Cans et al., 2000). The incidence of CP
depends on birth weight and gestational age (Pharoah et al., 1998; Vohr et al., 2005) and
presently preterm infants constitute a considerable proportion of the children diagnosed
with CP annually. In a recent study, 11% of infants born before 32nd GW and 18% of the
ones born before 27th GW developed CP (Vohr et al., 2005). A recent Finnish study
reported rates of 14% in ELBW infants in total and 19% in ELBW infants born <27th GW
(Mikkola et al., 2005).
In most CP patients, several risk factors as well as prenatal, perinatal, and postnatal events
account for the disability. In preterm infants, PVL or IVH are the most common types of
brain pathology underlying CP (Vohr et al., 2005). Corticospinal and thalamocortical
tracts pass close to the affected areas and are prone to injury (Figure 3). In fullterm infants,
the etiological causes include malformations, infections, vascular episodes, and head
injury (Cans et al., 2004). CP can be classified into spastic, dystonic, ataxic, dyskinetic,
and choreoathetotic forms based on the predominant movement constraint. These are
further grouped according to the affected extremities (mono-, di-, hemi-, and quadriplegia)
(Cans et al., 2000). The diagnosis of CP is often delayed. Clinical symptoms may not be
detectable until 6 months to 2 years of age in infants who develop hemiplegia. In some,
even deterioration and loss of pre-existing skills occurs (Bouza et al., 1994).
3.4.2. Organization of the sensorimotor system in hemiplegic CP
During normal development in humans, the corticospinal axons reach the lower cervical
spine by the 26th GW and extensive innervation of spinal neurons, including monosynaptic
innervation of motoneurons, occurs before fullterm birth (Eyre et al., 2000). It seems that
this corticospinal motor innervation is originally bilateral, and in normally developing
children, the ipsilateral connections are mostly withdrawn during the first two years of life
(Eyre et al., 2001). After an early unilateral brain insult, the motor representation may
organize either in the normal location at the contralateral hemisphere, i.e., ipsilesionally,
or at the ipsilateral hemisphere, i.e., contralesionally, depending on the timing, location,
and extent of the lesion (Staudt et al., 2002; 2004; 2006; Eyre, 2007). The mechanism for
preservation of the ipsilateral corticospinal projections may involve activity-dependent
competition for spinal synaptic space (Eyre, 2007). In several infants who had suffered a
unilateral perinatal stroke (either arterial or venous infarction), motor evoked potentials
(MEPs) elicited in the muscles of the contralateral arm by transcranial magnetic
stimulation (TMS) of the affected hemisphere were reduced systematically with age.
Eventually, the contralateral MEPs that were present right after the insult gradually
disappeared during the first 2 years of life whereas the ipsilaterally (i.e. from the
21
unaffected hemisphere) evoked MEPs persisted in the palsied hand (Eyre et al., 2007).
This gradual withdrawal of normal contralateral connections and preservation of ipsilateral
connections to the palsied hand may also account for the delayed manifestation of signs of
hemiplegia and loss of acquired motor skills in some children (Eyre et al., 2007). The type
of reorganization (normal contralateral vs. preserved ipsilateral) is strongly associated with
neurological outcome. Normal hand motor control is only attained when the normal
contralateral connections persist, whereas ipsilateral motor representation is associated
with more severe motor impairment and mirror movements of the paretic hand (Staudt et
al., 2002; Eyre et al., 2007).
On the contrary, primary somatosensory representation has generally remained in the
ipsilesional hemisphere, even in patients with contralesionally organized motor
representation (Staudt et al., 2004; 2006; Guzzetta et al., 2007). In such patients, the
somatosensory thalamocortical tracts are indeed able to bypass the white matter lesions as
demonstrated with magnetic resonance diffusion tractography (Staudt et al., 2006). The
fiber count in the thalamocortical somatosensory tract in hemiplegic CP patients, however,
may be reduced (Thomas et al., 2005). The differences between reorganization patterns of
motor and somatosensory systems are suggested to arise from distinct developmental time
courses of thalamocortical and corticospinal connections (Kostović and Judaš, 2002;
Staudt et al., 2006).
3.5. Somatosensory evoked responses
The term “evoked response” signifies a temporary change in the electrical activity of the
brain induced by an external stimulus. This change can be detected extracranially with
MEG which records evoked magnetic fields.
3.5.1. Somatosensory evoked magnetic fields (SEFs) to stimulation of the hand area in
adults
In adults, the earliest cortical activation after somatosensory stimulation is detected at the
contralateral primary somatosensory cortex (SIc). Depending on the site of peripheral
stimulation, the location of the activated source varies according to the somatotopical
organization of SI. The first ever SEF study already reported the source to thumb
stimulation to be approximately 2 cm more lateral than that of little finger stimulation
(Brenner et al., 1978). Thereafter, SI somatotopy has been repeatedly demonstrated with
MEG (Baumgartner et al., 1991; Hari et al., 1993; Yang et al., 1993; Nakamura et al.,
1998). The hand representation area is located posterior to the omega-shaped curvature of
the central sulcus with the fingers occupying a 15–20 mm strip in the postcentral gyrus
(Okada et al., 1984; Baumgartner et al., 1991; Hari et al., 1993; Hari and Forss, 1999).
The somatotopical map shows remarkable plasticity after changes in peripheral input.
MEG has been able to detect its remodeling after, e.g., amputations (Flor et al., 1995) and
surgical separation of originally fused fingers in patients with syndactyly (Mogilner et al.,
1993).
22
After median nerve (MN) stimulation, the SIc SEF response consists of several
components: N20m, P35m (sometimes referred to as P30m), and P60m (Figure 4). All
these components have dipolar field patterns: the N20m equivalent current dipole (ECD)
points anteriorly, whereas the P35m and P60m ECDs point posteriorly. The N20m is
considered the analogue of the N20 SEP, the earliest cortical SEP component thought to
reflect the initial excitatory thalamic input to Broadman‟s area 3b of SI, and more
specifically, the depolarization of layer III pyramidal cell bodies and their proximal apical
dendrites (Allison et al., 1989; Allison et al., 1991b). A recent current source-density
analysis conducted in anesthetized piglets, however, revealed two dipolar generators
underlying the peak of N20/N20m, both directed towards the cortical surface. After the
arrival of the initial thalamocortical volley in layer IV, the current sink of the first
generator shifted towards more superficial layers (II–III) and the sink of the second
generator to layer V (Ikeda et al., 2005). Thus, the generation mechanism of the human
N20m may also still need to be further detailed.
The cell level generation mechanisms of the P35m and P60m are not well understood.
According to one theory (Huttunen and Hömberg, 1991; Wikström et al., 1996; Restuccia
et al., 2002; Huttunen et al., 2008), inhibitory postsynaptic potentials play a critical role in
the generation of the P35m. This suggestion is based on similar recovery times of
excitatory and inhibitory synapses and the N20m and P35m SEFs, respectively (Wikström
et al., 1996), as well as pharmacological manipulations (Huttunen et al., 2001; 2008).
Interestingly, patients with Angelman syndrome, caused by a deletion in the gene coding
one of the GABAA receptor subunits, lack the P35m response (Egawa et al., 2008).
Another theory proposes excitation of distal portions of the apical dendrites as the
generation mechanism of the P30 SEP, the analog of P35m SEF (Allison et al., 1989;
1991b). Furthermore, the more anterior location of the P35m, than N20m ECD, has led to
a suggestion of contribution from the primary motor area (MI) (Kawamura et al., 1996;
Porcaro et al., 2008). Excision of MI does not, however, affect N20-P30 SEPs (Allison et
al., 1991a), whereas they are completely abolished by SI excision (Allison et al., 1991a)
or lesion (Sonoo et al., 1991). Furthermore, since ECDs estimate the center of gravity of
the activation, an extended activated area along the omega-shaped hand section of the
central sulcus may explain the more anterior location of P35m ECD, (Huttunen, 1997).
The generation mechanisms underlying the P60m are probably even more complex and
many closely located areas are likely to contribute (Huttunen et al., 2006). Contribution
from area 2 in the postcentral sulcus was suggested due to a slightly more posterior
location of P60m ECD compared to N20m ECD (Huttunen et al., 2006). Furthermore, the
two responses, P35m and P60m, clearly react differently to some situations, despite their
similarities in current orientation, interstimulus interval (ISI) dependence (Wikström et al.,
1996), and response to certain pharmaceuticals (Huttunen et al., 2001; 2008). In a paired
pulse paradigm, P60m completely recovered with a 100-ms ISI, whereas the P35m was
strongly attenuated (Huttunen et al., 2008). In addition, patients with pediatric
degenerative CLN5 disease (a Finnish variant of late infantile neuronal ceroid
lipofuscinoses) have giant N20m and P35m SEFs, whereas the P60m is nonexistent
(Lauronen et al., 2002).
23
Compared with MN SEFs from the SIc, electrical stimulation of fingertips elicits SEFs at
SIc with similar morphology (N20m-P35m-P60m), but with approximately 4 ms longer
latency due to the more distal stimulation site (Kaukoranta et al., 1986). Also after airpuff
or tactile stimulation of the fingers, the initial response at around 30 ms (referred to as
M30 in this thesis) is generated by an anteriorly pointing dipolar source (Forss et al.,
1994b; Lauronen et al., 2006; Pihko et al., 2009), which in some subjects is too weak for
ECD modeling (Biermann et al., 1998; Mertens and Lütkenhöner, 2000; Simões et al.,
2001). M30 is likely to correspond to the MN N20m, and thus represent the earliest
thalamic input to SI. The most prominent tactile SEF response is, however, the deflection
following the M30 at around 45 to 50 ms with an underlying ECD pointing posteriorly
(Biermann et al., 1998; Mertens and Lütkenhöner, 2000; Simoes et al., 2001; Nevalainen
et al., 2006). We will refer to this deflection as M50 according to its approximate latency
in our studies. Though M50 can not be considered the exact analog of the MN P35m,
similar mechanisms are likely to underlie the two responses as the ECD properties are
very similar (Mertens and Lütkenhöner, 2000). The weaker amplitude of the tactile SEFs
from the SIc, compared to MN SEFs, is explained by the smaller amount of activated
afferents, though stimulation jitter may also play a role (Mertens and Lütkenhöner, 2000).
The commonly found latency delay of tactile vs. electrically elicited SEFs and SEPs (after
accounting for the more distant stimulus site, when comparing to MN at the wrist) may
arise from the mechanoreceptor transduction time and slower conduction velocity of
cutaneous afferents (e.g. Nakanishi et al., 1973; Hashimoto, 1987) or a longer stimulus
rise time as suggested by Hashimoto (1988).
In healthy adults, stimulation of the hand area does not generally evoke SEFs at the
ipsilateral SI (SIi) (e.g. Hari and Forss, 1999), though exceptions exist (MN stimulation:
Korvenoja et al., 1995; Kanno et al., 2003; tactile stimulation: Zhu et al., 2007; Pihko et
al., 2010). Furthermore, the early SIc MN responses are not affected by preceding
stimulation to the MN of the other hand (with 20−120 ms ISI), indicative of little to no
interaction of the responses from the two hands at SI. On the contrary, such conditioning
stimulus to the median or ulnar nerve of the same hand causes attenuation of most SIc
responses (Huttunen et al., 1992). Finally, contamination from the contralateral hand
could also explain the occasional detection of SIi SEFs (Hari and Imada, 1999). In certain
patient populations, however, SIi SEFs are frequent and may reflect increased
interhemispheric spread of cortical excitation. In fact, presence of SIi SEFs correlated with
the tendency for generalized seizures in patients with the Unverricht-Lundborg type of
progressive myoclonus epilepsy (Forss et al., 2001). Also, intracranial SEP recordings in
epilepsy patients evaluated for surgery have revealed weak activity at the SIi, but not
necessarily area 3b, in a minority of patients (Noachtar et al., 1997).
In contrast to the SI, as most SII neurons have bilateral receptive fields, SEFs are
commonly recorded from both hemispheres after unilateral stimulation (Hari et al., 1983;
1984; Hari and Forss, 1999). SII activity peaks at 60 to 80 ms after MN stimulation, often
slightly earlier in the contralateral SII (SIIc) (Hari and Forss, 1999). SII responses are
more variable and, in general, more dependent on the experimental set-up and vigilance
state of the subject than SI responses. For example, changes in stimulation frequency more
24
easily affect SII than SI responses (Hari et al., 1990; 1993; Wikström et al., 1996; Hamada
et al., 2003). Moreover, inputs from the two hands strongly interact at the SII (Simões and
Hari, 1999) as demonstrated by attenuation of SII responses after simultaneous (Shimojo
et al., 1996) or alternating stimulation (ISI 1.5 s) of the bilateral MNs (Wegner et al.,
2000). Furthermore, attending to the stimulus enhances the SII SEFs, whereas they
diminish during sleep stages S1 and S2 (Kitamura et al., 1996; Kakigi et al., 2003) and
become undetectable during slow wave sleep (SWS) (our own unpublished observation in
8 healthy adults).
Figure 4: SIc SEF responses to electrical stimulation of the left median nerve (MN, top part of the figure)
and tactile stimulation of the left index finger (bottom) in a healthy adult subject. The waveform is displayed
from one planar gradiometer channel over the source. Note that the amplitude scale is different for MN and
tactile stimulation. The contour maps show the magnetic field distribution reflected on the helmet surface at
the time of the main peaks: N20m, P35m, and P60m for MN stimulation as well as M30, M50, and a later
peak at 73 ms for tactile stimulation. The solid lines indicate magnetic flux entering and the dashed lines
magnetic flux exiting the head. Note that the contour step is 80 fT/cm for the MN responses and 20 fT/cm
for tactile responses.
In addition to the SI and SII, hand area stimulation evokes SEFs also at the posterior
parietal cortex (PPC) usually peaking at around 70 to110 ms. Areas on both the anterior
(area 2 of SI) and posterior (areas 5 and 7) walls of the postcentral sulcus, may contribute
in generating this activity (Forss et al., 1994a). While MN stimulation activates the
contralateral PPC, airpuff stimuli consistently activated the right PPC regardless of the
side of stimulation, suggesting predominance of the right PPC in processing of natural
stimuli (Forss et al., 1994b). Finally, activation of an area located on the mesial wall close
to the end of the central sulcus can be detected with MEG at approximately 110 to 140 ms,
particularly when the subject is attending to the stimulus (Forss et al., 1996). As the side
of this mesial source, contralateral vs. ipsilateral, varied between subjects, the authors
25
concluded bilateral activation to be most likely. The exact area generating this activity was
located clearly anterior to the supplementary sensory area and may, thus, involve the
mesial part of area 4 as well as the supplementary motor area. Regarding the role of these
areas in motor planning and the attention dependence of the mesial SEFs, this source may
reflect motor preparation in case a stimulus related movement would be needed (Forss et
al., 1996).
3.5.2. SEFs and SEPs in newborns and infants
The earliest newborn SEF studies showed that the early response to MN stimulation
consisted of two peaks at approximately 30 (referred to as n-M30 in this thesis to
discriminate it from the tactile M30 response in adults) and 60 ms (M60), whereas after
tactile stimulation of the index finger the 30-ms component was usually not
distinguishable from the broad 60 ms deflection (M60) (Pihko et al., 2005). In addition,
the response amplitudes of the tactile M60 and a later M200 were shown to depend on
sleep stage, both were higher in quiet (QS) than active sleep (AS) (Pihko et al., 2004). In
comparisons involving six newborns, the source locations of the MN components n-M30
and M60 did not significantly differ from each other, but a distinct generator area was
suggested for a later M200 (Pihko et al., 2005). One study investigated tactile SEFs in
infants at palmar (6–8 months) and pincers (11–21 months) grasp stages (Gondo et al.,
2001). In the latter group, the latency of the first cortical response was shorter, whereas the
amplitude of a later response peaking at around 100 ms was higher for the thumb, but not
the ring finger stimulation.
In contrast to the rare infant SEF studies, the developmental SEP literature is vast. The N1
peaking at around 30 ms at term age is the first prominent contralateral parietal response
to MN stimulation in infants (Desmedt and Manil, 1970; Hrbek et al., 1973; Laget et al.,
1976; Zhu et al., 1987; Laureau et al., 1988; Laureau and Marlot 1990; George and
Taylor, 1991; Karniski, 1992; Gibson et al., 1992). It develops to the adult N20 over
several years (e.g. Laget et al., 1976). Until approximately age 3, the N1 latency decreases
(Bartel et al., 1987; Zhu et al., 1987; Taylor and Fagan, 1988) due to the increase in
conduction velocity (García et al., 2000) following myelination and maturation of the
pathways. Thereafter, the latency starts to prolong as the effect of physical growth of the
body and limbs overpowers that of maturation. Despite the prolonging of absolute
latencies, the conduction velocities continue to increase for several years, particularly in
the central portion of the afferent pathways (Boor and Goebel, 2000; Müller et al., 1994).
Most SEP studies in newborns and infants concentrated on the earliest SEP components
(Zhu et al., 1987; Laureau et al., 1988; Laureau and Marlot 1990; George and Taylor,
1991; Gibson et al., 1992) and used filter settings not even allowing detection of
components with longer latencies (see Pihko and Lauronen, 2004). The ones also
considering the longer-latency components (Desmedt and Manil, 1970; Hrbek et al., 1973;
Laget et al., 1976; Karniski, 1992) consistently found, in term newborns, three deflections
following the early N1 response at the central contralateral area: a positive deflection at
approximately 100 ms, a negativity at around 150 ms, and a second positive peak at a
26
latency around 230 ms (Desmedt and Manil, 1970; Hrbek et al., 1973; Laget et al., 1976;
Karniski, 1992). Of these the later positive peak was more prominent in SWS (i.e. quiet
sleep) but attenuated in rapid eye movement sleep (REMS i.e. active sleep) (Desmedt and
Manil, 1970). Laget et al. (1976) further investigated development of the SEP morphology
in infants of different ages. Already at 2 to 6 weeks of chronological age, the wide
neonatal N1 was interrupted by a deflection of opposite polarity, which by the age of
7 to 16 weeks crossed the baseline. Whereas this initial “adult-like” N1-P1 sequence
appeared at such an early age, some adult-like features were only attained by the age of
3 to 4 years (Laget et al., 1976).
Median (Hrbek et al., 1973; Willis et al., 1984; Klimach and Cooke, 1988a, b; Majnemer
et al., 1990; Karniski, 1992; Karniski et al., 1992; Pierrat et al., 1996, 1997; Taylor et al.,
1996; Smit et al., 2000) and tibial nerve SEPs (White and Cooke, 1994; Pierrat et al.,
1997; Pike and Marlow, 2000) have been used to assess the functional integrity of the
somatosensory pathways also in preterm infants. MN stimulation elicits SEPs recordable
on the scalp as early as the 25th GW (Hrbek et al., 1973) and in well designed
measurement settings they can be detected within the first week of life in all
neurologically normal preterm infants born between the 26th and 32nd GWs (Taylor et al.,
1996). In the youngest preterm infants the most striking feature of the scalp SEP is a large
negative wave with a mean duration of 1500 ms in infants younger than 30 GW (Hrbek et
al., 1973). The amplitude of this wave gradually decreases with age and an earlier N1
component appears after the 29th GW (Hrbek et al., 1973). Its latency then decreases
rapidly towards term (Hrbek et al., 1973; Klimach and Cooke, 1988a; Karniski et al.,
1992; Taylor et al., 1996; Smit et al., 2000). Based on a longer latency of the N1 at term in
preterm infants compared with latencies reported from fullterm infants, Smit and
colleagues (2000) suggested delayed maturation of sensory pathways in the preterm
infants. This finding was, however, not corroborated by others (Klimach and Cooke,
1988a; 1988b).
In preterm infants, both abnormal MN (Klimach and Cooke, 1988b; Willis et al., 1989;
Majnemer et al., 1990; de Vries et al., 1992; Pierrat et al., 1997) and posterior tibial nerve
SEPs predict future cerebral palsy (CP) (White and Cooke, 1994; Pierrat et al., 1997; Pike
and Marlow, 2000). The specificity, sensitivity, and positive and negative predictive
values have, however, varied considerably between studies. This variation is probably
explained by differences in patient inclusion criteria, methods of SEP assessment, and
outcome measure as well as technical difficulties in reliably recording the responses,
particularly in the youngest infants (Smit et al., 2000). Moreover, with the accumulating
knowledge on brain development, it has become evident that the generally applied SEP
recording setups (adapted from adult studies) are in many ways suboptimal for studies of
preterm infants (see Vanhatalo and Lauronen, 2006).
27
4. AIMS
Our general aim was improving the knowledge on functional development of the
somatosensory system in early childhood, particularly the neonatal period, using MEG.
The information gained on normal development was then applied in studies of two patient
populations: very preterm infants, at risk for brain lesions and adverse neurological
outcome, and adolescents with hemiplegic cerebral palsy (CP). The specific aims of the
Studies I–V were as follows:
I
To determine the possible differences between SEFs of newborns and adults, and
the nature of these differences.
II
To identify the cortical generators underlying the newborn SEFs. Additional aims
were determination of the stimulus rate and sleep stage effects on neonatal SEFs
originating from different cortical areas.
III
To determine the possible differences in SEFs at term equivalent age between
fullterm and preterm infants. The additional aim was to reveal any correlations between
individual deviations from the normal cortical activation pattern in the preterm infants and
anatomical lesions of the underlying hemisphere.
IV
To demonstrate the pattern of SEF development from the newborn form to the
adult form. In addition, we aimed to confirm that the previously observed differences
between newborns and adults were not caused by vigilance state, but were true
developmental differences.
V
To reveal effects of early brain lesions underlying hemiplegic CP on function of
the cortical somatosensory areas and somatotopy of the contralateral primary
somatosensory cortex (SIc). Furthermore, we searched for correlations between
abnormalities in SIc activity pattern in individual patients and the severity of their motor
and sensory symptoms as well as neuroimaging findings.
28
5. METHODS
5.1. Study design
Altogether 113 subjects participated in the 119 MEG measurements constituting this thesis
(Table 1). These included 84 healthy subjects of different ages as well as 29 patients:
16 very preterm infants and 13 adolescents with hemiplegic CP.
Table 1. The number of measurements for the studies of the thesis according to age, vigilance state, and
stimulation type. Note that some subjects were measured both asleep and awake, and in some both median
nerve and tactile stimulation were applied. #Altogether 40 newborns underwent an MEG measurement. The
data of some newborns were included in several of the Studies I–IV. *Two infants were measured at
6 and 12 months and one at the ages of 6, 12, and 18 months and 2 and 3 years. Thus, altogether
19 infants/children participated in the 25 measurements between ages 6 months and 6 years. (n = number,
MN = Median nerve, mo = months, y = years, CP = cerebral palsy)
Healthy subjects
Newborns
6 mo
Patients
12–18
1.6–6 y
12–18 y
Adults
Preterm
CP
mo
Study
I–IV
IV
IV
IV
V
I, IV
III
V
Total n
40#
9*
8*
8*
13
12
16
13
Awake
1
-
-
8
13
12
-
13
Asleep
40
9
8
4
-
9
16
-
MN
12
-
-
-
13
1
-
13
Tactile
34
9
8
8
13
12
16
13
5.2. Subjects
5.2.1. Newborns
In total 40 healthy fullterm newborns participated in the studies (17 females, 23 males).
Study I included 26, Study II 21, Study III 16, and Study IV 20 healthy newborns. Some
of the newborns were included in several studies. All newborns were recruited from the
maternity ward of the Helsinki University Central Hospital during years 2003–2007. Their
gestational age ranged between 37 and 42 weeks. MEG in all newborns was recorded 1 to
6 days after birth, except for three newborns of Study IV who were recorded
approximately 3 weeks after birth (postnatal days 17, 20, and 23). The 1 min Apgar scores
ranged between 5 and 10 with the 5 min follow-up scores all exceeding 8. The birth
weight ranged between 2622 and 4460 g, the head circumference between 33 and 37.5 cm,
and body length between 46 and 54 cm.
29
5.2.2. Infants and children
The older infants and children (altogether 25 measurements of 19 infants) of Studies I and
IV were children of the laboratory personnel or of their friends and relatives. They were
divided into three age groups: 6-month-olds (n = 9; 3 females, 6 males), 12–
18-month-olds (n = 8; 3 females, 5 males), and 1.6−6-year-olds (n = 8; 2 females, 6
males). Two of the subjects were measured twice at 6 and 12 months and one 5 times at
the ages of 6, 12, and 18 months as well as at 2 and 3 years.
5.2.3. Very preterm infants
Study IV included 16 infants (10 females, 6 males) born before the 28th GW (gestational
age range: 24 weeks and 1 day to 27 weeks and 6 days). Their birth weight ranged
between 660 and 1110 g, body length between 30.5 and 36.5 cm, and head circumference
between 20.7 and 25.5 cm. They were all patients in the neonatal intensive care unit
(NICU) of the Helsinki University Central Hospital (HUCH) and recruited by a
neonatologist. At the time of the MEG measurement, the post menstrual age ranged from
37 weeks 6 days to 43 weeks 2 days, weight between 2350 and 3615 g, body length
between 42.5 and 51 cm, and head circumference between 32 and 38.5 cm, and the infants
no longer needed extra oxygen, monitoring, or constant measuring of oxygen saturation.
For more details of the infants‟ clinical background, please see Table 1 of Study III.
5.2.4. Adolescents with CP
A child neurologist recruited 13 patients (aged 11 to 17 years, 8 females and 5 males) with
congenital, spastic, hemiplegic CP to participate in Study V. The hemiplegia was
left-sided in three and right-sided in ten patients. The underlying brain lesion extended to
the sensorimotor cortex in five patients, whereas eight had purely subcortical lesions. Six
patients had epilepsy and five were on antiepileptic medication when MEG was recorded.
One patient had undergone anterior callosotomy in 2003 (three years before the MEG
measurement) for treatment of her epilepsy (continuos spikes and waves during sleep).
Five of the CP patients had been born preterm. For details of the patients‟ clinical
background, please refer to Table 1 of Study V.
5.2.5. Healthy adolescents
For each CP patient of Study V, we selected an age and sex matched healthy control
(13 adolescents; 12 to 18 years) to undergo the same MEG experiment. Each control was
also assigned to have “an affected” hemisphere according to the patient‟s lesion side.
(Note: The statistical analyses performed on patient subgroups only included those
controls that were originally selected for the patients in that particular subgroup.)
30
5.2.6. Adults
Altogether 12 healthy adult volunteers (8 females, 4 males) participated in MEG
recordings in awake and sleep states. Three of them were, however, not able to fall asleep
during the measurement and consequently, only awake data was obtained from these
subjects. Adult sleep measurements were conducted during the night, except for two
subjects who were sleep deprived and measured during the day. All adult subjects were
members of the laboratory personnel or friends of the researchers. Data from the awake
measurements of 10 adults were included in Study I, whereas both sleep and awake
recordings were analyzed for Study IV.
5.3. MEG studies
5.3.1. Stimulation
The tactile stimuli, used in all studies, were delivered to the finger tips with diaphragms
driven by an air pressure pulse (Somatosensory Stimulus Generator, 4-D NeuroImaging
Inc., San Diego, USA). In Studies I−IV the stimulus was given to the tip of the left index
finger with an interstimulus interval (ISI) of 2 s. In Study II, 11 newborns underwent
additional sessions with ISIs of 0.5 and 4 s, and in the remaining 10 the right index finger
was stimulated in an additional session. In Study V, tactile stimulation was given
sequentially to the tips of digits II and V of both hands with an ISI of 1 s between the
different digits. Consequently, the ISI between two stimuli to the same digit was 4 s.
Electrical median nerve (MN) stimulation at the wrist was used in Study I (left MN) and
Study V (left and right MNs in separate sessions). In both studies the ISI was 2 s and the
stimulation intensity was set just above the motor threshold.
5.3.2. Recordings
The MEG recordings were performed in the BioMag Laboratory of the Helsinki
University Central Hospital (HUCH). These measurements were conducted in a
magnetically shielded room (Euroshield Ltd., Finland) with a whole-head helmet-shaped
MEG sensor array consisting of 306 independent channels: 204 planar gradiometers and
102 magnetometers (Elekta Neuromag®, Elekta Oy, Helsinki, Finland). EEG was
recorded for sleep stage monitoring with one to three silver-silver-chloride disposable
electrodes placed at F4, P4, Cz, or P3. Electro-oculogram (EOG) was recorded from two
electrodes, one above the left and the other below the right eye canthi. The reference
electrode was on the left mastoid and the ground electrode on the forehead. In the sleep
measurements of older infants and adults the submental electromyography (EMG) was
also recorded. EEG and MEG were bandpass filtered at 0.03–257 Hz and, depending on
the study, the sampling rate was between 987 and 1002 Hz. Additionally, four subjects of
Study IV, aged 12–30 months, were studied at The Mind Research Network and BRaIN
Imaging Center in Albuquerque (ABQ), New Mexico, USA. These subjects were
measured with a pediatric MEG prototype „babySQUID‟ with 76 axial gradiometers
31
(Okada et al., 2006), also located in a magnetically shielded room. No EEG, EOG, or
EMG was recorded from these subjects.
5.3.3. Procedure
In the beginning of each measurement, the EEG and EOG electrodes were attached on the
scalp (only EOG was used in awake subjects). Four position indicator coils were attached
on a cloth cap in infants and children, and on the skin in the 6-year-olds, adolescents, and
adults. The coil positions, relative to anatomical landmarks, were determined with a
three-dimensional digitizer (Polhemus) to construct an individual Cartesian coordinate
system. In this coordinate system the preauricular points determined the x-axis, which
pointed to the right. The y-axis was perpendicular to the x-axis pointing towards the
nasion, and the z-axis, perpendicular to the x-y-plane, pointed upwards. In the beginning of
each recording set, the head position inside the sensor array was determined by feeding the
position indicator coils with excitation currents to find their positions by modeling them as
magnetic dipoles.
When necessary, the infant was fed before placing him/her on a bed next to the MEG
measuring helmet (Figure 5). In Studies I–IV, the MEG device was in a supine position.
Newborns and 6-month-olds lay with the right hemisphere downwards over the occipital
part of the helmet. Older children and adults lay on their back. One or two researchers
were in the measurement room with the infants and children in order to hold the stimulator
on the index finger and observe the subject‟s behavior. The researcher(s) coded the
infant‟s behavior (whether the eyes were open or closed and the presumed sleep stage)
onto trigger channels linked to the raw data file. This behavioral coding, together with
EEG and EOG, served for off-line sleep stage determination. The complete session with
each infant lasted approximately two hours. The stimulation and recording started when
the infant was asleep and lying still. No sedation was used in any measurement. In the
measurements of adults, electrophysiological data alone determined the sleep stage. In
Study V, the MEG device was in an upright position and the subject was sitting
comfortably watching a self chosen film without audio. Each complete session in Study V
lasted approximately one and a half hours.
Figure 5. MEG measurement of a newborn
32
5.3.4. Sleep stage analyses
The sleep stage analyses were based on the electrophysiological data and the behavioral
coding in infants, whereas in adults only electrophysiological data was used. In newborns
the sleep stage was characterized as quiet sleep (QS) when the observing experimenter had
coded the eyes to be closed and the respiration pattern to be regular, EEG showed tracé
alternant (Figure 6A) or high-voltage low-frequency activity, and EOG showed no
saccadic eye movements. The sleep stage was characterized as active sleep (AS) when the
eyes were closed, respiration pattern was irregular, occasional facial twitches occurred,
and EEG showed low-voltage high-frequency activity together with saccadic eye
movements in the EOG (Figure 6B) (Prechtl, 1974).
For older infants, children, and adults the sleep stages were classified according to the
guidelines from the classical EEG criteria (Rechtshaffen and Kales, 1968). In the awake
state, the activity had low-amplitude mixed-frequency or rhythmic alpha in the
parieto-occipital channels. Disappearance of alpha activity and appearance of slow eye
movements characterized „S1‟. Appearance of sleep spindles or K-complexes signified the
„S2‟ stage. In slow wave sleep (SWS), slow-frequency high-amplitude activity comprised
over 20% of the 30-s analysis window. During rapid eye movement (REM) sleep, EEG
showed low-voltage mixed-frequency activity together with episodic rapid eye movements
and low-amplitude submental EMG. Periods when the sleep stage could not be
unambiguously specified were excluded from further analyses. In Study IV, the data from
awake state, REM-sleep, and non-REM stages S2 and SWS were further analyzed.
Figure 6: Period of raw MEG and EEG data from a healthy newborn A) in QS and B) in AS.
33
5.3.5. Data analyses
The data of Study I were preprocessed with a Signal Space Separation (SSS) method
(Taulu et al., 2004), and data of Studies II−V measured in Helsinki with a Spatiotemporal
Signal Space Separation (tSSS) method (Taulu and Simola, 2006) of the MaxFilterTM
software (Elekta Neuromag, Helsinki, Finland) to improve the signal to noise ratio by
removing possible magnetic artifacts caused by, e.g., dental braces and the heart. tSSS was
performed in a 4-s time window, thereby suppressing all frequencies below 0.25 Hz. We
used the default correlation limit of 0.98 except for one patient (P5) of Study V, in whom
the correlation limit was lowered to 0.9 (Medvedovsky et al., 2009) to appropriately
remove artifacts caused by residual magnetic particles from prior brain surgery. After
tSSS, the result file was carefully examined before averaging. In the sleeping subjects, the
data were averaged according to the sleep stages and periods with movement artifacts
were manually discarded from the averages. No less than 92 epochs were averaged for
each condition in each subject. Refer to Studies I−V for exact numbers of averages.
The location, strength, and orientation of the neural sources were estimated by calculating
equivalent current dipoles (ECDs) in a spherical conductor model. The subset of MEG
channels included in the modeling process was individually selected for each subject and
response. The 100-ms period before stimulus was used as a baseline. The averaged signals
from tactile stimulation trials of all studies and MN stimulation trials of Study I (after
removing the stimulus artifact) were digitally lowpass filtered at 90 Hz prior to analysis.
In addition, in Studies I and IV, the signals were highpass filtered at 1 Hz. No further
off-line filtering was applied to the MN data of Study V. The peak of each deflection was
determined by modeling single dipoles with 1-ms intervals around the visually determined
peaks. The ECD with the greatest dipole moment and a dipolar field pattern was selected
for further analysis. The goodness of fit values of the chosen dipoles exceeded 65% in
Studies I, II, and III, 70% in Study IV, and 75% in Study V. A time-varying multidipole
model was calculated in order to study the overall explanation by the modeled ECDs for
data from all sensors.
34
5.4. Magnetic resonance imaging (MRI)
For Study III the MRI was performed on all patients using a 1.5-Tesla scanner (Philips
Medical Systems Achieva). The MRI findings were classified according to Woodward et
al. (2006). For Study V, the MRI studies were performed with a 3-Tesla unit (Philips
Intera Achieva). An experienced neuroradiologist (author LV of Study V) performed the
structural analyses from T2-weighted axial and coronal images and axial FLAIR
(fluid-attenuated inversion recovery) images. The location and extent of the lesion was
scored, as well as the possible extension along the white matter tracts of the internal
capsule and brain stem. Lesion type was also noted (destructive or developmental).
T1-weighted images were used for MEG-MRI integration and figures.
5.5. Behavioral tests
In Study V, an occupational therapist examined the somatosensory ability with SemmesWeinstein monofilaments of the affected hand. She used a five-piece filament kit
(Bell-Krotoski and Tomancik, 1987), where the filament size was marked with log forces2
representing threshold values for touch. The therapist also measured the dynamic and
static 2 point discrimination (2-PD) ability at the tip of digits II and V (Moberg, 1990). In
the dynamic test, the ability to discriminate 2 to 3 mm separation was considered normal,
whereas that of 4 to 6 mm moderate, and 7 to 9 mm poor. In the static 2-PD test the
distances were 2 to 6 mm (normal), 7 to 10 mm (moderate) 11 to 15 mm (poor), and over
16 mm (untestable). For statistical analyses, the results of the static and dynamic tests
were combined so that score 1 indicates normal ability in both tests, score 2 moderate
ability in one and normal in the other test, and score 3 moderate to poor ability in both
tests.
The therapist further evaluated the motor performance of the CP patients with Manual
Ability Classification System (MACS) (Eliasson et al., 2006). MACS reflects the
bimanual ability in everyday life ranked into 5 levels. Level 1 indicates minor difficulties
in handling objects that require fine motor control or efficient coordination between hands.
Patients at Level 3 can not handle all objects and their degree of independence is related to
the adjustments made to the environment. Level 5 indicates severe impairment, meaning
participation in daily activities consists of, at best, simple movements in specific situations
(Eliasson et al., 2006).
2
Log forces: 2.83 = normal touch (score 6); 3.61 = diminished light touch (score 5); 4.31 = diminished
protective touch (score 4); 4.56 = loss of protective sensation (score 3); 6.65 = only deep touch (score 2); more
than 6.65 = untestable (score 1).
35
5.6. Statistical analyses
Statistical comparison of sleep stages, ISIs, or distinct SEF components within a single
group were performed with either repeated measures analysis of variance (ANOVA) or
paired, two-tailed t-tests. One-way ANOVA was used for comparisons between age
groups in Study IV. Preterm infants were compared with the fullterm controls by using
Student‟s twotailed ttests. For comparisons between the CP patients and their controls
we applied a two-factor repeated measures ANOVA, in which the group was set as the
independent factor and hemisphere (affected or unaffected) as the dependent factor. In
case of tactile stimulation, the digit (II or V) was added as another dependent factor. For
the comparisons of source strengths, the strength was considered to be 0 nAm when a
response could not be modeled with an ECD. For the angular data (directions of the
ECDs), circular statistics were used. In addition, in Study V we applied non-parametric
tests (Weighted Kappa or The Phi Coefficient) to correlate the level of SEF changes with
clinical and imaging findings and X2 test when comparing the categorical frequencies
between patients and controls, e.g., existence of certain SEF components. Furthermore,
when the expected count for any cell in the analysis was less than 5 we applied the
Fisher‟s exact test instead of the X2 test. The level of statistical significance was set at
P<0.05.
5.7. Ethical considerations
The Ethics Committee for Pediatrics, Adolescent medicine, and Psychiatry, Hospital
District of Helsinki and Uusimaa, approved the study protocol. All adult subjects gave
their informed consent. For the newborns, infants, and children (6 years and younger), the
informed consent was obtained from the parents. (The children 3 years and older also
themselves gave informed consent.) The adolescents gave their informed consent together
with their parents. None of the examinations is considered harmful or caused pain to the
subjects. All MEG sleep measurements were performed during natural sleep and no
subjects were sedated. The infants were placed on the measurement bed after falling
asleep usually in the arms of their parents or one of the researchers. The stimuli did not
wake up the subjects. All subjects were informed that they were free to discontinue their
participation at any time without any particular reason. The measurements of infants, too
young to express themselves in words, were discontinued if the infant was restless.
Inclusion of subjects that were children of friends or colleagues of the researchers
greatly facilitated MEG studies in the age group of 6 months to 6 years. In this age group,
no measurements could have been accomplished without active participation of a parent.
We considered it highly beneficially for the parent to be familiar with the measurement
environment and the researchers in order to make the infant/child feel comfortable during
the preparations and measurement. None of the parents were subordinates of or in any
other way obliged for the researchers.
36
6. RESULTS
6.1. SEFs in newborns
The normal SEF pattern in the newborn period was characterized in Studies I and II. The
results were further corroborated in Studies III and IV.
6.1.1. Differences between newborn and adult responses (Study I)
The early contralateral SEFs to stimulation of the hand area in newborns, compared to
adults, differed both in latency and orientation of the underlying current flow (Figure 7).
Electrical MN stimulation at the wrist elicited the first cortical response in the
contralateral hemisphere at around 30 ms in newborns (n-M30; mean latency of the 11
subjects in AS 30 ± 1.6 ms). The magnetic field pattern of this response was dipolar with
the equivalent current dipole (ECD) pointing anteriorly similar to the well known adult
N20m (Figure 7). After this initial activity, the ECD in the newborns continued to point
anteriorly during the second deflection peaking at around 60 ms (M60) [mean latency
51 ± 7.1 ms in AS (n = 11) and 56 ± 17.1 ms in QS (n = 12)] (Figure 7). On the contrary,
in adults the N20m is followed by the P35m deflection with an ECD oriented posteriorly.
In newborns, such a P35m-like response with posteriorly oriented ECD was completely
absent. The ECD locations of both neonatal responses (n-M30 and M60) were consistent
with the activity being generated at the contralateral primary somatosensory cortex (SIc).
After tactile stimulation of the index finger, the first prominent response in newborns
peaked at around 60 ms (M60), whereas a separate 30-ms component was usually not
distinguishable from the broad deflection. The ECD underlying the tactile M60 pointed
anteriorly and had a location consistent with the activity arising from the SIc. In adults, the
most prominent early cortical response, peaking at around 50 ms (M50), had a posterior
ECD orientation similar to the P35m. In two adults, a weaker earlier cortical response
peaked at around 30 ms with an anterior ECD direction corresponding to the MN N20m.
6.1.2. Origins of the contralateral SEFs: effect of sleep stage and interstimulus interval
(ISI) (Study II)
In Study II, 19 healthy newborns were recorded in QS and 11 in AS with a 2-s ISI. In
general, tactile stimulation of the index finger (ISI 2 s) elicited two main responses in the
contralateral hemisphere, the M60 and another prominent deflection peaking at around
200 ms (M200) (Figure 8). Both responses had dipolar magnetic field patterns. M60 could
be modeled with an ECD in 19/19 newborns in QS and 10/11 in AS, and M200 in
18/19 newborns in QS and 5/11 in AS. As noted above, the ECD underlying the M60
pointed anteriorly and its location was consistent with the SIc (Figures 8 and 9). The ECD
of the later deflection, M200, was localized significantly more inferiorly {mean difference
16 mm in QS [Student‟s ttest: P < 0.0001 (n = 18)]} and laterally {mean difference 7 mm
[P = 0.001 (n = 18)]} than the M60 ECD (Figure 9). Furthermore, the M200 ECD pointed
superiorly (Figure 8).
37
Figure 7. Early SEFs to median nerve stimulation in a newborn and an adult. In the upper row the
waveforms from one gradiometer channel showing the maximal response. Below are the contour maps
reflected on the skull surface. The red lines indicate magnetic field exiting the head and blue lines field
entering the head. The first responses (n-M30 and N20m) have similar ECD directions, but for the following
responses (M60 and P35m) the ECD directions are opposite. (Reprinted from NeuroImage, Vol 33,
Lauronen L, Nevalainen P, Wikström H, Parkkonen L, Okada Y, Pihko E, Immaturity of somatosensory
cortical processing in human newborns, page no. 197, Copyright (2006), with permission from Elsevier.)
Figure 8. M60 and M200 responses of one healthy newborn. Left: source waveforms and goodness of fit
when M60 and M200 ECDs are included in the multidipole model. Right: contour maps at the M60 and
M200 peaks reflected on a spherical surface. The solid lines indicate magnetic field entering the head and
the dashed lines field coming out of the head.
38
Figure 9. A schematic image visualizing the average ECD locations (mean of 18 newborns) of M60 (A) and
M200 (B) in quiet sleep (ISI 2 s) relative to brain anatomy at fullterm age (MRI of one healthy newborn).
Note that the locations of M60 and M200 coincide with the SI (on the posterior bank of the central sulcus)
and SII (on the superior lip of the Sylvian fissure) on the MRI. The white bars denote the standard error of
mean.
The ECD strengths of M60 and M200 (ISI = 2 s) were compared for AS and QS in
10 newborns with data available from both sleep stages. The M200 ECD was significantly
weaker in AS than QS, whereas the M60 strength did not significantly differ (Figure 10A)
[ANOVA (n = 10) main effect: sleep stage F(1,9) = 11.09; P = 0.009; Post hoc M60
P = 0.26, M200 P = 0.04]. Furthermore, the effect of the interstimulus interval (ISI) (0.5,
2, or 4 s) was evaluated in the 8 newborns in whom recordings with all three ISIs were
successfully accomplished in QS. The ECD strength of the M200 significantly attenuated
with the 0.5-s ISI compared to longer ISIs (2 and 4 s), whereas the M60 was not
significantly affected (Figure 10B) [ANOVA (n = 8) 2-way interaction ISI x response
M60/M200: F(2,14) = 6.94; P = 0.008; Post hoc for M200: 0.5-s vs. 2-s ISI P = 0.03; 0.5-s
vs.4-s ISI P < 0.001].
39
Figure 10. Average source strengths (nAm) with the bars denoting the standard deviations: M60 (white) and
M200 (black) A) in quiet (QS) and active sleep (AS) (n = 10); B) with the three ISIs in QS (n = 8). The
M200 ECD was significantly weaker in AS than QS as well as with the 0.5-s ISI compared to the longer
ISIs. *P < 0.05, ** P < 0.001 (9B reprinted from NeuroImage, Vol 40, Nevalainen P, Lauronen L, Sambeth
A, Wikström H, Okada Y, Pihko E. Somatosensory evoked magnetic fields from the primary and secondary
somatosensory cortices in healthy newborns, page no. 742, Copyright (2008), with permission from
Elsevier.)
6.1.3. Ipsilateral responses (Study II)
The ipsilateral (right) hand was stimulated in ten newborns, while recording from the right
hemisphere. Eight newborns were measured in QS and six in AS. In QS, a response with
latency, ECD orientation, and location similar to those of the M200 (elicited by
stimulation of the contralateral, left hand) was detected in four newborns. In two
(including one with the M200-like response), a response with ECD source location similar
to that of the M60 was detectable. In AS, a 120-ms peak was visible in the waveforms of
5/6 newborns, but the response could only be modeled with an ECD in one and was
therefore, left out of further analysis.
40
6.2. Developmental changes in SEFs (Studies I, IV)
In Studies I and IV, we also recorded SEFs from infants and children at different ages
between 6 months and 6 years. The data from the four infants measured in Albuquerque
was only evaluated visually and the waveforms corresponded to those obtained from
measurements conducted in Helsinki. In the following, only data from the Helsinki
measurements are presented.
At 6 months of age, the tactile SEF still resembled that of newborns with anteriorly
pointing ECDs underlying the earliest responses. Instead of a single M60 peak, however,
the earliest response consisted of two peaks (M30-M60) separated by a notch (Figure 11).
In Study IV, we found that with age the notch continued to increase in amplitude, crossing
the baseline in several 12- and 18-month-olds. By age 2, it was strong enough to be
modeled with a posteriorly oriented ECD similar to the typical adult M50 response (Figure
11). The M50 was also the main early SI response in children (3–6 y) (Study IV) and
adolescents (12–18 y) (Study V). This developmental change in SEF was independent of
the vigilance state. It should be noted that although the M50 was the most prominent
tactile SEF response in older subjects, the earlier peak at around 30 ms was still detectable
in most adults and could be modeled with an anteriorly pointing ECD in 71% of them in
Study IV.
The ECD orientations of M30 (newborn M60) responses did not differ between the age
groups. The M50 ECD orientation, which was practically opposite to that of the M30
ECD, was also concordant across all age groups in which it could be modeled (12–18 mo,
1.6–6 y, and adults). ECD locations of both responses, the M30/M60 and M50, were in
accordance with the activity being generated at the SIc and correlated with subject age in a
way that in older subjects the ECDs were located more superiorly (correlation of age and
z-coordinate r = 0.53; P < 0.0001) and laterally (correlation of age and x-coordinate
r = 0.58; P < 0.0001).
41
Figure 11. Developmental changes in SEFs. The early SEFs from a newborn (QS), a 6-month-old infant
(SWS), a 2-year-old child (S2), and an adult (S2). SEF waveforms from two magnetometer channels are
shown on the left. The main responses are indicated by the black arrows and the emerging M50 notch by the
white arrow in the 6-month-old infant. A proper M50 is only present in the 2-year-old child and the adult.
On the right, the contour maps during the main deflections are reflected on spherical heads and viewed from
above. Dashed lines indicate magnetic field coming out of the head and continuous lines field entering the
head. The equivalent current dipole (ECD), shown by an arrow, is directed anteriorly during M30/M60 and
posteriorly during the M50. The midpoint of the ECD corresponds to the locations of the active brain source.
Note that the ECD arrow size and the magnetic field contour step are set individually and are not comparable
across subjects.
42
6.3. SEFs in very preterm infants (Study III)
The general morphology of the contralateral SEFs in QS, M60 followed by M200, or their
latencies did not differ at term age between the preterm infants and their healthy fullterm
control subjects (Figure 12). The ECD strength of the M60 response was weaker in the
preterm group, however [preterm infants 7.9 (3.2) nAm; controls 11.9 (5.9) nAm;
Student‟s twotailed ttest: P = 0.02]. No group level differences existed for M200. At the
individual level, M200 was absent in four preterm infants all of whom had lesions of the
underlying hemisphere depicted by MRI and/or ultrasound (US). All infants with normal
US and MRI findings correspondingly had a normal M200. Two preterm infants with a
brain lesion, however, had a normal M200, but the M200 was missing from one control
(Table 2).
Table 2. Details of the lesions in those preterm infants with abnormal neuroimaging findings of the right
hemisphere together with the presence/absence of M200. In addition to the infants presented in this Table,
nine infants had no abnormalities in the right hemisphere in US or MRI and one infant had normal US, but
the MRI could not be evaluated due to movement artifact. All these ten infants had a normal M200 response.
(# refers to subject number in Study III, gr = grade, IVH = intraventricular hemorrhage, MRI = magnetic
resonance imaging, PVL = periventricular leukomalacia, US = ultrasound)
#
Imaging findings
M200
1
Right sided IVH gr. I
-
2
Moderate PVL
-
6
Calcifications (more on the left)
-
10
Right sided IVH gr. IV with enlarged right ventricle
-
7
Right sided IVH gr. IV
+
14
Moderate PVL; signs of old right sided hemorrhage in +
MRI
(No hemorrhage detected in US)
43
Figure 12. The SEF waveform from one gradiometer channel in three patients (left) and three controls
(right). A) a patient with normal imaging findings and SEFs, B) a patient with moderate periventricular
leucomalacia (PVL) and absent M200 (Patient 2 in Table 2), C) a patient with moderate PVL but normal
M200 (Patient 14 in Table 2). In general, the morphology of the waveforms is similar, M60 (black arrows)
followed by M200 (white arrows) in patients and controls (except for Patient B). The contour maps
correspond to the M60 response, showing similar contour patterns in patients and controls. The contour step
is 60 fT/cm, the dotted lines indicate magnetic flux exiting the head and the solid lines magnetic flux
entering the head.
44
6.4. SEFs in adolescents with CP (Study V)
6.4.1. Tactile stimulation
After tactile stimulation of digits II and V of both hands, the M50 was the most prominent
early deflection in all 13 healthy control adolescents (mean latency for all fingers
44 ± 3.8 ms, n = 13) and in all eight patients with pure subcortical lesions (45 ± 4.3 ms,
n = 8). Of the patients with cortico-subcortical lesions, stimulation of the normal hand
elicited the M50 in all the five (mean latency for normal hand 54.1 ± 8.1 ms, n = 5), but
that of the palsied hand in only one (P5 in Table 3). The M50 ECDs were located at the
SIc, in somatotopical order so that, when superimposed on individual MRIs of the
patients, digit V area was medial to digit II area along the central sulcus.
The Euclidian distance between M50 ECD locations for the two stimulated digits was
shorter in the patients with subcortical lesions (n = 8) than their controls (n = 8) in both
hemispheres [Affected hemisphere (AH): 5.3 ± 2.8 mm (patients) vs. 10.6 ± 5.8 mm
(controls); Unaffected hemisphere (UH): 7.1 ± 3.2 mm (patients) vs. 10.5 ± 4.4 mm
(controls); ANOVA main effect: group F(1,14) = 5.58; P = 0.03; Post hoc UH: P = 0.04,
AH: P = 0.01] (Figure 13). In the five patients with cortico-subcortical lesions, this
Euclidean distance in the UH was 10.9 ± 2.9 mm.
After tactile stimulation, the ipsilateral primary somatosensory cortex (SIi) was activated
more frequently in the patients with subcortical lesions (n = 7/8, altogether 11 digits) than
their controls (n = 1/8, 3 digits) (Fisher‟s exact test: P = 0.005). The peak latencies of the
SIi responses were generally a few milliseconds longer than those of the SIc responses.
Notably, 64% of the SIi responses of these patients were evoked by stimulation of the
normal hand. Of the five patients with cortico-subcortical lesions, stimulation of the
normal hand elicited activity in the ipsilateral (i.e. affected) hemisphere near SI in two. SIi
activity to stimulation of the palsied hand was evoked in none of these five patients.
6.4.2. Median nerve stimulation
In all controls, stimulation of both MNs elicited the three main early responses from the
SIc: N20m, P35m, and P60m. These three peaks were also present in all the eight patients
with subcortical lesions for the UH. On the affected side, N20m was absent in three and
P60m in two (Figure 14). An additional P25m peak (with posterior ECD orientation) was
more often present in these patients (6/8 UHs and 8/8 AHs) than their controls (1/8 UH
and 2/8 AHs) (X2 P < 0.001). Furthermore, the P35m peaked on average 4.5 ms later in
both hemispheres of these patients than their controls (38.3 ± 4.7 ms vs. 33.8 ± 2.8 ms,
n = 8 in both groups) [ANOVA main effect: group F(1,14) = 7.11; P = 0.02; Post hoc UH
P = 0.04; AH P = 0.002].
45
Figure 13. A schematic illustration visualizing the Euclidean distances separating digit II and V
representation areas on an average brain. The group average (from eight patients with subcortical lesions and
eight controls) locations of M50 ECDs of patients‟ AH and UH and one hemisphere of controls are all
superimposed on the same hemisphere for comparison. Note the smaller distance between the ECD locations
of the two fingers in the patients, particularly in the AH. The graph on the right shows the average Euclidean
distances with the narrow bars indicating standard errors of mean. * P < 0.05. (AH = Affected hemisphere,
UH = Unaffected hemisphere)
In all five patients with cortico-subcortical lesions, MN stimulation of the normal hand
elicited the N20m-P35m-P60m sequence, whereas on the palsied side, none of these
components were detectable in four patients, the same patients in whom the M50 was
absent after tactile stimulation. In the fifth patient (P5 in Table 3) N20m was absent, but
P35m and P60m were present. Despite the absent early MN SEF components in AH, the
most prominent activation within the first 200 ms occurred in the vicinity of the
contralateral sensorimotor area in all these five patients (Figure 14).
The secondary somatosensory cortices, contralateral (SIIc) and ipsilateral (SIIi), were
frequently activated in controls and patients with subcortical lesions. On the contrary, in
patients with cortico-subcortical lesions SII activity was rare. Most notably, stimulation of
the palsied hand evoked SIIc activity in none and SIIi activity in only one (P3 of Table 3)
of the five patients. Due to a great variability of latencies and source strengths, we did not
further compare the ECD properties of the SII responses. SIi activity within 100 ms after
MN stimulation was not detected in any control or patient. Posterior parietal cortex (PPC)
and mesial cortex activation was inconsistent in both patients and control subjects and
was, therefore, not analyzed further. It is, however, noteworthy that neither area was
activated in any of the patients with cortico-subcortical lesions.
46
Figure 14. A) A typical control subject. On the left the SEF waveform from one gradiometer channel above
the right SI showing maximal response after stimulation of the left MN. On the right the isofield contour
maps during the main deflections (N20m, P35m, P60m) reflected on the helmet surface. Dashed lines
indicate field coming out of the head and continuous lines field entering the head.
B) Patients with
cortico-subcortical lesions (P1–5). C) Patients with pure subcortical lesions (P6–9 with one or two MN SEF
components absent, P13 representing the four patients with N20m, P35m, and P60m MN responses present).
Left column for both patient groups shows the maximal response waveforms from one gradiometer channel
after stimulation of the MN of the palsied hand. For P1–5 the arrow points to the earliest contralateral
response, superimposed on the MRIs. For P6–9 and P13, the N20m is marked with ^, P25m with +, P35m
with *, and P60m with o. The P35m (P6–9,13) which was present in all of these patients is superimposed on
individual MRIs. Note that SEFs of P1–4 have no normal components and the P25m is present in all patients
of column C.
47
6.4.3. Comparison of results from MEG, MRI, and behavioral tests
To correlate the MEG results with clinical data and imaging findings we divided the
patients into three categories according to the number of absent SIc MN SEF components
(N20m, P35m, P60m) (Table 3); Group A: none of the three components present at AH,
Group B: one or two MN component absent at AH, Group C: all three components
present. These categories correlated with lesion type (Phi P = 0.01; most patients with
cortico-subcortical lesions had no normal MN SEF components) and lesion size in the
MRI (Weighted Kappa: P = 0.004; large lesions in the MRI were associated with more
components absent). The results of the behavioral tests also correlated with SEF categories
[Weighted Kappa: Manual ability Classification System (MACS) P = 0.01; 2 point
discrimination (2-PD) for digit II P < 0.001].
Table 3. Classification of the CP patients according to SEFs from the affected hemisphere together with
MRI findings and results from clinical examinations of the palsied hand. Lesion size 3: an infarction of the
whole middle cerebral artery (MCA) area or a corresponding size of some other type of lesion; 1: a spot type
lesion. MACS scores (Eliasson et al., 2006) describe bimanual ability of CP patients in everyday life. They
are generally given from I to V, where I signifies, at most, minor disability in fine hand motor function. In
our patients the worst score was III, indicating difficulties in performing everyday activities and dependency
on environmental adjustments. The 2-PD test score 1 indicates that both static and dynamic 2-PD abilities
were normal, 2 indicates moderate ability in one and normal in the other test, and 3 moderate to poor ability
in both tests (for normality levels in each test, please refer to the methods section). (Gr = Group,
GA = Gestational age, MN SEF = median nerve somatosensory evoked magnetic field,
CS = Cortico-subcortical, S = Subcortical, MACS = manual ability classification system, 2-PD = 2 point
discrimination, DII = Digit II, np = not performed, nf = not feasible)
Gr
#
A
P1
P2
P3
P4
P5
P6
P7
P8
P9
P10
P11
P12
P13
B
C
GA if
preterm
40+3
32+5
40+2
40+2
40+1
31+1
42+6
40+1
28+5
34+5
32+2
42+1
41+6
MN SEF
Major abn.
Major abn.
Major abn.
Major abn.
Minor abn.
Minor abn.
Minor abn.
Minor abn.
Minor abn.
Normal
Normal
Normal
Normal
Lesion
location
CS
CS
CS
CS
CS
S
S
S
S
S
S
S
S
48
Lesion
type
Infarction
Infarction
Infarction
Polymicrogyria
Infarction
PVL
Infarction
Infarction
Porencephaly
Infarction
Infarction
Infarction
Infarction
Lesion
size
3
3
3
3
3
3
2
2
1
2
1
1
1
MACS
nf
III
III
II
III
III
II
I
II
I
I
I
I
2-PD
DII
np
np
3
3
2
2
np
2
np
1
1
1
1
6.4.4. Effect of gestational age
Of all the CP patients, five had been born preterm (Table 3). The lesion was
cortico-subcortical in one of these five patients (Patient 2). In the other four, the defect
was in the periventricular white matter, additionally involving the thalamus in one (Patient
6) and the internal capsule in two patients (10 and 11). No obvious differences existed in
SEFs between the CP patients born preterm and those born fullterm, though no proper
statistical comparison between these groups could be made because of the insufficient
number of subjects in each group.
49
7. DISCUSSION
In this thesis we were able to demonstrate that somatosensory MEG measurements can be
reliably conducted in newborns and young infants. We showed previously unknown,
major differences in the early cortical responses from the primary somatosensory area
between newborns and adults. We further demonstrated how the cortical activity pattern of
newborns develops to the adult form over the first years of life. Finally, we applied the
acquired knowledge about normal neonatal SEFs and their development with age in two
patient populations: preterm infants and adolescents with hemiplegic cerebral palsy.
7.1. Methodological considerations
One of our greatest challenges was establishing a reliable method for somatosensory infant
MEG measurements and data analysis, which I have described in detail in the methods
section An MEG measurement session involving infants requires a lot of time and
patience. All our recordings were performed when the infants were in natural sleep. Most
of the failures in infant measurements resulted from the infant not falling asleep within
two hours after which the session was generally interrupted. Altogether four newborns, not
included in the number of subjects of the thesis, who arrived at the laboratory to
participate in these studies, did not fall asleep within the time limit. When the infant did
fall asleep, our success rate in the recordings was very high. Data of only one newborn
were completely excluded because of problems with the measurement of head position
during the recording. In several infants, the head position measurement had to be repeated
to get a reliable estimation, however. The challenges in head position measurement are
most likely due to the disproportion between the size of the sensor helmet, designed for
adults, and that of a newborn‟s head. This results in longer distance from some of the
position indicator coils to the MEG sensors and, consequently, worse signal-to-noise ratio
for the head position measurement than in adults. SEFs could be identified and modeled
with ECDs in all infants in whom the measurement was successfully carried through,
though some SEF components were missing in a few infants. Our experience is that the
head of a newborn needs to be right on the surface of the measuring helmet for reliable
SEF recordings. Therefore, it was not possible to record from both hemispheres
simultaneously. This sets certain limits on the experimental setups by, e.g., doubling the
measurement time when both ipsilateral and contralateral activity is of interest.
Possible head movements during the measurement constitute another important issue in
infant MEG studies. We compensated for this by conducting the recordings when the
infants were asleep and lying still. When occasional twitches occurred and the head
moved, the MEG recording was interrupted and the head position measurement was
repeated. We did not use continuous head position measurement because upon project
initiation this was not yet available in our laboratory. In the future, continuously
measuring the head position may facilitate the infant measurements as at least part of the
head movements can be compensated without interrupting the measurement.
50
Based on the experience from the Study I, we found tactile stimulation to be easier to
apply in small infants than electric MN stimulation. In addition, artifacts in MEG
produced by the electrical MN stimulation are greater in newborns, due to the proximity of
the stimulus to the sensors. Furthermore, the parents were often more compliant with the
tactile than the electrical stimulus. We decided to use tactile stimulation in the other
studies involving infants, since the tactile stimulation produced a response in the
contralateral somatosensory cortex as reliably as MN stimulation.
7.2. SEFs to median nerve stimulation
7.2.1. Healthy newborns
In newborns, the first cortical magnetic response after MN stimulation at the wrist reached
its maximum at about 30 ms (n-M30). This signifies that the somatosensory pathway from
the periphery to the cortex is developed enough to produce early synchronous activation of
cortical neurons. The latency delay compared with the adult N20m agrees with the
previous infant SEP studies (Hrbek et al., 1973; Willis et al., 1984; Laureau and Marlot,
1990; George and Taylor, 1991) and is most likely due to incomplete myelination of the
pathway, even though the distance from the hand to the cortex is shorter than in adults.
The similar generation area and orientation of the n-M30 and N20m current sources also
suggest that similar cortical mechanisms may underlie the two responses.
After the initial N20m/n-M30, the SIc activity in adults and newborns, however, differed
dramatically. In the newborns, the anterior orientation of the M60 source current was
similar to that of the n-M30, whereas in adults the well known P35m with posterior
current orientation follows the N20m (e.g. Wood et al., 1985; Hari and Forss, 1999). Some
previous neonatal SEP studies seemingly disagree with this result by reporting an
“adult-like” N1-P1 sequence with only slightly prolonged latencies (Willis et al., 1984;
Laureau et al., 1988; George and Taylor, 1991). This is, however, likely to be an artificial
effect of the highpass filter setting applied in these studies (see Pihko and Lauronen, 2004)
as others (using a lower highpass cutoff value), showed clearly distinct morphology of
early SEPs in newborns compared with adults (Desmedt and Manil, 1970; Hrbek et al.,
1973; Laget et al., 1976; Karniski, 1992; Karniski et al., 1992). Furthermore, the SEP over
the central contralateral area represents activity at both areas 3b and 1, the latter of which
is considered to be mostly invisible to MEG. Whereas the N1 is probably generated at area
3b and detected both by EEG and MEG, the P1 SEP may reflect activity of area 1
(Karniski et al., 1992).
51
At present, no consensus concerning the generation mechanism of the adult P35m exists
(see Review of literature section). Both excitation of the distal portions of the apical
dendrites (Allison et al., 1989; Allison et al., 1991b) and inhibition of the proximal parts
may contribute (Huttunen and Hömberg, 1991; Wikström et al., 1996; Valeriani et al.,
1998; Restuccia et al., 2002). In newborns, the wide initial deflection (nM30-M60) may
reflect prolonged excitation in the proximal parts of apical dendrites, for which there are
several possible underlying causes, e.g., slow kinetics of intrinsic membrane conductances
and immature neurotransmitter receptors.
In cortical neurons of rat pups, the excitatory postsynaptic potentials last several hundreds
of milliseconds and inhibitory responses are completely absent (Kim et al., 1995). The
prolonged excitation may be due to slow deactivation kinetics of the glutamate receptors
at this developmental stage (Moody and Bosma, 2005). Furthermore, though GABAergic
synapses are formed even before the glutamatergic ones, during early development,
GABAA receptor activation excites neurons due to a high intracellular Cl– concentration
(Moody and Bosma, 2005; Represa and Ben-Ari, 2005; Dzhala et al., 2005). In rodents,
the upregulation of the K+-Cl– cotransporter KCC2 expression and the following decrease
in the intracellular Cl– changes the effect of GABA from excitatory to inhibitory
postnatally (Rivera et al., 1999; Ben-Ari et al., 2004; Herlenius and Lagercrantz, 2004;
Represa and Ben-Ari, 2005). In human neonates, upregulation of KCC2 expression
parallels changes in the slow-frequency EEG activity from preterm to term age (Vanhatalo
et al., 2005). At full term, however, KCC2 expression is still lower than in adult cortex
(Dzhala et al., 2005). In our newborns, the SEF waveform is surprisingly similar to that
seen in patients with Angelman syndrome, caused by a deletion in the GABA A receptor
subunit gene (a wide initial deflection with an anteriorly pointing ECD and absent P35m)
(Egawa et al., 2008).
Also, the course of synaptogenesis beginning from the deep cortical layers and
progressing towards more superficial layers has been suggested to account for the
changing properties of SEP responses during early development (Kostović et al., 1995;
Kostović and Judaš, 2002). According to current knowledge, a significant portion of short
cortico-cortical connections are established postnatally (Kostović and Jovanov-Milošević,
2006) with active synaptogenesis continuing for several months or even years after birth
(Huttenlocher and Dabholkar, 1997). Thus, the lack of P35m-like response could also
simply reflect a lack of functional short cortico-cortical connections necessary for
mediating the response.
52
7.2.2. CP patients
In the CP patients, the most prominent cortical response to MN stimulation was always
found at the contralateral primary somatosensory cortex (SIc) or in nearby areas. Thus, our
findings support the notion (e.g. Guzzetta et al., 2007) that the organization of the
somatosensory system does not follow that of the motor system, which may shift to the
ipsilateral hemisphere by preservation of the normally withdrawn ipsilateral corticospinal
tracts (Eyre, 2007). Accordingly, our experience from the somatosensory newborn studies
is that early SEFs are predominantly detected at the SIc at fullterm age, in contrast to
bilateral MEPs elicited by TMS (Eyre, 2007).
Interestingly, however, in both hemispheres of the CP patients with subcortical lesions an
additional peak, P25m, preceded the P35m, in contrast to a single P35m peak of most
controls. The P25m, or P22m in some studies, generally appears as a small notch in the
ascending phase of P35m. It may, however, be enhanced in patients with various subtypes
of cortical myoclonus (Mima et al., 1998; Forss et al., 2001) as well as some adult stroke
patients (Forss et al., 1999). Our own unpublished observation is that P25m becomes more
pronounced in healthy adults with higher stimulation frequencies (ISI 300 ms). Thus the
prominent P25m, together with the delayed P35m, may reflect dysfunction in the
information processing sequence at SI. Whether these differences are directly caused by
the lesion or secondary to the reduction of movement and sensory experience needs
further investigation.
In four of the five CP patients with cortico-subcortical lesions, SIc responses to
stimulation of the palsied hand were markedly abnormal, but behaviorally tactile function
was only moderately impaired. In infant macaques, the SIIc is able to compensate, at least
partly, for the functions of an ablated SI area (Burton et al., 1990), which is not the case in
adult macaques (Pons et al., 1988). In adult stroke patients with abnormal SIc SEFs, SIIc
responses were absent, but SIIi response was always present (Forss et al., 1999). Of our
five patients, SIIi activity was detected in one and that of the SIIc in none. PPC, mesial
cortex, or SIi were neither activated in any of the five patients. Previously, in CP patients
with cortical defects, normal latency SEPs were evoked in the affected hemisphere by
stimulation of the palsied hand (Guzzetta et al., 2007). Our findings, thus, partly agree
(location) and partly disagree (latency) with this previous study.
7.3. SEFs to tactile stimulation
7.3.1. Healthy newborns
After tactile stimulation, the current sources underlying the main early SEFs of newborns
(M60) and adults (M50) had opposite orientations, in accordance with the MN results. The
source location and anterior current orientation of the newborn M60 were consistent with
activation of the SIc. On the contrary, the generation area of the M200 was located
significantly more inferior and lateral to that of M60. The relative location of the M200
53
source compared to the M60 source and the vertical orientation of the M200 source
current are typical for responses originating from the secondary somatosensory cortex
(SII) on the upper bank of the Sylvian fissure (Hari et al., 1983; Karhu et al., 1991; Hari et
al., 1993). We therefore suggest that the M200 represents activity of the SII indicating that
both the connections to and the neurons at the SII are sufficiently developed to produce a
detectable SEF response at fullterm age. In addition, in four out of eight newborns,
stimulation of the ipsilateral hand during quiet sleep evoked SEFs with source location
and orientation coinciding with those of the M200 evoked by stimulation of the
contralateral hand. Bilateral SII activation after unilateral hand area stimulation is also
commonly detected in adult MEG studies (Hari et al., 1983; Hari and Forss, 1999).
In newborns, the M200 source strength was significantly affected by the change in ISI,
unlike that of the M60. The SII SEFs in adults are also more easily affected by ISI than the
SEFs from SI (Hari et al., 1990; Hari et al., 1993; Forss et al., 1994a; Wikström et al.,
1996). In practical terms, for a reliable recording of evoked potentials a longer ISI is
required in young infants than in older subjects (Desmedt and Manil, 1970; George and
Taylor 1991). Reduction of the measurement time, however, favors the use of shorter ISIs
in MEG of newborns and infants, since the recording cannot be easily extended beyond
awakening. Since we found no significant group level difference in either response (M60
or M200) between the 2 and 4 s ISIs, we conclude that 2 s is the most suitable ISI (of the
three ISIs that were tested) to study these particular responses. When only the M60 is of
interest, even an ISI as short as 0.5 s may suffice.
Sleep stage did not significantly affect the M60 strength, which is in accordance with the
SI responses in the adults of Study IV, as well as previous reports of adults (Kitamura et
al., 1996; Kakigi et al., 2003). In a previous newborn MEG study, the M60 amplitudes
calculated from vectorsums attenuated in AS compared with QS (Pihko et al., 2004).
Thus, a weak tendency towards enhanced M60 in QS in neonates may exist, but this effect
did not reach the significance level in our Study II investigating the activation magnitude
at the source rather than sensor level. In adults, the SII responses are generally diminished
in sleep (Kitamura et al., 1996, Kakigi et al., 2003) and completely absent in slow-wave
sleep (our own unpublished observation). On the contrary, in newborns, M200 was
stronger in QS (characterized by slow-wave activity) than AS (characterized by rapid eye
movements like REM sleep of adults). Thus, even though the sleep stages of newborns
and adults are not fully comparable, their effect on SII activity is markedly different. The
mechanisms and possible physiological significance of this phenomenon remain yet
unknown.
7.3.2. Development
The early SEFs systematically transformed over the first years of life so that in children
2 years and older, sources underlying the early responses to tactile stimulation were
similar to those of adults in terms of orientations (M30 with anteriorly pointing ECD
followed by M50 with posterior ECD orientation). As the age effect was independent of
vigilance state, we conclude that it reflects development of the functional somatosensory
54
network. In adults, M50 is likely to represent similar events as the P35m after MN
stimulation. As P35m has been linked to 2 point discrimination (2-PD) ability (Wikström
et al., 1996), in behavioral terms its lack, or the lack of M50, in newborns could reflect yet
deficient lateral inhibition, corresponding to poorly developed tactile discrimination
capability. Based on the present knowledge, however, it is not possible to say whether the
SEF transformation parallels development of 2-PD ability, because its behavioral testing is
not feasible in children until the age 4–6, when 2-PD is already well developed (Thibault
et al., 1994; Hermann et al., 1996; Menier et al., 1996) as is the SEF pattern.
7.3.3. Very preterm infants
The M60 was present after tactile stimulation in all the very preterm infants at term age,
reflecting functional somatosensory pathways from the periphery to the SIc. In line with a
previous SEP study, we found no difference in M60 latency (Klimach and Cooke, 1988a).
In our study, however, the patients were on average 2.6 cm shorter than the control
infants. The difference in body length hampers direct comparison of the response latencies
and may mask a small but true difference in the conduction velocity. The source strength
of M60 was, however, weaker in the patients than controls suggesting lower firing
synchrony and/or a smaller number of active neurons in the SIc. In animal models,
hypoxia or ischemia may lower the amplitudes of SEPs (Coyer et al., 1986; McPherson et
al., 1986). MRI studies in human preterm infants have revealed increased cerebrospinal
fluid volumes compared to term infants (e.g. Inder et al., 2005). Although we did not
perform volumetric analyses of the MRIs, differences in cerebrospinal fluid volumes
should not have significantly influenced our results as MEG is practically insensitive to
conductivity differences between the neural source and the device (Hämäläinen et al.,
1993) and our analysis was conducted on source rather than sensor level.
7.3.4. CP patients
One of the main new findings from Study V was that within the SI the cortical sources
underlying the M50 responses, after tactile stimulation of contralateral digits II and V,
were located significantly closer to each other in the CP patients with subcortical lesions
than in controls. Importantly, the effect was seen in both hemispheres. These changes in
SIc hand representation may be either a direct result of the lesion and/or result from
inappropriate sensory experience due to the movement disability during development. The
SI somatotopical map is known to be capable of undergoing significant remodeling
according to sensory experience. In adult owl monkeys, surgical fusion of adjacent digits
results in a fusion of the SI receptive fields (Allard et al., 1991) as does solely training
consisting of synchronous tactile stimulation to adjacent fingers (Wang et al., 1995). In
humans, altered peripheral input after amputations (Flor et al., 1995), or surgical repair of
syndactyly, induce SIc map plasticity (Mogilner et al., 1993). The same applies for carpal
tunnel syndrome (Tecchio et al., 2002) and chronic pain (Juottonen et al., 2002;
Vartiainen et al., 2008; 2009). In our patients the shorter distance could reflect fusion of
cortical finger representation areas due to difficulties in fine hand motor control and,
consequently, inappropriate sensory experience.
55
Interestingly, in these patients with subcortical lesions we consistently found changes not
only to stimulation of the palsied hand but also the normal hand. Previously, bilateral
changes in the cortical representation areas were seen in patients with unilateral focal hand
dystonia (loss of control of individual finger movements) (Elbert et al., 1998) and an
animal model of the same condition (Byl et al., 1997). The underlying mechanisms remain
unknown, however. Transient cortical changes on the unaffected side have been reported
after finger amputation in flying foxes (Calford and Tweedale, 1988) and unilateral SI
lesions in flying foxes and monkeys (Clarey et al., 1996). In human adults with unilateral
stroke, decreased callosal inhibition was suggested to lead to enhanced excitability in the
unaffected hemisphere (Forss et al., 1999). Further studies in CP patients are necessary to
confirm the present findings and to determine the underlying mechanisms and their
significance.
7.4. SEFs from the ipsilateral primary somatosensory cortex (SIi)
In two of the eight healthy newborns, stimulation of the ipsilateral (right) hand evoked
activity in the right hemisphere with source location very close to that of M60 evoked by
stimulation of the contralateral (left) hand. In these two newborns the ipsilateral source
was most likely at or near the SI. In an fMRI study of newborns, SIi responses were as
strong and frequent as those from the SIc (Erberich et al., 2006). In our study, the SIi
responses were clearly less consistent than the SIc responses in accordance with another
fMRI report (Arichi et al., 2010). Even in the two infants showing SIi SEFs in our study,
the latencies were longer than those of the M60 responses for the contralateral hand.
Anatomically, a greater amount of callosal fibers in newborns compared to adults could
account for the neonatal SIi responses. For example in newborn monkeys, the number of
callosal axons is three times greater than in adult monkeys, and in human neonates too the
cross sectional area of the corpus callosum decreases towards the end of gestation and still
during the first two postnatal months (Innocenti and Price, 2005). On the contrary, to our
knowledge, no anatomical evidence favors existence of direct ipsilateral projections
(transient or permanent) from the hand area to the primary somatosensory cortex.
In Study V, SIi responses to tactile stimulation were more frequent in the patients with
subcortical lesions than their controls. Most of these responses were evoked from the
normal hand and recorded in the affected hemisphere. These findings should not therefore
be taken as support for contralesional reorganization of the somatosensory representation.
In healthy adults, stimulation of the hand area rarely evokes SEFs from the SIi (Hari and
Forss, 1999; Kanno et al., 2003), though exceptions exist (MN stimulation: Korvenoja et
al., 1995; Kanno et al., 2003; tactile stimulation: Zhu et al., 2007; Pihko et al., 2010).
Frequent SIi activity in certain patient populations may reflect brain pathology and
increased excitability (Mima et al., 1998; Forss et al., 2001). Thus, the ipsilateral
responses provide further evidence on changes in organization and/or function of the
affected hemisphere and interplay between the SI areas. Since tactile stimulation also
activated the SIi in three controls, SIi activation in the patients can not be considered
abnormal per se. Interestingly, MN stimulation evoked no SIi activity within the first 100
ms in any patient or control.
56
7.5. Correlation of SEFs with behavioral and MRI data in the very preterm infants
and CP patients
Our data from the very preterm infants highlight the importance of also analyzing the
long-latency responses from areas other than the primary somatosensory cortex as the
M200 was absent in four infants with anatomical lesions in the right hemisphere. Two
infants with a comparable lesion had, however, a normal M200. Furthermore, in one
control infant, the M200 deflection, though detectable in the waveforms, did not have a
dipolar field pattern and its source could not be modeled. Thus, the prognostic significance
of the absence/presence of M200 remains to be seen. It is noteworthy, that in Study V the
SII activity was frequent in the control adolescents and the CP patients with purely
subcortical lesions, but SIIc responses were not present in any of the CP patients with
cortico-subcortical lesions and also the most severe clinical symptoms.
Furthermore, in Study V, absence of one or more of the early SIc MN SEF components
correlated with location and size of the anatomical lesions as well as with motor and
somatosensory skills. Previously, large defects and the late timing of the insult during
development were associated with worse motor outcome in hemiplegic patients (Staudt et
al., 2002; 2004). Motor skills do not necessarily correlate with somatosensory abilities,
however (Cooper et al., 1995). SEPs, on the other hand, have closely correlated with
motor function in hemiplegic children and 2 point discrimination ability of the palsied
hand (Cooper et al., 1995). The correlation found in our study demonstrates that the SEF
findings are also clinically relevant. Further understanding of the individual functional
changes underlying the common clinical symptoms may aid in developing more precise
rehabilitation and treatment methods.
57
8. CONCLUSIONS
We have shown, in a relatively large number of newborns, that somatosensory stimulation
evokes activity at both the SI and SII already a few days after birth. At this early age, the
opposite current orientation underlying the main response from the contralateral primary
somatosensory cortex in newborns, M60, compared with that of adults, P35m/M50,
reflects the still developmental stage of a newborn‟s somatosensory system. Similarly, the
enhancement of the newborn SII response (M200) during quiet sleep is in contrast with the
lack of SII responses during slow-wave sleep in adults. The systematic change of SEFs
during the first years of life reflects development of the cortical somatosensory circuits.
Study III showed that novel information about deficits in the cortical processing of the
somatosensory information in preterm infants can be obtained with MEG. The normal
latency and morphology of SEFs in the preterm infants recorded at term age suggest
functional somatosensory pathways. The weaker strength of M60 may, however, reflect
less synchronous firing and/or fewer activated neurons at SI. The association between
absence of the M200 response and anatomical lesions in four preterm infants demonstrates
that activity patterns at areas outside SI may also reveal clinically interesting information
on the somatosensory system of infants. Determining the prognostic significance of this
finding, however, remains a challenge for future studies.
Study V revealed differences of somatosensory processing within the SI in both
hemispheres of hemiplegic CP patients with subcortical brain lesions as compared to their
controls. Furthermore, no normal early SIc SEFs were detectable in the affected
hemisphere of most patients with cortico-subcortical lesions. These results highlight the
complex nature of functional reorganization after an early brain insult. Deeper
understanding of the various changes in the functional sensorimotor networks underlying
the common clinical symptoms of CP patients may ultimately enable more precise
tailoring of rehabilitation and treatment strategies.
58
ACKNOWLEDGEMENTS
This study was conducted at the BioMag Laboratory, Helsinki University Central
Hospital, and the Department of Clinical Neurophysiology, Department of Neurological
Sciences, University of Helsinki, in the years 2003–2010. During this time I had the
privilege to encounter a number of brilliant people who all have influenced my work. I
would particularly like to thank the following people.
My heartfelt thanks go to my supervisors Docent Leena Lauronen and Docent Elina Pihko.
You have both been the best of mentors and provided me with a fruitful but relaxed
atmosphere to grow as a researcher and as an individual. I can not exaggerate my
appreciation for the two of you as scientist, persons, and friends. Leena is the one who
introduced me to MEG and originally got me interested in developmental neuroscience. I
remember her once saying “Could there be anything more interesting than studying the
developing brain?” to which I could nothing but agree. Elina has been my mainstay
throughout the process. Her wide knowledge on the field of MEG still continues to
surprise and amaze me. Without her devotion to the project (including early morning
measurements before my medical school classes) these studies would never have been
completed.
The Head of the BioMag Laboratory, Docent Jyrki Mäkelä, is thanked not only for
allowing me to work in the facilities but also for valuable comments and discussions about
my work. I would also like to thank the Heads of the Departments the study was
conducted in: Docent Juhani Partanen (Department of Clinical Neurophysiology) and
Professor Timo Erkinjuntti (Department of Neurological Sciences, University of
Helsinki). The Head of the Pediatric Graduate School in Helsinki, Professor Markku
Heikinheimo, is acknowledged for providing a support network for young researchers.
Professor Vineta Fellman and Docent Minna Huotilainen, the pre-examiners of this thesis,
are warmly thanked for their excellent comments and constructive criticism.
I kindly thank Professor Jari Karhu for accepting the role of the opponent.
My sincere thanks go to all my co-authors: Professor Yoshio Okada for his determination
in introducing developmental neuroscience to the MEG community, which to me has been
an amazing inspiration, Anke Sambeth for her spirit and optimism during all the hours we
spent together in the MEG room observing the infants, Heidi Wikström for lively and
thought evoking discussions, Lauri Parkkonen for offering his help with whatever the
matter, and Julia Stephen for assistance with the infant measurements. Docent Marjo
Metsäranta and Docent Sture Andersson are thanked for initiating and leading the
“KeKeKe” project, Helena Mäenpää for her enthusiasm to provide better care for patients
with cerebral palsy, and Docent Taina Autti and Docent Leena Valanne for sharing their
excellence in neuroradiology.
59
A number of people have provided invaluable assistance with a variety of practical
matters. I am deeply indebted to Marita Suni for caring for the preterm infants during the
MEG measurements. I warmly thank Kyllikki Nevalainen for her help in organizing the
measurements of the adolescents with cerebral palsy as well as Paula Hellen and Nadja
Ristaniemi for their occupational assessments. In addition, the personnel of the maternity
ward of the Helsinki University Central Hospital, and the neonatal wards of Kätilöopisto
Maternity Hospital and Jorvi Hospital are thanked for their seamless co-operation.
What really made the years spent on this thesis worthwhile are my colleagues in the
laboratory. I am very grateful to Suvi Heikkilä and Jari Kainulainen for their guidance
with the MEG measurements. I warmly thank Pirjo Kari for her help with any kinds of
practical matters and for never letting me miss any deadlines or laboratory seminars. Jussi
Nurminen receives my greatest gratitude for his endless patience with all my technical
questions or problems. My other lab mates: Ville Mäntynen, Simo Monto, Pantelis
Lioumis, Juha Heiskala, Katja Airaksinen, Juha Wilenius, Juha Montonen, Andrei
Zhdanov, Ville Mäkinen, Ritva Paetau, Rozalia Bikmullina, Essi Marttinen-Rossi, Ana
Sušac, Johanna Salonen, and Bei Wang are warmly thanked for support as well as
interesting scientific and sometimes non-scientific discussions during our lunch breaks and
“question hours”.
The Elekta Neuromag crew deserves special thanks for their patient and thorough help
with any hard- or software questions I encountered. Particularly, Samu Taulu and Jukka
Nenonen have been of invaluable assistance.
I am deeply grateful to all the families who participated in the studies. The enthusiastic
welcome the project received from all of them has been overwhelming.
Finally, my heartfelt thanks go to my partner and best friend, Väinö Toppinen, for his
everlasting optimism and support throughout these years. Väinö, you brightened up my
darkest moments with your version of Nuyorican Soul‟s “You can do it, baby” and made
also the off-duty hours of the past years unforgettable. I would also like thank my parents,
Pirkko and Kalervo Nevalainen, for evoking my interest in science already from a young
age.
My work was financially supported by the Finnish Cultural Foundation, the Pediatric
Research Foundation, the Biomedicum Helsinki Foundation, the Jenny and Antti Wihuri
Foundation, the Pediatric Graduate School, the Finnish Medical Foundation, The Emil
Aaltonen Foundation, the Maud Kuistila Foundation, and Helsinki University Central
Hospital Research Funds.
Helsinki, June 2010
Päivi Nevalainen
60
REFERENCES
Adachi Y, Miyamoto M, Kawai J, Kawabata M, Higuchi M, Oyama D, Uehara G, Ogata
H, Kado H, Haruta Y, Tesan G, Crain S. Development of a Whole-Head Child
MEG System. In: Adv Biomagn IFMBE Proc 2010; 28: 35–38.
Allard T, Clark SA, Jenkins WM, Merzenich MM. Reorganization of somatosensory area
3b representations in adult owl monkeys after digital syndactyly. J Neurophysiol
1991; 66: 1048–1058.
Allison T, McCarthy G, Wood CC, Darcey TM, Spencer DD, Williamson PD. Human
cortical potentials evoked by stimulation of the median nerve. I. Cytoarchitectonic
areas generating short-latency activity. J Neurophysiol 1989; 62: 694–710.
Allison T, Wood CC, McCarthy G, Spencer DD. Cortical somatosensory evoked
potentials. II. Effects of excision of somatosensory or motor cortex in humans and
monkeys. J Neurophysiol 1991a; 66: 64–82.
Allison T, McCarthy G, Wood CC, Jones SJ. Potentials evoked in human and monkey
cerebral cortex by stimulation of the median nerve. A review of scalp and
intracranial recordings. Brain 1991b; 114: 2465–2503.
Arichi T, Moraux A, Melendez A, Doria V, Groppo M, Merchant N, Combs S, Burdet E,
Larkman DJ, Counsell SJ, Beckmann CF, Edwards AD. Somatosensory cortical
activation identified by functional MRI in preterm and term infants. NeuroImage
2010; 49: 2063–2071.
Arrezzo JC, Vaughan HG Jr, Legatt AG. Topography and intracranial sources of
somatosensory evoked potentials in the monkey. II. Cortical components.
Electroencephalogr Clin Neurophysiol 1981; 51: 1–18.
Bartel P, Conradie J, Robinson E, Prinsloo J, Becker P. The relationship between median
nerve somatosensory evoked potential latencies and age and growth parameters in
young children. Electroenceph Clin Neurophysiol 1987; 68: 180–186.
Baumgartner C, Doppelbauer A, Deecke L, Barth DS, Zeitlhofer J, Lindinger G,
Sutherling WW. Neuromagnetic investigation of somatotopy of human hand
somatosensory cortex. Exp Brain Res 1991; 87: 641–648.
Bell-Krotoski J, Tomancik E. The repeatability of testing with Semmes-Weinstein
monofilaments. J Hand Surg Am 1987; 12: 155–161.
Ben-Ari Y, Khalilov I, Represa A, Gozlan H. Interneurons set the tune of developing
networks. Trends Neurosci 2004; 27: 422–427.
Biermann K, Schmitz F, Witte OW, Konczak J, Freund HJ, Schnitzler A. Interaction of
finger representation in the human first somatosensory cortex: a neuromagnetic
study. Neurosci Lett 1998; 251: 13–16.
Boor R, Goebel B. Maturation of near-field and far-field somatosensory evoked potentials
after median nerve stimulation in children under 4 years of age. Clin Neurophysiol
2000; 111: 1070–1081.
Bouza H, Rutherford M, Acolet D, Pennock JM, Dubowitz LM. Evolution of early
hemiplegic signs in full-term infants with unilateral brain lesions in the neonatal
period: a prospective study. Neuropediatrics 1994; 25: 201–207.
Brenner D, Lipton J, Kaufman L, Williamson SJ. Somatically evoked magnetic fields of
the human brain. Science 1978; 199: 81–83.
61
Burton H, Sathian K, Shao DH. Altered responses to cutaneous stimuli in the second
somatosensory cortex following lesions of the postcentral gyrus in infant and
juvenile macaques. J Comp Neurol 1990; 291: 395–414.
Byl NN, Merzenich MM, Cheung S, Bedenbaugh P, Nagarajan SS, Jenkins WM. A
primate model for studying focal dystonia and repetitive strain injury: effects on the
primary somatosensory cortex. Phys Ther 1997; 77: 269–284.
Bystron I, Blakemore C, Rakic P. Development of the human cerebral cortex: Boulder
Committee revisited. Nat Rev Neurosci 2008; 9: 110–122.
Calford MB, Tweedale R. Immediate and chronic changes in responses of somatosensory
cortex in adult flying-fox after digit amputation. Nature 1988; 332: 446–448.
Cans C. Surveillance of cerebral palsy in Europe: a collaboration of cerebral palsy surveys
and registers. Surveillance of Cerebral Palsy in Europe (SCPE). Dev Med Child
Neurol 2000; 42: 816–824.
Cans C, McManus V, Crowley M, Guillem P, Platt MJ, Johnson A, Arnaud C. Cerebral
palsy of post-neonatal origin: characteristics and risk factors. Paediatr Perinat
Epidemiol 2004; 18: 214–220.
Clarey JC, Tweedale R, Calford MB. Interhemispheric modulation of somatosensory
receptive fields: evidence for plasticity in primary somatosensory cortex. Cereb
Cortex 1996; 6: 196–206.
Cooper J, Majnemer A, Rosenblatt B, Birnbaum R. The determination of sensory deficits
in children with hemiplegic cerebral palsy. J Child Neurol 1995; 10: 300–309.
Coyer PE, Lesnick JE, Michele JJ, Simeone FA. Failure of the somatosensory evoked
potential following middle cerebral artery occlusion and high-grade ischemia in the
cat – effects of hemodilution. Stroke 1986; 17: 37–43.
DeFelipe J, Alonso-Nanclares L, Arellano JI. Microstructure of the neocortex:
Comparative aspects. J Neurocytol 2002; 31: 299–316.
de Vries LS, Eken P, Pierrat V, Daniels H, Casaer P. Prediction of neurodevelopmental
outcome in the preterm infant: short latency cortical somatosensory evoked
potentials compared with cranial ultrasound. Arch Dis Child 1992; 67: 1177–1181.
Desmedt JE, Manil J. Somatosensory evoked potentials of the normal human neonate in
REM sleep, in slow wave sleep and in waking. Electroencephalogr Clin
Neurophysiol 1970; 29: 113–126.
Desmedt JE, Brunko E, Debecker J. Maturation of the somatosensory evoked potentials in
normal infants and children, with special reference to the early N1 component.
Electroencephalogr Clin Neurophysiol 1976; 40: 43–58.
Dzhala VI, Talos DM, Sdrulla DA, Brumback AC, Mathews GC, Benke TA, Delpire E,
Jensen FE, Staley KJ. NKCC1 transporter facilitates seizures in the developing
brain. Nat Med 2005; 11: 1205–1213.
Egawa K, Asahina N, Shiraishi H, Kamada K, Takeuchi F, Nakane S, Sudo A, Kohsaka S,
Saitoh S. Aberrant somatosensory-evoked responses imply GABAergic dysfunction
in Angelman syndrome. Neuroimage 2008; 39: 593–599.
Elbert T, Candia V, Altenmüller E, Rau H, Sterr A, Rockstroh B, Pantev C, Taub E.
Alteration of digital representations in somatosensory cortex in focal hand dystonia.
Neuroreport 1998; 9: 3571–3575.
62
Eliasson AC, Krumlinde-Sundholm L, Rösblad B, Beckung E, Arner M, Öhrvall AM,
Rosembaum B. The Manual Ability Classification System (MACS) for children
with cerebral palsy: scale development and evidence of validity and reliability. Dev
Med Child Neurol 2006; 48: 549–554.
Erberich SG, Panigrahy A, Friedlich P, Seri I, Nelson MD, Gilles F. Somatosensory
lateralization in the newborn brain. Neuroimage 2006; 29: 155–161.
Eyre JA, Miller S, Clowry GJ, Conway EA, Watts C. Functional corticospinal projections
are established prenatally in the human foetus permitting involvement in the
development of spinal motor centres. Brain 2000; 123: 51–64.
Eyre JA, Taylor JP, Villagra F, Smith M, Miller S. Evidence of activity-dependent
withdrawal of corticospinal projections during human development. Neurology
2001; 57: 1543–1554.
Eyre JA. Corticospinal tract development and its plasticity after perinatal injury. Neurosci
Biobehav Rev 2007; 31: 1136–1149.
Eyre JA, Smith M, Dabydeen L, Clowry GJ, Petacchi E, Battini R, Guzzetta A, Cioni G. Is
hemiplegic cerebral palsy equivalent to amblyobia of the corticospinal system? Ann
Neurol 2007; 62: 493–503.
Flemming L, Wang Y, Caprihan A, Eiselt M, Haueisen J, Okada Y. Evaluation of the
distortion of EEG signals caused by a hole in the skull mimicking the fontanel in the
skull of human neonates. Clin Neurophysiol 2005; 116: 1141–1152.
Flor H, Elbert T, Knecht S, Wienbruch C, Pantev C, Birbaumer N, Larbig W, Taub E.
Phantom-limb pain as a perceptual correlate of cortical reorganization following
arm amputation. Nature 1995; 375: 482–484.
Forss N, Hari R, Salmelin R, Ahonen A, Hämäläinen M, Kajola M, Knuutila J, Simola J.
Activation of the human posterior parietal cortex by median nerve stimulation. Exp
Brain Res 1994a; 99: 309–315.
Forss N, Salmelin R, Hari R. Comparison of somatosensory evoked fields to airpuff and
electric stimuli. Electroencephalogr Clin Neurophysiol 1994b; 92: 510–517.
Forss N, Merlet I, Vanni S, Hämäläinen M, Mauguière F, Hari R. Activation of human
mesial cortex during somatosensory target detection task. Brain Res 1996; 734:
229–235.
Forss N, Jousmäki V. Sensorimotor integration in human primary and secondary
somatosensory cortices. Brain Res 1998; 781: 259–267.
Forss N, Hietanen M, Salonen O, Hari R. Modified activation of somatosensory cortical
network in patients with right-hemisphere stroke. Brain 1999; 122: 1889–1899.
Forss N, Silén T, Karjalainen T. Lack of activation of human secondary somatosensory
cortex in Unverricht-Lundborg type of progressive myoclonus epilepsy. Ann Neurol
2001; 49: 90–97.
García A, Calleja J, Antolín FM, Berciano J. Peripheral motor and sensory nerve
conduction studies in normal infants and children. Clin Neurophysiol 2000; 111:
513–520.
Garcia-Larrea L, Frot M, Valeriani M. Brain generators of laser-evoked potentials: from
dipoles to functional significance. Clin Neurophysiol 2003; 33: 279–292.
63
George SR, Taylor MJ. Somatosensory evoked potentials in neonates and infants:
developmental and normative data. Electroencephalogr Clin Neurophysiol 1991; 80:
94–102.
Gilbert SF. Developmental biology. Sunderland, Massachusetts, USA: Sinauer Associates,
Inc, 2006: 373–397.
Gibson NA, Brexinova V, Levene MI. Somatosensory evoked potentials in the term
newborn. Electroencephalogr Clin Neurophysiol 1992: 84; 26–31.
Gondo K, Tobimatsu S, Kira R, Tokunaga Y, Yamamoto T, Hara T. A
magnetoencephalographic study on development of the somatosensory cortex in
infants. Neuroreport 2001; 12: 3227–3231.
Guzzetta A, Bonanni P, Biagi L, Tosetti M, Montanaro D, Guerrini R, Cioni G.
Reorganisation of the somatosensory system after early brain damage. Clin
Neurophysiol 2007; 118: 1110–1121.
Hamada Y, Okita H, Suzuki R. Effect of interstimulus interval on attentional modulation
of cortical activities in human somatosensory areas. Clin Neurophysiol 2003; 114:
548–555.
Hari R, Hämäläinen M, Kaukoranta E, Reinikainen K, Teszner D. Neuromagnetic
responses from the second somatosensory cortex in man. Acta Neurol Scand 1983;
68: 207–212.
Hari R, Reinikainen K, Kaukoranta E, Hämäläinen M, Ilmoniemi R, Penttinen A,
Salminen J, Teszner D. Somatosensory evoked cerebral magnetic fields from SI and
SII in man. Electroencephalogr Clin Neurophysiol 1984; 57: 254–263.
Hari R, Hämäläinen H, Hämäläinen M, Kekoni J, Sams M, Tiihonen J. Separate finger
representations at the human second somatosensory cortex. Neuroscience 1990; 37:
245–249.
Hari R, Karhu J, Hämäläinen M, Knuutila J, Salonen O, Sams M, Vilkman V. Functional
organization of the human first and second somatosensory cortices: a neuromagnetic
study. Eur J Neurosci 1993; 5: 724–734.
Hari R, Forss N. Magnetoencephalography in the study of human somatosensory cortical
processing. Philos Trans R Soc Lond B Biol Sci 1999; 354: 1145–1154.
Hari R, Imada T. Ipsilateral movement-evoked fields reconsidered. Neuroimage 1999; 10:
582–588.
Hari R, Parkkonen L, Nangini C. The brain in time: insights from neuromagnetic
recordings. Ann N Y Acad Sci 2010; 1191: 89–109.
Hashimoto I. Somatosensory evoked potentials elicited by air-puff stimuli generated by a
new high-speed air control system. Electroencephalogr Clin Neurophysiol 1987; 67:
231–237.
Hashimoto I. Trigeminal evoked potentials following brief air-puff: enhanced
signal-to-noise ratio. Ann Neurol 1988; 23: 332–338.
Herlenius E, Lagercrantz H. Development of neurotransmitter systems during critical
periods. Exp Neurol 2004; 190: S8–21.
Hermann RP, Novak CB, Mackinnon SE. Establishing normal values of moving two-point
discrimination in children and adolescents. Dev Med Child Neurol 1996; 38: 255–
261.
64
Holmes GL. Morphological and physiological maturation of the brain in the neonate and
young child. J Clin Neurophysiol 1986; 3: 209–238.
Hrbek A, Karlberg P, Olsson T. Development of visual and somatosensory evoked
responses in pre-term newborn infants. Electroencephalogr Clin Neurophysiol 1973;
34: 225–232.
Hsiao S. Central mechanisms of tactile shape perception. Curr Op Neurobiol 2008; 18:
418–424.
Huttenlocher PR, Dabholkar AS. Regional differences in synaptogenesis in human
cerebral cortex. J Comp Neurol 1997; 387: 167–178.
Huttunen J, Hömberg V. Influence of stimulus repetition rate on cortical somatosensory
potentials evoked by median nerve stimulation: implications for generation
mechanisms. J Neurol Sci 1991; 105: 37–43.
Huttunen J, Ahlfors S, Hari R. Interaction of afferent impulses in the human primary
sensorimotor cortex. Electroencephalogr Clin Neurophysiol 1992; 82: 176–181.
Huttunen J, Wikström H, Korvenoja A, Seppäläinen AM, Aronen H, Ilmoniemi RJ.
Significance of the second somatosensory cortex in sensorimotor integration:
enhancement of sensory responses during finger movements. Neuroreport 1996; 7:
1009–1012.
Huttunen J. Does the P35m SEF deflection really come from the motor cortex?
Electroencephalogr Clin Neurophysiol 1997; 104: 101–102.
Huttunen J, Jääskelainen IP, Hirvonen J, Kaakkola S, Ilmoniemi RJ, Pekkonen E.
Scopolamine reduces the P35m and P60m deflections of the human somatosensory
evoked magnetic fields. Neuroreport 2001; 12: 619–623.
Huttunen J, Komssi S, Lauronen L. Spatial dynamics of population activities at S1 after
median and ulnar nerve stimulation revisited: an MEG study. Neuroimage 2006; 32:
1024–1031.
Huttunen J, Pekkonen E, Kivisaari R, Autti T, Kähkönen S. Modulation of somatosensory
evoked fields from SI and SII by acute GABA A-agonism and paired-pulse
stimulation. Neuroimage 2008; 40: 427–434.
Hyvärinen J. Posterior parietal lobe of the primate brain. Physiol Rev 1982; 62: 1060–
1129.
Hämäläinen M, Hari R, Ilmoniemi RJ, Knuutila J, Lounasmaa OV.
Magnetoencephalography – theory, instrumentation, and applications to noninvasive
studies of the working human brain. Reviews in Modern Physics 1993; 65: 413–
497.
Ikeda H, Wang Y, Okada YC. Origins of the somatic N20 and high-frequency oscillations
evoked by trigeminal stimulation in the piglets. Clin Neurophysiol. 2005; 116: 827–
841.
Inder TE, Warfield SK, Wang H, Hüppi PS, Volpe JJ. Abnormal cerebral structure is
present at term in premature infants. Pediatrics 2005; 115: 286–294.
Innocenti GM, Price DJ. Exuberance in the development of cortical networks. Nat Rev
Neurosci 2005; 6: 955–965.
Iwamura Y. Bilateral receptive field neurons and callosal connections in the
somatosensory cortex. Philos Trans R Soc Lond B Biol Sci 2000; 355: 267–273.
65
Juottonen K, Gockel M, Silén T, Hurri H, Hari R, Forss N. Altered central sensorimotor
processing in patients with complex regional pain syndrome. Pain 2002; 98: 315–
323.
Kakigi R, Naka D, Okusa T, Wang X, Inui K, Qiu Y, Tran TD, Miki K, Tamura Y,
Nguyen TB, Watanabe S, Hoshiyama M. Sensory perception during sleep in
humans: a magnetoencephalograhic study. Sleep Med 2003; 4: 493–507.
Kandel ER, Schwartz JH, Jessell TM. Principles of neural science. New York, USA:
McGraw-Hill, 2000: 105–297, 411–471.
Kanno A, Nakasato N, Hatanaka K, Yoshimoto T. Ipsilateral area 3b responses to median
nerve somatosensory stimulation. Neuroimage 2003; 18: 169–177.
Karhu J, Hari R, Lu ST, Paetau R, Rif J. Cerebral magnetic fields to lingual stimulation.
Electroencephalogr Clin Neurophysiol 1991; 80: 459–468.
Karniski W. The late somatosensory evoked potential in premature and term infants. I.
Principal component topography. Electroencephalogr Clin Neurophysiol 1992; 84:
32–43.
Karniski W, Wyble L, Lease L, Blair RC. The late somatosensory evoked potential in
premature and term infants. II. Topography and latency development.
Electroencephalogr Clin Neurophysiol 1992; 84: 44–54.
Kaukoranta E, Hämäläinen M, Sarvas J, Hari R. Mixed and sensory nerve stimulations
activate different cytoarchitectonic areas in the human primary somatosensory
cortex SI. Neuromagnetic recordings and statistical considerations. Exp Brain Res
1986; 63: 60–66.
Kawamura T, Nakasato N, Seki K, Kanno A, Fujita S, Fujiwara S, Yoshimoto T.
Neuromagnetic evidence of pre- and post-central cortical sources of somatosensory
evoked responses. Electroencephalogr Clin Neurophysiol 1996; 100: 44–50.
Khwaja O, Volpe JJ. Pathogenesis of cerebral white matter injury of prematurity. Arch Dis
Child Fetal Neonatal Ed 2008; 93: F153–161.
Kim HG, Fox K, Connors BW. Properties of excitatory synaptic events in neurons of
primary somatosensory cortex of neonatal rats. Cereb Cortex 1995; 5: 148–157.
Kitamura Y, Kakigi R, Hoshiyama M, Koyama S, Nakamura A. Effects of sleep on
somatosensory evoked responses in human: a magnetoencephalographic study.
Cogn Brain Res 1996; 4: 275–279.
Klimach VJ, Cooke RW. Maturation of the neonatal somatosensory evoked response in
preterm infants. Dev Med Child Neurol 1988a; 30: 208–214.
Klimach VJ, Cooke RW. Short-latency cortical somatosensory evoked responses of
preterm infants with ultrasound abnormality of the brain. Dev Med Child Neurol
1988b; 30: 215–221.
Korvenoja A, Wikström H, Huttunen J, Virtanan J, Laine P, Aronen HJ, Seppäläinen AM,
Ilmoniemi RJ. Activation of ipsilateral primary sensorimotor cortex by median
nerve stimulation. Neuroreport 1995; 6: 2589–2593.
Kostovic I, Rakic P. Developmental history of the transient subplate zone in the visual and
somatosensory cortex of the macaque monkey and human brain. J Comp Neurol
1990; 297: 441–470.
Kostović I, Judaš M, Petanjek Z, Šimić G. Ontogenesis of goal-directed behaviour:
anatomo-functional considerations. Int J Psychophysiol 1995; 19: 85–102.
66
Kostović I, Judaš M. Correlation between the sequential ingrowth of afferents and
transient patterns of cortical lamination in preterm infants. Anat Rec 2002; 267: 1–6.
Kostović I, Jovanov-Milošević N. The development of cerebral connections during the
first 20–45 weeks' gestation. Semin Fetal Neonatal Med 2006; 11: 415–422.
Laget P, Raimbault J, D'Allest AM, Flores-Guevara R, Mariani J, Thieriot-Prevost G. La
maturation des potentiels evoques somesthesiques (pes) chez l‟homme.
Electroencephalogr Clin Neurophysiol 1976; 40: 499–515.
Laptook AR, O'Shea TM, Shankaran S, Bhaskar B. Adverse neurodevelopmental
outcomes among extremely low birth weight infants with a normal head ultrasound:
prevalence and antecedents. Pediatrics 2005; 115: 673–680.
Laureau E, Majnemer A, Rosenblatt B, Riley P. A longitudinal study of short latency
somatosensory evoked responses in healthy newborns and infants.
Electroencephalogr Clin Neurophysiol 1988; 71: 100–108.
Laureau E, Marlot D. Somatosensory evoked potentials after median and tibial nerve
stimulation in healthy newborns. Electroencephalogr Clin Neurophysiol 1990; 76:
453–458.
Lauronen L, Huttunen J, Kirveskari E, Wikström H, Sainio K, Autti T, Santavuori P.
Enlarged SI and SII somatosensory evoked responses in the CLN5 form of neuronal
ceroid lipofuscinosis. Clin Neurophysiol 2002; 113: 1491–1500.
Lauronen L, Nevalainen P, Wikström H, Parkkonen L, Okada Y, Pihko E. Immaturity of
somatosensory cortical processing in human newborns. NeuroImage 2006; 33: 195–
203.
Majnemer A, Rosenblatt B, Riley PS. Prognostic significance of multimodality evoked
response testing in high-risk newborns. Pediatr Neurol 1990; 6: 367–374.
Marin-Padilla M. Prenatal and early postnatal ontogenesis of the human motor cortex: A
golgi study. I. The sequential development of the cortical layers. Brain Res 1970;
23: 167–183.
Marlow N, Wolke D, Bracewell MA, Samara M. Neurologic and developmental disability
at six years of age after extremely preterm birth. N Engl J Med 2005; 352: 9–19.
McPherson RW, Zeger S, Traystman RJ. Relationship of somatosensory evoked potentials
and cerebral oxygen consumption during hypoxic hypoxia in dogs. Stroke 1986; 17:
30–36.
Medvedovsky M, Taulu S, Bikmullina R, Ahonen A, Paetau R. Fine tuning the correlation
limit of spatio-temporal signal space separation for magnetoencephalography. J
Neurosci Methods 2009; 177: 203–211.
Menier C, Forget R, Lambert J. Evaluation of two-point discrimination in children:
reliability, effects of passive displacement and voluntary movements. Dev Med
Child Neurol 1996; 38: 523–537.
Mertens M, Lütkenhöner B. Efficient neuromagnetic determination of landmarks in the
somatosensory cortex. Clin Neurophysiol 2000; 111: 1478–1487.
Mikkola K, Ritari N, Tommiska V, Salokorpi T, Lehtonen L, Tammela O, Pääkkönen L,
Olsen P, Korkman M, Fellman V. Neurodevelopmental outcome at 5 years of age of
a national cohort of extremely low birth weight infants who were born in 1996–
1997. Pediatrics 2005; 116: 1391–1400.
67
Mima T, Nagamine T, Nishitani N, Mikuni N, Ikeda A, Fukuyama H, Takigawa T,
Kimura J, Shibasaki H. Cortical myoclonus: sensorimotor hyperexcitability.
Neurology 1998; 50: 933–942.
Moberg E. Two-point discrimination test. A valuable part of hand surgical rehabilitation,
e.g. in tetraplegia. Scand J Rehabil Med 1990; 22: 127–134.
Mogilner A, Grossman JA, Ribary U, Joliot M, Volkmann J, Rapaport D, Beasley RW,
LLinás RR. Somatosensory cortical plasticity in adult humans revealed by
magnetoencephalography. Proc Natl Acad Sci U S A 1993; 90: 3593–3597.
Molliver ME, Kostović I, Van Der Loos H. The development of synapses in cerebral
cortex of the human fetus. Brain Res 1973; 50: 403–407.
Moody WJ, Bosma MM. Ion channel development, spontaneous activity, and
activity-dependent development in nerve and muscle cells. Physiol Rev 2005; 85:
883–941.
Mountcastle VB, Lynch JC, Georgopoulos A, Sakata H, Acuna C. Posterior parietal
association cortex of the monkey: command functions for operations within
extrapersonal space. J Neurophysiol 1975; 38: 871–908.
Mrzljak L, Uylings HBM, Kostovic I, van Eden CG. Prenatal development of neurons in
the human prefrontal cortex: II. A quantative Golgi study. J Comp Neurol 1992;
316: 485–496.
Müller K, Ebner B, Hömberg V. Maturation of fastest afferent and efferent central and
peripheral pathways: no evidence for a constancy of central conduction delays.
Neurosci Lett 1994; 166: 9–12.
Murakami S, Zhang T, Hirose A, Okada YC. Physiological origins of evoked magnetic
fields and extracellular field potentials produced by guinea-pig CA3 hippocampal
slices. J Physiol 2002; 544: 237–251.
Murakami S, Hirose A, Okada YC. Contribution of ionic currents to
magnetoencephalography (MEG) and electroencephalography (EEG) signals
generated by guinea-pig CA3 slices. J Physiol 2003; 553: 975–985.
Murakami S, Okada Y. Contributions of principal neocortical neurons to
magnetoencephalography and electroencephalography signals. J Physiol 2006; 575:
925–936.
Nakamura A, Yamada T, Goto A, Kato T, Ito K, Abe Y, Kachi T, Kakigi R.
Somatosensory homunculus as drawn by MEG. Neuroimage 1998; 7: 377–386.
Nakanishi T, Takita K, Toyokura Y. Somatosensory evoked responses to tactile tap in
man. Electroencephalogr Clin Neurophysiol 1973; 34: 1–6.
Neil JJ, Inder TE. Imaging perinatal brain injury in premature infants. Semin Perinatol
2004; 28: 433–443.
Nevalainen P, Ramstad R, Isotalo E, Haapanen ML, Lauronen L. Trigeminal
somatosensory evoked magnetic fields to tactile stimulation. Clin Neurophysiol
2006; 117: 2007–2015.
Noachtar S, Lüders HO, Dinner DS, Klem G. Ipsilateral median somatosensory evoked
potentials recorded from human somatosensory cortex. Electroencephalogr Clin
Neurophysiol 1997; 104: 189–198.
O'Leary DD, Chou SJ, Sahara S. Area patterning of the mammalian cortex. Neuron 2007;
56: 252–269.
68
Okada YC, Tanenbaum R, Williamson SJ, Kaufman L. Somatotopic organization of the
human somatosensory cortex revealed by neuromagnetic measurements. Exp Brain
Res 1984; 56: 197–205.
Okada YC, Wu J, Kyuhou S. Genesis of MEG signals in a mammalian CNS structure.
Electroenceph Clin Neurophysiol 1997; 103: 474–485.
Okada Y, Pratt K, Nurminen J, Paulson D. BabySQUID: A mobile, high-resolution
multichannel magnetoencephalography system for neonatal brain assesment.
Review of scientific instruments 2006; 77.
Pharoah PO, Cooke T, Johnson MA, King R, Mutch L. Epidemiology of cerebral palsy in
England and Scotland, 1984–9. Arch Dis Child Fetal Neonatal Ed 1998; 79: F21–
25.
Pierrat V, Eken P, Truffert P, Duquennoy C, de Vries LS. Somatosensory evoked
potentials in preterm infants with intrauterine growth retardation. Early Hum Dev
1996; 44: 17–25.
Pierrat V, Eken P, de Vries LS. The predictive value of cranial ultrasound and of
somatosensory evoked potentials after nerve stimulation for adverse neurological
outcome in preterm infants. Dev Med Child Neurol 1997; 39: 398–403.
Pihko E, Lauronen L, Wikström H, Taulu S, Nurminen J, Kivitie-Kallio S, Okada Y.
Somatosensory evoked potentials and magnetic fields elicited by tactile stimulation
of the hand during active and quiet sleep in newborns. Clin Neurophysiol 2004; 115:
448–455.
Pihko E, Lauronen L. Somatosensory processing in healthy newborns. Exp Neurol
2004;190: 2–7.
Pihko E, Lauronen L, Wikström H, Parkkonen L, Okada Y. Somatosensory evoked
magnetic fields to median nerve stimulation in newborns. International Congress
Series 2005; 1278: 211–214.
Pihko E, Nevalainen P, Stephen J, Okada Y, Lauronen L. Maturation of somatosensory
cortical processing from birth to adulthood revealed by magnetoencephalography.
Clin neurophysiol 2009; 120: 1552–1561.
Pihko E, Nangini C, Jousmäki V, Hari R. Observing touch activates human primary
somatosensory cortex. Eur J Neurosci 2010; 31: 1836–1843.
Pike AA, Marlow N. The role of cortical evoked responses in predicting neuromotor
outcome in very preterm infants. Early Hum Dev 2000; 57: 123–135.
Pons TP, Garraghty PE, Mishkin M. Lesion-induced plasticity in the second
somatosensory cortex of adult macaques. Proc Natl Acad Sci U S A 1988; 85:
5279–5281.
Porcaro C, Barbati G, Zappasodi F, Rossini PM, Tecchio F. Hand sensory-motor cortical
network assessed by functional source separation. Hum Brain Mapp 2008; 29: 70–
81.
Prechtl HF. The behavioural states of the newborn infant (a review). Brain Res 1974; 76:
185–212.
Radoš M, Judaš M, Kostović I. In vitro MRI of brain development. Eur J Radiol 2006; 57:
187–198.
69
Rechtshaffen A, Kales A. A manual of standardized terminology: techniques and scoring
system for sleep stages of human subjects. Washington, DC, USA: US Government
Printing Office, 1968.
Represa A, Ben-Ari Y. Trophic actions of GABA on neuronal development. Trends
Neurosci 2005; 28: 278–283.
Restuccia D, Valeriani M, Grassi E, Gentili G, Mazza S, Tonali P, Mauguière F.
Contribution of GABAergic cortical circuitry in shaping somatosensory evoked
scalp responses: specific changes after single-dose administration of tiagabine. Clin
Neurophysiol 2002; 113: 656–671.
Ridley RM, Ettlinger G. Further evidence of impaired tactile learning after removals of the
second somatic sensory projection cortex (SII) in the monkey. Exp Brain Res 1978;
31: 475–488.
Rivera C, Voipio J, Payne JA, Ruusuvuori E, Lahtinen H, Lamsa K, Pirvola U, Saarma M,
Kaila K. The K+/Cl- co-transporter KCC2 renders GABA hyperpolarizing during
neuronal maturation. Nature 1999; 397: 251–255.
Sack AT. Parietal cortex and spatial cognition. Behav Brain Res 2009; 202: 153–161.
Sann C, Streri A. Intermanual transfer of object texture and shape in human neonates.
Neuropsychologia 2008; 46: 698–703.
Shimojo M, Kakigi R, Hoshiyama M, Koyama S, Kitamura Y, Watanabe S. Intracerebral
interactions caused by bilateral median nerve stimulation in man: a
magnetoencephalographic study. Neurosci Res 1996; 24: 175–181.
Simões C, Hari R. Relationship between responses to contra- and ipsilateral stimuli in the
human second somatosensory cortex SII. Neuroimage 1999; 10: 408–416.
Simões C, Mertens M, Forss N, Jousmäki V, Lütkenhöner B, Hari R. Functional overlap
of finger representations in human SI and SII cortices. J Neurophysiol 2001; 86:
1661–1665.
Smit BJ, Ongerboer de Visser BW, de Vries LS, Dekker FW, Kok JH. Somatosensory
evoked potentials in very preterm infants. Clin Neurophysiol 2000; 111: 901–908.
Sonoo M, Shimpo T, Takeda K, Genba K, Nakano I, Mannen T. SEPs in two patients with
localized lesions of the postcentral gyrus. Electroencephalogr Clin Neurophysiol
1991; 80: 536–546.
Spruston N. Pyramidal neurons: dendritic structure and synaptic integration. Nat Rev
Neurosci 2008; 9: 206–221.
Staudt M, Grodd W, Gerloff C, Erb M, Stitz J, Krägeloh-Mann I. Two types of ipsilateral
reorganization in congenital hemiparesis: a TMS and fMRI study. Brain 2002; 125:
2222–2237.
Staudt M, Gerloff C, Grodd W, Holthausen H, Niemann G, Krägeloh-Mann I.
Reorganization in congenital hemiparesis acquired at different gestational ages. Ann
Neurol 2004; 56: 854–863.
Staudt M, Braun C, Gerloff C, Erb M, Grodd W, Krägeloh-Mann I. Developing
somatosensory projections bypass periventricular brain lesions. Neurology 2006;
67: 522–525.
Streri A, Lhote M, Dutilleul S. Haptic perception in newborns. Dev Sci 2000; 3: 319–327.
Taulu S, Simola J. Spatiotemporal signal space separation method for rejecting nearby
interference in MEG measurements. Phys Med Biol 2006; 51: 1759–1768.
70
Taylor MJ and Fagan ER. SEPs to median nerve stimulation: normative data for
paediatrics. Electroenceph Clin Neurophysiol. 1988; 71: 323–330.
Taylor MJ, Boor R, Ekert PG. Preterm maturation of the somatosensory evoked potential.
Electroencephalogr Clin Neurophysiol 1996; 100: 448–452.
Tecchio F, Padua L, Aprile I, Rossini PM. Carpal tunnel syndrome modifies sensory hand
cortical somatotopy: a MEG study. Hum Brain Mapp 2002; 17: 28–36.
Thibault A, Forget R, Lambert J. Evaluation of cutaneous and proprioceptive sensation in
children: a reliability study. Dev Med Child Neurol 1994; 36: 796–812.
Thomas B, Eyssen M, Peeters R, Molenaers G, Van Hecke P, De Cock P, Sunaert S.
Quantitative diffusion tensor imaging in cerebral palsy due to periventricular white
matter injury. Brain 2005; 128: 2562–2577.
Valeriani M, Restuccia D, Di Lazzaro V, Le Pera D, Barba C, Tonali P, Mauguière F.
Dipolar sources of the early scalp somatosensory evoked potentials to upper limb
stimulation. Effect of increasing stimulus rates. Exp Brain Res 1998; 120: 306–315.
Wang DD, Kriegstein AR. GABA regulates excitatory synapse formation in the neocortex
via NMDA receptor activation. J Neurosci 2008; 28: 5547–5558.
Wang X, Merzenich MM, Sameshima K, Jenkins WM. Remodelling of hand
representation in adult cortex determined by timing of tactile stimulation. Nature
1995; 378: 71–75.
Vanhatalo S, Palva JM, Andersson S, Rivera C, Voipio J, Kaila K. Slow endogenous
activity transients and developmental expression of K+-Cl- cotransporter 2 in the
immature human cortex. Eur J Neurosci 2005; 22: 2799–2804.
Vanhatalo S, Lauronen L. Neonatal SEP – back to bedside with basic science. Sem Fet
Neonat Med 2006; 11: 464–470.
Vartiainen NV, Kirveskari E, Forss N. Central processing of tactile and nociceptive
stimuli in complex regional pain syndrome. Clin Neurophysiol 2008; 119: 2380–
2388.
Vartiainen N, Kirveskari E, Kallio-Laine K, Kalso E, Forss N. Cortical reorganization in
primary somatosensory cortex in patients with unilateral chronic pain. J Pain 2009;
10: 854–859.
Wegner K, Forss N, Salenius S. Characteristics of the human contra- versus ipsilateral SII
cortex. Clin Neurophysiol 2000; 111: 894–900.
White CP, Cooke RW. Somatosensory evoked potentials following posterior tibial nerve
stimulation predict later motor outcome. Dev Med Child Neurol 1994; 36: 34–40.
Whitsel BL, Petrucelli LM, Werner G. Symmetry and connectivity in the map of the body
surface in somatosensory area II of primates. J Neurophysiol 1969; 32: 170–183.
Wikström H, Huttunen J, Korvenoja A, Virtanen J, Salonen O, Aronen H, Ilmoniemi RJ.
Effects of interstimulus interval on somatosensory evoked magnetic fields (SEFs): a
hypothesis concerning SEF generation at the primary sensorimotor cortex.
Electroencephalogr Clin Neurophysiol 1996; 100: 479–487.
Willis J, Seales D, Frazier E. Short latency somatosensory evoked potentials in infants.
Electroencephalogr Clin Neurophysiol 1984; 59: 366–373.
Willis J, Duncan MC, Bell R, Pappas F, Moniz M. Somatosensory evoked potentials
predict neuromotor outcome after periventricular hemorrhage. Dev Med Child
Neurol 1989; 31: 435–439.
71
Wilson-Costello D, Friedman H, Minich N, Fanaroff AA, Hack M. Improved survival
rates with increased neurodevelopmental disability for extremely low birth weight
infants in the 1990s. Pediatrics 2005; 115: 997–1003.
Vohr BR, Wright LL, Poole WK, McDonald SA. Neurodevelopmental outcomes of
extremely low birth weight infants <32 weeks' gestation between 1993 and 1998.
Pediatrics 2005; 116: 635–643.
Volpe JJ. Brain injury in premature infants: a complex amalgam of destructive and
developmental disturbances. Lancet Neurol 2009a; 8: 110–124.
Volpe JJ. The encephalopathy of prematurity – brain injury and impaired brain
development inextricably intertwined. Semin Pediatr Neurol 2009b; 16: 167–178.
World Health Organization. International Statistical Classification of Diseases and Related
Health Problems, 10th Revision, Version for 2007 (Cited March 3, 2010; available
from: http://apps.who.int/classifications/apps/icd/icd10online/)
Wood CC, Cohen D, Cuffin BN, Yarita M, Allison T. Electrical sources in human
somatosensory cortex: identification by combined magnetic and potential
recordings. Science 1985; 227: 1051–1053.
Woodward LJ, Anderson PJ, Austin NC, Howard K, Inder TE. Neonatal MRI to predict
neurodevelopmental outcomes in preterm infants. N Engl J Med 2006; 355: 685–
694.
Wu J, Okada YC. Physiological bases of the synchronized population spikes and slow
wave of the magnetic field generated by a guinea-pig longitudinal CA3 slice
preparation. Electroencephalogr Clin Neurophysiol 1998; 107: 361–373.
Wu J, Okada YC. Roles of a potassium afterhyperpolarization current in generating
neuromagnetic fields and field potentials in longitudinal CA3 slices of the
guinea-pig. Clin Neurophysiol 1999; 110: 1858–1867.
Wu J, Okada YC. Roles of calcium- and voltage-sensitive potassium currents in the
generation of neuromagnetic signals and field potentials in a CA3 longitudinal slice
of the guinea-pig. Clin Neurophysiol 2000; 111: 150–160.
Vuori E, Gissler M. Births and newborns 2008. Official statistics of Finland. (Cited March
3, 2010; from:http://www.stakes.fi/tilastot/tilastotiedotteet/2009/tr22_09.pdf)
Yang TT, Gallen CC, Schwartz BJ, Bloom FE. Noninvasive somatosensory homunculus
mapping in humans by using a large-array biomagnetometer. Proc Natl Acad Sci
U S A 1993; 90: 3098–3102.
Zhu Y, Georgesco M, Cadilhac J. Normal latency values of early cortical somatosensory
evoked potentials in children. Electroencephalogr Clin Neurophysiol 1987; 68: 471–
474.
Zhu Z, Disbrow EA, Zumer JM, McGonigle DJ, Nagarajan SS. Spatiotemporal integration
of tactile information in human somatosensory cortex. BMC Neurosci 2007; 8: 21.
72
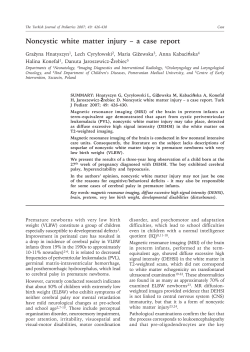


© Copyright 2026