
PREDICTION OF NEUROSENSORY DISABILITY IN VERY LOW BIRTH WEIGHT PRETERM INFANTS
PREDICTION OF NEUROSENSORY DISABILITY IN VERY LOW BIRTH WEIGHT PRETERM INFANTS Structural and functional brain imaging and hearing screening at term age and follow-up of infants to a corrected age of 18 months M A RIT A VAL KA MA Department of Paediatrics, University of Oulu Department of Diagnostic Radiology, University of Oulu Department of Clinical Neurophysiology, University of Oulu OULU 2001 MARITA VALKAMA PREDICTION OF NEUROSENSORY DISABILITY IN VERY LOW BIRTH WEIGHT PRETERM INFANTS Structural and functional brain imaging and hearing screening at term age and follow-up of infants to a corrected age of 18 months Academic Dissertation to be presented with the assent of the Faculty of Medicine, University of Oulu, for public discussion in the Auditorium of the Department of Paediatrics, on March 23rd, 2001, at 12 noon. O U L U N YL I O PI STO, O U L U 2 0 0 1 Copyright © 2001 University of Oulu, 2001 Manuscript received 22 February 2001 Manuscript accepted 6 March 2001 Communicated by Docent Anna-Liisa Järvenpää Docent Erkki Svedström ISBN 951-42-5915-7(URL: http://herkules.oulu.fi/isbn9514259157/) ALSO AVAILABLE IN PRINTED FORMAT ISBN 951-42-5914-9 ISSN 0355-3221(URL: http://herkules.oulu.fi/issn03553221/) OULU UNIVERSITY PRESS OULU 2001 Valkama, Marita, Prediction of neurosensory disability in very low birth weight preterm infants Department of Paediatrics, University of Oulu, P.O.Box 5000, FIN-90014 University of Oulu, Finland, Department of Diagnostic Radiology, University of Oulu, P.O.Box 5000, FIN-90014 University of Oulu, Finland, Department of Clinical Neurophysiology, University of Oulu, P.O.Box 5000, FIN-90014 University of Oulu, Finland 2001 Oulu, Finland (Manuscript received 22 February 2001) Abstract The objectives were to study ultrasound (US), magnetic resonance imaging (MRI), single photon emission tomography (SPET) and brainstem auditory evoked potentials (BAEP) as structural and functional imaging methods for the prediction of later neuromotor outcome and to assess the reliability of auditory brainstem responses (ABR), transient evoked otoacoustic emissions (TEOAE) and free-field auditory behavioural responses (FF) for the prediction of permanent hearing loss. The series comprised 51 surviving very low birth weight preterm infants born at <34 gestational weeks with a birth weight <1500 grams, taking 52 full-term infants as controls with respect to hearing screening and 21 with respect to brainstem function. The imaging examinations and hearing screening were performed at term age and follow-up continued to a corrected age of 18 months for the evaluation of neurodevelopment and hearing. MRI images were analysed with regard to the degree of myelination, parenchymal lesions, ventricular-brain ratios and widths of the extracerebral spaces, and the predictive value of the findings for later neuromotor development was assessed by comparison with US. In the SPET examinations (on 34 infants) relative regional perfusion levels and hemispheric asymmetries were evaluated in slices. The predictive value of perfusion defects in SPET was similarly assessed relative to US abnormalities. Brainstem size was measured by MRI, and brainstem function evaluated by BAEP, and results being used to predict neurosensory disability. Hearing was screened by means of TEOAE, ABR and FF, and the results used to predict permanent hearing loss. Parenchymal lesions in MRI predicted cerebral palsy (CP) with a sensitivity of 82% and a specificity of 97%, the corresponding figures for US being 58% and 100%. Delayed myelination, ventricularbrain ratios and widths of the extracerebral spaces failed to predict CP. The sensitivity of perfusion defects in SPET for predicting CP was 82% and the specificity 70%, and correspondingly US attained a sensitivity of 73% and a specificity of 83%. The best brainstem dimensions for predicting neurosensory disability reached at sensitivity of 23-31% and a specificity of 97-100%. The best predictors in BAEP gave the sensitivity of 93% with a specificity of 57-59%. Bilateral failure in TEOAE predicted hearing loss with a sensitivity of 50% and with a specificity of 84%, and that in ABR with a sensitivity of 100% and a specificity of 98%. The FF examination showed a sensitivity of 50% and a specificity of 98%. In conclusion, out of the brain imaging methods used here MRI was the best for predicting abnormal neuromotor outcome. Brainstem dimensions in MRI appear to predict neurosensory disability poorly, however, whereas BAEP shows a better prediction value, but is limited by a low specificity. ABR seems to be the best hearing screening method because it includes retrocochlear involvements in preterm infants. Keywords: hearing loss, cerebral palsy, magnetic resonance imaging, single photon emission tomography To my family Acknowledgements The work for this dissertation was carried out at the Department of Paediatrics, University of Oulu, in collaboration with the Departments of Diagnostic Radiology, Clinical Neurophysiology, Clinical Chemistry and Otorhinolaryngology over the years 1993–2001. I wish to express my respect for Professor Mikko Hallman, M.D., Head of the Department of Paediatrics, and the sympathetic and supportive attitude that he has shown towards this work. His prominent and notable reputation in the field of neonatal research has always stimulated and encouraged me to exceed all expectations. I also express my gratitude to Professor Matti Uhari, M.D., for offering me possibilities to study a wide range of statistical matters and to obtain the computer support that I needed for these achievements. I similarly wish to express my grateful thanks to Emeritus Professor Kauko Kouvalainen, M.D., former Head of the Department of Paediatrics, for his support at the beginning of this project and his confidence in its eventual completion. My deepest gratitude and respect go to Docent Maila Koivisto, M.D., former Head of the Division of Neonatology and my supervisor in neonatology during these years. She was always ready to contribute towards achieving this goal and never lost her belief in me. Equally, I express my sincere gratitude and appreciation to Docent Leena Vainionpää, M.D., my supervisor in paediatric neurology. She also guided me with optimism in the field of scientific thinking and writing. Many new frontiers in this work have been opened up through discussions with these mentors. I am indebted to Docent Anna-Liisa Järvenpää, M.D., and Docent Erkki Svedström, M.D., for their constructive criticism and humane attitude in discussions on the final construction of this work, and I am grateful to Malcolm Hicks, M.A., who skilfully revised the English language to convert the original manuscripts and the present work into successful instruments of science. I offer my warmest thanks to Docent Peter Lanning, M.D., Docent Eija Pääkkö, M.D., Eero Ilkko, M.D., and Liisa Kerttula, M.D., at the Department of Diagnostic Radiology, for their kind and smooth collaboration over the analyses of ultrasound and magnetic resonance images. I also acknowledge the contributions of Docent Aapo Ahonen, M.D., specialist in nuclear medicine, and Pentti Torniainen, physicist at the Division of Nuclear Medicine in the Department of Clinical Chemistry, who made me familiar with the possibilities for studying brain perfusion. I am sincerely grateful to Docent Uolevi Tolonen, M.D., at the Department of Clinical Neurophysiology for his fruitful contribution to this series of papers. I was lucky to have such a kind, experienced and helpful person as co-operator. I am under a deep obligation to Docent Kyösti Laitakari, M.D., at the Department of Otorhinolaryngology, and to Mirja Väyrynen, M.D., at the Division of Phoniatrics, for the work that they did in the screening of hearing. Their friendly way of teaching this difficult subject proficiently to clinical physicians was admirable. I am very grateful to the preterm infants and their families, who made this work possible. I also wish to thank all the competent staff at the co-operating departments for taking care of the infants and performing the examinations. I am also grateful for the help I have recieved from my fellow research workers. I would like to express my special thanks to Mrs. Marjatta Paloheimo for her help and advice in office matters, and to Mrs. Maija Veikkola for her collaboration in the library. I have been encouraged by the achievements of other colleagues in the Department of Paediatrics, and I am happy to have been able to keep in touch with the clinical colleagues. I appreciate the frequent supportive conversations I have had with Tuula Kaukola, M.D., my room-mate, and research colleague, and with Marja-Leena Pokela, M.D., and Timo Saarela, M.D., physicians currently working at the Division of Neonatology. I have had many occasions for inspiring chats whenever I have met with Docent Outi Tammela, M.D., and Riitta Marttila, M.D., my colleagues in Tampere and Seinäjoki, respectively. I have leaned greatly on my family during all these years. My mother has always supported me whatever I have done, and my brother and sisters have been eagerly waiting for the big moment. My dear husband, Juhani, has been patiently longing for it finally to come to an end. While waiting for this, he has provided a winter week on the fells and a summer week on the beach every year to relief my stress. Our lovely children Olli, Jussi and Heidi have taken this project as a part of their everyday life. Their attitudes have strengthened me to keep on writing eagerly. I admire childrens' ability to show how a simple explanation is a complete one. They never stopped waiting to have another real medical doctor in the family. I dedicate this work to my dear family. This research was supported financially by the Maud Kuistila Memorial Foundation, Helsinki, Finland, the Alma and K.A. Snellman Foundation, Oulu, Finland, the Foundation for Paediatric Research in Finland, Oulu, Finland, and the Oulu University Support Foundation, Finland. Oulu, February 2001 Abbreviations ABR AGA BAEP BOA BW CBF CI CP CRIB CT DQ DB EEG ELBW FF GQ GA (k)Hz LBW MRI (n)HL NICU OR PHI PVL ROI ROP SEH SD SGA SPET auditory brainstem responses appropriate for gestational age brainstem auditory evoked potentials behavioural observation audiometry birth weight cerebral blood flow confidence interval cerebral palsy critical risk index for babies computed tomography developmental quotient decibel electroencephalography extremely low birth weight free-field auditory examination general developmental quotient gestational age (kilo)hertz low birth weight magnetic resonance imaging (normal) hearing level neonatal intensive care unit odds ratio periventricular haemorrhagic infarction periventricular leukomalacia region of interest retinopathy of preterm subependymal haemorrhage standard deviation small for gestational age single photon emission tomography SQ Tc-99m HMPAO Tc-99m ECD TEOAE US VLBW VM WML sub-quotient technetium-99-m hexamethyl propylene amine oxime technetium-99-m ethylcysteinate dimer transient evoked otoacoustic emissions ultrasound very low birth weight ventriculomegaly white matter loss List of original papers This thesis is based on the following articles, which are referred to in the text by their Roman numerals: I Valkama AM, Pääkkö ELE, Vainionpää LK, Lanning FP, Ilkko EA & Koivisto ME (2000) Magnetic resonance imaging at term and neuromotor outcome in preterm infants. Acta Paediatr 89:348–355. II Valkama AM, Ahonen A, Vainionpää L, Torniainen P & Koivisto M (2001) Brain single photon emission computed tomography at term age for predicting cerebral palsy after preterm birth. Biol Neonate 79:27–33. III Valkama AM, Tolonen EU, Kerttula LI, Pääkkö ELE, Vainionpää LK & Koivisto ME Brainstem size and function at term age in relation to later neurosensory disability in high risk preterm infants. Revised version submitted to Acta Paediatr. IV Valkama AM, Laitakari KT, Tolonen EU, Väyrynen MRH, Vainionpää LK & Koivisto ME (2000) Prediction of permanent hearing loss in high-risk preterm infants at term age. Eur J Pediatr 159:459–464. Contents Abstract Acknowledgements Abbreviations List of original papers 1 Introduction . . . . . . . . . . . . . . . . . . . . . . . . . . . . . . . . . . . . . . . . . . . . . . . . . . . . . . . . 2 Review of the literature . . . . . . . . . . . . . . . . . . . . . . . . . . . . . . . . . . . . . . . . . . . . . . . 2.1 Definitions . . . . . . . . . . . . . . . . . . . . . . . . . . . . . . . . . . . . . . . . . . . . . . . . . . . . . . 2.2 Prevalence of neurosensory disability in preterm infants . . . . . . . . . . . . . . . . . . . . . . . . . . . . . . . . . . . . . . . . . . . . . . . . . 2.3 Pathophysiology of brain damage in preterm infants . . . . . . . . . . . . . . . . . . . . . 2.3.1 Maturational aspects . . . . . . . . . . . . . . . . . . . . . . . . . . . . . . . . . . . . . . . . . . 2.3.2 Haemorrhages and periventricular haemorrhagic infarction . . . . . . . . . . . 2.3.3 Periventricular leukomalacia . . . . . . . . . . . . . . . . . . . . . . . . . . . . . . . . . . . 2.4 Prediction of the outcome for preterm infants by neonatal brain imaging methods . . . . . . . . . . . . . . . . . . . . . . . . . . . . . . . . . . . . . 2.4.1 Ultrasound . . . . . . . . . . . . . . . . . . . . . . . . . . . . . . . . . . . . . . . . . . . . . . . . . 2.4.2 Magnetic resonance imaging . . . . . . . . . . . . . . . . . . . . . . . . . . . . . . . . . . . 2.4.3 Single photon emission tomography . . . . . . . . . . . . . . . . . . . . . . . . . . . . . 2.5 Neonatal brainstem auditory evoked potentials in preterm infants . . . . . . . . . . . . . . . . . . . . . . . . . . . . . . . . . . . . . . . . . . . . . . . . . 2.6 Neonatal screening of hearing in preterm infants . . . . . . . . . . . . . . . . . . . . . . . . 2.6.1 Auditory brainstem responses . . . . . . . . . . . . . . . . . . . . . . . . . . . . . . . . . . 2.6.2 Transient evoked otoacoustic emissions . . . . . . . . . . . . . . . . . . . . . . . . . . 2.6.3 Free-field auditory examination . . . . . . . . . . . . . . . . . . . . . . . . . . . . . . . . . 2.7 Neonatal neurological assessment and follow-up of preterm infants . . . . . . . . . . . . . . . . . . . . . . . . . . . . . . . . . . . . . . . . . . . . . . . . 3 Aims of the research . . . . . . . . . . . . . . . . . . . . . . . . . . . . . . . . . . . . . . . . . . . . . . . . . 4 Subjects and methods . . . . . . . . . . . . . . . . . . . . . . . . . . . . . . . . . . . . . . . . . . . . . . . . . 4.1 Subjects . . . . . . . . . . . . . . . . . . . . . . . . . . . . . . . . . . . . . . . . . . . . . . . . . . . . . . . . 4.2 Methods . . . . . . . . . . . . . . . . . . . . . . . . . . . . . . . . . . . . . . . . . . . . . . . . . . . . . . . . 4.2.1 Neonatal brain imaging . . . . . . . . . . . . . . . . . . . . . . . . . . . . . . . . . . . . . . . 4.2.1.1 Ultrasound at term age (I, II) . . . . . . . . . . . . . . . . . . . . . . . . . . . . . 4.2.1.2 Magnetic resonance imaging (I, III) . . . . . . . . . . . . . . . . . . . . . . . 15 17 17 18 19 20 22 23 25 25 27 30 32 33 34 34 35 35 37 38 38 39 39 39 40 5 6 7 8 4.2.1.3 Single photon emission tomography (II) . . . . . . . . . . . . . . . . . . . . 4.2.2 Brainstem auditory evoked potentials (III, IV) . . . . . . . . . . . . . . . . . . . . . 4.2.3 Neonatal screening of hearing (IV) . . . . . . . . . . . . . . . . . . . . . . . . . . . . . . 4.2.4 Developmental follow-up and neurosensory outcome . . . . . . . . . . . . . . . . 4.2.5 Statistical methods . . . . . . . . . . . . . . . . . . . . . . . . . . . . . . . . . . . . . . . . . . . Results . . . . . . . . . . . . . . . . . . . . . . . . . . . . . . . . . . . . . . . . . . . . . . . . . . . . . . . . . . . . 5.1 Neurodevelopmental outcome . . . . . . . . . . . . . . . . . . . . . . . . . . . . . . . . . . . . . . . 5.1.1 Cerebral palsy . . . . . . . . . . . . . . . . . . . . . . . . . . . . . . . . . . . . . . . . . . . . . . . 5.1.2 Developmental outcome . . . . . . . . . . . . . . . . . . . . . . . . . . . . . . . . . . . . . . . 5.2 Abnormalities in imaging examinations at term age and later neuromotor outcome . . . . . . . . . . . . . . . . . . . . . . . . . . . . . . . . . . . . . . . 5.2.1 Ultrasound . . . . . . . . . . . . . . . . . . . . . . . . . . . . . . . . . . . . . . . . . . . . . . . . . 5.2.2 Magnetic resonance imaging . . . . . . . . . . . . . . . . . . . . . . . . . . . . . . . . . . . 5.2.3 Single photon emission tomography . . . . . . . . . . . . . . . . . . . . . . . . . . . . . 5.3 Brainstem auditory evoked potentials . . . . . . . . . . . . . . . . . . . . . . . . . . . . . . . . . 5.4 Screening of hearing at term age and permanent hearing loss . . . . . . . . . . . . . . 5.4.1 Screening of hearing . . . . . . . . . . . . . . . . . . . . . . . . . . . . . . . . . . . . . . . . . . 5.4.2 Hearing loss . . . . . . . . . . . . . . . . . . . . . . . . . . . . . . . . . . . . . . . . . . . . . . . . 5.5 Prediction of neurosensory outcome . . . . . . . . . . . . . . . . . . . . . . . . . . . . . . . . . . Discussion . . . . . . . . . . . . . . . . . . . . . . . . . . . . . . . . . . . . . . . . . . . . . . . . . . . . . . . . . 6.1 Subjects . . . . . . . . . . . . . . . . . . . . . . . . . . . . . . . . . . . . . . . . . . . . . . . . . . . . . . . . 6.2 Methods . . . . . . . . . . . . . . . . . . . . . . . . . . . . . . . . . . . . . . . . . . . . . . . . . . . . . . . . 6.2.1 Neurodevelopmental follow-up and outcome . . . . . . . . . . . . . . . . . . . . . . 6.3 Abnormalities in imaging examinations at term age and later neuromotor outcome . . . . . . . . . . . . . . . . . . . . . . . . . . . . . . . . . . . . . . . . . . 6.3.1 Ultrasound . . . . . . . . . . . . . . . . . . . . . . . . . . . . . . . . . . . . . . . . . . . . . . . . . 6.3.2 Magnetic resonance imaging . . . . . . . . . . . . . . . . . . . . . . . . . . . . . . . . . . . 6.3.3 Single photon emission tomography . . . . . . . . . . . . . . . . . . . . . . . . . . . . . 6.4 Brainstem auditory evoked potentials . . . . . . . . . . . . . . . . . . . . . . . . . . . . . . . . . 6.5 Screening of hearing and permanent hearing loss . . . . . . . . . . . . . . . . . . . . . . . . 6.6 Clinical implications . . . . . . . . . . . . . . . . . . . . . . . . . . . . . . . . . . . . . . . . . . . . . . Conclusions . . . . . . . . . . . . . . . . . . . . . . . . . . . . . . . . . . . . . . . . . . . . . . . . . . . . . . . . References . . . . . . . . . . . . . . . . . . . . . . . . . . . . . . . . . . . . . . . . . . . . . . . . . . . . . . . . . 41 42 42 43 44 45 45 45 45 46 46 46 48 49 49 49 50 50 54 54 54 54 55 55 56 57 58 58 59 61 62 1 Introduction Prematurity is one of the greatest unsolved problems in perinatology and it comprises two thirds of neonatal mortality (1). Although improved educational and socioeconomic level, modern perinatal technology, advances in knowledge, increases in obstetric and neonatal personnel and both concomitance and co-operation with other specialties have reduced mortality rates in preterm infants, morbidity rates are still high (2–5). Prematurity covers a wide range of gestational ages and birth weights (3, 6, 7). The neonatal mortality of very low birth weight infants (VLBW, birth weight less than 1500 grams) in industrialized countries had fallen over the last thirty years from 50 to 15–20% by the early 1990s, and that of extremely low birth weight infants (ELBW, birth weight less than 1000 grams) from 80 to 30–40% (5, 8–14). The incidence of survivors with major complications, either severe intracerebral haemorrhage or chronic lung disease, has remained stable or increased (4, 5, 7). While the birth age of surviving preterm infants has become progressively lower in terms of gestational weeks, it has come to be expected that the more mature infants will manage better in life without any disability after neonatal care (8). The higher numbers of VLBW infants who have survived have also been shown to have increased the prevalence of cerebral palsy (CP), and has been even more true of ELBW infants (15–17). Neurosensory disabilities have been regarded in the course of times as the most important measure of the long-term outcome among preterm infants, the main examples of these being CP of any type, blindness, deafness and mental retardation (6, 10, 18). The prevalence of CP in surviving VLBW infants has been reported to be 7–35%, and that of hearing loss 2–17% (11, 19–21). Functional and neuropsychological assessments which focus on speech and language, visual-spatial abilities, attention and behaviour disorders and daily living skills in later life have been highlighted more recently (10, 22), and nonhandicapped VLBW infants have been shown to possess clumsy gross and fine motor skills and to encounter a wide range of difficulties at preschool and school age when followed up to adolescence (22–25). Early identification of brain damage can help in targeting intensive follow-up and rehabilitation adequately, but as neurological examinations alone have not proved reliable enough in predicting the outcome for preterm infants, new methods have been sought (26). The use of computed tomography (CT) has been restricted by the high radiation 16 exposure involved and the method has largely been replaced by grey scale and real-time ultrasound (US) and magnetic resonance imaging (MRI) (27). US imaging is the most widely used method for the prognostic assessments of brain damage. Of the functional methods available electroencephalography (EEG) and evoked responses have been used as diagnostic tools, but the newer functional methods of brain perfusion such as positron emission tomography (PET) and single photon emission tomography (SPET) require the use of isotopes and therefore involve a moderate degree of radiation exposure (27–29). The main objectives here were to study US, MRI, SPET and brainstem auditory evoked potentials (BAEP) as structural and functional imaging methods for the prediction of the later neuromotor outcome, and to assess the reliability of auditory brainstem responses (ABR), transient evoked otoacoustic emissions (TEOAE) and free-field auditory behavioural responses (FF) for the prediction of permanent hearing loss at term age in VLBW preterm infants. 2 Review of the literature 2.1 Definitions An infant weighting less than 2500 grams was initially defined as a preterm infant by Ylppö (30). Definitions for a preterm infant and the first weight of the newborn after birth according to the International Classification of Diseases (ICD) are presented in Table 1 (31, 32). Table 1. Definitions for a preterm infant and the first weight of the newborn after birth according to the International Classification of Diseases (31, 32). Infant Definition A preterm An infant born before 37 completed gestational weeks (259 days of gestation) A very preterm An infant born before 32 completed gestational weeks (between 154 and 224 days of gestation) An extremely preterm An infant born before 28 completed gestational weeks (between 154 and 196 days of gestation) Low birth weight=LBW The first weight < 2500 grams Very low birth weight=VLBW The first weight < 1500 grams Extremely low birth weight=ELBW The first weight < 1000 grams Small for gestational age (SGA) means having a birth weight two or more standard deviations (SD) or 10 percentiles below the mean value for the infant’s gestational age. According to the WHO International Classification of Impairments, Disabilities and Handicaps; an impairment is any loss or abnormality of psychological, physiological or anatomical structure or function, a disability is any restriction or lack (resulting from an impairment) of ability to perform an activity in the manner or within the range considered normal for a human being, and a handicap is a disadvantage for a given individual resulting from an impairment or disability that limits or prevents the fulfilment of a role that is normal for the individual (depending on age, sex and social and cultural factors) (32, 33). Although this WHO classification is difficult to modify for use with children, 18 there are functional losses that are likely to limit the individual severely in some field in later life and can thus be designated as disabilities. Severe motor and sensory disabilities can certainly be evaluated during the first two years of life (32). Neurosensory disabilities most often include four major domains: CP, deafness, blindness and mental retardation/ developmental delay (18). Cerebral palsy is defined as ‘a non-progressive permanent impairment of voluntary movement or posture presumed to be due to damage to the developing brain before, during or shortly after birth’ (32, 33), and it entails clinical signs including delayed motor development, deviant muscle tone and strength, abnormality in postural reactions (righting, protection and equilibrium) and inappropriate persistence of primitive reflexes beyond the normal age. Spastic CP is defined as spasticity of the extremities with flexor hypertonicity and increased tendon reflexes and characteristic posturing. In its distribution of topographic involvement, spastic tetraplegia consist of severe spastic paresis of the four limbs with disability in the upper extremities being of the same degree or more pronounced than that in the lower ones. Spastic diplegia implies spastic paresis of the lower extremities with variable but lesser involvement of the upper limbs, and spastic hemiplegia spastic paresis of the arm and leg on one side. An ataxic component means ataxic traits, especially dyssynergia and intention tremor in the limbs, and the dyskinetic group comprises syndromes of choreo-athetosis and the more disabling dystonic forms. (34, 35) In terms of severity, motor disability may be described as functionally mild if the child has consistent physical findings but no limitation on ordinary activities, being able to walk independently, moderate if there are definite difficulties in daily activities and the child is often dependent on assistive devices to move independently, and severe if there are moderate to great limitations in activity and the child mostly needs a wheelchair for mobility (36). According to the ICD, profound, severe or moderate retardation is considered to be present if the child has a developmental quotient (DQ = developmental age/chronological age x 100) of less than 50, and mild when it is 50–69. The ICD does not categorize borderline and definite normal cases (32). There are various global scoring systems which can be used to assess an infant’s developmental, cognitive and intellectual progress for follow up purposes (10). The boundary scores on different scales below which the child has a developmental delay causing major or severe disability have been 70–85 (7, 37, 38). The WHO defines hearing impairment according to the better ear hearing level averaged at frequencies of 0.5, 1, 2 and 4 kHz (BEHL0.5–4 kHz), in which context sensorineural deafness is defined as a hearing loss of 40 desibels (dB) or more at any frequency in the range of 0.5–4 kHz in the better ear (with or without associated conductive loss) (32, 39). The hearing impairment may be classified in terms of BEHL as mild (26–40 dB), moderate (41–60 dB), severe (61–80 dB) or profound (>80 dB) (39). 2.2 Prevalence of neurosensory disability in preterm infants Volpe (40) estimated that 5–15 % of surviving VLBW infants in the USA later have CP and an additional 25–50% have abnormalities that disturb their daily life and schooling. 19 In a meta-analysis reviewing reports from industrialized countries, the proportion of surviving VLBW infants with an intact outcome was shown to have increased from 25 to 50% over the thirty years up to the late 1980s (8). According to another meta-analysis by Escobar et al. (18), the disability rate for VLBW preterm survivors from 1960 to 1985 varied from 21 to 34%. The improvement in the survival of ELBW infants has progressively compromised the most critical disability group, steering it towards the tiniest and most preterm cases, while the heavier infants have fared better (8, 9, 38, 41). More than 90% of all preterm infants with a BW of 1000–1499 g in the early 1990s were reported to have normal motor abilities and more than 80% to have a normal cognitive outcome, whereas about 50% of ELBW preterm infants were found to be normal (16, 38, 42, 43). Even lower rates of 20% for severe neurosensory disability (CP, mental retardation, blindness and / or deafness) have nevertheless been reported among ELBW infants during the 1980s and 1990s (44, 45). CP is the most commonly reported major neurological disorder identified in ELBW and VLBW children during the first two years of life (10). According to the meta-analysis of VLBW survivors between 1960 and 1985, the prevalence of CP ranged from 5 to 9% (18). The prevalence of CP in surviving VLBW preterm infants in Europe has been 5– 35% in the 1990s, and 7–17% in ELBW preterm infants (9, 12, 15, 21, 46, 47). Rates of CP published in the USA have been 7% in VLBW infants and 10–17% in ELBW infants (11, 16, 38). Two reviews of infants born at gestational ages of less than 26 weeks between 1977 and 1997 have found CP in 12% of such infants, while 12–15% of preterm infants born before 34 gestational weeks in the early 1990s developed CP (7, 48, 49). Nine percent of VLBW infants born in the early 1990s were found to have DQ≤80 (2 SD below the mean) at a corrected age of 6 months, while at the age of one year 22% of VLBW infants in the mid-1990s were assessed as having major neurodevelopmental impairment (DQ<85) (50, 51). Infants with a BW of 1000–1500 g had severe hearing disability in 2% of cases and severe visual disability in 6% in the late 1980s, whereas 10% of ELBW infants had severe hearing disability and 16% severe visual disability (41). Overall, the prevalence of hearing loss in VLBW infants has been 2–17% in recent decades (19, 20, 41). More recently deafness was found in 9–11% of surviving ELBW infants in the 1990s and blindness in 1% (16, 38). A half of the ELBW infants with hearing loss were also reported to have CP (52). Later, at the age of 5 years, sensorineural, conductive or unspecified hearing loss was found in 15–30% out of series of very preterm infants (53, 54). 2.3 Pathophysiology of brain damage in preterm infants Brain damage in preterm infants may result from a series of events rather than from one specific insult (55). Maturational characteristics with a failing adaptation capacity may predispose the brain to harmful events during both intrauterine and extrauterine life (56, 57). 20 2.3.1 Maturational aspects Structural and functional immaturity of the organs responsible for ventilation and the circulation in a preterm infant is the basic reason leading to a lack of an acceptable cerebral blood flow and arterial oxygen delivery in the brain under unfavourable clinical conditions. Immature vascular structures, certain developmental characteristics in the cerebral circulation, intrinsic cell vulnerability and various toxic mechanisms overlap and contribute to a predisposition to cerebral damage (56, 58–61). The germinal matrix tissue where the neuroblasts originate between 10 and 20 weeks of gestation and the glioblasts originate in the third trimester, is located adjacent to the lateral ventricles, with the greatest abundance tissue lying between the ventricles and the caudate nucleus in the telencephalon (27). The tissue extends originally around and beside the horns of the lateral ventricles in the periventricular areas and diminishes gradually with advancing gestation, mostly disappearing by the 36th gestational weeks (56, 62). This germinal matrix tissue is a loose network that is abundant in tiny, fragile, thin-walled vessels that serve as straight passageways for blood originating from the anterior and middle cerebral and anterior choroidal arterial supplies, and it is separated from a lateral ventricle by only one layer of ependyma (56, 63). Drainage of the germinal matrix takes place through the terminal vein, into the internal cerebral vein and then through the great vein of Galen into the straight sinus, in the same way as the venous blood draining from the white matter and the choroids plexus. The vessels between the arteries and veins in the inner germinal matrix are not easily distinguished as arterioles, venules or capillaries, and this microvascular network presents a weak vascular border zone. The most critical area is a vascular border zone between the striate and thalamic end arteries, where the decreased oxygen and increased carbon dioxide partial pressures lead to vasodilatation, causing hyperperfusion and sometimes subsequently hypoperfusion depending on the persistence of hypoxia, because of impaired cerebral autoregulation. Fluctuations in cerebral blood flow (CBF) can lead to rupture of these fragile vessels, causing haemorrhages especially in sick preterm infants with coagulopathy. As neuronal cell migration to the cortex is completed by the 24th gestational weeks, haemorrhages in the germinal matrix may destroy the migrating glial precursor cells and partly nullify subsequent brain development (27). The white matter includes critical areas for ischaemic injury, i.e. the ‘distal fields’ or ‘watershed areas’, or more precisely the arterial terminal end zones and border zones (27). Of the penetrating cerebral arteries, the long penetrators branching from the leptomeningeal artery terminate in the deep white matter (i.e. the vascular end zones) at 24–28 gestational weeks and have only infrequent anastomoses with the short penetrators (i.e. the vascular border zones), which extend only to the subcortical white matter (i.e. the vascular end zones) (57). There are only a few interconnections of the long penetrators in the intermediate white matter (i.e. the vascular border zone) (57). Vessel density in the deep white matter has been shown immunohistochemically to be high at 16–24 gestational weeks in the mean foetal period, and then transiently low at 28–36 gestational weeks followed by an increase after 39 gestational weeks (58, 64). This agrees with the finding that the CBF to the white matter has been measured as being extremely low around the 30th gestational weeks (65). Although there is also small degree of physiological oscillation or variability in CBF velocity in healthy preterm infants, 21 cerebral vascular autoregulation is needed to maintain the required constant CBF during any change in cerebral perfusion pressure (=mean arterial pressure minus intracranial pressure) (66, 67). The most common clinical situations in which secondary loss of CBF autoregulation may occur are events such as hypotension, acidosis, septic shock, hypocarbia, patent ductus arteriosus, recurrent apnoea and bradycardia (27, 59). The lost autoregulation may render preterm infants susceptible to both to haemorrhagic and ischaemic events in the most vulnerable vascular end and border zone areas, which thereby serve as determinants of a poor neurological outcome (40, 60). The vessel density in the cerebral cortex (grey matter) and subcortical white matter has been found to be low at 16–28 weeks of gestation, followed by an increase after 36 weeks (64). The CBF to the cortex increases in the first days of life and further with advancing gestational age in very preterm infants after birth (68, 69). The number of vessels in the basilar pons of the brainstem has been shown to increase at 28–32 gestational weeks more than that in the tegmentum of pons, which is in agreement with progress of myelination (64, 70). Because of the active metabolism and corresponding abundant blood flow in the brainstem, it is highly vulnerable to adverse events at 26–32 gestational weeks, when the neurons are still immature (27, 64). The intrinsic vulnerability of cells plays a major role in the generation of brain damage. Oligodendrocyte precursors or early differentiating oligodendroglia have found to be the most vulnerable target cells at the premyelinating stage, because of their enhanced glucose and energy requirements for lipid synthesis, and they are also rich in iron-binding proteins during the maturation process (40). After hypoxic-ischaemic insult during the reperfusion period, more cell damage is caused by the release of oxygen radicals, the synthesis of nitric oxide, inflammatory reactions and an imbalance between the excitatory and inhibitory neurotransmitter systems, and also by apoptosis (40). Cytokines connected with inflammations are the latest adverse clinical features to be associated with brain damage, as indicators of maternal infection and a foetal inflammatory response have been seen to precede white matter abnormalities (71, 72). The expression of a wide variety of cytokines, e.g. tumour necrosis factor and interleukins has been found to relate white matter damage (73). Perinatal infections have been found in VLBW preterm infants with later CP (74). Myelination, i.e. myelin deposition, is the main pattern for CNS maturation, beginning in the peripheral nervous system, with the motor roots first, followed by the sensory roots, and progressing from the spinal cord in a caudocranial direction, so that it appears in some major sensory systems, including the inferior colliculus, and in some major motor systems, including the corticospinal tracts in the midbrain and pons, before term age (27, 75). Through the posterior limb of the internal capsule, myelination reaches the hemispheric white matter, from where it proceeds from the central sulcus towards the poles. Myelination advances from deep areas to superficial ones and from posterior areas in an anterior direction (75–77). Reached myelination stages (M1-4) visualised in MR images lags behind some weeks when compared with histological timetables (75). Stages M1-M2 on MR images are described in Table 2. 22 Table 2. A timetable of normal progress of myelination in MRI (76, 78). Myelination stage Post-conceptional age (weeks) Presence of myelin M1 Before 37 Myelin in the brainstem, the vermis and the cerebellar hemispheres M2 At 37–38 Myelin in the posterior limb of the internal capsule and the lenticular nucleus and thalamus M3 At 39–40 Myelin in the central corona radiata and the caudate nucleus M4 At 40–42 Myelin in the centrum semiovale 2.3.2 Haemorrhages and periventricular haemorrhagic infarction Papile et al. (79) provided the first classification of germinal matrix and intraventricular haemorrhages (GMH-IVH) based on the results of CT images of the brain in an unselected sample of VLBW infants (Table 3). Table 3. Classification of haemorrhages in VLBW infants, according to Papile et al. (79). Grade Extension of haemorrhage I Subependymal haemorrhage (SEH) II Intraventricular haemorrhage (IVH) III Intraventricular haemorrhage with ventricular dilatation (IVH+VD) IV Intraventricular haemorrhage with ventricular dilatation and parenchymal extension This classification is still in use, although the grades of haemorrhages are now described in a cumulative sense (80). The classification used by Volpe (27) is based on the severity of GMH-IVH in US in preterm infants, and treats the grades as separate entities (Table 4). Table 4. Grading of the severity of germinal matrix-intraventricular haemorrhages from US scan, adapted from Volpe (27). Grade Extension of haemorrhage I Germinal matrix haemorrhage with minimal or no intraventricular haemorrhage (<10% of ventricular area in parasagittal view) II Intraventricular haemorrhage (10–50% of ventricular area in parasagittal view) III Intraventricular haemorrhage (>50% of ventricular area in parasagittal view; usually distends lateral ventricle) Separate notion Periventricular echodensity (location and extent) The most common single pathological involvement in the brain of the preterm infants is GMH-IVH (56). A grade I haemorrhage, originating from the germinal matrix, will not have any harmful consequences, as it originates in an area that disappears and will not 23 normally extend to the white matter (27). In addition to the dominant region for subependymal haemorrhages (SEHs) in the caudothalamic zone, haemorrhages may more rarely occupy occipital and temporal locations (56). As intraventricular haemorrhages, of grade II, originating from the germinal matrix or the choroid plexus, do not reach the white matter areas, either, these have no neurological sequelae. Grade III IVH entails ventricular dilatation, however, and as a consequence of the vulnerability of the developing brain, adverse cognitive and motor development has been found in preterm infants with posthaemorrhagic ventriculomegaly (VM) (81). A mortality rate of approximately 20% has been observed when the haemorrhage fills the ventricles, and over half of the survivors may exhibit VM (27). Progressive VM is caused by disturbances in cerebrospinal fluid flow or absorption, causing hydrocephalus. The occurrence of IVH with VM has frequently been found to increase the incidence of white matter damage (82, 83). Neonatal mortality may be related more to additional ischaemic lesions than to the severity of haemorrhage per se (84). Haemorrhage in the germinal matrix can be complicated by ventricular haemorrhage extension and intraparenchymal haemorrhage (Papile’s grade IV). This may also promote venous congestion with periventricular haemorrhagic infarction (PHI) through ischaemia in the medullary vein area, with its most noteworthy involvement in the white matter just near the ventricular angle (57). This destroys some of the white matter, leaving a pore or an area of thinning. The typical fan-shaped topographic appearance of the apex area of the trigone reaches the descending corticospinal tract motor fibres (27). This lesion normally occurs only on one side and causes spastic hemiplegia, but a larger one can causes spastic tetraplegia and intellectual deficit (57, 85). A focal infarct in the main branch of the middle cerebral artery can sometimes occur in preterm infants, and even more often smaller infarcts with the involvement of a cortical branch or one or more lenticulostriate branches. Infarction in the main branch of middle cerebral artery may cause hemiplegia, while infarction in a cortical branch will have milder consequences and infarction in the lenticulostriate branches will have an outcome varying from normal motor functions to athetoid CP or global delay according to the attachments to the motor tracts (86). Thalamic lesions in premature infants have been seen to lead to disturbances in tone persisting throughout infancy (87). Intracerebellar haemorrhages of primary origin in the cerebellar germinal matrix zones or secondary to traumatic delivery have been seen in 14–28% of autopsy cases involving VLBW preterm infants (56). Sometimes IVH may extend to the subarachnoid spaces, but in traumatic deliveries solitary subarachnoidal haemorrhages are also observed in preterm infants, as seen at autopsy (27, 56). 2.3.3 Periventricular leukomalacia The most obvious of the primary white matter lesions is periventricular leukomalacia (PVL), which has been typical of the pathological descriptions of necrosis in the white matter (88). Leukomalacia can be classified according to the distribution of ischaemic necrosis in the cerebral pathology, into focal, widespread, diffuse and multifocal (89). Focal periventricular necrosis predominates in the occipital radiation at the trigone area 24 and in the white matter around the foramen of Monroe, leaving myelin loss through cystic changes, and focal ventricular dilatation, most often in the trigone as sequelae (27). As PVL may be distributed focally in the deep white matter of the terminal and border zones, dorsally and laterally to the external angle of the lateral ventricles, particularly involving the centrum semiovale (frontal horn and body) and the optic (trigone and occipital horn) and acoustic (temporal horn) radiations, widespread necrosis appears more widely in the deep white matter, while diffuse necrosis also includes the subcortical white matter and the multicystic form additionally involves the grey matter (89). Diffuse leukomalacia is more common in smaller preterm infants, and it leaves a thinned parenchyma with more prominent VM (27). PVL is more frequently bilateral than haemorrhagic infarction and its long-term sequelae correspond to the anatomical location and extent of the injury (40, 56). Solely anterior cystic PVL is usually associated with a normal outcome (71). One classic long-term consequence of PVL is motor disability, usually spastic diplegia or tetraplegia, with greater involvement of the lower limbs because of damage to the corticospinal tracts passing through the internal capsule, the centrum semiovale and the corona radiata (27, 56). Extensive white matter loss (WML) with involvement of the optic and acoustic radiations has been observed to cause not only severe neurological sequelae but also severe cerebral visual impairment and deafness (90, 91). Periventricular white matter injury may moreover lead to a reduction in cerebral cortical grey matter development, bearing an anatomical correlation with later intellectual deficits (92). The originally histological diagnosis of PVL is commonly applied nowadays to both echodense and echolucent abnormalities in US images of the cerebral white matter (93). The changing appearance of PVL as it develops means that time is needed before it becomes conclusively assessable in its cystic form during neonatal period. These PVL changes, classified by de Vries et al. (29), are shown in Table 5. Table 5. Classification of periventricular leukomalacia, according to de Vries (29). Grade Definition I Transient periventricular echodensities persisting for 7 days or longer II Periventricular echodensities evolving into small localized frontoparietal cystic lesions III Periventricular densities, evolving into extensive periventricular cystic lesions IV Densities extending into the deep white matter evolving into extensive cystic lesions Brainstem lesions in preterm infants have mostly been seen in autopsies following with IVH or PVL and in connection with cortical, cerebellar and basal ganglion lesions (56, 84). The tegmentum of pons, nuclei and the subiculum of the hippocampus are preferred regions for hypoxic-ischaemic injury, chiefly pontosubicular necrosis, which has been seen more commonly in preterm than term infants (27, 84). Microscopic examinations have shown not only a great number of karyorrhectic neuronal cells in the pons and subiculum, but also possible injuries to the inferior olivary nucleus, cerebellum, basal ganglia, thalamus and cerebral cortex, particularly in the most immature preterm infants (84, 94, 95). Only minimal glial reactions have been seen in cases of neuronal karyorrhexis (95). 25 2.4 Prediction of the outcome for preterm infants by neonatal brain imaging methods Although the anatomical and physiological maturation processes in the brain are interdependent, they are different entities, and their development and disturbances have to be measured by different techniques. Of the morphological imaging methods, CT was the first just before grey scale and real-time US to be taken into clinical use, and it has nowadays been largely replaced by MRI, while among the functional methods mention should be made of EEG, evoked responses, SPET, PET and magnetic resonance spectroscopy (27, 96–98). The methods to be considered below are US, MRI, SPET and BAEP. 2.4.1 Ultrasound US is the most frequently used method for assessing intracranial abnormalities in neonatal period (27, 99). It is less expensive, fast and easily transportable to the bedside. The standard coronal and parasagittal images are obtained through the anterior fontanelle and modern scanners with transducers of 5–10 MHz offer high resolution (99). One disadvantage of US is the restricted field of view, which may prohibit the observation of peripheral involvements and also mean that the brainstem and cerebellum are not outlined sharply (100). Visual descriptions of US findings such as echodensities, echolucencies, loss of parenchyma and dilatation of ventricles can be interpreted to a diagnosis of haemorrhage, PVL, VM or other minor defects (27, 79, 99). Predictive value of abnormalities in US. A half of the surviving VLBW infants in the 1980s and 1990s have been reported to have evidence of haemorrhages in their US images during neonatal period (99, 101). The traces suggest that some bleeding can be judged to have taken place before birth (102, 103). Earlier it was estimated that 90% of GMH-IVHs become visible in the first three days of life, but it has been reported recently that only 65% of haemorrhages in VLBW infants are seen in US during the first week of life (27, 99). About 50% of haemorrhages affected the germinal matrix, 35% filling less than 50% of ventricles and the other 15% being more severe forms (99). US has shown a sensitivity of 60–100% and a specificity of 40–100% in detecting post mortem identifiable GMH-IVHs in VLBW preterm infants (56). GMH-IVHs just after the birth have recently been reported to associate with significant motor developmental delay and CP in 15% of VLBW infants and with delayed mental developmental in 39% (104, 105). Isolated germinal matrix or choroid plexus cysts, whether or not consequent upon haemorrhages, have sometimes been seen just after birth (99, 106). Thalamic echoes have been imaged, either as isolated phenomena or in association with haemorrhages, in infants less than 34 gestational weeks at birth and in VLBW infants (99, 103). Cerebellar haemorrhages are sometimes observed at autopsy, but seldom in US, because of technical restrictions (27, 107). Haemorrhages in neonatal US had a sensitivity of around 60% and a specificity of around 85% in the prediction of disabling CP in preterm infants (108). Traces of haemorrhages in discharge US images of VLBW infants have been able to 26 predict an adverse outcome with a sensitivity of almost 70% and a specificity of around 50% (101). PHI is unilateral and often associated with ipsilateral IVH. It can best be determined by means of serial US examinations, as the haemorrhagic appearance of a PHI can vary from a striking echogenic lesion to a single large porencephalic cyst (27, 56, 85). If PHI (or IVH with parenchymal involvement) appears around the trigone, it is almost always followed by mild, moderate or severe hemiplegia (109). Focal arterial infarcts may be associated with IVH or PVL (86). Cysts visible in US on the second day of life have been interpreted as pointing to an infarct with antenatal onset (103). Infarction of the middle cerebral artery causes increased echogenicity in the region supplied by the affected artery followed by cystic degeneration after 2–4 weeks, but involvements of the cortical anterior branches may be difficult to detect even with serial US unless cysts develop, similarly small infarctions in the lenticulostriate branches until very late cysts or hyperechogenicity appear in the thalamus or basal ganglia (86). Hemiplegia may be the consequence of an infarction in areas of the brain supplied by the entire middle cerebral artery, in the complete set of cortical branches of that artery, in its anterior or posterior trunk, in its lenticulostriate branches or in the anterior choroidal artery (86, 110). Cystic PVL was found in 5–8% of surviving VLBW infants in the 1980s and 1990s and prolonged flare in 15–30% (99, 101, 111). The average proportion of CP was 60% in infants with persistent flares or cystic PVL in their US image, according to a review of reports published between 1980 and 1990, the most severe CP forms having arisen from cystic PVL in the external angle of the lateral ventricles (56). Almost 20% of preterm infants with persistent foetal periventricular echodensities have been observed to develop cystic PVL involvement after 10 days to 7 weeks (112), although many reports consider PVL to have had an antenatal onset when the cysts have already been visible in the first US after birth or during the first two weeks (55, 102, 103, 113). Cysts often seem to appear during the first or the second weeks after echodensities in the initial US, but in cases of normal scans cystic PVL has tended to evolve during the 3rd to 7th weeks of life (90, 99, 111, 114). Although these echolucent cysts usually disappear within 3 months, they may leave enlarged ventricles, and very early onset PVL may reflect intrauterine problems and leads to severe disability more often than later onset PVL. Even transient periventricular echodensities have been observed to associate with significant motor developmental delay in a few of VLBW infants with that finding and to delayed mental developmental in one quarter of cases (104). The ventricular dimensions at term age are wider in VLBW infants than in full-term infants (115). The diagnosis of VM is mostly based on exact measurements, but the boundary of the VM in US at term age has varied in width, being abnormal at the midbody of the lateral ventricles in a oblique coronal scan or having a ventricular index (midbody ventricular width divided by hemispheric width) that is abnormal, i.e. more than 0.32–0.39 (81, 115–119). A mean value of 0.51 (95 % CL 0.40–0.60) has been quoted for the corresponding ventricular-brain ratio at the trigone (atrium) level (116). Apart from reduced amount of parenchymal tissue, a diagnosis of hydrocephalus with a ventricular index of over 0.40 requires clinical signs of increased brain pressure with a bulging anterior fontanelle, widened spreads of the sutures in the bony skull and rapid growth in head circumference (115, 120). Ventricular dilatation is associated with the severest IVH grades and with PVL, and not only the lateral ventricles may be dilated but also the third 27 and the fourth ventricles (27, 117). Infants with VM at term age are usually extremely preterm and have significant low birth weight (81, 83, 99). Where the margins of the walls of the ventricles most often remain regular after IVH and hydrocephalus caused by impairment of cerebrospinal fluid (CSF) absorption, dilatation may occur relatively slowly after PVL, with ragged or irregular ventricular walls in US (117, 119). The most characteristic enlargement after PVL nevertheless exists in the occipital horns of the lateral ventricles (40, 121). As only ventricular enlargement is noted, almost a half of VLBW infants with VM have progressed to CP later (56). It has been observed recently that preterm infants with VM have spastic tetraplegia, diplegia or hemiplegia significantly more often than infants with normal ventricles in US, and significantly more often have an IQ less than 70 (81). The subarachnoidal spaces are relatively large in preterm infants, but although this feature has been noticed as a sequel to some form of involvement, these spaces have not normally been used for prediction purposes (27). Linear hyperechogenicity within the basal ganglia and thalamus may sometimes appear in preterm infants as a mark of more diffuse brain lesion and cause neurodevelopmental delay and, in particularly cognitive and behavioural problems (122). Unilateral thalamic lesions varying in appearance have mainly been connected with disturbances in tone persisting throughout infancy (87). 2.4.2 Magnetic resonance imaging MRI has provided help in detailing neonatal brain abnormalities over the last twenty years. MRI of the brain provides higher contrast resolution than do US and CT, and it avoids the problems of radiation exposure, restricted views and bony artefacts (123, 124). The main disadvantages limiting the use of the method for neonatal purposes include difficulties with availability, expense, transportation to imaging rooms and sedation. Prenatal and neonatal MRI studies are performed with magnetic field strengths of a 0.15 to 2.35 Tesla (T) (76, 92, 121, 125–128). Maturational aspects are reflected in imaging properties. As the water content of the brain is greater in infants than in adults, the signal intensities of the grey and white matter at term age are the reverse of those seen in adults, that of the white matter being lower than that of the grey matter in T1-weighted images and higher than that of the grey matter in T2-weighted images (129, 130). White and grey matter differentiation has been found to indicate very low white matter intensity before 37 post-conceptional weeks and high intensity after term age (76, 97). In addition to the white and grey matter differentiation and myelination, attention has also been paid to other maturation features such as sulcal and gyral development in cortical folding and volumetric changes in the white and grey matter and CSF (92, 126, 131–133). Development and ageing of the brainstem has been assessed by MRI, and morphometric measurements have also been performed on the images (123, 134–136). As a part of the midbrain structure, the brainstem demonstrates the presence of myelin from the 23rd week of gestation onwards and the mature myelin stage is reached in MRI before term age (75, 124, 137–139). The most frequently used morphometric parameters have 28 been the area and dimensions of the pons, which has been shown to grow exponentially in early childhood (123, 124, 135, 136). Predictive value of abnormalities in MRI. Diagnostic abnormalities in conventional MRI may be deduced from excessively high or low signal intensities in white and grey matter differentiation and patterns of myelination that deviate from normal age-related contrast changes, lack of signal intensity in structural entities due to brain material loss, or exceptional morphometric measurements (76, 125, 126, 133, 139, 140). Brain lesions in preterm infants have been depicted reliably by MRI in terms of volume and topography when referenced to autopsy abnormalities, but more subtle histological abnormalities such as increased glial cells or apoptosis could not be detected on conventional MRI (140, 141). Neonatal MRI has most often been used to confirm findings in neonatal US or as a point of comparison for them, and later MRI has been used to verify abnormalities with regard to clinical findings (142–147). In survived preterm infants neonatal brain MRI has played an increasing role in prediction of neurodevelopmental outcome (87, 145, 147, 148). Traces of germinal matrix or parenchymal haemorrhages are observed as weak abnormal signal intensities during an acute stage of less than three days followed by a higher intensity in T1-weighted images and a lower intensity in T2-weighted images in the late subacute stage, lasting two weeks. Traces of small haemorrhages have been seen to fade away after that. Some may persist very late, for a chronic stage of several weeks with high intensities in both T1-weighted and T2-weighted images, with even haemosiderin and structural changes acting as reminders of neonatal haemorrhage for months afterwards. Subependymal and parenchymal haemorrhages remain visible for longer because of haemosiderin deposits and the development of porencephalic cysts, some of them being continuous with the ventricular system. Clots following IVHs have been seen to give a high signal in T1-weighted images and a low signal in T2-weighted images at first. Later signals reverse in two weeks and these features may persist for weeks, outlining the walls of the lateral ventricles. (125, 145, 149–151) Extensive IVHs in foetal MRI, especially with associated parenchymal lesions, have usually led to intrauterine or postnatal death or caused hydrocephalus and poor development, but haemosiderin deposits without parenchymal destruction in neonatal MRI have not predicted an unfavourable outcome (128, 145). The correlation of IVH in neonatal MRI with the results of neuropathological examination has been excellent (140, 141). PHI including parenchymal cysts around the trigone area in MRI at post-conceptional term age in preterm infants, and later haemosiderin deposits and parenchymal volume loss at the site seen in follow-up MRI images have been found to lead to contralateral spastic hemiplegia (85, 145). In cases of focal arterial infarctions suspected on the basis of neonatal US, the findings have been confirmed by MRI during the neonatal period or in infancy (86, 152). Deep infarctions in the area of the middle cerebral artery and smaller infarcts in a cortical branch or one or more lenticulostriate branches have been seen in preterm infants (86, 152). Preterm infants with involvement of the main branch had usually developed contralateral hemiplegia, but those with involvements of other branches had more favourable outcome (86). PVL has been reliably estimated in terms of volume and topography by reference to a definition of the components of the bilateral lesion at autopsy, including cavities, translucent zones and cellular reaction, although not in cases of diffuse PVL (140, 141). 29 Early neonatal brain MRI, even after a post-conceptional age of 31–34 weeks, has demonstrated PVL with bilateral periventricular hyperintensities located mainly posteriorly and laterally to the occipital horns, anteriorly to frontal horns or in the corona radiata (140, 153, 154). Profound signal intensity changes in MRI, however, in the periventricular white matter visible at a mean post-conceptional age of 33 weeks and corresponding flaring in US have been shown to predict disturbances in tone, which in part have been only transient in follow up, and therefore no level of significance for the outcome has been defined for these (147). Later, at term age or after some months, PVL has been reflected in WML, especially in the areas around the trigone and occipital horns, with VM and irregularities in the ventricular walls (91, 92, 145, 154). When PVL had been found by neonatal US, MRI was able to show its degree, and in other respects, too, very good agreement has been reached (155). Late MRI used with a series of LBW infants at the age of 1 year or more in the 1980s showed the degree of periventricular hyperintensity in the white matter to correlate very well with the severity of functional handicap (156). Severe PVL findings have been the main abnormal features found in childhood MRI after very preterm birth followed by motor disability, especially spastic diplegia (91, 143, 144). Reduction of the myelinated white matter in PVL has been confirmed to relate to a marked reduction in the cerebral cortical grey matter (92). Ischaemic lesions, whether non-haemorrhagic or haemorrhagic, have also been observed in the deep grey matter (i.e. the basal ganglia and thalamus) on MRI in preterm infants (154). Lesions in the deep grey matter areas have been shown to lead to developmental abnormalities in tone and motor functions (87, 150). Thalamic lesions with PVL have caused the most severe motor and mental disabilities (157). Myelination stages are described by the extent of myelination reflected by high intensities in T1-weighted images and / or low intensities in T2-weighted images. Some authors have not found prematurity per se to cause delayed myelination in conventional MRI around term age, but others have found a delay by more modern imaging methods (97, 158). It has been emphasized that IVH does not delay myelination, although PVL has been seen to be followed by delayed myelination mostly after the neonatal period (148, 153, 159). Preterm infants with myelination stage M2 in MRI at a corrected age of one month have had a significantly poorer neurodevelopmental outcome at the age of one year than those who have reached stage M3 or M4 (148). Marked myelination delay, however, has been seen more frequently at a few months of age in MRI in infants with disability following white matter injury (124, 142, 159, 160). Ventricular size is described by the ventricular-brain ratio, which can be calculated by relating the ventricular diameter at the level of the frontal horn angles or midbody of the lateral ventricles to the diameter of the brain at the same level (126). Ratios over 0.35 have been defined as abnormal, and ratios of 0.40 as indicative of diminished parenchymal tissue (126). Moderate to severe VM in MRI is regarded as a strong sign of white matter injury in preterm infants (126). All preterm infants with CP in a small cohort were shown by MRI at the age of 1 year to have dilated occipital horns, and this dilatation was obvious also in 25% of the infants with a normal outcome (142). Measurements of CSF volume and extracerebral spaces at term age are greater in preterm infants, even without PVL, than in full-term ones, and the widths of the interhemispheric fissure and extracerebral spaces along the cortical convexities have been found to vary between 0 and 3 mm in MRI (92, 126, 133). Other of the extracerebral spaces have been described as 30 abnormally wide or large if they are over 3–4 mm, but these figures were not correlated with outcome (126, 133). Abnormalities of the brainstem have been found in foetal MRI examinations, although insufficient information on the size of the foetal brainstem can be gathered by this means (139). It has been difficult to localise lesions in small structures such as the brainstem by neonatal MRI, although some necrosis and infarctions have been seen, but less marked necrosis or increased glial cells have only been seen in histological examinations in preterm infants (141). Children with spastic hemiplegia after preterm birth and hemispheric infarction in neonatal US have been imaged by MRI after some months to years and found to have measurable shrinkage of the ipsilateral brainstem structures (152). Some other measurements of the brainstem have been reported including some infants (123, 135, 136). After severe asphyxia in addition to abnormal intensity of the thalamus and putamen, one preterm infant proved in a term age MRI to have atrophy of the brainstem, an observation that was in agreement with the neuropathological findings (161). Parenchymal lesions in surviving preterm infants, especially PHI and other focal deep infarcts, can cause brainstem lesion detectable on late MRI as a result of Wallerian degeneration (152). 2.4.3 Single photon emission tomography SPET has been used as a functional cerebral imaging method for studying brain maturation and perfusion changes in neonates (65, 68, 162, 163). Although it is a feasible method for in vivo measurements of regional CBF distribution, repeated examinations are restricted because of radiation exposure. The method requires a radiopharmaceutical tracer that will cross the blood-brain barrier and be retained in the brain tissue in proportion to the regional blood flow. Tracers such as iodine-123 iodoamphetamine (123 I-IMP), Xenon-133 (133-Xe) and technetium-99-m hexamethyl propylene amine oxime (Tc-99m HMPAO) have been used with neonates (68, 96, 162, 164, 165). Technetium99m ethylcysteinate dimer (Tc-99m ECD) is newer as a tracer and is not yet widely used in examinations of newborns, although it has a better brain uptake and greatly increased clearance from the body by the kidneys than its predecessors (166–168). The tracer distribution is measured from emitted gamma rays using rotating single, double or multiple-head gamma cameras (96, 163, 167). CBF changes are related to the age of the infant (40, 169). Increases are noted even in extremely preterm infants during the first days of life, representing a normal period of adaptation of the cerebral circulation (69, 170). Regional CBF of distribution patterns found by SPET is closely associated with the characteristics of vessel density development as detected in immunohistochemical studies (64, 65). A distribution map of blood flow maturation has been determined from infants with a normal outcome (Table 6) (68, 96). 31 Table 6. Maturational patterns of cerebral blood flow according to brain single photon emission tomography (68, 96). Pattern Age Regional cerebral blood flow 1 Before term age Prominent flow activity in the thalamus and in the sensorimotor cortex, low in the parietal and occipital cortices and very poor in the frontal cortex 2 Term age Prominent flow activity in the thalamus and sensorimotor cortex, important activity in the parietal cortex, low in the occipital cortex and very low in the frontal cortex 3 1 month Prominent flow activity in the thalamus, sensorimotor and parietal cortices, important activity in the occipital cortex and low in the frontal cortex 4 2 months Slightly predominant blood flow in the parietal and occipital cortices, low in the frontal cortex 5 6 months Marked cortical flow predominance, but still slighter in the frontal cortex 6 12 months Important blood flow activity in all cortical areas Findings in brain SPET have been interpreted by visual approximation or by semiquantification (68, 96). For comparison of tracer uptake between different cerebral areas, circular regions of interest (ROIs) at the antero-posterior sagittal level are identified manually by reference to anatomical structures, including the thalamus, cerebellum and cortical areas (frontal, sensorimotor, parietal, occipital), and hemispheric right-left asymmetries are assessed at transversal (transaxial) levels (167, 171). Predictive value of abnormalities in SPET. Abnormalities in SPET are detected by hypoperfusion or hyperperfusion of a distribution region in relation to others or globally in relation to age and by deviations in semiquantitative count ratios (96, 162, 166). By comparison with other methods available during infancy and childhood, brain SPET has succeeded in identifying hypoperfusion regions that mainly correspond to the posterior watershed areas seen in normal CT scans of prematurely born children with CP (172). Children with CP have been shown by SPET to have unilateral hypoperfusion in the hemisphere contralateral to hemiplegia, bilateral hypoperfusion of the motor cortex in moderate diplegia and tetraplegia, and bilateral reduction of perfusion in the sensorimotor, parietal and frontal regions in severe diplegia or tetraplegia respectively (173). In cases of children with CP having abnormal CT or MRI findings, brain perfusion SPET has detected corresponding abnormalities extending further to the cortical and deep grey matter (174, 175). SPET has occasionally given normal scans in cases of mild CP (173). In neonatal cases of haemorrhage SPET approach has pointed to a corresponding area of low perfusion to that detected in US. Brain SPET has shown involvement to reach the cortical areas in PHI, and the involvement has not been apparent in neonatal US or MRI scans. Focal infarctions have been detected in neonates in the form of low perfusion in the zone of the middle cerebral artery in neonates. In PVL, neonatal SPET has indicated low cerebral perfusion corresponding to the region shown to be affected in US and MRI, and low perfusion zones have reached the parietal cortical areas which again has been larger than could be detected in US or MRI scans. (162) Hypoperfusion in brain SPET during the first week of life has proved to be predictive of a major neurological handicap in high-risk neonates, including VLBW, asphyctic or 32 otherwise sick preterm and full-term infants (163, 171). SPET performed at the postconception age of 41–44 weeks has been reported to be even more sensitive than MRI for predicting major neurological disability in infants born at 32–42 gestational weeks (163). Others, however, have concluded that brain SPET in the neonatal period could not provide any additional information for predicting the outcome relative to a diagnosis based on lesions visible in US or MRI in preterm and term neonates, although the regions of diminished perfusion defined in SPET extended beyond the apparent limits visible in US and MRI (162). 2.5 Neonatal brainstem auditory evoked potentials in preterm infants BAEP has been used in neonatology to evaluate normal physiological maturation and integrity of the auditory system, to diagnose brain damage and to provide a prognosis for the outcome (176–178). The auditory system is the earliest sensory pathway to mature, at 25 gestational weeks, and is already affected by high intensity auditory stimuli in preterm infants (28, 179, 180). Monaural 2000 stimulations at rates of 10 to 20 / s are normally required, with intensities of 70 to 80 dBs above the average hearing level of normal adults (normal hearing level, nHL), to achieve the most reliable responses in neonates (176, 180). BAEP examinations can detect lesions that may be asymptomatic. One disadvantage, however, is that the examination is time consuming. The results are primarily analysed for the presence of the waves I, III and V. Wave I, or latency I (L I), is based on the transformation of tone-specific responses in the hair cells into impulses travelling along the auditory nerve, and after passing the cochlear nucleus of the brainstem, the impulse reaches the superior olivary complex, forming wave III, or latency III (L III) (181). Wave V, or latency V (L V), is then produced in the inferior colliculus, and finally the temporal auditory cortex is reached (181). A significant shortening of the evoked response has been demonstrated with term post-conceptional age (176, 178). The motor and sensory nerve roots in the brainstem have completed the myelination process before term age, and healthy preterm infants have normally reached a state of morphological maturation in BAEP which is equal to that of their full-term counterparts (70, 75, 176, 178). Inter-peak latency (IPL) I–V, the brainstem central conduction time, is reported to be about 5 ms for the stable preterm infants, whereas IPL III–V, the pontine conduction time, is remarkable stable throughout most of life and without sex difference in children, however, it is recommended that each laboratory should have own normative data (181). Predictive value of abnormality in brainstem auditory evoked potentials. Most failures in 40 and 70 dBnHL ABR screenings at post-conceptional age less than 35 weeks have resulted from immaturity (182). The effect of stimulus intensity is the greater the more immature the preterm infant is, and as the intensity is increased the wave latencies in both preterm and full-term infants decrease, while the amplitude increases (183–185). The central conduction time, IPL I–V, has frequently been found to become for neonates with greater duration of extrauterine life (186). Some reports indicate no deviate alternations in 33 the responses of small for gestational age (SGA) preterm infants, but others point to accelerated conduction in the neonatal period (187). Brainstem structures appear to be selectively vulnerable to ischaemic perinatal insults, especially in the superior colliculi, inferior colliculi, facial motor nuclei, vestibular nuclei and olivary nuclei (94, 161). Such adverse events may affect impulse conduction through the brainstem, causing abnormalities in BAEP findings (188). An abnormal BAEP, manifested as an absence or prolongation of latencies or a diminution of the V/I amplitude ratio, has been associated with adverse neurological development (188, 189). Transient dysfunction or maturational delay in neonatal BAEP measurements, including prolongation of the IPL I–V and IPL III–V conduction times, has been found in high-risk preterm infants with a transient neurological abnormality (189). A bilateral abnormality in a pre-discharge BAEP examination of a VLBW infant has been shown to correlate with an adverse outcome in intelligent quotient, language and academic achievements (177). Increased IPL III–V and IPL I–V conduction times have been shown to be significantly prognostic for delayed motor development and abnormal neurological findings such as CP at one year in high-risk preterm and full-term infants (188). Abnormal or repeatedly absent BAEPs during the neonatal period have been correlated closely with the impairment of psychomotor development (181). Abnormal BAEPs in prematurely born children with spastic CP indicate a poor prognosis and are associated with a “multihandicap state” (190). The predictive value with respect to hearing loss is discussed in the following section. 2.6 Neonatal screening of hearing in preterm infants The first behavioural response of the foetus to a sound stimulus at a high intensity level of >110 dB (A) and with a low frequency of 250–500 Hz can be observed at around the 20th gestational week, the required intensity level gradually decreasing and the frequency band broadening towards term age (191). Two neonatal hearing screening techniques were developed in the 1980s, one based on ABR and the other on TEOAE (192). Behavioural observation audiometry (BOA), e.g. FF audiometry, is a psychophysiological measure which has been used to evaluate peripheral hearing acuity and the neurological development of auditory behaviour in infants (193). In accordance with the recommendations of the Joint Committee on Infant Hearing, most screening programmes are targeted at infants with a high-risk of hearing deficits, including infants with BW <1500 g, birth asphyxia, mechanical ventilation, hyperbilirubinaemia exceeding the exchange transfusion level, congenital perinatal infection, syndromes or craniofacial anomalies, bacterial meningitis, ototoxic medication, or a family history of congenital hearing impairment (194). 34 2.6.1 Auditory brainstem responses In ABR (BAEP) screening, clicks are presented to the infant’s ear and the resulting electrical activity generated in the auditory pathway is recorded with the surface electrodes and averaged (192). The conventional ABR screening procedure is timeconsuming, and a highly trained physician is needed to evaluate the results (195). Modern automated screeners are quicker (196). Predictive value of abnormalities in auditory brainstem responses. The pass criterion for the ABR examination is a replicable wave V component that can be identified bilaterally at the test intensity required (196). According to the Joint Committee on Infant Hearing, a screening series including high-risk infants had a total of 3.3% with a unilateral pathological automated ABR and 2.0% with a bilateral pathological response (197). The best predictive value for neonatal ABR screening has been found with respect to a severe to profound degree of hearing impairment observed initially at an intensity of 60 dBnHL, whereas an initial suspicion of a milder hearing deficit based on lower intensities has more often reverted to normal in the follow-up (196). 2.6.2 Transient evoked otoacoustic emissions TEOAEs are produced by an active physiological mechanism in the healthy cochlea, and can be elicited in response to clicks presented to the ear through a small probe, which includes a microphone to catch the acoustic energy generated by the cochlea and transmitted back to the outer ear (192). Emissions are normally found at a 3 dB signal to noise ratio from 1 to 4 kHz, reflecting cochlear function under 30–40 dBHL (198, 199). The pass criteria for emissions can be rated visually or automated (197, 199, 200). As the amplitude and frequency ranges of emissions increase with age with the largest changes between 37 and 39 gestational weeks, the preferred approach has been to perform TEOAE screening at discharge or at term post-conceptional weeks (199, 201, 202). TEOAE screeners have the advantages that they are easily portable and that single-ear evaluations can be performed, and the method is also quick, objective and non-invasive (199). The disadvantages are false negative findings if used very early just after birth, and passes when cochlear function is normal although there is a retrocohlear deficit (203, 204). Predictive value of abnormalities in TEOAEs. Emissions are not produced in an ear when there is hearing loss of more than 30 to 40 dB, but unfortunately a small number of data points, a weak stimulus, low reproducibility, poor probe stability, a whimpering or crying infant, debris in the external ear canal, or performance of the test at too early a juncture are other things that may cause absence of a response in addition to a hearing defect (202, 203, 205). A failure rate of 9% in both ears has been reported for infants in universal screening, a high failure rate of 13% in one ear or 6 to 16% in both ears screened for high-risk infants, and a very high failure rate of 46% in one or both ears for VLBW infants (197, 200, 206, 207). TEOAE screening performed in a neonatal nursery has been reported to give failure rates of 18–25% for one ear (208). Failure rates in 35 screening before discharge from a NICU have been highest in infants with the lowest BWs, the oldest chronological age and the longest duration of post-conceptional care (206, 208). Universal TEOAE screenings of newborn infants, within the Rhode Island Hearing Assessment Program and elsewhere, have achieved sensitivities of 95–100% and specificities of 90–95% for the prediction of hearing loss (204, 207). Because of the high failure rates among preterm and other high-risk infants a sensitivity of 100% with a specificity of 50% has been reported for such series (206). 2.6.3 Free-field auditory examination The simplest form of behavioural screening for hearing impairments is observation of the infants. Full-term infants respond to pure tone stimuli with a mean threshold of 85 dB in BOA, whereas only one third of preterm infants are reported to respond at 90 dB. However, neurologically normal preterm infants have reached normal threshold ranges by the age of 9 months (193). Predictive value of abnormalities in FF examinations. Failure of an infant to be aroused or startled or to show auropalpebral reflexes repeatedly after test sounds at any frequency below 100 dBHL may be considered a mark of failure (209). No specific predictions have been associated with FF examinations. 2.7 Neonatal neurological assessment and follow-up of preterm infants It is a problem simply to carry out a clinical neurological assessment of a sick, labile, immature preterm infant and to reach conclusions on the basis of this (27, 210). So that serial examinations may be needed to increase the predictive capacity (27, 211). Various scoring systems based on diagnostic categories, risk factors, therapeutic requirements, physiological measurements or combinations of these have been used to predict morbidity and future development (212). The clinical risk index for babies (CRIB) score has been developed by the International Neonatal Network to simplify and refine the prediction of neonatal mortality and morbidity, and sometimes of the general outcome, in VLBW preterm infants (51, 213). CRIB includes scores for BW (0 for >1350 g, 1 for 851–1350 g, 4 for 701–850 g and 7 for ≤700 g), GA (0 for >24 weeks and 1 for ≤24 weeks), congenital malformations (0 for none, 1 for not acutely life-threatening and 3 for acutely life-threatening), maximum base excess in the first 12 h (0 for > –7.0 mmol/L, 1 for –7.0 to –9.9 mmol/L, 2 for –10.0 to – 14.9 mmol/L and 3 ≤ –15.0 mmol/L), minimum appropriate FIO2 in first 12 h (0 for ≤ 0.40, 2 for 0.41–0.60, 3 for 0.61–0.90 and 4 for 0.91–1.00) and maximum appropriate FIO2 in the first 12 h (0 for < 0.40, 1 for 0.41–0.80, 3 for 0.81–0.90 and 5 for 0.91–1.00). Major cerebral abnormalities on ultrasound have been found in 5% of surviving VLBW preterm infants at discharge home with CRIB scores 0–5, 12% of those with scores 6–10 and 20% of those with scores > 11. (213) 36 Term age, a milestone in the progression from foetal life to infancy, implies a transition in posture and a development in movement from lower subcortical control to upper corticospinal control as maturation of the neuromotor pathways proceeds (210). The major features to be considered in a motor examination consist of passive muscle tone, the posture of the limbs, active motility and muscle power, tendon reflexes and the plantar response (27, 214). Detailed advices on the conducting of neonatal neurological examinations on full-term infants have been offered for a much longer period than on preterm infants (214, 215). However, practical and satisfactory methods based on cumulative experience in the assessment of preterm infants have been modified during the last decade (214). The tests should be carried out in a sequence that is aimed at causing minimal disturbance to the state of the infant, by observing and testing items in the supine, prone and upright positions (214, 215). Preterm infants have been observed to present transient abnormal neurological signs with regard to posture, gross motor abilities, fine motor abilities, equilibrium, coordination, muscle tone or reflexes within the first 2 years (216–218). Common motor milestones, including the abilities to roll from prone to supine and from supine to prone, to sit with and without support, to creep, to assume a sitting position, to crawl, to pull to a standing position, to cruise and to walk, are used for early detection of motor delay or as part of a more comprehensive development testing methods (219, 220). A normal neuromotor assessment after six months of age has been found highly predictive of subsequent normal motor outcome (218). The persistence and extent of a clinical abnormality in posture, muscle tone and strength, motor abilities or reflexes, or a severe delay in skills during the follow-up should be interpreted as pointing to a notable motor disability such as CP (221). Motor delay may also be a sign of delay in some other area of development, which may arouse concern (220). It has been observed that if a preterm infant has a major impairment that implies a neurosensory disability (CP, blindness, deafness, epilepsy or DQ<70) at 1 year of age, this will also exist in the early school years (37, 222). Development scales measure intelligence and assess broadly degree of abilities in subgroups of motor, hearing and speech, personal-social, hand and eye and performance abilities (219, 223). The normal general DQ on Griffiths’ scales has been considered to be 80 or more with borderline scores of 70–79. During the early months of life a healthy infant may be transiently far ahead of the average in one subgroup and lower than the age-related level in another subgroup, depending on the apparent attention paid to these in the environment. Relatively high or low levels of skills in some area will produce different developmental profiles, which can show where a weakness or mental disability lies, or in what direction exceptional progress may be expected. The DQ may be repeatedly low in preterm infants with severe neuromotor disability, because most of the subscales demand locomotion ability. A profile for a deaf child may show a deep scaledown in hearing and speech. (219) 3 Aims of the research The purpose of the present work was to study structural and functional imaging methods applied at term age for predicting the later neuromotor outcome in very low birth weight preterm infants and to assess hearing screening methods used at term age in regard to the prediction of permanent hearing loss. The specific aims were: 1. to study the efficacy of neonatal brain MRI for predicting the later neuromotor outcome in relation to US in VLBW preterm infants, 2. to study the accuracy of neonatal brain SPET for predicting cerebral palsy in relation to US in VLBW preterm infants, 3. to measure brainstem size in MRI and brainstem function as shown by BAEP at term age as means of predicting the later neurosensory outcome in VLBW preterm infants, and 4. to assess auditory responses by means of ABR, TEOAE and FF behavioural observation responses as means of predicting permanent hearing loss in VLBW preterm infants. 4 Subjects and methods 4.1 Subjects The prospective follow-up series comprised of 51 surviving preterm infants born at less than 34 gestational weeks with a birth weight below 1500 grams and admitted to the Neonatal Intensive Care Unit (NICU) from the district primarily served by the Paediatric Clinic of Oulu University Hospital and of 52 full-term infants born in the Obstetric Clinic of the same hospital. VLBW preterm infants (I-IV). The subjects were three pilot infants born during 1993 and 45 consecutive preterm infants born between November 1, 1993 and October 31, 1995, together with three co-born siblings with birth weights of 1645, 1650 and 1800 grams. Of the 65 live-born preterm infants who were treated during the study period and were eligible for the series, nine died before the research enrolment could be carried out, four infants were excluded because of serious congenital anomalies and four others because of parental refusal. Control full-term infants (III, IV). In order to evaluate the suitability of the screening methods, 52 full-term healthy newborns were picked out at random from a normal well baby ward at the Obstetric Clinic of Oulu University Hospital for participation in series IV, and 21 of these were also included in series III. The data on the infants in the four series are summarised in Table 7. All the examinations were approved by the Ethics Committee of Oulu University and conducted with informed parental consent. 39 Table 7. Clinical characteristics and neonatal morbidity of infants in series I-IV. Characteristics and morbidity Number of infants Gestational age (wk), mean (SD) Preterm infants in series I,III,IV Preterm infants in series II (a) Full-term infants in series III (b) Full-term infants in series IV 51 34 21 52 29.3 (2.2) 28.9 (2.0) 40.0 (1.0) 40.0 (1.0) Birth weight (g), mean (SD) 1153 (289) 1090 (273) 3801 (476) 3728 (504) Head circumference (cm), mean (SD) 26.5 (2.5) 25.9 (2.3) 35.6 (1.3) 35.3 (1.2) 16 (31) 11 (32) Small for gestational age (n, %) Male/Female (n) 27/24 18/16 9/12 25/27 Singleton (n, %) 32 (63) 29 (85) 21 (100) 52 (100) Apgar score at 5 min, mean (SD) 7 (1.7) 6 (1.5) 9 (0.5) 9 (0.4) Respiratory distress syndrome (n, %) 45 (88) 31 (91) Bronchopulmonary dysplasia (n, %) 10 (20) 8 (24) Abnormality in cranial ultrasound (n, %) Haemorrhagia gr I-II gr III-IV Periventricula leukomalacia 10 (20) 4 (8) 2 (4) 5 (15) 3 (9) 4 (12) Clinical risk index for babies (CRIB), mean (SD) 4 (3) a Preterm infants in this group are a part of preterm infants in series I, III and IV. b Full-term infants in this group are a part of full-term infants in series IV. 4.2 Methods 4.2.1 Neonatal brain imaging 4.2.1.1 Ultrasound at term age (I, II) US examination at term age as a reference imaging method was performed by experienced radiologists according to Siegel (224) by using transducers of 5 or 7.5 MHz (Toshiba Sonolayer SSA-270), and images were documented on films. The paediatric radiologist who was not aware of the clinical histories of the preterm infants systematically evaluated the resulting hard copy images, identifying all traces of IVHs, PVL and infarctions. IVHs (germinal matrix cysts, porenchephaly or blood clots) were graded according to Papile et al. (79), and PVL lesions according to de Vries et al. (24), and the infarctions were also evaluated. IVHs, cystic PVL and infarctions in the brain tissue were included in the analyses as parenchymal lesions, which were also analysed without grade I-III haemorrhages. 40 Ventricular dilatation was defined in terms of the ventricular-brain diameter ratio calculated for the areas of the frontal horn (frontal horn or Evans index), midbody (midbody index) and trigone (trigone index) on coronal scans. Ratios exceeding 0.35 in the frontal horn and midbody implied abnormal dilatation, similarly trigone indices exceeding 0.60 (115, 116, 118). 4.2.1.2 Magnetic resonance imaging (I, III) MRI was performed using a scanner of 1.0 T (Magneton, Siemens). The examinations included sagittal and axial T1-weighted (repetition time of 570-600 msec / echo time of 15 msec / 2 excitations) and axial proton density- and T2-weighted turbo spin echo (3500 / 19, 93 / 1) images with a slice thickness of 4 mm and a field of view of 180 mm with a 160-192x256 matrix. A T1-weighted axial scan could not be obtained for one child. To prevent movement artefacts without using of sedative medication, the infants were transported to the imaging room after feeding and were wrapped in swaddling clothes and provided with earplugs during imaging. If supplementary oxygen was needed, the infants were monitored with a pulse oximeter. The images were analysed independently by two radiologists who were unaware of the clinical outcome of the infants, and a consensus was reached. Parenchymal traces of haemorrhages (subependymal or intraparenchymal with or without porencephalia), PVL (periventricular cysts with or without haemorrhage), infarctions (mainly atrophic lesions with or without haemorrhage) and clear WML were treated together as parenchymal lesions in the analyses. Parenchymal lesions were also analysed without SEHs. The T1-weighted axial images were used to assess of the degree of myelination (M1-M4) according to McArdle et al. (76). The lateral ventricles were measured using a cursor on the display. Ventricular-brain ratios at the level of the frontal horn angles (frontal horn index), midbody (midbody index) and trigones (trigone index) of the lateral ventricles were measured on the T1-weighted axial images, or the T2weighted image in one case (126). Abnormal frontal horn and midbody indices were defined as values in excess of 0.35 and abnormal trigone indices as being over 0.60, as in the US examinations (116, 126). The widths of the lateral and posterior parietal subarachnoid spaces at the level of the centrum semiovale, lateral ventricles, and the thalamus and the anterior and posterior interhemispheric fissures were measured on T2weighted axial images. Space widths from 0 to 4 mm were considered normal (126). Every sagittal (Sag) and axial (Ax) brainstem morphometric dimension of an infant was obtained as a mean of three measurements performed with help of a cursor on the display as follows (225, 134, 136): Sagittal (Sag) measurements of the brainstem Pontine oblique height = Distance from the pulbo-pontine sulcus to the inferior colliculus. Brainstem height = Distance between a line connecting the superior margin of the atlas to the clivus and the proximal end of the Sylvian aqueduct. Sag-Mesencephalon = The anteroposterior mesencephalon diameter between the upper border of the pons and a point midway between the superior and inferior colliculi. 41 Sag-Pons = The anteroposterior pontine diameter from its anterior surface to the floor of the fourth ventricle at the midpoint between its upper and lower borders and perpendicular to its long axis. Sag-Medulla Oblongata = The anteroposterior diameter of the medulla oblongata measured perpendicularly to the longitudinal axis just above the posterior kink at the cervicomedullary junction. Axial (Ax) measurements of the brainstem Ax-Mesencephalon = The maximum interpeduncular diameter at the mesencephalon. Ax-Pons = The pontine diameter at the point where the trigeminal nerves originate from the brainstem, between two points just posterolateral to their origins. Ax-Medulla Oblongata = The minimum transverse diameter in the most caudal section of the medulla oblongata at which the medulla was still visible. 4.2.1.3 Single photon emission tomography (II) The brain SPET examinations were carried out by the Division of Nuclear Medicine. To keep the infants calm without any premedication, they were well nourished and an intravenous injection route was established in the NICU before they were moved to a quiet imaging room, where they were wrapped in swaddling clothes on a stretcher after injection of the perfusion tracer agent. Tc-99m ECD (Neurolite, DuPond Pharma, USA) was used at a dose of 110 MBq as a tracer, the EDE of which was reduced by enhancing voiding with a dose of 0.5 mg furosemide intravenously or orally. The images were captured with a single head rotating gamma camera with a slant collimator (Siemens/ Orbiter) or a double head gamma camera equipped with a fan beam collimator (Adac/ Vertex). The single head provided 64 frames of 30 s each and the double head 64 frames of 35 s. Transaxial (transversal, parallel to the base of the brain) and sagittal slices 2 pixels (one of 4.7 mm) thick were reconstructed and no attenuation correction was applied. Visual interpretation: An experienced physician specialized in nuclear medicine who was unaware of the infants’ clinical data or other imaging results regarding them inspected all the transaxial and sagittal slices visually. Relative differences in perfusion between the cortical areas (frontal, sensorimotor, parietal and occipital) and the reference areas (thalamus and cerebellum) in the craniocaudal or antero-posterior direction of the middle sagittal slices were considered and asymmetries between the hemispheres were estimated in transversal slices (96). Semiquantitative evaluations of the regions of interest (ROI) in the sagittal slices were made in borderline cases (96). The ratios were classified as abnormal when at least two of them in the same infant lay outside 2 SD for the published reference values (96, 167). Semiquantitative assessments for reference values were calculated from the count densities collected by a physicist from the ROIs in the middle sagittal slices determined by a physician in nuclear medicine. Reference values were collected from preterm infants with a normal outcome in the series. 42 4.2.2 Brainstem auditory evoked potentials (III, IV) Recordings for both ears were performed using a Disa 1500 system (Disa, Denmark). Rarefaction clicks of 100 µs duration were delivered separately to both ears through earphones. The stimulus rate was 10 Hz (alternating in the range 7-15 Hz), the intensity 75 dBnHL with contralateral masking (-40 dB) and the time base 20 ms. The low and high bandpasses were set at 20 and 3000 Hz respectively. Vertex responses to stimulation of each ear were recorded with cup electrodes and referenced to both the ipsilateral and contralateral mastoid. Waveform responses to at least 2000 clicks were averaged twice, and if no reproducible responses were obtained the clicks were increased to 4000 and the test performed up to four times. The components of L I, III and V were measured, and IPL I-V and III-V and the amplitude ratio V/I were determined from printed screens by a clinical neurophysiologist who were unaware of the clinical data. When a response was absent or was delayed by more than 2 SD, or an amplitude ratio V/I was below 2 SD of the reference values (for full-term infants), this was considered abnormal in a preterm infant. 4.2.3 Neonatal screening of hearing (IV) All the hearing examinations in the preterm and full-term infants were performed after feeding without premedication. ABR screenings were carried out in separate sessions at the Department of Clinical Neurophysiology, while the TEOAE and free-field auditory examinations were carried out at one session in a soundproof examination room at the Hearing Centre of the Department of Otorhinolaryngology. ABR. The ABR method as a part of BAEP is explained in Section 4.2.2. Clear, reproducible responses at least in waves of type V at the test level were taken as a pass and their absence as a fail (180). An infant was deemed to have failed the test if both ears failed, and to have passed if either ear passed. TEOAE. TEOAEs were measured in both ears using an ILO88 otodynamic analyser system (Otodynamics Ltd, Southampton, UK) with known guidelines for probe design, signal processing and technical procedures (203). The results were analysed by an audiologist who did not know anything about the origin of the infants or their clinical data, and were interpreted as a pass, if emissions were found at a 3 dB signal to noise ratio in at least one of the 1-2, 2-3 and 3-4 kHz frequency bands, reflecting cochlear function under 30-40 dBHL (198, 203). A recording with no emissions was graded as a fail, and bilateral failure resulted a fail in the screening. FF. BOA in the form of free-field examination was performed by trained audiophonological staff. The lowest reaction level was assessed from arousal and startling or from auropalpebral reflexes in the infant’s behaviour elicited by various filtered environmental sounds. Sounds in ½-octave frequency bands around 1, 2 and 4 kHz were delivered at intensities of 60 to 100 dBnHL through loudspeakers placed on the sides of the infant’s head and at ear level. Clear, repeated behavioural reactions to the test sounds at any frequency band below 100 dBHL were considered to mark a pass (209). 43 4.2.4 Developmental follow-up and neurosensory outcome The preterm infants underwent neurological and developmental follow-up examinations performed by a neonatologist every three months up to a corrected age of 18 months, and hearing was followed up in all the infants by means of a re-tests and evaluations of hearing and speech development. CP and permanent hearing loss were recorded as outcomes for prediction purposes. Neuromotor outcome. Asymmetries, persistence of primitive/infantile reflexes, dystonia and deviations in motor skills relative to averaged abilities for the corresponding corrected age levels and relative to the previous performance of the preterm infant were highlighted in particular according to Illingworth (221). Preterm infants who had a continuous delayed in their motor development and abnormal muscle tone and motor function as impairments or disabilities at a corrected age of 18 months were defined as having CP in the sense of Illingworth (221) and Hagberg et al. (34). CP was further evaluated as mild, moderate or severe in terms of functional ability and the severity of ambulatory impairment (36). Neurodevelopmental outcome. The developmental abilities of the preterm infants were evaluated in the fields of locomotor, hearing and speech, personal-social, hand and eye, and performance according to the developmental scales of Griffiths (219). The general developmental quotient (GQ) calculated at corrected ages of 6 and 18 months, and values of 80 or more were held to be normal. Follow-up of hearing. All the preterm infants with bilateral failures in screening at term age (ABR and TEOAE/FF) were further evaluated at the Hearing Centre and in the audiophonological ward by repeated audiological methods (TEOAE/FF and ABR under sedation). It was planned to re-evaluate all the preterm infants at a corrected age of 6 months by means of at least one audiological examination, either TEOAE or FF or both. The sub-quotient (SQ) for hearing and speech development was calculated at corrected ages of 6 and 18 months (219). Diagnosis of permanent hearing loss was based on 1) absence of responses in a 60-105 dBHL ABR examination under sedation, 2) lack of behavioural responses to sounds during an observation period in the audiophonological ward, and 3) ability of amplification devices to enhance reactivity to sounds. If speech development continued to be normal after passing the hearing tests, the infant's hearing was considered normal, or if a preterm infant had CP and abnormal speech ability, hearing was considered to be normal, or at least not severely affected, after passing the hearing tests repeatedly and responding to sounds. The full-term infants were followed up by conventional methods, including a distraction test and an assessment of speech and language development at a family health care centres. Hospital records and a questionnaire administered at the age of 2-3 years were also used to verify hearing and speech development. Hearing ability was considered normal when speech production was normal after obtaining a pass in the screenings. A summary of the imaging methods and the main outcome measures used in these series is presented in Table 8. 44 Table 8. Summary of the main methods used in the term age examinations and the main outcome measures employed at a corrected age of 18 months in series I-IV. Series Methods used at term age Outcome at age of 18 months I Brain magnetic resonance imaging Intracranial ultrasound Cerebral palsy II Brain single emission tomography Intracranial ultrasound Cerebral palsy III Brainstem magnetic resonance imaging Brainstem auditory evoked responses Neurosensory disability IV Transient evoked otoacoustic emissions Auditory brainstem responses Free-field auditory examination Permanent bilateral hearing loss 4.2.5 Statistical methods This data were processed using the Statistical Package for the Social Sciences (SPSS version 7.5). The values of the neonatal brain MRI and SPET examinations for predicting CP was evaluated by comparison with US, and the brainstem measurements obtained from the MRI and BAEP (ABR) results were used to predict neurosensory disability (including CP and hearing loss). The abilities of ABR (BAEP), TEOAE and FF auditory examinations to predict permanent hearing loss were likewise evaluated. The t test for two independent samples was used to compare the means for the subgroups. The chi square test or Fisher’s Exact Test at low frequencies was used for prediction purposes, and sensitivity, specificity, odds ratio (OR) with 95% confidence interval (95 % CI) and significance (p < 0.05) were calculated for each test. 5 Results 5.1 Neurodevelopmental outcome Neurological and developmental follow-up examinations and recordings of hearing ability were performed on 49 out of the 51 preterm infants at a mean (SD) corrected age of 18.6 (1.0) months in order to assess the prediction of neurosensory outcome. One infant had moved away from the district, but the infant was not excluded and some data was extracted from the patient records for evaluation. Another died of a severe chronic lung disease with complications at the corrected age of 9 months. 5.1.1 Cerebral palsy CP was observed in 12 out of the 51 preterm infants (24%), and in 11 out of the 48 consecutive ones (23%). There were ten infants with CP among the 35 AGA infants and two among the 16 SGA infants. Eight of the 12 infants with CP had diplegia (six spastic, one dystonic and one athetotic), while three had tetraplegia (two spastic and one dystonic), and one had spastic hemiplegia. Five infants had severe CP, three moderate CP and four mild CP. The gestational age of the infants with later CP at birth was less than 29 weeks, the mean (SD) value being 27.2 (1.4) weeks. This was significantly less than the mean of 29.9 (1.9) weeks recorded for the infants with a normal motor outcome (p<0.01, independent samples t test). Likewise, the mean (SD) birth weight of 965 (219) g for the infants with CP was significantly lower than that of 1210 (283) g for the infants without CP. A half of the CP cases were ELBW infants. None of the full-term infants had developed severe neuromotor disabilities. 5.1.2 Developmental outcome The mean (SD) GQ at the corrected age of 18 months for the 49 preterm infants tested by means of Griffiths’ developmental scales was 103 (22). Five infants with a GQ less than 46 80 had CP, and the infants with and without CP had a mean (SD) GQ of 73 (27) and 112 (9), respectively. Six out of the 51 infants had a SQ for hearing and speech of less than 80, their mean (SD) SQ value at a corrected age of 6 months being 59 (27). Four of these infants had hearing loss, and the other two had CP. Two of the infants with hearing loss did not attend for the developmental scoring at the corrected age of 18 months, but the remaining four received a mean (SD) SQ of 54 (28). The infants without profound hearing loss had a mean (SD) SQ of 112 (18) at a corrected age of 6 months and 109 (17) at 18 months. 5.2 Abnormalities in imaging examinations at term age and later neuromotor outcome 5.2.1 Ultrasound Term age US examinations were performed at a mean (SD) post-conception age of 38.6 (2.4) weeks. Eleven of the preterm infants (22%) had traces of haemorrhages, seven in the subependymal area (Grade I), one intraventricularly (Grade III), and three in the parenchymal area (Grade IV). Two of the latter were PHIs the white matter. One infant with a parenchymal haemorrhage had additional PVL cysts, one with subependymal haemorrhage and all three with parenchymal haemorrhages developed CP. Four infants had PVL (one hyperechogenic and three cystic) and all of them developed CP. Fourteen of the preterm infants (27%) had a parenchymal lesion, eight of whom had CP: one tetraplegia, six diplegia and one hemiplegia. Thirty of the preterm infants (59%) had an abnormal frontal horn index, and one third of the cases had CP. Twentyone had an abnormality in the midbody index (41%), and eight of these had CP. All told, sixteen infants (31%) had an abnormal trigone index, seven of these being CP cases. 5.2.2 Magnetic resonance imaging Fifty preterm infants underwent a MRI examination at a mean (SD) post-conceptional age of 39.0 (2.4) weeks. The MRI of one infant with later dystonic tetraplegia failed because of restlessness and severe respiratory difficulty. Some movement artefacts were observed in 10 cases, but these did not prevent us from seeing cysts or larger haemorrhages. Parenchymal abnormalities. Twelve infants (24%) had haemorrhage as the dominant finding, nine of these being subependymal, including one with diplegia, while the remainig three infants had intraparenchymal haemorrhage with porenchephaly and moderate or severe WML. All three infants developed CP: one hemiplegia, one diplegia, and one teraplegia. Four infants had bilateral PVL in the typical periventricular area (one haemorrhagic and three cystic), and all these infants developed diplegia. Two infants had an infarction, one with bilateral cortical dysplasia after severe intrauterine asphyxia who 47 developed tetraplegia, and the other with a parieto-occipital infarction who does not have CP. One infant with WML developed athetotic diplegia. All together, nineteen out of the 50 preterm infants (38%) had parenchymal lesions in MRI. Eight infants (16%) had myelination delay; and three of them had CP. Ventricular size and extracerebral spaces. Eight preterm infants had an abnormal frontal horn index, a half of whom had CP, while six had an abnormal midbody index, again a half of them having CP. Four infants had an abnormal trigone index, including three cases with CP. Measurements of the extracerebral spaces gave a mean (SD) anterior interhemispheric width of 2.0 (0.8) mm and a posterior width of 1.9 (1.9) mm. The mean (SD) width of the lateral parietal subarachnoid space was 0.5 (0.9) on the right and 0.3 (0.8) mm on the left. The mean (SD) posterior parietal widths were 5.3 (3.2) on the right and 5.2 (3.2) on the left. Brainstem size. The mean brainstem dimensions at term age were almost equal between the SGA and AGA preterm infants, and only the pontine oblique height was significantly greater (p= 0.019) and the Sag-Mesencephalon significantly thinner (0.045) in the SGA infants than in the AGA ones. By comparison with brainstem dimensions, the SGA preterm infants continued their head circumference growth to term age in the same manner as the AGA infants achieving a mean (SD) of 33.2 (1.5) versus 34.0 (1.6) cm, although their weight gain fell behind the mean (SD) for the AGA infants (2234 (377) versus 2573 (477) g, p=0.016, independent samples t test). The preterm infants with neurosensory disability had smaller brainstem dimensions than those with normal outcome. The differences in the Sag-Mesencephalon and both in the sagittal and axial Pons and Medullo Oblongata diameters were significant, as shown in Table 9. Table 9. The mean (SD) dimensions of the brainstem on T1-weighted brain magnetic resonance imaging (MRI) scan at term age in appropriate for gestational age (AGA) and small for gestational age (SGA) preterm infants (independent samples t test). MRI brainstem dimension AGA preterm infants (n=35) mean (SD) mm SGA preterm infants (n=15) mean (SD) mm 95% Confidence interval for the difference of means p-value 20.0 (1.5) 21.1 (0.9) –1.90– –0.18 0.019 0.310 Sagittal Pontine oblique height Brainstem height 33.6 (2.3) 34.3 (2.2) –2.14–0.69 Mesencephalon 13.3 (0.8) 12.9 (0.6) 0.01–0.90 0.045 Pons 13.8 (0.9) 14.2 (0.8) –1.93–0.12 0.131 Medulla Oblongata 8.2 (0.9) 8.4 (0.7) –0.55–0.26 0.480 Axial Mesencephalon 20.8 (1.8) 21.6 (1.1) –1.75–0.30 0.162 Pons 16.7 (1.5) 17.2 (0.3) –1.39–0.29 0.196 Medulla Oblongata 9.6 (0.9) 9.6 (0.8) –0.46–0.56 0.835 The preterm infants with neurosensory disability had smaller brainstem dimensions than those with normal outcome. The differences in the Sag-Mesencephalon and both in 48 the sagittal and axial Pons and Medullo Oblongata diameters were significant, as shown in Table 10. Table 10. The mean (SD) dimensions of the brainstem on T1-weighted brain magnetic resonance imaging (MRI) scan at term age in preterm infants according to the neurosensory outcome (independent samples t test). MRI brainstem dimension Preterm infants with normal outcome (n=37) mean (SD) mm Preterm infants with disability (n=13) mean (SD) mm 95% Confidence interval for the difference of means p-value Sagittal Pontine oblique height 20.6 (1.5) 19.7 (1.2) –0.010–1.82 0.051 Brainstem height 34.1 (2.3) 32.9 (2.0) –0.280–2.62 0.112 Mesencephalon 13.3 (0.6) 12.8 (0.9) 0.003–0.93 0.049 Pons 14.2 (0.7) 13.2 (0.8) 0.470–1.44 <0.001 8.4 (0.6) 7.9 (0.6) 0.080–0.89 0.019 Mesencephalon 21.4 (1.4) 20.2 (2.1) –0.170–2.45 0.084 Pons 17.0 (1.3) 16.2 (1.4) 0.030–1.74 0.043 9.8 (0.7) 9.1 (1.0) 0.170–1.16 0.010 Medulla Oblongata Axial Medulla Oblongata 5.2.3 Single photon emission tomography The SPET examinations were performed at a mean (SD) post-conceptional age of 39.2 (2.0) weeks. Parenchymal abnormalities. Visual interpretation showed sixteen out of 34 infants (47%) to have a perfusion defect, nine of whom had CP including all the infants with moderate or severe CP. Of the 16 infants with normal perfusion scans, two had mild diplegia. Cranio-caudal abnormalities in the sagittal slices were found in 13 infants, of whom eight developed CP. Eleven of these thirteen preterm infants had hypoperfusion in the sensorimotor cortex or thalamus, seven of them developing CP. Transversal hemispheric asymmetries were seen in seven cases including four cases of CP. Semiquantitative results. In order to obtain reference values for the 99Tcm-ECD brain perfusion SPET at term age, regional semiquantitative values were calculated from the results for seventeen infants with a normal motor outcome. By comparison with these values, eight of the infants with CP had from one to five values outside 2 SD. 49 5.3 Brainstem auditory evoked potentials All 51 preterm infants underwent a BAEP examination on both ears at post-conceptional term age and 21 full-term infants did so at three days of age. The results were used for neuromotor and audiological prediction purposes. The preterm infants had longer mean BAEP peak I and V latencies and I–V and III–V IPL values than the full-term infants, whereas L I was significantly longer in the AGA infants than in the SGA infants. Most of the infants with neurosensory disability, except one with severe CP, had bilaterally absent or delayed responses in BAEP components. Of the 37 preterm infants with a normal outcome, 15 had abnormality in L I, 12 in L III, 19 in L V, 12 in IPL I–V, 16 in IPL III–V and four in A V/I. 5.4 Screening of hearing at term age and permanent hearing loss 5.4.1 Screening of hearing ABR. Seven out of the 51 preterm infants had bilateral failures and 3 unilateral failures in ABR screening. Six of the infants with a bilateral failure had hearing loss. None of the 21 full-term infants failed with this screening modality. TEOAEs. Nine of the 44 preterm infants failed the TEOAE test in one ear and nine in both ears. Three of the bilateral failure cases and two cases of unilateral failure later had permanent hearing loss. One preterm infant who passed the TEOAE test had both CP and permanent hearing loss. Two of the 52 full-term infants failed the TEOAE test in one ear. FF examinations. Four of the preterm infants failed the FF examination, but none of the full-term infants. Three of the former had permanent hearing loss. The results regarding fails in the ABR, TEOAE and FF examinations are summarised in Figure 1. 50 40 Infants with unilateral failure Infants with bilateral failure n=9 30 % 20 10 n=3 n=9 n=7 n=0 0 ABR preterm ABR full-term TEOAE preterm n=2 TEOAE fullterm n=4 FF preterm n=0 FF full-term Fig. 1. Failure results for the preterm and full-term infants in ABR, TEOAE and FF examinations at term post-conceptional age. 50 5.4.2 Hearing loss Six out of the 51 preterm infants (12 %) had a significant bilateral hearing loss (60–105 dB), and four of these also had CP. One of the infants with hearing loss died before any hearing appliance could be used, but the daily use of hearing devices was feasible for another infant without CP at a corrected age of 5 months. Four infants with CP were able to use hearing appliances after 6, 12, 34 and 39 months of age. The delays were caused by difficulties in confirming amplification enhancement ability in these otherwise disabled infants. The planned audiological follow-up examinations were delayed to a mean (SD) age of 9.9 (4.2) months because of infection and middle ear effusion problems in 34 cases (67%). Seventeen preterm infants (33%) had tympanostomy tubes inserted in both ears for glue ear, and six of them underwent adenoidectomy. Five of the preterm infants with hearing loss had ear ventilation tubes. Re-evaluation did not reveal any further preterm infants with permanent hearing loss. None of the full-term infants had any significant hearing loss at the follow-up. Twenty of the infants (38%) had suffered from otitis media, and four (8%) had undergone adenoidectomy and the insertion of tympanostomy tubes during the corresponding period of time. 5.5 Prediction of neurosensory outcome Fourteen of the preterm infants (27%) had at least one neurosensory disability, including 12 with CP, four of whom, together with two infants without CP, had permanent hearing loss. In terms of intrauterine growth, two of the 16 SGA infants had CP and two others permanent hearing loss. The mean (SD) birth weights of the infants with and without neurosensory disability were 942 (211) g and 1232 (274) g, respectively (p=0.01, independent samples t test), and their mean (SD) gestational ages at birth were 27.5 (1.5) weeks and 30.0 (2.0) weeks (p<0.01, independent samples t test). The findings in the MRI and SPET examinations were compared to findings in US examinations for predicting CP. Numbers of the cases in examinations are summarised in table 11. 51 Table 11. Numbers (n) of preterm infants with normal and abnormal findings in brain magnetic resonance imaging (MRI) and single photon emission tomography (SPET) examinations at term age in relation to findings in ultrasound (US) examinations in preterm infants with and without cerebral palsy (CP and non-CP) as an outcome at a corrected age of 18 months. Groups of infants with examinations US (n=51) MRI (n=50) Normal (n=34) SPET (n=34) Abnormal (n=16) Normal (n=18) Abnormal (n=16) CP Non-CP Normal US without SPET 1 14 0 14 1 0 – – – – Normal US with SPET 3 17 1 14 1 3 1 12 2 5 4 31 1 28 2 3 1 12 2 5 CP Non-CP CP Total (n) Non-CP CP Non-CP CP Non-CP Abnormal US without SPET 0 2 0 1 0 1 – – – – Abnormal US with SPET 8 6 0 4 8 2 1 4 7 2 Total (n) All (n) 8 8 0 5 8 3 1 4 7 2 12 39 1 33 10 6 2 16 9 7 – = not done Prediction of CP was most sensitive in the case of parenchymal lesion visible in MRI. Out of the ventricular-brain ratios, only an abnormal trigone index predicted CP in both US and MRI examinations. Wide extracerebral spaces or delayed myelination as seen in MRI did not predict CP. Brain perfusion SPET attained a sensitivity and specificity of the same magnitude as US for predicting all forms of CP, but its sensitivity in predicting moderate or severe CP was better (100% vs. 71%, but with a specificity of 67% vs. 74%, p=0.002 vs. 0.070). The predictive values of the different imaging methods for CP as recorded in the present series are summarised in Table 12. 52 Table 12. Performance of brain magnetic resonance imaging (MRI) and brain perfusion single photon emission tomography (SPET) at term age for the prediction of cerebral palsy as an outcome at a corrected age of 18 months in very low birth weight preterm infants with reference values for ultrasounds (US). Imaging method and defects to be predicted MRI Number Sensitivity Specificity of (%) (%) infants Odds ratio 95 % confidence interval p-value 50 Parenchymal lesion 19 100 79 Parenchymal lesion, excluding subependymal haemorrhages 10 82 97 171.0 13.9–2100.0 <0.001 4 27 97 14.2 1.3–155.2 0.029 14 67 85 11.0 2.5–48.4 0.001 7 58 100 16 58 76 4.5 1.1–17.7 0.031 Abnormal trigone index Reference US Parenchymal lesion Parenchymal lesion, excluding subependymal haemorrhages Abnormal trigone index MRI and/or US <0.001 51 <0.001 51 Parenchymal lesion in both 11 67 92 24.0 4.5–129.0 <0.001 Parenchymal lesion in one 21 83 72 12.7 2.4–67.6 0.002 SPET 34 Perfusion defect 16 82 70 10.3 1.8–60.4 0.010 Cranio-caudal defect 13 73 78 9.6 1.8–50.3 0.007 Cranio-caudal sensomotor or thalamic hypoperfusion 11 64 83 8.3 1.6–42.6 0.011 73 83 12.7 2.3–70.0 0.005 Reference US Parenchymal lesion 34 12 Prediction of neurosensory disability was based on abnormal brainstem dimensions in MRI and unilateral or bilateral failures in components of BAEP. Brainstem dimensions in MRI gave poor sensitivity values of 23–31%, but their specificities reached 100%. BAEP components gained more significant predictive values, with sensitivities of 79–93% and specificities of 49–91%. The significant predictive values of brainstem dimensions and BAEP for neurosensory disability are summarised in Table 13. 53 Table 13. Brainstem dimensions in magnetic resonance imaging (MRI) and absence or abnormal peak and inter-peak latencies and the amplitude ratio V/I in brainstem auditory evoked potentials (BAEPs) at term age for the prediction of neurosensory disability in very low birth weight preterm infants at a corrected age of 18 months. Imaging method and abnormal parameters Number of infants Brainstem MRI Sensitivity (%) Specificity (%) Odds ratio 95 % confidence interval 10.8 1.0–115.4 p-value 50 Sagittal dimensions Mesencephalon 23 97 Pons 31 100 0.049 Mesencephalon 31 100 0.003 Pons 23 100 0.015 Peak latency I 93 59 19.1 2.3–161.6 0.001 Peak latency III 79 68 7.6 1.8–32.6 0.005 Peak latency V 86 49 5.7 1.1–29.0 0.029 Inter-peak latency I–V 79 68 7.6 1.8–32.6 0.005 Inter-peak latency III–V 93 57 17.1 2.0–144.4 0.001 Amplitude ratio V/I 79 89 30.3 5.8–156.7 <0.001 Inter-peak latency III–V and amplitude ratio V/I 79 91 41.6 7.3–236.5 <0.001 Inter-peak latency III–V or amplitude ratio V/I 93 57 17.1 2.0–144.4 0.001 0.003 Axial dimensions BAEP 51 Prediction of permanent hearing loss succeeded best with ABR, which had a sensitivity of 100%, whereas the TEOAE and FF auditory examinations achieved only a half of this figure. The predictive values of the various hearing assessments for permanent hearing loss in the series are summarised in Table 14. Table 14. Auditory brainstem responses (ABR), transient evoked otoacoustic emissions (TEOAEs), and free-field auditory examination (FF) at term age for the prediction of permanent hearing loss in very low birth weight preterm infants at a corrected age of 18 months. Screening method ABR Bilateral fail TEOAE Bilateral fail FF Number of infants Sensitivity (%) Specificity (%) Odds ratio 95 % confidence interval p-value 100 98 50 84 5.3 0.9–33.0 0.089 50 98 42.0 3.3–536.8 0.004 51 7 <0.001 44 9 51 Fail 4 6 Discussion 6.1 Subjects This research design based on prospective follow-up of a homogeneous population proved advantageous for the comparison of imaging methods. Although the series was small in size, the infants were followed up closely and frequently without dropouts. The subjecting of a more numerous series to such a range of multi-imaging examinations would have required too much time and expense. The birth weight and gestational age limits for the subjects were selected in order to include the most vulnerable brain development period affected by adverse events during perinatal care (226, 227), in addition, CRIB scores based on data recorded within 12 hours of birth were used as an index of the performance of perinatal care (213). The fairly low scores recorded for this series testify to the balanced perinatal care provided. 6.2 Methods 6.2.1 Neurodevelopmental follow-up and outcome It is very difficult to predict clinically the outcome for VLBW preterm infants, as episodes of abnormal neurological signs, such as hyperirritability, asymmetries and central hypotonia appearing during the first year of life mostly improve during the second, and in any case vary greatly in an individual during a clinical follow-up (216, 218, 220, 228). There are many clinical implications to formulating an ambulation prognosis for a preterm infant, the basis comprises gross motor milestones, primitive reflexes, muscle tone and posture. Some of the motor milestones may be delayed due to prematurity, i.e. VLBW infants have been found to learn to walk significantly older than full-term infants (median 14 months vs. 12 months) even after correction for prematurity (229). Also, the quality of the movements made is important. Likewise, primitive reflexes may persist in cases of brain damage and become exaggerated relative to the normal state, and postural mechanisms may appear later or fail to appear at all (230). Although severe 55 CP can be diagnosed within the first year of life, its degree can be more reliably determined at 18 months of age or later, simply because of the general prevalence of hypertonicity in the VLBW preterm population (35). In order to gain accurate information to confirm the CP outcome in these infants, repeated follow-up contacts and observations were arranged so that transitory neurological findings could be passed off before the corrected age of 18 months. The developmental follow-up in this series was performed using Griffiths’ scales, in order to obtain information on general abilities, especially cognitive performance. The proportion of infants with a general quotient (GQ) less than 80 is the same as found by others, and the finding of an abnormal GQ in preterm infants with CP also agrees with the experience of others (228, 231). 6.3 Abnormalities in imaging examinations at term age and later neuromotor outcome 6.3.1 Ultrasound We choose the term age US examination as a reference for this series, because the MRI and SPET examinations were performed at that age and comparisons with US could then be conveniently assessed. By that time the preterm infants were in a suitable maturational and clinical condition to be discharged from hospital. In addition to different screening frequency protocols during neonatal care up to the time of discharge home, the definitions of outcomes, outcome ages and the characteristics of the populations have led to variations in the predictive value of US (99, 232). Very early timing of imaging may produce overestimations or underestimations of prognostically informative changes if the examinations are not repeated later (56, 99, 233, 234). It has been reported that a half of all VLBW infants have IVH, periventricular echogenicity, VM or solitary cysts in their initial cranial scans, but two thirds of these abnormalities are interpreted as normal at discharge (99). US screening at discharge or at term age has been found to be important not only for the diagnosis of PVL but also for VM, and this approach has recently been preferred for prediction purposes by other authors as well (111, 232). US can most often recognise cystic PVL, infarction and parenchymal haemorrhage, but some minor findings cannot be seen (235, 236). The sensitivity of intraparenchymal echo abnormalities or PVL in correlating with the neuropathological diagnosis has nevertheless varied between 20% and 85% with a specificity in the range 69-100% according to two reviews concerned with the 1980s’ and 1990s’ (56, 237). One third of all clinically healthy full-term infants in a postnatal ward are likely to have some US abnormalities without CP in follow-up, but some infants with white matter densities have later had low scores on Griffiths’ locomotion subscale (238). A normal cranial US for a VLBW infants usually means freedom from severe motor disability, although a 5% risk of major disabilities has been reported (239, 240). The predictive value achieved by term age cranial US in the present series of VLBW preterm infants qualified it as a reliable reference method. US in this series reached sensitivity and 56 specificity levels equal to those mentioned in previous reports, where sensitivities of 5070% and specificities of 70-90% have been quoted for the ability of parenchymal lesions in neonatal US to predict disabling CP in VLBW preterm infants (37, 108, 171, 222, 241). 6.3.2 Magnetic resonance imaging The signal intensity changes before term age due to the water and myelin content of the immature brain, as seen in the periventricular white matter in MRI being more disturbing for prediction purposes then at term age (146). There are only few studies of the ability of MRI of preterm infants around term age to predict the later outcome (145, 160). Many previous reports on conventional MRI in preterm infants during neonatal care or at term age concern selected populations, are hospital-based or include infants with different gestational ages or aetiologies (75, 78, 140, 145, 150). Some series do not include followup and outcome data (133, 150). Parenchymal lesions in MRI seemed to have better sensitivity than US for predicting CP in this series, just as foetal MRI has been shown to be better for detecting haemorrhagic and ischaemic lesions in cases where prenatal US is incomplete, doubtful or limited (128, 139). The value of MRI for predicting of outcome was underestimated at first, when only indications of myelination in MRI were compared with PVL seen in neonatal US, and other definitive information contained in the images was passed over (148, 160). Technical progress and repeated neonatal MRIs in selected populations have nevertheless yielded many useful detailed observations for comparison with neonatal US changes (147). Although MRI has been found to be more sensitive than US for the early detection of mild periventricular lesions, one case with later CP in the present series had only bilateral SEHs at first, whereas a typical PVL with ventricular enlargement and WML were seen in MRI at the age of six months. Conventional MRI, like US, may not detect all the subtlest abnormalities such as diffuse white matter injury that can be found at autopsy (141). As in other reports, infarctions were found in two cases in this series to be better visualised in MRI than in US (86). Delayed myelination at term age was not found here to predict CP. As significant perinatal disturbances and adverse consequences cause death or impairment of oligodendrocytes, they will reduce myelinogenesis (119). The most susceptible regions are those under active myelination and therefore they are different in preterm infants from those in full-term infants (75). Other prospective studies of preterm and full-term infants have shown that a delay after the age of one month is predictive of a poor outcome, and that a delay at the corrected age of one year is reflected mainly in white matter loss and irregular shape of the posterior horns in dilated ventricles, presumably representing end stage PVL in VLBW children with CP (142, 160). It may be difficult to assess myelination reliably at a very early stage because the areas to be analysed are obscured by the pathology in infants with an intraparenchymal lesion. Delayed myelination may be expected to occur at least transiently during a complicated perinatal course, as this will involve disturbances in the circulation and nutrition in areas with an active myelination process (76, 124). Normal myelination has been found at term age in preterm infants with optimal nutrition (124, 160). 57 Neither ventricular-brain indices nor extracerebral space widths were alone capable of predicting CP in this series. VM is randomly present after large-scale IVH and PVL, and volumetric MRI at term age and school age has recently shown cortical volumes to be significantly smaller and the ventricles significantly larger in prematurelly born children than in full-term ones (92, 242). The increase in the volume of the normal infant brain during the two months before term age has been found to be due to an increase in grey matter, whereas the white matter has remained fairly stable. SGA infants have been observed to have a smaller increase in grey matter volume than AGA infants (131). Shrinkage of the brainstem at term age was slight in the surviving preterm infants with later disability studied here, and the sensitivity of this feature for predicting later disability was poor. Others have described smaller ipsilateral brainstem areas as being more significant some months after the insult in preterm children with hemiplegia and Wallerian degeneration (152). Neuronal karyorrhexis has been found in autopsies of preterm infants delivered before 29 gestational weeks, not only in the pons, but also in the cerebral cortex, striate corpus, globus pallidum, thalamus, inferior olivary nucleus, and cerebellar cortex (95). 6.3.3 Single photon emission tomography The most prominent perfusion regions at term age, the sensorimotor and occipital cortices and the thalamic region, are concerned with future neuromotor development (68, 96). Although much of the neurological disability in preterm infants is damage to the white matter, lesions in the deep and intermediate white matter may extend up to the subcortical white matter and also have consequences for the cortical grey matter (92). SPET has enabled more cortical and subcortical abnormalities to be identified in neonates and children beyond those apparent in MRI, CT or US (162, 172, 175). In this series, SPET found one infant with an occipital defect and one with a thalamic defect, and CP in both, although the US scans were normal. The sensitivities and specificities of the perfusion defects observed in SPET were equally as good as those of the parenchymal lesions in US for predicting CP, and in certain cases the prediction of moderate to severe CP was much better with SPET than with US. The radiation exposure limits the use of repeated clinical examinations, however, although the overall exposure to the tracer, the effective dose equivalent (EDE), is only 0.88 mSv, while the yearly background radiation is 4.00 mSv, and a brain CT examination may reach values between 0.80 and 5.00 mSv, respectively (243, 244). As the most prominent perfusion region at term age is the sensorimotor cortical area, this series predicted CP through sensorimotor and thalamic hypoperfusion defects, which proved to be sensitive predictors. It has been found that regional cortical volumes, and predominantly sensorimotor cortical volumes in volumetric MRI, are significantly smaller in preterm children than in full-term ones at the age of 8 years, and that this is connected with a poorer cognitive outcome (242). The series should therefore be followed- up and evaluated further to find cognitive difficulties. Although semiquantification did not help in the series, semiquantitative values were compiled for healthy infants and presented. Both structural and functional maturation is 58 very rapid during the first months of life and each age group should have reference values. 6.4 Brainstem auditory evoked potentials Healthy preterm infants normally reach a state of morphological maturation in BAEP at term age which is equal to that of full-term infants, and the use of a high stimulus intensity can give the best possible response (178). Brainstem structures, including auditory relay nuclei, appear to be selectively vulnerable to ischaemic perinatal insults, especially in the superior colliculi, inferior colliculi, facial motor nuclei, vestibular nuclei and in olivary nuclei (94, 161). Such adverse events may affect impulse conduction through the brainstem, causing absent or delayed responses or decreased amplitude ratios, as some of the pathways are destroyed (188). Although BAEP is reported to of limited value for predicting the neurodevelopmental outcome (245), the present findings suggest that abnormal BAEP, being a functional abnormality, is of much greater prognostic value, with the best parameters achieving a sensitivity and specificity of about 90%. 6.5 Screening of hearing and permanent hearing loss Alongside CP and severe developmental delay, bilateral permanent hearing loss is a serious complication in preterm infants (31). Hearing is a key to the development of speech, language and cognition, and therefore early detection of hearing loss is very important (246, 247). Hearing loss, including conductive, sensorineural or mixed hearing loss, whether temporary or permanent, partial or complete, has effects on infant and childhood development, as the critical period for language learning is within the first three years. Early and repeated testing and the detection of auditory impairments by neonatal and infant follow-up examinations can help to limit developmental delay secondary to hearing loss (247). The present series shows that the developmental SQ level for hearing and speech remains low throughout the follow-up in all infants with hearing loss regardless of CP. Therefore all infants with low scores should have their hearing screened. The present series confirmed the argument that preterm infants with CP frequently have hearing loss (52). Early planning of rehabilitative services is essential, as hearing loss affects speech perception, may cause a distortion of CNS maturation, and will finally lead to auditory and language processing difficulties, and thereby to permanent disability (247). Many of the preterm infants in this series had infections that included middle ear effusions before the re-evaluation. To exclude speech and language development delay due to glue ear, this condition was treated before re-examinations. Others investigators have also encountered such difficulties with preterm infants more often than with a general population (248). Failure rates at term age were clearly higher in the present ABR, TEOAE and FF examinations than in those performed on full-term infants or reported elsewhere (195, 207). This may be attributable to the fact that the subjects in this series were high-risk 59 preterm infants (<1500 g and <34 gestational weeks at birth), and that one third of them had an abnormality in cranial US. The usefulness of TEOAE with high-risk preterm infants seems to be limited. The failure rates in the present TEOAE examinations were higher than in ABR presumably because of disturbing features of middle ear function or some other features associated with preterm infants (205). High false-positive rates in screening with TEOAE have roused concern when examining groups of high-risk neonates (197, 206, 249). In this series TEOAE failed to identify two infants with hearing loss in addition to CP, obviously because of retrocochlear damage. Others have also reported on TEOAEs in infants with normal cochleas and subsequently hearing loss behind the cochlea (201, 250, 204). FF examination alone did not seem to be very sensitive in predicting early hearing loss in preterm infants. This was the primary method of infant auditory screening at the hospital concerned here before the introduction of TEOAE in 1994. It is a BOA method that measures the acuity of perception of environmental sounds or pure tones in the whole auditory pathway and requires a response from both the auditory and motor pathways, but it involves inter-subject variability in the ratio of hearing thresholds to reaction thresholds. Preterm infants have higher behaviour thresholds for their reactions to pure tones than full-term infants, but a catch-up interval of 9 months of age has been noted (193). The best predictor of permanent hearing loss in the series was bilateral failure in ABR, possibly because of its ability to detect both cochlear and brainstem lesions. It should also be mentioned that four of the six preterm infants with permanent hearing loss in the present series had CP. A conventional BAEP examination is time-consuming, but the future automated ABR should prove to be a faster screening method. 6.6 Clinical implications As long as our efforts to prevent preterm births continue to be unsuccessful, there will be high-risk preterm infants. To be born too prematurely, and to have been exposed to inadequately distributed brain perfusion during perinatal and neonatal life are major risks with regard to CP. We do not know what an infant has suffered, however, or how much this will contribute to the development of a later disability. Although the plasticity of the developing nervous system is enormous an uneventful neonatal period cannot guarantee normality. A structural neonatal clinical neurological examination requires experienced staff, takes a considerable time and frequently has to be repeated, and in any case the result depends very much on the condition and age of the infant. Its sensitivity in predicting the outcome will still be uncertain, and a follow-up will be needed. Concern over the proportion of preterm survivors with disabilities has led us to study the possibilities for identifying as early as possible the structural and functional lesions which cause major difficulties for preterm infants at a later stage and to focus resources on these. Any lesion in a living preterm infant that involves the brain parenchyma, including haemorrhagic lesions, porencephalic cysts and cystic leukomalacia, or intraventiricular haemorrhage complicated by ventricular dilatation, must be defined as a major cerebral 60 abnormality and can frequently be expected to lead to neuromotor and sensory disabilities. Lesions in the brainstem and the auditory pathways of surviving preterm infants are less often assessed. Although US, MRI and SPET are based on different phenomena and may predict different entities, these methods were used in an attempt to identify changes in the brain that might be predictive of the neuromotor outcome. MRI at term age was more sensitive to parenchymal changes than US. Although the main prediction end point for the US, MRI and SPET examinations may be the motor outcome, not only white matter damage should be highlighted. As lesions of the grey matter in cortical areas and the thalamus are often reflections of white matter loss or infarcts, it seems that perfusion defects in SPET can achieve a moderate predictive value with regard to motor disability. Similarly, germinal matrix area abnormalities may be connected with more diffuse, invisible white matter injury, and the deep grey matter areas (the thalamus and basal ganglia) may be damaged with functional impairments or disabilities later in childhood, adolescence and adulthood. Brainstem lesions in MRI of surviving preterm infants remained of low-significance although the mean diameters of the brainstem were smaller in the infants with neurosensory disability than in those with a normal outcome. Thus brainstem MRI cannot be used as the sole predictor of disabilities. BAEP, being a functional measure, achieved a much better predictive value. Out of the tests used for auditory screening in this series, TEOAE was disturbed far too often when applied to preterm infants and FF identified only a half of the disabled cases, thus attaining poorer predictive values than ABR. This latter identified all the preterm infants with permanent hearing loss, possibly due to its ability to detect retrocochlear damage, which may affect preterm infants more often than full-term ones. ABR should therefore be recommended for the term age screening of hearing in preterm infants. 7 Conclusions 1. Parenchymal lesions in brain MRI at term age are very sensitive, and better than in US, for predicting motor disability in VLBW preterm infants. A brain MRI examination at term age can therefore be recommended for VLBW preterm infants whenever available. 2. Brain perfusion SPET at term age predicts CP in VLBW preterm infants with the same accuracy as US. SPET distinguishes the most severe CP forms very well, but the clinical use of the method is restricted by the radiation exposure involved. 3. The brainstem dimension changes seen in MRI at term age were so unremarkable that an abnormal neurosensory outcome cannot be predicted on these grounds alone in VLBW preterm infants, whereas abnormalities in BAEP predict neurosensory disability relatively well. 4. The predictive value of ABR at term age was better than that of TEOAE or FF for identifying cases of permanent hearing loss among VLBW preterm infants. The false failure rate in TEOAE was high in preterm infants. TEOAE failed to identify hearing loss in two infants with CP, possibly because a defect may be due to retrocochlear damage. TEOAE alone is not so applicable to the neonatal screening of hearing in VLBW preterm infants as in full-term infants. 8 References 1. Koskinen R, Meriläinen J, Gissler M & Virtanen M (1999) Finnish Perinatal Statistics 1997– 1978. National Research and Development Centre for Welfare and Health (STAKES), Helsinki. 2. Bregman J & Kimberlin LVS (1993) Developmental outcome in extremely premature infants. Pediatr Clin North Am 40: 937–953. 3. Cartlidge PHT & Steward JH (1997) Survival of very low birthweight and very preterm infants in a geographically defined population. Acta Paediatr 86: 105–110. 4. Svenningsen NW, Björklund K & Lindroth M (1997) Changing trend in perinatal management and outcome of extremely low birthweight (ELBW) infants. Acta Paediatr 422: 89–91. 5. Lemons JA, Bauer CR, Oh W, Korones SB, Papile L-A, Stoll BJ, Verter J, Temprosa M, Wright LL, Ehrenkranz RA, Fanaroff AA, Stark A, Carlo W, Tyson JE, Donovan EF, Shankaran S & Stevenson DK (2001) Very low birth weight outcomes of the National Institute of Child Health and Human Development Neonatal Research Network, January 1995 through December 1996. Pediatrics 107 (1): URL: http://www.pediatrics.org/cgi/content/full/107/1/e1. 6. Leonard CH & Piecuch RE (1997) School age outcome in low birth weight preterm infants. Semin Perinatol 21: 240–253. 7. Hack M & Fanaroff AA (2000) Outcomes of children of extremely low birthweight and gestational age in the 1990s. Semin Neonatol 5: 89–106. 8. Lee K, Kim B, Khosnood B, Hsieh H, Chen T-J, Herschel M & Mittendorf R (1995) Outcome of very low birth weight infants in industrialized countries: 1947–1987. Am J Epidemiol 141: 1188–1193. 9. Finnström O, Otterblad Olausson P, Sedin G, Serenius F, Svenningsen N, Thiringer K, Tunell R & Wesström G (1998) Neurosensory outcome and growth at three years in extremely low birthweight infants: Follow-up results from the Swedish national prospective study. Acta Paediatr 87: 1055–1060. 10. Vohr BR & Msall ME (1997) Neuropsychological and functional outcomes of very low birth weight infants. Semin Perinatol 21: 202–220. 11. O´Shea TM, Preisser JS, Klinepeter KL & Dillard RG (1998) Trends in mortality and cerebral palsy in a geographically based cohort of very low birth weight neonates born between 1982 to 1994. Pediatrics 101: 642–647. 12. Cooke RWI (1999) Trends in incidence of cranial ultrasound lesions and cerebral palsy in very low birthweight infants 1982–93. Arch Dis Child Fetal Neonatal Ed 80: F115–F117. 13. The International Neonatal Network, Scottish Neonatal Consultants, Nurses Collaborative Study Group (2000) Risk adjusted and population based studies of the outcome for high risk infants in Scotland and Australia. Arch Dis Child Fetal Neonatal Ed 82: F118–F123. 63 14. Tommiska V, Heinonen K, Ikonen Sami, Kero Pentti, Pokela M-L, Renlund M, Virtanen M & Fellman V (2001) A national short-term follow-up study of extremely low birth weight infants born in Finland in 1996–1997. Pediatrics 107 (1): URL: http://www.pediatrics.org/cgi/content/ full/107/1/e2. 15. Colver AF, Gibson M, Hey EN, Jarvis SN, Mackie PC & Richmond R for the North of England Collaborative Cerebral Palsy Survey (2000) Increasing rates of cerebral palsy across the severity spectrum in north-east England 1964–1993. Arch Dis Child Fetal Neonatal Ed 83: F7– F12. 16. Hack M, Wilson-Costello D, Friedman H, Taylor GH, Schluchter M & Fanaroff AA (2000) Neurodevelopment and predictors of outcomes of children with birth weights of less than 1000 g 1992–1995. Arch Pediatr Adolesc Med 154: 725–731. 17. Wood NS, Marlow N, Costeloe K, Gibson AT & Wilkinson AR (2000) Neurologic and developmental disability after extremely preterm birth. EPICure Study Group. N Engl J Med 343: 429–430. 18. Escobar GJ, Littenberg B & Petitti DB (1991) Outcome among surviving very low birthweight infants: A meta-analysis. Arch Dis Child 66: 204–211. 19. Borradori C, Fawer C-L, Buclin T & Calame A (1997) Risk factors of sensorineural hearing loss in preterm infants. Biol Neonate 71: 1–10. 20. Holt J, Weidle B, Kaaresen PI, Fundingsrud HP & Dahl LB (1998) Very low birthweight infants: Outcome in a sub-Arctic population. Acta Paediatr 87: 446–451. 21. Dunin-W¹sowicz D, Rowecka-Trzebicka K, Milewska-Bobula B, Kassur-Siemieñska B, Bauer A, Idzik M, Lipka B & Marciñski P (2000) Risk factors for cerebral palsy in very low birthweight infants in the 1980s and 1990s. J Child Neurol 15: 417–420. 22. Olsen P, Vainionpää L, Pääkkö E, Korkman M, Pyhtinen J & Järvelin M-R (1998) Psychological findingds in preterm children related to neurologic status and magnetic resonance imaging. Pediatrics 102: 329–336. 23. Stewart AL, Rifkin L, Amess PN, Kirbride V, Townsend JP, Miller DH, Lewis SW, Kingsley DPE, Moseley IF, Foster O & Murray RM (1999) Brain structure and neurocognitive and behavioural function in adolescents who were born very preterm. Lancet 353: 1653–1657. 24. Stjernquist K & Svenningsen NW (1999) Ten-year follow-up of children born before 29 gestational weeks: health, cognitive development, behaviour and school achievement. Acta Pediatr 88: 557–562. 25. Saigal S (2000) Follow-up of very low birth weight babies to adolescence. Semin Neonatol 5: 107–118. 26. Weindling AM (2000) Intervention after brain injury to reduce disability. Semin Neonatol 5: 53–60. 27. Volpe JJ (1995) Neurological evaluation; Hypoxic-ischemic encephalopathy; and Intracranial hemorrhage. In: JJ Volpe (ed) Neurology of the newborn. Third edition. W.B. Sounders Company, Philadelphia, Pennsylvania p 95–463. 28. Mercuri E, von Siebenthal K, Daniëls H, Guzzetta F & Casaer P (1994) Multimodality evoked responses in the neurological assessment of the newborn. Eur J Pediatr 153: 622–631. 29. De Vries LS (1996) Neurological assessment of the preterm infant. Acta Paediatr 85: 765–771. 30. Ylppö A (1913) Icterus Neonatorum und Gallenfarbstoffsekretion beim Foetus und Neugeboren. Zeitschrift für Kinderheilkunde 9: 208–374. 31. Perinatal Audit (1996) A report produced for the European Association of Perinatal Medicine. Prenatal and Neonatal Med 1: 162–194. 32. ICD-10 Tautiluokitus (1999) Finnish version of the International Statistical Classification of Diseases and Related Health Problems, Tenth Revision in Geneva 1992 Sosiaali- ja terveysalan tutkimus- ja kehittämiskeskus. 2nd Ed. Ro-Offset Oy Turenki, p 255–258, 302–304, 338–339, 564–565. 64 33. WHO (1980) International classification of impairments, disabilitities and handicaps. Geneva, WHO. 34. Hagberg B, Hagberg G & Olow I (1975) The changing panorama of cerebral palsy in Sweden 1954–1970. Acta Paediatr Scand 64: 187–192. 35. Hagberg B & Hagberg G (1993) The origins of cerebral palsy. Recent advantages in Paediatrics 11: 67–83. 36. Lindström K & Bremberg (1997) The contribution of developmental surveillance to early detection of cerebral palsy. Acta Paediatr 86: 736–739. 37. Stewart A & Kirkbride V (1996) Very preterm infants at fourteen years: Relationship with neonatal ultrasound brain scans and neurodevelopmental status at one year. Acta Paediatr 416: 44–47. 38. Vohr BR, Wright LL, Dusick AM, Mele L, Verter J, Steichen JJ, Simon NP, Wilson DC, Broyles S, Bauer CR, Delaney-Black V, Yolton KA, Fleisher BE, Papile L-A & Kaplan MD (2000) Neurodevelopmental and functional outcomes of extremely low birth weight infants in the National Institute of Child Health and Human Development Neonatal Research Network, 1993–1994. Pediatrics 105: 1216–1226. 39. WHO (1991) Grades of hearing impairment. Hearing Network News no 1, September. 40. Volpe JJ (1998) Neurologic outcome of prematurity; Neurological review. Arch Neurol 55: 297–300. 41. Pharoah POD, Cooke T, Johnson MA, King R & Mutch L (1998) Epidemiology of cerebral palsy in England and Scotland, 1984–9. Arch Dis Child Fetal Neonatal Ed 79: F21–F25. 42. Doyle LW for The Victorian Infant Collaborative Study Group (1997) Improvind outcome into the 1990s for infants weighting 500–999 g at birth. Arch Dis Child Fetal Neonatal Ed 77: F91– F94. 43. Piecuch RE, Leonard CH & Cooper BA (1998) Infants with birth weight 1,000–1,499 grams born in three time periods: Has outcome changed over time? Clin Pediatr 37: 537–546. 44. Järvenpää A-L, Virtanen M & Pohjavuori M (1991) The outcome of extremely low birthweight infants. Ann Med 23: 699–704. 45. Lago P, Freato F, Bettiol T, Chiandetti L, Vianello A & Zaramella P (1999) Is the CRIP score (clinical risk index for babies) a valid tool in predicting neurodevelopmental outcome in extremely low birth weight infants? Biol Neonate 76: 220–227. 46. Hagberg B, Hagberg G, Olow I & von Wendt L (1996) The changing panorama of cerebral palsy in Sweden. VI. Prevalence and origin in the birth year period 1987–90. Acta Paediatr 85: 954–60. 47. Salokorpi T, Rajantie I, Viitala J, Rita H & von Wendt L (1999) Does perinatal hypocarbia play a role in the pathogenesis of cerebral palsy? Acta Paediatr 88: 571–575. 48. Salokorpi T, Sajaniemi N, Hällback H, Kari A, Rita H & von Wendt L (1997) Randomized study of the effect of antenatal dexamethasone on growth and development of premature children at the corrected age of 2 years. Acta Paediatr 86: 294–298. 49. Spinillo A, Capuzzo E, Orcesi S, Stronati M, Di Mario M & Fazzi E (1997) Antenatal and delivery risk factors simultaneously associated with neonatal death and cerebral palsy in peterm infants. Early Hum Dev 48: 81–91. 50. Heiser A, Grimmer I, Metze B & Obladen M (1995) Parent’s estimation of psychomotor development in very low birthweight (VLBW) infants. Early Hum Dev 42: 131–139. 51. Bührer C, Grimmer I, Metze B & Obladen M (2000) The CRIB (clinical risk index for babies) score and neurodevelopmental impairment at one year corrected age in very low birth weight infants. Intensive Care Med 26: 325–329. 52. Marlow ES, Hunt LP & Marlow N (2000) Sensorineural hearing loss and prematurity. Arch Dis Child Fetal Neonatal Ed 82: F141–F144. 65 53. Herrgård E, Karjalainen S, Martikainen A & Heinonen K (1995) Hearing loss at the age of 5 years of children born preterm – a matter of definition. Acta Paediatr 84: 1160–1164. 54. Veen S, Sassen ML, Schreuder AM, Ens-Dokkum MH, Verloove-Vanhorick SP, Brand R, Grote JJ & Ruys JH (1993) Hearing loss in very preterm and very low birthweight infants at the age of 5 years in a nationwide cohort. Int J Pediatr Otorhinolaryngol 26: 11–28. 55. Murphy DJ, Squier MV, Hope PL, Sellers S & Johnson A (1996) Clinical associations and time of onset of cerebral white matter damage in very preterm babies. Arch Dis Child Fetal Neonatal Ed 75: F27–F32. 56. Paneth N, Rudelli R, Kazam E & Monte W (1994) Brain damage in the preterm infant. Clinics in developmental medicine No.131. Mac Keith press by The Spastics Society, London, England. 57. Volpe JJ (1997) Brain injury in the premature infant. Neuropathology, clinical aspects, pathogenesis, and prevention. Clin Perinatol 24: 567–587. 58. Takashima S, Iida K & Deguchi K (1995) Periventricular leukomalacia, glial development and myelination. Early Hum Dev 43: 177–184. 59. Perlman JM (1998) White matter injury in the preterm infant: An important determination of abnormal neurodevelopment outcome. Early Hum Dev 53: 99–120. 60. Boylan GB, Young K, Panerai RB, Rennie JM & Evans DH (2000) Dynamic cerebral autoregulation in sick newborn infants. Pediatr Res 48: 12–17. 61. Inder TE & Volpe JJ (2000) Mechanisms of perinatal brain injury. Semin Neonatol 5: 3–16. 62. Greisen G (1992) Ischaemia of the preterm brain. Biol Neonate 62: 243–247. 63. Guzzetta F (1991) Ischemic and hemorrhagic cerebral lesions of the newborn. Childs Nerv Syst 7: 417–424. 64. Miyawaki T, Matsui K & Takashima S (1998). Developmental characteristics of vessel density in the human fetal and infant brains. Early Hum Dev 53: 65–72. 65. Børch K & Greisen G (1998) Blood flow distribution in the normal human preterm brain. Pediatr Res 43: 28–33. 66. Coughtrey H, Rennie JM & Evans DH (1992) Postnatal evolution of slow variability in cerebral blood flow velocity. Arch Dis Child 67: 412–415. 67. Anthony MY, Evans DH & Levene MI (1993) Neonatal cerebral blood flow velocity responses to changes in posture. Arch Dis Child 69: 304–308. 68. Rubinstein M, Denays R, Ham HR, Piepsz A, Van Pachterbeke T, Haumont D & Noël P (1989) Functional imaging of brain maturation in humans using iodine-123 iodoamphetamine and SPECT. J Nucl Med 30: 1982–1985. 69. Meek JH, Tyszczuk L, Elwell CE & Wyatt JS (1998). Cerebral blood flow increases over the first three days of life in extremely preterm neonates. Arch Dis Child Fetal Neonatal Ed 78: F33–F37. 70. Tanaka S, Mito T & Takashima S (1995) Progress of myelination in the human fetal spinal nerve roots, spinal cord and brainstem with myelin basic protein immunohistochemistry. Early Hum Dev 41: 49–59. 71. Resch B, Vollaard E, Maurer U, Haas J, Rosegger H & Müller W (2000) Risk factors and determinants of neurodevelopmental outcome in cystic periventricular leukomalacia. Eur J Pediatr 159: 663–670. 72. Wu YW & Colford JM (2000) Chorioamnionitis as a risk factor for cerebral palsy: A metaanalysis. JAMA 284: 1417–1424. 73. Dammann O & Leviton A (2000) Brain damage in preterm newborns: Biological response modification as a strategy to reduce disabilities. J Pediatr 136: 433–438. 74. Wheater M & Rennie JM (2000) Perinatal infection is an important risk factor for cerebral palsy in very low birthweight infants. Dev Med Child Neurol 42: 364–367. 66 75. Sie LTL, van der Knaap MS, van Wezel-Meijler G & Valk J (1997) MRI assessment of myelination of motor and sensory pathways in the brain of preterm and term-born infants. Neuropediatrics 28: 97–105. 76. McArdle CB, Richardson CJ, Nicholas DA, Mirfakhraee M, Hayden CK & Amparo EG (1987) Developmental features of the neonatal brain: MR imaging. Part I. Gray-white matter differentiation and myelination. Radiology 162: 223–229. 77. Barkovich AJ, Kjos BO, Jackson DE & Norman D (1988) Normal maturation of the neonatal and infant brain: MR imaging at 1.5 T. Radiology 166: 173–180. 78. Battin MR, Maalouf EF, Counsell SJ, Herlihy AH, Rutherford MA, Azzopardi D & Edwards AD (1998) Magnetic resonance imaging of the brain in very preterm infants: Visualization of the germinal matrix, early myelinaiton, and cortical folding. Pediatrics 101: 957–962. 79. Papile L-A, Burstein J, Burstein R & Koffler H (1978) Incidence and evolution of subependymal and intaventricular hemorrhage: A study of infants with birth weights less than 1,500 gm. J Pediatr 92: 529–534. 80. Tortorolo G, Luciano R, Papacci P & Tonelli T (1999) Intraventricular hemorrhage: past, present and future, focusing on classification, pathogenesis and prevention. Childs Nerv Syst 15: 652–661. 81. Ment LR, Vohr B, Allan W, Westerveld M, Katz KH, Schneider KC & Makuch RW (1999) The etiology and outcome of cerebral ventriculomegaly at term in very low birth weight preterm infants. Pediatrics 104: 243–248. 82. Roland EH & Hill A (1997) Intraventricular hemorrhage and posthemorrhagic hydrocephalus. Current and potential future interventions. Clin Perinatol 24: 589–605. 83. Kuban K, Sanocka U, Leviton A, Allred E, Pagano M, Damman O, Share J, Rosenfeld D, Abiri M, DiSalvo D, Doubilet P, Kairam R, Kazam E, Kirpekar M & Schonfeld S (1999) White matter disorders of prematurity: Association with intraventricular hemorrhage and ventriculomegaly. J Pediatr 134: 539–546. 84. Skullerud K & Westre B (1986) Frequency and prognostic significance of germinal matrix hemorrhage, periventricular leukomalacia, and pontosubicular necrosis in preterm neonates. Acta Neuropathol 70: 257–261. 85. De Vries LS, Groenendaal F, van Haastert IC, Eken P, Rademaker KJ & Meiners LC (1999) Asymmetrical myelination of the posterior limb of the internal capsule in infants with periventricular haemorrhagic infarction: An early predictor of hemiplgia. Neuropediatrics 30: 314–319. 86. De Vries LS, Groenendaal F, Eken P, van Haastert IC, Rademaker KJ & Meiners LC (1997) Infarcts in the vascular distribution of the middle cerebral artery in preterm and fullterm infants. Neuropediatrics 28: 88–96. 87. Van Wezel-Meijler G, Hummel TZ, Oosting J, de Groot L, Sie LTL, Huisman J, Lafeber HN & van der Knaap MS (1999) Unilateral thalamic lesion in premature infants: Risk factors and short-term prognosis. Neuropediatrics 30: 300–306. 88. Banker BQ & Larroche J-C (1962) Periventricular leukomalacia of infancy; A forum of neonatal anoxic encephalopathy. Arch Neurol 7: 386–410. 89. Iida K, Takashima S & Takeuchi Y (1992) Etiologies and distribution of neonatal leukomalacia. Pediatr Neurol 8: 205–209. 90. De Vries LS, Dubowitz V, Lary S, Whitelaw A, Dubowitz LMS, Kaiser A, Silverman M & Wigglesworth JS (1985) Predictive value of cranial ultrasound in the newborn baby: a reappraisal. Lancet ii: 137–143. 91. Eken P, de Vries LS, van der Graaf Y, Meiners LC & van Nieuwenhuizen O (1995) Hemorrhagic-ischemic lesions of the neonatal brain: correlation between cerebral visual impairment, neurodevelopmental outcome and MRI in infancy. Dev Med Child Neurol 37: 41– 55. 67 92. Inder TE, Hüppi PS, Warfield S, Kikinis R, Zientara GP, Barnes PD, Jolesz F & Volpe JJ (1999) Periventricular white matter injury in the premature infant is followed by reduced cerebral gray matter volume at term. Ann Neurol 46: 755–760. 93. Kuban KCK & Leviton A (1994) Cerebral palsy. N Engl J Med 330: 188–195. 94. Takashima S, Mito T, Houdou S & Ando Y (1989) Relationship between periventricular hemorrhage, leukomalacia and brainstem lesions in prematurely born infants. Brain Dev 11: 121–124. 95. Sohma O, Mito T, Mizuguchi M & Takashima s (1995) The prenatal age critical for the development of the pontosubicular necrosis. Acta Neuropathol 90: 7–10. 96. Denays R, Ham H, Tondeur M, Piepsz A & Noël P (1992) Detection of bilateral and symmetrical anomalies in technetium-99m-HMPAO brain SPECT studies. J Nucl Med 33: 485–490. 97. Hüppi PS, Schucknecht B, Boesch C, Bossi E, Felblinger J, Fusch C & Herschkowitz N (1996) Structural and neurobehavioral delay in postnatal brain development of preterm infants. Pediatr Res 39: 895–901. 98. Taylor MJ, Saliba E & Laugier J (1996) Use of evoked potentials in preterm neonates. Arch Dis Child Fetal Neonatal Ed 74: F70–F76. 99. Perlman JM & Rollins N (2000) Surveillance protocol fot the detection of intracranial abnormalities in premature neonates. Arch Pediatr Adolesc Med 154: 822–826. 100. Helmke K, Winkler P & Kock C (1987) Sonographic examination of the brain stem area in infants. Pediatr Radiol 17: 1–6. 101. Graham M, Trounce JQ, Levene MI & Rutter N (1987) Prediction of cerebral palsy in very low birthweight infants: Prospective ultrasound study. Lancet ii: 593–596. 102. Sinha SK, D'Souza SW, Rivlin E & Chiswick ML (1990) Ischaemic brain lesions diagnosed at birth in preterm infants: Clinical events and developmental outcome. Arch Dis Child 65: 1017– 1020. 103. De Vries LS, Eken P, Groenendaal F, Rademaker KJ, Hoogervorst B & Bruinse HW (1998) Antenatal onset of haemorrhagic an/or ischaemic lesions in preterm infants: Prevalence and associated obstetric variables. Arch Dis Child Fetal Neonatal Ed 78: F51–F56. 104. Lai FF & Tsou KY (1999) Transient periventricular echodensities and developmental outcome in preterm infants. Pediatr Neurol 21: 797–801. 105. Vohr B, Allan WC, Scott DT, Katz KH, Schneider KC, Makuch RW & Ment LR (1999) Earlyonset intraventricular hemorrhage in preterm neonates: Incidence of neurodevelopmental handicap. Semin Perinatol 23: 212–217. 106. Larcos G, Gruenewald SM & Lui K (1994) Neonatal subependymal cysts detected by sonography: Prevalence, sonographic findings, and clinical significance. AJR Am J Roentgenol 162: 953–956. 107. Carson SC, Hertzberg BS, Bowie JD & Burger PC (1990) Value of sonography in the diagnosis of intracranial hemorrhage and periventricular leukomalacia: A postmortem study of 35 cases. AJNR Am J Neuroradiol 11: 677–683. 108. Pinto-Martin JA, Riolo S, Cnaan A, Holzman C, Susser MW & Paneth N (1995) Cranial ultrasound prediction of disabling and nondisabling cerebral palsy at age two in a low birth weight population. Pediatrics 95: 249–254. 109. De Vries LS, Rademaker KJ, Groenendaal F, Eken P, van Haastert IC, Vandertop WP, Gooskens R & Meiners LC (1998) Correlation between neonatal cranial ultrasound, MRI in infancy and neurodevelopmental outcome in infants with a large intraventricular haemorrhage with or without unilateral parenchymal involvement. Neuropediatrics 29: 180–188. 110. Govaert P, Matthys E, Zecic A, Roelens F, Oostra A & Vanzieleghem B (2000) Perinatal cortical infarction within middle cerebral artery trunks. Arch Dis Child Fetal Neonatal Ed 82: F59–F63. 68 111. Townsend SF, Rumack CM, Thilo EH, Merenstein GB & Rosenberg AA (1999) Late neurosonographic screening is important to the diagnosis of periventricular leukomalacia and ventricular enlargement in preterm infants. Pediatr Radiol 29: 347–352. 112. Yamamoto N, Utsu M, Serizawa M, Ohki S, Murakoshi T, Seguchi M, Iwase K & Maeda K (2000) Neonatal periventricular leukomalacia preceded by fetal periventricular echodensity. Fetal Diagn Ther 15: 198–208. 113. Ito T, Kadowaki K, Takahashi H, Nagata N, Makio A & Terakowa N (1997) Clinical features of and cardiotocographic findings for premature infants with antenatal periventricular leukomalacia. Early Hum Dev 47: 195–201. 114. Perlman JM, Risser R & Broyles RS (1996) Bilateral cystic periventricular leukomalacia in the premature infant: Associated risk factors. Pediatrics 97: 822–827. 115. Virkola K (1988) The lateral ventricle in early infancy. thesis, Univ Helsinki. p 51–94. 116. Poland RL, Slovis TL & Shankaran S (1985) Normal values for ventricular size as determined by real time sonographic techniques. Pediatr Radiol 15: 12–14. 117. Pellicer A, Cabañas F, García-Alix A, Rodriguez JP & Quero J (1993) Natural history of ventricular dilatation in preterm infants: prognostic significance. Pediatr Neurol 9: 108–114. 118. Weisglas-Kuperus N, Baerts W, Fetter WPF & Sauer PJJ (1992) Neonatal cerebral ultrasound, neonatal neurology and perinatal conditions as predictors of neurodevelopmental outcome in very low birthweight infants. Early Hum Dev 31: 131–148. 119. Leviton A & Gilles F (1996) Ventriculomegaly, delayed myelination, white matter hypoplasia, and periventricular leukomalacia: How are they related? Pediatr Neurol 15: 127–136. 120. Saukkonen A-L (1989) Childhood hydrocephalus. thesis, Acta Univ Oulu D p 15–18. 121. De Vries LS, Dubowitz LMS, Pennock JM & Bydder GM (1989) Extensive cystic leucomalacia: Correlation of cranial ultrasound, magnetic resonance imaging and clinical findings in sequential studies. Clin Radiol 40: 158–166. 122. Chamnanvanakij S Rogers CG Luppino C Broyles SR Hickman J Perlman JM (2000) Linear hyperechogenicity within the basal ganglia and thalamus of preterm infants. Pediatr Neurol 23: 129–133. 123. Hashimoto T, Tayama M, Miyazaki M & Kuroda Y (1991) Development of the brainstem: Assessment by MR Imaging. Neuropediatrics 22: 139–146. 124. Konishi Y, Hayakawa K, Kuriyama M, Fujii Y, Sudo M, Konishi K & Ishii Y (1993) Developmental features of the brain in preterm and fullterm infants on MR imaging. Early Hum Dev 34: 155–162 125. McArdle CB, Richardson CJ, Hayden CK, Nicholas DA, Crofford MJ & Amparo EG (1987) Abnormalities of the neonatal brain: MR imaging. Part I. Intracranial hemorrhage. Radiology 163: 387–394. 126. McArdle CB, Richardson CJ, Nicholas DA, Mirfakhraee M, Hayden CK & Amparo EG (1987) Developmental features of the neonatal brain: MR imaging. Part II. Ventricular size and extracerebral space. Radiology 162: 230–234. 127. Martin E, Boesch C, Zuerrer M, Kikinis R, Molinari L, Kaelin P, Boltshauser E & Duc G (1990) MR imaging of brain maturation in normal and developmentally handicapped children. J Comput Assist Tomogr 14: 685–692. 128. Sonigo PC, Rypens FF, Carteret M, Delezoide A-L & Brunelle FO (1998) MR imaging of fetal cerebral anomalies. Pediatr Radiol 28: 212–222. 129. Dietrich RB, Bradley WG, Zaragoza IV, EJ, Otto RJ, Taira RK, Wilson GH & Kangarloo H (1988) MR evaluation of early myelination patterns in normal and developmentally delayed infants. AJNR Am J Neuroradiol 9: 69–76. 130. Ballesteros MC, Hansen PE & Soila K (1993) MR imaging of the developing human brain. Radiographics 13: 611–622. 69 131. Toft PB, Leth H, Ring PB, Peitersen B, Lou H & Henriksen O (1995) Volumetric analysis of the normal infant brain and in intrauterine growth retardation. Early Hum Dev 43: 15–29. 132. Van der Knaap MS, van Wezel-Meijler G, Barth PC, Barkhof F, Adèr HJ & Valk J (1996) Normal gyration and sulcation in preterm and term neonates: Appearance on MR images. Radiology 200: 389–396. 133. Maalouf EF, Duggan PJ, Rutherford MA, Counsell SJ, Fletcher AM, Battin M, Cowan F & Edwards AD (1999) Magnetic resonance imaging of the brain in a cohort of extremely preterm infants. J Pediatr 135: 351–357. 134. Antonelli AR, Bonfioli F, Nicolai P & Peretti G (1988) The relationship of head and brainstem size to main parameters of ABR in the developmental age and in adults. Acta Otolaryngol 105: 587–590. 135. Hayakawa K, Konishi Y, Matsuda T, Kuriyama M, Konishi K, Yamashita K, Okumura R & Hamanaka D (1989) Development and aging of brain midline structures: Assessment with MR imaging. Radiology 172: 171–177. 136. Raininko R, Autti T, Vanhanen SL, Ylikoski A, Erkinjuntti T & Santavuori P (1994) The normal brain stem from infancy to old age; A morphometric study. Neuroradiology 36: 364– 368. 137. Hittmair K, Kramer J, Rand T, Bernert G & Wimberger D (1996) Infratentorial brain maturation: a comparison of MRI at 0.5 and 1.5 T. Neuroradiology 38: 360–366. 138. Martin E, Krassnitzer S, Kaelin P & Boesch C (1991) MR imaging of the brainstem: normal postnatal development. Neuroradiology 33: 391–395. 139. Garel C, Brisse H, Sebag G, Elmaleh M, Oury J-F & Hassan M (1998) Magnetic resonsnce imaging of the fetus. Pediatr Radiol 28: 201–211. 140. Schouman-Claeys E, Henry-Feugeas M-C, Roset F, Larroche J-C, Hassine D, Sadik J-C, Frija G & Gabilan JC (1993) Periventricular leukomalacia: Correlation between MR imaging and autopsy findings during the first 2 months of life. Radiology 189: 59–64. 141. Felderhoff-Mueser U, Rutherford MA, Squier WV, Cox Ph, Maalouf EF, Counsell SJ, Bydder GM & Edwards AD (1999) Relationship between MR Imaging and histopathologic findings of the brain in extremely sick preterm infants. AJNR Am J Neuroradiol 20: 1349–1357. 142. Skranes JS, Vik T, Nilsen G, Smevik O, Andersson HW & Brubakk AM (1993) Cerebral magnetic resonance imaging and mental and motor function of very low birth weight children at six years of age. Neuropediatrics 24: 256–262. 143. Okumura A, Hayakawa F, Kato T, Kuno K & Watanabe K (1997) MRI findings in patients with spastic cerebral palsy. I: Correlation with gestational age at birth. Dev Med Child Neurol 39: 363–368. 144. Okumura A, Kato T, Kuno K, Hayakawa F & Watanabe K (1997) MRI findings in patients with spastic cerebral palsy. II: Correlation with type of cerebral palsy. Dev Med Child Neurol 39: 369–372. 145. Aida N, Nishimura G, Hachiya Y, Matsui K, Takeuchi M & Itani Y (1998) MR imaging of erinatal rain damage: Comparison of clinical outcome with initial and follow-up MR finding. AJNR Am J Neuroradiol 19: 1909–1921. 146. Van Wezel-Meijler G, van der Knaap MS, Sie LTL, Oosting J, Taest van Amerongen AHM, Cranendonk A & Lafeber HN (1998) Magnetic resonance imaging of the brain in premature infants during the neonatal period. Normal phenomena and reflection of mild ultrasound abnormalities. Neuropediatrics 29: 89–96. 147. Van Wezel-Meijler G, van der Knaap MS, Oosting J, Sie LTL, de Groot L, Huisman J, Valk J & Lafeber HN (1999) Predictive value of neonatal MRI as compared to ultrasound in premature infants with mild periventricular white matter changes. Neuropediatrics 30: 231–238. 70 148. Guit GL, van de Bor M, den Ouden L & Wondergem JHM (1990) Prediction of neurodevelopmental outcome in the preterm infant: MR-staged myelination compared with cranial US. Radiology 175: 107–109. 149. Gomori JM, Grossman RI, Goldberg HI, Hackney DB, Zimmerman RA & Bilaniuk LT (1987) High-field spin-echo MR imaging of superficial and subependymal siderosis secondary to neonatal intraventricular hemorrhage. Neuroradiology 29: 339–342. 150. Keeney SE, Adcock EW & McArdle CB (1991) Prospective observations of 100 high-risk neonates by high-field (1.5 Tesla) magnetic resonance imaging of the central nervous system: I. Intraventricular and extracerebral lesions. Pediatrics 87: 421–430. 151. Zuerrer M, Martin E & Boltshauser E (1991) MR imaging of intracraniel hemorrhage in neonates and infants at 2.35 Tesla. Neuroradiology 33: 223–229. 152. Bouza H, Dubowitz LMS, Rutherford M & Pennock LM (1994) Prediction of outcome in children with congenital hemiplegia: A magnetic resonance imaging study. Neuropediatrics 25: 60–66. 153. De Vries LS, Connell JA, Dubowitz LMS, Oozeer RC, Dubowitz V & Pennock JM (1987) Neurological, electrophysiological and MRI abnormalities in infants with extensive cystic leukomalacia. Neuropediatrics 18: 61–66. 154. Baenziger O, Maritin E, Steinlin M, Good M, Largo R, Burger R, Fanconi S, Duc G, Buchli R, Rumpel H & Boltshauser E (1993) Early pattern recognition in severe perinatal asphyxia: A prospective MRI study. Neuroradiology 35: 437–442. 155. Groenendaal F, van der Grond J, Eken P, van Haastert I, Rademaker KJ, Toet MC & de Vries LS (1997) Early cerebral proton MRS and neurodevelopmental outcome in infants with cystic leukomalacia. Dev Med Child Neurol 39: 373–379. 156. Sugita K, Takeuchi A, Iai M & Tanabe Y (1989) Neurologic sequelae and MRI in low-birth weight patients. Pediatr Neurol 5: 365–369. 157. Yokochi K (1997) Thalamic lesions revealed by MR associated with periventricular leukomalacia and clinical profiles of subjects. Acta Paediatr 86: 493–496. 158. Van de Bor M, Guit GL, Schreuder AM, van Bell F, Wondergem J, den Ouden L & Vielvoye GJ (1990) Does very preterm birth impair myelination of the central nervous system? Neuropediatrics 21: 37–39. 159. Johnson MA, Pennock JM, Bydder GM, Dubowitz LMS, Thomas DJ & Young IR (1987) Serial MR imaging in neonatal cerebral injury. Am J Neuroradiol 8: 83–92. 160. Van de Bor M, den Ouden L & Guit GL (1992) Value of cranial ultrasound and magnetic resonance imaging in predicting neurodevelopmental outcome in preterm infants. Pediatrics 90: 196–199. 161. Natsume J, Watanabe K, Kuno K, Hayakawa F & Hashizume Y (1995) Clinical, neurophysiologic, and neuropathological features of an infant with brain damage of total asphyxia type (Myers). Pediatr Neurol 13: 61–64 162. Haddad J, Contantinesco A, Brunot B & Messer J (1994) A study of cerebral perfusion using single photon emission computed tomography in neonates with brain lesions. Acta Paediatr 83: 265–269. 163. Konishi Y, Kuriyama M, Mori I, Fujii Y, Konishi K, Sudo M & Ishii Y (1994) Assessment of local cerebral blood flow in neonates with N.isopropyl-P-(123I) iodoamphetamine and single photon emission computed tomography. Brain Dev 16: 450–453. 164. Chiron C, Raynaud C, Mazière et al (1992) Changes in regional cerebral blod flow during brain maturation in children and adolescents. J Nucl Med 33: 696–703. 165. Kumar P, Bedard MP, Shankaran S & Delaney-Black V (1994) Post extracorporeal membrane oxygenation single photon emission computed tomography (SPECT) as a predictor of neurodevelopmental outcome. Pediatrics 93: 951–955. 71 166. Léveillé J, Demonceau G & Walovitch R (1992) Intrasubject comparison between technetium99m-ECD and technetium-99m-HMPAO in healthy human subjects. J Nucl Med 33: 480–484. 167. Schiepers C, Verbruggen A, Casaer P & De Roo M (1997) Normal brain perfusion pattern of technetium-99m-ethylcysteinate dimer in children. J Nucl Med 38: 1115–1120. 168. Asenbaum S, Brücke T, Pirker W, Pietrzyk U & Podreka I (1998) Imaging of cerebral blood flow with Technetium-99m-HMPAO and Technetium-99m- ECD: A comparison. J Nucl Med 39: 613–618. 169. Greisen G (1997) Cerebral blood flow and energy metabolism in the newborn. Clin Perinatol 24: 531–546. 170. Yoshida H, Yasuhara A & Kobayashi Y (1991) Transcranial Doppler sonographic studies of cerebral blood flow velocity in neonates. Pediatr Neurol 7: 105–110. 171. Denays R, Van Pachterbeke T, Toppet V, Tondeur M, Spehl M, Piepsz A, Noël P, Haumont D & Ham HR (1993) Prediction of cerebral palsy in high-risk neonates: A technetium-99m-HMPAO SPECT study. J Nucl Med 34: 1223–1227. 172. Taudorf K & Vorstrup S (1988) Cerebral blood flow abnormalities in cerebral palsied children with a normal CT scan. Neuropediatrics 20: 33–40. 173. Denays R, Tondeur M, Toppet V, Ham H, Piepsz A, Spehl M, Rubinstein M & Noël P (1990) Cerebral palsy: Initial experience with Tc-99m HMPAO SPET of the brain. Radiology 175: 111–116. 174. Sztriha L, Al Suhaili AR, Prais V & Nork M (1996) Regional cerebral blood perfusion in children with hemiplegia: A SPECT study. Neuropediatrics 27: 178–183. 175. Lee J, Kim D, Ryu Y, Whang G, Park C & Kim D (1998) Technetium-99m ECD brain SPECT in cerebral palsy: Comparison with MRI. J Nucl Med 39: 619–623. 176. Rotteveel JJ, de Graaf R, Colon EJ, Stegeman DF & Visco YM (1987) The maturation of the central auditory conduction in preterm infants until three months post term. II. The auditory brainstem responses (ABRs). Hear Res 26: 21–35. 177. Cox C, Hack M, Aram D & Borawski E (1992) Neonatal auditory brainstem response failure of very low birth weight infants: 8-year outcome. Pediatr Res 31: 68–72. 178. Kohelet D, Arbel E, Goldberg M & Arlazoroff A (2000) Brainstem auditory evoked response in newborns and infants. J Child Neurol 15: 33–35. 179. Jiang ZD (1995) Maturation of the auditory brainstem in low risk preterm infants: a comparison with age.matched full term infants up to 6 years. Early Hum Dev 42: 49–65. 180. Jiang ZD & Tierney TS (1995) Development of human peripheral hearing revealed by brainstem auditory evoked potentials. Acta Paediatr 84: 1216–1220. 181. Markand ON (1994) Brainstem auditory evoked potentials. J Clin Neurophysiol 11: 319–342. 182. Roberts JL, Davis H, Phon GL, Reichert TJ, Sturtevant EM & Marshall RE (1982) Auditory brainstem responses in preterm neonates: Maturation and follow-up. J Pediatr 101: 257–263. 183. Fawer C-L & Dubowitz LMS (1982) Auditory brain stem response in neurologically normal preterm and full-term newborn infants. Neuropediatrics 13: 200–206. 184. Johansson R (1987) Hearing evaluation in infants with special reference to the audiovegetative tests. thesis, Univ Turku, Finland. 185. Collet L, Morgon A, Soares I, Disant F & Salle B (1988) Maturational changes in the intensity latency relation of the brainstem auditory evoked potentials in humans. Acta Otolaryngol 105: 473–476. 186. Yamamoto N, Watanabe K, Sugiura J, Okada J, Nagae H & Fujimoto Y (1990) Marked latency change of auditory brainstem response in preterm infants in the early postnatal period. Brain Dev 12: 766–769. 187. Kohelet D, Arbel E, Goldberg M & Arlazzoroff A (2000) Intrauterine growth retardation and brainstem auditory-evoked response in preterm infants. Acta Paediatr 89: 73–76. 72 188. Majnemer A, Rosenblatt B & Riley PS (1990) Prognostic significance of multimodality evoked response testing in high-risk newborns. Pediatr Neurol 6: 367–374. 189. Kitamoto I, Kukita J, Kurokawa T, Chen Y-J, Minami T & Ueda K (1990) Transient neurologic abnormalities and BAEPs in high-risk infants. Pediatr Neurol 6: 319–325. 190. Zafeiriou DI, Andreou A & Karasavidou K (2000) Utility of brainstem auditory evoked potentials in children with spastic cerebral palsy. Acta Paediatr 89: 194–197. 191. Hepper PG & Shahidullah BS (1994) Development of fetal hearing. Arch Dis Child Fetal Neonatal Ed 71: F81–F87. 192. Bamford J, Davis A & Stevens J (1998) Screening for congenital hearing impairment: Time for change. Arch Dis Child Fetal Neonatal Ed 79: F73–F76. 193. Kaga K, Hashira S & Marsh RR (1986) Auditory brainstem responses and behavioural responses in pre-term infants. Br J Audiol 20: 121–127. 194. American Academy of Pediatrics (1995) Joint Committee on Infant Hearing 1994 position statement. Pediatrics 95: 152–156. 195. Oudesluys-Murphy AM, van Straaten HLM, Bholasingh R & van Zanten GA (1996) Neonatal hearing screening. Eur J Pediatr 155: 429–435. 196. Chen S-J, Yang EY, Kwan M-L, Chang P, Shiao A-S & Lien C-F (1996) Infant hearing screening with an automated auditory brainstem response screener and the auditory brainstem response. Acta Paediatr 85: 14–18. 197. Meyer C, Witte J, Hildmann A, Hennecke K-H, Schunck K-U, Maul K, Franke U, Fahnenstich H, Rabe H, Rossi R, Hartmann S & Gortner L (1999) Neonatal screening for hearing disorders in infants at risk: Incidence, risk factors, and follow-up. Pediatrics 104: 900–904. 198. Brass D, Watkins P & Kemp DT (1994) Assessment of an implementation of a narrow and, neonatal otoacoustic emission screening method. Ear Hear 15: 467–475. 199. Brienesse P, Anteunis L, Wit H, Gavilanes D & Maertzdorf W (1996) Otoacoustic emissions in preterm infants: Indications for cochlear development? Audiology 35: 296–306. 200. Kennedy CR, Kimm L, Cafarelli Dees D, Evans PIP, Hunter M, Lenton S & Thornton RD (1991) Otoacoustic emissions and auditory brainstem responses in the newborn. Arch Dis Child 66: 1124–1129. 201. Chuang SW, Gerber SE & Thornton ARD (1993) Evoked otoacoustic emissions in preterm infants. Int J Pediatr Otorhinolaryngol 26: 39–45. 202. Eshraghi A, François M & Narcy P (1996) Evolution of transient evoked otoacoustic emissions in preterm newborns: A preliminary study. Int J Pediatr Otorhinolaryngol 37: 121–127. 203. Vohr BR, White KR, Maxon AB & Johnson MJ (1993) Factors affecting the interpretation of transient evoked otoacoustic emission results in neonatal hearing screening. Semin Hear 14: 57–72. 204. Vohr BR, Carty LM, Moore PE & Letourneau K (1998) The Rhode Island Hearing Assessment Program: Experience with statewide hearing screening (1993–1996). J Pediatr 33: 353–357. 205. El-Refaie Amr, Parker DJ & Bamford JM (1996) Otoacoustic emission versus ABR screening: The effect of external and middle ear abnormalities in a group of SCBU neonates. Br J Audiol 30: 3–8. 206. Meredith R, Stephens D, Hogan S, Cartlidge PHT & Drayton M (1994) Screening for hearing loss in an at-risk neonatal population using evoked otoacoustic emissions. Scand Audiol 23: 187–193. 207. Bantock HM & Croxson S (1998) Universal hearing screening using transient otoacoustic emissions in a community health clinic. Arch Dis Child 78: 249–252. 208. Rhodes MC, Margolis RH, Hirsch JE & Napp AP (1999) Hearing screening in the newborn intensive care nursery: Comparison of methods. Otorhinolaryngol Head Neck Surg 120: 799– 808. 73 209. Salmivalli A, Jauhiainen T, Kärjä J & Raivio M (1984) Kuulontutkimus ja kuntoutus (in finnish). 2nd ed. Instrumentarium julkaisu, Ajanpaino OY, Helsinki. 210. Amiel-Tison C (1996) Does neurological assessment still have a place in the NICU? Acta Paediatr 416: 31–38. 211. Mercuri E & Dubowitz L (1999) Neurological examination of the newborn. Current Probl Pediatr 9: 42–50. 212. Hope P (1995) CRIP, son of Apgar, brother to APACHE. Arch Dis Child Fetal Neonatal Ed 72: F81–F83. 213. The International Neonatal Network (1993) The CRIP (clinical risk index for babies) score: a tool for assessing initial neonatal risk and comparing performance of neonatal intensive care units. Lancet 342: 193–198. 214. Dubowitz LMS, Dubowitz V & Mercuri E (1999) The neurological assessment of the preterm & full-term newborn infant. Clinics in Developmental Medicine No 148. 2nd ed. Mac Keith Press, London. 215. Prechtl HFR & Beintema D (1964) The neurological examination of the full-term newborn infant. Clinics in developmental medicine No. 12. Spastics International Medical Publication, Heinmann Medical Books Ltd, London. 216. Brandt I, Sticker EJ, Höcky M & Lentze MJ (2000) Transient abnormal neurologic signs (TANS) in a longitudinal study of very low birth weight preterm infants. Early Hum Dev 59: 107–126. 217. McGrath MM, Sullivan MC, Lester BM & Oh W (2000) Longitudinal neurologic follow-up in neonatal intensive care unit survivors with various neonatal morbidities. Pediatrics 106: 1397– 1405. 218. Pedersen SJ, Sommerfelt K & Markestad T (2000) Early motor development of premature infants with birthweight less than 2000g. Acta Paediatr 89: 1456–1461. 219. Griffiths R (1954) The abilities of babies. A study in mental measurement. Mcgraw-Hill Book Company INC, London. 220. Allen MC & Alexander GR (1997) Using motor milestones as a multistep progress to screen preterm infants for cerebral palsy. Dev Med Child Neurol 39: 12–16. 221. Illingworth RS (1983) The development of the infant and young child. Normal and abnormal. Eighth edition. Churchill Livinstone, London. 222. Roth SC, Baudin J, Pezzani-Goldsmith M, Townsend J, Reynolds EOR & Stewart AL (1994) Relation between neurodevelopmental status of very preterm infants at one and eight years. Dev Med Child Neurol 36: 1049–1062. 223. Bayley N (1969) The Bayley scales of infants development. New York: Psychological corporation. 224. Siegel MJ (1995) Brain. In: Pediatric Sonography. Second edition. Raven Press, New York. p 29–40. 225. Inagaki M, Tomita Y, Takashima S, Ohtani K, Andoh G & Takeshita K (1987) Functional and morphometrical maturation of the brainstem auditory pathway. Brain Dev 9: 597–601. 226. Hagberg B, Hagberg G & Olow I (1993) The changing panorama of cerebral palsy in Sweden. VI. Prevalence and origin during the birth year period 1983–1986. Acta Paediatr 82: 387–393. 227. Martin E & Barkovich AJ (1995) Magnetic resonance imaging in perinatal asphyxia. Arch Dis Child 72: F62–F70. 228. Kohlhauser C, Fuiko R, Panagl A, Zadra C, Haschke N, Brandstetter S, Weninger M & Pollak A (2000) Outcome of very-low-birth-weight infants at 1 and 2 years of age. Clin Pediatr 39: 441–449. 229. Jeng S-F, Yau K-IT, Liao H-F, Chen L-C & Chen P-S (2000) Prognostic factors for walking attainment in very low-birthweight preterm infants. Early Hum Dev 59: 159–173. 74 230. Blasco PA (1994) Primitive reflexes. Their contribution to the early detection of cerebral palsy. Clin Pediatr 388–397. 231. Wolke D, Ratschinski G, Ohrt & Riegel K (1994) The cognitive outcome of very preterm infants may be poorer than often reported: An empirical investigation of how methodological issues make a big difference. Eur J Pediatr 153: 906–915. 232. Paul DA, Pearlman SA, Finkelstein MS & Stefano JL (1999) Cranial sonography in very-lowbirth-weight infants: Do all infants need to be screened? Clin Pediatr 38: 503–509. 233. Cooke RWI (1987) Early and late cranial ultrasonographic appearances and outcome in very low birthweight infants. Arch Dis Child 62: 931–937. 234. Adcock LM, Moore PJ, Schlesinger AE & Armstrong DL (1998) Correlation of ultrasound with postmortem neuropathologic studies in neonates. Pediatr Neurol 19: 263–271. 235. Paneth N, Rudelli R, Monte W, Rodrigues E, Pinto J, Kairam R & Kazam E (1990) White matter necrosis in very low birth weight infants: Neuropathologic and ultrasonograhic findings in infants surviving six days or longer. J Pediatr 116: 975–984. 236. Paneth N (1999) Classifying brain damage in preterm infants. J Pediatrics 134: 527–529. 237. Kuban KCK (1998) White-matter disease of prematurity, periventricular leukomalacia, and ischemic lesions. Dev Med Child Neurol 40: 571–573. 238. Haataja L, Mercuri E, Cowan F & Dubowitz L (2000) Cranial ultrasound abnormalities in full term infants in a postnatal ward: Outcome at 12 and 18 months. Arch Dis Child Fetal Neonatal Ed 82: F128–F133. 239. Levene MI (1990) Cerebral ultrasound and neurological impairment: Telling the future. Arch Dis Child 65: 469–471. 240. Torrioli MG, Frisone MF, Bonvini L, Luciano R, Pasca MG, Lepori R, Tortorolo G & Guzzetta F (2000) Perceptual-motor, visual and cognitive ability in very low birthweight prechool children without neonatal ultrasound abnormalities. Brain Dev 22: 163–168. 241. Nwaesei CG, Allen AC, Vincer MJ, Brown St J, Stinson DA, Evans JR & Byrne JM (1988) Effect of timing of cerebral ultrasonography on the prediction of later neurodevelopmental outcome in high-risk preterm infant. J Pediatr 112: 970–975. 242. Peterson BS, Vohr B, Staib LH, Cannistraci CJ, Dolberg A, Schneider KC, Katz KH, Westerveld M, Sparrow S, Anderson AW, Duncan CC, Makuch RW, Gore JC & Ment LR (2000) Regional brain volume abnormalities and long-term cognitive outcome in preterm infants. JAMA 284: 1939–1947. 243. Wilson-Costello D, Rao PS, Morrison S & Hack M (1996). Radiation exposure from diagnostic radiographs in extremely low birth weight infants. Pediatrics 97: 369–374. 244. Van Unnik JG, Broerse JJ, Geleijns J, Jansen JThM & Zoetelief Zweers D (1997) Survey of CT techniques and absorbed dose in various Dutch hospitals. Br J Radiol 70: 367–371. 245. Pasman JW, Rotteveel JJ, Maassen B, de Graaf R & Visco Y (1997) Diagnostic and predictive value of auditory evoked responses in preterm infants: II. Auditory evoked responses. Pediatr Res 42: 670–677. 246. Yoshinaga-Itano C, Sedey AL, Coulter DK & Mehl AL (1998) Language of early- and lateridentified children with hearing loss. Pediatrics 102: 1161–1171. 247. Purdy IB (2000) Newborn auditory follow-up. Neonatal Network 19: 25–33. 248. Sassen ML, Veen S, Schreuder AM, Ens-Dokum MH, Verloove-Vanhorick SP, Brand R, Ruys JH & Grote JJ (1994) Otitis media, respiratory tract infections and hearing loss in preterm and low birthweight infants. Clin Otolaryngol 19: 179–184. 249. Sutton GJ, Gleadle P & Rowe SJ (1996) Tympanometry and otoacoustic emissions in a cohort of special care neonates. Br J Audiol 30: 9–17. 250. Seifert E, Hartmann S & Weber P (1997) Otoacoustic emissions as indicators of neurologically based hearing loss in childhood. Neuropediatrics 28: 289–291.
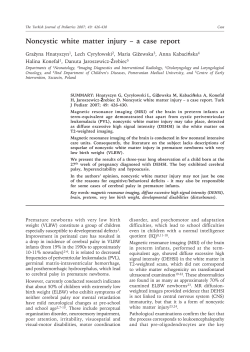
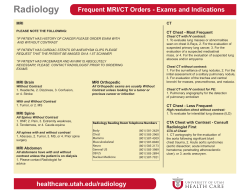


© Copyright 2026