
Inclusive Green Growth: For the Future We Want
Rio+20 brochure [f] [update 1]_Layout 1 06/07/2012 10:05 Page 47
INCLUSIVE
GREEN GROWTH:
FOR THE FUTURE
WE WANT
OECD WORK
2012
Rio+20 brochure [f] [update 1]_Layout 1 06/07/2012 10:02 Page B
Contents
Message from the OECD Secretary-General
1
An urgent call for action
2
What is green growth and how can it help deliver sustainable development?
8
The elements of successful green growth strategies
10
Integrating green growth into government policies
23
International co-operation for green growth
26
Measuring well-being and progress towards greener growth
32
Transforming sectors
36
OECD EPOC Ministerial Policy Statement to the Rio+20 Conference
41
OECD DAC Policy Statement for the Rio+20 Conference
43
This work is published on the responsibility of the Secretary-General of the OECD. The opinions expressed
and arguments employed herein do not necessarily reflect the official views of the Organisation or of the
governments of its member countries.
© OECD 2012
OECD freely authorises the use of this material for non-commercial purposes. All requests for commercial
uses of this material or for translation rights should be submitted to [email protected].
Brochure design by Baseline Arts
Rio+20 brochure [f] [update 1]_Layout 1 06/07/2012 10:21 Page 1
Message from the OECD
Secretary-General
Inclusive green growth for a fairer,
cleaner, stronger economy
The first Rio Summit in 1992 was historic for arguing
that development has to be sustainable, and that to be
sustainable, it must integrate the environmental with
the social and the economic dimensions. Twenty years
on, that is still a powerful message, but sustainable
development is not a reality. The Rio+20 Conference
provides an opportunity to change that by setting out
ways to move from a concept to practical proposals for
making it happen.
There has been significant progress over the past 20
years. While the world’s population has increased by a
third, world GDP has tripled, helping millions of people
to work their way out of poverty. The number of children
in developing countries who die before the age of five
dropped from 100 to 72 per 1 000 live births between
1990 and 2008, and around 90% of children in developing
countries are now enrolled in primary school.
However, economic expansion has come at a price to the
planet. If we do not protect the environment and its
natural resources, this expansion could grind to a halt
because we will have destroyed or permanently damaged
the water and mineral resources, ecosystem diversity
and other natural foundations on which our well-being
relies.
If we do not change course, the impact on our quality of
life and health will be significant, with an increasing
economic burden. More and more financial and human
resources will need to be spent to make enough water
available and drinkable, keep the land productive, ensure
that the air is breathable, and supply industry with the
raw materials it needs.
Inclusive green growth offers an optimistic, realistic
alternative to countries looking for new sources of growth
that make economic, environmental and social sense.
Green growth is not a replacement for sustainable
development. Together with innovation, going green can
be a long-term driver for economic growth.
The OECD Green Growth Strategy provides a clear
framework for how countries can achieve economic
growth and development while preventing costly
environmental degradation, climate change and
inefficient use of natural resources. The Strategy identifies
common principles and challenges but shows that there
is no one-size-fits-all prescription for implementing green
growth. Each country needs to devise a strategy tailored to
its own circumstances. In all cases, to be sustainable,
strategies have to be inclusive and open. Growth has to
reduce inequality and the tensions it generates. “Green”
cannot be an excuse for protectionism, depriving citizens
of choice, driving up costs and stifling innovation.
However, even the best policies are nothing without the
political will to implement them. In 2011, Ministers
meeting at the OECD welcomed the Green Growth
Strategy as a growth strategy first and foremost, and
stressed that green growth tools and indicators have the
potential to unlock new growth engines and job
opportunities. In 2012, the Mexican presidency of the G20
has established green growth as one of its priorities.
It is a key priority for the OECD too. We are exploring how
green growth strategies can be applied in the specific
context of developing countries and emerging-market
economies. And we will continue to work with our members
and partner countries to design cost-effective and politically
implementable policy measures; robust indicators, data and
mechanisms to help track progress; and dedicated
platforms and innovative ways to facilitate knowledgesharing and co-operation at the international level.
I wish Rio+20 every success in helping to make life better
for us all and for future generations.
Angel Gurría
OECD Secretary-General
OECD RIO+20 . 1
Rio+20 brochure [f] [update 1]_Layout 1 06/07/2012 10:02 Page 2
An urgent call for action
An urgent call for action
Since the Rio Summit in 1992, some impressive progress has been achieved on the
road to sustainable development. From 1992 to 2010, world GDP increased by
almost 75% and GDP per capita by 40%, bringing with it widespread improvements
in living standards while helping to lift hundreds of millions of people out of
extreme poverty.
Yet the fruits of this economic
growth have not been equally
distributed and poverty eradication
still remains a pressing concern in
many parts of the world. The
distributional patterns of that growth,
as reflected in wealth accumulation
and well-being, has seen income and
equity gaps widen in both developing
and developed countries.
Today in advanced economies, the
average income of the richest 10% of
the population is about nine times
that of the poorest 10%. Emerging
economies have achieved dramatic
reductions in poverty, yet income
inequality, which was already high,
has worsened over the last decade.
Rising inequality creates economic,
social and political challenges,
including affecting economic
performance as a whole and fuelling
protectionist sentiments.
Even in traditionally more
egalitarian countries – such as
Germany, Denmark and Sweden –
the income gap between rich and
poor is expanding – from 5 to 1 in
the 1980s to 6 to 1 today. It is 10
to 1 in Italy, Japan, Korea and the
United Kingdom, has risen to 14 to
1 in Israel, Turkey and the United
States and has reached more than
25 to 1 in Mexico and Chile.
2 . INCLUSIVE GREEN GROWTH
DIVIDED WE STAND
CHANGE IN INEQUALITY LEVELS, EARLY 1990s VERSUS LATE 2000s
Gini coefficient of household income
South Africa
Brazil
Argentina
Russian
Federation
China
Late 2000s
Early 1990s
India
Indonesia
OECD
0
0.1
0.2
0.3
0.4
0.5
0.6
0.7
0.8
Notes: Figures for the early 1990s generally refer to 1993, whereas figures for the late 2000s
generally refer to 2008.
Gini coefficients are based on equivalised incomes for OECD countries and per capita incomes
for all emerging economies except India and Indonesia for which per capita consumption
was used.
Source: OECD-EU Database on Emerging Economies and World Bank Development Indicators
Database.
The OECD study Divided We Stand: Why Inequality Keeps Rising (2012) reveals that
the gap between rich and poor has widened in most advanced and emerging
economies. It analyses the major underlying forces behind these developments
and discusses the most promising policies to counter increases in inequalities and
how the policy mix can be adjusted when public budgets are under strain.
www.oecd.org/els/social/inequality
Rio+20 brochure [f] [update 1]_Layout 1 06/07/2012 10:02 Page 3
While China, India, the Russian
Federation and South Africa have
seen strong economic expansion
over the last decade, they have
also recorded steep increases in
inequality levels in this time. In
Indonesia and Brazil, however,
strong output growth went handto-hand with declining income
inequality. But the gap between
rich and poor is still high in
Brazil, at 50 to 1.
At the same time, growth patterns
have incurred significant
environmental costs. Natural assets
have been and continue to be
depleted, with the ecosystems
services they deliver already
compromised by environmental
pollution.
Providing for a further 2 billion
people by 2050 and improving
living standards for all will
challenge our ability to manage
and restore those natural assets on
which all life depends. Failure to do
so will have serious consequences,
especially for the poor, and
ultimately undermine economic
growth and human development.
Finding out more
www.oecd.org/economy/goingforgrowth/inequality
Going for Growth. Chapter on Reducing income inequality while boosting
economic growth: Can it be done? (OECD, 2012)
Perspectives on Global Development 2012: Social Cohesion in a Shifting World
(OECD, 2012)
The Impact of Publicly Provided Services on the Distribution of Resources:
Review of New Results and Methods, OECD Social, Employment and Migration
Working Papers No. 130 (OECD, 2012)
Tackling Inequalities in Brazil, China, India and South Africa - The Role of
Labour Market and Social Policies (OECD, 2010)
OECD publications are available for free preview at www.oecd-ilibrary.org
OECD RIO+20 . 3
Rio+20 brochure [f] [update 1]_Layout 1 06/07/2012 10:02 Page 4
An urgent call for action
SOCIO-ECONOMIC DEVELOPMENTS
TO 2050
By 2050, the Earth’s population is
expected to increase from 7 billion
to over 9 billion and the world
economy is projected to nearly
quadruple, with growing demand
for energy and natural resources as
a result. While growth will still be
high, average GDP growth rates are
projected to slow in China and India.
Africa could see the world’s highest
growth rates between 2030 and 2050.
OECD countries are expected to have
over a quarter of their population
aged over 65 years in 2050,
compared with 15% today. China and
India are also likely to see significant
population ageing, while more
youthful populations in other parts
of the world, especially Africa, are
expected to grow rapidly. These
demographic shifts and higher living
standards imply evolving lifestyles
and consumption patterns, all of
which will have significant
consequences for the environment.
Nearly 70% of the world’s population
is projected to live in urban areas by
2050, exacerbating challenges such
as air pollution, transport
congestion, and waste management.
4
Without more effective policies, a
world economy four times larger
than today is projected to use 80%
more energy in 2050. It is projected
that the share of fossil-fuel based
energy in the global energy mix will
still remain at about 85%. The major
emerging economies are projected to
become major energy users. To feed
a growing population with changing
dietary preferences, global use of
agricultural land is projected to
expand in the next decade.
In the absence of new policy
action, the OECD projects that
pressures on the environment
from population growth and rising
living standards will outpace
progress in pollution abatement
and resource efficiency. Continued
degradation and erosion of natural
environmental capital is expected
by 2050 as a result, with the risk of
irreversible changes that could
endanger centuries of rising living
standards.
The OECD Environmental Outlook to 2050:
The Consequences of Inaction (2012) projects
demographic and economic trends over the next
four decades, using joint modelling by the OECD
and the Netherlands Environmental Assessment
Agency (PBL). It assesses the impacts of these
trends on the environment if we do not introduce
more ambitious policies to better manage natural
assets, and examines some of the policies that
could change that picture for the better. The
Outlook focuses on four areas: climate change,
biodiversity, water and the health impacts of pollution. It concludes that
urgent action is needed now to avoid significant costs of inaction, both in
economic and human terms.
www.oecd.org/environment/outlookto2050
Rio+20 brochure [f] [update 1]_Layout 1 06/07/2012 10:02 Page 5
WHAT WOULD IT COST TO FIGHT CLIMATE CHANGE?
Index 2010 = 100
450 Core scenario: global emissions and cost of mitigation
400
GDP -5.5%
Baseline scenario
450 ppm core scenario
350
300
250
200
GHG emissions
-69.5%
150
100
50
2010
2015
2020
2025
2030
2035
2040
2045
2050
Source: OECD Environmental Outlook to 2050: The Consequences of Inaction (OECD, 2012); output
from OECD ENV-Linkages model.
IT PAYS TO ACT NOW
Acting now makes environmental and economic sense. In the case of climate,
if countries act now, there is still a chance – although it is receding – of global
GHG emissions peaking before 2020 and limiting the world’s average
temperature increase to 2° C. The OECD Environmental Outlook to 2050 suggests
that a global carbon price sufficient to lower GHG emissions by nearly 70% in
2050 compared with the baseline scenario and limit GHG concentrations to
450 parts per million (ppm) would slow economic growth by only
0.2 percentage points per year on average. Global GDP would still almost
quadruple. The difference pales alongside the potential cost of inaction on
climate change, which some estimate could be as high as 14% of average world
consumption per capita. The Outlook also suggests that the benefits of making
further air pollution reductions in the BRIICS could outweigh the costs by 10 to
1 by 2050. Investing in safe water and sanitation in developing countries can
yield benefit-to-cost ratios as high as 7 to 1.
OECD RIO+20 . 5
Rio+20 brochure [f] [update 1]_Layout 1 06/07/2012 10:02 Page 6
An urgent call for action
GtCO2e
10
RoW
Rest of BRIICS
80
Russia & rest of A1
OECD A1
60
40
20
0
2010
2015
2020
2025
2030
2035
2040
2045
2050
Notes: A1: Group of countries that are part of Annex 1 of the Kyoto Protocol
Rest of BRIICS: Country group including Brazil, China, India, Indonesia and South Africa
ROW: Rest of the world
GtCO2e: Giga tonnes of CO2 equivalent
EFFECTS OF DIFFERENT PRESSURES ON TERRESTRIAL MSA
OECD
BRIICS
RoW
World
100%
90%
80%
70%
Remaining MSA
Food crop
Bioenergy
Pasture
Former land-use
Nitrogen
Climate change
Infr+Encr+Frag
Note: MSA of 100% is equivalent to the undisturbed state
Infr+Encr+Frag stands for Infrastructure, encroachment and fragmentation
6 . INCLUSIVE GREEN GROWTH: FOR THE FUTURE WE WANT
2050
2030
2010
2050
2030
2010
2050
2030
2010
2050
0-50%
2030
60%
2010
Biodiversity loss is projected to
continue, especially in Asia, Europe
and Southern Africa.
Globally, terrestrial biodiversity
(measured as mean species
abundance – or MSA – an indicator
of the intactness of a natural
ecosystem) is projected to decrease
by a further 10% by 2050. Mature
forests are projected to shrink in
area by 13%. Climate change is
projected to become the fastest
growing driver of biodiversity loss by
2050. Declining biodiversity
threatens human welfare, especially
for the rural poor and indigenous
communities whose livelihoods
often depend directly on natural
resources and well-functioning
ecosystems services.
GHG EMISSIONS BY REGION
MSA
WHAT WOULD THE ENVIRONMENT
LOOK LIKE IN 2050 IF CURRENT
POLICIES ARE MAINTAINED?
More disruptive climate change is
likely to be locked in, with global
greenhouse gas (GHG) emissions
projected to increase by over 50%.
The global average temperature
increase is projected to be 3o C to
6o C above pre-industrial levels by
the end of the century. The GHG
mitigation actions pledged by
countries in the Cancún Agreements
at the United Nations Climate
Change Conference in 2010 will not
be enough to prevent the global
average temperature from exceeding
the internationally agreed goal of
2o C, unless very rapid and costly
emission reductions are realised
after 2020. Surpassing the 2o C
threshold would alter precipitation
patterns, increase glacier and
permafrost melt, drive sea-level rise,
and the intensity of extreme
weather events. This will hamper
the ability of people and ecosystems
to adapt.
Forestry
Rio+20 brochure [f] [update 1]_Layout 1 06/07/2012 10:03 Page 7
About one-third of global
freshwater biodiversity has
already been lost, and further
loss is projected to 2050.
Km3
GLOBAL WATER DEMAND
6000
Electricity
Manufacturing
5000
Livestock
Domestic
4000
Irrigation
3000
2000
1000
0
2000
2050
2000
OECD
2050
BRIICS
2000
2050
RoW
2000
2050
WORLD
Note: This graph only measures ‘blue water’ demand and does not consider rainfed
agriculture.
Sub-Saharan Africa is unlikely
to meet the MDG of halving the
1990 level of the population
without access to an improved
water source by 2015.
GLOBAL PREMATURE DEATHS FROM ENVIRONMENTAL RISKS
Particulate
matter
Ground-level
ozone
Unsafe water
supply and
sanitation*
2010
2030
2050
Indoor air
pollution
Malaria
0.0
0.5
1.0
1.5
2.0
2.5
3.0
Deaths (millions of people)
3.5
Freshwater availability will be
further strained in many regions,
with 2.3 billion more people than
today – in total over 40% of the
global population – projected to be
living in river basins under severe
water stress, especially in North
and South Africa, and South and
Central Asia. Global water demand
is projected to increase by 55%,
intensifying competition among
users. Environmental water flows
will be contested, putting
ecosystems at risk. Pollution from
urban wastewater and agriculture
is projected to worsen in most
regions, increasing eutrophication
and damaging aquatic biodiversity.
Globally more than 240 million
people are expected to be without
access to an improved water source
by 2050, and 1.4 billion people still
without access to basic sanitation.
4.0
Note: *Child mortality only
Source: OECD Environmental Outlook to 2050: The Consequences of Inaction (OECD, 2012); outputs
from IMAGE and ENV-Linkages models.
Air pollution is set to become the
world’s top environmental cause
of premature mortality. Air
pollution concentrations in some
cities, particularly in Asia, already
far exceed World Health
Organization safe levels. By 2050,
the number of premature deaths
from exposure to particulate
matter is projected to more than
double to 3.6 million a year
globally, with most deaths
occurring in China and India. The
burden of disease related to
exposure to hazardous chemicals
is significant worldwide, but most
severe in non-OECD countries
where chemical safety measures
are still insufficient.
OECD RIO+20 . 7
Rio+20 brochure [f] [update 1]_Layout 1 06/07/2012 10:03 Page 8
What is green growth
What is green growth and how can it
help deliver sustainable development?
Twenty years after the first Rio
Summit, the world continues to face
a twin challenge: expanding
economic opportunities for all in the
context of a growing global
population; and addressing
environmental pressures that, if left
unaddressed, could undermine our
ability to seize these opportunities.
on a sustainable basis. That
potential includes the provision of
critical life support services – clean
air and water, and the resilient
biodiversity needed to support food
production and human health.
Natural assets are not infinitely
substitutable and green growth
policies take account of that.
Green growth is where these two
challenges meet and it is about
exploiting the opportunities to
realise the two together.
Green growth policies are an
integral part of the structural
reforms needed to foster strong,
more sustainable and inclusive
growth. They can unlock new
growth engines by:
Green growth means fostering
economic growth and
development while ensuring that
natural assets continue to provide
the resources and environmental
services on which our well-being
relies.
To do this it must catalyse
investment and innovation which
will underpin sustained growth and
give rise to new economic
opportunities.
Green growth is not a replacement
for sustainable development.
Rather, it provides a practical and
flexible approach for achieving
concrete, measurable progress
across its economic and
environmental pillars, while taking
full account of the social
consequences of greening the
growth dynamic of economies. The
focus of green growth strategies is
ensuring that natural assets can
deliver their full economic potential
8 . INCLUSIVE GREEN GROWTH
Enhancing productivity by creating
incentives for greater efficiency in
the use of natural resources,
reducing waste and energy
consumption, unlocking
opportunities for innovation and
value creation, and allocating
resources to the highest value use.
Boosting investor confidence
through greater predictability in
how governments deal with major
environmental issues.
Opening up new markets by
stimulating demand for green
goods, services and technologies.
Contributing to fiscal consolidation
by mobilising revenues through
green taxes and through the
elimination of environmentally
harmful subsidies. These measures
can also help to generate or free
up resources for anti-poverty
programmes in such areas as
water supply and sanitation, or
other pro-poor investments.
Reducing risks of negative shocks to
growth due to resource
bottlenecks, as well as damaging
and potentially irreversible
environmental impacts.
In May 2011, the OECD delivered its Green Growth
Strategy to Heads of State and Ministers from over
forty countries, who welcomed it as a useful tool for
expanding economic growth and job creation
through more sustainable use of natural resources,
efficiencies in the use of energy, and valuation of
ecosystem services.
The Strategy responds to a request from Ministers of
the 34 countries who signed the Green Growth
Declaration in 2009, committing to strengthen their efforts to pursue green
growth strategies as part of their response to the economic crisis and beyond.
www.oecd.org/greengrowth
Rio+20 brochure [f] [update 1]_Layout 1 06/07/2012 10:03 Page 9
Strategies for greener growth need
to be tailored to fit specific country
circumstances. They will need to
carefully consider how to manage
any potential trade-offs and best
exploit the synergies between green
growth and poverty reduction. The
latter include, for example, bringing
more efficient infrastructure to
people (e.g. in energy, water and
transport), tackling poor health
associated with environmental
degradation and introducing efficient
technologies that can reduce costs
and increase productivity, while
easing environmental pressure. Given
the centrality of natural assets in
low-income countries, green growth
policies can reduce vulnerability to
environmental risks and increase the
livelihood security of the poor.
Green growth strategies also
recognise that focusing on GDP as
the main measure of economic
progress generally overlooks the
contribution of natural assets to
wealth, health and well-being. They
therefore need to rely on a broader
range of measures of progress,
encompassing the quality and
composition of growth, and how this
affects people’s wealth and welfare.
The OECD is working to identify the
policy mixes and measurement tools
that countries in different situations
can adopt to implement green
growth in a way that contributes to
poverty eradication, employment
opportunities, and a strong and
sustainable economy.
The starting point of OECD work
is that there is no “one-size-fitsall” prescription for fostering
greener growth.
Greening the growth path of an
economy depends on policy and
institutional settings, level of
development, social structures,
resource endowments and
particular environmental pressure
points. Advanced, emerging, and
developing countries will face
different challenges and
opportunities. While national plans
will differ, in all cases green growth
strategies need to go hand-in-hand
with the main pillars of action to
promote social equity: more
intensive human capital
investment, inclusive employment
promotion, and well-designed
tax/transfer redistribution policies.
The OECD report on Green Growth and Developing
Countries (forthcoming) aims to identify promising
areas in which green growth objectives could be
achieved and the policies, regulations, technology
transfer, financing and new market and innovation
opportunities that could help to deliver them. It
reviews key barriers and includes options for a policy
framework and a set of criteria that developing
countries could consider in their efforts towards
green growth policy making. Work will also
commence on how progress could be assessed.
The report is being developed based on a consultative process with
developing countries. It aims to provide a platform for developing country
partners to indicate their interest in collaborating with the OECD to shape
a green growth agenda that is feasible and relevant for them and addresses
the aspirations of their citizens.
www.oecd.org/dac/greengrowth
OECD RIO+20 . 9
Rio+20 brochure [f] [update 1]_Layout 1 06/07/2012 10:03 Page 10
The elements of successful
green growth strategies
The elements of successful
green growth strategies
The OECD Green Growth Strategy
provides an analytical lens that can
be applied to differing country needs
and priorities. It helps to identify the
most appropriate policy mix for
advancing more sustainable and
inclusive growth.
A number of criteria to help guide
the design of policy strategies are
proposed, such as: cost-effectiveness,
adoption and compliance incentives,
and ability to cope with uncertainty
and provide a clear and credible signal
to investors. Other important criteria
include effectiveness in stimulating
innovation and the diffusion of green
technologies, and the extent to which
instruments can be designed and
implemented in a way that facilitates
international co-ordination.
Governance issues are also an
important consideration in policy
design and implementation.
Difficulties in monitoring
environmental performance and
compliance, collecting green taxes,
adapting new technologies or setting
up new markets may influence the
choice of policy instruments in
countries with large informal
economies and where there is weak
institutional or human capacity.
Distributional effects will play an
equally important role in policy
development, including for the
protection of poor households from
any adverse effects of policy reforms.
Successful strategies will likely draw
on the key elements identified in this
section.
VALUING NATURAL ASSETS AND
ECOSYSTEM SERVICES
Valuing and properly pricing natural
resources, biodiversity and the
ecosystem services they provide lead
to more sustainable use of these
goods and services. For example,
pricing can be an effective way of
allocating water, particularly where
it is scarce, and for encouraging
more sustainable consumption.
Appropriate water tariffs can
generate the essential finance
needed to help cover the costs of
water infrastructure, essential to
ensuring continued and expanded
access to water supply and
sanitation services for all.
associated ecosystem services. This
work supports the UN Convention on
Biological Diversity.
Interest in PES has been
increasing rapidly over the past
decade, with more than 300
programmes being implemented
worldwide to date. PES
programmes in China, Costa Rica,
Mexico, the United Kingdom and
the United States alone are
estimated to channel over USD
6.53 billion annually.
Finding out more
www.oecd.org/env/biodiversity
Economic instruments also show
promise with respect to biodiversity
and other ecosystem services.
Estimating the monetary value of the
services provided by ecosystems and
biodiversity can make their benefits
more visible, and can lead to better,
more cost-effective decisions.
Creating markets and incentives to
capture these values are an
important element of the green
growth toolkit, for example through
payments for ecosystem services
(PES) for forests and watersheds,
tradable water rights, or through the
use of eco-labelling certification
schemes. OECD policy analysis
focuses on the economic valuation of
biodiversity and ecosystem services,
and the use of economic incentives
and market-based instruments to
promote the conservation and
sustainable use of biodiversity and
10 . INCLUSIVE GREEN GROWTH: FOR THE FUTURE WE WANT
www.oecd.org/water
Green Growth and Biodiversity,
OECD Green Growth Papers (OECD,
forthcoming)
Paying for Biodiversity: Enhancing
the Cost-Effectiveness of Payments
for Ecosystem Services (OECD, 2010)
Pricing Water Resources and Water
and Sanitation Services, OECD
Studies on Water (OECD, 2010)
Rio+20 brochure [f] [update 1]_Layout 1 06/07/2012 10:03 Page 11
Tailoring green growth policies to individual countries
The OECD is supporting countries in their efforts to design and implement strategies for greener and more
inclusive growth, including through its core advice in country-specific and multilateral surveillance. Through
these, the OECD is providing guidance tailored to the needs of individual countries.
The OECD Economic Surveys
systematically assess how
environmental and growth
policy recommendations
interact, including in areas
such as taxation, innovation,
infrastructure, energy,
agriculture and product
market regulation. Recent
surveys covering green
growth include Brazil,
Denmark, Germany, India,
Korea, Mexico, New Zealand,
Poland and the Russian Federation.
The OECD Environmental
Performance Reviews
examine how countries’
environmental policy
frameworks can support green
growth, including through
pricing mechanisms and
transition measures. Recent
reviews include Ireland, Israel,
Japan, Luxembourg, Norway,
Portugal, the Slovak Republic,
and Greece.
The OECD report Going for
Growth identifies structural
reform priorities to boost real
income for each OECD
country and key emerging
economies. It will start to
highlight policy opportunities
that can strengthen growth,
improve environmental
outcomes and identify
possible trade-offs.
In response to country
demand, the OECD
Investment Policy Reviews
now seek to help countries
improve domestic conditions
for investment in support of
green growth objectives. The
Investment Policy Review of
Colombia and forthcoming
Reviews of Tunisia, Jordan and
Malaysia all include a green
growth focus.
Also based on country
demand, the OECD Reviews of
Innovation Policy incorporate
green growth considerations in
their recommendations as well
as best practice examples on
how to improve policies which
impact on innovation
performance, including R&D
policies. Recent reviews include
Russia and Peru.
The OECD Green Cities
programme assesses the
impact of urban green growth
and sustainability policies on
urban and national economic
performance and
environmental quality in
different geographical,
economic and national
regulatory contexts. A first
round of case studies included
the Paris-IDF region, the
Chicago/Tri-State Area and Korea. Case studies of
Stockholm, Kitakyushu, Abu Dhabi and China are
currently underway.
www.oecd.org/greengrowth/countries
OECD RIO+20 . 11
Rio+20 brochure [f] [update 1]_Layout 1 06/07/2012 10:03 Page 12
The elements of successful
green growth strategies
MAKING POLLUTION
MORE COSTLY
Putting a price on pollution –
through carbon taxes or emissions
trading schemes – is a key policy for
greener growth. Pricing
mechanisms tend to minimise the
costs of achieving a given
environmental objective and
provide incentives for further
efficiency gains and innovation,
encouraging more sustainable
production and consumption
patterns. Better pricing of
Finding out more
www.oecd.org/env/taxes
Interactions Between Emission
Trading Systems and Other
Overlapping Policy Instruments,
General Distribution Document
(OECD, 2011)
Taxation, Innovation and the
Environment (OECD, 2010)
12 . INCLUSIVE GREEN GROWTH
environmental ‘bads’ can
contribute to improved health
outcomes through a cleaner
environment, with positive
repercussions for human capital,
labour productivity and reduced
health-related expenditures.
Pricing instruments can also
generate additional fiscal revenues
to ease tight government budgets
and help finance critical priorities
such as health, education, or
infrastructure development.
A number of countries have
embarked on green tax reforms, often
using the revenues raised to reduce
taxes on labour which could help
boost employment and encourage
green growth.
If advanced economies used taxes
or auctioned permits to achieve
the greenhouse gas emission
reductions they pledged in the
Cancún Agreements, they could
raise USD 250 billion in revenues
per year by 2020.
The OECD Environmental Fiscal Reform for Poverty
Reduction, DAC Guidelines and Reference Series (2005)
identifies approaches to fiscal reform for green
growth that can work well in most developing
countries. The report provides insights and examples
of good practice on using environmental taxation and
pricing measures in country development and
poverty reduction strategies. It also looks at the
political economy of environmental fiscal reform and
the role of donors in supporting the reform process.
www.oecd.org/dev/poverty
Rio+20 brochure [f] [update 1]_Layout 1 06/07/2012 10:03 Page 13
ENVIRONMENTALLY RELATED TAXES IN PRACTICE
The use of environmentally related taxation (and emission trading systems) has widened in recent years, but there is still
significant scope for increased use of these pricing instruments.
Meanwhile, the revenue from taxes on energy, the most widespread form of environmentally related tax, has tended to decline as
a share of GDP, partly because growing global energy demand has pushed up pre-tax prices and encouraged increased fuel
efficiency – showing the impact of economic incentives.
% of GDP
REVENUES IN % OF GDP, 2010
4.5
Energy
4.0
Motor vehicles
Other
3.5
3.0
2.5
2.0
1.5
1.0
0.5
* 2009 figures
Argentina*
Brazil
China
Colombia *
Costa Rica*
Dominican Republic *
Guatemala*
Peru *
Uruguay*
South Africa
-1.0
Weighted average
-0.5
Mexico
United States
Chile
Canada*
New Zealand
Japan
Spain
Australia
France
Poland
Hungary
Slovak Republic*
Switzerland
Belgium
Greece*
Iceland
Germany
Luxembourg
Norway
Austria
Ireland
Portugal
United Kingdom
Italy
Sweden
Korea
Finland
Czech Republic
Estonia
Slovenia
Israel
Netherlands
Turkey
Denmark
0.0
Note: Revenues from motor fuel taxes are included in 'Energy', not in 'Motor vehicles'. Royalties and tax revenues from oil and gas
extraction are not included.
Source: OECD/EEA database on instruments for environmental policy: www.oecd.org/env/policies/database
OECD RIO+20 . 13
Rio+20 brochure [f] [update 1]_Layout 1 06/07/2012 10:03 Page 14
The elements of successful
green growth strategies
REFORMING ENVIRONMENTALLY
HARMFUL SUBSIDIES
Reforming policy-induced
distortions that are damaging both
for growth and the environment is a
key priority within the green growth
policy mix. Subsidies to fossil fuels,
for example, encourage pollution
and constrain the ability of
governments to engage in
programmes that help improve long
term growth prospects such as
improved health and education.
There is significant scope for
reducing the heavy burden that
these subsidies place on
government budgets, while also
better targeting support to those
who most need it.
Governments and taxpayers spent
about half a trillion USD in 2010
supporting the production and
consumption of fossil fuels. For the
first time ever, the OECD has
compiled an inventory of over 250
measures that support fossil-fuel
production or use in 24
industrialised countries, which
together account for 95% of the
OECD’s total primary energy supply.
Those measures had an overall
value of about USD 45-75 billion a
year between 2005 and 2010. In
emerging and developing countries,
the International Energy Agency
(IEA) estimated that subsidies to
fossil fuel consumption amounted
to some USD 409 billion in 2010.
Fossil fuel subsidies encourage the
wasteful use of energy, contribute to
price volatility by blurring market
signals and act to lower the costcompetitiveness of renewable
energy sources and energy-efficient
technologies. Moreover, they often
fail to meet their stated objectives
of alleviating poverty or promoting
economic development. The IEA
found that only 8% of the USD 409
billion spent on fossil fuel
subsidies in 2010 was distributed
to the poorest 20% of the
population; other direct forms of
welfare support would cost much
less and reach the people who need
them most.
OECD analysis suggests that most
countries or regions would record
real income gains following
unilateral removal of their subsidies
to fossil fuel consumption, as a
result of a more efficient allocation
of resources across sectors. Scarce
government resources would be
freed up for other priorities, such as
protecting vulnerable households,
stimulating employment creation,
or helping to address climate change
at home or in developing countries.
Real income gains from the
unilateral removal of fossil fuel
consumption subsidies could be
as much as 4% in some countries.
At the same time, global GHG
emissions would be reduced 6%
by 2050 compared with businessas-usual.
Considerable momentum is building
to cut fossil fuel subsidies, notably in
the G20 forum as well as among
Asia-Pacific Economic Cooperation
(APEC) economies. Many countries
are now pursuing reforms, though
formidable economic, political and
social hurdles will need to be
overcome to realise lasting gains.
To assist governments’ understanding of the nature
and scale of their policies supporting fossil fuels, the
OECD Inventory of Estimated Budgetary Support and
Tax Expenditures For Fossil Fuels (2012) contains
detailed information of over 250 mechanisms that
support fossil fuel production and use in OECD
countries. The Inventory will be updated regularly
and expanded over time to cover more countries and
more support mechanisms.
www.oecd.org/iea-oecd-ffss
Finding out more
www.oecd.org/g20/fossilfuelsubsidies
An update of the G20 Pittsburgh and Toronto Commitments, joint report by
IEA, OPEC, OECD and World Bank on fossil-fuel and other energy subsidies
(2011)
Mitigation Potential of Removing Fossil Fuel Subsidies: A General Equilibrium
Assessment, OECD Economics Department Working Papers no. 853 (OECD, 2011)
14 . INCLUSIVE GREEN GROWTH: FOR THE FUTURE WE WANT
Rio+20 brochure [f] [update 1]_Layout 1 06/07/2012 10:03 Page 15
The OECD and the IEA have
established an online database to
increase the availability and
transparency of data on energy
consumer subsidies and measures
that support the production or use
of fossil fuels in OECD countries.
The OECD’s Economic Surveys also
provide targeted analysis and advice
to countries implementing fossil fuel
subsidy reforms, for example in
Mexico, India and Indonesia.
In the case of agriculture and
fisheries, some support measures to
these sectors may hamper the
allocation of scarce resources to
more productive activities, and
increase the pressures on the
environment, for instance through
elevated GHG emissions, nutrient
loading, rates of resource depletion
and pressures on land and water
resources. Not all forms of
agricultural support are
environmentally harmful, however,
and some support measures are
linked to the achievement of specific
environmental objectives. OECD work
shows that the share of agricultural
support that is linked to commodity
production has decreased (e.g.
market price support and associated
trade barriers, direct production
support, or input subsidies) and
support measures conditional upon
meeting environmental, food safety
and animal welfare requirements or
support based on the generation of
ecosystem services have increased.
Targeting policies to specific
objectives is likely to achieve greater
economic efficiency and better
environmental performance. Further
work is underway in the OECD to
deepen understanding of the linkages
between agricultural policies, support
and green growth.
Finding out more
Decoupling agricultural support:
www.oecd.org/agriculture/
decoupling
Producer and Consumer Support
Estimates database:
www.oecd.org/agriculture/pse
Agricultural Policy Monitoring
and Evaluation 2011: OECD
Countries and Emerging
Economies (OECD, 2011)
% of gross receipts
TRANSFERS FROM CONSUMERS AND TAXPAYERS TO AGRICULTURAL PRODUCERS
1986-2010
40
Other
Potentially least distorting support
Potentially most distorting support
35
30
25
20
15
10
5
0
1986
1988
1990
1992
1994
1996
1998
2000
2002
2004
2006
2008
2010
Notes: Potentially most distorting = support based on commodity production and inputs with no constraints attached to their use.
Potentially least distorting = support not based on production.
Data for 2010 are provisional.
Source: OECD PSE/CSE database, 2011.
OECD RIO+20 . 15
Rio+20 brochure [f] [update 1]_Layout 1 06/07/2012 10:04 Page 16
The elements of successful
green growth strategies
well-functioning financial markets.
Removing barriers to new and
young firms is particularly
important, as these firms tend to be
more responsive to new
technological or commercial
opportunities. Providing effective
protection and enforcement of
intellectual property rights (IPR) is
essential to encourage the
development and diffusion of
technologies and to facilitate
foreign direct investment and
licensing.
INNOVATION AND GREEN
TECHNOLOGY DEVELOPMENT
AND DIFFUSION
Innovation, involving the creation,
diffusion and application of new
products, processes and
technologies, can help to achieve the
decoupling of growth from
environmental pressures, at the
lowest possible cost. Innovation also
leads to new ideas, new
entrepreneurs and business models,
contributing to the establishment of
new markets and eventually to the
creation of new jobs.
The drivers of green innovation
differ across countries. Advanced
and emerging economies can often
mobilise foreign direct investment,
trade and human capital to build
their technological and innovation
capacity. However, in many
developing countries, innovation
takes place in small firms or in the
informal economy, with less capacity
to seek and absorb knowledge. Policy
frameworks to foster green
innovation should be adjusted to
national circumstances, including
the economic structure, existing
capabilities to innovate, and the
institutions in place.
Green innovation thrives under the
same conditions as overall
innovation, as the fundamental
drivers and barriers are similar.
Therefore a sound framework for
innovation is important, including
competitive markets, openness to
foreign trade and investment, and
But the rate and pattern of ‘green’
innovation is also affected by other
factors, such as the environmental
policy framework. Emission taxes
and tradable permit systems provide
price signals that indicate
governments’ commitment to
greener growth, giving innovators an
incentive to invest in green
innovation and the flexibility to
identify the best means of meeting
environmental objectives. Price
signals enhance efficiency in
allocating resources by strengthening
markets for green innovation, and
will lower the costs of addressing
environmental challenges.
But price signals are not sufficient,
particularly if breakthrough
technologies are to be developed
and diffused throughout the
economy. Temporary support for
the development and
commercialisation of green
technologies will be needed in
certain cases as well as public and
private investment in relevant
research, including in emerging and
developing economies that will need
to adapt existing technologies to
their own local context.
Strengthening markets for green
innovation is also important, for
example through well-designed
public procurement
standards and regulation.
Investing only in energy and
environmental R&D is not enough
to spur green innovation. R&D in
fields such as chemistry, material
sciences and engineering are
equally important sources of
scientific research for green
inventions.
Recent OECD work suggests that there
are significant differences between
the effects of different policy
measures depending on the level of
technological development, so having
the appropriate mix of policy
instruments is important. For
example, when a technology is still far
from being competitive, relative prices
are less important than ambitious
performance standards, or significant
public support for research.
More generally, characteristics of the
policy framework for green growth
like stringency, predictability and
flexibility are key for encouraging
innovation and technology transfer.
An “unpredictable” policy regime
can slow down technology
invention and adoption. For
instance, the increased volatility of
public R&D spending has a negative
impact on innovation.
GREEN INNOVATION IN TOURISM
Tourism, as a transversal sector interacting with many other industries
and services, can contribute significantly to the shift towards more
sustainable, cleaner and low-carbon economic growth. Entrepreneurs and
policy-makers are increasingly looking at innovation as key to improving
environmental performance and achieving sustainable targets. Innovation
is also essential to improve existing products and to develop more
sustainable tourism products and experiences.
www.oecd.org/cfe/tourism
16 . INCLUSIVE GREEN GROWTH: FOR THE FUTURE WE WANT
Rio+20 brochure [f] [update 1]_Layout 1 06/07/2012 10:04 Page 17
Although energy and environmental
R&D still account for a small share of
GDP, in recent years governments
have been promoting increased
investment in green technologies,
notably in the area of renewable
energy. As competition between
alternative technological trajectories
is key, there is a risk that
governments will attempt to pick
winners. One way to avoid this is to
support general infrastructure or
basic conditions for a wide range of
alternative technologies, e.g.
advanced grid management systems
that are needed for a number of
generating technologies, or generalpurpose technologies such as ICT,
industrial biotechnology or
nanotechnologies. Good policy design
is essential for any support, e.g. in
ensuring competitive selection
policy impact, and containing costs.
Support for commercialisation should
be temporary and accompanied by
clear sunset clauses and transparent
phase-out schedules.
processes, focusing on performance
rather than specific technologies,
avoiding favouring incumbents or
providing opportunities for lobbying,
ensuring a rigorous evaluation of
Finding out more
www.oecd.org/environment/innovation
www.oecd.org/sti/innovation/green
Energy and Climate Policy and Innovation: Bending the Trajectory, OECD
Studies on Environmental Innovation (OECD, 2012)
Invention and Transfer of Environmental Technologies, OECD Studies on
Environmental Innovation (OECD, 2011)
Fostering Innovation for Green Growth, OECD Green Growth Studies
(OECD, 2011)
15
Wind power
Solar photovoltaics
Electric/Hybrid cars
12
Improved combustion/carbon
capture and storage
Kyoto protocol adopted
Patenting activity worldwide
(3-yr moving average indexed on 1997=1)
THE IMPORTANCE OF CLEAR POLICY SIGNALS
Trends in patenting activity worldwide
Climate change adaption
Energy storage
9
Air emissions purification
All tech. sectors
6
Wastewater treatment
Material recycling
3
0
1978
1980
1982
1984
1986
1988
1990
1992
1994
1996
1998
2000
2002
2004
2006
2008
Note: Patent counts refer to the number of "claimed priorities", by the first filing date worldwide, shown as 3-year moving averages and
indexed on the year 1997.
Source: OECD calculations based on data extracted from the EPO Worldwide Patent Statistical Database (PATSTAT, October 2011) using
algorithms developed at the OECD and the EPO. See Energy and Climate Policy and Innovation: Bending the Trajectory (OECD, 2012).
OECD RIO+20 . 17
Rio+20 brochure [f] [update 1]_Layout 1 06/07/2012 10:04 Page 18
The elements of successful
green growth strategies
SKILLS DEVELOPMENT AND
LABOUR MARKET POLICIES
A successful transition towards a
greener economy will create new
opportunities for workers, but also
new risks. The challenge for labour
market and skill policies is to
maximise the benefits for workers
and help assure a fair sharing of
adjustment costs, while also
supporting broader green growth
policies (e.g. by minimising skill
bottlenecks). The three main policy
priorities are:
support a smooth reallocation of
workers from declining to
growing firms, while reducing the
adjustment costs borne by
displaced workers
support eco-innovation and the
diffusion of green technologies by
strengthening initial education
and vocational training, and
ensuring that overly-strict
product market regulations are
not blunting the incentive to
innovate
reform tax and benefit systems
for workers to make sure that
cost pressures generated by
environmental policies do not
become a barrier to employment.
There is also need for greenspecific labour market and skill
policies, including top-up training
for mid-career workers who need
to adapt to greener ways of
working. An OECD questionnaire
sent to labour and employment
ministries reveals that about 60% of
the responding countries have
implemented at least one green
growth labour market measure, with
training being the most common.
The challenges that emerge are:
detecting how green growth is
changing labour demand and jobs
skill requirements, co-ordinating
labour market and skill policies with
environmental policy, and ensuring
that both men and women are
equally well-prepared for the shift to
a greener economy and that they
both benefit from new jobs and
entrepreneurial opportunities.
Women’s under-representation in
science, technology, engineering and
mathematics fields in tertiary
education directly limits women’s
opportunities to participate in a
growing green labour market. In the
majority of OECD countries, fewer
than 30% of tertiary qualifications in
the fields of engineering,
manufacturing and construction
and about 40% of tertiary
qualifications in science degrees
were awarded to women.
Gender differences in these subject
choices are even more distinct in
vocational training programmes. If
green content is introduced only in
science and engineering oriented
vocational programmes, a large
proportion of women will not benefit
from the training and miss the
opportunity to acquire the necessary
skills for new green jobs.
18 . INCLUSIVE GREEN GROWTH: FOR THE FUTURE WE WANT
In OECD countries, women have a
smaller carbon footprint than
men. Moreover, women are more
likely to recycle, buy organic food
and eco-labelled products and
they place a higher value on
energy-efficient transport than
men.
From the demand side, an OECD
survey of small and medium-sized
enterprises indicates that firms are
often not sufficiently aware of the
need for green skills for the future,
and their investment in green
training or green knowledgeintensive activities is often limited,
as is their awareness of the impact
of regulations on their industry.
By 2030 employment in the solar
and wind electricity sector in the
OECD area as a whole could be
40% higher than without climate
mitigation policies. By contrast,
the fossil fuel and coal mining
sectors could lose more than 35%
of their jobs in the OECD area.
Rio+20 brochure [f] [update 1]_Layout 1 06/07/2012 10:04 Page 19
WHAT WOULD CLIMATE CHANGE POLICIES MEAN FOR JOBS?
A study using the OECD’s ENV-Linkages model shows that a
well-designed emissions trading system could sharply reduce
GHG emissions while allowing GDP to keep growing (although
The OECD model demonstrates that the impact of GHG
mitigation policy on GDP growth is small when the labour
market adjusts smoothly to employment opportunities and
at a slightly lower rate). These modelling results also indicate
small net impacts on total employment, but other studies
suggest bigger gains if the right policies are in place. These
studies also show that green growth could be a powerful
losses, but that the costs rise significantly when workers in
declining sectors become unemployable elsewhere due to
an incapacity to change and lack of flexibility in labour
markets. One way to combine environmental policy with
weapon to help developing economies in their fight against
underemployment. The key is mobility, with workers able to
move easily from sectors where employment would drop,
notably fossil-fuel industries, to sectors such as renewable
measures to help workers take advantage of new
opportunities would be use revenues from carbon taxes to
reduce taxes on labour income. This can generate a
“double-dividend” by delivering both lower GHG emissions
energy industries where job opportunities rise rapidly.
Countries exporting fossil-based energies would be most affected.
and higher employment.
% deviation from the BAU in 2030
SECTORAL CHANGES IN EMPLOYMENT WITH AMBITIOUS CLIMATE CHANGE MITIGATION POLICIES, OECD COUNTRIES
In % deviation from the business-as-usual (BAU) scenario in 2030
50
Employment
Value added
40
30
20
10
0
-10
-20
-30
Solar & wind electricity
Nuclear power
Combustible renewables
& waste electricity
Transport services
Hydro & geothermal
electricity
Iron & steel
Non-metallic minerals
Non-ferrous metals
Paper & paper products
Chemicals
Forestry
Other manufacturing
Other services
Fabricated metal
products
Fisheries
Food products
Other crops
Other mining
Construction & dwellings
Source: OECD ENV-linkages model.
Livestock
Crude oil
Petroleum &
coal products
Rice
Coal
Fossil fuel based
electricity
-50
Gas
-40
Finding out more
Greening jobs and skills: www.oecd.org/greengrowth/skills
OECD Employment Outlook 2012, chapter on green jobs (OECD, forthcoming)
Employment Impacts of Climate Change Mitigation Policies in OECD:
A General-Equilibrium Perspective, OECD Environment Working Papers no. 32
(OECD, 2011)
Enabling Local Green Growth: Addressing Climate Change
Effects on Employment and Local Development, OECD LEED Working Papers
no. 2012/01 (OECD, 2012)
Greening Jobs and Skills: Labour Market Implications of Addressing
Climate Change, OECD LEED Working Papers no. 2010/02 (OECD, 2010)
OECD RIO+20 . 19
Rio+20 brochure [f] [update 1]_Layout 1 06/07/2012 10:04 Page 20
The elements of successful
green growth strategies
LEVERAGING PRIVATE
INVESTMENT FOR GREEN
INFRASTRUCTURE AND
TECHNOLOGIES
Investing in greener infrastructure is
critical for more sustainable growth
because the choice of infrastructure
can lock-in polluting and climate
vulnerable development patterns,
and because it accounts for the bulk
of investment needed to address
pressing environmental challenges.
In addition, infrastructure projects
are particularly vulnerable to
climate change, due to long
operational life times.
In developing countries, where a
major part of the infrastructure
required for development is still to
be built, there is an opportunity to
leap-frog by introducing greener and
more efficient infrastructure. In
developed countries, the challenge is
more about renovation and
upgrading outdated infrastructure.
Major shifts in long-term
investments will be required to
transform energy, transport, water
and building infrastructure to
become resource- and energyefficient and increase the use of
renewable energy. The IEA and
others estimate the investment
required is USD 1 trillion per year
globally, in addition to the OECD’s
estimates of global infrastructure
requirements of USD 50 trillion to
2030, almost half of which is
required by 2020.
While private investment in clean
energy is rising quickly, domestic
and international private
investment in green infrastructure
is still seriously constrained by
market failures and by activity- and
sector-specific investment barriers.
RANKING OF RISKS IN GREEN FINANCE
Longevity
Transaction cost
Human/operational
Economic/commodity price volatility
Legitimate policy changes
Policy development
Infrastructure
Illegitimate policy changes
Enforcement
Liquidity
Aggregation/commoditisation
Multitude
Institutional - property rights
Additionality
Institutional - regulatory
Inconsistency
MRV
Fungibility
Currency
Complexity
Branding
Cannibalisation
Physical
Technology
Fraud/cash leakage
0
1
2
3
4
5
Level of risk
6
7
8
Source: Mobilising Private Investment in Green Infrastructure (OECD, forthcoming working paper) (based on data from Standard & Poor’s /
Parhelion)
20 . INCLUSIVE GREEN GROWTH: FOR THE FUTURE WE WANT
9
Rio+20 brochure [f] [update 1]_Layout 1 06/07/2012 10:04 Page 21
Moreover, country-specific barriers
often limit the attractiveness of
such investments, either in terms
of the adequacy of returns or
unmanageable risk.
Institutional investors – such as
pension funds and insurance
companies– can play an important
role in financing such green growth
initiatives, which represent a
potentially “win-win” long-term
investment opportunity with
steady income streams. However,
less than 1% of pension funds’
assets globally are allocated to
infrastructure investment, let alone
to green growth projects. This may
be due to an unsupportive
environmental policy backdrop,
including regulatory risk and
uncertainty, a lack of information,
knowledge and expertise about the
type of investment required to
finance green projects, or a lack of
appropriately structured financing
vehicles providing the risk/return
profile required.
Almost 10% of the global burden
of disease could be avoided
through investment in better
water and sanitation
infrastructure and could result
in several million lives being
saved.
How can governments encourage
private investments?
Governments can aid the transition
by using public funds to mitigate
financial risk, unlock private
investment, promote learning, and
build institutional and human
capacity to bring about
transformative change, while
developing a coherent green
investment policy framework for
long term financial viability.
The OECD is working to develop an
integrated policy framework that
can help achieve the common goal
of low-carbon, climate resilient
(LCR) development and greener
growth. This includes goal setting
across levels of government;
reforming policies to enable
investment and strengthen market
incentives for LCR infrastructure;
and specific financial policies that
provide transitional support for new
green technologies, as well as
increasing the social returns
through, for example, training and
R&D and institutional capacity
building; along with promoting
green business and consumer
behaviour through information and
education policies.
Other OECD work aims to establish
what policy signals are required to
give institutional investors the
confidence to invest in this space,
and to determine the most efficient
financing tools for leveraging
private sector financing, as well as
how to track both public and private
sector climate change finance.
Finding out more
www.oecd.org/greengrowth/
investment
Defining and Measuring
Institutional Investors’
Allocations to Green Investments
(OECD, forthcoming working
paper)
Toward a Policy Framework for
Green Infrastructure Investment
(OECD, forthcoming working
paper)
Role of Institutional Investors in
Financing Clean Energy (OECD,
forthcoming working paper)
The Role of Pension Funds in
Financing Green Growth
Initiatives, OECD Working Papers on
Finance, Insurance and Private
Pensions, no. 10 (OECD, 2011)
Transition to a Low Carbon
Economy: Public Goals and
Corporate Practices (OECD, 2010)
OECD RIO+20 . 21
Rio+20 brochure [f] [update 1]_Layout 1 06/07/2012 10:04 Page 22
The elements of successful
green growth strategies
Finding out more
www.oecd.org/environment/
households
GREENING CONSUMER
BEHAVIOUR
Household consumption patterns
and behaviour are having an
increasing impact on stocks of
natural resources, environmental
quality and climate change. In
response, governments are
introducing measures to encourage
people to consider the
environmental effects of their
purchasing decisions and practices.
These include environmentallyrelated taxes, energy efficiency
standards for homes, CO2 emissions
labels for cars, and financial
support to invest in solar panels.
Better understanding what
influences people’s behaviour
towards the environment can help
governments choose the most
effective policy instruments. OECD
surveys of more than 10 000
households across a number of
countries, in the areas of energy,
food, transport, waste and water,
show that economic incentives
encourage energy savings and
investment in water-efficient
equipment as well as waste
generation and recycling levels.
Households charged for their
water on a volume basis consume
approximately 20% less than
those who are not charged.
But “soft” policy measures such as
labelling, public information
campaigns and education can play a
significant complementary role.
Initiatives to raise environmental
awareness are crucial, as attitudes
towards the environment drive
water-saving behaviours, demand for
energy-efficient appliances, and
decisions to recycle and to consume
organic food. However, few
households are prepared to pay
Greening Household Behaviour: The
Role of Public Policy (OECD, 2011)
Consumer Policy Toolkit (OECD, 2010)
Environmental Claims: Findings
and Conclusions of the Committee
of the OECD Committee on
Consumer Policy (OECD, 2010)
much to use green energy, drive
alternative fuel vehicles or consume
organic food, so using a mix of
instruments will be key to spur
behavioural change.
60% of people are willing to pay
extra for the use of renewable
energy in their electricity, but 45%
of people who would choose a
differentiated rate for renewable
energy do not have the option to
do so.
DO CONSUMERS CARE ABOUT ENVIRONMENTAL ISSUES?
Percentage of respondents agreeing with the statements
100%
80%
60%
40%
20%
0%
Australia
Canada
Chile
France
Israel
Japan
Korea Netherlands
Spain
Sweden
Environmental issues should be dealt with primarily by future generations
I am not willing to do anything about the environment if others don't do the same
Environmental impacts are frequently overstated
Environmental issues will be resolved in any case through technological progress
Policies introduced by the government to address environmental issues should not cost me extra money
I am willing to make compromises in my current lifestyle for the benefit of the environment
Source: OECD Greening Household Behaviour: Results of the 2011 Survey (OECD, forthcoming)
22 . INCLUSIVE GREEN GROWTH: FOR THE FUTURE WE WANT
Switzerland
Rio+20 brochure [f] [update 1]_Layout 1 06/07/2012 10:04 Page 23
Integrating green growth
into government policies
MAINSTREAMING GREEN GROWTH
INTO CORE ECONOMIC POLICIES
Having the institutional and
governance capacity to implement
wide-ranging policy reform is an
essential condition for greening
growth and achieving sustainable
development. Governments need to
be able to integrate green growth
objectives into broader economic
policymaking and development
planning. Developing such capacity
is a key structural issue and applies
as much to many OECD countries as
it does to developing countries. This
issue is not restricted to formal
national level planning processes,
such as national plans or poverty
reduction strategies, but extends to
public financial management
(especially the budget process),
developing strategies for key
economic sectors as well as how
these feed through into sub-national
development.
Capacity development for green
growth policies should take a
“country system approach” across
government. Finance and core
economic ministries should take a
leading role on core economic
policies for green growth that engage
central planning, finance and
sectoral ministries as well as
environment agencies in their
formulation. The role and capacity
of non-governmental actors in the
private sector and civil society will
also be important.
Finding out more
Environmental Action Programme
Task Force: Greening
Development in Eastern Europe,
Caucasus and Central Asia:
www.oecd.org/env/eap
Green Growth and Developing
Countries (OECD, forthcoming)
Greening Development: Enhancing
Capacity for Environmental
Management and Governance
(OECD, 2012)
Green Growth and Environmental
Governance in Eastern Europe,
Caucasus, and Central Asia, OECD
Green Growth Papers (OECD, 2012)
Greening national processes:
distinctive features of developing countries
Natural resources are central to
developing countries. Valuing
environmental assets and services in
national and corporate accounts can
encourage the development of
policies to safeguard their value.
The low level of infrastructure in
most developing countries provides
an opportunity to leapfrog to
modern, efficient technologies, but it
also requires sufficient technical
capacity and a supportive policy
environment.
High levels of employment in
informal sectors poses challenges
for successfully implementing
environmental standards, and
requires stakeholders to have the
capacity to develop and implement
appropriate measures.
Effective, inclusive and equitable
governance is essential. Governance
processes and mechanisms for
greening development should
respond to the needs and interests
of marginalised groups.
OECD RIO+20 . 23
Rio+20 brochure [f] [update 1]_Layout 1 06/07/2012 10:04 Page 24
Integrating green growth into
government policies
WIKIGENDER is a project initiated by the
OECD Development Centre to improve
knowledge of and exchange on gender
equality-related issues around the world,
with a focus on empirical evidence
measuring gender equality. Based on the
work of the Social Institutions and Gender
Index, Wikigender also aims to highlight the
importance of social institutions such as
informal and formal laws, social norms and
practices that impact on women’s
empowerment.
www.wikigender.org
MAINSTREAMING GENDER
Mainstreaming gender in green
growth strategies will be
particularly important to tackle
malnutrition and food security in
developing countries. Women play a
fundamental role in poverty
reduction, decreasing child
malnutrition and increasing
agricultural production.
Discriminatory attitudes and
practices regarding the role of
women in society are significant
barriers to their control over
resources and thus food production.
For example, OECD work using the
Social Institutions and Gender Index
shows that in countries where
women have few or no rights to
access land, the levels of child
malnutrition are also higher. Recent
OECD work also shows that
discriminatory social institutions
can negatively affect rural women’s
empowerment, agricultural
production and food security.
Countries where women lack
rights to own land have on
average 60% more malnourished
children.
THE IMPORTANCE OF CITIES,
REGIONS AND COMMUNITIES
Central government policy alone
cannot ensure a green transition –
cities, regions and communities can
also be catalysts for green growth
policy solutions. Experimentation
and learning at the local level can
provide essential experience and lead
to bottom-up diffusion of approaches
between cities and regions as well as
influence national and even
international levels of actions. Coordinating governance issues can
help achieve the most cost-effective
option in attaining green growth,
including in the areas of green
investment and innovation.
Cities are essential to making growth
stronger, greener and more inclusive
Over 50% of the world’s population
is now living in cities, and 70% of the
population is expected to be urban
by 2050. Cities are critical drivers of
national growth: just 2% of OECD
regions, mainly the largest OECD
urban areas, produce one-third of all
growth in the OECD. In both India
and China, the five largest cities’
economies contribute approximately
15% of national GDP – roughly three
times their share of the population.
But growing urbanisation increases
pressures on the environment. Cities
account for an estimated 67% of
global energy use and 71% of global
energy-related CO2 emissions. The
expansion of cities without sufficient
spatial planning or adequate
investment in housing and other
24
essential infrastructure can create
substandard living conditions,
through severe air and water
pollution as well as the accumulation
and inappropriate disposal of
household and industrial waste.
Without new policies, the health
impacts of urban air pollution
will continue to worsen by 2050,
and it is expected to become the
top environmental cause of
premature mortality worldwide.
OECD work on cities and green
growth shows that urban policies,
such as increasing density,
congestion charges and property tax
reforms, can contribute to reducing
environmental pressures while
supporting economic growth in the
long term. There are clear instances
where green growth initiatives at the
city level can also provide social cobenefits, such as reducing social
exclusion through public transit
enhancements or reducing
households’ energy costs through
energy-efficiency retrofits. But
developing green growth strategies at
the city scale is not an easy task. Key
challenges include how to ensure
integration and co-ordination
between local and national initiatives
and making these efforts broader,
more systematic and long-term. Now
more than ever, funding is another
key issue as cities face demands of
employment generation and service
provision with fewer resources.
www.oecd.org/greencities
Rio+20 brochure [f] [update 1]_Layout 1 06/07/2012 10:04 Page 25
RENEWABLE ENERGY AND THE
OPPORTUNITIES FOR RURAL
DEVELOPMENT
Recent years have seen a rapid
increase in the quantity of energy
produced from renewable sources,
such as wind, solar, geothermal and
small hydropower.
Between 2002 and 2010, overall
investment in renewable
technologies has been estimated at
approximately USD 1 trillion. Due to
the availability of both space and
renewable sources of energy, rural
regions attract a large share of this
investment.
In Germany around 25% of
overall renewable energy
investments goes to rural areas,
and above 60% in countries like
the United States, Canada and
Australia.
OECD case studies suggest that
renewable energy deployment can
positively affect the development
path of rural areas. For instance,
royalties and taxes paid by
developers to local communities
help them to improve the delivery of
key services. New resources can be
used to build schools, senior
residences, or increase broadband
access in sparsely populated areas.
Renewable energy installations can
also create employment
opportunities in maintenance and
operation activities and can spur
self-employment and
entrepreneurship.
However, national and regional
renewable energy policies with very
ambitious targets and high
incentives for renewable energy
production have often caused
distortions, triggering rent-seeking
behaviours, and creating
competition between installations
and agriculture and tourism for land
use or landscape amenities. As a
result, many local communities have
started opposing further
deployment.
Potential links with rural industries
such as forestry or manufacturing
are not developed due to the lack of
an integrated approach to renewable
energy deployment. Reducing the
use of spatially blind incentives set
at the central level, and taking into
account the characteristics and
specific needs of hosting economies
could help to transform the large
investment in an opportunity for
economic development.
Finding out more
www.oecd.org/greengrowth/cities
andregions
Cities and Green Growth (OECD,
forthcoming)
Compact City Policies: A
Comparative Assessment, OECD
Green Growth Studies (OECD,
2012)
The Production of Renewable
Energy as a Regional
Development Policy in Rural
Areas, OECD Green Growth Papers
(OECD, 2012)
OECD Regional Outlook 2011:
Building Resilient Regions for
Stronger Economies, Special Focus:
Innovation and Green Growth in
Regions, (OECD, 2011)
OECD RIO+20 . 25
Rio+20 brochure [f] [update 1]_Layout 1 06/07/2012 10:04 Page 26
International co-operation
for green growth
International co-operation
for green growth
TECHNOLOGY TRANSFER AND
INTERNATIONAL RESEARCH COOPERATION
Ensuring a wide diffusion of green
technologies in areas such as energy,
transport and waste disposal will be
as important as their development.
Environmental issues of
international or global concern can
benefit from international policy coordination which extends beyond
joint commitment to emission
reductions.
OECD work shows that not all
international green technology
transfer and knowledge diffusion
takes place within advanced
economies. In recent years,
emerging and developing economies
have become important destinations
and sources for international
transfer of environmental and
climate change mitigation
technologies. Increasingly, inventors
in non-OECD countries have joined
forces with OECD inventors in the
development of specific
technologies. However, there is
significant potential for further
expansion in North-South and
South-South diffusion of
environmental technologies and
knowledge.
Actions by developing countries to
put in place policies that constrain
emissions will be critical for
encouraging greater international
diffusion of green technologies.
INTERNATIONAL RESEARCH CO-OPERATION IN DESALINATION TECHNOLOGIES
Most important co-authorship relationships between OECD and non-OECD countries
Note: Country of authorship is defined in terms of country of primary affiliation.
Source: OECD calculations based on data from the SCOPUS database. See International Cooperation for Climate Change: A Problem Shared is a
Problem Halved (OECD, forthcoming).
26 . INCLUSIVE GREEN GROWTH: FOR THE FUTURE WE WANT
Rio+20 brochure [f] [update 1]_Layout 1 06/07/2012 10:04 Page 27
However, the lack of stringent
environmental policy signals in
developing countries is not the only
explanation for the low rates. More
general factors such as lack of
financial resources, openness to trade
and foreign direct investment, the
rule of law and the quality of the IPR
system also help to explain why
technology diffusion tends to be
concentrated in developed countries.
However, the most important factor
is unquestionably domestic
innovative (or absorptive) capacity.
The higher the level of domestic
human capital, the greater the
diffusion and adoption of
technologies available on
international markets. This
illustrates the importance of longterm capacity building and education
in technical and scientific areas
underpinning ‘green’ innovation.
One important way to increase
domestic innovation capacity is
through international research
collaboration. Indeed, it is
interesting to see that while much of
the international research cooperation is amongst OECD
economies, some developing
countries have become significant
research partners. The map shows
how frequently researchers based in
OECD and non-OECD countries coauthor scientific papers in the area
of desalination.
International technology-oriented
agreements can play an important
role in encouraging collaboration,
and the evidence indicates that
emerging economies are relatively
more likely to collaborate in the
development of climate mitigation
technologies than in other areas.
The IEA’s “Implementing
Agreements” have played an
important role in encouraging
inventors from different countries to
collaborate in the development of
technologies such as solar and wind
power, carbon capture and storage,
and energy storage, and many of the
emerging economies are playing an
increasingly prominent role in such
agreements.
Finding out more
www.oecd.org/environment/
innovation
www.oecd.org/sti/innovation/green
International Cooperation for
Climate Change: A Problem Shared
is a Problem Halved (OECD,
forthcoming working paper)
Energy and Climate Policy and
Innovation: Bending the
Technological Trajectory, OECD
Studies on Environmental
Innovation (OECD, 2012)
International Technology
Agreements for Climate Change:
Analysis Based on Co-Invention
Data, OECD Environment Working
Papers, No. 42 (OECD, 2012)
Invention and Transfer of
Environmental Technologies, OECD
Studies on Environmental
Innovation (OECD, 2011)
OECD RIO+20 . 27
Rio+20 brochure [f] [update 1]_Layout 1 06/07/2012 10:04 Page 28
www.oecd.org/trade/env
REDUCING BARRIERS TO TRADE
IN ENVIRONMENTAL GOODS
AND SERVICES
Achieving greener growth will
require numerous goods and services
to enable factories and buildings to
use energy more efficiently, to reduce
air and water pollution, to make the
transition to more sustainable uses
of energy, and to provide sanitation
and clean drinking water. Many of
these goods and services will be
procured locally, but some will only
be available, or available more
cheaply, from foreign suppliers.
Trade in both environmental goods
and services (EG&S) often goes hand
in hand. For example, there is a fastgrowing trade in services
monitoring, repairing and even
remotely operating renewableenergy facilities such as wind
turbines and bio-gas plants.
At one point in the negotiations
on liberalising trade in
environmental goods at the WTO,
the number of products proposed
by member economies for
including on a list of such goods
numbered more than 400.
Trade can help the environment
both through achieving a more
efficient use of resources and by
serving as a conduit for the transfer
of green technologies. Willingness
within the international community
to reduce barriers to trade in EG&S
appears to be growing. The OECD
has been active in providing input to
such efforts by the WTO, APEC and
NGO coalitions. But, currently, trade
barriers still reduce the quality of
the needed inputs and make their
supply more expensive, rendering
progress along the path of green
growth more difficult.
Reducing or eliminating import
tariffs on environmental goods is
relatively easy to implement with
the appropriate political support.
But many of the barriers to trade in
EG&S are of a non-tariff nature and
require more frequent consultation
and co-ordination among the
countries concerned. Local-content
obligations, for example, are
conditions imposed on producers or
investors — often in the context of
subsidies, tax breaks, or government
procurement — that specify a
minimum share of goods or services
associated with a project that have
to be procured locally. Such
obligations have arisen in several
countries, or their provinces, notably
in connection with renewable
energy. The OECD is currently
working to document the incidences
of these and other domestic
incentive measures and to explain
their effects on production,
consumption and trade in the
affected goods.
Trade-Related Measures Based
on Processes and Production
Methods in the Context of
Climate-Change Mitigation,
OECD Trade and Environment
Working Papers, no. 2011/04
(OECD, 2011)
Trade in Services Related to
Climate Change: An Exploratory
Analysis, OECD Trade and
Environment Working Papers, no.
2011/03 (OECD, 2011)
Facilitating Trade in Selected
Climate Change Mitigation
Technologies in the Energy
Supply, Buildings, and Industry
Sectors, OECD Trade and
Environment Working Papers, no.
2009/02 (OECD, 2009)
From 1996 through 2010, world trade in environmental goods – as defined by a
list drawn up by the OECD in the late 1990s – tripled in nominal value terms.
Over the same period, the share accounted for by non-OECD countries grew
fourfold, from 6% to 24%.
WORLD TRADE IN ENVIRONMENTAL GOODS
1996 – 2010
Billions of nominal US dollars
International co-operation
for green growth
Finding out more
700
World
OECD
China
600
500
400
300
200
100
0
1996
1998
2000
2002
2004
2006
2008
Note: “Environmental goods” refer to those included in the OECD’s illustrative list in
Environmental Goods and Services: the Benefits of Further Trade Liberalisation (OECD, 2001)
Source: OECD based on WTO trade data.
28 . INCLUSIVE GREEN GROWTH: FOR THE FUTURE WE WANT
2010
Rio+20 brochure [f] [update 1]_Layout 1 06/07/2012 10:05 Page 29
ENSURING FREEDOM OF
INVESTMENT AND PREVENTING
PROTECTIONISM
International investment is a vital
source of finance and a powerful
vector of innovation and
technology transfer as countries
address the effects of climate
change and seek to promote green
growth.
The OECD-hosted Freedom of
Investment (FOI) Roundtable,
bringing together some 50
governments from around the
globe, has issued a statement,
Harnessing Freedom of Investment for
Green Growth, which underscores
the importance of continued
monitoring by governments of
their investment treaty practices
regarding environmental goals.
New environmental measures
should also observe key
international law principles such
as non-discrimination (creating a
level playing field for domestic and
international investors).
International investment
arbitration is assuming a growing
role in resolving disputes involving
environmental issues, placing
special responsibility on the
investment policy community to
ensure the integrity and
competence of arbitral tribunals
and to improve their transparency.
The FOI Roundtable also addresses
concerns expressed by some
countries that investment could be
affected if the green growth policy
agenda were captured by
protectionist interests. However, to
date, none of the 42 OECD and
emerging economies that report
regularly to the Roundtable about
investment measures have
reported overt discrimination
against non-resident or foreign
investors in relation to
environmental policy. Nonetheless,
vigilance is encouraged.
Environmental policy measures that
appear to be neutral may potentially
involve de facto discrimination or
create barriers to trade which
constrain development. Some
environment-related state aids (such
as grants, loan guarantees or capital
injections for individual firms), may
potentially pose risks to
competition.
The FOI Roundtable will continue
to monitor investment measures to
ensure that they are not used as
disguised protectionism. As part of
its general monitoring of investment
measures, the Roundtable invites
States to report on whether their
investment treaty arbitration cases
have any impact on environmental
policy.
Finding out more
www.oecd.org/daf/investment/foi
Harnessing Freedom of Investment for Green Growth, Freedom of
Investment Roundtable (OECD, 2011)
Defining and Measuring Green FDI: An Exploratory Review of Existing
Work and Evidence, OECD Working Papers on International Investment, No.
2011/02 (OECD, 2011)
Stocktaking of Domestic Greenhouse Gas Emission Reporting Schemes
(OECD, forthcoming working paper)
The OECD Guidelines for Multinational Enterprises are
recommendations addressed by governments to
multinational enterprises. They provide voluntary
principles and standards for responsible business
conduct.
The Guidelines encourage communication practices
in areas where reporting standards are still
evolving, such as social, environmental and risk
reporting. This is particularly the case with GHG
emissions. In line with an increased demand for disclosure of non-financial
information by companies, the OECD is currently taking stock of
government schemes promoting corporate GHG emissions disclosure with
a view to identify related benefits and challenges for governments,
companies and investors.
www.oecd.org/daf/investment/guidelines
OECD RIO+20 . 29
Rio+20 brochure [f] [update 1]_Layout 1 06/07/2012 10:05 Page 30
International co-operation
for green growth
DEVELOPMENT ASSISTANCE FOR
GREEN GROWTH AND
SUSTAINABLE DEVELOPMENT
Official development assistance
(ODA) plays an important role in
areas where private sector flows
are scarce – such as human and
institutional capacity
development – to create enabling
conditions for greener growth.
OECD countries make up the main
donor countries, and have been
working with developing country
partners to identify how ODA can
best support their sustainable
development.
Sustainable natural resource
management is now a priority
focus of many bilateral aid
programmes and Environmental
Impact Assessments are a
standard requirement of all
significant aid-funded
infrastructure projects in
developing countries. Moreover, aid
can play an instrumental role to
avoid lock-in to carbon-intensive
infrastructures and in many cases
to mobilise private investment in
these areas.
change and environmental
degradation. It should aim to assist
with major developmental shifts,
such as urbanisation, where the
scale of investment needed is large
and the sustainability of its planning
is particularly important for
advancing green growth.
ODA for renewable energies
recently surpassed that of ODA
for non-renewable energies.
The OECD has recently accelerated its
efforts in applying lessons learned
from enhancing development
effectiveness to climate change
finance, which is set to increase
substantially to USD 100 billion
annually by 2020. This work includes
ensuring the effectiveness of its
delivery and using the finance
critically not only for the impact of
mitigation and adaptation measures
but also for development outcomes
and poverty reduction.
AID ACTIVITIES TARGETING THE THREE RIO CONVENTIONS
2009-10 average commitments by Development Assistance Committee (DAC)
members, constant 2010 prices
Climate change
mitigation
USD 13.7 bn.
Desertification
USD 2.7 bn.
In 2010 OECD donors allocated
about USD 3 billion to railway
transport which could
potentially reduce private
transport demand and the
associated GHG emissions.
ODA’s contribution to green growth
in developing countries can be
further strengthened by ensuring
that climate proofing and disaster
risk reduction approaches are
mainstreamed in aid-funded
public investments. Similarly aid
for poverty reduction needs to
promote livelihoods that are more
secure and resilient to climate
Biodiversity
USD 5.7 bn.
Source: OECD DAC Creditor Reporting System (CRS)
The OECD collects data on aid flows to key sectors related to green growth and
sustainable development such as energy, water, agriculture and forestry. It has
also been tracking aid for environmental purposes for over two decades and aid
targeted to the three Rio Conventions on biodiversity, desertification, and
climate change since 2000.
www.oecd.org/dac/stats/rioconventions
30 . INCLUSIVE GREEN GROWTH: FOR THE FUTURE WE WANT
Rio+20 brochure [f] [update 1]_Layout 1 06/07/2012 10:05 Page 31
Bilateral ODA for general environmental protection from DAC members grew
from USD 1.9 billion in 2001-02 to USD 5.1 billion in 2010.
Support for other activities addressing environmental sustainability rose from
USD 5.8 billon to USD 20.3 billion in 2009-10.
USD billion
ENVIRONMENT AID
2001-2010, commitments by DAC members, constant 2009 prices
30
Total environment-focused aid (includes "significant objective")
Other activities with environment as "principal objective"
Finding out more
Environment as a sector
25
www.oecd.org/dac/greengrowth
20
Development Co-operation Report
2012 (OECD, forthcoming)
15
Strategic Environmental
Assessment in Development
Practice: A Review of Recent
Experience (OECD, 2012)
10
5
0
2001
2002
2003
2004
2005
2006
2007
2008
2009
2010
The Mutual Review of Development
Effectiveness in Africa 2010: Promise
and Performance, OECD/United
Nations Economic Commission for
Africa (OECD, 2011)
Source: OECD DAC Creditor Reporting System (CRS)
PROMOTING KNOWLEDGE-SHARING
The OECD has joined forces with the Global Green
Growth Institute, UNEP and the World Bank to
establish the Green Growth Knowledge Platform
(GGKP). Launched in January 2012, the GGKP is an
international knowledge-sharing platform that identifies
and addresses major knowledge gaps in green
growth/green economy theory and practice. It aims to
provide practitioners and policymakers with better tools
to foster economic growth and implement sustainable
development, including any commitments that emerge
from Rio+20.
All GGKP research and knowledge-sharing activities
operate with an understanding that the green growth
and green economy policy mix will vary according to
country-specific circumstances, thereby necessitating a
menu of policy options and toolkits. These will seek to
improve local, national, and global economic
policymaking around the world by providing rigorous
and relevant analysis of the various synergies and
tradeoffs between the economy and the environment.
The GGKP will complement other efforts by emphasizing
policy instruments that yield local environmental cobenefits while stimulating growth, providing a
compelling set of incentives for governments.
www.greengrowthknowledge.org
OECD RIO+20 . 31
Rio+20 brochure [f] [update 1]_Layout 1 06/07/2012 10:05 Page 32
Measuring well-being and
progress towards greener growth
Measuring well-being and
progress towards greener growth
For almost 10 years, the OECD has
been looking beyond the functioning
of the economic system to the diverse
experiences and living conditions of
people and households. The OECD
agenda on measuring well-being and
progress calls for improved and new
statistical measures, aimed at filling
the gap between standard economic
statistics (which are mainly focused
on measuring the volume of market
activity and related macro-economic
statistics) and indicators that have a
more direct bearing on people’s lives.
Work on the latter aspect can be
grouped under the following three
pillars of the OECD Measuring
Progress framework:
Material well-being includes the
commodities and resources
available to individuals and
households. To improve
measurement in this area, the
OECD is working in different
directions such as: measuring
OECD FRAMEWORK FOR MEASURING WELL-BEING AND PROGRESS
HUMAN WELL-BEING
Different outcomes for different
people (inequalities):
Quality of life
Material living
conditions
GDP
Health status
Work and life balance
Education skills
Social connections
Civic engagement
and governance
Environmental quality
Personal security
Subjective well-being
Income and wealth
Jobs and earnings
Housing
Regrettables
SUSTAINABILITY OF WELL-BEING
OVER TIME
Requires preserving different types of capital:
Natural capital
Economic capital
Human capital
Social capital
32 . INCLUSIVE GREEN GROWTH: FOR THE FUTURE WE WANT
disparities in National Accounts;
measurement of services produced
by households for their own use;
analysing and explaining the
difference between volume growth
in real GDP per capita and real
household income per capita; and
developing an integrated
framework on income,
expenditures and wealth.
Quality of life gathers nonmonetary aspects that shape
people’s ‘doings and beings’. This
work mainly focuses on developing
guidelines on the measurement of
subjective well-being, improved
measures of environmental quality
of life and measures of resilience
and vulnerability.
Sustainability can be assessed by
looking at the set of key economic,
social and environmental assets
transmitted from current to future
generations, and whether these
assets will allow people to meet
their own needs in the future. To
capture the broad notion of
economic, social and
environmental sustainability, the
OECD is monitoring key natural
resources, estimating carbonemissions embedded in
consumption, and measuring
human capital.
Finding out more
www.oecd.org/measuringprogress
oecdbetterlifeindex.org
Rio+20 brochure [f] [update 1]_Layout 1 06/07/2012 10:05 Page 33
The OECD’s work on green growth
indicators is a key part of its
broader agenda on measuring
progress and well-being. It can
complement GDP by measuring and
communicating progress on the
decoupling of pollution and
resource consumption from growth,
as well as the impact of economic
activity on natural assets and
human well-being. For developing
countries, these indicators can be
also used to provide valuable
feedback for international donors,
financial institutions and corporate
partners.
The OECD works closely with other
relevant organisations to develop a
common framework that can be
easily used by all countries, taking
into account their national
circumstances and capacities. Given
the complexity of green growth that
cuts across economic,
environmental and social
dimensions, progress towards policy
objectives cannot be easily captured
by a single measure but rather by a
set of markers that identify
necessary conditions for green
growth. To this end, the OECD Green
Growth Measurement Framework is
a powerful tool for providing a body
of evidence to support the policy
dialogue on whether:
The 2011 report Towards Green
Growth: Monitoring Progress - OECD
Indicators proposes a set of twentyfive indicators on the basis of
existing work in international
PROPOSED GREEN GROWTH INDICATOR GROUPS AND TOPICS COVERED
1
The environmental and
resource productivity
of the economy
• Carbon and energy productivity
• Resource productivity: materials, nutrients,
water
• Multi-factor productivity
2
The natural asset base
• Renewable stocks: water, forest, fish
resources
• Non-renewable stocks: mineral resources
• Biodiversity and ecosystems
3
The environmental
dimension of quality of
life
• Environmental health and risks
• Environmental services and amenities
4
Economic opportunities
and policy responses
• Technology and innovation
• Environmental goods and services
• International financial flows
• Prices and transfers
• Skills and training
• Regulations and management approaches
economic growth is becoming
greener;
there is risk of future shocks to
growth linked to deterioration of
natural resources;
people benefit from greener
growth; and
greening the economy is opening
new sources of growth.
organisations, and in OECD and
partner countries. The framework
divides indicators into four interlinked groups reflecting the main
features of green growth.
Socio-economic context
and characteristics of
growth
• Economic growth and structure
• Productivity and trade
• Labour markets, education and income
• Socio-demographic patterns
OECD RIO+20 . 33
Rio+20 brochure [f] [update 1]_Layout 1 06/07/2012 10:05 Page 34
Measuring well-being and
progress towards greener growth
OECD GREEN GROWTH MEASUREMENT FRAMEWORK
Economic activities (production, consumption, trade)
Outputs
Consumption
Inputs
Production
Income Goods
and Services
Households
Governments
Recycling,
re-use
remanufacturing
substitution
Residuals
Investments
4
Resources
Multi-factor
productivity
1
3
Amenities, health
and safety aspects
Service
functions
Policies,
measures,
opportunities
Labour
Capital
Pollutants
waste
Sink
functions
Energy and raw materials,
water, land, biomass, all
2
Resource
functions
Natural asset base (capital stocks, environmental quality)
The OECD will continue working
with countries to advance the green
growth measurement agenda, fill
some of the most important
information gaps, and contribute to
the implementation of the System of
Environmental and Economic
Accounting in areas relevant to
green growth. The aim is to:
Fill gaps in environmentaleconomic data at the industry
level.
Develop and improve the physical
data for key stocks and flows of
natural assets, including
information on land resources and
non-energy mineral resources that
often constitute critical inputs
into production.
Further develop physical data to
help improve material flow
analyses.
Improve information on
biodiversity.
Develop monetary values to
reflect prices and quantities for
(changes in) key stocks and flows
of natural assets. Such valuations,
even if incomplete and imperfect
are required for extended growth
accounting models, more
comprehensive balance sheets
and for adjusted measures of real
income.
Produce information on how
environmental concerns trigger
innovation in companies.
Develop indicators on
environmental regulation to
complement indicators on
economic instruments.
At the same time, the OECD, UNEP
and the World Bank are working
closely together, and also with other
organisations, including the UN
Statistics Division, other UN
agencies, EUROSTAT, and the
European Environment Agency, to
develop a common set of core
indicators for the green economy.
INDICATORS DATABASE
The OECD has recently launched an online
database containing selected indicators for
monitoring progress towards green growth
to support policy making and inform the
public at large. The indicators draw upon
the OECD's expertise with statistics,
indicators and measures of progress.
Improve measures on both the
objective and the subjective
dimensions of quality of life, in
particular measures of
environmentally induced health
problems and related costs; and
public perceptions.
34 . INCLUSIVE GREEN GROWTH: FOR THE FUTURE WE WANT
The dataset covers OECD countries as
well as the BRIICS economies (Brazil,
Russian Federation, India, Indonesia,
China and South Africa), Argentina and
Saudi Arabia from 1990 onwards.
stats.oecd.org
Rio+20 brochure [f] [update 1]_Layout 1 06/07/2012 10:05 Page 35
Towards headline indicators for
green growth
As part of the next steps of its Green
Growth Strategy, Ministers have
asked the OECD to define a small set
of headline indicators that can
support national economic policies
by tracking central elements of
green growth, while at the same
time conveying a clear message to
the public and policy makers.
Based on a preliminary reflection
and in co-ordination with other
international initiatives, notably the
UNEP’s framework for Green
Economy indicators, the following
six indicators are under
consideration and development and
will be augmented with an indicator
reflecting economic opportunities
and policy responses:
OECD green growth indicators in practice
Countries like the Czech Republic, Korea and the Netherlands have already
applied the OECD green growth measurement framework and indicators to
their specific national contexts to assess their state of green growth. With the
support of OECD, the Latin America Development Bank, the Latin American
and the Caribbean Economic System and the United Nations Industrial
Development Organization, work is underway in Mexico, Colombia, Costa
Rica, Ecuador, Guatemala, and Paraguay to apply the OECD indicators as a
way to identify key areas of national concern and the scope for improving the
design, choice and performance of policy instruments.
CO2 productivity (demand-based
and production-based)
Non-energy material productivity
by material group (demand-based
and production-based)
Finding out more
www.oecd.org/greengrowth/indicators
Multifactor productivity adjusted
for environmental services
Towards Green Growth: Monitoring Progress – OECD Indicators (OECD, 2011)
Index of natural resource stocks
Sustainable Manufacturing Toolkit: www.oecd.org/innovation/green/toolkit
Change in land cover
Material Resources, Productivity and the Environment (OECD, forthcoming)
Population exposure to fine
particles (PM 2.5)
Mortality Risk Valuation in Environment, Health and Transport Policies (OECD,
2012)
OECD RIO+20 . 35
Rio+20 brochure [f] [update 1]_Layout 1 06/07/2012 10:05 Page 36
Transforming sectors
An increase of 3° - 5° C in global
mean temperatures would likely
result in a fall in maize and
wheat yields, high production
losses of pigs and confined cattle,
and increased heat stress and
mortality in livestock.
Transforming sectors
FOOD, AGRICULTURE AND
FISHERIES
Agriculture has usually responded
successfully to the need to produce
more, initially by expanding the land it
occupied and then by producing more
intensively on that land. But world
population is projected to grow by a
third by 2050 and demand for food will
double. Farmers will be in competition
with urbanisation and infrastructure
projects for land and other resources
such as water, and the negative
impacts of further intensification on
the environment may limit
improvements to yields.
To meet the needs of an expected
9 billion people by 2050, food
production will need to increase
by 70% - 100% compared with
current levels.
Agriculture uses on average over
40% of water and land resources
in OECD countries.
Farming and fishing have significant
impacts on the environment. Climate
change will also have an effect on
agriculture and food production. The
challenge for policy makers is to meet
increasing demands for food and
resources while minimising
environmental and social pressure.
Developing countries will need an
estimated investment of USD 209
billion per year to meet the food
needs of their growing
populations.
36 . INCLUSIVE GREEN GROWTH
The OECD Green Growth Study: Food and Agriculture
(2011) argues that a greener and more effective food
chain can contribute substantially to sustainable
growth and food security, and pave the way for less
pressure on marine and land resources. It identifies
three priority areas where coherent action is required:
Increase productivity in a sustainable way: Increasing
resource use efficiency throughout the supply chain
will not only ensure more production relative to
inputs used, but also conserve scarce natural
resources and deal with waste.
Ensure that well functioning markets provide the right signals: Prices that
reflect the scarcity value of natural resources as well as the positive and
negative environmental impacts of the food and agriculture system will
contribute to resource use efficiency.
Establish and enforce well-defined property rights: Property rights help
ensure optimal resource use, in particular for marine resources, land and
forests, greenhouse gas emissions, and air and water quality.
www.oecd.org/agriculture/greengrowth
Rio+20 brochure [f] [update 1]_Layout 1 06/07/2012 10:05 Page 37
FISHERIES AND AQUACULTURE
As natural capital is used up, it
becomes more expensive to replace it
with technology and other resources.
About half of the fish stock groups
monitored by the FAO are fully
exploited and a third overexploited,
depleted or recovering from depletion.
Poorly managed fisheries leave the
environment and profitability at risk.
Allowing fish stocks to be drawn down
below the point where they offer
maximum returns hurts the
profitability of fishers and the
potential contribution of the sector to
the economy and food supply, as well
as ocean ecosystems.
Finding out more
OECD-FAO Agricultural Outlook (OECD, FAO, 2012)
Agricultural Policies for Poverty Reduction (OECD, 2012)
Food and Agriculture, OECD Green Growth Studies (OECD, 2011)
The Economics of Rebuilding Fisheries (OECD, 2012)
Fisheries: While Stocks Last? OECD Insights (OECD, 2010)
Change can be sudden, unpredictable
and irreversible.
Some stocks can recover from
catastrophic collapse, as did the
Peruvian anchovetta, while others fail
to do so, like the cod stocks in the
Northwest Atlantic.
Approximately 30% of the world’s
fish stocks are overexploited,
depleted, or recovering from
depletion and 50% are fully
exploited.
Policies have to be coherent with
activities outside the fish sector.
For example, fertilizer and pesticides
from agriculture can cause dead zones
such as the 6 000 - 7 000 square mile
zone in the Gulf of Mexico. Tourism
and commerce may compete with fish
production for access to infrastructure.
Principles and guidelines for rebuilding
fisheries recommended by the OECD in
2012 address these issues. The key
message is that if fisheries are
managed in a sustainable and
responsible way, rebuilding won’t be
necessary. OECD work calls for a
comprehensive assessment that
recognises the interplay between the
economics of fishing activity, the
biological state of the stocks,
management and governance.
www.oecd.org/fisheries
OECD RIO+20 . 37
Rio+20 brochure [f] [update 1]_Layout 1 06/07/2012 10:05 Page 38
Transforming sectors
ENERGY
Rising energy demand and the need to
drastically cut CO2 emissions require a
transformation in the way we produce,
deliver and consume energy. The
current energy system is highly
dependent on fossil fuels, whose
combustion accounted for 84% of
global greenhouse gas emissions in
2009, according to the IEA. Global
demand for energy is rapidly
increasing, because of population and
economic growth, especially in large
emerging market economies, which
will account for 90% of energy
demand growth to 2035. At the same
time, 1.3 billion people worldwide still
lack access to electricity.
As developed countries renew their
energy infrastructure and developing
countries build new power plants to
meet growing demand, there is a
window of opportunity to achieve
greener energy production. IEA
analysis shows that worldwide
energy-related emissions of CO2
could be halved by 2050, using
existing and emerging technologies,
at an additional new investment of
USD 46 trillion.
Promoting innovation and creating new
markets and industries can reduce the
sector’s carbon-intensity and improve
energy efficiency, as well as create
opportunities for economic growth and
employment. It is vital for governments
to create the enabling policy
framework to catalyze private sector
investment. By acting now, long-term
costs can be reduced: every US dollar
Finding out more
www.iea.org
World Energy Outlook 2011 (IEA,
2011)
that is not spent on investment in the
energy sector before 2020 will require
an additional USD 4.3 to be spent after
2020 to compensate for increased
greenhouse gas emissions by building
zero-carbon plants and infrastructure
by 2035 (IEA, 2011).
The joint
report by the
OECD and
IEA, Green
Growth
Studies:
Energy (2011)
highlights the
challenges
facing energy
producers
and users, how they can be
addressed using green growth
policies, and how to reshape the
political economy of reform.
GTCO2
KEY TECHNOLOGIES FOR A LOW-CARBON ENERGY SYSTEM IN 2050
60
Baseline emissions 57 Gt
55
Carbon capture and storage 19%
50
45
Renewables 17%
40
Nuclear 6%
Power generation efficiency and fuel switching 5%
35
End-use fuel switching 15%
30
25
End-use fuel and electricity efficiency 38%
20
15
BLUE MAP emissions 14 Gt
10
5
WEO 2009 450 ppm case
ETP2010 analysis
0
2010
2015
2020
2025
2030
2035
Source: Energy Technology Perspectives 2010, IEA
38 . INCLUSIVE GREEN GROWTH: FOR THE FUTURE WE WANT
2040
2045
2050
Rio+20 brochure [f] [update 1]_Layout 1 06/07/2012 10:05 Page 39
WATER
According to the OECD Environmental
Outlook to 2050, global water demand is
projected to increase by 55% between
2000 and 2050, and tensions could
increase as domestic users,
manufacturing, electricity generation
and other economic sectors compete
with agriculture for access to resources.
By 2050, over 40% of the global
population are likely to be living in river
basins under severe water stress.
Despite progress in increasing access to
improved water sources and sanitation,
more than 240 million people are
expected to remain without access to
“improved” –but not necessarily safe –
water sources by 2050. Almost 1.4
billion people are projected to still be
without access to basic sanitation in
2050, mostly in developing countries.
According to the World Health
Organization, investments to meet
the water and sanitation MDGs
could have a benefit-to-cost ratio
of 7 to 1.
Green growth policies in the water
sector need to address both quantity
and quality issues, encourage waterrelated innovation and investment in
green infrastructures, and they need to
be integrated with policies in sectors
that have an impact on water
availability and use - especially
agriculture, energy, and land use.
Sustainable financing, effective
governance and policy coherence are
key.
Sustainable pricing of water and water
related services can signal the scarcity
of the resource, promote efficiency and
manage demand. Targeted social
support is more effective than low
tariffs (or the absence of tariffs) to
combine investment in water supply
and sanitation systems and
affordability for poor households.
Finding out more
Restoring environmental flows and
allocating more water to watershed
services will help maintain the
valuable ecosystem services they
provide. Removing incentives which
encourage people to settle or invest in
flood-prone areas can reduce the
impact of water-related disasters.
www.oecd.org/water
Health and other dividends
Investing in water supply and
sanitation infrastructure brings
important dividends, in particular in
urban slums where unsafe water and
lack of sanitation generates huge
health costs and lost economic
opportunities. Innovative techniques
and business models with private
sector involvement will be needed.
OECD Environmental Outlook to
2050: The Consequences of Inaction
(OECD, 2012)
Meeting the Water Reform
Challenge (OECD, 2012)
Water Quality and Agriculture:
Meeting the Policy Challenge (OECD,
2012)
Public support for water-related R&D
and building the capacity of users is
justified to improve and increase the
use of appropriate wastewater
treatment equipment and techniques,
and the efficient management of
nutrients and agricultural run-off.
Experience shows that building the
capacity of users (essentially that of
farmers) in target economies through
training and education can be even
more relevant and effective than
transferring technologies.
Additional benefits can include saving
energy and cutting investment
requirements and operation and
maintenance costs. However, there are
also risks, notably pollution of
agricultural land or health risks. OECD
work on eco-innovation for water
explores economic and policy issues
associated with the use of alternative
water resources and innovative
technologies, such as smart water
systems.
OECD RIO+20 . 39
Rio+20 brochure [f] [update 1]_Layout 1 06/07/2012 10:05 Page 40
Total CO2 emissions from freight
and passenger transport
combined worldwide are expected
to grow 1.5 to 2.4 times their
2010 levels by 2050.
Automobiles
A large part of public expenditure to
stimulate green growth has been
directed at alternative vehicles, and
electric cars in particular. Some
governments are also making longterm investments in high speed rail, to
reduce the use of car and short-haul
aviation traffic.
Priority should be given to improving
the fuel efficiency of conventional
engines, through fuel economy and
CO2 emissions standards and
economic incentives such as feebates,
before gradually introducing
alternative technologies. Managing
congestion is central to sustainable
transport.
The congestion charge scheme in
London has seen a 6% increase in
bus passengers during charging
hours, and raised GBP 148 million
in 2009/10 to be invested in
improving transport.
Rail
High speed rail can compete
effectively with passenger cars and air
transport over distances up to 1 000
kilometres where traffic is dense.
Investment in high speed rail is likely
to reduce GHGs from traffic, but the
reduction is small and may take
decades to compensate for the
emissions from construction. The
economic benefits of high speed rail,
including stimulating local
employment, can be significant, but
should be closely assessed.
Maritime transport
Regulations and advocacy through both
international and territorial policy
action, and continued development of
environmental performance metrics in
global supply-chain networks can
create market-based incentives for lesspolluting maritime transport.
Aviation
Investment in fuel efficient technologies
and fleet renewal will largely determine
the environmental impact of aviation.
Fuel prices, tax and regulatory policies
will influence the composition of the
fleet. An internationally agreed
emissions trading system would be
more effective than taxes on passenger
ticket sales. Better management of air
space will also contribute to reducing
both emissions and noise.
Tradeoffs
Governments should consider tradeoffs
among various policy objectives, for
example in aero engine design between
noise and emissions, or when
improvements in passenger car fuel
efficiency reduce fuel tax revenues. As
green growth policies spread, it is
necessary to review the way the
transport sector is taxed. It is also
necessary to consider the political
economy of congestion charges based
on experience with existing systems,
and conduct comprehensive socioeconomic appraisal of countries’
transport investments and policies.
Finding out more
www.internationaltransport
forum.org
2012 Transport Outlook (ITF, 2012)
Environmental Impacts of
International Shipping: The Role of
Ports (OECD, 2011)
Globalisation, Transport and the
Environment (OECD, 2010)
Green Growth and Transport, ITF
Discussion Paper no. 2 (ITF, 2011)
Reducing Transport Greenhouse Gas
Emissions: Trends and Data, (ITF,
2011)
Strategic Transport Infrastructure
Needs to 2030, (ITF, 2011)
CAR OWNERSHIP IN RELATION TO GDP
2010–2050
Index, 2010 = 100
Transforming sectors
TRANSPORT
Transport has major environmental
impacts in terms of GHG emissions,
air pollution and noise. Maritime and
air transport represent smaller shares
of total emissions than road.
400
400
Non-OECD Countries
OECD Countries
350
350
High car ownership –
High GDP
300
300
Low car ownership –
High GDP
250
250
Low car ownership –
Low GDP
200
200
150
150
100
100
50
2010
50
2020
2030
2040
2050
2010
2020
Source: 2012 Transport Outlook, International Transport Forum (ITF).
40 . INCLUSIVE GREEN GROWTH: FOR THE FUTURE WE WANT
2030
2040
2050
Rio+20 brochure [f] [update 1]_Layout 1 06/07/2012 10:11 Page 41
Policy Statement to the
Rio+20 Conference
From the OECD Environment Policy Committee Ministerial
Meeting on 29-30 March 2012
We, ministers1 assembled at the OECD Headquarters
on 29-30 March 2012;
We recall that sustainable development is an
overarching goal of OECD governments and the OECD,
as was noted in the Communiqué of the May 2001
OECD Meeting of Council at Ministerial level (MCM)
[PAC/COM NEWS(2001)48]. We emphasise the
importance of continuing work on sustainable
development at the OECD.
We further recall that the 2009 MCM adopted the
“Declaration on Green Growth” [C/MIN(2009)5/ADD1/
FINAL] while the 2011 MCM welcomed the OECD’s
Green Growth Strategy [C/MIN(2011)4 and its ANN1&2;
C/MIN(2011)5 and C/MIN(2011)5/FINAL].We consider
green growth a practical means of achieving many of
the goals of sustainable development, not a
replacement for it. We note that the aim of green
growth is closely aligned with one of the two major
themes of the Rio+20 Conference, namely green
economy in the context of sustainable development
and poverty eradication. We support the ongoing work
of the OECD on green growth, and welcome the
contribution that it makes to discussions at the Rio+20
Conference.
We welcome the OECD’s Environmental Outlook to 2050
(the Outlook) which we called for at our meeting in
2008. We consider that it contains important findings
in the fields of climate, water, biodiversity and human
health that should usefully inform deliberations at the
forthcoming Rio+20 Conference. We also recognise the
need for further attention by the OECD to other
environmental issues, including resource and energy
efficiency, sustainable agriculture and food security,
chemical risk reduction and waste management, and
environment-related spatial planning.
The Outlook demonstrates the need for urgent policy
action to address key environmental challenges, change
the course of development, and avoid potentially
significant consequences and costs of inaction. We
confirm the Outlook findings that a business-as-usual
approach to growth and development would place grave
pressures on the earth’s biosphere. Although
uncertainties remain about environmental thresholds,
crossing them would entail real reductions in well-being
and welfare.
We further note that strong governance and welldesigned policies can significantly relieve these
pressures while still meeting the legitimate development
aspirations of everyone. We recognise the importance of
establishing the right conditions to ensure a smooth
transition to an inclusive and equitable green growth.
We consider that the OECD’s Green Growth Strategy,
released in May 2011 and augmented by subsequent
analyses, provides an important policy toolkit with
which to address many of the developmental challenges
facing the global community. We look forward to the
OECD’s forthcoming report on green growth and
developing countries including emerging economies, and
welcome the contribution of these emerging economies
to the report in order to maximise its policy relevance
and usefulness.
We ask the OECD to broaden its green growth analysis
both thematically and sectorally, recognising that green
growth should be encouraged across all sectors and take
into account the linkages between different sectors. We
stress that the idea of green growth is not a replacement
for the broader paradigm of sustainable development.
Green growth aims to foster economic growth and
development while ensuring that natural assets continue
to provide the resources and environmental services on
OECD RIO+20 . 41
Rio+20 brochure [f] [update 1]_Layout 1 06/07/2012 10:11 Page 42
Policy Statements
which our well-being relies. Green growth is not a onesize-fits-all prescription, but is instead an approach that
aims to take account of different levels of development,
resource endowments and environmental pressures.
We support efforts to mainstream green growth into
economic policy, and recognise the important role of
finance and economy ministries, working together with
our own ministries as well as those responsible for
innovation, skills development, natural resource
management, agriculture and energy amongst others. The
private sector will play a major role in delivering green
growth. We emphasise the need for governments to
establish enabling frameworks that leverage private
investment, and to work effectively in partnership with
the private sector and civil society in achieving green
growth. The success of green growth policies depends on
the awareness of consumers and enterprises of the need
and possibilities for change, and the willingness of
governments to promote policies to alter incentives for
these groups. This underlines the importance of access to
environmental information, public awareness and
participation, and effective access to judicial and
administrative review of decisions that may affect the
environment. We look to the OECD to work with countries
to explore implementation paths and governance
approaches that are adapted to different country settings.
We underline that if countries are to effectively monitor
their implementation of national green growth strategies
and their progress towards any goals that may be agreed
at the Rio+20 Conference, practical measurement tools
will need to be developed. We commend the OECD’s
ongoing work on green growth indicators [C/MIN(2011)5/
FINAL] as a useful complement to GDP by providing a
means to measure and communicate progress on the
decoupling of pollution and resource consumption from
growth, as well as the impact of economic activity on
natural assets and human well-being, including
protection of public health. We urge the OECD to work
with other relevant organisations to develop a common
framework that can be easily and practically used by all
countries, taking into account their national
circumstances and capacities. We seek wider support for
such indicators at the Rio+20 Conference. We commit to
ensuring that the green growth policy agenda, open trade
and investment for sustainable development, and the
spread of green technologies and innovation are
mutually supportive. We stress that green growth should
42 . INCLUSIVE GREEN GROWTH: FOR THE FUTURE WE WANT
not constitute a means of discrimination or provide a
pretext for economic protectionism; at the same time,
trade and investment policy must not be a barrier to
green growth or sustainable development. We note that
the OECD has so far found no evidence of green
investment protectionism. International co-operation,
including capacity building, should be strengthened to
support clean production in all countries and to avoid a
shift of polluting production to countries with less
stringent regulations. We ask the OECD to continue to
estimate and assess fossil fuel and other subsidies, with
a view to supporting countries in their efforts to
rationalise or phase out environmentally-harmful and
inefficient subsidies, such as fossil fuel subsidies, that
encourage wasteful consumption, while providing
targeted support for the poorest.
We consider that work on sustainable development and
environment should be a priority in OECD cooperation
with enhanced engagement countries (Brazil, China,
India, Indonesia and South Africa), Russia and other
emerging and developing countries. We recognise the
importance for all of sharing policy experiences,
including through the Organisation’s improved and
streamlined peer review processes so that green growth
can be grounded in country-specific policy advice. We
support efforts to accelerate and broaden the world-wide
transition towards an inclusive green economy that
promotes sustainable development and poverty
eradication, and to drive international action and
increase co-operation in key areas for environmental and
social development such as agriculture, water, energy,
employment and education. We are committed to
strengthen governance structures at all levels (local, subnational, national, regional, global) that underpin the
delivery of sustainable development and the
achievement of internationally agreed goals. We look
forward to making progress in these areas at the Rio+20
Conference. We offer our support to the Rio+20
Conference and stand ready to contribute to the
outcomes of the Conference.
1. Ministers and Representatives of Australia, Austria, Belgium,
Canada, Chile, the Czech Republic, Denmark, Estonia, Finland,
France, Germany, Greece, Hungary, Iceland, Ireland, Israel, Italy,
Japan, Korea, Luxembourg, Mexico, the Netherlands, New Zealand,
Norway, Poland, Portugal, the Russian Federation, the Slovak
Republic, Slovenia, Spain, Sweden, Switzerland, Turkey, the United
Kingdom, the United States and the European Union.
Rio+20 brochure [f] [update 1]_Layout 1 06/07/2012 10:11 Page 43
OECD DAC Policy Statement for
the Rio+20 Conference
This statement was endorsed by the DAC at its Senior Level
Meeting on 3-4 April 2012.
Rio+20 is an important opportunity to assess progress,
identify gaps and renew commitments to sustainable
development. We, the members of the OECD
Development Assistance Committee (DAC), pledge to
strengthen our collaboration to address new and
emerging challenges and promote economic and social
transformation for sustainable development. We are
fully committed to the three pillars of sustainable
development, through our support for social
development, economic growth and environment
protection and we will contribute to the delivery of clear
and significant outcomes from the Rio+20 Conference by
building a post-2015 global development framework on
the successful example of and lessons learned from the
Millennium Development Goals (MDGs).
We will continue our support for developing countries’
pursuit of greener and more inclusive growth in their
nationally owned development objectives and poverty
reduction strategies, in line with the principles adopted
in the Busan Partnership for Effective Development Cooperation. We stand by our commitments to integrate
biodiversity, ecosystem services and climate change
adaptation into our development co-operation practices1
and to enhance the quality and effectiveness of
development assistance, particularly regarding pro-poor
economic growth and poverty reduction2. We welcome
the Ministerial Policy Statement of the OECD
Environment Policy Committee, agreed on 29-30 March
2012.
We are building on our past efforts. Our ODA, which is
supporting all MDGs, traditionally with a focus on social
and economic development, has steadily increased and
in 2010 amounted to almost USD 130 billion. This
represents an increase of 63% since 2000. We have also
made efforts to better take into account the increasing
concerns of developing countries regarding environment
challenges they are facing and, during recent years, ODA
allocated to environmental development (the third pillar
of sustainable development) has also increased. Between
2001-02 and 2009-10, bilateral ODA for general
environmental protection grew from USD 1.9 billion to
USD 5.1 billion and support for other activities
addressing environmental sustainability rose from USD
5.8 billon to USD 20.3 billion.
We share developing country concerns about
environmental sustainability and recognise that many of
them have taken the lead in the responsible use of
natural resources and are learning the lessons from the
shortcomings of conventional development models. We
also recognise the particularities of green growth in
developing countries, where it must deliver on national
development, poverty reduction and job creation
objectives in the context of sustainable development. We
believe that green growth can deliver on these objectives,
but this is only possible if context-specific strategies are
defined through national policy and planning processes,
led by Governments.
We will support our developing country partners’ efforts
to:
Develop and implement country-specific, nationallyowned, cost-effective and inclusive strategies aiming at
ensuring green growth, that take into account trade-offs
and political economy barriers, support local, sectoral
and national policy frameworks for equity, poverty
reduction and development, and are implemented
through national planning and budget processes.
Build trust, partnership and capacities among all
stakeholders, and strengthen inclusive governance of
public policy and expenditure, economic governance
and natural resource management, so that the
OECD RIO+20 . 43
Rio+20 brochure [f] [update 1]_Layout 1 06/07/2012 10:11 Page 44
Policy Statements
interests of poor women and men are reflected in
green growth policies and their rights to sustainable
livelihood assets and social protection programmes are
secured.
Identify and nurture opportunities for affordable green
innovation and investment that increases employment
and creates jobs, such as climate-resilient livelihoods
and low-carbon and resource-efficient technologies,
inter alia by supporting local initiatives, indigenous
knowledge and technology transfer on voluntary and
mutually agreed terms and conditions to, and
between, developing countries.
Support and scrutinise public-private partnerships to
foster innovation, mitigate investment risks and
facilitate multi-stakeholder initiatives to promote
more equitable and environmentally sustainable
investments and commodity chains.
Increase the value and welfare derived from natural
capital by managing natural resources sustainably;
developing mechanisms for the payment of ecosystem
services; increasing domestic revenue and income
distribution from natural resource use and extraction;
developing more comprehensive national accounts;
and adopting relevant well-being measures.
Encourage countries to work collaboratively at all
levels to promote knowledge sharing and effective
capacity and institutional development, including by
making use of the Green Growth Knowledge Platform
(GGKP).
We intend to track our progress by:
Supporting developing country partners’ own systems
for monitoring, evaluating and reporting on public
programmes to develop and use their own indicators
of green growth and sustainable development,
including by drawing upon OECD work on measuring
well-being and green growth.
Continuing to monitor and report on external resource
flows targeting relevant social and environmental
objectives through the OECD DAC.
Reporting through the OECD DAC on our progress to
integrate green growth into development co operation,
implement key actions from this Statement, and share
good practices and lessons learned.
We will also:
Assess and promote the coherence of our domestic
green growth policies with development objectives, use
Strategic Environmental Assessments and Poverty
Impact Assessments to raise awareness in our country
offices of environmental issues and climate change,
and their links to poverty reduction, and ensure that
our programmes coherently support green growth and
poverty reduction.
Support systems to allow countries to choose growth
paths and technological trajectories that are socially
and environmentally sustainable, and to adequately
manage global public goods by: creating incentives for
foreign investment in sustainable sectors; promoting
trade flows of environmentally sustainable goods and
services; supporting developing countries’ active
participation in international standardisation
processes; and developing capacity for innovation.
44 . INCLUSIVE GREEN GROWTH: FOR THE FUTURE WE WANT
1. Policy Statement on Integrating Biodiversity and Associated
Ecosystems Services into Development Co operation adopted in April
2010 and Policy Statement on Integrating Climate Change Adaptation
into Development Co-operation adopted in May 2009.
2. “The overarching objective of the DAC is to promote development
co-operation and other policies so as to contribute to sustainable
development, including pro-poor economic growth, poverty reduction, and to
this effect to enhance the quality and effectiveness of development
assistance.” Based on DAC Mandate from Council Resolution
C(2010)123 and CORR1.
www.oecd.org/dac/environment
Rio+20 brochure [f] [update 1]_Layout 1 06/07/2012 10:11 Page 45
GREENING THE OECD
The OECD is taking action to increase its environmental
performance:
Waste management
Between 2007 and 2011 the total amount of waste
produced by the OECD halved.
The number of printed copies of official documents has
more than halved over the past 15 years.
Paper, cans, bottles, metal, batteries, and used
electronic equipment are all recycled.
Water consumption
Modifications to faucets have reduced the water volume
used by 20-22%.
Energy consumption
Energy-saving light bulbs are in use throughout the
Organisation’s buildings.
The heating and cooling of the buildings is partly
provided from the vapour produced by household
waste combustion.
Re-circulated heat produced by the main computer
room is used to warm the buildings
The majority of the products used in the organisation are
eco-labeled, from cleaning supplies to materials such as
paint, glue and carpets.
Since 2002, the OECD has been equipped with
furniture that uses environmentally sound production
techniques, transport, recycling and re-use.
Design and layout by Baseline Arts Ltd, Oxford
Buildings and plant
In 2011 one of OECD’s main office buildings, the
Marshall Building, was granted the French
environmental certificate for buildings, Haute Qualité
Environnementale (HQE® E certification).
Rio+20 brochure [f] [update 1]_Layout 1 06/07/2012 10:05 Page 46
www.oecd.org/greengrowth

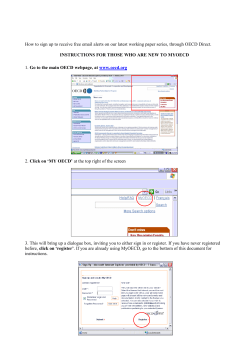
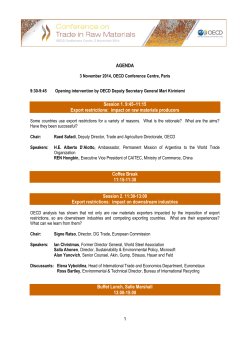
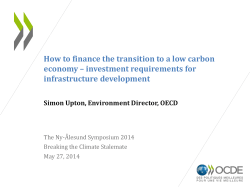
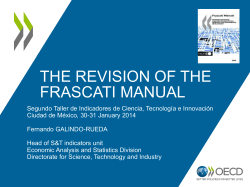


© Copyright 2026