
Chapter 6: You Can get there from here—transportation
C h a p t e r 6 : Yo u c a n g e t t h e r e f r o m h e r e — t r a n s p o r tat i o n
93
Chapter 6
You Can Get There from Here:
Transportation
A
merica’s transportation system is intricately
woven into our daily lives. The most obvious examples are the light-duty vehicles
(cars, SUVs, pickups, and minivans) we use
to get to work, do errands, or visit family and friends.
We rely on trucks, trains, and ships to move goods as
well, and on garbage trucks to haul our waste. We also
spend a lot of time on airplanes, while some people use
public transit, walk, or bike.
All this travel and shipping add up when it comes
to global warming. The production and use of fuel for
transportation in the United States is directly responsible for more than 2 billion metric tons of carbon dioxide and other heat-trapping emissions annually.45
That puts the U.S. transportation system second to
power plants as the biggest contributors to the nation’s
global warming emissions—producing about 30 percent of the total, and more than one-third (36 percent)
of all carbon dioxide emissions.
The biggest transportation sources of heat-trapping
emissions are light-duty vehicles, which account for
more than 60 percent of transportation’s total, and
about one-fifth of the nation’s total (see Figure 6.1).
Next in line are medium- and heavy-duty vehicles at
18 percent, followed by air at 10 pcercent, and then
shipping, rail, military, and other uses.
The impact of these vehicles also adds up when it
comes to America’s addiction to oil. Transportation
depends on petroleum for 98 percent of its fuel, and
accounts for more than two-thirds of all petroleum
products used in the United States (CTA 2008). In
2007, with average gasoline prices at more than $2.75
per gallon, Americans spent more than $575 billion
on transportation fuels such as gasoline, diesel, and jet
fuel (EIA 2008a).
Figure 6.1. The Sources of Transportation
Heat-Trapping Emissions (2005)
Misc
3%
Military
2%
Freight
Trucks and
Buses
18%
Light-Duty
Vehicles
61%
Rail
2%
Aircraft
10%
Source: EIA 2008.
Ships
4%
Much of the oil used to make those fuels is imported,
so transportation demand shipped nearly $200 billion out of our economy and into the hands of oilexporting nations (EIA 2008a).
The impact of transportation’s near-exclusive use of
petroleum products goes beyond carbon emissions and
the cost of fuel. The past 40 years have brought five
significant spikes in oil prices—every one soon followed
by an economic recession (CTA 2008). Although analysts have tied the most recent recession to problems
with the housing and credit markets, spiking oil and
gasoline prices likely had a significant impact, given
these historical trends.
45 That is more than the amount produced from burning fossil fuels in all sectors in every nation except China and the United States
(Marland, Boden, and Andres 2008).
94
U n i o n o f C o n c e r n e d Sc i e n t i s t s : C l i m at e 2 0 3 0
A surprisingly small percentage of the fuel in your car’s gas tank is actually
used to move you down the road—most of the energy contained in fuel is
wasted on inefficiencies in the engine and transmission, or lost while idling
in stop-and-go traffic. Increasing fuel economy will help reduce these inefficiencies and decrease heat-trapping carbon emissions (which currently
average about 1.25 pounds per mile driven, based on an average fuel economy of 20 miles per gallon for new cars and light trucks).
Three key ingredients for a more stable transportation system. The transportation sector is so large
that no single solution will end our oil addiction and
cut global warming emissions as much as we need.
But the lack of a silver bullet does not mean there are
no solutions. It simply means we need to take advantage
of a variety of options to address these challenges.
The easiest way to think of this opportunity is to
break it into three parts:
• Tapping technology to improve the efficiency of
vehicles and their air conditioning systems.
• Shifting away from oil toward cleaner alternatives.
• Providing smarter transportation options to cut
down on the number of miles we spend stuck in
traffic in our cars.
As with a table or a stool, strengthening these three
legs can provide both a stable climate and a secure
energy future.
6.1. Driving Change: Technologies
to Improve Fuel Efficiency and Air
Conditioning
Only 15–20 percent of the energy in our fuel tanks
actually goes to propelling today’s cars and light trucks
down the road. Most is effectively thrown away because of inefficiencies in the engine and transmission systems, or is wasted when we are stuck at a traffic
light with the engine running or in stop-and-go traffic.
Some of this energy also powers air conditioning, fans,
lights, and the growing use of onboard electronics. Of
the fuel that is not simply wasted, most is needed to
push air out of the way, keep tires rolling, and speed
up the 1.5 to 3 tons of metal, plastic, and glass in our
cars and trucks.
That, in a nutshell, is why new cars and light trucks
sold in 2005 averaged only about 25 miles per gallon
on government tests and about 20 mpg on the road—
about the same as they did two decades ago (OTAQ
2008). As a result, the average new vehicle is responsible for nearly one and a quarter pounds of carbon
dioxide and other heat-trapping emissions for every
mile it is driven (one pound from the tailpipe, and another quarter-pound from making and delivering the
fuel) (ANL 2008). The average auto—driven about
11,500 miles annually—is responsible for about 6.5
metric tons of global warming emissions every year.
The bigger trucks used to ship goods and haul garbage waste less fuel because they tend to have more
efficient engines and transmissions. However, these
vehicles carry a lot more weight, and their boxy shapes
mean they must push much more air out of the way.
Bigger trucks also use heavy-duty tires, which also waste
more energy when they roll.
As a result, medium-duty trucks, such as those used
to deliver packages, average 8–8.5 mpg of gasoline
equivalent, while the heaviest trucks, such as 18-wheelers, average only about 6 mpg of gasoline equivalent
(EIA 2008a). This low fuel economy means that medium-duty trucks are responsible for about three
pounds of global warming emissions per mile, while
heavy-duty trucks release about four pounds per mile
(ANL 2008).
The typical medium-duty truck also travels about
11,500 miles annually, so it is responsible for more than
15 metric tons of global warming emissions each year.
With more annual mileage (about 36,000 miles) and
lower fuel economy, the average heavy-duty vehicle
is responsible for more than 65 metric tons of carbon
dioxide and other heat-trapping emissions each year.
And cross-country 18-wheelers put on 130,000 miles
annually, so they average more than 240 metric tons
of global warming emissions each year.
6.1.1. Potential
and Costs of Vehicle
Technologies
6.1.1.1. Efficient Choices in the Showrooms
Potential
Costs
For decades the automotive industry has been developing technologies that can safely and economically help
consumers get more miles to the gallon while driving
C h a p t e r 6 : Yo u c a n g e t t h e r e f r o m h e r e — t r a n s p o r tat i o n
The average 18-wheel tractor trailer, or “big rig,” is responsible for 65 metric tons of carbon emissions
each year. Existing and emerging technologies can
boost truck fuel economy by nearly 60 percent and significantly reduce emissions. To help guide this process, the Department of Energy developed the 21st
Century Truck Partnership, a collaboration between
government agencies and manufacturers of heavy-
duty engines, trucks, buses, and hybrid powertrains.
Figure 6.2. Fuel Economy Potential for Cars, Minivans,
SUVs, and Pickups
60
50
Miles per Gallon
cars, minivans, pickups, and SUVs of all shapes and
sizes. These off-the-shelf technologies include turbocharged direct-injection gasoline engines, high-efficiency automatic-manual transmissions, engines that
shut off instead of wasting fuel while idling, improved
aerodynamics, and better tires (among many others).
More advanced vehicles, such as hybrids, can push fuel
economy even further (see Figure 6.2).
These technologies will deliver vehicles with the
same safety, utility, and performance consumers enjoy today (Gordon et al. 2007; Friedman, Nash, and
Ditlow 2003). Other technologies, such as highstrength steel and aluminum and unibody construction, can boost fuel economy while actually making
highways safer (Gordon et al. 2007; Friedman, Nash,
and Ditlow 2003).
Automakers are already including many of these
technologies on vehicles individually (see Appendix F
online for examples). But not until they are packaged
together can they deliver a substantial boost in fuel
economy.
A variety of studies have looked at this potential and
the associated costs (Kliesch 2008). For example, a
55 MPG
40
38 MPG
30
20
25 MPG
10
0
Average Vehicle
in 2005
Off-the-Shelf
Technologies
Hybrid-Electric
Vehicles
While the average vehicle in 2005 reached only 25 miles per gallon on government tests, tapping into off-the-shelf technologies already in the hands of automakers could boost the fuel economy of our cars and light trucks to 38 mpg. Adding hybrid electric vehicle technology on top of that could bring our fleet to more than 50 mpg. These values all assume a mix of 54 percent
cars and 46 percent light trucks, which may change over time.
2002 study from the National Academies of Science
pointed to a potential for passenger vehicles to average
about 37 mpg, at a cost of about $3,000. However, this
study did not include the potential benefits of using
high-strength steel to reduce the weight of vehicles
(NRC 2002).
A more recent MIT study points to the potential
for these conventional technologies to deliver a fleet of
new cars and trucks that achieves 42–48 mpg while offering today’s size and acceleration. These vehicles
would cost about $2,200–$2,950 more than today’s
average vehicle (Bandivadekar et al. 2008).
A recent UCS study showed that a similar package
of technologies could bring the fleet of new cars and
trucks to about 38 mpg, at an extra cost of $1,700
(Kliesch 2008). That report found that even at fuel
prices of just $2.50 per gallon—a conservative estimate, given that the 2008 Annual Energy Outlook
predicts notably higher fuel prices—owners would
save almost $5,100 on gasoline over the average vehicle’s lifetime, for a net savings of almost $3,400.46 In
other words, consumers would save thousands of
46 That figure assumes that a vehicle’s real-world fuel economy is 20 percent lower than achieved on federal tests. It also assumes that
the owner drives the vehicle 15,600 miles during the first year, declining by 4.5 percent per year (as an approximation of data from
CTA 2008d on the decline in vehicle mileage with age), and a 7 percent discount rate. For more on modeled cost assumptions, see
Table 6.1 and Appendix E online.
95
96
U n i o n o f C o n c e r n e d Sc i e n t i s t s : C l i m at e 2 0 3 0
dollars while cutting carbon emissions by more than
one-third.
Advanced technologies such as hybrid-electric drive
trains hold even greater promise. In such a hybrid, an
electric motor and a battery pack work together to provide supplemental power to the vehicle, which allows
it to use a smaller engine that operates more efficiently.
The electric motor/battery combination also allows the
engine to shut off at stoplights, rather than wasting fuel
while idling. Hybrids also employ “regenerative braking,” which recovers some of the energy normally lost
in braking and feeds it back into the battery. These
technologies work together to improve fuel economy
while maintaining vehicle performance.
If 25 percent of cars and light
trucks were hybrids in 2020,
with the remainder using the
best conventional fuel economy technologies, the fleet
could average 42 mpg.
The MIT study says that such hybrids have the potential to reach more than 70 mpg for about $5,100
more than the cost of today’s conventional vehicles.
The 2008 UCS analysis points to a more modest 55
mpg for advanced hybrids, at a cost of about $4,400
more than today’s conventional vehicles. At a conservative $2.50 per gallon, owners of these vehicles would
therefore save nearly $8,100 on fuel, or about $3,700
above the cost of the technology—while cutting carbon emissions in half.
6.1.1.2. Improving Air Conditioning to
Cut Heat-Trapping Emissions
While fuel combustion in vehicles produces a host of
heat-trapping emissions—including carbon dioxide,
nitrous oxide (N2O), unburned hydrocarbons (HC),
and methane (CH4)— burning fuel is not the only way
cars and light trucks produce heat-trapping emissions.
The air conditioning systems they use to keep drivers
cool leak refrigerant and require extra power.
While the amount of refrigerant that vehicles leak
is small compared with the amount of carbon they
emit, the heat-trapping impact of today’s refrigerants
is more than 1,400 times that of carbon dioxide.
Replacing those refrigerants with alternatives such as
Hybrids combine an electric motor and battery pack
with a combustion engine to improve fuel economy,
cut carbon emissions, and save drivers money at the
pump. These savings are achieved through features
including “idle-off” technology, which shuts off the
engine when idling so that no fuel is wasted; power
assist, in which the motor boosts acceleration to allow
for a smaller gasoline engine; and regenerative braking, which captures some of the energy normally lost
when braking and uses it to recharge the battery.
HFC-152a, which is only 120 times as powerful as
carbon dioxide in trapping heat—and taking steps to
reduce leaks and improve the efficiency of the air conditioning system—can cut global warming emissions
by about 8 grams per mile. And the newer refrigerant
system would cost just $50 per vehicle (Hill 2003).
Scientists are continuing to develop new refrigerants. The refrigerant HFO1234yf, for example, has a
remarkably low heat-trapping potential of just four
times that of carbon dioxide. And that refrigerant still
allows compressors in air conditioners to operate efficiently (SAE 2008).
6.1.1.3. Boosting the Efficiency of Medium-Duty
and Heavy-Duty Vehicles
Long-distance, heavy-duty tractor-trailers are the largest consumers of fuel in the truck category. According
C h a p t e r 6 : Yo u c a n g e t t h e r e f r o m h e r e — t r a n s p o r tat i o n
97
Table 6.1. Fuel Economy Potential and Costs Used in the Climate 2030 Blueprint
Cars and
Light-Duty
Trucks
MediumDuty
Trucks
HeavyDuty
Trucks
2005 Baseline Fuel Economy (mi/gallon gasoline eq)
26
8.6
6
2020 Fuel Economy for New Vehicles (mi/gallon gasoline eq)
42
11
8
$2,900
$6,000
$15,800
55
16
9.5
$5,200
$14,900
$40,500

2020 Incremental Cost vs. 2005 (2006 dollars)
2030 Fuel Economy for New Vehicles (mi/gallon gasoline eq)
2030 Incremental Cost vs. 2005 (2006 dollars)
Notes: These potentials and costs are based on assumptions in the AEO 2008 NEMS high technology case, as modified by the authors,
and modeling runs of UCS-NEMS. The values in our Blueprint case model runs may not match these levels because of limitations in the
model. See Appendix E online for details.
to the U.S. Census Bureau’s Vehicle and In-Use Survey
Microdata, the average new tractor-trailer travels
130,000 miles per year while consuming more than
20,000 gallons of diesel (U.S. Census Bureau 2002).
Using technology available today, owners can improve
the fuel efficiency of these trucks more than 10 percent
Medium-duty vehicles, such
as those used to deliver packages, could average 16 mpg
by 2030, while heavy-duty
trucks could average 9.5 mpg.
by purchasing equipment to make trailers and tractors
more aerodynamic, and by choosing fuel-efficient tires.
The resulting savings in fuel costs—after accounting
for the cost of the upgrades—can top $20,000 over the
life of a truck (Anair 2008). However, despite these
savings, the trucking industry has been slow to adopt
many of these technologies.
What’s more, studies from Argonne National Laboratory and the Department of Energy (DOE) show
that better engines and transmissions—plus advanced
aerodynamics, better tires, and weight reduction—
could improve the fuel efficiency of heavy-duty trucks
by about 60 percent, at a cost of about $40,000 (Cooper et al. forthcoming; Vyas, Saricks, and Stodolsky
2003). That would raise the gasoline-equivalent fuel
Hydraulic hybrid vehicle (HHV) technology combines a highly-efficient diesel engine with a hydraulic propulsion system, which stores energy
more efficiently than a battery. This advanced technology can improve fuel economy up to 50 percent compared with conventional diesel engines, while reducing carbon emissions by as much as one-third. UPS was the first company in the package delivery industry to purchase HHVs, and currently has seven in its fleet.
economy of the average heavy-duty truck from six miles
per gallon today to more than 9.5 mpg—and reduce
global warming emissions per truck by more than 36
percent (see Table 6.1).
For a typical medium-duty truck, hybridization
alone—by adding a battery and an electric motor or a
hydraulic motor and storage system—could improve
fuel economy 40 percent.47 That improvement could
47 Performance of these vehicles varies based on how and where they are used, with some estimates showing a 100 percent improvement in fuel economy for use in urban stop-and-go driving (An et al. 2000). Under typical driving conditions, analysts at Argonne
National Laboratory estimate that hybrids would improve the fuel economy of such vehicles 40–71 percent (Vyas, Saricks, and
Stodolsky 2003).
98
U n i o n o f C o n c e r n e d Sc i e n t i s t s : C l i m at e 2 0 3 0
save 1,000 gallons of fuel per vehicle each year, with
the more advanced systems paying for themselves in as
little as four years.48
By 2030, the average medium-duty truck with a
combination of conventional and hybrid technologies
could raise its fuel economy by more than 80 percent,
at a cost of about $15,000.49 That would boost the
gasoline-equivalent fuel economy from an average of
8.6 mpg to about 16 mpg, and reduce carbon emissions per truck by 44 percent.
6.1.1.4. Trains, Ships, and Planes
Trucks are not the only mode of freight transport that
can benefit from improvements in efficiency. Better
vehicle and engine technology for rail, ship, and air—
along with more efficient use of these modes—can also
deliver cuts in emissions between now and 2030. Trains
and ships can take advantage of engine improvements
similar to those for heavy-duty trucks, and can also reduce engine idling.50 Improvements aimed at maximizing loads and optimizing routes can deliver even more
gains (Stodolsky 2002).
Passenger aircraft can save fuel by using lighterweight materials and improved engine technology. And
efforts to ensure that planes fly full can provide immediate benefits from existing aircraft. These incremental
improvements can boost efficiency in rail, ship, and air
by 10–15 percent. Shifting freight from one mode to
another and tapping alternative fuels (see below) can
also reduce emissions from freight transportation.
6.1.2. Key Challenges for New Vehicle
Challenges Technologies
All the technologies and other options for
travel and shipping in this chapter point to a 2030
where consumers and companies can do their part to
cut heat-trapping emissions while also reducing America’s oil addiction and saving money. But if past is prologue, the needed changes simply won’t happen on their
own. Each of the technologies and other options faces
barriers to becoming mainstream.
One barrier has been low gas prices. Between 1990
and 2003, annual average gasoline prices ranged from
about $1 to $1.50 per gallon (EIA 2009c). The average vehicle achieved only about 25 mpg on government
tests, as automakers devoted new technology to boosting vehicle size and power instead of fuel economy
(OTAQ 2008).
Gasoline would have to rise to $5–$10 per gallon just
to encourage consumers to purchase vehicles that reach
about 40 mpg, according to estimates of people’s responses to price.51 And the upper end of that range may
be the most realistic. A recent study indicates that consumers are becoming less responsive to gas prices as
household incomes rise (Small and Van Dender 2006).
A second, related, barrier is that consumers appear
to be averse to risk. Purchasing a vehicle with higher
fuel economy means making an investment today that
will yield benefits in fuel savings over time. Yet consumers lack information on future fuel prices, and are
unsure about how long they will own the vehicle and
other factors—and that creates uncertainty about
whether their investment in fuel economy will pay off.
Recent research indicates that the result is a market
failure: consumers choose fuel economy lower than
what makes sense given the costs and benefits (Greene,
German, and Delucchi 2009). That is, consumers are
sensitive to sticker prices, placing a greater emphasis on
up-front costs despite potential longer-term benefits.
A final barrier has been a lack of options for consumers. They have historically had to shift to smaller
or less powerful vehicles if they wanted much better
fuel economy. Only with the recent introduction of
hybrids have consumers been able to choose a vehicle
with better fuel economy that also has the size and acceleration of the vehicle they already own.
Other automakers were caught off guard by the
success of the Prius when Toyota first introduced it in
48 This figure is based on 30,000 annual miles driven, a 40 percent improvement in fuel economy, an incremental cost of $10,000, a fuel price of $2.50 per gallon, and a 7 percent discount rate.
49 This figure is based on improvements in conventional and hybrid technologies described in Vyas, Saricks, and Stodolsky 2003.
Even greater improvements may be available, as indicated by the goal of the DOE’s 21st Century Truck program: to improve the
fuel efficiency of medium-duty (Class 6) trucks by a factor of three (DOE 2000).
50 Hybrid tugboats and switcher locomotives designed to reduce or eliminate idling are two examples of where these technologies are
already gaining traction.
51 This figure assumes that the long-run price elasticity of demand for lower fuel intensity (fewer gallons per mile) ranges from 0.2 to
0.4 (based on Brons et al. 2006; Small and Van Dender 2006; Espey 2004; Goodwin, Dargay, and Hanly 2004; Dahl 1993). The
figure also assumes fixed household income. Note that consumers would purchase fewer vehicles and drive less because of the
higher prices.
C h a p t e r 6 : Yo u c a n g e t t h e r e f r o m h e r e — t r a n s p o r tat i o n
99
Japan in 1997 and in the United States in 2000, when
gas prices were still quite low (Sperling and Gordon
2009). It is difficult for consumers to show demand for
a product with high fuel economy if it is not on the
market.52
Policies
6.1.3. Key Policies for Putting Better
Vehicle Technology to Work
If the main barrier to better fuel economy
and less global warming emissions is simply low gas
prices, then the policy solution could be to raise those
prices. But as the previous section showed, gas prices
might have to rise to $10 per gallon to encourage consumers to move just to 40 mpg vehicles. Even higher
gas prices would be needed to spur a wider move to the
better fuel economy offered by hybrids. That suggests
another barrier to the use of technologies to improve
fuel economy: the political difficulty of creating policies that will raise gas prices enough to deliver the benefits of those technologies.
That political barrier does not mean we should abandon attempts to create policies that influence gas prices.
Instead, it means that we cannot rely on them on exclusively. Indeed, accurately pricing gasoline is essential
to capture the costs of smog, global warming, the U.S.
military presence in the Middle East, and other externalities that gas prices do not now reflect.
An economywide cap-and-trade policy that includes
the Blueprint’s complementary policies for energy and
transportation will gradually add up to $0.55 per gallon to the price of gasoline. Such a policy will provide
modest cuts in carbon emissions by spurring people to
reduce the number of miles they drive and encouraging automakers to increase fuel economy somewhat.
Such a policy will also help internalize the costs of the
impact of gasoline consumption on our climate. However, that policy alone will not deliver the full potential
benefits of better technologies for both conventional
and hybrid vehicles.53
Instead, policies that require or reward better vehicle
performance—whether higher fuel economy or lower
carbon emissions—can deliver on this potential and
overcome all three barriers. As Greene, German, and
Delucchi (2009) note, such policies remove or reduce
the uncertainty associated with the benefits of more
Over the past 30 years, Corporate Average Fuel Economy (CAFE) standards have made America’s cars and trucks go farther on a gallon of gas,
saving consumers hundreds of billions of dollars in gas costs. Under a
proposal announced by President Obama in May 2009, CAFE standards
would be coordinated with the nation’s first system to regulate carbon
emissions from cars and light trucks—helping to further reduce global
warming emissions, consumer costs, and America’s oil dependence. efficient vehicles. Such policies also guarantee that consumers will be able to choose higher-fuel-economy or
lower-polluting vehicles in all types and sizes, not just
small cars.
The federal government has relied on performancebased standards for about 40 years to reduce smogforming and toxic pollution from cars and trucks (such
as grams per mile for Tier 1 and Tier 2 vehicles). Such
standards have cut these pollutants by well over 90 percent compared with emissions from cars and trucks in
the 1960s. Federal performance standards have also cut
gasoline use in cars and trucks.
The federal government created the corporate average fuel economy (CAFE) standards more than 30 years
ago, to boost the fuel economy of cars and trucks in
response to an oil embargo. If car companies do not
meet those standards, they are subject to a fine.54 Had
these standards not been around, and had consumers
been stuck with the same fuel economy choices from
the 1970s—when vehicles averaged about 15 mpg on
government tests, versus about 25 mpg in 2007—they
would have needed to purchase another 40 billion
52 This resembles the experience with airbags. Automakers fought a federal requirement that they install airbags, but now compete
based on the number onboard in response to consumer interest in safety.
53 This analysis assumes base gas prices of $2.50–$3.50 per gallon. Adding even $0.55 per gallon would not raise the price enough
to exhaust conventional technology, let alone hybrids, based on elasticity values for gasoline demand of 0.2–0.4.
54 The fine is $5.50 per 0.1 mpg below the standard, multiplied by the manufacturer’s sales volume (40 CFR 32912).
100
U n i o n o f C o n c e r n e d Sc i e n t i s t s : C l i m at e 2 0 3 0
gallons of gasoline in 2007, at a cost of more than
$100 billion.55
While CAFE standards are clearly saving consumers money today, they have been nearly stagnant for
the past 20 years. That changed at the end of 2007,
when Congress required that America’s cars and trucks
average at least 35 mpg by 2020.56
Box 6.1.
The Advantages of Regulating
Vehicle Emissions versus
Fuel Economy
T
oday the National Highway Traffic Safety Administration (NHTSA) regulates the fuel economy of vehicles
through its CAFE (Corporate Average Fuel Economy) standards, but those do not directly cap heat-trapping emissions from vehicles. Having the Environmental Protection
Agency (EPA) regulate carbon emissions directly would
offer several advantages:
•The EPA can set long-term standards, while NHTSA can
set standards for only five years at a time. This limits
NHTSA to technologies that are available today, and
robs automakers of the regulatory certainty that would
help them direct their long-term investments.
•The EPA can consider the potential of all technologies
to reduce the emissions of vehicles and fuels, while the
law forbids NHTSA from accounting for the impact of
alternative fuels on fuel economy standards.
•An EPA-based standard for global warming emissions
would guarantee a shift away from oil, one of the most
carbon-intensive fuels on the market. NHTSA’s fuel
economy standards, in contrast, do not guarantee cuts
in carbon emissions, because the agency must use
complicated formulas that reward displacement of oil
alone. For example, NHTSA assumes that natural gas
will reduce the use of petroleum-based fuels by more
than 80 percent. However, such a substitution would
reduce carbon emissions by only about 15 percent.
NHTSA’s process also overstates the impact on oil consumption and carbon emissions of a shift to diesel by
at least 10 percent.
•The EPA would regulate global warming gases beyond
CO2, such as the refrigerants used in vehicle air conditioning systems, as well as nitrous oxide and methane.
NHTSA’s regulations ignore those emissions.
An alternative to CAFE standards is to target heattrapping emissions from cars and trucks directly. Such
standards can tap a broader set of solutions than fuel
economy, including better air conditioning systems and
fuels, while also saving consumers money and cutting
the use of gasoline.
California and 14 other states have already adopted
standards requiring new cars and trucks to cut global
warming emissions by about 30 percent in 2016, and
California is considering stronger standards for 2020.57
These state standards represent a more aggressive attempt to address global warming emissions, but they
still fall short of the potential for the technologies
outlined earlier in this chapter. As of 2009, the U.S.
Environmental Protection Agency (EPA) was also considering adopting standards on global warming emissions for cars and trucks nationwide (see Box 6.1).
If we are to reap the benefits of technologies that
are available now—including low-carbon fuel (see
below)—national standards would have to require
new cars and light trucks to average no more than
200 grams of global warming emissions per mile in
2020, and no more than 140 grams per mile in 2030
(see Table 6.2).58
The 2020 level is based on enabling conventional
passenger vehicles to achieve 38 mpg, and spurring
hybrids to account for 25 percent of the car and lighttruck market. The combination would produce an average fuel economy for passenger vehicles of 42 mpg.
The 2020 level also assumes that all automakers would
install better air conditioning, which would cut 8 grams
per mile by 2015, and that the federal government
would create a 3.5 percent low-carbon fuel standard
(see below). The 2020 standard also accounts for the
fact that today’s vehicles emit about 1.9 grams per mile
of heat-trapping gases other than carbon dioxide.
The 2030 standard is based on near-complete market penetration of hybrids, 20 percent penetration of
plug-ins (see below), full adoption of air conditioning
improvements, a 10 percent low-carbon fuel standard,
and the same 1.9 grams per mile in other heat-trapping
emissions.59
States and the EPA can establish similar standards
to reduce emissions from medium- and heavy-duty vehicles. Those standards would have to account for the
55 This figure is based on 2.67 trillion miles traveled in cars
and trucks in 2007, gasoline at an average of $2.843 per
gallon (EIA 2009d), a rebound effect of 10 percent, and
estimated on-road fuel economies of 13.1 mpg (OTAQ
2008) versus 20.2 mpg (EIA 2008a).
C h a p t e r 6 : Yo u c a n g e t t h e r e f r o m h e r e — t r a n s p o r tat i o n
Table 6.2. Standards for Vehicle Global Warming Emissions

2005 Baseline Global Warming Emissions (g/mi CO2 eq)a
Fuel Economy (mi/gallon gasoline eq)
Non-CO2 Emissions Estimate (g/mi CO2eq)
2020 Standard for Global Warming Emissions (g/mi CO2eq)
a
Fuel Economy (mi/gallon gasoline eq)
CO2 Emissions with Current Gasoline (g/mi CO2eq)b
Non-CO2 Emissions Estimate (g/mi CO2eq)
c
Credit for Improved A/C (g/mi CO2 eq)d
Credit for Low-Carbon Fuel Standard (g/mi CO2eq)
e
2030 Standard for Global Warming Emissions (g/mi CO2eq)a
Fuel Economy (mi/gallon gasoline eq)
CO2 Emissions with Current Gasoline (g/mi CO2eq)
b
Non-CO2 Emissions Estimate (g/mi CO2eq)c
Credit for Improved A/C (g/mi CO2 eq)
d
Credit for Low-Carbon Fuel Standard (g/mi CO2eq)
e
Cars and
Light-Duty
Trucks
MediumDuty
Trucks
HeavyDuty
Trucks
372
1,038
1,489
24
8.6
6
2
5
8
198
777
1,072
42
11
8
212
808
1,111
2
5
8
-8
-8
-8
-7
-28
-39
139
497
842
55
16
9.5
162
555
935
2
5
8
-8
-8
-8
-16
-56
-94
Note: Values may not sum properly because of rounding.
a We calculated global warming emissions as the sum of CO2 and non-CO2 emissions from today’s gasoline, minus cuts in emissions
from the use of better air conditioning and low-carbon fuels.
b In converting fuel economy into CO2 equivalent, we assumed 8,887 grams of CO2 per gallon of today’s gasoline burned.
c We scaled up estimates of non-CO2 heat-trapping emissions for medium- and heavy-duty trucks from those for light-duty vehicles
based on relative fuel consumption. We expect to update these numbers as more accurate data become available. These estimates
do not include black carbon.
d Note that 8 grams per mile is a conservative estimate for cars and light trucks based on Bedsworth 2004 and CARB 2008. We have
no data for medium- and heavy-duty vehicles. However, given that they have larger air conditioning systems (and thus greater
potential for absolute savings) but travel farther (reducing the per-mile benefit), we used 8 grams per mile as a rough value pending
more information.
e All fuels achieve the average low-carbon standard in Table 6.4.
56 As required by the 2007 Energy Independence and Security Act, online at http://frwebgate.access.gpo.gov/cgi-bin/getdoc.
cgi?dbname=110_cong_bills&docid=f:h6enr.txt.pdf. Our Reference case includes this policy, which delivers significant cuts in carbon
emissions. Reductions in emissions from the transportation sector under the Blueprint are therefore notably lower than they
would otherwise be.
57 Under the Clean Air Act, California can adopt its own vehicle standards. Other states must choose between California’s standards
or those of the federal government. However, the latter has yet to regulate global warming emissions from vehicles. California’s
proposed stronger standards would reduce heat-trapping emissions from vehicles by more than 40 percent, according to estimates.
For more information, see Tables 4 and 6 at http://www.climatechange.ca.gov/publications/arb/ARB-1000-2008-012/ARB-10002008-012.PDF.
58 Under this approach, automakers would receive credit for selling vehicles that use ethanol, hydrogen, or electricity, if they reduce
global warming emissions from the production and delivery of the fuel.
59 The factors used for air conditioning and non-CO2 emissions for the 2020 and 2030 standards are consistent with those used by
the California Air Resources Board (CARB 2008), and are conservative in the case of air conditioning, given that newer refrigerants
with very low potential for trapping heat are likely to enter the market soon.
101
102
U n i o n o f C o n c e r n e d Sc i e n t i s t s : C l i m at e 2 0 3 0
Box 6.2.
Promising Policies the Blueprint Case Did Not Include
Feebates and the California Clean Car Discount.
Besides vehicle performance standards, a system of
financial carrots and sticks can encourage automakers
to make better vehicles, and consumers to purchase
them. Feebates create surcharges on vehicles with
more heat-trapping emissions, and use the proceeds
to pay for rebates on cleaner vehicles. California is considering adopting such a system. A 2007 study suggests this approach could encourage greater use of
technology to cut carbon emissions while saving consumers money (McManus 2007).
Air, rail, marine, and off-road standards. Limits on
global warming emissions can also apply to planes,
trains, ships, and off-road vehicles—all of which can
benefit from technologies to improve efficiency, including hybridization in some cases, and can tap into
cleaner fuels and improved air conditioning systems.
The aviation sector is responsible for 10 percent of
heat-trapping emissions from transportation, so regulators should not ignore it. And construction and other
off-road equipment present an important opportunity
for further emissions cuts, as that equipment uses
about 7 percent of all diesel fuel.
Without such policies, however, baseline improvements are still likely. The efficiency of rail transport (ton
miles per Btu) is likely to rise by a modest 10 percent
between 2005 and 2030, marine transport (ton miles
per Btu) by 12 percent, and passenger aircraft (passenger miles per gallon) by 16 percent.
Lower speed limits. When cars and trucks travel at
highway speeds, they use a lot of fuel to overcome
aerodynamic drag. Lowering maximum speeds can
save fuel and reduce carbon emissions.
For example, reducing vehicle speeds from 70 to 65
mph could cut highway fuel use and carbon emissions
by 8–10 percent per mile (CTA 2008). A forthcoming
study by the North East States Center for a Clean Air
Future similarly finds that lowering the maximum
speed of a tractor-trailer on a typical long-haul trip to
60 miles per hour could reduce carbon emissions by
4 percent. Such a vehicle can require 5–10 percent
more fuel traveling at 70 mph than at 65 (DOE 2000).
Freight transport standards. California is considering
a suite of regulatory and voluntary measures aimed at
reducing carbon emissions from the use of planes,
trains, and ships to transport freight. Those measures
could cut emissions from the movement of goods
by 3.5 million metric tons of carbon dioxide equivalent
by 2020—a 20 percent reduction.
Efforts that could help meet that goal include reducing the speeds of oceangoing vessels, connecting
docked ships to the electricity grid, using better hull
and propeller maintenance practices, reducing idling
of cargo-handling equipment and relying on electricity
to power it, setting energy efficiency standards for
refrigerated trailers and containers, and using zeroemission rail technologies (CARB 2008a).
many different uses of such vehicles, as well as the numerous manufacturers of engines, truck chassis, and
trailers (Lowell and Balon 2009).60
Today’s medium-duty vehicles produce more than
1 kilogram of global warming emissions per mile, not
counting upstream emissions. Based on the vehicle
technologies noted above and the potential for cleaner
fuels, state and federal standards should allow such
vehicles to release no more than 780 grams of heattrapping emissions per mile in 2020, and no more than
500 grams per mile in 2030—representing cuts of
25 percent and 50 percent, respectively.
For heavy-duty vehicles, standards should be no
more than 1,075 grams per mile in 2020, and no more
than 840 grams per mile in 2030. Those standards
would cut carbon emissions more than 25 percent and
40 percent, compared with today’s emissions of about
1,500 grams per mile.
These standards assume full adoption of available
technology for improving fuel economy by 2030, and
60 The EPA can regulate carbon emissions for medium- and heavy-duty vehicles under the Clean Air Act. The Energy Independence
and Security Act of 2007 authorized the National Highway Traffic Safety Administration to establish fuel economy standards for
medium- and heavy-duty vehicles, based on a National Academy of Sciences study now under way. Japan established fuel efficiency
standards for heavy-duty vehicles in 2005.
C h a p t e r 6 : Yo u c a n g e t t h e r e f r o m h e r e — t r a n s p o r tat i o n
3.5 percent and 10 percent low-carbon fuel standards
for 2020 and 2030. The standards also assume that better air conditioning systems in medium- and heavy-duty
trucks would reduce emissions 8 grams per mile, though
we lack data on actual values. (The air conditioning
systems in these vehicles are larger, so their emissions
are higher than those from cars and light trucks. However, medium- and heavy-duty vehicles also travel more
miles per year, so we assume that the per-mile emissions from all the vehicles are about the same.)
6.2. Smart Fill-Ups: Switching
to Low-Carbon Fuel
Americans use the equivalent of nearly 220 billion gallons of gasoline every year (EIA 2008a). Cars and
light trucks use the largest portion of that amount:
62 percent, or 140 billion gallons. Medium-duty and
heavy-duty trucks are next, at 18 percent, followed
by airplanes at 10 percent. Rail, shipping, military,
and other uses account for the last 10 percent (see
Figure 6.3).
Even if the nation takes aggressive measures to increase the efficiency of vehicles and reduce the number of miles we travel, we will still need the equivalent
of about 200 billion gallons of gasoline by 2030 as
the population and economy continue to grow. If
transportation is to do its part in cutting U.S. carbon
emissions close to 60 percent by 2030, we cannot continue to fill up almost exclusively on petroleum products as we do today.
To make these deep cuts while continuing to strengthen our economy, we must tap into transportation fuels
that do not release significant amounts of carbon.
Biofuels (fuels produced from plants), electricity, and
hydrogen all have the potential—if produced in a sustainable manner and without significant impacts on
land use—to both cut carbon emissions from transportation and curb our country’s dependence on oil.
Potential
Costs
6.2.1. Potential and Costs
of Low-Carbon Fuel
6.2.1.1. Biofuels for Today and Tomorrow
You probably already use biofuels when you drive your
car. To cut down on smog or substitute for gasoline, fuel makers now blend ethanol—an alcohol—into
Figure 6.3. Petroleum Use
in Transportation (2005)
218 billion gallons gasoline equivalent
Cars and Light Trucks
62%
Other
3%
Rail and
Ships
7%
Aircraft
10%
Medium and
Heavy-Duty Trucks
18%
Source: EIA 2008.
gasoline, where it accounts for 4–5 percent of what
Americans buy (EIA 2008a).61
As noted, biofuels are made from plants: ethanol is
made from corn or sugar cane, for example, and biodiesel from vegetable oil. Existing vehicles can use
small amounts of ethanol and biodiesel, but must
be modified to use larger amounts.62 However, enabling cars to use up to 85 percent ethanol (E85) adds
only $50–$100 to their price (DOT, DOE, and
EPA 2002).
New technologies nearing commercialization will
create fuel based on other types of plant material, such
as wood, grass, and waste products from agriculture,
forestry, and landfills. Some of these technologies can
be used to make biofuels that are even more compatible
with gasoline and diesel engines, potentially requiring
no engine modifications at all.
Because the carbon in biofuels comes from plants
rather than fossil fuels, they could theoretically provide
carbon-free transportation—if regrown crops absorbed
the CO2 emitted from tailpipes. However, the true picture is not that simple. To get a complete understanding of the carbon and other heat-trapping emissions
from fuel, we need to look at its full life cycle, which
includes all the emissions caused directly or indirectly
by its production, distribution, and use.
For ethanol based on corn, that means accounting
for the fertilizer and pesticide used to grow it, the energy used to convert the corn to fuel, the tractors, trains,
and tanker trucks used to move the fuel around, and
61 Ethanol is blended at 6–7 percent to cut down on smog, but is not used everywhere year-round.
62 Ethanol blended with gasoline up to 10 percent is sold as E10, or gasohol. Biodiesel can be blended up to 5 percent under today’s
warranties, although some vehicles use blends of up to 20 percent.
103
104
U n i o n o f C o n c e r n e d Sc i e n t i s t s : C l i m at e 2 0 3 0
Biofuels made from food crops, especially corn and soybeans, require a lot of energy to produce and can actually
create more global warming emissions than traditional gasoline. However, cellulosic biofuels—made from sugars
in the plant walls of corn cobs and stalks, grasses, wheat straw, and other plants—have the potential to cut carbon emissions by 80 percent or more compared with gasoline. This South Dakota farmer is harvesting switchgrass, a prairie grass native to the Midwest that can be grown on land not typically used for agriculture.
finally the emissions from vehicles’ tailpipes. We also
need to account for heat-trapping emissions from indirect effects, such as the expansion of agricultural production to produce more biofuels and the resulting
changes in land use. When we add up all of these sources of emissions, today’s generation of biofuels—which
are made from food crops, especially corn and soybeans—offer little opportunity to reduce carbon emissions, and may even increase them (Fargione et al. 2008;
Searchinger et al. 2008; UCS 2008a).
To deliver biofuels that can provide significant cuts
in carbon emissions, the industry is moving to secondgeneration technologies. Cellulosic biofuels, for example, are produced from the materials that compose the
cell walls of all plant matter. That means corn cobs and
corn stalks, grasses, wheat straw, and sawdust can all
be used to make fuel. A closely related technology called
biomass-to-liquids (BTL) can be used to make a replacement for diesel fuel from plants, wood, or even
the carbon-containing portion of municipal garbage,
such as lawn clippings and used plastic.
These next-generation biofuels could cut carbon
emissions from transportation by 60–80 percent or
more (ANL 2008). However, these cuts rely on using
waste products, grasses, or other crops grown on land
that does not directly or indirectly displace food crops.
These restrictions mean that the amount of low-carbon
biofuels we can make from domestic resources is significantly less than some analysts estimate (Perlack et
al. 2005; Greene et al. 2004).
Further, some of those resources will be used in
power plants to generate cleaner electricity. Based on
the domestic potential given land-use restrictions and
other exclusions outlined in Chapter 2, the transportation sector could tap about 280 million tons of biomass for conversion into biofuel.63 At a conversion rate
of 110 gallons of ethanol per ton of biomass, we estimate that the ethanol equivalent of about 30 billion
63 This is the combination of 158 million tons of agricultural residues and 121 million tons of biofuel crops grown without inducing
direct or indirect changes in land use.
C h a p t e r 6 : Yo u c a n g e t t h e r e f r o m h e r e — t r a n s p o r tat i o n
gallons of low-carbon biofuels could be available in
2030—enough to displace about 20 billion gallons of
gasoline (see Table 6.3).64
Biofuels have historically been more expensive than
gasoline. However, the next generation of biofuels has
the potential to be cost-competitive with gasoline prices
of $2.70–$3.00 per gallon (Anden et al. 2002), and
some studies point to the potential for even lower costs
(ASES 2007; Greene et al. 2004).
The nation could produce
about 30 billion gallons of
low-carbon biofuels in 2030,
displacing 20 billion gallons
of gasoline.
Biofuel makers can achieve cost-competitiveness
through greater efficiency, lower production costs, and
“biorefinery” approaches, which combine ethanol production with the production of electricity, heat, and
animal feed. Such technologies can lead to true lowcarbon biofuels that can deliver dramatic cuts in carbon
emissions while allowing consumers to at least break
even and possibly even save money compared with
future gas prices.
The leaves and stalks left behind after the corn
harvest—known as corn stover—have substantial
potential as a biofuel. Increasing our use of biofuels
in vehicles and power plants can help reduce our
dependence on fossil fuels.
grid. Such “plug-in” hybrids would have the fuel efficiency and range of a conventional hybrid, but would
rely on a larger battery pack to tap into electricity as
another potentially low-carbon fuel.
The next step after plug-ins is to get rid of the engine and have an all-electric vehicle, which would require an even bigger battery pack. If based on most
6.2.1.2. An Electrifying Transportation Future
There is a lot of excitement today about the potential
for drivers to not only own a hybrid vehicle but to plug
it in and recharge the battery pack from the electricity
Table 6.3. A Look at Cellulosic Ethanol in 2030
Resource, Yield, and Potential
Costs
Biomass Resources Available for Transportation
(million tons)
280
Fixed Production Costs
(in 2006 dollars per gallon)
$0.128
Ethanol Yield (gallons per ton)
110
Non-Feedstock Variable Costs
(in 2006 dollars per gallon)
$0.17
Initial Capital Cost
(in 2006 dollars per gallon of capacity)
$1.99
Maximum Biofuel Potential
(billion gallons ethanol equivalent)
30
Note: In our Blueprint analysis, actual production of cellulosic ethanol may be lower, as it competes with biomass-to-liquids technology
for access to biomass resources. However, the total volume of low-carbon biofuels will be similar.
64 The 110 gallons of ethanol per ton of biomass is based on information in ASES 2007 (90 gallons per ton) and Greene et al. 2004
(100–126 gallons per ton). Ethanol and gasoline equivalents are used for convenience, and because the federal renewable fuel
standard uses ethanol equivalence. The actual volume of the biofuel will vary with the density of the product.
105
106
U n i o n o f C o n c e r n e d Sc i e n t i s t s : C l i m at e 2 0 3 0
$20,000 premium over the cost of a conventional car
(Gonzales 2008). Toyota and Ford are targeting plugins with smaller all-electric ranges.
Given the variety of possible plug-in configurations,
and their potential for an all-electric range of 5–10 miles
to 40 miles or more, the Blueprint analysis assumes that
the average plug-in will have an all-electric range of
about 30 miles. That would allow the average driver to
satisfy about half of his or her driving needs using electricity alone (Komatsu et al. 2008; Santini and Vyas
2008; Tate, Harpster, and Savagian 2008; EPRI 2007a).
A combination of fuel cell
vehicles and plug-in hybrids
could account for at least
Plug-in hybrids have real potential to reduce carbon emissions and
fuel costs from passenger vehicles. A plug-in with an all-electric range
of 30 miles could supply the average driver with about half of his or
her driving needs using electricity alone. If that electricity comes from
a battery charged from renewable electricity sources, carbon emissions will be at least 70 percent lower than today’s vehicles.
battery technologies available today, such a vehicle
would give up a significant amount of range. However,
the electric power train in such a vehicle is more than
four times as efficient as that in a conventional vehicle,
and about two times as efficient as that of a hybrid.
Electric vehicles have not advanced past small-scale
commercialization because of high battery costs, short
lifetimes, and limited range. Advances in battery technology—such as lithium ion batteries similar to those
used to run laptops—have brought battery-electric vehicles closer to commercial reality. However, plug-in
hybrids are more likely to reach sales in the millions
first (Kalhammer et al. 2007).
General Motors, Toyota, and Ford have all announced plans to put early-model plug-ins into smallscale production between 2010 and 2012, and companies
that convert conventional hybrids into plug-ins are already making a few available (Ford Motor Company
2009; Toyota Motor Sales 2009; GM 2008). GM has
noted that its first plug-in will be a car that can travel
about 40 miles on the battery alone, and that it will
cost around $40,000 in small volumes—about a
20 percent of the car and
light-truck market by 2030.
Based on recent studies, we expect a typical plug-in
with an all-electric range of about 30 miles to cost about
$8,650 more than today’s conventional vehicles, when
sold at high volume—or about $4,250 more than
hybrids (Bandivadekar et al. 2008; Duvall 2002). If a
driver can satisfy half of his or her driving on electricity
at $0.10 per kilowatt-hour (equivalent to about $3.60
per gallon of gasoline), and gasoline is $2.50 per gallon, that driver will save more than $9,500 on fuel over
the vehicle’s lifetime compared with today’s conventional vehicles, for a net lifetime savings of $850.65
As with biofuels, we must count all the emissions
released during the life cycle of fuels used for plug-ins.
For electricity, that means going back to the power
plant. As a result, cuts in emissions from such vehicles
can vary significantly, depending on where the electricity comes from. Given the average mix of fuels
now used to produce electricity, a good plug-in will cut
carbon emissions by about 55 percent compared with
today’s vehicles—if half the vehicle’s miles come from
the battery (ANL 2008). If the battery is recharged
from a 2030 grid with 70–80 percent lower carbon
emissions, the vehicle’s emissions would be at least 70
percent lower than today.
65 While electricity is more expensive in this case, driving on electricity alone is much more efficient, so costs are lower per mile. In
this plug-in example, electricity costs $0.033 per mile, while gasoline costs $0.057 per mile. The analysis assumes that the plug-in
uses 0.33 kilowatt-hour per mile when operating on battery electricity. The analysis also assumes that the federal test fuel economy
is 55 miles per gallon when the vehicle runs as a conventional hybrid, but that on-road fuel economy is 20 percent lower. The
analysis also assumes that the vehicle is driven 15,600 miles during the first year, declining at 4.5 percent per year, and a 7 percent
discount rate. For more on modeled cost assumptions, see Table 6.1 and Appendix E online.
C h a p t e r 6 : Yo u c a n g e t t h e r e f r o m h e r e — t r a n s p o r tat i o n
Significant uncertainties remain as to how quickly
plug-ins will be ready to enter the market, and how
quickly that market will grow. The first mass-market
hybrid, the Prius, introduced in 1997, accounted for
about 2 percent of the U.S. market in 2007, 10 years
later (Ward’s Auto Data n.d.). If we assume that
plug-ins—which Toyota and GM expect to introduce
in 2010—parallel the significant success of conventional hybrids, they could reach 2 percent of the U.S.
market by 2020. From there, a 25 percent average
annual growth rate would have plug-ins capturing
20 percent of the market by 2030, given the proper
incentives.
to reduce the emissions associated with those fuels by
improving the efficiency of refineries.
In 2000, the petroleum industry created a technological vision that pointed to the potential for a 10 percent improvement in refinery efficiency by 2020 (API
2000). A 2005 study from Lawrence Berkeley National
Laboratory suggested paths to improve the efficiency
of refineries across the country by 10–20 percent that
would also cut costs (Worrel and Galitsky 2005). Based
on today’s efficiency levels for refineries of about 90
percent (Wang 2008), a 10–20 percent improvement
in efficiency would lead to a 1–2 percent reduction in
carbon emissions from gasoline.
6.2.1.3. Hoping for Hydrogen Transportation
6.2.1.5. Avoiding Dirty Fuels
The excitement expressed today about plug-ins belonged to hydrogen fuel cells about three to five years
ago. Like batteries, fuel cells provide electricity, but instead of storing it directly, a fuel cell generates it from
hydrogen and air. That enables fuel cell vehicles—unlike battery-electric vehicles—to have driving ranges
that approach those of today’s vehicles. For example,
the Honda Clarify FCX fuel cell vehicle is rated as having a range of 280 miles (American Honda Motor
Company 2009).
Hydrogen fuel cells lost some of their luster when
the technology did not deliver as quickly as automakers had hoped (much like battery-electric vehicles in
the early 1990s). Despite that, automakers have made
significant progress in lowering the costs of fuel cells
and increasing their durability, and they could see
small-scale production as early as 2015 if given enough
support (NRC 2008; Kalhammer et al. 2007).
The incremental cost of fuel cell vehicles is quite
high today, but could come down significantly over
time. Reports from the National Research Council and
MIT indicate that the incremental cost of fuel cells
produced in large volumes can be similar to the costs
we have presented for plug-ins (Bandivadekar et al.
2008; NRC 2008). The MIT study shows that the
carbon benefits will be similar as well.
As with plug-ins, many uncertainties remain around
the future of mass-market fuel cell vehicles. The National Research Council study suggests that sales
could account for slightly more than 20 percent of the
market by 2030.
While new low-carbon alternatives can reduce global
warming emissions from fuel, new high-carbon fuels
can easily wipe out these hard-won gains. Development
of oil shale, tar sands, heavy crudes, and coal-to-liquid
(CTL) fuels can all substantially increase the upstream
emissions associated with gasoline and diesel fuels.
The life-cycle carbon emissions from liquid transportation fuel made from coal are double those of
conventional petroleum (Bartis et al. 2008). In fact, displacing a gallon of petroleum fuel with a gallon of CTL
more than cancels out the benefits of displacing a gallon of gasoline with low-carbon biofuel or electricity.
Emissions from crude oil recovered from tar sands
and oil shale are also much higher than those from
Oil and gas refineries could become at least 10 percent
more efficient by 2030, according to Lawrence Berkeley National Laboratory.
conventional crude—and would mean that we would
backslide on our path to cleaner alternatives to oil.
Projections of these sources producing more than 6
million barrels a day by 2035 (Task Force on Strategic
Unconventional Fuels 2006) suggest that avoiding these
dirty fuels is just as important as developing better alternatives, to ensure steady progress in cleaning up our
fuel supply.
6.2.1.4. Cleaner Gasoline and Diesel
While alternatives to petroleum fuels have clear potential, we will undoubtedly be using gasoline and diesel
for decades to come. Given that, the nation also needs
6.2.1.6. All of the Above
The reality is that no one can predict which of the
lower-carbon fuels will win out. In fact, the most
107
108
U n i o n o f C o n c e r n e d Sc i e n t i s t s : C l i m at e 2 0 3 0
likely outcome is a mix of different options. Electricity
and hydrogen are not well-suited for use in planes,
ships, or big trucks, but will work well for cars and
light trucks, and for some medium-duty trucks that
operate mostly on city streets. Biofuels will work well
in all parts of the transportation sector, but are a
more limited resource if they are to remain truly
low-carbon, so we might best use them where neither
electricity or hydrogen work best (such as in airplanes).
Further complicating matters, the next 10 years will
probably see some trial and error, wherein every sector
tries all the low-carbon options. Based on that competition, plug-ins, fuel cell vehicles, and battery-electric
vehicles could all emerge successful. If so, these electric-drive vehicles could account for one-third or even
more of the market by 2030.66
66 California has a different mix of vehicles and sources of electricity. However, an analysis by the California Energy Commission shows
that plug-in, battery, and fuel cell vehicles together could capture about 33 percent of the state’s market in 2030 (Bemis 2008).
Box 6.3.
S u cc e s s S t o r y
Jump-Starting Tomorrow’s Biofuels
The sustainable harvesting of perennial grasses and
forestry and agricultural waste products to make biofuels can be an important part of our low-carbon future.
C
orn and soybeans, grasses and wood chips, even
municipal waste dumps—what do they have in
common? In a world seeking to trim its dependence on
the fossil fuels that, when burned, overload our atmosphere with carbon, these items all have the potential to
be turned into vehicle fuels. Unfortunately, biofuels are
not all created equal, at least not when it comes to curbing carbon emissions. The future of biofuels depends on
making the right choices today.
The basic technology to extract liquid fuel from
plants like wood and grass and other forms of biomass
has existed for decades, but has not been cost-effective
compared with the cost of producing gasoline and diesel. Driven primarily by an influx of federal dollars,
production of corn ethanol has grown to 3 percent of the
fuel used in U.S. passenger cars and trucks (EIA 2008a).
However, land, water, and other resource constraints limit
the potential of food-based biofuels—such as corn ethanol and soy biodiesel—to reduce the carbon footprint
of our transportation fuels (UCS 2008a; UCS 2008b).
A brighter future for biofuels requires technologies for
making fuel from wood chips, grasses, and waste products—and then developing sustainable sources of these
feedstocks.
Recent breakthroughs in biological research, combined with government support, are bringing us closer to
making fuel from plant leaves, stems, and stalks (cellulosic biofuels) a commercial reality. Several new companies are making the transition from laboratory testing to
pilot manufacturing plants.
Mascoma, for example, has built a pilot plant in Rome,
NY, that can make half a million gallons of biofuel a year
from wood chips. Verenium has opened a 1.4-million-gallon-a-year plant in Jennings, LA, to make ethanol from
crushed sugar cane stalks. Both these plants use biochemical processes to break down cellulose into ethanol
(Verenium 2009; LaMonica 2008). Bluefire Ethanol in
Southern California is using a different approach—breaking down cellulose in municipal waste to make sugar via
acid hydrolysis—and will begin construction this year of a
3.7-million-gallon-a-year facility in Lancaster, CA (Bluefire
Ethanol 2008).
However, while exciting, these pilot plants are far too
small to meet the nation’s demand for cellulosic biofuels.
In comparison, corn ethanol facilities often produce 100
million gallons a year or more, and petroleum refineries
C h a p t e r 6 : Yo u c a n g e t t h e r e f r o m h e r e — t r a n s p o r tat i o n
On the other hand, given the fact that putting the
maximum feasible number of fuel cell vehicles on the
road over the next decade will cost about $50 billion,
success for all these options may be difficult. Still, together they should be able to account for 20 percent
of the car and light-truck market, as the National
Research Council noted was possible for fuel cell
vehicles alone (NRC 2008).
To supply the energy that transportation needs, the
nation will have to tap renewable electricity, clean hydrogen, and low-carbon biofuels while avoiding fuels
from tar sands, oil shale, and coal. However, these
cleaner resources will not appear overnight—nor will
the vehicles that use them.
6.2.2. Key Challenges for
Challenges Low-Carbon Fuel
Making progress on producing new fuels
for transportation has proved even more challenging
than boosting vehicle efficiency—highlighted by the
fact that oil and other petroleum products still account
for 98 percent of fuel used for transportation. This hard
road exists because new fuels face three barriers: technological, infrastructure-related, and behavioral.
6.2.2.1. Technology and Cost Hurdles
can be 20 times that size (EIA 2008g; RFA 2009).
The next step is commercial-scale facilities for
cellulosic ethanol.
Range Fuels in Soperton, GA, is the top contender in the race to produce such fuel at a scale
of tens of millions of gallons a year. The company has broken ground on a facility, and expects
to begin using high-temperature gasification
to turn the cellulose in waste wood chips into
liquid fuel in 2010. Range Fuels plans an initial
capacity of 20 million gallons a year, eventually
expanding to 100 million gallons a year (Range
Fuels 2007).
A competing approach to large-scale production of cellulosic ethanol relies on microorganisms to break down the cellulose. Using
this technology, Mascoma’s facility in Kinross,
MI, is scheduled to produce 20 million gallons a
year of ethanol from wood waste by 2011 (Reidy
2008). And Verenium plans to build a commercial-scale cellulosic ethanol facility in Highlands
County, FL, to convert grasses into perhaps 36 million gallons of ethanol a year.
The variety of technologies, feedstocks, and
locations tapped by these promising projects
improves the chances that one or more will produce the breakthroughs that move the approach
from laboratory to market. Scaling up nextgeneration biofuels from less than a million gallons a year in 2008 to more than a billion is
essential if biofuels are to be players in America’s
low-carbon future.
Whether the option is low-carbon biofuels, renewable
electricity, or clean hydrogen, a transition to new fuels
has stalled because either the fuel or the vehicle faces
technological barriers to becoming widely available at
a reasonable cost.
While creating vehicles that can run on biofuels is
not a challenge, making the fuel at a competitive cost
is. Producing cellulosic biofuels requires special en-
Tomorrow’s plug-ins
will be competing against
conventional hybrids with
fuel economy as high as
55 miles per gallon.
zymes that break down the walls of the plant cells. These
enzymes are expensive today—both because they are
still in development and because they are made on such
a small scale. More research and development is needed
to lower the cost, and demonstration programs are
essential to start scaling up production to bring down
costs. Similarly, the technology exists for biomass-toliquid fuel, but demonstration projects are needed to
scale up production to help bring down costs.
Unlike biofuels, making renewable electricity itself
is less of a challenge. As Chapter 3 shows, electricity
from wind can be cost-competitive with electricity from
natural gas. Instead, the technological challenge of using electricity as a transportation fuel comes from the
vehicle. Researchers have been trying for decades to
develop batteries that are both durable and cost-effective, and several companies are working hard to reach
this milestone. However, as evidenced by the projected
109
110
U n i o n o f C o n c e r n e d Sc i e n t i s t s : C l i m at e 2 0 3 0
$40,000 price tag for GM’s plug-in hybrid, more R&D
is needed to cross the finish line.
As noted, the costs of plug-ins are expected to come
down, making them less expensive to own than today’s
conventional vehicles. However, tomorrow’s plug-ins
won’t be competing against today’s cars. Instead, they
will be competing against conventional hybrids with
fuel economy as high as 55 miles per gallon.
A plug-in will cost an additional $2,800 over its
lifetime compared with such a vehicle, assuming gasoline at $2.50 per gallon for half of all mileage, and electricity at $0.10 per kilowatt-hour for the other half.
For the average plug-in owner to break even with the
average hybrid owner, gasoline would have to reach
$4.50 per gallon (or $3.50 per gallon for an owner with
short commutes who can take advantage of all-electric
operation three-quarters of the time). The high up-front
Shell Hydrogen and General Motors teamed up to build the first
combined hydrogen and gasoline fueling station in North America,
located in Washington, DC.
cost of plug-ins—combined with the fact that they pay
for themselves only at higher gas prices or for owners
with short commutes—poses a significant challenge.
Hydrogen, on the other hand, faces challenges in
making both the fuel and the vehicles. Fuel cell vehicles
require more R&D to lower costs, because of their
extensive use of platinum and the cost of onboard storage of hydrogen. And although hydrogen can be produced cost-effectively from natural gas, further research
is needed to cost-effectively produce hydrogen from
renewable electricity or directly from sunlight. Hydrogen can also be produced from coal, but making that
an effective low-carbon option requires unproven technology, such as carbon capture and storage.
6.2.2.2. Infrastructure Barriers
A network of charging and alternative fueling stations
is essential to the market success of low-carbon fuels
and the vehicles that use them. As the number of
vehicles that can run on low-carbon fuels grows, the
infrastructure must grow as well.
Many biofuels, especially ethanol, require their own
corrosion-resistant pumps and storage tanks at fueling
stations, though regulations have already required such
changes. Many of the nation’s more than 160,000 gas
stations already carry ethanol that has been blended
into gasoline at low levels. However, fewer than 2,000
stations carry E85, a mixture of 85 percent ethanol
blended with gasoline, which will be needed if ethanol
is to grow to more than 10 percent of U.S. fuel use
(EERE 2009c). Further, ethanol cannot be shipped in
existing pipelines because of the risk of water contamination. Other biofuels will have to replace ethanol, or
dedicated pipelines may be needed to supply larger
amounts of biofuels.
Because plug-ins can operate on gasoline alone and
have smaller battery packs than battery-electric vehicles,
they will not require an extensive high-power charging
infrastructure. Most overnight charging can occur at
homes or businesses. However, such charging will require added equipment. A report from the U.S. Department of Energy (DOE) puts the cost of adding
charging capabilities to a home at less than $900 (Morrow, Karner, and Francfort 2008).
Initially, battery-electric vehicles will be used by fleet
operators or in urban locations, and will not require
public charging stations. The cost of a charging system
for such vehicles is higher than for plug-ins because
quickly recharging the large battery pack requires
more power. The DOE estimates that the cost of a
residential charger is about $2,200 (Morrow, Karner,
and Francfort 2008). If battery technology advances
to a point where long-range electric vehicles do reach
the market, the nation will need a public charging
network.
As the numbers of plug-ins and battery-electric vehicles rise and they are integrated into the electricity
grid, added costs and benefits will emerge. If large
numbers of these vehicles increase electricity demand
beyond today’s levels, they will require investments by
utilities and power producers.
The electricity grid will also need to tap into more
renewable sources of power, or the environmental
C h a p t e r 6 : Yo u c a n g e t t h e r e f r o m h e r e — t r a n s p o r tat i o n
benefits of electric-drive vehicles will be limited. Standardized charging equipment and protocols, limits on
charging during peak hours, and charging costs that
vary with the time of day will also be critical to realizing benefits from widespread adoption of plug-ins or
battery-electric vehicles.
Fuel cell vehicles will require the largest investment
in infrastructure, because of the need to expand both
the production and distribution of hydrogen. The National Research Council estimates that an aggressive
goal of putting more than 60 million fuel cell vehicles
on the road will require an investment of $8 billion
from 2008 to 2023, and as much as $140 billion
through 2035 (NRC 2008).
Regardless of the technology, widespread growth of
clean vehicles will require both significant and intelligent investments in infrastructure.
6.2.2.3. Corporate and Consumer Behavior
Ensuring that the technologies for clean transportation
fuels and vehicles work and that their costs are reasonable will probably still not be enough. The conventional
gasoline car has been around for more than 100 years
and is embedded in our way of life. Shifting to alternatives will require changes in the way we refuel our
vehicles and changes in the vehicles themselves. For
companies to invest in those changes, they need to
believe that people will embrace them. But people
will not do so unless they believe that the alternatives
are viable.
The problem gets even worse when we consider
petroleum prices. When they are low, the existing fuel
supply industry resists competition, and consumers
and the auto industry are less interested in alternatives.
When petroleum prices are high, steering the fuel supply industry away from enormous short-term profits
toward long-term alternatives will remain a challenge—
just when consumers and the auto industry are most
interested in those alternatives. And whether petroleum prices are high or low, almost everyone seems
to resist fuel-pricing policies that support a shift to
alternatives, despite their potential. All these challenges
create a chicken-and-egg problem that can doom
even cost-effective fuels.
Policies
6.2.3. Key Policies for Moving
to Low-Carbon Alternatives
6.2.3.1. Making Them Available at the Pump
One approach is to put performance-based standards
in place to make sure that low-carbon alternatives
Today, only about 4,000 out of the more than 160,000
U.S. gas stations carry biofuels, electricity, hydrogen,
or natural gas. A strong policy push is needed to make
these low-carbon fuels more widely available. A lowcarbon fuel standard supports access to, and innovation in, transportation fuels while ensuring that these
fuels contribute to both energy and climate security.
become available. The 2007 energy bill passed by Congress included the first federal policy requiring fewer
heat-trapping emissions over the full life cycle of a
fuel—including harvesting, production, delivery, and
use, as well as direct and indirect emissions from the
clearing of land for crops. This provision—the renewable fuel standard (RFS)—requires fuel providers to
buy 36 billion gallons of biofuels by 2022, and sets
low-carbon performance standards for at least 21 billion of those gallons. However, because the RFS does
not regulate emissions from gasoline, biofuel production already in place, or other fuels, it covers only about
10 percent of the transportation fuel market. A more
comprehensive approach—a low-carbon fuel standard
that covers all transportation fuels—can protect and
build on the benefits of the RFS.
A low-carbon fuel standard supports innovation in
transportation fuels while ensuring that they contribute to both energy and climate security. Under such a
standard, suppliers must reduce emissions from the
fuels they sell on an average per-unit-of-energy (or energy intensity) basis. They can meet this requirement
111
112
U n i o n o f C o n c e r n e d Sc i e n t i s t s : C l i m at e 2 0 3 0
Table 6.4. Potential of Advanced Vehicles and Fuels

2020
2030
Low-Carbon Fuel Standard: Reduction
in Carbon Intensity for All Transportation
Fuels vs. 2005a
3.5%
10%
Sales of Advanced Light-Duty Vehicles
Spurred by Regulationsb
2.0%
20%
a This standard would require a reduction in life-cycle grams of CO2 equivalent
per Btu of all fuel used for transportation, including cars and light trucks, medium- and heavy-duty vehicles, rail, air, shipping, and other miscellaneous uses.
If the standard is restricted to highway vehicles (cars, light trucks, and medium- and heavy-duty vehicles), the figure for 2020 would be 4.5 percent, and
that for 2030 would be 14 percent.
b This represents the fraction of light-duty vehicles that are plug-in hybrids, or pure battery and fuel cell vehicles delivering equivalent benefits.
by blending low-carbon biofuels, such as cellulosic
ethanol, into a fuel, or by improving refinery efficiency.
Suppliers can also sell clean hydrogen or renewable
electricity, or purchase credits from those that do. A
low-carbon fuel standard requires providers to account
for emissions from high-carbon alternatives—such as
liquid coal, which has double the carbon emissions of
gasoline—by either avoiding them or offsetting them
with cleaner fuels.
Based on the potential to produce about 30 billion
gallons of low-carbon biofuels, the nation should be
able to reduce carbon emissions from all transportation
fuels 8 percent by 2030. A reasonable goal of a 10 percent improvement in refinery efficiency can add another 1 percent cut in emissions. And if plug-in hybrids
or other electricity-based vehicles account for 20 percent of sales of new vehicles, and use electricity producing 70–80 percent fewer carbon emissions than
today (see below), such vehicles should cut the carbon
intensity of fuels by another 1–1.5 percent.
All told, those technologies could cut carbon emissions from transportation fuels by about 3.5 percent
in 2020, and 10 percent in 2030 (see Table 6.4).67 California—which is leading the nation with a low-carbon
fuel standard that aims to reduce emissions from transportation fuels 10 percent by 2020—would play a key
role in fulfilling such a national standard (CARB 2009).
California consumes 11–12 percent of the nation’s
transportation fuel, so its requirement would cut
the nation’s carbon emissions from such fuel by about
1.2 percent in 2020, partly through importing biomass
and low-carbon fuels from other parts of the country
(EIA 2009e).
A nationwide low-carbon fuel standard is constrained by how quickly technologies such as cellulosic
biofuels and biomass-to-liquids can scale up, and
by the amount of land available to produce the needed
biomass. Conservative assumptions in our Blueprint
case about the availability of land for producing
biomass for transportation fuel mean that such fuel
would not have significant direct and indirect carbon
emissions. More optimistic assumptions—such as
those in a 2007 report from the DOE’s Energy Information Agency—suggest that annual biofuel production could reach 45–60 billion gallons, which could
support a 15 percent low-carbon fuel standard in 2030
(EIA 2007).
6.2.3.2. Moving Consumers to the Cleanest Fuels
All these challenges point to the need for significant
research, development, and deployment programs to
speed low-carbon fuels to market. While industry will
bear much of the cost of such programs, and pass them
on in the prices of vehicles and fuels, these technologies are both risky and important enough to suggest a
clear role for government-funded programs. Those will
need to support everything from basic research to grants
for the pilot plants needed to prove the technology and
begin the process of scaling up production.
But even R&D will not be enough to overcome the
chicken-and-egg problem, especially when it comes to
the more advanced vehicles like plug-ins, which will
cost even more than conventional hybrids, and fuel cell
vehicles. Even a low-carbon fuel standard is unlikely to
spur early widespread use of the best technologies, if
refiners find simpler alternatives. While that may be
fine in the near term, it will further delay progress on
these technologies, and may compromise their ability
to bear fruit in the longer term.
Subsidies in the early years, when costs are high, can
lead advanced fuels and vehicles to the market. One
study put the incremental cost of bringing hydrogen
fuel to market—and the number of fuel cell vehicles
to about 5 million by 2023—at more than $50 billion
(NRC 2008). Plug-ins may require a similar level
of funding, to cover the extra up-front costs of more
advanced vehicles. These resources could come from
67 If the low-carbon fuel standard applied only to highway vehicles—cars and light trucks, and medium- and heavy-duty vehicles—
the equivalent values would be a 4.5 percent reduction in carbon emissions from highway fuels in 2020, and a 13.7 percent cut by 2030.
C h a p t e r 6 : Yo u c a n g e t t h e r e f r o m h e r e — t r a n s p o r tat i o n
auctions of carbon allowances under the cap-and-trade
program, or as part of a broader effort to create green
jobs in the coming decade.
Another alternative is to create a performancebased version of California’s Zero Emission Vehicle
program. While that program has encountered delays, direct requirements for advanced vehicles have
spurred the development of hybrids and significant
progress on battery and fuel cell technology (Turrentine and Kurani 2000).
6.3. The Road Less Traveled:
Reducing Vehicle Miles
The nation can make great strides in improving vehicle
efficiency and producing cleaner fuels, but technology
alone will not keep pace with growing demand for personal and freight travel if we continue on our current
path. The classic suburban American lifestyle is predicated
on driving a personal car a growing number of miles.
Since 1980, the number of vehicle miles traveled
(VMT) in cars and light trucks has grown three times
faster than the U.S. population, and nearly two times
faster than vehicle registrations (Ewing et al. 2007).
VMT is expected to grow at a slower pace than historical trends from 2005 to 2030 but continue its upward
trajectory, growing nearly two times faster than the
U.S. population (EIA 2008a).68
While today’s fleet of cars and light trucks travels
about 2.7 trillion miles a year, that number could
easily reach 3.8 trillion miles by 2030—a 42 percent
increase (1.4 percent per year) (CTA 2008; EIA 2008a).
Freight travel could rise by a similar amount, while air
travel could grow by as much as 60 percent (2.2 percent per year) (EIA 2008a).
To slow growth in vehicle miles traveled, the nation
needs to promote compact development, provide
drivers with market-based incentives to drive less (such
as pay-as-you-drive insurance and congestion mitigation fees), and give freight operators tools to increase
the number of tons they haul per mile. Better-planned
and more compact development can shorten car trips,
increase the use of public transit and light rail, and provide substantial health and other benefits. By co-locating housing with jobs, improving access to walking,
biking, and public transit, and revitalizing city centers,
the road less traveled can promote healthy, vibrant, and
desirable communities while cutting carbon emissions.
Potential
113
6.3.1. Potential for Reducing Car
and Truck Travel
Overturning today’s car-centric culture will
require us to overhaul how and where we live and work.
The technical potential to reduce travel is vast, although
more research is needed on the cost and effectiveness
of various strategies.
The next sections explore the technical potential for
building smarter cities, reducing VMT through personal choice, raising the number of people using each
vehicle and public transit, and moving goods more efficiently. Our analysis does not include the technical
potential to reduce air, marine, and off-road VMT, or
to improve transit options, as in providing high-speed
electric rail.
6.3.1.1. Smarter and More Compact Development
More compact and better-planned cities could reduce
VMT by up to 30 percent (Ewing et al. 2007). One
study found that residents of sprawling, suburban Atlanta and Raleigh drove more than 30 miles per person
per day, while residents of compact cities such as Boston and Portland drove fewer than 24 miles per person
Growing in popularity, car sharing greatly reduces vehicle miles traveled
simply by reducing the number of vehicles on the road. The car-sharing
company Zipcar offers trucks, compacts, and hybrids for urban transport; members can reserve a car months or minutes in advance. Instead
of purchasing a pickup truck and driving it year-round, members can
rent trucks just for the times they need to transport heavy loads.
68 This analysis of VMT is based on the EIA’s high-gas-price scenario ($3.50 per gallon) versus its baseline scenario ($2.50 per gallon)
in its 2008 Annual Energy Outlook. Higher gas prices suppress VMT for light-duty vehicles from the baseline of 1.7 percent per year
to 1.4 percent per year.
114
U n i o n o f C o n c e r n e d Sc i e n t i s t s : C l i m at e 2 0 3 0
market-based incentives. Given historical trends, good
intentions and personal preferences alone are unlikely
to provide much of a reduction. However, market-based
incentives have proven successful.
The higher the cost per mile of driving, the more
likely a consumer will be to drive less. A recent study
of 84 U.S. urban areas from 1985 to 2005 found that
for every 1 percent increase in the price of fuel, VMT
fell by 0.17 percent (Ewing et al. 2007). A study by
Cambridge Systematics found that pay-as-you-drive
insurance—which charges drivers based on how many
miles they drive—could reduce national VMT more
than 7 percent (Cowart 2008).69
Over the next 20 years there are significant opportunities to shape
new growth in ways that enable denser and more livable communities. As downtowns are revitalized, areas can be reserved for walking, biking, and public transit. New communities can have housing,
shopping, parks, and jobs integrated with public transit.
per day—more than 25 percent less (Ewing, Pendall,
and Chen 2002). Another study found that residents
of compact regions drive up to one-third fewer miles
than the U.S. average (Bartholomew 2005 and 2007
in Ewing et al. 2007).
Construction of new buildings and revitalization of
existing neighborhoods provide the greatest opportunity to capitalize on smart growth to reduce VMT.
According to one study, “By 2030, about half of the
buildings in which Americans live, work, and shop will
have been built after 2000” (AASHTO 2007). That
means that the next 20 years will provide significant
opportunities to shape new growth in ways that enable
denser and more livable communities. As we revitalize
our downtowns, we can reserve space for walking, biking,
and public transit, while new communities can integrate housing, shopping, parks, and jobs with transit.
These approaches would feed a smart-growth revolution
that entails rethinking how we move people and goods.
6.3.1.2. Choosing to Drive Less
For discretionary trips, drivers can make a conscious
choice to reduce VMT, spurred by good intentions,
personal preferences (such as the desire to avoid time
in traffic or trapped behind the wheel of a car), or
6.3.1.3. Bring a Friend: Raising the Occupancy
of Personal Vehicles
One simple way to reduce travel is to increase the number of people riding in each vehicle, reversing historical
trends. The average U.S. vehicle carries 1.6 people, and
occupancy drops to barely more than one person (1.1)
during trips to work (CTA 2008).
Carpooling is the key to increasing the occupancy
of personal vehicles. If people who drive to work carpooled with just one other person (HOV-2) every other
day, annual car and truck travel would drop by more
than 5 percent, and average vehicle occupancy during
work trips would rise to about 1.4.70 If commuters carpooled with two other people (HOV-3) for about 60
percent of work trips, annual travel would fall about
10 percent, and average occupancy during work trips
would rise to about 1.8.
6.3.1.4. Ride the Bus: Expanding Ridership on
Public Transit and in Vanpools
Urban and suburban areas need greater access to public transportation and vanpools to help cut carbon
emissions. As of 2001, less than one-third of the U.S.
population lived within about a block of a bus line,
and only about 40 percent lived within a half-mile
(NCTR 2007). The situation is even worse for rail:
only about 10 percent of the U.S. population lived
within a mile of a rail stop, while only about one-quarter lived within five miles (NCTR 2007). As a result
of low ridership, buses release more global warming
emissions per passenger-mile than cars.
69 This figure does not account for induced demand from reduced congestion, which will offset some of the gains of pay-as-you-drive
insurance.
70 Travel to work would shrink by about 25 percent. However, such travel represents only 27 percent of all VMT for cars and light
trucks, so the overall impact of such a shift is much smaller (CTA 2008).
C h a p t e r 6 : Yo u c a n g e t t h e r e f r o m h e r e — t r a n s p o r tat i o n
Public transportation advocates have pointed to the
potential to at least double the capacity and ridership
of bus and rail transit by 2030, at an annualized cost
of about $21 billion (AASHTO 2007). That would
By carpooling with a
co-worker every other day or
shifting to a four-day workweek, Americans can reduce
their personal travel by
more than 5 percent.
represent an important start in satisfying Americans’
awakening appetite for public transit (Sun 2008). Individual drivers who switch from a car or SUV to
vanpools, bus, or electric rail cut their carbon footprint significantly, with the benefits rising as more people switch.
The U.S. mass transit system is so small that doubling it will reduce VMT by only about 2 percent, given
today’s ridership levels. Expanding ridership could
boost this impact significantly, especially in regions that
use transit least effectively. The nation clearly needs to
make major investments in public transit, but such
investments will bear most of their fruit after 2030.
6.3.1.5. Working Up a Sweat or Working from
Home: Near-Zero-Carbon Options
We can cut carbon emissions dramatically by replacing
car trips with walking or biking. However, in 2000
fewer than 3 percent of Americans reported walking to
work, while less than one-half of 1 percent reported
bicycling to work (CTA 2008).
Flexible workplace policies that allow employees to
work at home or shift to four days per week at 10 hours
per day can also reduce car and truck use. In 2000,
slightly more than 3 percent of Americans reported
working from home (CTA 2008). By shifting to a fourday workweek or working from home one day per
week, the typical American could cut his or her overall
travel by about 5 percent. By working at home two
days a week, he or she could cut annual travel by about
10 percent.
New technology and expanded transit service can increase ridership while dramatically cutting emissions and creating jobs. A number of Indiana cities, for example, have added hybrid buses to their transit fleets, including
Indianapolis (pictured here), Muncie, Fort Wayne, Bloomington, greater Lafayette, Evansville, and Terre Haute. At least three Indiana-based companies manufacture hybrid bus drivetrains or components.
115
116
U n i o n o f C o n c e r n e d Sc i e n t i s t s : C l i m at e 2 0 3 0
or shopping trips on their extra day off. However, those
practices are a good start.
6.3.1.6. Car and Truck Travel: All of the Above
As with cleaner vehicles and fuels, no silver bullet can
preserve the mobility we enjoy today while reducing
overall travel. Instead, the nation will have to pursue a
variety of approaches to ensure that people live productively while relying less on personal vehicles.
A recent analysis by Cambridge Systematics points
to the potential for significant reductions in projected
car and light-truck travel (Cowart 2008). That study
evaluated a suite of policies to reduce VMT through
more compact communities, per-mile pricing policies,
and other smart-growth strategies. The study found
that these approaches could reduce the annual growth
rate in VMT for light-duty vehicles from 1.7 percent
to 0.9 percent.71 Part of that reduction could come
from a doubling of transit.
6.3.1.7. Shifting Freight Back to Rail
Changing our daily commutes by walking, biking, or telecommuting can dramatically cut carbon emissions. Unfortunately, less than 10 percent of Americans report taking advantage of these alternatives. This statistic highlights the need for policies and funding to make these commuting options safe and accessible—
true alternatives to being stuck in traffic alone in a car.
Working from home is not quite carbon-free, because the use of lights, computers, heating, and cooling does grow. However, avoiding the use of those
resources at the office should offset much of that use.
Working longer hours but fewer days is not quite carbon-free for the same reason, and also because that
practice could encourage people to take more leisure
Just as consumers can shift to more efficient transportation modes such as transit, biking, and walking, companies can also shift to rail as a more efficient mode for
moving goods than trucks.
Moving goods by rail is about five times more efficient than doing so by truck, based on weight, primarily because rail transports dense, heavy cargo such as
coal.72 However, even for lighter-weight loads more
typical of 18-wheelers, trucks emit two to three times
more carbon emissions than trains (Mathews 2008).
And rail is likely to retain that advantage over trucks
during the coming decades, although it may erode if
improvements in truck efficiency outpace those in rail.
Estimates from the American Association of State
Highway and Transportation Officials (AASHTO) indicate that 1 percent of truck freight could shift to rail
by 2020, and an analysis by two national laboratories points to the potential for a 2–5 percent shift (AASHTO 2003; IWG 2000). A conservative estimate is
that about 1.5 percent of freight could move from
trucks to rail by 2020, and at least 2.5 percent could
shift by 2030.
71 The analysis showed an 18 percent reduction in projected light-duty travel in 2030 of more than 4 trillion miles, accounting for
induced demand. The baseline projection of a growth rate of 1.7 percent per year is higher than that used in our study (1.4 percent
per year). Our figure means that a reduction to 0.9 percent per year should be even easier to achieve.
72 The average value of five times is based on data from the Transportation Energy Data Book (CTA 2008), and assumes that freight
trucks carry 11.8 tons per mile, based on statistics from the U.S. Department of Transportation (U.S. DOT 2000). Using the most
common type of tractor-trailer (van trailers), we found the average payload to be 30,555 pounds. The loads of such combination
vehicles are the most likely to shift to rail. Using the U.S. Census Bureau’s 2002 Vehicle Inventory and Use Survey Microdata for
Class 8 trucks, we determined that their “empty miles” averaged 23 percent.
C h a p t e r 6 : Yo u c a n g e t t h e r e f r o m h e r e — t r a n s p o r tat i o n
6.3.2. Key Challenges for Smarter
Challenges Travel, Freight Transport, and Cities
6.3.2.1. Lack of Funding
There is no denying that expanding transit costs money,
and that finding those funds is a challenge. Estimates
show that annual funding for highways and transit falls
about $10 billion short of what the nation needs just
to maintain the existing system. Closing that gap would
require a 6-cent-per-gallon increase in diesel and gasoline taxes, while doubling transit capacity would require
another 12 cents per gallon. Together those increases
would double today’s 18-cent-per-gallon gasoline tax—
a drop in the barrel compared with price swings in
2008, but likely still a significant political hurdle.
Making matters ironically worse, rising fuel economy
will cut projected gasoline and diesel use, expanding
the funding shortfall.
117
Given that Americans are not paying enough in
gasoline taxes to maintain today’s highway system, they
are clearly not directly paying the full cost of the U.S.
reliance on personal vehicles, including the national
security costs of our dependence on oil, the health impacts from smog and toxic pollution, time lost owing
to congestion, and the health and economic impacts
of global warming, just to name a few. If we are not
directly paying the full price of a resource, we are
going to use too much of it, and will be less willing to
switch to the many alternatives.
If businesses shifted 2.5 percent of goods now shipped by
truck to rail by 2030, carbon
emissions from those shipments would drop by half or more.
6.3.2.2. The Impact of a Lower Cost of Driving
Blueprint policies that require new vehicles to reduce
carbon emissions will help push fuel economy to 50–55
miles per gallon in 2030 and reduce the per-mile cost
of driving—potentially giving consumers an incentive to drive even more. As the cost of driving falls,
consumers have less incentive to carpool, take public
transit, or explore near-zero-carbon options such as
biking and walking. Increasing the efficiency of our car
and truck fleets is essential. However, if doing so encourages people to drive more while still saving money,
it could dilute some of the carbon benefits of more efficient vehicles.
A similar impact may result from reducing the number of vehicles on the road, as that will lower another
cost: time wasted in congested traffic. That may encourage people who avoid congested routes to switch
to those routes, again reversing some of the progress.
6.3.2.3. Weak Market Signals
Funding challenges are directly tied to the fact that
consumers do not actually pay the full costs of driving.
Transporting coal from where it is mined to where it is burned in a
power plant takes up about 40 percent of our nation’s rail capacity.
Because rail is a more efficient and less carbon-intensive way to
ship freight, one surprising benefit of phasing out coal-fired power
plants is that rail capacity would be freed up to handle other kinds
of freight currently transported in trucks, helping to reduce the
global warming impact of the shipping sector.
118
U n i o n o f C o n c e r n e d Sc i e n t i s t s : C l i m at e 2 0 3 0
Box 6.4.
S u cc e s s S t o r y
It Takes an Urban Village to Reduce Carbon Emissions
Arlington, VA, has won national awards for its “urban village”
model of smart growth.
T
he trolley carried its first passengers from Clarendon,
VA, across the Potomac into Washington, DC, in 1896
(APA 2007). It served not only commuters but also shoppers, transporting them to stores along its lines.
Today the “urban villages” along the old trolley lines—
Clarendon, Courthouse, Ballston, and others—make
Arlington County one of the most desirable communities in the metropolitan DC area.
Although there are no more streetcars, the spirit of
the trolleys is alive in Arlington County. In contrast to its
suburban cousins in Maryland and northern Virginia, the
county used its rail and bus system as a foundation for
smart growth, encouraging business development while
preserving unique neighborhoods.
Under its General Land Use Plan, Arlington concentrated dense, mixed-use development around its
Metro stations beginning in the mid-1980s. These urban
Chicago’s Climate Action Plan includes a smarter, energyefficient transportation mix.
villages emphasize pedestrian access, promote safety
through traffic “calming,” provide bike lanes, and create
highly desirable living spaces by incorporating public art,
pocket parks and street trees, wide sidewalks with restaurant seating, and street-level retail (EPA 2002).
While much of the nation followed the trajectory of
urban sprawl, Arlington County boasts 22,500 apartments
and condos, townhouses, and single-family detached
homes, as well as a thriving commercial base (EPA 2002).
Mindful of the area’s socioeconomic disparities, county
government and civic groups worked to spread the benefits equitably among all residents. Affordable Housing
Protection Districts, for example, help preserve low- and
moderate-income apartment units (CPHD 2008a).
Metro ridership in the corridor doubled between 1991
and 2002. And to expand residents’ access to public transportation, the county created the Arlington Rapid Transit
Arlington County’s urban villages emphasize pedestrian access,
promote safety through traffic “calming,” provide bike lanes, and create
highly desirable living spaces by incorporating public art, pocket parks and
street trees, wide sidewalks with restaurant seating, and street-level retail.
C h a p t e r 6 : Yo u c a n g e t t h e r e f r o m h e r e — t r a n s p o r tat i o n
6.2.2.4. Incentives for Unrestricted Growth
system (ART)—a fleet of 30 smaller, handicapped-accessible buses that can navigate
neighborhoods and are well integrated into the
comprehensive network of bus and train lines in
the nation’s capital and the surrounding region
(ART 2009).
The resulting health, environmental, and
other quality-of-life benefits are equally impressive. Almost half of Arlington residents use
transit to commute (APA 2007), while another
6 percent walk to work, compared with 2.5 percent nationwide (CPHD 2008b; Reuters 2007).
Nearly 20 percent of county residents do not
even own a car.
Heavily traveled Wilson Boulevard saw traffic
drop nearly 16 percent from 1996 to 2006 (APA
2007). Commute time in Arlington County is the
region’s lowest, and both carbon and smogforming emissions have fallen dramatically. The
county has accomplished all this while maintaining a high level of municipal services and
the lowest property tax rate of any jurisdiction
near the nation’s capital (CPHD 2008b).
The urban village model has won national
awards for smart growth (EPA 2002), and the
American Planning Association recently showcased Arlington’s main corridor as one of the
Great Streets of America (APA 2007).
Meanwhile other cities are forging their own
smart-growth paths. Chicago’s Climate Action
Plan places strong emphasis on transit-oriented
community growth. Atlanta has focused on
urban renewal through its downtown Atlantic
Station project (EPA 2005). And the outer-rim
suburb of Buckeye, AZ, near Phoenix, is working
to become its own bedroom and business community (Suarez 2008). Whatever the approach, a
commitment to sustainable growth is one way
to help us reach our lower-carbon future.
A number of existing laws actually encourage sprawling development, which requires greater use of cars.
For example, zoning requirements that do not allow
commercial and residential uses to mix limit the
potential to integrate transit, housing, and shopping.
Local ordinances that require taxpayers to fund the expansion of utilities to new houses and businesses ensure
that developers do not pass on the full costs of building outside existing communities. And formulas for
distributing federal highway funds that focus on expanding roadways rather than mitigating traffic further
encourage sprawl.
Policies
6.3.3. Key Policies That Provide New
Options for Getting There from Here
As U.S. history shows, the barriers to reducing projected vehicle miles traveled are anything but
trivial. However, several public policies could help overcome these barriers.
6.3.3.1. Smart-Growth Policies
The biggest job of all is rethinking and reinventing
where we live. Much of this work has to happen at the
local level, such as by changing zoning laws to allow
more mixed use, and requiring developers to pay the
full costs of extending utilities to their projects. However, the federal government can help move these
approaches along through a variety of steps.
Agencies should tie existing and future highway
funding to performance metrics—whether cuts in carbon emissions or vehicle miles, or more efficient use of
infrastructure. Highway funds represent a significant
transfer of taxpayer dollars, and their use should focus
on delivering public benefits. The nation should also
reform the home mortgage tax deduction, to allow
higher deductions for homes near transit or in mixeduse developments.
6.3.3.2. Pay as You Drive
Another straightforward approach to overcoming barriers is to require that people pay the actual costs of
their daily driving. The initial response to asking people
to pay more for every mile they drive is resistance, as
they see that approach as raising their expenses. However, that is just a misunderstanding.
Americans are already bearing those costs. For example, we pay higher hospital bills and health insurance rates because of asthma and lung disease stemming
from smog. We also pay higher income taxes to help
secure U.S. access to oil, and to cover the shortfall in
119
120
U n i o n o f C o n c e r n e d Sc i e n t i s t s : C l i m at e 2 0 3 0
road repair funds. And if we do not cover these costs
elsewhere, we still pay them through spikes in gas prices, more costly car repairs, and time wasted owing to
congestion, potholes, bridge collapses, and road closures. Consumers and businesses that pay driving fees
will therefore see tax cuts elsewhere, lower health care
costs, fewer price spikes, and less congestion.
Table 6.5.
We can start with two key measures: highway user
fees and pay-as-you-drive insurance.
Highway user fees. As the fuel economy of vehicles
rises, people will use less fuel, save money, and pollute
less. But because they use less fuel, they will also
pay fewer gasoline taxes, which are collected on a
Potential for Reducing Vehicle Miles Traveled
Potential for Reducing Vehicle Miles Traveled
2020
2030
Assumed Policy Impact: Reduction in Annual Growth in Vehicle Miles Traveled (VMT)a
Reduce growth in VMT from baseline
of 1.4% per year to 0.9% per year
Light-Duty Vehiclesb
Reduce VMT by 0.1% per year,
on top of all other policy effects
Trucksc
Policies and Costs for Light-Duty Vehicles
Ramp up transit funding to reach
$21 billion per year by 2030
Transitd
Pay as You Drive
Highway User Fee 1:
Maintain Existing Funding Levelse
Highway User Fee 2:
Congestion Mitigation Fee Used to Fund Transitd
Total User Fees
Pay-as-You-Drive (PAYD) Insurance
e
Federal Funding for PAYD Pilot Programs
$0.005 per mile
$0.011 per mile
$0.004
$0.006
$0.009 per mile
$0.017 per mile
$0.07 per mile
$0.07 per mile
$3 million per year for 5 years
Tax Credit for PAYD Electronics
$100 million per year for 5 years
Smart Growth
$0.00
$0.00
$0.00
$0.00
f
Policies and Costs for Heavy-Duty Vehicles
Switch from Truck to Railg
Notes:
a NEMS is unable to model the full suite of policies needed to address vehicle travel. Instead, we inserted the total reductions in vehicle
miles traveled that could result from such policies into UCS-NEMS.
b For the potential to reduce VMT from light-duty vehicles, we relied primarily on a recent analysis by Cambridge Systematics (Cowart
2008), which found that growth in light-duty VMT could be reduced to 0.9 percent per year.
c To evaluate the potential to reduce VMT from freight trucks, we assumed that policies can shift 2.5 percent of truck VMT to rail,
based on potential highlighted in AASHTO 2007 and IWG 2000. This represents about a 0.1 percent annual reduction in freight truck
travel. Actual freight truck travel will fall further as the economy shifts due to other policies, such as a cap-and-trade program and
reduced oil use from higher vehicle efficiency.
d The congestion mitigation fee provides this funding, so we did not count it as a cost above that fee.
e Blueprint policies do not include these fees as a cost, because the Reference case would also need to raise the highway funding to pay
for repair of existing roads, and would include the cost of insurance. Actual insurance costs would probably drop, because people
would drive less under the Blueprint.
f Smart-growth policies could actually reduce costs, so we assumed that they are cost-neutral.
g Switching from truck to rail will likely entail some costs, but evaluating them was beyond the scope of our study.
C h a p t e r 6 : Yo u c a n g e t t h e r e f r o m h e r e — t r a n s p o r tat i o n
Riding a bike to work is a healthy and affordable alternative to driving, and it saves time, too—no more wasting
time stuck in traffic or circling parking lots.
per-gallon basis. Rather than raising those taxes to
compensate, we should adopt a per-mile user fee that
at least covers any resulting federal, state, and local
shortfalls. We should also institute a congestion and
air-quality mitigation fee that will at least cover the
costs of doubling transit by 2030. The former would
require at least a one-cent-per-mile road user fee by
2030. The latter would require a little more than a
one-half-cent-per-mile fee—for a total of $0.009 per
mile by 2020, and $0.017 per mile by 2030 (see
Table 6.5).
Per-mile highway user fees do not represent a new
cost to drivers, as the nation would need to raise the
funds to maintain our roads in any case. And unlike
income or sales taxes, such fees will have the added
benefit of reducing the number of miles we drive. We
therefore should not count these specific per-mile highway user fees as a “cost” of cutting carbon emissions.
Pay-as-you-drive insurance. Another cost that to-
day’s drivers already bear is car insurance. The price of
that insurance is usually not tied to the number of
miles we drive, despite the fact that the more we drive,
the more we risk the accidents that insurance covers.
If insurance were tied to the number of miles we
drive, the roughly $800 per year in insurance we
pay would equal about $0.07 per mile—the equivalent of raising gas taxes by about $1.40 per gallon.73
Two recent reports point to the potential of this approach to cut VMT by 7–9 percent (Bordoff and
Noel 2008; Cowart 2008). The Blueprint analysis
estimates an impact on the order of 5–6 percent (likely
because of a higher per-mile baseline, reflecting higher
gasoline costs).
Pay-as-you-drive (PAYD) insurance is more equitable, given that low-mileage drivers now subsidize
high-mileage drivers, and consumers will save money
73 The cost of insurance is from Bordoff and Noel 2008. The per-mile figure is based on 11,500 miles per year. The per-gallon figure
is based on 20 miles per gallon.
121
122
U n i o n o f C o n c e r n e d Sc i e n t i s t s : C l i m at e 2 0 3 0
Box 6.5.
Technologies and Other Options on the Horizon:
Transportation
Breakthroughs in
algae biofuels
High-speed rail
• Breakthroughs in third-generation biofuels. From
algae to efficient microbes that can digest almost
anything, hoped-for breakthroughs could produce
large volumes of liquid fuels with minimal land use.
• Dramatic expansion of all-electric cars and trucks.
If cost and other key hurdles are overcome, by 2050
most cars and light trucks could run on batteries or
fuel cells supplied by renewable energy, effectively
eliminating those vehicles as a significant source of
carbon emissions. Many medium-duty and heavyduty vehicles could also follow this path.
• High-speed and zero-emission rail. Trains that can
move rapidly between major cities while running on
renewable electricity could replace airplanes for
shorter trips, eliminating carbon emissions. Such a
train system could also help shift freight from truck to
rail, significantly reducing emissions from freight
shipments.
• Advanced high-strength materials. Carbon fiber,
now used in aircraft, could become cost-effective
for use in highway vehicles over the long term. Such
uses would dramatically cut the weight—and thus
the carbon emissions—of cars and trucks of all
shapes and sizes while also increasing their safety.
• Expanded transit-oriented development. Cities do
not expand overnight. With advanced planning, more
and more cities could expand around transit, integrating homes, shopping, and transportation with
parks and open areas across the country.
C h a p t e r 6 : Yo u c a n g e t t h e r e f r o m h e r e — t r a n s p o r tat i o n
To double capacity and ridership for bus and rail transportation by 2030, more money must be set aside to expand and improve public transit. Chicago leads the way with an aggressive climate action plan (online at www.chicagoclimateaction.org) to reduce its emissions across various sectors including transportation (which
currently comprises 21 percent of its total emissions). By investing in transportation alternatives such as public transit, bicycling, walking, car sharing, hybrid buses, and smart growth, Chicago can meet its goal of creating a convenient and energy-efficient transportation mix.
as reduced travel means fewer accidents and thus lower
costs. Bordoff and Noel estimate that this approach
could save the nation $32 billion just by reducing the
number of accidents—or about $150 per vehicle, of
which $34 per vehicle could accrue to insurers.
The way PAYD is implemented is also important.
While it could be based on annual odometer readings,
a once-per-year payment or rebate might not have the
same impact as more immediate feedback. A better alternative is to install a GPS-based device to track mileage, which Bordoff and Noel estimate would cost $100
per vehicle, and to require periodic payment of insurance premiums. GPS technology could even allow us
to pay for insurance along with a fuel purchase, combining pay-at-the-pump with PAYD.
Bordoff and Noel point to the cost of this device as
a significant hurdle, because insurance companies
would not save enough to cover it, so they might be
unwilling to advocate for it. To overcome that hurdle,
those analysts recommend a $100 tax credit per vehicle
for insurance companies, for the first 5 million vehicles.
That approach would put systems in place that could
also support per-mile road user fees. Bordoff and Noel
also recommend that the federal government spend
$3 million per year for five years to establish pilot programs, and that states adopt laws clearing the way for
PAYD insurance.
6.3.3.3. More Funding for Transit
If the nation is to double transit by 2030, we must set
aside more money to expand and improve bus and
rail transportation. Based on AASHTO recommendations, such a doubling would require additional
dedicated funding that would reach $21 billion per
year in 2030.
123


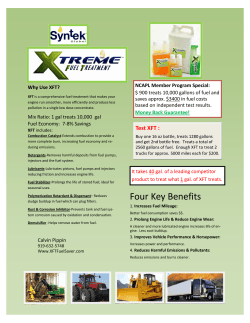


© Copyright 2026