
WHAT DOES fMRI TELL US ABOUT NEURONAL ACTIVITY?
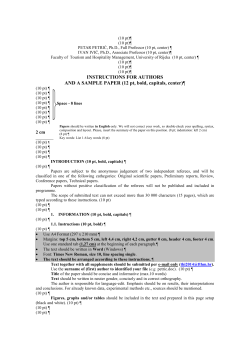
REVIEWS
WHAT DOES fMRI TELL US ABOUT
NEURONAL ACTIVITY?
David J. Heeger and David Ress
In recent years, cognitive neuroscientists have taken great advantage of functional magnetic
resonance imaging (fMRI) as a non-invasive method of measuring neuronal activity in the human
brain. But what exactly does fMRI tell us? We know that its signals arise from changes in local
haemodynamics that, in turn, result from alterations in neuronal activity, but exactly how neuronal
activity, haemodynamics and fMRI signals are related is unclear. It has been assumed that the
fMRI signal is proportional to the local average neuronal activity, but many factors can influence
the relationship between the two. A clearer understanding of how neuronal activity influences the
fMRI signal is needed if we are correctly to interpret functional imaging data.
EXTRASTRIATE CORTEX
All visually responsive areas of
cortex except the primary visual
cortex.
Department of Psychology,
450 Serra Mall, Building 420,
Stanford University,
Stanford, California 94305,
USA.
Correspondence to D.J.H.
e-mail: [email protected]
DOI: 10.1038/nrn730
142
Functional magnetic resonance imaging (fMRI)1–5 has
revolutionized cognitive neuroscience over the past
decade. fMRI takes advantage of the coupling between
neuronal activity and haemodynamics (the local control of blood flow and oxygenation) in the brain to
allow the non-invasive localization and measurement of
brain activity (BOX 1). This technique is allowing a new
era of research, complementary to more invasive techniques for measuring neuronal activity in animal models, to explore the function and dysfunction of the
human brain. However, the ultimate success of this
research depends on the relationship between the fMRI
signal and the underlying neuronal activity. The vascular source of the fMRI signal places important limits on
the usefulness of the technique. Although we know that
the fMRI signal is triggered by the metabolic demands
of increased neuronal activity, the details of this process
are only partially understood (BOX 2). Consequently, this
issue has emerged as one of the most important areas in
neuroscience.
Understanding the relationship between fMRI and
neuronal responses is particularly important because
some fMRI and neurophysiology experiments have
yielded apparently conflicting results. One example
concerns the role of primary visual cortex (V1) in spatial attention6. Our ability to perform a visual discrimination task improves when we are cued to attend,
without moving our eyes, to the spatial location of the
relevant stimulus. Shifts in attention are correlated
with systematic changes in activity in a number of
brain areas. Although some theories posit that attention is mediated by selection very early in the visual
pathways, attentional effects have been notoriously
difficult to measure using single-unit electrophysiology in area V1 of the monkey brain7,8. By contrast,
robust attentional effects have been readily measurable
with fMRI in human V1, and attentional effects in
EXTRASTRIATE CORTICAL AREAS (such as V4) seem to be considerably larger in human fMRI experiments than in
monkey electrophysiology experiments9,10. Is this due
to a species difference, or does it indicate a difference
in what is being measured? For example, the fMRI signal might reflect not only the firing rates of the local
neuronal population, but also subthreshold activity,
simultaneous excitation and inhibition, or modulatory inputs (such as feedback from distant, higherlevel areas of visual cortex) that might not evoke spikes.
In addition, the fMRI signal might reflect changes in
neuronal synchrony without a concomitant increase
in mean firing rate11. A further complication is that
fMRI signals reflect the pooled activity of a very large
number of neurons; modulations in the fMRI
responses could be caused by either large changes in
the firing rates in a small subpopulation of neurons,
or small changes in the firing rates in a much larger
subpopulation of neurons12.
| FEBRUARY 2002 | VOLUME 3
www.nature.com/reviews/neuro
© 2002 Macmillan Magazines Ltd
REVIEWS
Box 1 | BOLD fMRI
In this review, we examine our current understanding
of how the fMRI signal relates to neuronal responses, in
the context of a simple linear transform model. We begin
by defining the model, and then discuss experiments that
have evaluated three crucial implications of the model:
that fMRI responses should show temporal summation,
that the time course and amplitude of the fMRI
responses should be predictable from the underlying
neuronal responses, and that the fMRI responses should
be colocalized with the underlying neuronal activity.
The linear transform model
The central assumption guiding inferences that are
made from fMRI data about neuronal activity has been
that the fMRI signal is approximately proportional to a
measure of local neural activity, averaged over a spatial
extent of several millimetres and over a time period of
several seconds13,14 (FIG. 1). We will refer to this as the
linear transform model of the fMRI signal. Note that the
linear transform model allows the possibility of an arbitrarily complex, nonlinear relationship between the
stimulus and the neuronal activity. To evaluate
the model, one must either measure the underlying
neuronal activity (as in the direct comparisons of fMRI
and electrophysiological measurements discussed
a
Astrocyte
Synapse
Glutamate
Glutamate
Glucose
Capillary
O2
?
Glucose
O2
Glucose
• More Hb
• Faster dephasing
• Weaker MRI signal
• Less Hb
• Slower dephasing
• Stronger MRI signal
b
Hb-induced
dephasing
Excite
Acquire image
MRI emission
The fundamental signal for blood oxygen level dependent (BOLD) functional magnetic
resonance imaging (fMRI) comes from hydrogen atoms, which are abundant in the water
molecules of the brain. In the presence of a magnetic field, these hydrogen atoms absorb
energy that is applied at a characteristic radio frequency (~64 MHz for a standard,
clinical 1.5-Tesla MRI scanner). After this step of applying radio-frequency excitation,
the hydrogen atoms emit energy at the same radio frequency until they gradually return
to their equilibrium state. The MRI scanner measures the sum total of the emitted radiofrequency energy. The measured radio-frequency signal decays over time, owing to
various factors, including the presence of inhomogeneities in the magnetic field. Greater
inhomogeneity results in decreased image intensity, because each hydrogen atom
experiences a slightly different magnetic field strength, and after a short time has passed
(commonly called T2*), their radio-frequency emissions cancel one another out. BOLD
fMRI techniques are designed to measure primarily changes in the inhomogeneity of the
magnetic field, within each small volume of tissue, that result from changes in blood
oxygenation. Deoxy- and oxyhaemoglobin have different magnetic properties;
deoxyhaemoglobin is paramagnetic and introduces an inhomogeneity into the nearby
magnetic field, whereas oxyhaemoglobin is weakly diamagnetic and has little effect.
Hence, an increase in the concentration of deoxyhaemoglobin would cause a decrease in
image intensity, and a decrease in deoxyhaemoglobin would cause an increase in image
intensity (see figure; Hb, haemoglobin).
The emerging model of the haemodynamic response (BOX 2) posits that there are three
phases of the BOLD fMRI response to a transient increase in neuronal activity: an initial,
small decrease in image intensity below baseline (during the initial period of oxygen
consumption), followed by a large increase above baseline (an oversupply of oxygenated
blood, which is only partially compensated for by an increase in deoxygenated venous
blood volume), and then by a decrease back to below baseline again (after the oversupply
of oxygenated blood has diminished, it still takes some time for the blood volume to
return to baseline). The BOLD fMRI signal also depends on the inflow of fresh blood that
has not experienced the same history of radio-frequency excitation. This inflow effect, by
itself (in the absence of any of the aforementioned changes in deoxyhaemoglobin
concentration), would appear as an increase in image intensity, and it adds to the increase
in image intensity during the second phase of the response. The figure shows the proposed
relationship between synaptic activity, neurotransmitter recycling and metabolic demand
(part a), and the effect of deoxyhaemoglobin on the MRI signal (part b).
Time
below), or rely on what is already known about the neuronal activity (as in the temporal-summation experiments discussed below). Although the model is at best
an approximation of the complex interactions between
neuronal activity, metabolic demand, and blood flow
and oxygenation, it nonetheless serves as a useful platform on which to build. If the linear model were a satisfactory approximation, it would greatly simplify the
analysis and interpretation of fMRI data. The relationship between fMRI and neuronal responses would be
characterized completely and simply by the haemodynamic impulse response function (HIRF); that is, the
fMRI response that results from a brief, spatially localized pulse of neuronal activity. Furthermore, one could
estimate the underlying neuronal activity from fMRI
measurements (FIG. 1). In fact, many fMRI studies have
relied on the linear transform model, using measurements of the temporal component of the HIRF to estimate the underlying neuronal activity. However, these
measurements of the HIRF would be worthless if the
linear transform model were not a valid approximation.
To be useful, the linear transform model must approximate the detailed relationship between the fMRI data
and the neuronal activity. That relationship depends on
three main factors, as outlined below.
NATURE REVIEWS | NEUROSCIENCE
VOLUME 3 | FEBRUARY 2002 | 1 4 3
© 2002 Macmillan Magazines Ltd
REVIEWS
First, the relationship between fMRI and neuronal
responses depends on the fMRI acquisition technique.
Most fMRI experiments measure a blood oxygen level
dependent (BOLD) response. BOLD fMRI provides a
mixed signal that depends on blood flow, blood volume
and blood oxygenation (BOXES 1 and 2). Some of the
signal derives from changes within larger draining veins,
some from smaller venules and capillaries, and some
from extravascular sources15–17. Variations of the technique can be used to emphasize or de-emphasize one or
another of these components. The intravascular signals
are suppressed at higher magnetic field strengths
Box 2 | Haemodynamics and metabolism
The emerging model of the haemodynamic response posits that an increase in neuronal activity results in an initial
increase in oxygen consumption owing to increased metabolic demand; this changes the concentrations of oxy- and
deoxyhaemoglobin in the nearby vasculature, increasing the concentration of deoxyhaemoglobin while decreasing the
concentration of oxyhaemoglobin66–68. The increased neuronal activity also triggers, after a delay of ~2 s, a large
increase in local blood flow. This increase in blood flow provides a roughly proportional increase in glucose
consumption, but it actually overcompensates for the amount of oxygen being extracted, so that an oversupply of
oxygenated blood is delivered69,70. The increased flow also causes vasodilation of the venules and veins, because of their
balloon-like elasticity, which results in an increase in (mostly deoxygenated) venous blood volume71–74.
Empirical tests of this model of the haemodynamic response have relied on various methods to measure separately
blood volume, flow, oxygenation and magnetic susceptibility36,66,68,74–82. A particular emphasis has been placed on the
proposed initial phase of oxygen consumption, before the inflow and volume effects take place. The importance of the
‘initial dip’, as it has come to be called, is that it should be more closely related to the neuronal activity than the other,
more sluggish components of the haemodynamic response66. Much of the empirical evidence for the initial dip comes
from optical-imaging studies66–68,82. There are also some reports of the initial dip using BOLD fMRI63,83–85 and magnetic
resonance spectroscopy86. However, the initial dip is highly controversial in both the optical-imaging and fMRI literature,
because it has not always been found64,65,81,87.
It is widely believed that increased blood flow follows directly from increased synaptic activity. The rationale for this is
based on the following two observations. First, as mentioned above, blood flow increases in proportion to glucose
consumption70. Second, glucose metabolism is linked to synaptic activity88–91. It has also been suggested that increases in
brain activation are supported by glycolysis (non-oxidative glucose metabolism)69,70. This would explain the observed
proportionality between blood flow and glucose consumption, along with the mismatch between blood flow and
oxygen consumption. In particular, astrocytes have a crucial role in neurotransmitter recycling, using energy to clear
glutamate from the extracellular space and convert it to glutamine. Astrocytes surround both synapses and
intraparenchymal capillaries, and the release of glutamate at an excitatory synapse triggers a concomitant uptake of
glucose by the astrocytes from the blood. Astrocytes rely on glycolysis to achieve their neurotransmitter recycling
function (consuming glucose and releasing lactate)89. In summary, the blood flow change has been proposed to deliver
the level of glucose required by the astrocytes, regardless of blood oxygenation.
An alternative view is that the blood flow response serves to deliver the level of oxygen required by the neurons.
According to this view, the apparent mismatch between blood flow and oxygen consumption is a necessary consequence
of how the oxygen is delivered; a disproportionately large change in blood flow is required to support a small change in
oxygen metabolism, because extraction (by passive diffusion) of oxygen from the blood is less efficient at higher flow
rates92–94. This alternative view is supported by three further considerations. First, oxygen consumption does increase
with neuronal activity, although to a lesser extent than does blood flow36,95. Second, estimates of the metabolic costs of
brain activity show that most of the energy is used by the neurons and that their energy usage depends strongly on
firing rates; only a small percentage of the energy is used for neurotransmitter recycling by the astrocytes96. The neurons
rely on oxidative metabolism of lactate, whereas the astrocytes rely on non-oxidative glycolysis89. It would make sense,
therefore, for the haemodynamic response to support the need for oxygen. Third, it has been proposed that astrocytes
might rely on their in-built stores of glycogen to provide energy during transient periods of strong neuronal activity,
obviating the need for increased glucose delivery97.
Resolving these views will surely depend on learning more about the detailed cellular and molecular mechanisms that
cause the increase in blood flow89,98. Although the blood flow response is correlated with glucose consumption under
normal circumstances, it might be caused by something else. Likewise, the blood flow response is correlated with, but
not necessarily causally related to, oxygen consumption. These suspicions are highlighted by evidence that the blood
flow response is not affected by sustained hypoxia (decreased blood oxygen), nor by hypoglycaemia (decreased blood
glucose)99,100. Furthermore, it is important to keep in mind that the blood flow response, whatever its purpose, is
remarkably slow relative to the underlying changes in neuronal activity: the brain has typically done its thing and
moved on before the vasculature responds.
Various signals have been proposed to cause the blood flow response89,98; we mention three possibilities. First, the
response might be triggered by lactate (released by the astrocytes), implying a tight link between the fMRI signal and
synaptic activity. Second, it might be triggered by a diffusible by-product of neuronal spiking; for example, by nitric
oxide. Indeed, the blood flow response is reduced by blocking nitric oxide synthase while preserving the normal level of
glucose metabolism101. A third possibility is that the blood flow response might be triggered within the blood vessels
themselves, in response to transient decreases in oxygenation (the initial dip). Of course, these three processes might
operate together and with other mechanisms.
144
| FEBRUARY 2002 | VOLUME 3
www.nature.com/reviews/neuro
© 2002 Macmillan Magazines Ltd
Average
neural activity
Average
neural activity
REVIEWS
0
0
5
10
15
20
0
25
0
50
0
0
5
10
15
100
150
200
250
200
250
Time (s)
fMRI response
fMRI response
Time (s)
20
25
Time (s)
0
0
50
100
150
Time (s)
Figure 1 | The linear transform model of fMRI responses. Top row: hypothetical plots of
average neuronal activity over time. Bottom row: corresponding functional magnetic resonance
imaging (fMRI) responses. Left: hypothetical haemodynamic impulse response function (HIRF)
measured as the response to a brief pulse of neuronal activity. Right: the fMRI response when the
average neuronal activity alternates (at specific times) between three different states (high,
medium and low), with brief transients each time it switches from one state to another. Given the
measured time course of neuronal activity, it is possible to compute (using convolution) the time
course of the fMRI response. Most fMRI studies go the other way, to infer the underlying neuronal
activity from the fMRI response. In the example shown, it is possible to estimate (using linear
regression, given the HIRF) the relative amplitudes of the neuronal activity in each of the three
states, along with the amplitude of the transients.
because of the intrinsic inhomogeneity in the magnetic
field within larger vessels. The acquisition can be modified to de-emphasize the BOLD signals from larger
vessels, by suppressing signals that are associated with
higher flow velocities15,18. Other fMRI techniques have
been developed that separately measure different components of the haemodynamic response: perfusionbased fMRI measures blood flow19,20, compounds can be
injected into the blood stream to allow the measurement of blood volume21, and diffusion-based fMRI
techniques promise to measure changes in neural and
glial cell swelling that occur with excitation22. So far,
there has been only a modest amount of work towards
quantifying the relationships between these different
fMRI techniques (for example, see REFS 20,23,24).
Second, the relationship between fMRI and neuronal
responses depends on the behavioural and stimulation
protocols, and on the fMRI data-analysis methods. In the
early days of fMRI there was some concern that the signal
was derived entirely from large draining veins, and consequently that it would provide misleading information
about the spatial localization of neuronal activity. For
example, presenting visual stimuli at two nearby locations
in the visual field evokes neuronal activity at two nearby
locations in retinotopic visual areas such as V1. If the
fMRI signal were evident only in the large vessel(s), which
drain the blood from V1, then it would not be possible to
distinguish between these two nearby foci of neuronal
activity. Rather, the activity evoked by both visual stimuli
would seem to be displaced to the location of the draining
vein(s). To a large degree, this issue was resolved by adopting appropriate experimental protocols. Retinotopic
maps are now routinely measured in the visual cortex
using stimuli that move through the visual field, thereby
evoking a travelling wave of neuronal activity across the
folded grey matter surface25. Signals in a large draining
vein, one that drains from the region of grey matter that
corresponds to a large fraction of the retinotopic map, are
de-emphasized because the blood flow and oxygenation
in those vessels are roughly constant throughout the
experiment. By using this travelling-wave technique, and
by restricting the data analysis to the grey matter, it is possible to distinguish activity that is separated by less than
1.5 mm in the cortex25 (fMRI techniques have advanced
considerably since these initial measurements were
reported in 1994, allowing even finer spatial resolution, as
discussed below). Hence, the experimental protocol
might be crucial for obtaining precise spatial localization
of functional activity, a point that we will return to later.
There are surely a number of further issues concerning
the experimental protocol and data analysis that can
affect the fidelity of the fMRI measurements. It is therefore important, each time a new protocol is developed, to
measure the relationship between the fMRI signals and
the underlying neuronal activity.
Third, the relationship between fMRI and neuronal
responses depends on how the neuronal activity itself is
measured and quantified. Consider recording the simultaneous activity of a large number of individual neurons
within a region of cortex (several millimetres) and over
a period of time (several seconds). What component of
the neuronal activity would be most predictive of the
fMRI signal? The various possible measurements of
neuronal activity include: the average firing rate of all of
the neurons; the average firing rate of a subpopulation
of neurons; synchronous spiking activity across the neuronal population; the local field potential (LFP); the current source density; some measure of local average
synaptic activity; or some measure of the subthreshold
electrical activity. What is the relationship between these
different measures of neuronal activity, and how are
they each related to the fMRI signal? New experiments
are just beginning to shed light on this question (BOX 3).
Temporal summation of fMRI responses
In a typical experiment, a time-series of BOLD fMRI
images are collected while a stimulus or cognitive task is
systematically varied. If the stimulus or task variations
evoke a large enough change in blood flow and oxygenation in a certain brain region, then the image
intensity in that region will modulate (by as much as
±5%, but typically by less than this) over time about its
mean intensity value.
According to the linear transform model, it should
be possible to predict the response to a long stimulus
presentation by summing the responses to shorter
stimuli (FIG. 2). For example, the response to a 12-s stimulus is predicted by summing the response to a 6-s
stimulus with a copy of the same response delayed by
6 s. Note that this allows the possibility of an arbitrarily
complex, nonlinear relationship between the stimulus
and the neuronal activity. Whatever the neuronal activity
is for the first 6 s, as long as it is identical for the second
6 s, it should be possible to predict the fMRI response to
a pair of back-to-back stimuli, given the response to one
stimulus presentation.
NATURE REVIEWS | NEUROSCIENCE
VOLUME 3 | FEBRUARY 2002 | 1 4 5
© 2002 Macmillan Magazines Ltd
REVIEWS
Box 3 | Local field potential and multi-unit activity
What is known about the local field potential (LFP; low-frequency component of the electrophysiological signal) and
multi-unit activity (MUA), and how each relates to processing in the cerebral cortex? The MUA is believed to reflect the
spiking activity of neurons near the electrode tip (within ~200 µm)102,103. The LFP, on the other hand, is believed to
reflect the superposition of synchronized dendritic currents, averaged over a larger volume of tissue104.
The role of synchronized neuronal signals, including that inferred from LFP measurements, has been a source of
heated debate and considerable controversy105–107. Regardless of its functional role, it is conceivable that neuronal
synchrony (and hence LFP) could increase without a concomitant increase in mean firing rate11.
However, the LFP is expected under many circumstances to be highly correlated with local average firing rates. Most
synapses (both excitatory and inhibitory) can be traced to a local network of connections that originates in the nearby
cortical neighbourhood, leaving only a small minority of inputs from more remote cortical and subcortical
structures108–110. So, local spiking activity, synaptic activity and dendritic currents should all covary. Moreover, although
some studies have found that the LFP includes contributions from distant sources104, others have found that it is dominated
by the activity of nearby neurons111–113. Methodological choices can make a huge difference, such as whether the LFP
recording is single-ended (referenced to a remote ground) or differential (referenced to another electrode or epidural
silverball) (P. Fries, personal communication). The former method can provide a localized measure of neuronal activity; for
example, in area MT, the stimulus selectivity of the LFP is similar to those of the MUA and single-unit responses
(G. DeAngelis and W. T. Newsome, personal communication). The latter method is crucially dependent on the relative
positions of the two recording sites. If they are just embracing a cortical column, the measure is called a ‘transcortical field
potential’, and provides the best localization available with LFP112,113. However, if the reference is a distant epidural
silverball, the LFP picks up a more global signal that is strongly correlated with scalp electroencephalography (EEG).
In summary, the LFP is believed to reflect inputs and intracortical activity, but is often (but not always) correlated with
the output spiking activity in single- or multi-unit recordings.
Temporal summation holds up well in some experiments, but not in others13,20,24,26–33. The failure can be
traced to the fact that very short stimulus presentations
evoke disproportionately large fMRI responses, compared with what is expected from the responses to long
stimulus presentations. One possible explanation for
the failure of temporal summation is that although
blood flow might indeed be proportional to the underlying neuronal activity, BOLD fMRI signals might have
Response to 6-s stimulus
Copy, shift by 6 s
6
fMRI response
(% BOLD signal)
fMRI response
(% BOLD signal)
6
3
0
3
0
–3
–3
0
10
20
30
40
0
10
Time (s)
Response to 12-s stimulus
30
40
30
40
Add
6
fMRI response
(% BOLD signal)
6
fMRI response
(% BOLD signal)
20
Time (s)
3
0
3
0
–3
–3
0
10
20
30
Time (s)
40
0
10
20
Time (s)
Figure 2 | Temporal summation of fMRI responses. Left: measured functional magnetic
resonance imaging (fMRI) responses from the visual cortex for 6- and 12-s stimulus presentations.
Right: the procedure for measuring temporal summation, by comparing the responses to the two
different stimulus durations. BOLD, blood oxygen level dependent. Modified with permission from
REF. 13 © 1996 Society for Neuroscience.
146
an inherently nonlinear dependence on flow (see BOX 2
and REFS 20,34). In particular, the BOLD effect might
saturate at high levels of blood flow because further
increases in flow would cause negligible decreases in
the concentration of deoxyhaemoglobin20,35,36. Consequently, a moderately strong stimulus might evoke a
near-maximal fMRI response, leaving very little room
to reveal any further change in fMRI signal in response
to a stronger stimulus that is known to evoke more
neuronal activity. Indeed, there is some evidence that
flow might show temporal summation even when
BOLD fMRI fails to do so20.
An alternative possibility is a failure in the design of
the experiments, rather than a failure of temporal summation itself. These experiments were all completed in
primary sensory and motor cortical areas, mostly in V1,
where short-duration stimuli are expected to give disproportionately large neuronal responses for at least
three reasons. First, V1 neurons show large transient
responses after stimulus onset, which rapidly decrease
over a period of several hundred milliseconds37. Second,
V1 neurons adapt; their responses decrease gradually
over time after prolonged (4–30 s) stimulation38. Third,
V1 responses are boosted by attention (see above), and
stimulus onsets are likely to engage attention automatically. Hence, very short stimulus presentations evoke
disproportionately large neural responses, which,
according to the linear transform model, should in turn
evoke disproportionately large fMRI responses. Some
studies have included a post-hoc analysis to account for
the expected response transients13,20,33, but experiments
have not yet been carried out that measure the temporal
summation of the fMRI responses while explicitly controlling or compensating for response transients, adaptation and attention. So, the temporal-summation
experiments completed so far are inconclusive because
| FEBRUARY 2002 | VOLUME 3
www.nature.com/reviews/neuro
© 2002 Macmillan Magazines Ltd
REVIEWS
a Impulse response
b
BOLD/neural signal change (s.d. units)
0.07
Normalized response
0.06
0.05
0.04
0.03
0.02
0.01
0.00
–0.01
–0.02
–0.03
0
5
10
15
20
Time (s)
25
4
3
2
1
0
–1
0
20
40
60
80
100
Time (s)
Figure 3 | Neuronal versus fMRI responses. a | Haemodynamic impulse response functions
(HIRFs) estimated from two (red and blue curves) different recording sites. b | Comparison of the
measured functional magnetic resonance imaging (fMRI) response with that predicted (using the
linear transform model and the estimated HIRF) from the local field potential (LFP) (BOLD, blood
oxygen level dependent; s.d., standard deviation). Stimulus was a full-field, rotating, checkerboard
pattern that varied in contrast over time. Dark turquoise rectangles: contrast level over time. Light
turquoise: measured neuronal activity (LFP). Red curve: measured fMRI response. Blue curve:
predicted fMRI response. Reproduced with permission from REF. 50 © 2001 Macmillan
Magazines Ltd.
the reported failures of the linear transform model
might actually be failures of the assumptions underlying
the test, not failures of temporal summation itself.
Comparison of fMRI and neuronal responses
A second implication of the linear transform model
is that the time course and amplitude of the fMRI
responses should be predictable from the underlying
neuronal responses.
Two studies have compared human fMRI and monkey single-unit data to infer that fMRI signals are
directly proportional to average neuronal firing rates39,40.
The first of these studies compared single-unit data
recorded in monkey MT, an extrastriate area of visual
cortex that is specialized for visual motion processing,
with fMRI measurements in human MT+ (the MT
complex, also known as V5), a motion-responsive cortical region that is widely believed to be homologous with
monkey MT along with adjacent motion-sensitive
areas41,42. MT neurons are sensitive to the strength, or
coherence, of the motion signal. In a stimulus that consists of a field of moving dots, motion coherence can be
varied parametrically from 0% (in which each dot
moves in a random direction) to 100% (in which all
dots move in the same direction). The responses of MT
neurons to such stochastic motion stimuli have been
extensively characterized43. Using this large database of
single-unit recordings, Rees et al.39 calculated that the
average neuronal firing rate across a large population of
MT neurons would be expected to increase linearly with
coherence. They then confirmed that the fMRI
responses in human MT+ also increased approximately
linearly with motion coherence, indicating a proportionality between fMRI signals and average firing rates.
Motivated by their report, we carried out a similar
analysis of some of our previously reported measurements of the activity in human and monkey primary
visual cortex (V1)40,44,45. We used stimulus contrast as the
independent variable, because nearly all V1 neurons
(along with most neurons in other early visual areas)
increase their firing rates monotonically with contrast.
We would expect, therefore, that if the fMRI signals were
proportional to average firing rates, then they too would
increase monotonically with stimulus contrast. We
analysed the responses of a large database of macaque V1
neurons to stimuli of varying contrasts, orientations,
directions and spatiotemporal frequencies. From this
database of individual V1 neurons, we estimated the
average firing rate in monkey V1, as a function of contrast, for the specific stimulus pattern that had been used
in the fMRI experiments. The fMRI and average firingrate response curves superimposed, again indicating a
proportional relationship between fMRI response and
average firing rate. However, both of these studies relied
on a series of computations to estimate the average neuronal activity from the electrophysiological data.
Moreover, they compared data not only from different
areas of cortical tissue, but also from different brains in
two different species.
Several studies have found generally good agreement
between the amplitudes of fMRI and electroencephalographic (EEG) signals, in both humans and anaesthetized rats27,46. Likewise, blood flow measured with the
laser Doppler flow technique has been reported to be
highly predictable from EEG and LFP measurements47–49.
See BOX 3 for a discussion of how the EEG and LFP
measurements relate to the spiking activity of neurons.
A recent, seminal study by Logothetis et al.50 evaluated
the linear transform model by comparing simultaneously
recorded fMRI and neuronal signals in the anaesthetized
monkey. Neuronal activity was recorded with a microelectrode in V1, and analysed to measure multi-unit
activity (MUA) and LFP, which were extracted from different frequency bands of the raw electrophysiological
signal (LFP, 40–130 Hz; MUA, 300–1,500 Hz). For each
recording site, the fMRI data were analysed over a small
(approximately 2 × 2.5 × 7 mm) region of grey matter
surrounding the electrode tip.
Logothetis et al. examined how well they could predict
the fMRI measurements from the LFP and MUA measurements (FIG. 3). They measured baseline activity in the
absence of visual stimulation at each recording site to estimate the HIRFs separately for the MUA and LFP (the
method they used to estimate the HIRFs relied on having
simultaneous fMRI and electrophysiological measurements). They then used separate measurements of visually evoked activity to evaluate the linear transform
model, by comparing the visually evoked fMRI responses
with those predicted from the MUA and LFP signals
(according to the linear transform model, given the estimated HIRFs). At some recording sites, the linear transform model predicted the measured fMRI responses well,
explaining more than 90% of the variance in the fMRI
signals. However, at other recording sites, the LFP and
MUA signals were very poor predictors of the fMRI
responses.At those sites where the LFP was a good predictor of the fMRI responses, MUA also tended to be a good
predictor (N. K. Logothetis, personal communication).
NATURE REVIEWS | NEUROSCIENCE
VOLUME 3 | FEBRUARY 2002 | 1 4 7
© 2002 Macmillan Magazines Ltd
REVIEWS
CENTROID
Geometric centre.
148
On average, the LFP was slightly better than MUA at predicting the fMRI responses (although this difference was
statistically significant, the LFP accounted for only 7.6%
more of the variance in the fMRI responses than did the
MUA). The data indicate that this difference related to the
transient nature of the MUA. Around one-quarter of the
recording sites showed transient MUA responses that
returned to baseline within 2–4 s even though the stimulus stayed on for much longer. The LFP and fMRI signals
from the same sites were both sustained throughout the
stimulus presentations, which lasted for up to 20 s.
On the basis of these results, Logothetis et al. concluded that BOLD fMRI signals “reflect the input and
intracortical processing of a given area rather than its
spiking output.” Specifically, the data reported in most
single-unit electrophysiological experiments reflect the
activity of a biased sample of neurons, mostly large
pyramidal cells that send projections to other brain
areas. BOLD signals, they argue, also reflect the activity
of incoming fibres, interneurons, and recurrent excitatory or inhibitory activity, rather than just ‘output’ firing
rates of the pyramidal cells (N. K. Logothetis, personal
communication). Under some conditions, the intracortical processing within a region of cortical tissue will be
highly correlated with the output spiking activity of the
pyramidal cells. For example, the inputs, intracortical
activity and outputs in V1 all increase monotonically
with stimulus contrast (see above). But there might be
some circumstances in which there is a decoupling of
inputs and intracortical processing from output activity.
For example, the strong attentional signals (mentioned
above) measured with fMRI in early visual cortical areas
might reflect subthreshold activity arising from modulatory inputs that do not evoke spikes in the output
pyramidal cells. The interpretation of the fMRI results
depends crucially, therefore, on the extent to which the
output from a cortical area can be decoupled from
the intracortical activity within that area.
An example of such a decoupling of inputs from outputs was reported by Mathiesen et al.47, who compared
blood flow, LFP and spiking activity in the cerebellum of
anaesthetized rats, while electrically stimulating inputs to
the cerebellum. The crucial condition involved stimulating the cerebellar parallel fibres that evoke monosynaptic
excitatory postsynaptic potentials and disynaptic
inhibitory postsynaptic potentials in Purkinje cells, the
primary output neurons of the cerebellar cortex. By taking advantage of this specialized cerebellar circuitry, they
provided strong synaptic excitation, including excitation
of inhibitory interneurons, with little or no change in the
net activity of the Purkinje cells. Nevertheless, blood flow
and LFP increased.
Perhaps the most important result in the Logothetis
et al. study concerns the large differences across recording
sites. This raises a number of questions. Are the estimated
HIRFs stable across recording sites? Is the fMRI signal less
well predicted by neuronal activity at some sites than at
others because of their proximity to larger veins? In this
context, it is also important to note that the stimuli were
presented in the commonly used block-alternation
design, with relatively long (4–24 s) intervals of a full-field
checkerboard pattern that alternated with intervals of a
blank (uniform grey) field. The results might differ if a
rapid series of brief (~1 s) stimulus presentations is used
(N. K. Logothetis, personal communication). Under such
conditions the transient activity would dominate, thereby
increasing the correlation between the LFP, MUA and
single-unit activity, and causing each of these measures to
be more predictive of the fMRI responses. This would be
welcome news because a growing number of fMRI
experiments have been using such a rapid sequence of
stimulus presentations with brief inter-trial intervals30,51.
A final result from the Logothetis et al. study is that
fMRI and neuronal responses were not simply proportional to one another. A 12% stimulus contrast evoked
about half the maximum fMRI response but much less
than half the maximum LFP and MUA. This implies
that there is a monotonic but nonlinear relationship
between the fMRI signal and neuronal responses, such
that the fMRI responses increase more rapidly than neuronal responses at low contrasts, but less rapidly at high
contrasts. For example, the fMRI signal might include a
contribution of asynchronous, subthreshold activity that
is not visible in LFP or MUA measurements. However,
just the opposite result was observed in a comparison of
LFP and blood flow (measured with the laser Doppler
flow technique) in the somatosensory cortex of the
anaesthetized rat. No blood flow response was elicited at
low levels of neuronal activity, whereas flow increased in
proportion to LFP above a certain threshold level49. This
indicates that flow increases more slowly than neuronal
activity at low levels of activity, but that flow increases at
a greater rate for higher levels of activity.
Despite the nonlinear relationships observed between
LFP and either flow or BOLD signals, single-unit firing
rates seem to be roughly proportional to BOLD fMRI
signals. Isolated V1 neurons reach half their maximum
firing rate at ~10–15% contrast on average40,45, consistent
with the fMRI measurements reported by Logothetis
et al. and with other fMRI measurements in humans40,44,
but in contrast to the LFP and MUA measurements
reported by Logothetis et al.
Colocalization of fMRI and neuronal activity
A third implication of the linear transform model is that
the fMRI responses should be colocalized with the
underlying neuronal activity. This has been explored in
both human and monkey brains.
Several studies of patients undergoing neurosurgery
have reported general agreement between sensorimotor
maps measured with fMRI and intraoperative corticalsurface recording, cortical stimulation and optical imaging52–56. This has obvious and important implications
for pre-surgical planning. However, Cannestra et al.56
point out that the precision of the concordance depends
crucially on the fMRI data-analysis techniques. As is
typical of many fMRI studies, they used a model of the
HIRF to analyse their data and localize regions of activity. Using one model of the HIRF, the CENTROID of fMRI
activity was on average more than 1 cm from the centroid of intrinsic optical-imaging activity. A slight modification to the HIRF, including an initial dip (BOX 2),
| FEBRUARY 2002 | VOLUME 3
www.nature.com/reviews/neuro
© 2002 Macmillan Magazines Ltd
REVIEWS
yielded a marked improvement such that the centroids
were separated by ~2 mm on average.
Disbrow et al.57 reported a profound discordance
between fMRI and electrophysiological recordings of
somatosensory cortical maps in the anaesthetized
monkey. Although it was possible to use fMRI to determine the gross organization of body-part representations,
there were important differences between the two maps.
First, in only about half of the measurements were the
centroids of fMRI activity located within the respective
hand and face representations obtained electrophysiologically, and the mean distance between map centres (fMRI
versus electrophysiology) was ~1 cm. Second, the fMRIdefined cortical maps were considerably larger than the
maps that were obtained on the basis of microelectrode
recordings.
Wandell et al.58, on the other hand, reported excellent
agreement between the locations and retinotopic maps
of monkey V1, V2, V4 and MT, as measured by fMRI,
and those expected from the electrophysiological literature. This difference between the accuracy of the
somatosensory and visual maps might reflect a fundamental difference in the basis of the haemodynamic
responses in these two cortical areas. Or it might be a
simple consequence of differences in the experimental
methods; Wandell et al. used the travelling-wave stimulus to measure the retinotopic maps in visual cortex,
whereas as Disbrow et al. presented tactile stimuli using
a block-alternation design with relatively long (~20 s)
intervals of stimulation versus rest.
Further evidence for the colocalization of fMRI and
neuronal signals comes from experiments in which
fMRI has been used to image ocular dominance and
orientation columns59–63. Although some of these papers
have provoked considerable controversy (for example,
REFS 64,65), others are compelling and would not have
been possible unless the signals were properly localized
to within a fraction of a millimetre.
Conclusions
We started this review by describing the linear transform
model, which has been a common assumption in the
interpretation of fMRI studies. Does the evidence indicate
1.
2.
3.
4.
5.
Ogawa, S., Lee, T. M., Kay, A. R. & Tank, D. W. Brain
magnetic resonance imaging with contrast dependent on
blood oxygenation. Proc. Natl Acad. Sci. USA 87,
9868–9872 (1990).
The first demonstration of BOLD MRI. This paper was
followed two years later by several concurrent reports
(references 2–5) of the use of BOLD fMRI to measure
activity non-invasively in the human brain.
Ogawa, S. et al. Intrinsic signal changes accompanying
sensory stimulation: functional brain mapping with magnetic
resonance imaging. Proc. Natl Acad. Sci. USA 89,
5951–5955 (1992).
Kwong, K. K. et al. Dynamic magnetic resonance imaging of
human brain activity during primary sensory stimulation.
Proc. Natl Acad. Sci. USA 89, 5675–5679 (1992).
Bandettini, P. A., Wong, E. C., Hinks, R. S., Tikofsky, R. S.
& Hyde, J. S. Time course EPI of human brain function
during task activation. Magn. Reson. Med. 25, 390–397
(1992).
Blamire, A. M. et al. Dynamic mapping of the human visual
cortex by high-speed magnetic resonance imaging.
Proc. Natl Acad. Sci. USA 89, 11069–11073 (1992).
that this model is a reasonable and useful approximation?
The answer is ‘yes’ for some recording sites, in some brain
areas, using certain experimental protocols. But the
answer is ‘no’ under other circumstances.
After ten years of fMRI studies, there is still much to
learn about the source of these signals. In particular, further measurements that compare fMRI and neuronal
signals are needed. The specifics of the experimental protocols are important and, hence, should be systematically
varied. Clearly, we need to know more about the relationships between the different measures of neuronal activity,
single- and multi-unit spiking activity, and LFP, to determine whether they reflect different aspects of neuronal
function. For example, it would be helpful for neurophysiologists routinely to digitize the entire electrophysiological signal, not just the spike times, to determine whether
or not, and under which circumstances, the intracortical
activity within a cortical area (for example, as represented
by the LFP or MUA) might be decoupled from the output
spiking activity of isolated single units. It would also be
helpful to compare measurements of local average firing
rates with local average synaptic activity, because synaptic
activity has been identified as being linked with metabolic
demand (BOX 2), although it is not clear exactly how average synaptic activity could be measured directly. In addition, it would be informative to measure the fMRI signal
in the absence of spikes — for example, by cooling the
cortex — to determine how much of the signal is induced
exclusively by the inputs to a cortical area.
This review has raised more questions than answers.
Although these questions are motivated by methodological considerations, many of them bear on fundamental
issues concerning cortical circuitry and the ways in which
large populations of neurons represent information in the
brain. With any new technique, it takes some time to sort
out the methodological details. MRI offers a huge amount
of flexibility — good news, because it should allow us to
refine the methods to measure precisely the underlying
neuronal activity, but also bad news, because it might take
a while for us to converge on those methods. fMRI provides a new and different picture of brain function, complementary to other techniques; although this presents
a challenge, it will also prove to be of great benefit.
6.
Kanwisher, N. & Wojciulik, E. Visual attention: insights from
brain imaging. Nature Rev. Neurosci. 1, 91–100 (2000).
7. Luck, S. J., Chelazzi, L., Hillyard, S. A. & Desimone, R.
Neural mechanisms of spatial selective attention in areas V1,
V2, and V4 of macaque visual cortex. J. Neurophysiol. 77,
24–42 (1997).
8. McAdams, C. J. & Maunsell, J. H. R. Effects of attention on
orientation-tuning functions of single neurons in macaque
cortical area V4. J. Neurosci. 19, 431–441 (1999).
9. Kastner, S., Pinsk, M. A., De Weerd, P., Desimone, R. &
Ungerleider, L. G. Increased activity in human visual cortex
during directed attention in the absence of visual stimulation.
Neuron 22, 751–761 (1999).
10. Ress, D., Backus, B. T. & Heeger, D. J. Activity in primary
visual cortex predicts performance in a visual detection task.
Nature Neurosci. 3, 940–945 (2000).
11. Fries, P., Reynolds, J. H., Rorie, A. E. & Desimone, R.
Modulation of oscillatory neuronal synchronization by
selective visual attention. Science 291, 1560–1563 (2001).
12. Scannell, J. W. & Young, M. P. Neuronal population activity
and functional imaging. Proc. R. Soc. Lond. B 266,
875–881 (1999).
NATURE REVIEWS | NEUROSCIENCE
13. Boynton, G. M., Engel, S. A., Glover, G. H. & Heeger, D. J.
Linear systems analysis of functional magnetic
resonance imaging in human V1. J. Neurosci. 16,
4207–4221 (1996).
Framed the linear transform hypothesis and reported
the first measurements of temporal summation.
14. Friston, K. J., Jezzard, P. & Turner, R. Analysis of functional
MRI time-series. Hum. Brain Mapp. 1, 153–171 (1994).
Developed methods, widely used to analyse fMRI
data, that rely on the linear transform hypothesis.
15. Boxerman, J. L. et al. The intravascular contribution to fMRI
signal change: Monte Carlo modeling and diffusionweighted studies in vivo. Magn. Reson. Med. 34, 4–10
(1995).
16. Zhong, J., Kennan, R. P., Fulbright, R. K. & Gore, J. C.
Quantification of intravascular and extravascular
contributions to BOLD effects induced by alteration in
oxygenation or intravascular contrast agents. Magn. Reson.
Med. 40, 526–536 (1998).
17. Hoogenraad, F. G. et al. Quantitative differentiation between
BOLD models in fMRI. Magn. Reson. Med. 45, 233–246
(2001).
VOLUME 3 | FEBRUARY 2002 | 1 4 9
© 2002 Macmillan Magazines Ltd
REVIEWS
18. Song, A. W., Wong, E. C., Tan, S. G. & Hyde, J. S. Diffusion
weighted fMRI at 1.5 T. Magn. Reson. Med. 35, 155–158
(1996).
19. Kim, S. G. Quantification of relative cerebral blood flow
change by flow-sensitive alternating inversion recovery
(FAIR) technique: application to functional mapping.
Magn. Reson. Med. 34, 293–301 (1995).
20. Miller, K. L. et al. Nonlinear temporal dynamics of the cerebral
blood flow response. Hum. Brain Mapp. 13, 1–12 (2001).
21. Mandeville, J. B. et al. Dynamic functional imaging of relative
cerebral blood volume during rat forepaw stimulation.
Magn. Reson. Med. 39, 615–624 (1998).
22. Darquie, A., Poline, J. B., Poupon, C., Saint-Jalmes, H. &
Le Bihan, D. Transient decrease in water diffusion observed
in human occipital cortex during visual stimulation.
Proc. Natl Acad. Sci. USA 98, 9391–9395 (2001).
23. Luh, W. M., Wong, E. C., Bandettini, P. A., Ward, B. D. &
Hyde, J. S. Comparison of simultaneously measured
perfusion and BOLD signal increases during brain activation
with T1-based tissue identification. Magn. Reson. Med. 44,
137–143 (2000).
24. Hoge, R. D. et al. Stimulus-dependent BOLD and perfusion
dynamics in human V1. Neuroimage 9, 573–585 (1999).
25. Engel, S. A. et al. fMRI of human visual cortex. Nature 369,
525 (1994).
Introduced the travelling-wave stimulation protocol
for measuring retinotopic maps in human visual
cortex, and resolved the ‘brain–vein’ debate by
showing that one could reliably distinguish activity
separated by <1.5 mm in cortex.
26. Glover, G. H. Deconvolution of impulse response in eventrelated BOLD fMRI. Neuroimage 9, 416–429 (1999).
27. Ogawa, S. et al. An approach to probe some neural
systems interaction by functional MRI at neural time scale
down to milliseconds. Proc. Natl Acad. Sci. USA 97,
11026–11031 (2000).
28. Kershaw, J., Kashikura, K., Zhang, X., Abe, S. & Kanno, I.
Bayesian technique for investigating linearity in event-related
BOLD fMRI. Magn. Reson. Med. 45, 1081–1094 (2001).
29. Friston, K. J., Josephs, O., Rees, G. & Turner, R. Nonlinear
event-related responses in fMRI. Magn. Reson. Med. 39,
41–52 (1998).
30. Dale, A. M. & Buckner, R. L. Selective averaging of rapidly
presented individual trials using fMRI. Hum. Brain Mapp. 5,
329–340 (1997).
31. Robson, M. D., Dorosz, J. L. & Gore, J. C. Measurements of
the temporal fMRI response of the human auditory cortex to
trains of tones. Neuroimage 7, 185–198 (1998).
32. Vazquez, A. L. & Noll, D. C. Nonlinear aspects of the BOLD
response in functional MRI. Neuroimage 7, 108–118 (1998).
33. Birn, R. M., Saad, Z. S. & Bandettini, P. A. Spatial
heterogeneity of the nonlinear dynamics in the fMRI bold
response. Neuroimage 14, 817–826 (2001).
34. Mechelli, A., Price, C. J. & Friston, K. J. Nonlinear coupling
between evoked rCBF and BOLD signals: a simulation
study of hemodynamic responses. Neuroimage 14,
862–872 (2001).
35. Rees, G. et al. Characterizing the relationship between
BOLD contrast and regional cerebral blood flow
measurements by varying the stimulus presentation rate.
Neuroimage 6, 270–278 (1997).
36. Davis, T. L., Kwong, K. K., Weisskoff, R. M. & Rosen, B. R.
Calibrated functional MRI: mapping the dynamics of
oxidative metabolism. Proc. Natl Acad. Sci. USA 95,
1834–1839 (1998).
37. Muller, J. R., Metha, A. B., Krauskopf, J. & Lennie, P.
Information conveyed by onset transients in responses of
striate cortical neurons. J. Neurosci. 21, 6978–6990 (2001).
38. Ohzawa, I., Sclar, G. & Freeman, R. D. Contrast gain control
in the cat visual cortex. Nature 298, 266–268 (1982).
39. Rees, G., Friston, K. & Koch, C. A direct quantitative
relationship between the functional properties of human and
macaque V5. Nature Neurosci. 3, 716–723 (2000).
40. Heeger, D. J., Huk, A. C., Geisler, W. S. & Albrecht, D. G.
Spikes versus BOLD: what does neuroimaging tell us about
neuronal activity? Nature Neurosci. 3, 631–633 (2000).
41. Zeki, S. et al. A direct demonstration of functional
specialization in human visual cortex. J. Neurosci. 11,
641–649 (1991).
42. Huk, A. C., Ress, D. & Heeger, D. J. Neuronal basis of the
motion aftereffect reconsidered. Neuron 32, 161–172 (2001).
43. Britten, K. H. & Newsome, W. T. Tuning bandwidths for
near-threshold stimuli in area MT. J. Neurophysiol. 80,
762–770 (1998).
44. Boynton, G. M., Demb, J. B., Glover, G. H. & Heeger, D. J.
Neuronal basis of contrast discrimination. Vision Res. 39,
257–269 (1999).
45. Geisler, W. S. & Albrecht, D. G. Visual cortex neurons in
monkeys and cats: detection, discrimination, and
identification. Vis. Neurosci. 14, 897–919 (1997).
150
46. Brinker, G. et al. Simultaneous recording of evoked
potentials and T2*-weighted MR images during
somatosensory stimulation of rat. Magn. Reson. Med. 41,
469–473 (1999).
47. Mathiesen, C., Caesar, K., Akgoren, N. & Lauritzen, M.
Modification of activity-dependent increases of cerebral
blood flow by excitatory synaptic activity and spikes in rat
cerebellar cortex. J. Physiol. (Lond.) 512, 555–566 (1998).
A compelling demonstration that blood flow can be
decoupled from spiking activity.
48. Ances, B. M., Zarahn, E., Greenberg, J. H. & Detre, J. A.
Coupling of neural activation to blood flow in the
somatosensory cortex of rats is time-intensity separable, but
not linear. J. Cereb. Blood Flow Metab. 20, 921–930 (2000).
49. Nielsen, A. N. & Lauritzen, M. Coupling and uncoupling of
activity-dependent increases of neuronal activity and blood
flow in rat somatosensory cortex. J. Physiol. (Lond.) 553,
773–785 (2001).
50. Logothetis, N. K., Pauls, J., Augath, M., Trinath, T. &
Oeltermann, A. Neurophysiological investigation of the basis
of the fMRI signal. Nature 412, 150–157 (2001).
Evaluated the linear transform model by comparing
simultaneously recorded fMRI and neuronal signals in
the anaesthetized monkey.
51. Burock, M. A., Buckner, R. L., Woldorff, M. G., Rosen, B. R.
& Dale, A. M. Randomized event-related experimental
designs allow for extremely rapid presentation rates using
functional MRI. Neuroreport 9, 3735–3739 (1998).
52. Puce, A. et al. Functional magnetic resonance imaging of
sensory and motor cortex: comparison with
electrophysiological localization. J. Neurosurg. 83, 262–270
(1995).
53. Yousry, T. A. et al. Topography of the cortical motor hand
area: prospective study with functional MR imaging and
direct motor mapping at surgery. Radiology 195, 23–29
(1995).
54. Schulder, M. et al. Functional image-guided surgery of
intracranial tumors located in or near the sensorimotor
cortex. J. Neurosurg. 89, 412–418 (1998).
55. Ruge, M. I. et al. Concordance between functional magnetic
resonance imaging and intraoperative language mapping.
Stereotact. Funct. Neurosurg. 72, 95–102 (1999).
56. Cannestra, A. F. et al. Temporal spatial differences observed
by functional MRI and human intraoperative optical imaging.
Cereb. Cortex 11, 773–782 (2001).
57. Disbrow, E. A., Slutsky, D. A., Roberts, T. P. & Krubitzer, L. A.
Functional MRI at 1.5 Tesla: a comparison of the blood
oxygenation level-dependent signal and electrophysiology.
Proc. Natl Acad. Sci. USA 97, 9718–9723 (2000).
Reported a profound discordance between fMRI and
electrophysiological recordings of somatosensory
cortical maps in the anaesthetized monkey.
58. Wandell, B., Press, W., Brewer, A. & Logothetis, N.
fMRI measurements of visual areas and retinotopic maps in
monkey. Soc. Neurosci. Abstr. 30, 309.9 (2000).
59. Cheng, K., Waggoner, R. A. & Tanaka, K. Human ocular
dominance columns as revealed by high-field functional
magnetic resonance imaging. Neuron 32, 359–374 (2001).
The most compelling demonstration so far of the use
of fMRI to image human ocular dominance.
60. Menon, R. S., Ogawa, S., Strupp, J. P. & Ugurbil, K.
Ocular dominance in human V1 demonstrated by functional
magnetic resonance imaging. J. Neurophysiol. 77,
2780–2787 (1997).
61. Goodyear, B. G. & Menon, R. S. Brief visual stimulation
allows mapping of ocular dominance in visual cortex using
fMRI. Hum. Brain Mapp. 14, 210–217 (2001).
62. Menon, R. S. & Goodyear, B. G. Submillimeter functional
localization in human striate cortex using BOLD contrast at
4 Tesla: implications for the vascular point-spread function.
Magn. Reson. Med. 41, 230–235 (1999).
63. Kim, D. S., Duong, T. Q. & Kim, S. G. High-resolution
mapping of iso-orientation columns by fMRI. Nature
Neurosci. 3, 164–169 (2000).
64. Logothetis, N. Can current fMRI techniques reveal the microarchitecture of cortex? Nature Neurosci. 3, 413–414 (2000).
65. Kim, D. S., Duong, T. Q. & Kim, S. G. Reply to: Can current
fMRI techniques reveal the micro-architecture of cortex?
Nature Neurosci. 3, 414 (2000).
66. Malonek, D. & Grinvald, A. Interactions between electrical
activity and cortical microcirculation revealed by imaging
spectroscopy: implications for functional brain mapping.
Science 272, 551–554 (1996).
67. Malonek, D. et al. Vascular imprints of neuronal activity:
relationships between the dynamics of cortical blood flow,
oxygenation, and volume changes following sensory
stimulation. Proc. Natl Acad. Sci. USA 94, 14826–14831
(1997).
68. Vanzetta, I. & Grinvald, A. Increased cortical oxidative
metabolism due to sensory stimulation: implications for
| FEBRUARY 2002 | VOLUME 3
69.
70.
71.
72.
73.
74.
75.
76.
77.
78.
79.
80.
81.
82.
83.
84.
85.
86.
87.
88.
89.
functional brain imaging. Science 286, 1555–1558 (1999).
The most compelling in a series of influential papers
about the initial dip, the proposed initial increase in
oxygen consumption that occurs immediately after
the onset of neuronal activity. See also references 66,
67 and 87.
Fox, P. T. & Raichle, M. E. Focal physiological uncoupling of
cerebral blood flow and oxidative metabolism during
somatosensory stimulation in human subjects. Proc. Natl
Acad. Sci. USA 83, 1140–1144 (1986).
Fox, P. T., Raichle, M. E., Mintun, M. A. & Dence, C.
Nonoxidative glucose consumption during focal physiologic
neural activity. Science 241, 462–464 (1988).
A classic study showing that oxygen consumption did
not match blood flow and glucose consumption,
indicating that increases in brain activation are
supported by non-oxidative glucose metabolism. See
also reference 69.
Buxton, R. B., Wong, E. C. & Frank, L. R. Dynamics
of blood flow and oxygenation changes during brain
activation: the balloon model. Magn. Reson. Med. 39,
855–864 (1998).
An influential model of blood flow, volume and
oxygenation that explains many of the properties of
the haemodynamic response. See also references 72
and 73.
Friston, K. J., Mechelli, A., Turner, R. & Price, C. J.
Nonlinear responses in fMRI: the balloon model, volterra
kernels, and other hemodynamics. Neuroimage 12,
466–477 (2000).
Mandeville, J. B. et al. Evidence of a cerebrovascular
postarteriole windkessel with delayed compliance. J. Cereb.
Blood Flow Metab. 19, 679–689 (1999).
Mandeville, J. B. et al. MRI measurement of the temporal
evolution of relative CMRO2 during rat forepaw stimulation.
Magn. Reson. Med. 42, 944–951 (1999).
Kim, S. G., Rostrup, E., Larsson, H. B., Ogawa, S. &
Paulson, O. B. Determination of relative CMRO2 from CBF
and BOLD changes: significant increase of oxygen
consumption rate during visual stimulation. Magn. Reson.
Med. 41, 1152–1161 (1999).
Kim, S. G. & Ugurbil, K. Comparison of blood oxygenation
and cerebral blood flow effects in fMRI: estimation of relative
oxygen consumption change. Magn. Reson. Med. 38,
59–65 (1997).
Kennan, R. P., Scanley, B. E., Innis, R. B. & Gore, J. C.
Physiological basis for BOLD MR signal changes due to
neuronal stimulation: separation of blood volume and
magnetic susceptibility effects. Magn. Reson. Med. 40,
840–846 (1998).
Lee, S. P., Duong, T. Q., Yang, G., Iadecola, C. & Kim, S. G.
Relative changes of cerebral arterial and venous
blood volumes during increased cerebral blood flow:
implications for BOLD fMRI. Magn. Reson. Med. 45,
791–800 (2001).
Bandettini, P. A. et al. Characterization of cerebral blood
oxygenation and flow changes during prolonged brain
activation. Hum. Brain Mapp. 5, 93–109 (1997).
Mandeville, J. B. et al. Regional sensitivity and coupling of
BOLD and CBV changes during stimulation of rat brain.
Magn. Reson. Med. 45, 443–447 (2001).
Marota, J. J. et al. Investigation of the early response to rat
forepaw stimulation. Magn. Reson. Med. 41, 247–252
(1999).
Jones, M., Berwick, J., Johnston, D. & Mayhew, J.
Concurrent optical imaging spectroscopy and laser-Doppler
flowmetry: the relationship between blood flow,
oxygenation, and volume in rodent barrel cortex.
Neuroimage 13, 1002–1015 (2001).
Hu, X., Le, T. H. & Ugurbil, K. Evaluation of the early
response in fMRI in individual subjects using short stimulus
duration. Magn. Reson. Med. 37, 877–884 (1997).
Logothetis, N. K., Guggenberger, H., Peled, S. & Pauls, J.
Functional imaging of the monkey brain. Nature Neurosci. 2,
555–562 (1999).
Menon, R. S. et al. BOLD based functional MRI at 4 Tesla
includes a capillary bed contribution: echo-planar imaging
correlates with previous optical imaging using intrinsic
signals. Magn. Reson. Med. 33, 453–459 (1995).
Ernst, T. & Hennig, J. Observation of a fast response in
functional MR. Magn. Reson. Med. 32, 146–149 (1994).
Buxton, R. B. The elusive initial dip. Neuroimage 13,
953–958 (2001).
Schwartz, W. J. et al. Metabolic mapping of functional
activity in the hypothalamo–neurohypophysial system of the
rat. Science 205, 723–725 (1979).
A classic study linking glucose consumption with
synaptic activity.
Magistretti, P. J. & Pellerin, L. Cellular mechanisms of brain
energy metabolism and their relevance to functional brain
www.nature.com/reviews/neuro
© 2002 Macmillan Magazines Ltd
REVIEWS
90.
91.
92.
93.
94.
95.
96.
imaging. Phil. Trans. R. Soc. Lond. B 354, 1155–1163
(1999).
An excellent review of the literature on
neurotransmitter recycling and its relationship to
neuroimaging measurements.
Sibson, N. R. et al. Stoichiometric coupling of brain glucose
metabolism and glutamatergic neuronal activity. Proc. Natl
Acad. Sci. USA 95, 316–321 (1998).
Shulman, R. G. & Rothman, D. L. Interpreting
functional imaging studies in terms of neurotransmitter
cycling. Proc. Natl Acad. Sci. USA 95, 11993–11998
(1998).
Buxton, R. B. & Frank, L. R. A model for the coupling
between cerebral blood flow and oxygen metabolism during
neural stimulation. J. Cereb. Blood Flow Metab. 17, 64–72
(1997).
A model showing that the apparent mismatch
between blood flow and oxygen consumption might
be required to support a change in oxygen
metabolism, because extraction (through passive
diffusion) of oxygen from the blood is less efficient at
higher flow rates. See also references 93 and 94.
Hyder, F., Shulman, R. G. & Rothman, D. L. A model for the
regulation of cerebral oxygen delivery. J. Appl. Physiol. 85,
554–564 (1998).
Vafaee, M. S. & Gjedde, A. Model of blood-brain transfer of
oxygen explains nonlinear flow–metabolism coupling during
stimulation of visual cortex. J. Cereb. Blood Flow Metab. 20,
747–754 (2000).
Hoge, R. D. et al. Investigation of BOLD signal dependence
on cerebral blood flow and oxygen consumption: the
deoxyhemoglobin dilution model. Magn. Reson. Med. 42,
849–863 (1999).
Attwell, D. & Laughlin, S. B. An energy budget for signaling
in the grey matter of the brain. J. Cereb. Blood Flow Metab.
21, 1133–1145 (2001).
An excellent review of energy consumption in the
brain, which concludes that action potentials and
postsynaptic effects of glutamate consume much of
the energy (47% and 34%, respectively), with the
97.
98.
99.
100.
101.
102.
103.
104.
105.
106.
107.
resting potential consuming a smaller amount (13%)
and glutamate recycling using only 3%.
Shulman, R. G., Hyder, F. & Rothman, D. L. Cerebral
energetics and the glycogen shunt: neurochemical basis of
functional imaging. Proc. Natl Acad. Sci. USA 98,
6417–6422 (2001).
Villringer, A. & Dirnagl, U. Coupling of brain activity and
cerebral blood flow: basis of functional neuroimaging.
Cerebrovasc. Brain Metab. Rev. 7, 240–276 (1995).
Mintun, M. A. et al. Blood flow and oxygen delivery to
human brain during functional activity: theoretical modeling
and experimental data. Proc. Natl Acad. Sci. USA 98,
6859–6864 (2001).
Powers, W. J., Hirsch, I. B. & Cryer, P. E. Effect of stepped
hypoglycemia on regional cerebral blood flow response to
physiological brain activation. Am. J. Physiol. 270,
H554–H559 (1996).
Cholet, N., Seylaz, J., Lacombe, P. & Bonvento, G. Local
uncoupling of the cerebrovascular and metabolic responses
to somatosensory stimulation after neuronal nitric oxide
synthase inhibition. J. Cereb. Blood Flow Metab. 17,
1191–1201 (1997).
Legatt, A. D., Arezzo, J. & Vaughan, H. G. Jr. Averaged
multiple unit activity as an estimate of phasic changes in
local neuronal activity: effects of volume-conducted
potentials. J. Neurosci. Methods 2, 203–217 (1980).
Freeman, W. Mass Action in the Nervous System
(Academic, New York, 1975).
Mitzdorf, U. Properties of the evoked potential
generators: current source-density analysis of visually
evoked potentials in the cat cortex. Int. J. Neurosci. 33,
33–59 (1987).
Singer, W. Synchronization of cortical activity and its putative
role in information processing and learning. Annu. Rev.
Physiol. 55, 349–374 (1993).
Singer, W. Neuronal synchrony: a versatile code for the
definition of relations? Neuron 24, 49–65; 111–125 (1999).
Shadlen, M. N. & Movshon, J. A. Synchrony unbound: a
critical evaluation of the temporal binding hypothesis.
Neuron 24, 67–77; 111–125 (1999).
NATURE REVIEWS | NEUROSCIENCE
108. Braitenberg, V. & Schuz, A. Anatomy of the Cortex (Springer,
Berlin, 1991).
109. Peters, A. & Sethares, C. Organization of pyramidal neurons
in area 17 of monkey visual cortex. J. Comp. Neurol. 306,
1–23 (1991).
110. Latawiec, D., Martin, K. A. & Meskenaite, V. Termination of the
geniculocortical projection in the striate cortex of macaque
monkey: a quantitative immunoelectron microscopic study.
J. Comp. Neurol. 419, 306–319 (2000).
111. Eckhorn, R. et al. Coherent oscillations: a mechanism of
feature linking in the visual cortex? Multiple electrode and
correlation analyses in the cat. Biol. Cybern. 60, 121–130
(1988).
112. Roelfsema, P. R., Engel, A. K., Konig, P. & Singer, W.
Visuomotor integration is associated with zero time-lag
synchronization among cortical areas. Nature 385, 157–161
(1997).
113. Bressler, S. L., Coppola, R. & Nakamura, R. Episodic
multiregional cortical coherence at multiple frequencies
during visual task performance. Nature 366, 153–156 (1993).
Acknowledgements
We thank W. Newsome, G. DeAngelis, P. Fries, B. Wandell, G.
Rees, R. Buxton, P. Bandettini, G. Glover, G. Boynton, M. Raichle
and N. Logothetis for detailed comments on this manuscript. The
authors are supported by grants from the National Eye Institute and
the Human Frontier Science Program.
Online links
FURTHER INFORMATION
Encyclopedia of Life Sciences: http://www.els.net/
brain imaging: observing ongoing neural activity | magnetic
resonance imaging
MIT Encyclopedia of Cognitive Sciences:
http://cognet.mit.edu/MITECS/
electrophysiology, electric and magnetic evoked fields | magnetic
resonance imaging
Access to this interactive links box is free online.
VOLUME 3 | FEBRUARY 2002 | 1 5 1
© 2002 Macmillan Magazines Ltd


© Copyright 2026